fy2018 3rd quarter financial results - konami.com · future performance of the company. ......
TRANSCRIPT

KONAMI HOLDINGS CORPORATIONJanuary 31, 2018
FY2018 3rd Quarter Financial ResultsNine months ended December 31, 2017
Cautionary statement with respect to forward-looking statements
Statements made in this presentation with respect to KONAMI HOLDINGS’ current plans,estimates, strategies and beliefs, including forecasts, are forward-looking statements about thefuture performance of the Company. These statements are based on management’s assumptionsand beliefs in light of information currently available to it and, therefore, you should not placeundue reliance on them. A number of important factors could cause actual results to be materiallydifferent from and worse than those discussed in forward-looking statements. Such factorsinclude, but are not limited to (1) Changes in economic conditions affecting our operations; (2)Fluctuations in foreign exchange rates, particularly with respect to the value of the Japanese yen,the U.S. dollar and the Euro; (3) the Company’s ability to continue to win acceptance of ourproducts, which are offered in highly competitive markets characterized by the continuousintroduction of new products, rapid developments in technology and subjective and changingconsumer preferences; (4) the Company’s ability to successfully expand internationally with afocus on our Digital Entertainment business, Gaming & Systems business and Amusementbusiness; (5) the Company’s ability to successfully expand the scope of our business andbroaden our customer base through our Health & Fitness business; (6) Regulatory developmentsand changes and our ability to respond and adapt to those changes; (7) the Company’sexpectations with regard to further acquisitions and the integration of any companies we mayacquire; and (8) the outcome of contingencies.
- Financial information included herein is not audited by independent public accountants(1) Numbers included in this presentation material are;
a) in accordance with IFRSb) rounded to the nearest one hundred million yen
(2) Revenues of each segment include inter-segment sales
2
3
Contents
Consolidated Financial Results 4
Revenue and Profit by Business Segment 5
Guidance Revision 6
Guidance Revision by Business Segment 7
Dividend Forecast Revision 8
Digital Entertainment 9
Health & Fitness 10
Gaming & Systems 11
Amusement 12
Titles Released in Oct - Dec 2017 / Pipeline(1) 13
Titles Released in Oct - Dec 2017 / Pipeline(2) 14
Consolidated Business Performance 15
Consolidated Financial Position 16
Consolidated Cash Flows 17

4
Consolidated Financial Results
(Yen in Billions)
FY2017
Q1-3
FY2018
Q1-3
YoY
Change
(Amount)
YoY
Change
(%)
FY2018
Guidance
9 months ended
December 2016
9 months ended
December 2017
12 months ending
March 2018
Revenue 163.9 178.7 14.7 +9.0% 245.0
Operating profit 29.6 38.5 8.9 +30.2% 40.0
Profit before income taxes 28.9 38.1 9.3 +32.1% 39.0
Profit for the period 20.7 26.0 5.4 +26.1% 27.0(attributable to owners of the parent)
Earnings per share (JPY) 152.70 192.50 39.80 199.65

5
Revenue and Profit by Business Segment
(Yen in Billions)
FY2017
Q1-3
FY2018
Q1-3
YoY
Change
(Amount)
YoY
Change
(%)
FY2018
Guidance
Revenue9 months ended
December 2016
9 months ended
December 2017
12 months ending
March 2018
Digital Entertainment 73.7 89.7 16.0 +21.7% 118.0Health & Fitness 51.9 49.7 △ 2.2 △4.3% 69.0Gaming & Systems 21.7 20.7 △ 1.1 △4.9% 32.0Amusement 17.1 19.8 2.7 +15.6% 27.0Eliminations △ 0.5 △ 1.2 △ 0.7 - △ 1.0Total 163.9 178.7 14.7 +9.0% 245.0
Segment profit (loss)
Digital Entertainment 24.4 29.7 5.3 +21.9% 31.0Health & Fitness 4.1 3.0 △ 1.1 △26.0% 4.5Gaming & Systems 2.9 2.7 △ 0.3 △8.6% 5.5Amusement 3.9 6.5 2.6 +67.9% 5.2Corporate expenses and eliminations △ 2.9 △ 2.5 0.4 △12.4% △ 4.5Segment profit (loss) 32.4 39.4 7.0 +21.6% 41.7Other income and other expenses △ 2.8 △ 0.9 1.9 - △ 1.7Total Operating Profit 29.6 38.5 8.9 +30.2% 40.0

6
Guidance Revision
(Yen in Billions)
FY2017
FY2018
Initial
Guidance
FY2018
Revised
Guidance
Change vs.
Initial
Guidance
YoY
Change
12 months ended
March 2017
12 months ending
March 2018
12 months ending
March 2018
Revenue 229.9 245.0 240.0 △ 5.0 10.1
△2.0% +4.4%
Operating profit 36.4 40.0 45.0 5.0 8.6
+12.5% +23.8%
Profit before income taxes 35.5 39.0 44.0 5.0 8.5
+12.8% +23.9%
Profit for the period 26.0 27.0 29.0 2.0 3.0(attributable to owners of the parent) +7.4% +11.7%
Earnings per share (JPY) 191.89 199.65 214.44 14.79 22.55

7
Guidance Revision by Business Segment
(Yen in Billions)
FY2017
FY2018
Initial
Guidance
FY2018
Revised
Guidance
Change vs.
Initial
Guidance
YoY
Change
Revenue12 months ended
March 2017
12 months ending
March 2018
12 months ending
March 2018
Digital Entertainment 105.6 118.0 120.0 2.0 14.4
Health & Fitness 68.6 69.0 66.0 △ 3.0 △ 2.6
Gaming & Systems 31.3 32.0 30.5 △ 1.5 △ 0.8
Amusement 25.3 27.0 25.0 △ 2.0 △ 0.3
Eliminations △ 0.9 △ 1.0 △ 1.5 △ 0.5 △ 0.6
Total 229.9 245.0 240.0 △ 5.0 10.1
Segment profit (loss)
Digital Entertainment 33.8 31.0 37.0 6.0 3.2
Health & Fitness 4.2 4.5 3.0 △ 1.5 △ 1.2
Gaming & Systems 4.8 5.5 4.5 △ 1.0 △ 0.3
Amusement 5.2 5.2 7.5 2.3 2.3
Corporate expenses and eliminations △ 4.4 △ 4.5 △ 4.5 0.0 △ 0.1Segment profit (loss) 43.6 41.7 47.5 5.8 3.9Other income and other expenses △ 7.3 △ 1.7 △ 2.5 △ 0.8 4.8Total Operating Profit 36.4 40.0 45.0 5.0 8.6

8
Dividend Forecast Revision
(JPY)
FY2017
FY2018
Initial
Forecast
FY2018
Revised
Forecast
Change vs.
Initial
Forecast
YoY
Change
12 months ended
March 2017
12 months ending
March 2018
12 months ending
March 2018
Interim dividend 17.00 30.00 30.00 0.00 13.00
Year-end dividend 41.00 30.00 35.00 5.00 △ 6.00(Forecast)
Annual dividend 58.00 60.00 65.00 5.00 7.00(Forecast)

(Yen in Billions)
FY2017Q1-3
FY2018Q1-3
YoYChange
FY2018Initial
Guidance
FY2018Revised
Guidance9 months ended
December 2016
9 months ended
December 2017
12 months ending
March 2018
12 months ending
March 2018
Revenue 73.7 89.7 +21.7% 118.0 120.0
Segment profit 24.4 29.7 +21.9% 31.0 37.0
Margin 33.1% 33.2% 26.3% 30.8%
9
Revenue and segment profit
FY2018 Q3 summary
Mobile games including “JIKKYOU PAWAFURU PUROYAKYU” and “PROFESSIONAL BASEBALLSPIRITS A” continue to deliver solid performance. “Winning Eleven Card Collection (PES CARDCOLLECTION)” launched in October; conducted major update of “Winning Eleven 2018 (PROEVOLUTION SOCCER 2018)” with over 80 million downloads as of January. “Yu-Gi-Oh! Duel Links”records 60 million downloads as of December while the PC version launched globally
Global sales of Yu-Gi-Oh! trading card games
Video games “Winning Eleven 2018 (PRO EVOLUTION SOCCER 2018)” and “Super Bomberman R”continue to drive solid performance
Hosted eSports regional tournaments for PAWAPURO CHAMPIONSHIPS 2017, an officially recognizedtournament by Nippon Professional Baseball (NPB), with finals taking place in January
Digital Entertainment

(Yen in Billions)
FY2017Q1-3
FY2018Q1-3
YoYChange
FY2018Initial
Guidance
FY2018Revised
Guidance9 months ended
December 2016
9 months ended
December 2017
12 months ending
March 2018
12 months ending
March 2018
Revenue 51.9 49.7 △4.3% 69.0 66.0
Segment profit 4.1 3.0 △26.0% 4.5 3.0
Margin 7.9% 6.1% 6.5% 4.5%
10
Health & Fitness
Revenue and segment profit
FY2018 Q3 summary
Rebranded the “XAX” brand as a fitness club dedicated to workout machines / studios; its secondclub XAX Kanadenomori (Narashino) opened on October 5th
In-house developed studio exercise program "Cardio Cross“ and Les Mills programs “Body Attack”and “Body Jam” introduced in October
Announced a partnership with Nippon Sport Science University to cooperate on physical education,sports and health related activities to promote measures including career planning for athletes,hosting sport events with top athletes and developing studio exercise programs
Note: Other expenses of JPY 0.5 billion (FY2017) and JPY 0.1 billion (FY2018) are notincluded in segment profit

(Yen in Billions)
FY2017Q1-3
FY2018Q1-3
YoYChange
FY2018Initial
Guidance
FY2018Revised
Guidance9 months ended
December 2016
9 months ended
December 2017
12 months ending
March 2018
12 months ending
March 2018
Revenue 21.7 20.7 △4.9% 32.0 30.5
Segment profit 2.9 2.7 △8.6% 5.5 4.5
Margin 13.4% 12.9% 17.2% 14.8%
11
Gaming & Systems
Revenue and segment profit
FY2018 Q3 summary
Enhanced lineup of the Concerto series in North America e.g. curved screen cabinet “ConcertoCrescent” and the single tall screen cabinet “Concerto Stack”
Installed casino management system “SYNKROS” in cruise ships and casinos in North America
Announced new products at the October show Global Gaming Expo 2017 in Las Vegas includingskill-based slot machine “Beat Square”, multi-station “Crystal Cyclone” and large format slot machine“Concerto Opus”
* YoY impact from the yen depreciation: revenue JPY +0.9 billion, operating profit JPY +0.1 billion

(Yen in Billions)
FY2017Q1-3
FY2018Q1-3
YoYChange
FY2018Initial
Guidance
FY2018Revised
Guidance9 months ended
December 2016
9 months ended
December 2017
12 months ending
March 2018
12 months ending
March 2018
Revenue 17.1 19.8 +15.6% 27.0 25.0
Segment profit 3.9 6.5 +67.9% 5.2 7.5
Margin 22.6% 32.9% 19.3% 30.0%
Continued solid performance of “MAH-JONG FIGHT CLUB High Grade Model”; launched music game“beatmania IIDX 25 CANNON BALLERS”, medal games “AnimaLotta Otogino Kunino Anima”, “GI-WorldClassic” and from the FEATURE PREMIUM series "Tower de Patissietta" and "PIRATES AGOGO!"
Launched “Sengoku Collection 3” with a strong track record of performance from its preceding title
12
Amusement
Revenue and segment profit
FY2018 Q3 summary
Note: Other expenses of JPY 2.3 billion (FY2017) and JPY 0.8 billion (FY2018) are notincluded in segment profit
13
Title Platform GeographyRelease
Date
Business
Segment
(※1)
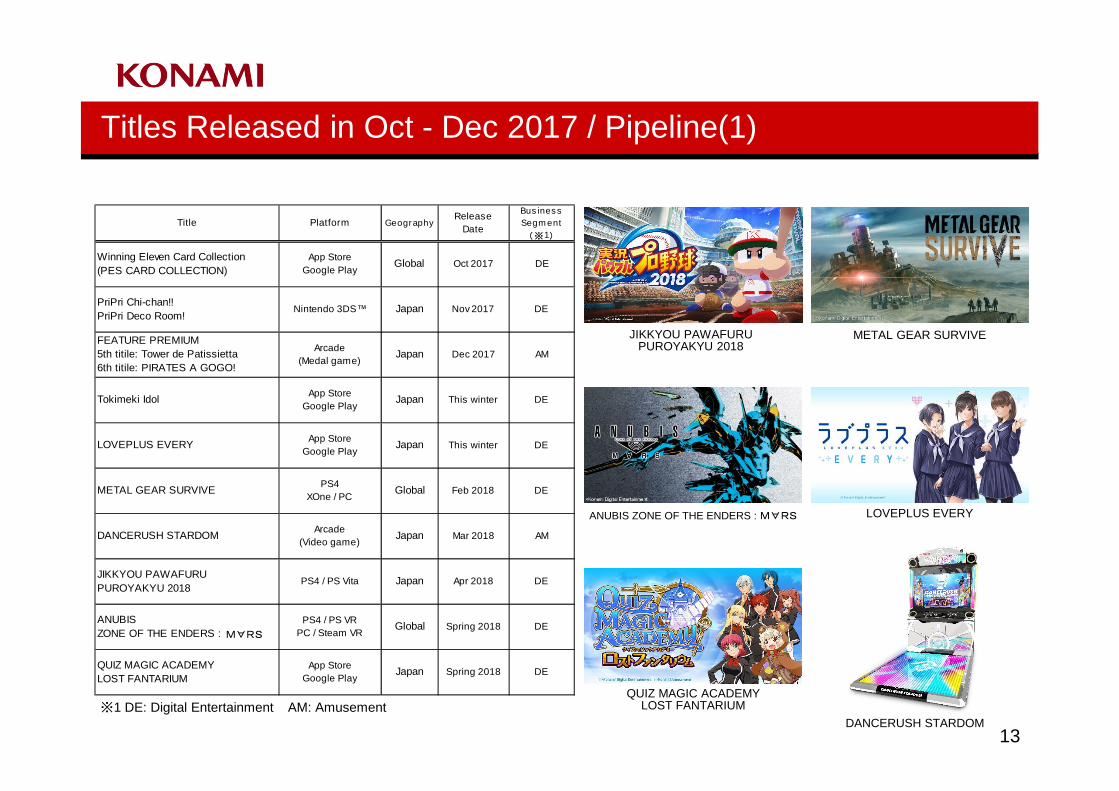
Winning Eleven Card Collection
(PES CARD COLLECTION)
App Store
Google PlayGlobal Oct 2017 DE
PriPri Chi-chan!!
PriPri Deco Room!Nintendo 3DS™ Japan Nov 2017 DE
FEATURE PREMIUM
5th titile: Tower de Patissietta
6th titile: PIRATES A GOGO!
Arcade
(Medal game)Japan Dec 2017 AM
Tokimeki IdolApp Store
Google PlayJapan This winter DE
LOVEPLUS EVERYApp Store
Google PlayJapan This winter DE
METAL GEAR SURVIVEPS4
XOne / PCGlobal Feb 2018 DE
DANCERUSH STARDOMArcade
(Video game)Japan Mar 2018 AM
JIKKYOU PAWAFURU
PUROYAKYU 2018PS4 / PS Vita Japan Apr 2018 DE
ANUBIS
ZONE OF THE ENDERS : M∀RS
PS4 / PS VR
PC / Steam VRGlobal Spring 2018 DE
QUIZ MAGIC ACADEMY
LOST FANTARIUM
App Store
Google PlayJapan Spring 2018 DE
※1 DE: Digital Entertainment AM: Amusement
LOVEPLUS EVERY
QUIZ MAGIC ACADEMYLOST FANTARIUM
ANUBIS ZONE OF THE ENDERS : M∀RS
JIKKYOU PAWAFURUPUROYAKYU 2018
METAL GEAR SURVIVE
DANCERUSH STARDOM
Titles Released in Oct - Dec 2017 / Pipeline(1)

14
Titles Released in Oct - Dec 2017 / Pipeline(2)
Title Platform GeographyRelease
Date
Business
Segment
(※)
Sengoku Collection 3 Pachislot Japan Nov 2017 AM
MARBLE FEVERArcade
(Medal game)Japan Mar 2018 AM
Fortune Cup Gaming MachineNorth
America
FY Mar 2018
H2GS
Beat Square Gaming MachineNorth
America
FY Mar 2019
H1GS
Concerto Opus Gaming MachineNorth
America
FY Mar 2019
H2GS
Crystal Cyclone Gaming Machine TBD TBD GS
※ AM: Amusement GS: Gaming & Systems
Sengoku Collection 3
Fortune Cup
Concerto Opus Crystal Cyclone
Beat Square
MARBLE FEVER

15
Consolidated Business Performance
(Yen in Billions)
163.9 100.0% 178.7 100.0% 14.7 +9.0%
△ 99.9 60.9% △ 104.6 58.5% △ 4.7
△ 31.7 19.3% △ 34.7 19.4% △ 3.0
△ 2.8 1.7% △ 0.9 0.5% 1.9
29.6 18.0% 38.5 21.6% 8.9 +30.2%
0.1 0.2 0.1
△ 1.0 △ 0.6 0.3
0.1 0.1 △ 0.1
28.9 17.6% 38.1 21.3% 9.3 +32.1%
△ 8.2 5.0% △ 12.1 6.8% △ 3.9
20.7 12.6% 26.0 14.6% 5.4 +26.0%
Owners of the parent 20.7 12.6% 26.0 14.6% 5.4 +26.1%
Non-controlling interests 0.0 0.0% 0.0 0.0% △ 0
Revenue
Total cost of revenue
SG&A
Profit before income taxes
Income taxes
Profit for the period
Profit attributable to:
Other income and other expenses
Operating profit
Finance income
Finance costsProfit from investments accounted
for using the equity method
percentileFY2018
Q1-3
YoY
Change
(%)
FY2017
Q1-3percentile
YoY
Change
(Amount)
16
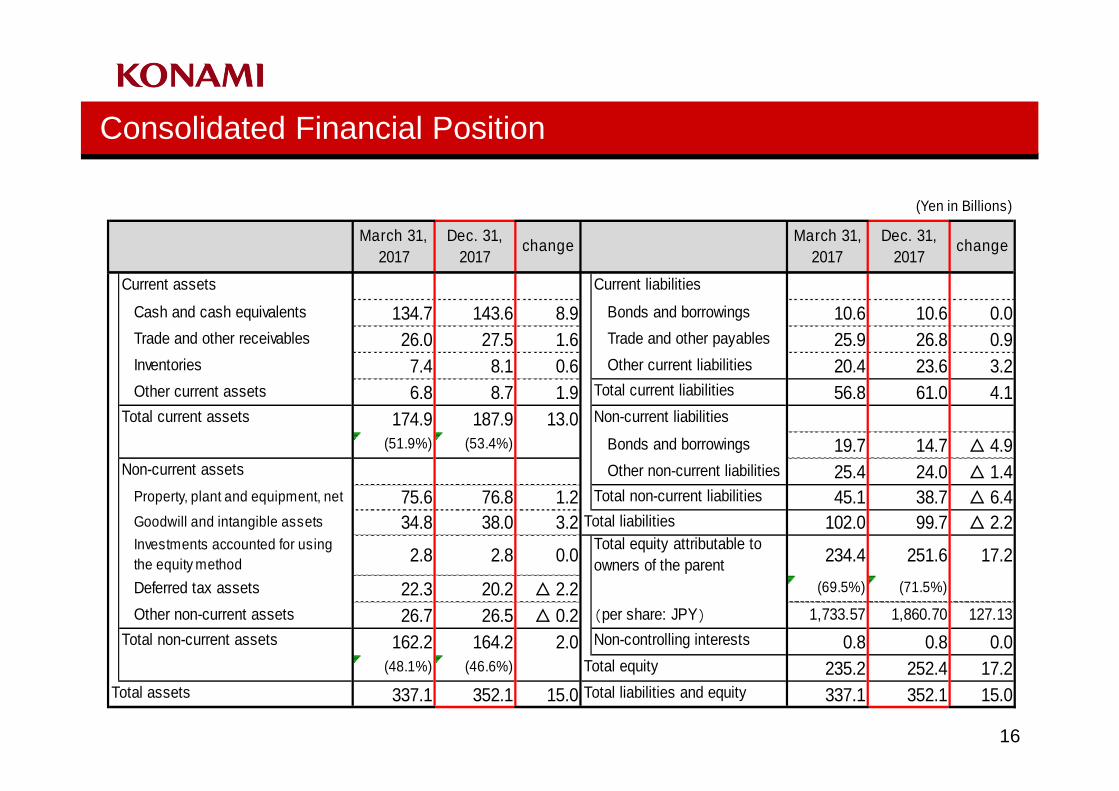
Consolidated Financial Position
(Yen in Billions)
March 31, Dec. 31, March 31, Dec. 31,
2017 2017 2017 2017
Cash and cash equivalents 134.7 143.6 8.9 Bonds and borrowings 10.6 10.6 0.0
Trade and other receivables 26.0 27.5 1.6 Trade and other payables 25.9 26.8 0.9
Inventories 7.4 8.1 0.6 Other current liabilities 20.4 23.6 3.2
Other current assets 6.8 8.7 1.9 56.8 61.0 4.1
174.9 187.9 13.0(51.9%) (53.4%) Bonds and borrowings 19.7 14.7 △ 4.9
Other non-current liabilities 25.4 24.0 △ 1.4Property, plant and equipment, net 75.6 76.8 1.2 45.1 38.7 △ 6.4Goodwill and intangible assets 34.8 38.0 3.2 102.0 99.7 △ 2.2Investments accounted for using
the equity method2.8 2.8 0.0 234.4 251.6 17.2
Deferred tax assets 22.3 20.2 △ 2.2 (69.5%) (71.5%)
Other non-current assets 26.7 26.5 △ 0.2 (per share: JPY) 1,733.57 1,860.70 127.13
162.2 164.2 2.0 0.8 0.8 0.0(48.1%) (46.6%) 235.2 252.4 17.2
337.1 352.1 15.0 337.1 352.1 15.0Total liabilities and equity
Total non-current assets
Total assets
Total equity attributable to
owners of the parent
Non-controlling interests
Total equity
change change
Non-current assets
Total non-current liabilities
Total liabilities
Current assets Current liabilities
Total current assets
Total current liabilities
Non-current liabilities

17
Consolidated Cash Flows
(JPY in billions)
△5.5
Dec 31, 2016
△14.4
143.6
Dec 31, 2017+0.7△16.0
134.7
+25.8
113.9
FY2017 Q3
Apr 1, 2016
Operating CF Investing CF
Financing CF△8.0
8.9 billion increase
FX
+0.8
13.1 billion increase
127.1
Apr 1, 2017
Financing CF FX
Operating CF Investing CFFY2018 Q3
+38.6

THANK YOU
©KONAMI