fy2018 results and fy2019 forecasts1-3. sales and op by segment h bn sales op sales op sales op...
TRANSCRIPT
FY2018 Results and
FY2019 Forecasts
2019/5/24
INDEX
1. FY2018 Results
1. FY2018 Results (PL)
2. OP variation factors from FY2017 to FY2018
3. Sales and OP by Segment
4. BS as of FY2018 end
2. FY2019 Forecasts
1. FY2019 Forecasts (PL)
2. OP variation factors from FY2018 to FY2019
3. Sales and OP by Segment
4. Our major efforts in FY2019
5. Capital Investment by Region/Segment
6. R&D Expenditures by Segment
7. Dividend
3. R&D Activities
1. R&D Organization
2. R&D investments and policies
3. Fields and themes
4. SEI’s R&D in the CASE field
5. R&D in new energy field
6. R&D in 5G communications field
2/26
1.FY2018 Results
3/26

1-1. FY2018 Results (PL)FY2017 FY2018 FY2018 Growth Difference
\bn Actual ①Revised
Plan②Actual ③ ③-① ③-②
Net Sales 3,082.2 3,180.0 3,178.0 +95.7 (2.0)
Operating Profit 173.1 175.0 166.3 (6.9) (8.7)
Non-Operating Income/Expenses 21.9 18.0 22.4 +0.5 +4.4
Ordinary Income 195.0 193.0 188.6 (6.4) (4.4)
Gain on return of assets
from retirement benefit trust- +8.9 +8.9
Gain on sales of investment securities 13.5 - (13.5)
Loss on disposal of fixed assets (3.7) (3.1) +0.6
Impairment loss on fixed assets (3.4) (10.7) (7.3)
Restructuring expenses (4.0) (2.4) +1.6
Loss on construction related accident (4.1) - +4.1
Profit before Income Taxes 193.3 181.4 (11.9)
Profit Attributable to
Non-Controlling Interests(73.0) (63.3) +9.7
Profit Attributable to
Owners of the Parent120.3 122.0 118.1 (2.3) (3.9)
(71.0) +0.4
※
4/26

1-2. OP variation factors from FY2017 to FY2018
△436
FY2018Actual
(42.7)
+36.5
(2.7)
(7.3)
(16.6)
+26.0
Average Rate
2017 2018
USD 110.85 110.92
EUR 129.66 128.44
¥173.1
bn
(5.6%)
¥166.3
bn
(5.2%)
(%):OP Rate
FY2017Actual
Unit price decline/Product mix
Depreciation
Sales volumeincrease
Costreduction
Forex impact/additional tariff
and others
R&D andothers
Despite sales expansion and global cost reduction, operating profit (OP) decreased by ¥6.9 bn from the previous period due to a price decline, increase in R&D costs for the future and additional tariffs between China and the U.S..
5/26

1-3. Sales and OP by Segment
¥bn Sales OP Sales OP Sales OP Sales OP
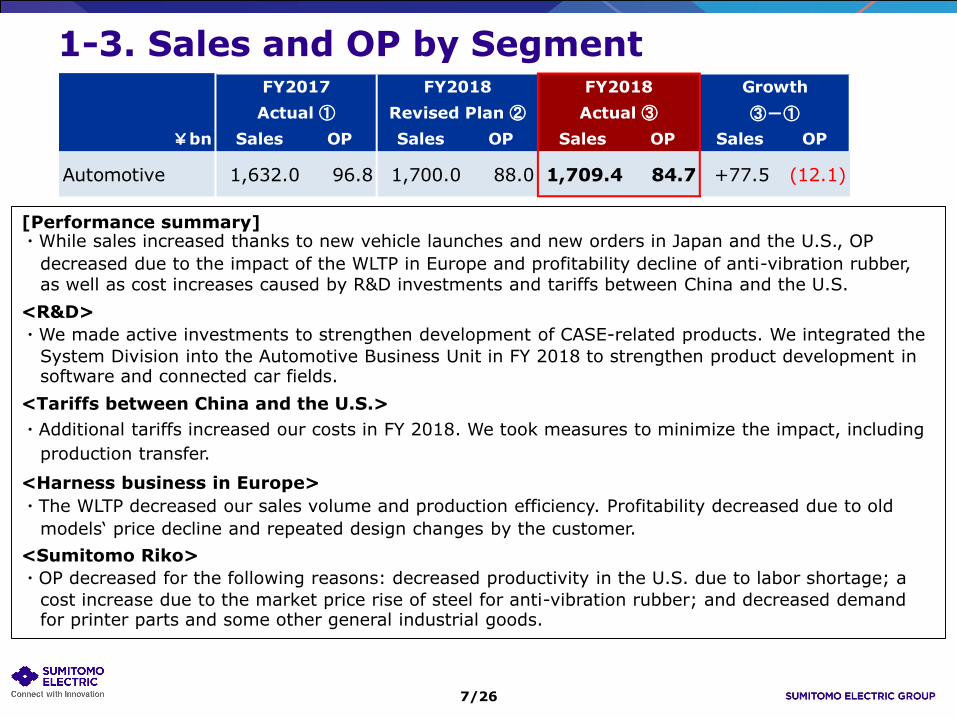
Automotive 1,632.0 96.8 1,700.0 88.0 1,709.4 84.7 +77.5 (12.1)
Infocommunications 220.3 18.6 220.0 19.0 208.4 16.4 (11.9) (2.2)
Electronics 246.3 5.4 230.0 8.0 228.9 7.0 (17.4) +1.6
Environment and
Energy718.0 24.1 760.0 28.0 759.8 30.1 +41.8 +5.9
Industrial Materials
and Others343.1 28.2 370.0 32.0 357.8 28.2 +14.7 +0.0
Total 3,082.2 173.1 3,180.0 175.0 3,178.0 166.3 +95.7 (6.9)
※ Differences between the aggregate of all segments and Total are consolidated eliminations.
Actual ① ③-①Actual ③
GrowthFY2017 FY2018FY2018
Revised Plan ②
From the previous period, OP decreased in the automotive and infocommunications segments, but increased in the electronics, environment & energy, and industrial materials & others segments.
6/26
1-3. Sales and OP by Segment
¥bn Sales OP Sales OP Sales OP Sales OP
Automotive 1,632.0 96.8 1,700.0 88.0 1,709.4 84.7 +77.5 (12.1)
Actual ① ③-①Actual ③
GrowthFY2017 FY2018FY2018
Revised Plan ②
[Performance summary]・While sales increased thanks to new vehicle launches and new orders in Japan and the U.S., OP
decreased due to the impact of the WLTP in Europe and profitability decline of anti-vibration rubber, as well as cost increases caused by R&D investments and tariffs between China and the U.S.
<R&D>
・We made active investments to strengthen development of CASE-related products. We integrated the
System Division into the Automotive Business Unit in FY 2018 to strengthen product development in software and connected car fields.
<Tariffs between China and the U.S.>
・Additional tariffs increased our costs in FY 2018. We took measures to minimize the impact, including
production transfer.
<Harness business in Europe>
・The WLTP decreased our sales volume and production efficiency. Profitability decreased due to old
models‘ price decline and repeated design changes by the customer.
<Sumitomo Riko>
・OP decreased for the following reasons: decreased productivity in the U.S. due to labor shortage; a
cost increase due to the market price rise of steel for anti-vibration rubber; and decreased demand for printer parts and some other general industrial goods.
7/26

1-3. Sales and OP by Segment
¥bn Sales OP Sales OP Sales OP Sales OP
Environment and Energy 718.0 24.1 760.0 28.0 759.8 30.1 +41.8 +5.9
Actual ① ③-①Actual ③
GrowthFY2017 FY2018FY2018
Revised Plan ②
[Performance summary]Sales and OP increased thanks to an increase in large-scale overseas electric power cable projects, Sumitomo Densetsu’s steady facility-construction business mainly in the Tokyo metropolitan area, and sales increases in rectangular magnet wires for electric vehicles and in Celmet.
<Electric power cables>(1) HV cables: Sales increased thanks to an increase in both overseas projects (e.g. large-
scale DC cables in Europe and India, submarine cables in the Middle East) anddomestic renewable energy projects.
(2) LV cables: Sales increased thanks to a demand increase in the construction field mainly in the Tokyo metropolitan area.
<Copper wire rods>
Sales increased at STEC, which we established in Thailand as our third base for copper wire rods and our integrated production base for aluminum wires (STEC started producing copper rods in 2015 and aluminum wires in 2016). A three-base (Japan, Indonesia and Thailand) of copper wire rod manufacturing has taken root.
<Others>Magnet wires Sales of rectangular magnet wires for electric vehicles increased.
Upfront costs for capacity increase occurred.Celmet Sales increased thanks to sales of electric vehicles.
8/26

1-3. Sales and OP by Segment
¥bn Sales OP Sales OP Sales OP Sales OP
Automotive 1,632.0 96.8 1,700.0 88.0 1,709.4 84.7 +9.4 (3.3)
Infocommunications 220.3 18.6 220.0 19.0 208.4 16.4 (11.6) (2.6)
Electronics 246.3 5.4 230.0 8.0 228.9 7.0 (1.1) (1.0)
Environment and
Energy718.0 24.1 760.0 28.0 759.8 30.1 (0.2) +2.1
Industrial Materials
and Others343.1 28.2 370.0 32.0 357.8 28.2 (12.2) (3.8)
Total 3,082.2 173.1 3,180.0 175.0 3,178.0 166.3 (2.0) (8.7)
※ Differences between the aggregate of all segments and Total are consolidated eliminations.
Actual ① Actual ③
Difference
③-②
FY2017 FY2018FY2018
Revised Plan ②
While OP exceeded the forecast in the environment & energy segment, it fell short of forecasts in the other four segments due to the impact of China’s economic slowdown and shipment postponements to the next period.
9/26

1-5. BS as of FY2018 end
¥bnFY2016
Actual
FY2017
Actual
FY2018
Actual
Current Assets 1,426.6 1,401.7 1,513.6
Non-Current Assets 1,480.7 1,598.2 1,539.6
Current Liabilities 824.2 803.7 880.8
Non-Current Liabilities 454.5 432.1 396.2
(Interest Bearing Debt) (511.0) (492.6) (540.7)
Shareholders' Equity 1,324.6 1,410.4 1,466.1
Accumulated Other
Comprehensive Income91.1 129.0 84.8
Non- Controlling Interests 212.9 224.6 225.4
Total Assets 2,907.3 2,999.9 3,053.3
Shareholders' Equity Ratio 48.7% 51.3% 50.8%
Debt/Equity Ratio 0.36 0.32 0.35
FY2016
Actual
FY2017
Actual
FY2018
Actual
※Operating Profit /
Invested Assets (ROIC)7.2% 7.9% 7.3%
Return on Equity (ROE) 7.7% 8.1% 7.6%
※Operating Profit / Invested Assets(ROIC) =Operating Profit
Total Assets-Interest-Free Liabilities
10/26
2. FY2019 Forecasts
11/26

2-1. FY2019 Forecasts (PL)
FY2019 PlanForex rate¥110/USD¥125/EUR
FY2018 Growth
¥bnActual
①1H
Plan
2H
Plan
Annual
Plan②
②-①
Net Sales 3,178.0 1,530.0 1,670.0 3,200.0 +22.0
Operating Profit 166.3 50.0 117.0 167.0 +0.7
Non-Operating
Income/Expenses22.4 7.0 11.0 18.0 (4.4)
Ordinary Income 188.6 57.0 128.0 185.0 (3.6)
Net Extraordinary Profit/Loss (7.3)
Profit before Income Taxes 181.4 (22.0) (44.0) (66.0) +4.5
Profit Attributable to
Non-Controlling Interests(63.3)
Profit Attributable to
Owners of the Parent118.1 35.0 84.0 119.0 +0.9
FY2019
12/26
Unit price decline/Product mix
FY2019Plan
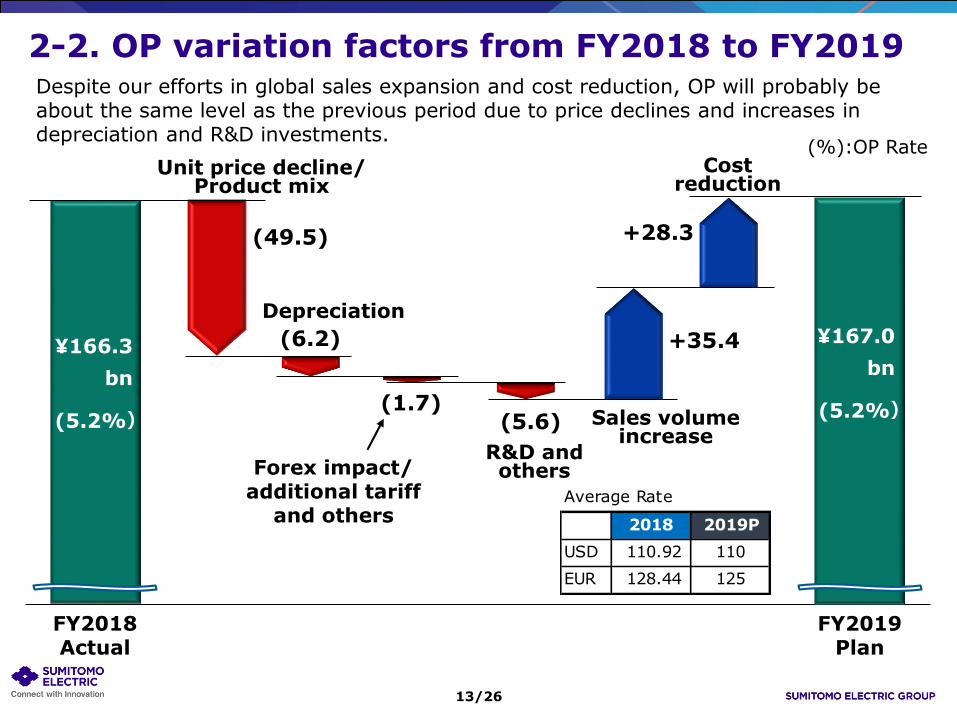
2-2. OP variation factors from FY2018 to FY2019
(49.5)
(6.2)
(1.7)(5.6)
+35.4
+28.3
Average Rate
2018 2019P
USD 110.92 110
EUR 128.44 125
¥166.3
bn
(5.2%)
¥167.0
bn
(5.2%)
(%):OP Rate
Depreciation
Sales volumeincrease
Costreduction
Forex impact/additional tariff
and others
R&D andothers
FY2018Actual
Despite our efforts in global sales expansion and cost reduction, OP will probably be about the same level as the previous period due to price declines and increases in depreciation and R&D investments.
13/26
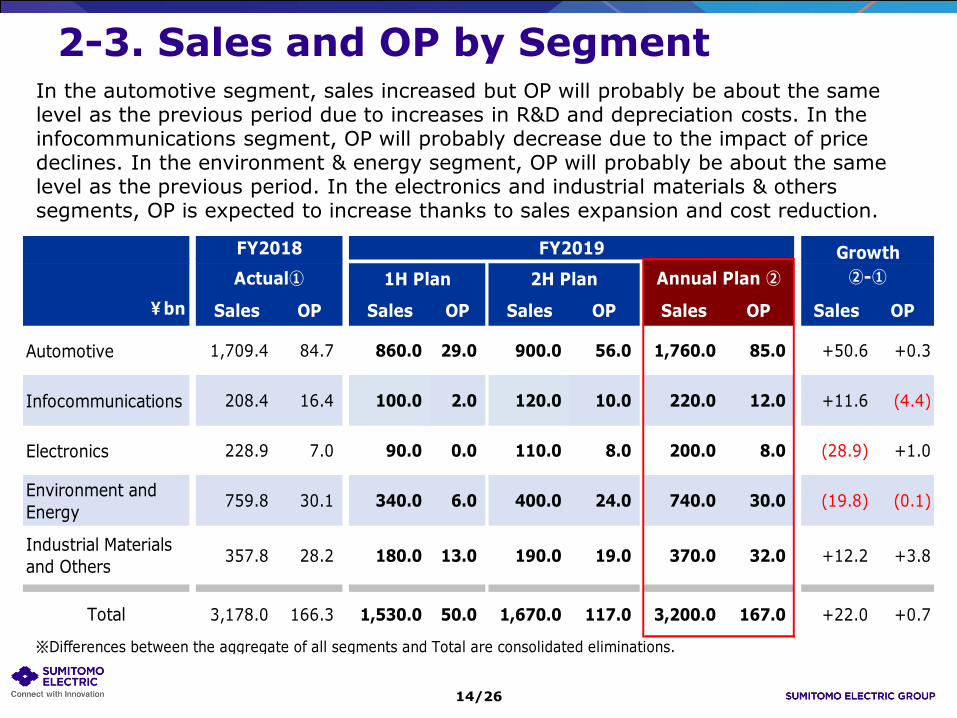
2-3. Sales and OP by SegmentIn the automotive segment, sales increased but OP will probably be about the same level as the previous period due to increases in R&D and depreciation costs. In the infocommunications segment, OP will probably decrease due to the impact of price declines. In the environment & energy segment, OP will probably be about the same level as the previous period. In the electronics and industrial materials & others segments, OP is expected to increase thanks to sales expansion and cost reduction.
14/26
¥bn Sales OP Sales OP Sales OP Sales OP Sales OP
Automotive 1,709.4 84.7 860.0 29.0 900.0 56.0 1,760.0 85.0 +50.6 +0.3
Infocommunications 208.4 16.4 100.0 2.0 120.0 10.0 220.0 12.0 +11.6 (4.4)
Electronics 228.9 7.0 90.0 0.0 110.0 8.0 200.0 8.0 (28.9) +1.0
Environment and
Energy759.8 30.1 340.0 6.0 400.0 24.0 740.0 30.0 (19.8) (0.1)
Industrial Materials
and Others357.8 28.2 180.0 13.0 190.0 19.0 370.0 32.0 +12.2 +3.8
Total 3,178.0 166.3 1,530.0 50.0 1,670.0 117.0 3,200.0 167.0 +22.0 +0.7
※Differences between the aggregate of all segments and Total are consolidated eliminations.
Annual Plan ②Actual①
FY2018
②-①2H Plan
Growth
1H Plan
FY2019
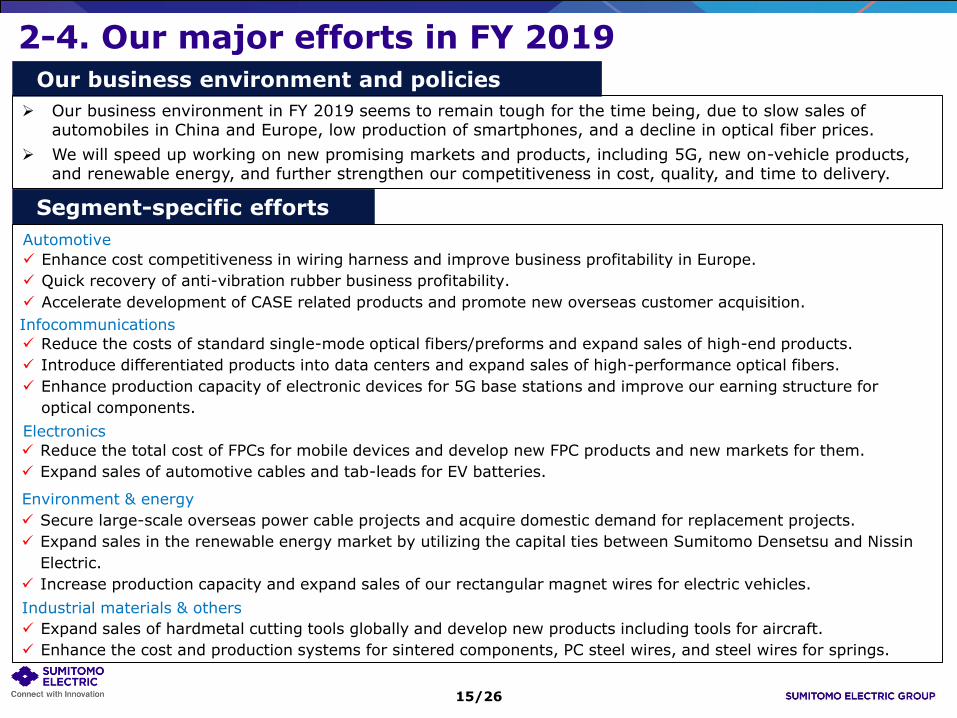
2-4. Our major efforts in FY 2019Our business environment and policies
➢ Our business environment in FY 2019 seems to remain tough for the time being, due to slow sales of automobiles in China and Europe, low production of smartphones, and a decline in optical fiber prices.
➢ We will speed up working on new promising markets and products, including 5G, new on-vehicle products, and renewable energy, and further strengthen our competitiveness in cost, quality, and time to delivery.
✓ Enhance cost competitiveness in wiring harness and improve business profitability in Europe.
✓ Quick recovery of anti-vibration rubber business profitability.
✓ Accelerate development of CASE related products and promote new overseas customer acquisition.
Infocommunications
Electronics
Environment & energy
Industrial materials & others
Automotive
✓ Reduce the costs of standard single-mode optical fibers/preforms and expand sales of high-end products.
✓ Introduce differentiated products into data centers and expand sales of high-performance optical fibers.
✓ Enhance production capacity of electronic devices for 5G base stations and improve our earning structure for
optical components.
✓ Reduce the total cost of FPCs for mobile devices and develop new FPC products and new markets for them.
✓ Expand sales of automotive cables and tab-leads for EV batteries.
✓ Secure large-scale overseas power cable projects and acquire domestic demand for replacement projects.
✓ Expand sales in the renewable energy market by utilizing the capital ties between Sumitomo Densetsu and Nissin
Electric.
✓ Increase production capacity and expand sales of our rectangular magnet wires for electric vehicles.
✓ Expand sales of hardmetal cutting tools globally and develop new products including tools for aircraft.
✓ Enhance the cost and production systems for sintered components, PC steel wires, and steel wires for springs.
Segment-specific efforts
15/26
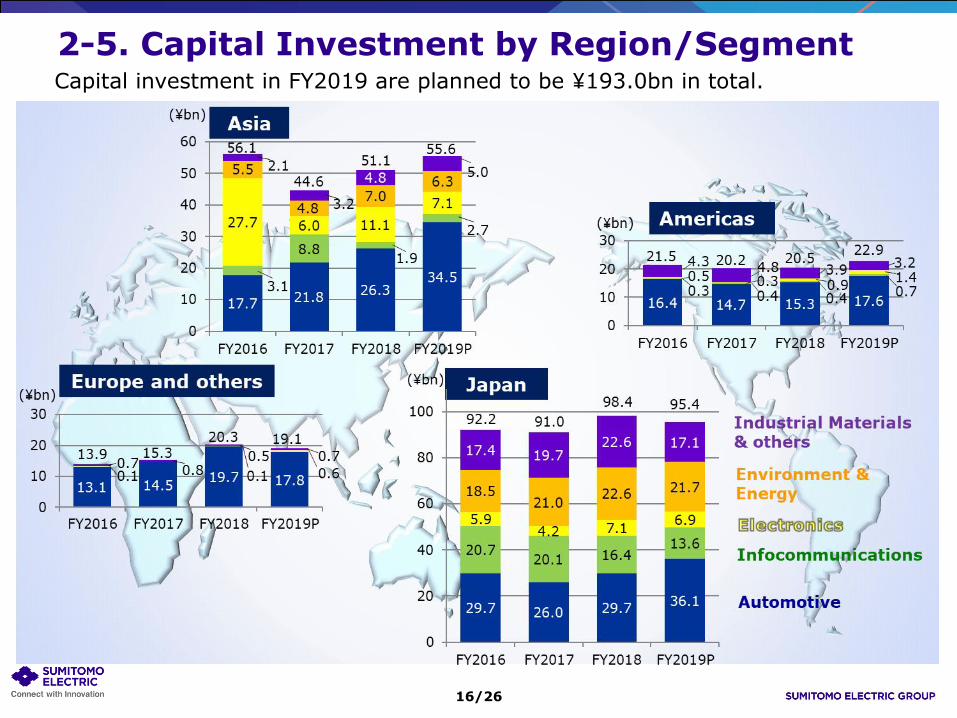
2-5. Capital Investment by Region/SegmentCapital investment in FY2019 are planned to be ¥193.0bn in total.
16/26
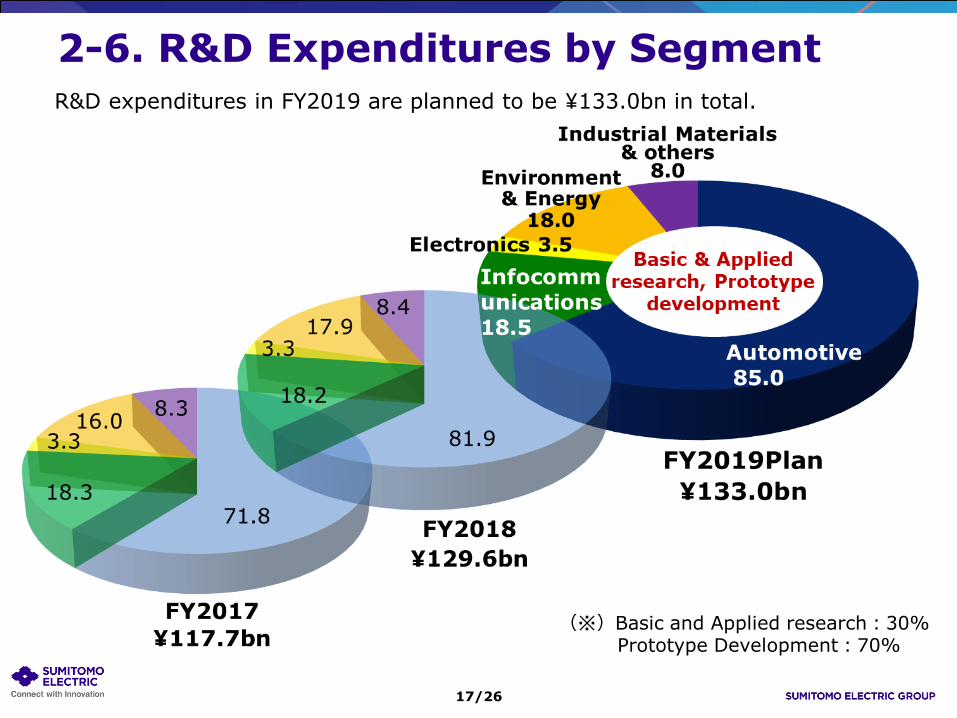
2-6. R&D Expenditures by SegmentR&D expenditures in FY2019 are planned to be ¥133.0bn in total.
(※)Basic and Applied research:30%Prototype Development:70%
17/26

2-7. DividendFY2019 annual dividend is planned to be ¥48/share.
18/26

3.R&D Activities
19/26

3-1. R&D Organization
➢ Overseas Operations✓ Innovation Core SEI(U.S.A , Germany)
San Jose, CA, U.S.A
Düsseldorf, Germany→Research North American and European
market and develop new businesses✓ China Analysis Technology Center
Suzhou, Jiangsu, China
→Supports production and developmentoperations in China
➢ R&D Operations of Major Group Companies
✓ AutoNetworks Technologies, Ltd.(Yokkaichi & Suzuka, Mie)
✓ A.L.M.T. Corp.(Toyama & Hyogo)✓ Nissin Electric Co., Ltd.(Kyoto)✓ Sumitomo Riko Company Ltd.(Aichi)
・Advanced
Materials
・Transmission
Device
・Analysis
Technology
YokohamaItami
Osaka
・Optical
Communications
・Transmission
Device
・Frontier
Technologies・Analysis
Technology
・Advanced Automotive Systems・Power Systems・Information Network・Energy and Electronics Materials・Frontier Technologies・Power Device・Analysis Technology・IoT , Cyber-security
20/26

3-2. R&D investments and policies
Automotive
Industrial Materials& others
Infocommunications
Environment & Energy
◼ Sumitomo Electric Group’s R&D costs➢ ¥129.6 bn/yr. (FY 2018 actual)
• Ratio to sales: staying at around 4%➢ Segment breakdown
• Automotive: approx. 60%• R&D Unit: approx. one-third• Divisions and affiliated companies:
approx. two-thirds
◼ Operation policies➢ Creation and enhancement of leading
technologies.➢ Continue to enhance core
technologies from materials to processes
➢ Create innovations in advance of future changes in the automotive and energy fields and exploits commercialization opportunities
➢ Challenge ourselves to create innovative technologies that encourages social reform
➢ Open innovation➢ Ensure consistency with intellectual
property strategies and standardization strategies.
21/26

Research and Development for the Next Generation—Creating innovative technologies and products via far-sighted R&D
3-3. Fields and themes
22/26

Telematics centers vehicles
Energy
Mobility
Quick charging
Mobility services
Communications
With our “connecting technologies,” one of our great advantages, we are creating new products and technologies that will connect vehicles with energy and communications infrastructure.
Onboard networks
5G commu-nications
Traffic control infrastructure
ITS infrastructure
Optical network
infra-structure
Power control servers
Power grid
Traffic info and OTA
3-4. SEI’s R&D in the CASE field
Residen-tialGW
23/26
Power control service
Charging and
communi-cations control
Electric power infrastructure
Roadside units
Vehicles

大事
Redox flowbatteries
Quick charging stations/connectors
Power grid
POWER DEPO
Concentrator photovoltaic
systems (CPV)Resource
servers
PV monitoring systems
sEMSA
HEMS systems/
sensors
Overhead line monitoring
DLR*3
CASE-related new energy field
VPPs*1
PLC*2/smart meters
*1 VPP: Virtual power plant*2 PLC: Power line communication*3 DLR: Dynamic line rating (Overhead line temperature, wind speed, and electric power are
measured in real time to determine the upper limit of power transmission.)
We are creating new businesses by developing new technologies and products for expanded renewable energy use and sophisticated management of distributed power sources.
3-5. R&D in new energy field
24/26

Term
inals
Access
Metr
oC
ore
5G antennas and TCUs
Onboard networks
GaN HEMTs
Ethernet system1/10 GE-PON
5Gbase
stations
5G optical network
Clo
ud
Traffic information system
Wavelength multiplexers
Optical fiber amplifiers
Optical switches
Wireless modules for 5G base stations
Optical fiber
Optical transceiver modules
WDM optical components
Optical connectors
Traffic control systems
4K/8K video transmission
Optical fusion splicersSecurity systems
25/26
Demonstration tests
⚫ Cabinet Office’s Cross-ministerial Strategic Innovation Promotion Program
⚫ MIC-led 5G Comprehensive Demonstration Tests (by KDDI and ATR)
⚫ NTT Docomo⚫ Michinori HD, etc.
FPCs
In fields related to 5G communications, we are developing technologies ranging from long-and short-distance communications infrastructure to smartphones and onboard equipment.
Smartphones
Datacenters
Connected cars
3-6. R&D in 5G communications field

Notes on Perspective Information
26/26