fy2018 third quarter financial results innova geographic operating income :asia operating income...
TRANSCRIPT
e-Palette Concept
(Consumer Electronics Show 2018
exhibition car)
FY2018 Third Quarter Financial Results
Toyota Motor Corporation February 6, 2018

2
Cautionary Statement with Respect to Forward-Looking Statements
This presentation contains forward-looking statements that reflect Toyota’s plans and expectations. These forward-looking
statements are not guarantees of future performance and involve known and unknown risks, uncertainties and other
factors that may cause Toyota’s actual results, performance, achievements or financial position to be materially different
from any future results, performance, achievements or financial position expressed or implied by these forward-looking
statements. These factors include, but are not limited to: (i) changes in economic conditions, market demand, and the
competitive environment affecting the automotive markets in Japan, North America, Europe, Asia and other markets in
which Toyota operates; (ii) fluctuations in currency exchange rates, particularly with respect to the value of the Japanese
yen, the U.S. dollar, the euro, the Australian dollar, the Russian ruble, the Canadian dollar and the British pound, and
interest rates fluctuations; (iii) changes in funding environment in financial markets and increased competition in the
financial services industry; (iv) Toyota’s ability to market and distribute effectively; (v) Toyota’s ability to realize production
efficiencies and to implement capital expenditures at the levels and times planned by management; (vi) changes in the
laws, regulations and government policies in the markets in which Toyota operates that affect Toyota’s automotive
operations, particularly laws, regulations and government policies relating to vehicle safety including remedial measures
such as recalls, trade, environmental protection, vehicle emissions and vehicle fuel economy, as well as changes in laws,
regulations and government policies that affect Toyota’s other operations, including the outcome of current and future
litigation and other legal proceedings, government proceedings and investigations; (vii) political and economic instability in
the markets in which Toyota operates; (viii) Toyota’s ability to timely develop and achieve market acceptance of new
products that meet customer demand; (ix) any damage to Toyota’s brand image; (x) Toyota’s reliance on various suppliers
for the provision of supplies; (xi) increases in prices of raw materials; (xii) Toyota’s reliance on various digital and
information technologies; (xiii) fuel shortages or interruptions in electricity, transportation systems, labor strikes, work
stoppages or other interruptions to, or difficulties in, the employment of labor in the major markets where Toyota purchases
materials, components and supplies for the production of its products or where its products are produced, distributed or
sold; and (xiv) the impact of natural calamities including the negative effect on Toyota’s vehicle production and sales.
A discussion of these and other factors which may affect Toyota’s actual results, performance, achievements or financial
position is contained in Toyota’s annual report on Form 20-F, which is on file with the United States Securities and
Exchange Commission.

3
Caution concerning Insider Trading Under Japanese securities laws and regulations (the "Regulations"), subject to certain exceptions, any person who
receives certain material information relating to the business, etc. of Toyota which may be contained in this document is
prohibited from trading in Toyota's shares or certain other transactions related to such shares (as set forth in the
Regulations) until such material information is deemed to be made public. Under the Regulations, material information is
deemed to be made public when (i) such material information is notified to a stock exchange and is disclosed by ways of
electromagnetic means as prescribed by the ordinance of the Cabinet Office (posting on the TDnet (Timely Disclosure
Network) information service ) or (ii) twelve (12) hours have elapsed since a listed company, such as Toyota, disclosed
such material information to at least two (2) media sources as prescribed by the Regulations.

4
FY2018 Third Quarter
Financial Results
FY2018 Third Quarter Financial Performance
FY2018 Financial Forecasts

5
FY2018
3Q
FY2018
9 months
1,025 1,053
1,192 1,148
668 706
2,145
1,613 1,639
2,132
0
2,000
4,000
6,000
8,000
340 361
428 404
233 237
745 735
534 552
0
1,000
2,000
3,000
6,678 6,643
’16/10-12 Change ’17/10-12 ’16/4-12 ’17/4-12
Japan
N. America
Other
(+18)
(-10)
(+4)
(-24)
(+21)
(+35)
(+26)
(-13)
(+38)
(-44)
(+28)
Change
(+0.4%)
(+0.5%)
2,645 2,631 -14 7,712 7,847 +135
Consolidated Vehicle Sales (thousands of vehicles)
Total retail vehicle sales in thousands
2,280 2,289 (+9)
Asia
Europe
Central and South America, Oceania, Africa, The Middle East, etc.

- +155.45 yen 159.54 yen 314.99 yen
+4 yen 109 yen 113 yen
+15 yen 118 yen 133 yen
-
+93.6%
+27.8%
-
+7.4%
- 6.9% 12.4%
+455.3 486.5 941.8
- 6.2% 8.9%
+163.4 587.5 750.9
+235.0 438.5 673.6
+521.5 7,084.1 7,605.7
+53.6%
-
-
FY2018 3Q (’17/10-12)
Change
(billions of yen)
Net Revenues
Operating Income Operating margin
Income before income taxes and
equity in earnings of affiliated
companies
Net Income* Net margin*
Net income per share* (diluted)
FOREX
Rates
US$ €
*1 Net Income attributable to Toyota Motor Corporation
*2 Net Income attributable to common shareholders
FY2017 3Q (’16/10-12)
1
1
2
6
Consolidated Financial Summary (FY2018 Third Quarter)

+35.0
+195.0
+5.0
+35.0-35.0
7
*1. Details ※
Transactional (Imports & Exports) +75.0 Volume, Model Mix +60.0 Labor Costs -15.0
US$ +35.0 Financial Services ±0 Depreciation -10.0
€ +25.0 Other +110.0 Other -55.0 R&D Expenses -5.0
Other +15.0 Expenses, etc. -5.0
※From FY2017 financial results, "Effects of FOREX Rates" includes translational FOREX impact concerning operating income of overseas subsidiaries and fiscal year-end balance of provisions in foreign currencies, etc.
*4. Details*3. Details
+10.0
*2. DetailsTranslational FOREX impact
concerning overseas
subsidiaries
Valuation Gains/Losses
from Swaps, etc.+35.0
Analysis of Consolidated Operating Income (FY2018 Third Quarter)
(billions of yen)
’16/10-12 ’17/10-12
438.5
673.6
Operating Income (+235.0)
Cost
Reduction
Efforts
Effects of
FOREX
Rates *1
Marketing
Efforts *2
Increase in
Expenses,
etc. *3
Other *4
+5.0
Excluding the overall impact of foreign exchange
rates and swap valuation gains/losses, etc.
(Translational FOREX impact of fiscal
year-end balance of provisions in foreign
currencies, etc.)
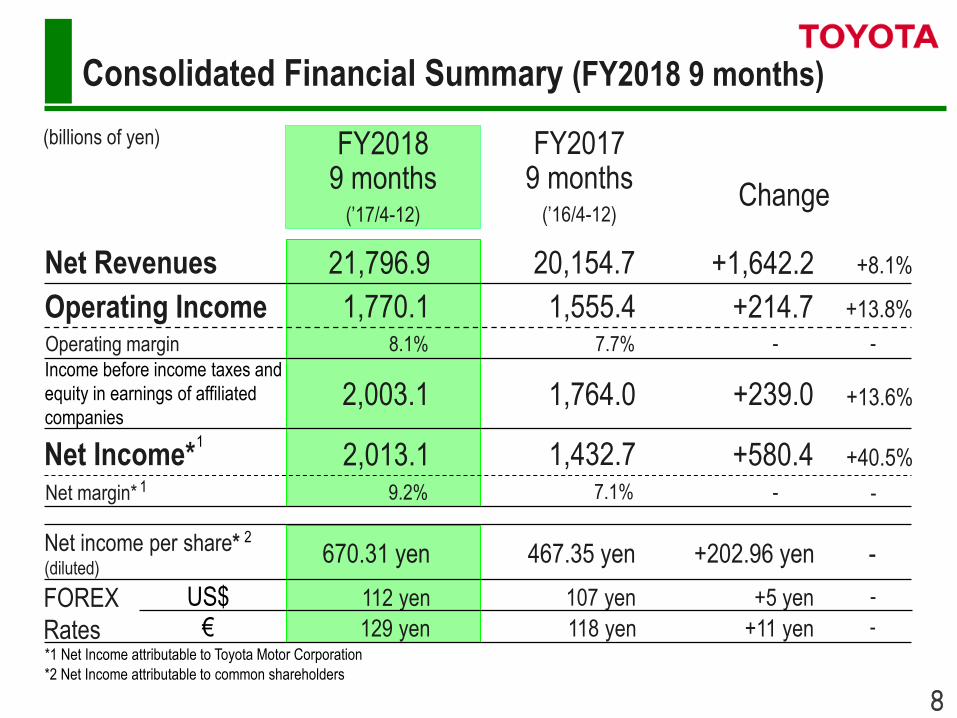
- +202.96 yen 467.35 yen 670.31 yen
+5 yen 107 yen 112 yen
+11 yen 118 yen 129 yen
-
+40.5%
+13.6%
-
+8.1%
- 7.1% 9.2%
+580.4 1,432.7 2,013.1
- 7.7% 8.1%
+239.0 1,764.0 2,003.1
+214.7 1,555.4 1,770.1
+1,642.2 20,154.7 21,796.9
+13.8%
-
-
FY2018 9 months
(’17/4-12) Change
Consolidated Financial Summary (FY2018 9 months)
(billions of yen)
Net Revenues
Operating Income Operating margin
Income before income taxes and
equity in earnings of affiliated
companies
Net Income* Net margin*
Net income per share* (diluted)
FOREX
Rates
US$ €
*1 Net Income attributable to Toyota Motor Corporation
*2 Net Income attributable to common shareholders
FY2017 9 months
(’16/4-12)
1
1
2
8

-85.0+24.7
-155.0
+295.0
+135.0
9
*1. Details ※
Transactional (Imports & Exports) +255.0 Volume, Model Mix -5.0 Labor Costs -40.0
US$ +155.0 Financial Services ±0 Depreciation -30.0
€ +50.0 Other +5.0 Other -150.0 R&D Expenses -15.0
Other +50.0 Expenses, etc. ±0
※From FY2017 financial results, "Effects of FOREX Rates" includes translational FOREX impact concerning operating income of overseas subsidiaries and fiscal year-end balance of provisions in foreign currencies, etc.
*4. Details*3. Details
+35.0
*2. DetailsTranslational FOREX impact
concerning overseas
subsidiaries
Valuation Gains/Losses
from Swaps, etc.+24.7
Analysis of Consolidated Operating Income (FY2018 9 months)
(billions of yen)
’16/4-12 ’17/4-12
1,555.4
1,770.1
Effects of
FOREX
Rates *1
Cost
Reduction
Efforts
Effects of
Marketing
Activities *2
Increase in
Expenses,
etc. *3
Other *4
Operating Income (+214.7)
(Translational FOREX impact of fiscal
year-end balance of provisions in foreign
currencies, etc.)
-105.0
Excluding the overall impact of foreign exchange
rates and swap valuation gains/losses, etc.

10
696.9
1,112.8
1,613 1,639
9.5%
FY2018
3Q
211.1
471.1
552534
5.6% 11.3%
(+18)
6.5%
(+26)
+259.9 +415.9
FY2018
9 months
209.3 470.6 694.0 1,111.1
'16/10-12 '17/10-12 '16/4-12 '17/4-12
C-HR
Geographic Operating Income:Japan Operating Income (billions of yen) * Consolidated Vehicle Sales (thousands of vehicles)
* ●
Excluding Valuation Gains/Losses from Interest Rate Swaps, etc.
Operating Income Margin
Operating Income including
Valuation Gains/Losses
from Interest Rate Swaps, etc.
(billions of yen)
FY2018 3Q Operating Income*
471.1 billion yen (+259.9 billion yen year on year)
Increased as a result of favorable
foreign exchange rates, marketing
efforts, and cost reduction efforts.

11
27.0
101.3
745 735
●
(-10)
398.1
168.1
2,145 2,132
-229.9 -74.3
FY2018
9 months FY2018
3Q
70.6 33.1 381.9 177.7
2.1% 3.7% 1.0% 5.2%
(-13)
'16/10-12 '17/10-12 '16/4-12 '17/4-12
LEXUS RX450hL
Geographic Operating Income:North America Operating Income (billions of yen) * Consolidated Vehicle Sales (thousands of vehicles)
* Excluding Valuation Gains/Losses from Interest Rate Swaps, etc.
Operating Income Margin
Operating Income including
Valuation Gains/Losses
from Interest Rate Swaps, etc.
(billions of yen)
FY2018 3Q Operating Income*
27.0 billion yen (-74.3 billion yen year on year)
Declined due to increased sales
incentives and decreased vehicle
production.

12
20.923.4
237233
3.1% 3.0%
(+4)
55.5
62.5
706668
2.9% 2.7%
+2.4
+6.9
FY2018
9 months
FY2018
3Q
(+38)
18.1 23.3 52.6 61.1
'16/10-12 '17/10-12 '16/4-12 '17/4-12
YARIS
Geographic Operating Income:Europe Operating Income (billions of yen) * ●
* Consolidated Vehicle Sales (thousands of vehicles) Excluding Valuation Gains/Losses from Interest Rate Swaps, etc.
Operating Income Margin
Operating Income including
Valuation Gains/Losses
from Interest Rate Swaps, etc.
(billions of yen)
FY2018 3Q Operating Income*
23.4 billion yen (+2.4 billion yen year on year)
Increased mainly as a result of cost
reduction efforts.

13
8.8%
118.3122.0
404428
9.4% 9.1%
(-24)
338.0335.0
1,1481,192
9.5%
+3.7
-2.9
FY2018
9 months
FY2018
3Q
124.6 123.6 347.4 337.8
(-44)
'16/10-12 '17/10-12 '16/4-12 '17/4-12
KIJANG INNOVA
Geographic Operating Income:Asia Operating Income (billions of yen) * ●
* Consolidated Vehicle Sales (thousands of vehicles) Excluding Valuation Gains/Losses from Interest Rate Swaps, etc.
Operating Income Margin
Operating Income including
Valuation Gains/Losses
from Interest Rate Swaps, etc.
(billions of yen)
FY2018 3Q Operating Income*
122.0 billion yen (+3.7 billion yen year on year)
Increased largely because of
marketing and cost reduction efforts.

14
25.0
34.1
361340
4.5% 5.5%
(+21)
80.3
105.9
1,0531,025
5.0% 5.7%
(+28)
+9.0 +25.6
24.1 33.0 77.0 103.3
FY2018
3Q
FY2018
9 months
’16/10-12 ’17/10-12 ’16/4-12 ’17/4-12
HILUX
Geographic Operating Income : Central & South America,
Oceania, Africa and The Middle East
●
*
Operating Income (billions of yen) * Consolidated Vehicle Sales (thousands of vehicles) Excluding Valuation Gains/Losses from Interest Rate Swaps, etc.
Operating Income Margin
Operating Income including
Valuation Gains/Losses
from Interest Rate Swaps, etc.
(billions of yen)
FY2018 3Q Operating Income*
34.1 billion yen (+9.0 billion yen year on year)
Increased as a result of marketing
efforts.

FY2018 3Q : Increased mainly because of increased lending balance and decreased costs related to loan losses mainly in North America.
15
+32.4
+22.5
+39.9
+35.9 -29.9
72.6 76.6 +4.0
+6.0
42.6 82.6
-15.8
210.7 220.6 +9.8
+6.6
194.8 227.3
FY2018
3Q
FY2018
9 months
210.7 220.6
72.6 76.6
+4.0 +9.8
Change Change '16/10-12 '17/10-12 '16/4-12 '17/4-12
Financial Services Operating Income (billions of yen)
Operating Income
Valuation Gains/Losses
from Interest Rate Swaps, etc.
Operating Income Excluding
Valuation Gains/Losses from
Interest Rate Swaps, etc.

16
FY2018 Third Quarter
Financial Results
FY2018 Third Quarter Financial Performance
FY2018 Financial Forecasts

1,347
1,588
925
2,837
2,274Japan
N. America
Europe
Asia
Other
1,380 1,380
1,550 1,550
970 960
2,790 2,810
2,260 2,250
0
2,000
4,000
6,000
8,000
10,000
8,950 8,950 (±0)
(-10)
(+20)
(-10)
(±0)
(±0)
Change
8,971
10,300 10,250 +50 10,251
(’17/4-’18/3) (’17/4-’18/3) (’16/4-’17/3)
17
FY2018 Forecasts: Consolidated Vehicle Sales (thousands of vehicles)
Previous Forecasts New Forecasts FY2017 Results
Central and South America, Oceania, Africa, The Middle East, etc.
Total retail vehicle sales
in thousands
18
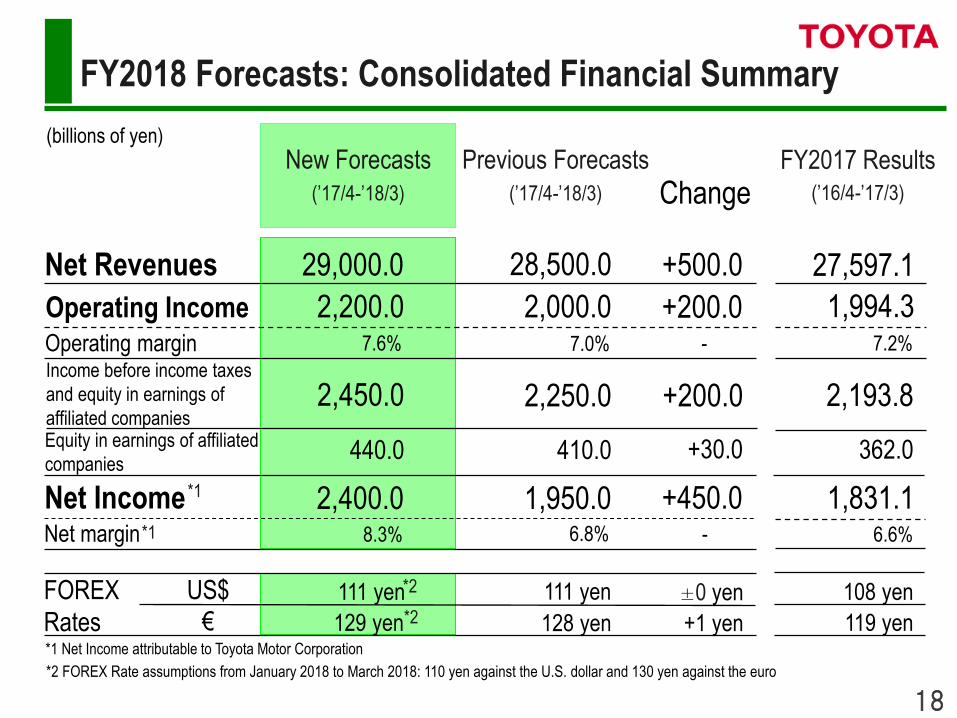
6.6%
±0 yen 111 yen
+1 yen 128 yen
6.8% 8.3%
+450.0 1,950.0 2,400.0
- 7.0% 7.6%
+200.0 2,250.0 2,450.0
+200.0 2,000.0 2,200.0
+500.0 28,500.0 29,000.0
Change
+30.0 410.0 440.0
(’16/4-’17/3)
FY2017 Results
108 yen
119 yen
1,831.1
7.2%
2,193.8
1,994.3
27,597.1
362.0
-
New Forecasts
(’17/4-’18/3)
111 yen
129 yen
FY2018 Forecasts: Consolidated Financial Summary
(billions of yen)
Net Revenues
Operating Income Operating margin
Equity in earnings of affiliated
companies
Net Income Net margin
FOREX
Rates
US$
€ *1 Net Income attributable to Toyota Motor Corporation
*2 FOREX Rate assumptions from January 2018 to March 2018: 110 yen against the U.S. dollar and 130 yen against the euro
Previous Forecasts
(’17/4-’18/3)
Income before income taxes
and equity in earnings of
affiliated companies
*1
*2
*2
*1

19
Analysis of FY2018 Forecasts: Consolidated Operating Income
(vs. Previous Forecasts)
(billions of yen)
+65.0
+20.0 +15.0 +95.0
+5.0
2,000.0
2,200.0
111 yen/ US$
128 yen/ €
111 yen/ US$
129 yen/ €
Previous Forecasts (’17/4-’18/3)
New Forecasts (’17/4-’18/3) Operating Income (+200.0)
Effects of
FOREX
Rates *1
Cost
Reduction
Efforts
Marketing
Efforts *2
Decrease in
Expenses,
etc. *3
Other *4
*1. Details ※
Transactional (Imports & Exports) +60.0 Volume, Model Mix +20.0 Labor Costs -10.0
US$ +45.0 Financial Services +20.0 Depreciation ±0
€ +5.0 Other ±0 Other -25.0 R&D Expenses ±0
Other +10.0 Expenses, etc. +105.0
※From FY2017 financial results, "Effects of FOREX Rates" includes translational FOREX impact concerning operating income of overseas subsidiaries and fiscal year-end balance of provisions in foreign currencies, etc.
*4. Details*3. Details
+5.0
*2. DetailsTranslational FOREX impact
concerning overseas
subsidiaries
Valuation Gains/Losses
from Swaps, etc.+5.0
(Translational FOREX impact of fiscal
year-end balance of provisions in foreign
currencies, etc.)
+130.0
Excluding the overall impact of foreign exchange
rates and swap valuation gains/losses, etc.

20
Analysis of FY2018 Forecasts: Consolidated Operating Income
(vs. FY2017 Results)
+240.0
+140.0 -195.0
±0.0 +20.7
1,994.3
Operating Income (+205.7)
2,200.0
+245.0 Improvement
Effects of
FOREX
Rates *1
Cost
Reduction
Efforts
Effects of
Marketing
Activities *2
Changes in
Expenses,
etc. *3
Other *4
Cost Reduction
Efforts Effects of
Marketing Activities
Increase in
Expenses, etc. Total
+90.0 -245.0 -145.0 -300.0
<Initial Forecasts>
(billions of yen)
FY2017 Results New Forecasts (’16/4-’17/3) (’17/4-’18/3) 108 yen/ US$
119 yen/ €
111 yen/ US$
129 yen/ €
*1. Details ※
Transactional (Imports & Exports) +215.0 Volume, Model Mix -40.0 Labor Costs -70.0
US$ +130.0 Financial Services +20.0 Depreciation -45.0
€ +60.0 Other ±0 Other -175.0 R&D Expenses -20.0
Other +25.0 Expenses, etc. +135.0
※From FY2017 financial results, "Effects of FOREX Rates" includes translational FOREX impact concerning operating income of overseas subsidiaries and fiscal year-end balance of provisions in foreign currencies, etc.
*4. Details*3. Details
+25.0
*2. DetailsTranslational FOREX impact
concerning overseas
subsidiaries
Valuation Gains/Losses
from Swaps, etc.+20.7
(Translational FOREX impact of fiscal
year-end balance of provisions in foreign
currencies, etc.)
-55.0
Excluding the overall impact of foreign exchange
rates and swap valuation gains/losses, etc.

Promote further enhancement of
product appeal and cost reduction
through overall cooperation with
suppliers.
Cultivate “Tough, professional manufacturing groups who can keep handling changes”.
21
Activities for Enhancement of Competitiveness
TNGA Accelerate Initiatives to realize
a Mobility Society in the Future
Electrification / Automated Driving / MaaS
- Collaboration with Panasonic.
- Challenges for popularization of electrified
vehicles.
- Automated research vehicle “Platform 3.0”.
- “e-Palette Concept”.
Manufacturing / Skill Transfer Explanation from
Mitsuru Kawai, EVP
*
* Mobility as a Service

Lexus LF-1 Limitless
(North American International
Auto Show 2018 exhibition car)
FY2018 Third Quarter
Financial Results
Toyota Motor Corporation February 6, 2018

23
29.827.1
76.970.1
252.0
160.6
0
500
1,000
1,500
2,000
2,500
3,000
3,500
4,000
9.710.3
23.015.6
91.0
63.5
0
500
1,000
1,500
’17/10-12 ’16/4-12 ’17/4-12 Change Change ’16/10-12
301 340 +39
FY2018
3Q
898 969 +71
FY2018
9 months
’16/7-9 ’17/7-9 ’16/1-9 ’17/1-9
358.8
89.6
123.8
258.0
(+7.3)
(-0.6)
(+100.8)
(+6.7)
(+27.4)
(+34.2)
(+91.4)
(+2.7)
(Reference)
Equity in Earnings of Affiliated Companies (billions of yen)
Retail Sales Results in China (thousands of vehicles)
150
Japan
China
Other
100
50
0
400
350
300
250
200
150
100
50
0

7,839.0
9,309.1
1,470.1
7,763.0 〔+33.6〕 +1,534.7
+694.2 -781.5
-911.8 -459.7
+75.9
24
(Reference)
Liquid Assets (Excluding Financial Services)
Net Liquid Assets as of December 31, 2017 : 7,839.0 billion yen (+75.9 billion yen compared to March 31, 2017)
(billions of yen)
Free Cash Flow (total) : +1,447.4
〔Compared to March 31, 2017〕
〔+109.6〕
Net
Liquid
Assets
Net
Liquid
Assets
As of March 31, 2017
(Actual)
As of December 31,
2017
As of December 31,
2017
*Total Liquid Assets consist primarily of cash and cash equivalents, time deposits, marketable securities and
security investments (excluding equity securities), excluding in each case those relating to financial services.
(Actual) (Actual)
Net Income
Depreciation
Expenses
CAPEX
Shareholder
Return Working
Capital, etc.
Interest-
Bearing
Debt
Total
Liquid
Assets*

1,000
1,037.51,055.6
910.5
1,004.5
1,060.0
1,280.0
1,177.4
1,000.7
1,292.5
1,211.8
R&D Expenses
885.1
775.9
806.2
950.0
FY2014 FY2015 FY2016 FY2017 FY2018 FY2014 FY2015 FY2016 FY2017 FY2018
800
900
700
0
●
1,100
1,200
1,300
893.2
25
(Reference) FY2018 Consolidated Forecasts: R&D, CAPEX, Depreciation
(billions of yen)
Capital Expenditures
Depreciation Expenses
Forecast Forecast
Change from Previous Forecasts: R&D Expenses ±0 billion yen Capital Expenditures ±0 billion yen Depreciation Expenses ±0 billion yen

26
5,770
10,300
1,800
9,300
7,720
1,580
8,950
3,180
Previous Forecasts (’17/4-’18/3)
+50 10,250 Total Retail Vehicle Sales (Including Daihatsu- & Hino- brand)
+50 1,850 Exports
+50 9,350 Total
+50 7,770 Overseas
±0 1,580 Japan
±0 8,950 Total
-20 5,750 Overseas
+20 3,200 Japan T
o
y
o
t
a
&
L
e
x
u
s
Change New Forecasts
(’17/4-’18/3)
(Reference)
FY2018 Forecasts: Vehicle Production and Retail Sales
(thousands of vehicles)
Vehicle
Production
Retail
Vehicle Sales
*
* 2
1
2 *
*1 Including vehicle production by Toyota’s affiliates outside consolidation
*2 Including vehicle sales by Toyota’s affiliates outside consolidation
27
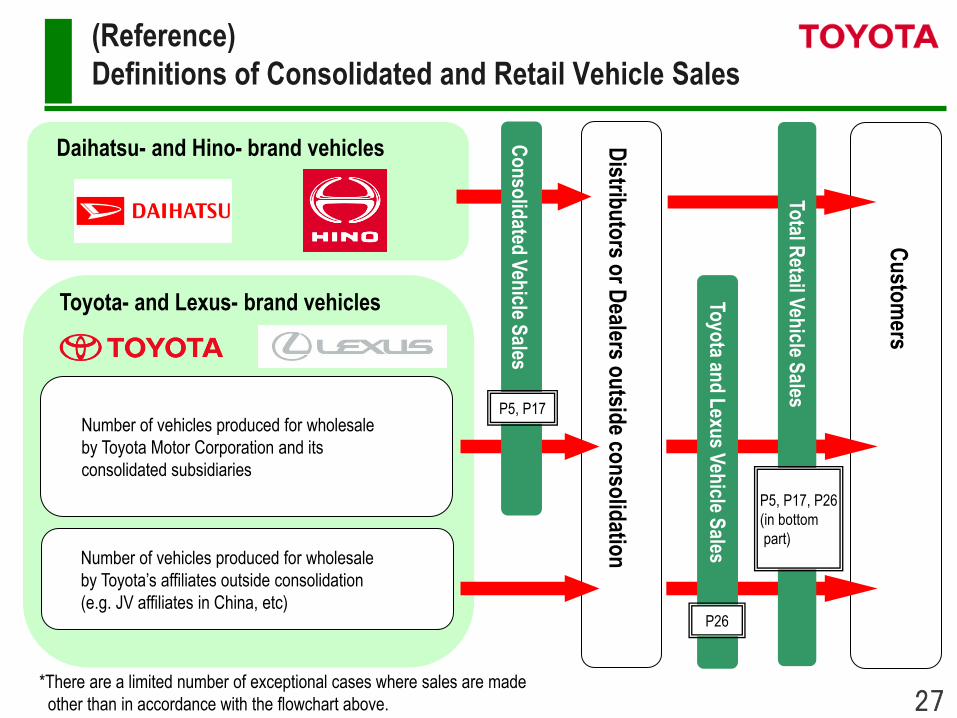
(Reference)
Definitions of Consolidated and Retail Vehicle Sales
Daihatsu- and Hino- brand vehicles
Toyota- and Lexus- brand vehicles
Number of vehicles produced for wholesale
by Toyota Motor Corporation and its
consolidated subsidiaries
Number of vehicles produced for wholesale
by Toyota’s affiliates outside consolidation
(e.g. JV affiliates in China, etc)
Distrib
uto
rs or D
ealers ou
tside co
nso
lidatio
n
Cu
stom
ers
Total R
etail Veh
icle Sales
Toyo
ta and
Lexu
s Veh
icle Sales
*There are a limited number of exceptional cases where sales are made
other than in accordance with the flowchart above.
P26
P5, P17, P26
(in bottom
part)
P5, P17
Co
nso
lidated
Veh
icle Sales