fy2019 earnings release - inktankir
TRANSCRIPT
1 | Cleopatra Hospitals Group FY2019 EARNINGS RELEASE
Cleopatra Hospitals Group S.A.E. FY2019 EARNINGS RELEASE
Cairo, Egypt | 12 March 2020
Cleopatra Hospitals Group Reports FY2019 Results
CHG closes the year reporting strong top-line growth and solid profitability on both a full-year and quarterly
basis, with fourth quarter margins in line with CHG’s all-time highs; the Group enters 2020 ideally positioned
to continue delivering growth at an organic level while executing on its expansion strategy
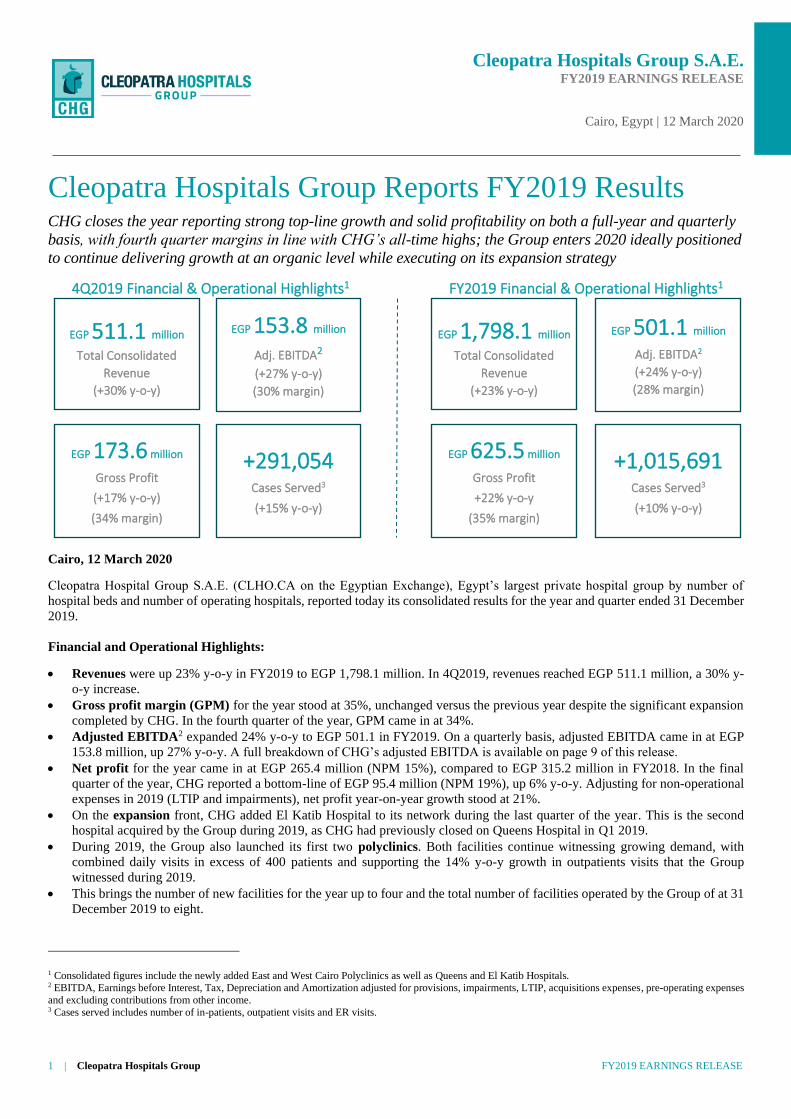
4Q2019 Financial & Operational Highlights1 FY2019 Financial & Operational Highlights1
Cairo, 12 March 2020
Cleopatra Hospital Group S.A.E. (CLHO.CA on the Egyptian Exchange), Egypt’s largest private hospital group by number of
hospital beds and number of operating hospitals, reported today its consolidated results for the year and quarter ended 31 December
2019.
Financial and Operational Highlights:
• Revenues were up 23% y-o-y in FY2019 to EGP 1,798.1 million. In 4Q2019, revenues reached EGP 511.1 million, a 30% y-
o-y increase.
• Gross profit margin (GPM) for the year stood at 35%, unchanged versus the previous year despite the significant expansion
completed by CHG. In the fourth quarter of the year, GPM came in at 34%.
• Adjusted EBITDA2 expanded 24% y-o-y to EGP 501.1 in FY2019. On a quarterly basis, adjusted EBITDA came in at EGP
153.8 million, up 27% y-o-y. A full breakdown of CHG’s adjusted EBITDA is available on page 9 of this release.
• Net profit for the year came in at EGP 265.4 million (NPM 15%), compared to EGP 315.2 million in FY2018. In the final
quarter of the year, CHG reported a bottom-line of EGP 95.4 million (NPM 19%), up 6% y-o-y. Adjusting for non-operational
expenses in 2019 (LTIP and impairments), net profit year-on-year growth stood at 21%.
• On the expansion front, CHG added El Katib Hospital to its network during the last quarter of the year. This is the second
hospital acquired by the Group during 2019, as CHG had previously closed on Queens Hospital in Q1 2019.
• During 2019, the Group also launched its first two polyclinics. Both facilities continue witnessing growing demand, with
combined daily visits in excess of 400 patients and supporting the 14% y-o-y growth in outpatients visits that the Group
witnessed during 2019.
• This brings the number of new facilities for the year up to four and the total number of facilities operated by the Group of at 31
December 2019 to eight.
1 Consolidated figures include the newly added East and West Cairo Polyclinics as well as Queens and El Katib Hospitals. 2 EBITDA, Earnings before Interest, Tax, Depreciation and Amortization adjusted for provisions, impairments, LTIP, acquisitions expenses, pre-operating expenses
and excluding contributions from other income. 3 Cases served includes number of in-patients, outpatient visits and ER visits.
EGP 511.1 million
Total Consolidated
Revenue
(+30% y-o-y)
EGP 153.8 million
Adj. EBITDA2
(+27% y-o-y)
(30% margin)
EGP 173.6 million
Gross Profit
(+17% y-o-y)
(34% margin)
+291,054 Cases Served3
(+15% y-o-y)
EGP 1,798.1 million
Total Consolidated
Revenue
(+23% y-o-y)
EGP 501.1 million
Adj. EBITDA2
(+24% y-o-y)
(28% margin)
EGP 625.5 million
Gross Profit
+22% y-o-y
(35% margin)
+1,015,691 Cases Served3
(+10% y-o-y)
2 | Cleopatra Hospitals Group FY2019 EARNINGS RELEASE
Cleopatra Hospitals Group S.A.E. FY2019 EARNINGS RELEASE
Cairo, Egypt | 12 March 2020
Commenting on Cleopatra Hospitals Group’s performance for FY2019, Chief Executive Officer Ahmed Ezzeldin said:
“With 2019 having come to a close, I am delighted to report that Cleopatra Hospitals Group delivered, once again, excellent operational and financial results for the year, as we broadened our geographic reach and service offering while continuing to drive enhancements in the quality of care the Group delivers to its growing pool of patients. 2019 was a year of expansion, internal restructuring and integration for the Group. In the last twelve months, we added four new facilities to our network acquiring Queens and El Katib Hospitals and rolling out our East and West Cairo Polyclinics. In parallel, we also worked to increase capacity at our existing hospitals through a Group-wide renovation plan and a series of expansions at Al Shorouk and Nile Badrawi Hospitals. On the operational front we worked to enhance our claims collection process instituting a new revenue cycle management framework, introduced several new business entities to better oversee various aspects of our day-to-day operations, and continued to drive digitalization across the Group’s network of facilities. During the past year, we continued to place great emphasis on the professional development and careering advancement of our staff as we look to continue attracting and retaining the best professionals the industry has to offer. We enter 2020 with renewed confidence that the solid fundamentals that underpin the Egyptian economy and the foundations we laid over the course of the past twelve months, have us placed in an ideal position to continue generating sustainable value for all stakeholders. In the coming year we expect to begin seeing strong contributions to our top- and bottom-line coming from the new assets added to our network during 2019. In parallel, we will continue to pursue strategic growth opportunities in line with our six-pillar expansion strategy. I am particularly excited for the roll out of the first phase of our Bani Suef hospital, the Group’s first facility outside Greater Cairo, which we expect to complete during the last quarter of 2020. Going into 2020 we expect to see strong revenue and net income growth as our efforts to enhance the quality of the Group’s claim collection and revenue cycle management continue to bear the desire results. At this time, with the end of 1Q2020 fast approaching, we have good visibility on financial and operational results for the period and expect top-line growth ahead of last year’s first quarter figure with expanding margins maintaining the momentum gained in the fourth quarter of the year just ended. With this trend expected to continue throughout the year, and with the impact of higher LTIP expenses and impairments behind us, we expect to return to see the full reflection of the Group’s EBITDA and earnings growth on our bottom-line profitability in 2020. With regards to the recent Coronavirus outbreak, I would like to take this opportunity to reassure you that we are closely monitoring the situation and keeping a close eye across our operations. At this time, the number of registered cases in Egypt remains limited and fully under the control of the relevant authorities, with businesses continuing to operate normally. CHG’s management is confident that the Egyptian government and the Group are well-equipped to handle developments as the situation evolves. We are regularly updating our staff on the progression of the outbreak and providing them with necessary training and precautions to ensure of the safety of our workforce and our patients and to safeguard our operations. CHG will provide all stakeholders with any and all updates through official corporate channels.”
—Ends—
Performance Drivers and Discussion
• Top-line growth in both periods came on the back of continued favourable pricing, an improved case mix across the Group’s
hospitals, and growing patient volumes.
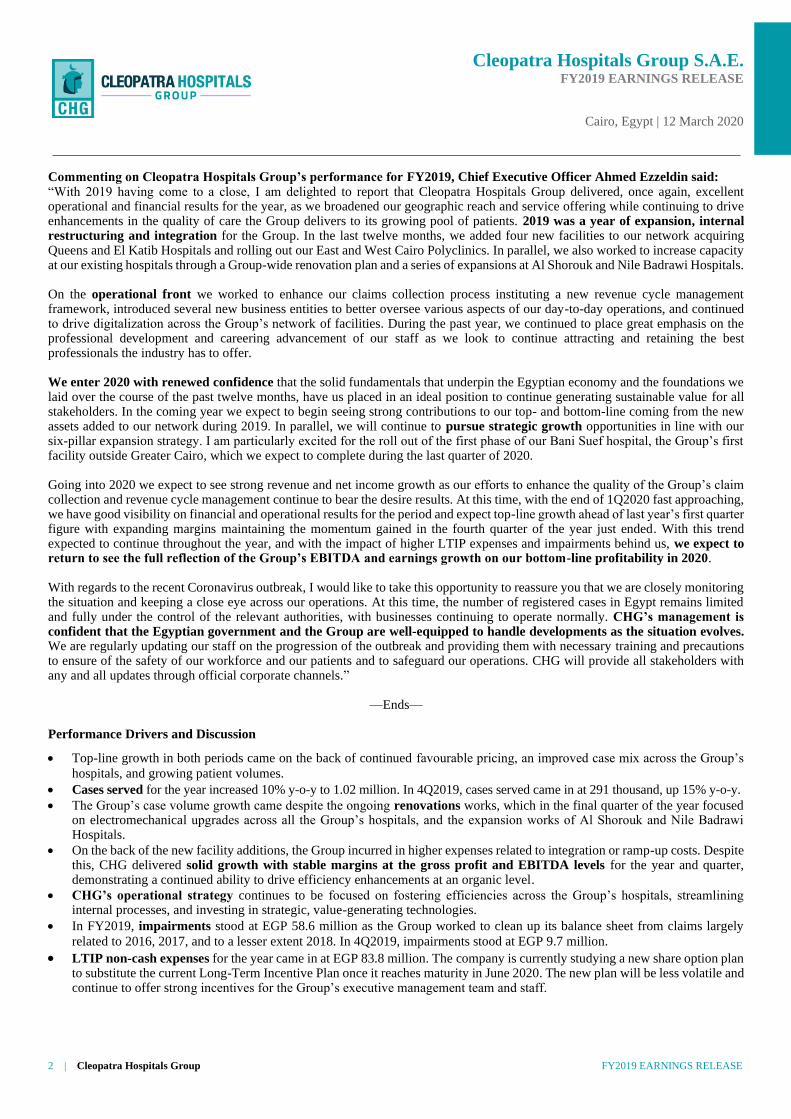
• Cases served for the year increased 10% y-o-y to 1.02 million. In 4Q2019, cases served came in at 291 thousand, up 15% y-o-y.
• The Group’s case volume growth came despite the ongoing renovations works, which in the final quarter of the year focused on electromechanical upgrades across all the Group’s hospitals, and the expansion works of Al Shorouk and Nile Badrawi Hospitals.
• On the back of the new facility additions, the Group incurred in higher expenses related to integration or ramp-up costs. Despite this, CHG delivered solid growth with stable margins at the gross profit and EBITDA levels for the year and quarter, demonstrating a continued ability to drive efficiency enhancements at an organic level.
• CHG’s operational strategy continues to be focused on fostering efficiencies across the Group’s hospitals, streamlining internal processes, and investing in strategic, value-generating technologies.
• In FY2019, impairments stood at EGP 58.6 million as the Group worked to clean up its balance sheet from claims largely
related to 2016, 2017, and to a lesser extent 2018. In 4Q2019, impairments stood at EGP 9.7 million.
• LTIP non-cash expenses for the year came in at EGP 83.8 million. The company is currently studying a new share option plan to substitute the current Long-Term Incentive Plan once it reaches maturity in June 2020. The new plan will be less volatile and continue to offer strong incentives for the Group’s executive management team and staff.
3 | Cleopatra Hospitals Group FY2019 EARNINGS RELEASE
Cleopatra Hospitals Group S.A.E. FY2019 EARNINGS RELEASE
Cairo, Egypt | 12 March 2020
Expansion Strategy Expansion Strategy In addition to better utilising existing capacities, the Group has been actively working toward expanding the number of hospitals it operates and its geographic reach, ultimately ensuring it delivers the high-quality care it has become known for. To maximise the effectiveness of the Group’s expansion, back in 2018 management introduced a six-pillar expansion strategy which guided management’s decisions throughout the course of 2019 and will continue to provide guidance heading into the new year. The Group’s expansion strategy focuses on: I. Creating a feeder network through the launch of polyclinics across the Greater Cairo
area. II. Building additional capacity at existing facilities. To this end, the Al Shorouk
Hospital extension is expected to come online in 2Q2020, with the extension to Nile Badrawi Hospital expected to launch in the coming period as well. The Group also continues pushing forward with the Group-wide renovation project. In 2019, work focused on enhancing the Electromechanical systems across all CHG facilities. Management expects to complete all renovation works by end of 2020.
III. Strategically acquiring operating hospitals characterised by strong brand names and convenient locations, allowing them to immediately drive value for CHG
IV. Targeting brownfield expansions in and outside the Greater Cairo area. V. Exploring new verticals to ensure the Group continues to grow and create long-term
value for all its stakeholders. This involves expanding past its current multi- specialty service network model to include a more diverse offering, venturing into healthcare facility management, long-term patient care, and home care. CHG is also targeting a further operational expansion of its pharmacy business in the coming year.
VI. Creating new business operation entities to oversee specific areas of the Group’s
day-to-day operations as the Group looks to leverage synergies and expand its
service offering.
New Facilities Updates El Katib The Group officially took over operations at El Katib Hospital on November 6th having completed the business transfer agreement (BTA) with the hospital’s operating company. The 89-bed facility located in the Dokki neighborhood of Greater Cairo, recorded a very strong start to operations and immediately began contributing to the Group’s consolidated results in the fourth quarter of the year. Having recently undergone a series of significant upgrades to its facilities and equipment, the hospital is expected to continue contributing strongly in the coming year. Heading into 2020, the Group aims to build on the existing infrastructure, adding further state-of-the-art equipment, as it seeks to develop the hospital’s capabilities and transform it into the Group’s urology centre of excellence. Management is confident that the integration of El Katib into the wider Group’s operating framework will conclude smoothly and in a short timeframe with the new management team working to execute the facility’s 100-day integration plan. Queens Hospital Queens Hospital continued to operate at reduced capacity as the Group works to complete the facility’s upgrade works. Management expects the hospital to begin operating at full capacity by the end of the first six months of 2020 once the renovation plan is completed. Since having taken over operations in the first quarter of 2019, the Group has worked to enhance the hospital’s OBGYN services and expand its service offering to include orthopaedics and general surgery, both of which are specialties characterised by high patient demand. As part of the renovation plan, CHG will be adding a new ICU unit and a diagnostics centre, expand the hospital’s ER facilities, upgrade of its operating theatres, and revamp Queens Hospital’s inpatient ward.
34
,650
39
,627
FY2018 FY2019
# of Surgeries(Rev/surgery)
61
9,91
4
70
8,15
2
FY2018 FY2019
# of OP Clinic Visits(Rev/visit)
47
,826
54
,778
FY2018 FY2019
# of Inpatients(Rev/stay)
25
7,16
4
25
2,76
1
FY2018 FY2019
# of ER Visits(Rev/visit)
EGP 9,502
EGP 322
EGP 322
EGP 7,431
EGP 7,575
EGP 289 EGP 256
EGP 8,255
4 | Cleopatra Hospitals Group FY2019 EARNINGS RELEASE
Cleopatra Hospitals Group S.A.E. FY2019 EARNINGS RELEASE
Cairo, Egypt | 12 March 2020
Polyclinics CHG East Cairo Polyclinic continued to outperform the Group’s expectations, averaging close to 300 visit per day, in line with volumes recorded by a typical hospital’s outpatient clinic department. At the Group’s West Cairo Polyclinic management is also witnessing strong growth in demand with volumes continuing to expand in the second half of 2019. The launch of the East and West Cairo Polyclinics is part of the Group’s feeder network strategy which aims to grow CHG’s geographic reach across Greater Cairo while driving up volumes at the Group’s main hospitals through the referral of patients. Polyclinics are relatively underdeveloped in Egypt, but they represent a low-CAPEX expansion avenue. The facilities are located strategically across high-catchment and currently underserved areas of Cairo, allowing it to not only extend its geographical reach, but to fill a supply gap for segments of the population who currently have limited healthcare access. Bani Suef During the final quarter of the year, CHG kicked off civil works at its new 198-bed hospital. The Group is looking to complete the first phase of the hospital before the end of 2020, which will see between 70 and 90 beds come online. The Beni Suef hospital is CHG’s first medical facility outside Greater Cairo and is a move to expand the Group’s reach to more secluded regions of the country. The facility will also house a teaching section dedicated to Nahda University’s faculty of medicine. The total estimated cost for the refurbishment and development of the facility is estimated at EGP 360 million. Operational Review During the last twelve months, CHG’s management worked to improve the Group’s claim collection process, roll out a Group-wide HIS/Enterprise Resource Planning (ERP) system, and introduced multiple new internal functions to improve on various aspects of the Group’s day-to-day operations. Internal Management Systems Restructuring
Throughout 2019, CHG focused heavily on restructuring its internal management
framework to promptly integrate the newly acquired assets within its operating framework,
leverage existing synergies, and expand its service offering. 2019 initiatives included:
• The hiring of multiple new, highly-experience managing directors to oversee day-to-
day operations across its newly acquired facilities.
• The launch of the Group’s new Medical Council. The new body will be under the
direct supervision and guidance of the Board’s quality committee and will be
composed of renowned specialized consultants from across the Group’s hospitals.
• The launch of the new Doctor Sales Function. The team will be targeting consultant
sales and work to attract the highest quality and experienced talent in the country. The
new sales function has been focusing heavily on enhancing referrals at the Group’s
cardiovascular, orthopedic, and general surgery specialties.
• The introduction of an enhanced employee training and development program to
provide tailored, career-enhancing training to all staff.
• The launch of a new succession planning scheme to develop the Group’s future class
of managers. Information Technology
The Group continued to make progress on the rollout of its Group-wide HIS/Enterprise
Resource Planning (ERP) system. As of year-end 2019. the system is operational at both
the East and West Cairo Polyclinics as well as at Cairo Specialised Hospital. Currently, the
Group is rolling out the new system at Cleopatra Hospital before moving on to Queens
Hospital. Management expects the full migration by end of 2020. The Group is also in the
pre-launch phase for its new CHG app. The new app will allow patients to book
4,0
50
4,5
14
FY2018 FY2019
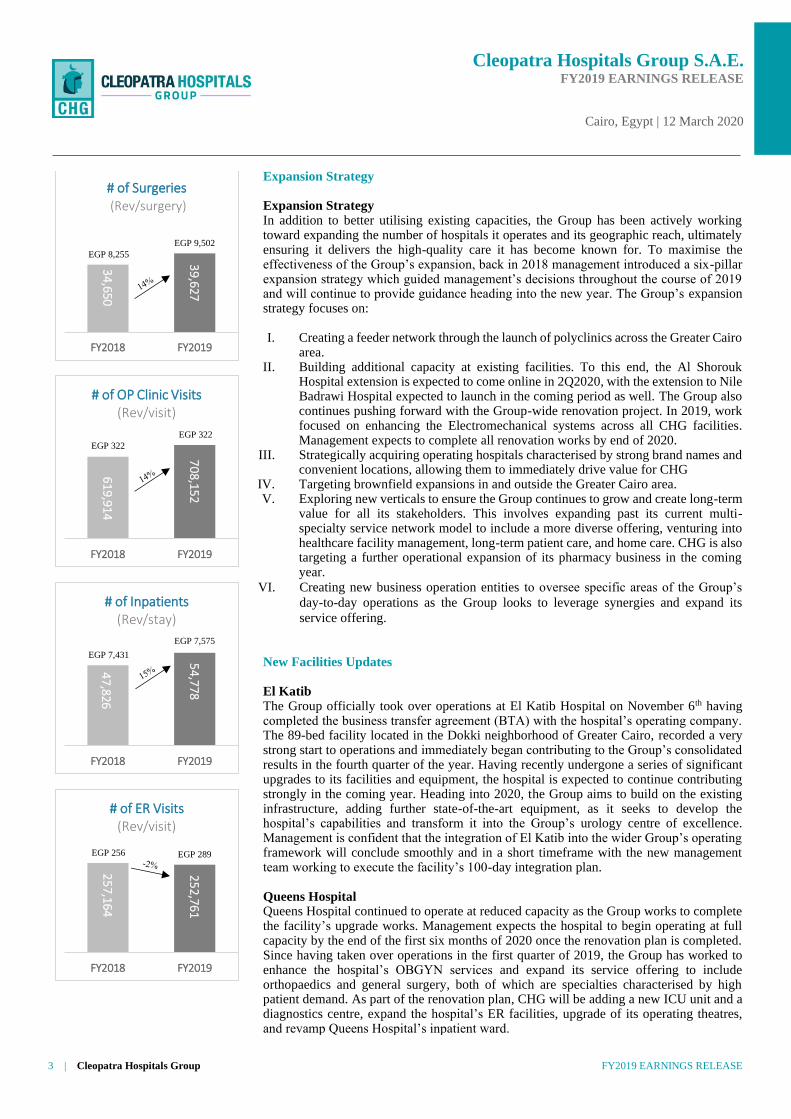
# of Catheterizations(Rev/catheterization)
EGP 33,051EGP 29,526
Historical figures have been adjusted to
account for standardization of KPI reporting
across all facilities.
All KPI figures for FY2019 refer to all six of
CHG hospitals as well as the Group’s East
and West Cairo Polyclinics (contributing to
group’s outpatient visits volumes)
5 | Cleopatra Hospitals Group FY2019 EARNINGS RELEASE
Cleopatra Hospitals Group S.A.E. FY2019 EARNINGS RELEASE
Cairo, Egypt | 12 March 2020
appointments, review diagnostics, and follow up on their medical cases from anywhere in
the world through their smartphones.
Commercial and Business Development During the course of the year, CHG has worked to revamp its claim collection process introducing a new fully organised revenue cycle management framework. This has in turn supported the normalization of the Group’s receivables impairments throughout the last four quarters. In 4Q2019, impairments came in at EGP 9.7 million, bringing the total for the second half of the year to EGP 17.4 million versus a total of EGP 41.2 million booked in the first two quarters. As part of the new revenue cycle management framework, CHG has established a new dedicated team to oversee the claim collection and post-submission credit control processes. The Group has also introduced several internal KPIs related to revenue cycle management to ensure that the new framework helps continue to achieve the desired improvements. CSR and Social Impact Partnership
Partnership with MOH - Skills Enhancement Program
The Skill Enhancement Programme (SEP), designed by CHG in partnership with the
Ministry of Health as part of the wider Health Insurance Program implemented by the
Egyptian Government, was first launched in Port Said Governate in June of this year. As
part of the SEP, CHG provides the staff in public hospitals a learning opportunity to
enhance their technical and managerial skills, ultimately aiming to improve the service
quality provided. Throughout the year, CHG completed the first phase of the program and
made significant progress on the second phase. As part of the program’s second phase,
CHG is delivering medical and administrative training courses to medical and non-medical
staff at three hospitals in Port Said (El Nasr Specialized Hospital, El Tadamon Hospital
and El Nesa Hospital). As at year-end 2019, the Group had trained over 600 staff members
on fundamental medical and non-medical functions. The next phases of the SEP will see
the Group begin to help monitor operations at the three hospitals by transferring its
knowledge and best practices, and implement the tailored administrative systems and
protocols which have enabled CHG to become a market leader in the healthcare sector.
6 | Cleopatra Hospitals Group FY2019 EARNINGS RELEASE
Cleopatra Hospitals Group S.A.E. FY2019 EARNINGS RELEASE
Cairo, Egypt | 12 March 2020
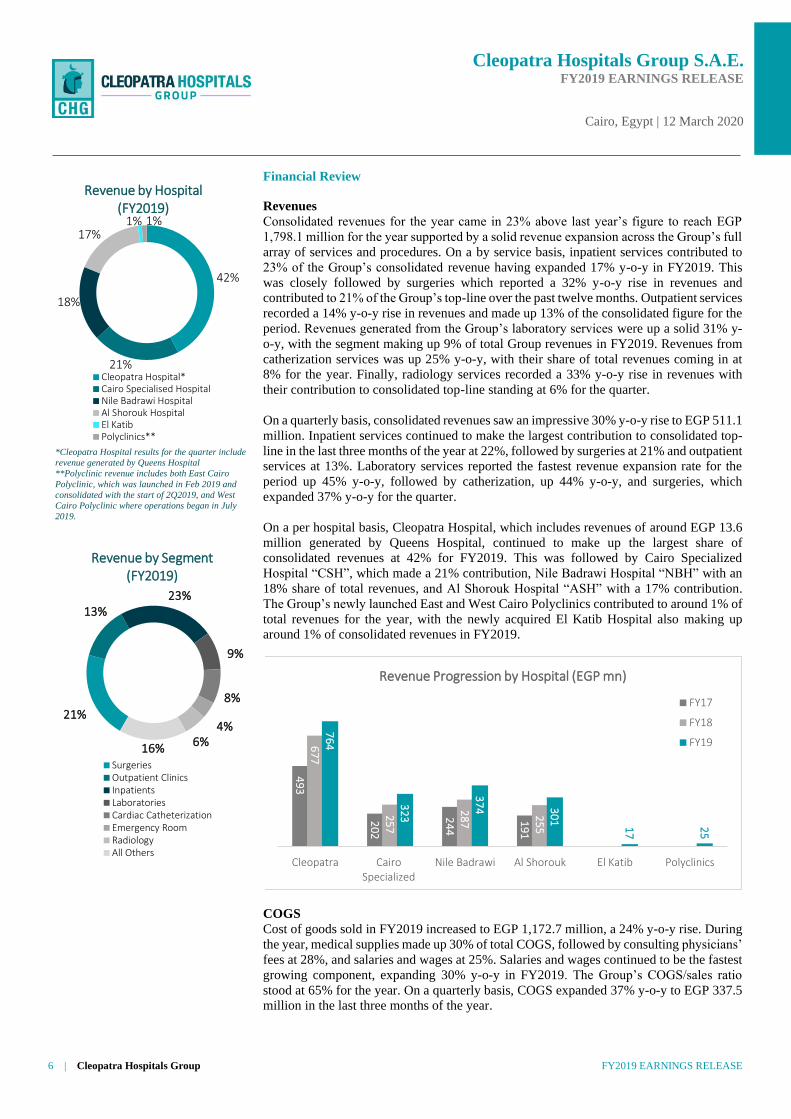
*Cleopatra Hospital results for the quarter include
revenue generated by Queens Hospital
**Polyclinic revenue includes both East Cairo
Polyclinic, which was launched in Feb 2019 and
consolidated with the start of 2Q2019, and West
Cairo Polyclinic where operations began in July
2019.
Financial Review
Revenues
Consolidated revenues for the year came in 23% above last year’s figure to reach EGP
1,798.1 million for the year supported by a solid revenue expansion across the Group’s full
array of services and procedures. On a by service basis, inpatient services contributed to
23% of the Group’s consolidated revenue having expanded 17% y-o-y in FY2019. This
was closely followed by surgeries which reported a 32% y-o-y rise in revenues and
contributed to 21% of the Group’s top-line over the past twelve months. Outpatient services
recorded a 14% y-o-y rise in revenues and made up 13% of the consolidated figure for the
period. Revenues generated from the Group’s laboratory services were up a solid 31% y-
o-y, with the segment making up 9% of total Group revenues in FY2019. Revenues from
catherization services was up 25% y-o-y, with their share of total revenues coming in at
8% for the year. Finally, radiology services recorded a 33% y-o-y rise in revenues with
their contribution to consolidated top-line standing at 6% for the quarter.
On a quarterly basis, consolidated revenues saw an impressive 30% y-o-y rise to EGP 511.1
million. Inpatient services continued to make the largest contribution to consolidated top-
line in the last three months of the year at 22%, followed by surgeries at 21% and outpatient
services at 13%. Laboratory services reported the fastest revenue expansion rate for the
period up 45% y-o-y, followed by catherization, up 44% y-o-y, and surgeries, which
expanded 37% y-o-y for the quarter.
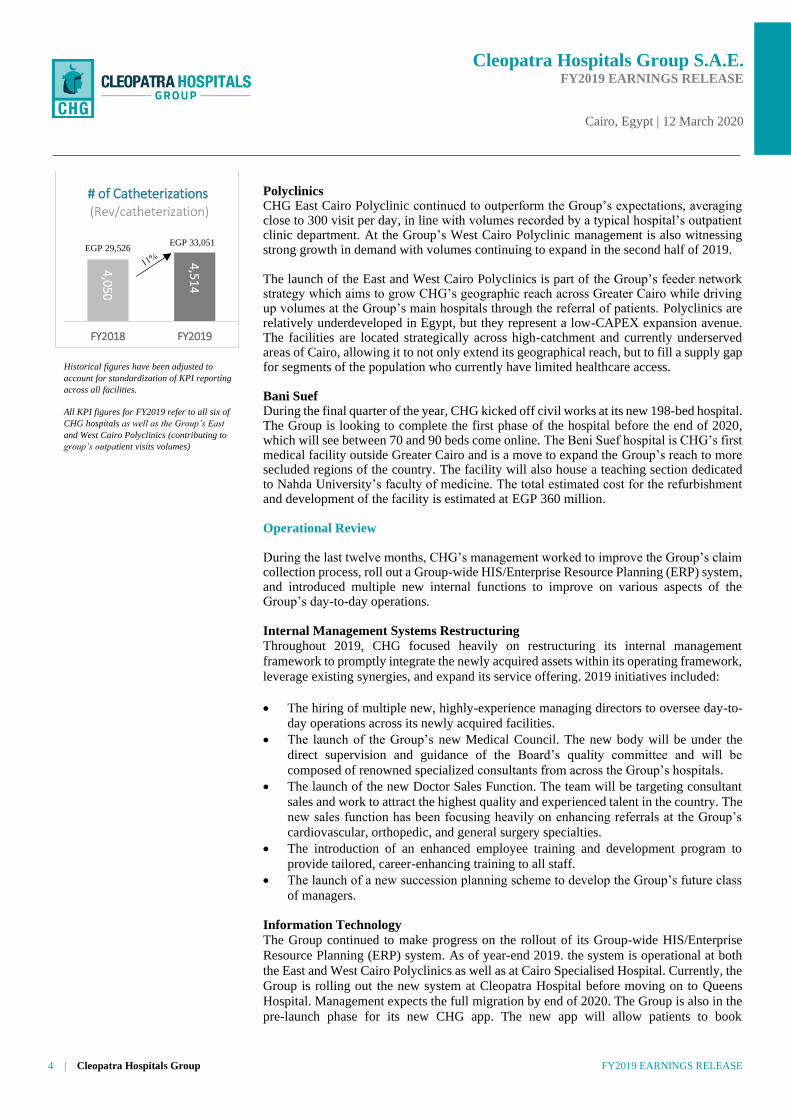
On a per hospital basis, Cleopatra Hospital, which includes revenues of around EGP 13.6
million generated by Queens Hospital, continued to make up the largest share of
consolidated revenues at 42% for FY2019. This was followed by Cairo Specialized
Hospital “CSH”, which made a 21% contribution, Nile Badrawi Hospital “NBH” with an
18% share of total revenues, and Al Shorouk Hospital “ASH” with a 17% contribution.
The Group’s newly launched East and West Cairo Polyclinics contributed to around 1% of
total revenues for the year, with the newly acquired El Katib Hospital also making up
around 1% of consolidated revenues in FY2019.
COGS
Cost of goods sold in FY2019 increased to EGP 1,172.7 million, a 24% y-o-y rise. During
the year, medical supplies made up 30% of total COGS, followed by consulting physicians’
fees at 28%, and salaries and wages at 25%. Salaries and wages continued to be the fastest
growing component, expanding 30% y-o-y in FY2019. The Group’s COGS/sales ratio
stood at 65% for the year. On a quarterly basis, COGS expanded 37% y-o-y to EGP 337.5
million in the last three months of the year.
49
3
20
2
24
4
19
1
67
7
25
7
28
7
25
5
76
4
32
3
37
4
30
1 1
7
25
Cleopatra CairoSpecialized
Nile Badrawi Al Shorouk El Katib Polyclinics
Revenue Progression by Hospital (EGP mn)
FY17
FY18
FY19
42%
21%
18%
17%1% 1%
Revenue by Hospital (FY2019)
Cleopatra Hospital*Cairo Specialised HospitalNile Badrawi HospitalAl Shorouk HospitalEl KatibPolyclinics**
21%
13%23%
9%
8%
4%6%16%
Revenue by Segment (FY2019)
SurgeriesOutpatient ClinicsInpatientsLaboratoriesCardiac CatheterizationEmergency RoomRadiologyAll Others
7 | Cleopatra Hospitals Group FY2019 EARNINGS RELEASE
Cleopatra Hospitals Group S.A.E. FY2019 EARNINGS RELEASE
Cairo, Egypt | 12 March 2020
Gross Profit
CHG reported a gross profit of EGP 625.5 million in FY2019, a 22% y-o-y increase. GPM
for the year stood at 35% unchanged from last year’s margin. Cleopatra Hospital, which
continues to include Queens Hospital’s results, reported a 13% y-o-y rise in gross profit
and made up half of total gross profit for the period. Cairo Specialised Hospital reported
the fastest gross profit growth rate for the year expanding 47% y-o-y and making up 20%
of CHG’s consolidated gross profit. Nile Badrawi Hospital reported a 21% y-o-y rise in
gross profits, making up 17% of the Group’s gross profits, followed by Al Shorouk
Hospital which saw a 27% y-o-y rise in gross profit, making a 14% contribution to
consolidated gross profit for the year.
In the last quarter of the year, the Group’s gross profit expanded 17% y-o-y to EGP 173.6,
with an associated margin of 34%. On a per hospital basis, Cairo Specialised Hospital
continued to report the fastest year-on-year growth rate at 39%, with Cleopatra Hospital
(which includes results from Queens Hospital) continuing to make up the lion share of total
gross profit at 48% for 4Q2019.
G&A Expenses
General and administrative (G&A) expenses consist of the company’s non-medical staff
costs, including those of senior management and Group-level professional consulting fees.
G&A expenses also include the Group’s Long-Term Incentive Program (LTIP), a non-cash
charge linked to share price appreciation and EBITDA growth. The LTIP has a four-year
maturity period maturing by 30 June 2020, after which amounts will be disbursed. Outlays
for G&A purposes increased 85% y-o-y in FY2019 to EGP 338.0 million, and 41% y-o-y
to EGP 64.6 million on a quarterly basis.
The year-on-year increase on both a full-year and quarterly basis, came on the back of an
increase in the accrued non-cash LTIP expense and a rise in impairments for the periods.
In FY2019, LTIP expenses came in at EGP 83.8 million compared to EGP 20.4 million in
FY2018. In the last three months of the year, LTIP expenses recorded EGP 11.2 million
compared to EGP 3.6 million in the same quarter of 2018. The Group booked EGP 58.6
million in impairments during FY2019 compared to EGP 1.7 million in FY2018. The rise
in impairments for the year was related to claims from 2016, 2017, and to a lesser extent
2018. However, during the last three months of the year, impairments continued on their
path towards normalization coming in at EGP 9.7 million. This brings the total impairments
booked in 2H2019 to EGP 17.4 million, significantly down from the EGP 41.2 million
booked in the first half of the year. The decrease was supported by the Group’s efforts to
establish a more structured revenue cycle management and enhance the quality of its claims
collection procedure.
EBITDA
CHG’s EBITDA, factoring out acquisition expenses, impairments, the LTIP’s non-cash
charge, pre-operating expenses and contributions from other income, increased 24% y-o-y
in FY2019 surpassing the half-a-million mark to reach EGP 501.1 million. EBITDA
margin for the year stood unchanged at 28%. On a quarterly basis, EBITDA increased to
EGP 153.8 million, up 27% y-o-y with an associated margin of 30%.
Excluding the negative impact on EBITDA of the Group’s East and West Cairo polyclinics
launched in 2019 and Queens Hospital, currently undergoing refurbishment works,
EBITDA would have expanded 32% y-o-y in FY2019, with a margin of 30%.
8 | Cleopatra Hospitals Group FY2019 EARNINGS RELEASE
Cleopatra Hospitals Group S.A.E. FY2019 EARNINGS RELEASE
Cairo, Egypt | 12 March 2020
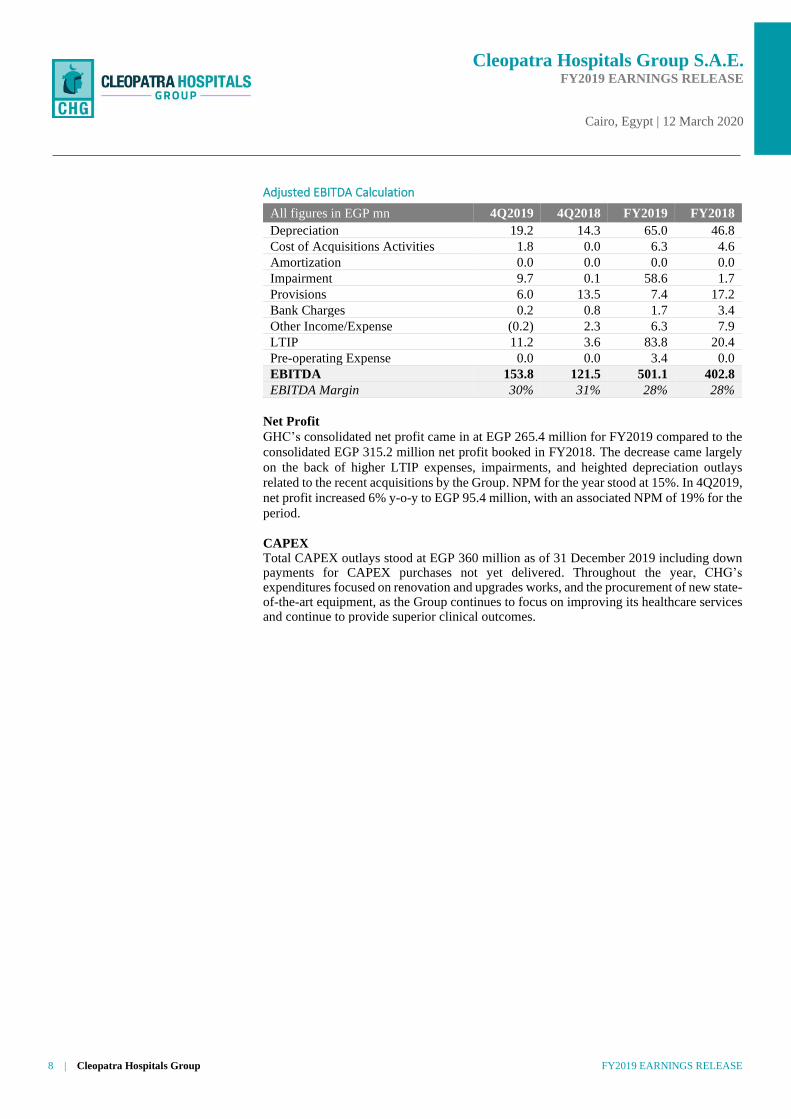
Adjusted EBITDA Calculation
All figures in EGP mn 4Q2019 4Q2018 FY2019 FY2018
Depreciation 19.2 14.3 65.0 46.8
Cost of Acquisitions Activities 1.8 0.0 6.3 4.6
Amortization 0.0 0.0 0.0 0.0
Impairment 9.7 0.1 58.6 1.7
Provisions 6.0 13.5 7.4 17.2
Bank Charges 0.2 0.8 1.7 3.4
Other Income/Expense (0.2) 2.3 6.3 7.9
LTIP 11.2 3.6 83.8 20.4
Pre-operating Expense 0.0 0.0 3.4 0.0
EBITDA 153.8 121.5 501.1 402.8
EBITDA Margin 30% 31% 28% 28%
Net Profit
GHC’s consolidated net profit came in at EGP 265.4 million for FY2019 compared to the
consolidated EGP 315.2 million net profit booked in FY2018. The decrease came largely
on the back of higher LTIP expenses, impairments, and heighted depreciation outlays
related to the recent acquisitions by the Group. NPM for the year stood at 15%. In 4Q2019,
net profit increased 6% y-o-y to EGP 95.4 million, with an associated NPM of 19% for the
period.
CAPEX Total CAPEX outlays stood at EGP 360 million as of 31 December 2019 including down payments for CAPEX purchases not yet delivered. Throughout the year, CHG’s expenditures focused on renovation and upgrades works, and the procurement of new state-of-the-art equipment, as the Group continues to focus on improving its healthcare services and continue to provide superior clinical outcomes.
9 | Cleopatra Hospitals Group FY2019 EARNINGS RELEASE
Cleopatra Hospitals Group S.A.E. FY2019 EARNINGS RELEASE
Cairo, Egypt | 12 March 2020
ABOUT CLEOPATRA HOSPITALS GROUP S.A.E.
The Group is the largest private hospital group in Egypt by number of hospital beds and number of operating hospitals. The company
holds majority stakes and operates six leading hospitals in the Greater Cairo Area: Cleopatra Hospital, Cairo Specialized Hospital,
Nile Badrawi Hospital, Al Shorouk Hospital, Queens Hospital, and El Katib Hospital offering a full array of general and emergency
healthcare services.
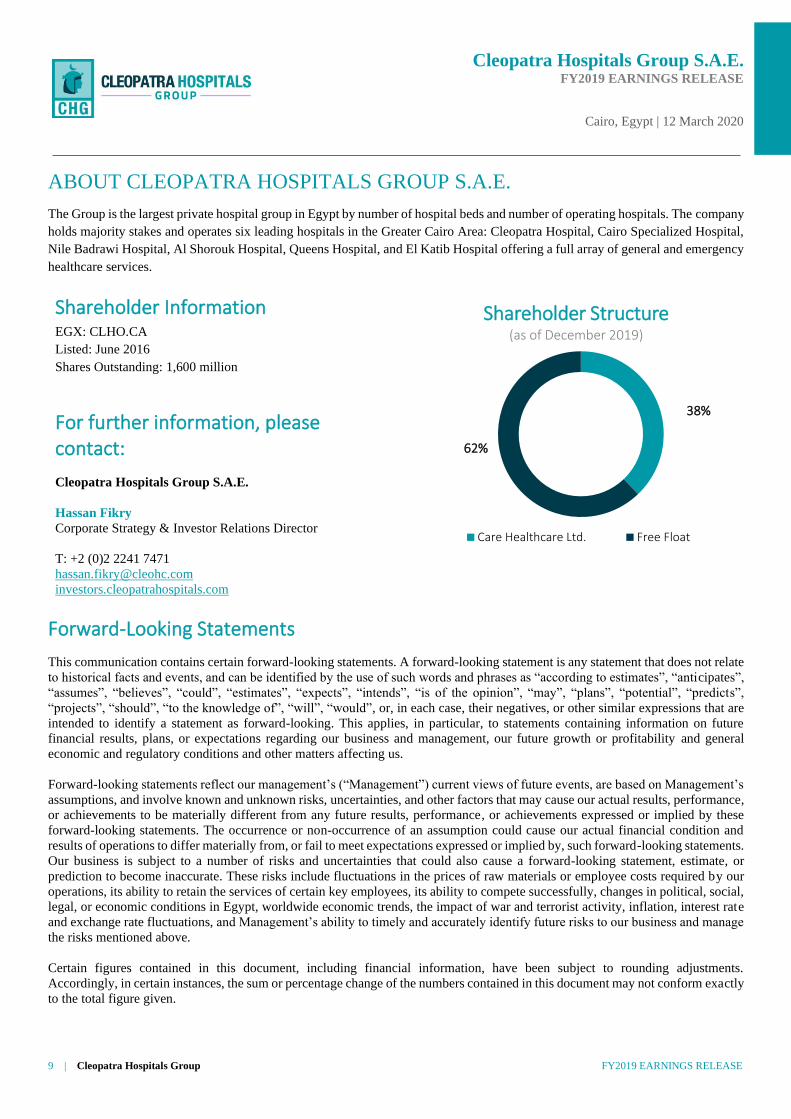
Shareholder Information EGX: CLHO.CA
Listed: June 2016
Shares Outstanding: 1,600 million
For further information, please contact:
Cleopatra Hospitals Group S.A.E.
Hassan Fikry
Corporate Strategy & Investor Relations Director
T: +2 (0)2 2241 7471
investors.cleopatrahospitals.com
Forward-Looking Statements
This communication contains certain forward-looking statements. A forward-looking statement is any statement that does not relate
to historical facts and events, and can be identified by the use of such words and phrases as “according to estimates”, “anticipates”,
“assumes”, “believes”, “could”, “estimates”, “expects”, “intends”, “is of the opinion”, “may”, “plans”, “potential”, “predicts”,
“projects”, “should”, “to the knowledge of”, “will”, “would”, or, in each case, their negatives, or other similar expressions that are
intended to identify a statement as forward-looking. This applies, in particular, to statements containing information on future
financial results, plans, or expectations regarding our business and management, our future growth or profitability and general
economic and regulatory conditions and other matters affecting us.
Forward-looking statements reflect our management’s (“Management”) current views of future events, are based on Management’s
assumptions, and involve known and unknown risks, uncertainties, and other factors that may cause our actual results, performance,
or achievements to be materially different from any future results, performance, or achievements expressed or implied by these
forward-looking statements. The occurrence or non-occurrence of an assumption could cause our actual financial condition and
results of operations to differ materially from, or fail to meet expectations expressed or implied by, such forward-looking statements.
Our business is subject to a number of risks and uncertainties that could also cause a forward-looking statement, estimate, or
prediction to become inaccurate. These risks include fluctuations in the prices of raw materials or employee costs required by our
operations, its ability to retain the services of certain key employees, its ability to compete successfully, changes in political, social,
legal, or economic conditions in Egypt, worldwide economic trends, the impact of war and terrorist activity, inflation, interest rate
and exchange rate fluctuations, and Management’s ability to timely and accurately identify future risks to our business and manage
the risks mentioned above.
Certain figures contained in this document, including financial information, have been subject to rounding adjustments.
Accordingly, in certain instances, the sum or percentage change of the numbers contained in this document may not conform exactly
to the total figure given.
38%
62%
Shareholder Structure (as of December 2019)
Care Healthcare Ltd. Free Float

10 | Cleopatra Hospitals Group FY2019 EARNINGS RELEASE
Cleopatra Hospitals Group S.A.E. FY2019 EARNINGS RELEASE
Cairo, Egypt | 12 March 2020
Consolidated Statement of Income All figures in EGP mn 4Q2019 4Q2018 % change FY2019 FY2018 % change
Revenues 511.1 394.0 30% 1798.1 1456.1 23%
Cost of sales (337.5) (245.5) 37% (1172.7) (942.5) 24%
Gross profit 173.6 148.6 17% 625.5 513.6 22%
Gross Profit Margin 34% 38% 35% 35%
General & administrative expenses (64.6) (45.7) 41% (338.0) (183.1) 85%
Cost of acquisition activities (1.8) (0.0) (6.3) (4.6) 37%
Provisions (6.0) (13.5) -56% (7.4) (17.2) -57%
Other income 4.3 2.3 86% 10.7 7.9 36%
Pre-Operating Expenses 0.0 0.0 (3.4) 0.0
EBIT 105.4 91.6 15% 281.1 316.6 -11%
EBIT Margin 21% 23% 16% 22%
Interest income 21.4 35.2 -39% 93.3 129.4 -28%
Interest expense (1.1) (7.0) -85% (6.9) (38.0) -82%
Profit before tax 125.8 119.7 5% 367.5 408.0 -10%
PBT Margin 25% 30% 20% 28%
Income tax (25.5) (28.7) -11% (94.3) (90.4) 4%
Deferred tax (4.9) (0.8) 0% (7.9) (2.4) 225%
Net profit after tax 95.4 90.2 6% 265.4 315.2 -16%
Net Profit Margin 19% 23% 15% 22%
Distributed as follows:
Shareholders of the company 90.9 84.0 8% 257.4 294.9 -13%
Minority rights 4.5 6.2 -28% 8.0 20.3 -61%
Profit for the period 95.4 90.2 6% 265.4 315.2 -16%
Consolidated Statement of Comprehensive Income All figures in EGP mn 4Q2019 4Q2018 % change FY2019 FY2018 % change
Net Profit 95.4 90.2 6% 265.4 315.2 -16%
Other comprehensive income 0.0 0.0 0.0 0.0
Total comprehensive income for
the year
95.4 90.2 6% 265.4 315.2 -16%
Total comprehensive income
attributable to:
Owners of the company 90.9 84.0 8% 257.4 294.9 -13%
Non-controlling interest 4.5 6.2 -28% 8.0 20.3 -61%
Total comprehensive income for
the year
95.4 90.2 6% 265.4 315.2 -16%
11 | Cleopatra Hospitals Group FY2019 EARNINGS RELEASE
Cleopatra Hospitals Group S.A.E. FY2019 EARNINGS RELEASE
Cairo, Egypt | 12 March 2020
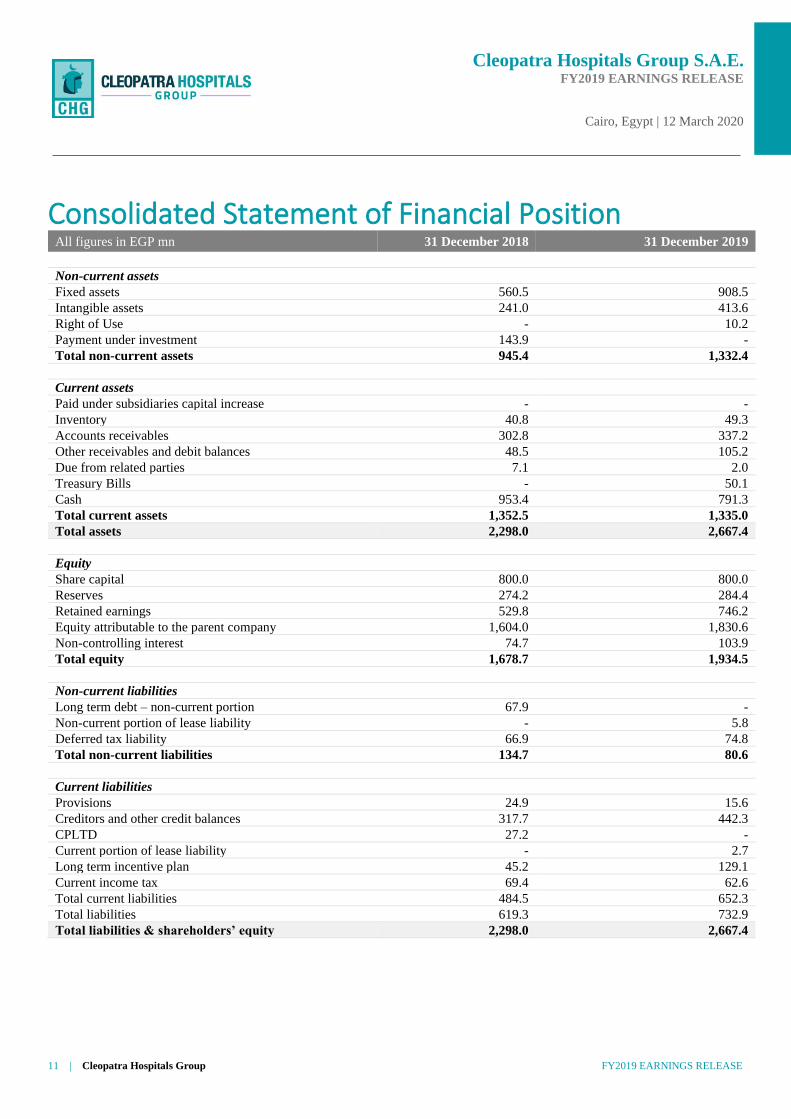
Consolidated Statement of Financial Position All figures in EGP mn 31 December 2018 31 December 2019
Non-current assets
Fixed assets 560.5 908.5
Intangible assets 241.0 413.6
Right of Use - 10.2
Payment under investment 143.9 -
Total non-current assets 945.4 1,332.4
Current assets
Paid under subsidiaries capital increase - -
Inventory 40.8 49.3
Accounts receivables 302.8 337.2
Other receivables and debit balances 48.5 105.2
Due from related parties 7.1 2.0
Treasury Bills - 50.1
Cash 953.4 791.3
Total current assets 1,352.5 1,335.0
Total assets 2,298.0 2,667.4
Equity
Share capital 800.0 800.0
Reserves 274.2 284.4
Retained earnings 529.8 746.2
Equity attributable to the parent company 1,604.0 1,830.6
Non-controlling interest 74.7 103.9
Total equity 1,678.7 1,934.5
Non-current liabilities
Long term debt – non-current portion 67.9 -
Non-current portion of lease liability - 5.8
Deferred tax liability 66.9 74.8
Total non-current liabilities 134.7 80.6
Current liabilities
Provisions 24.9 15.6
Creditors and other credit balances 317.7 442.3
CPLTD 27.2 -
Current portion of lease liability - 2.7
Long term incentive plan 45.2 129.1
Current income tax 69.4 62.6
Total current liabilities 484.5 652.3
Total liabilities 619.3 732.9
Total liabilities & shareholders’ equity 2,298.0 2,667.4
12 | Cleopatra Hospitals Group FY2019 EARNINGS RELEASE
Cleopatra Hospitals Group S.A.E. FY2019 EARNINGS RELEASE
Cairo, Egypt | 12 March 2020
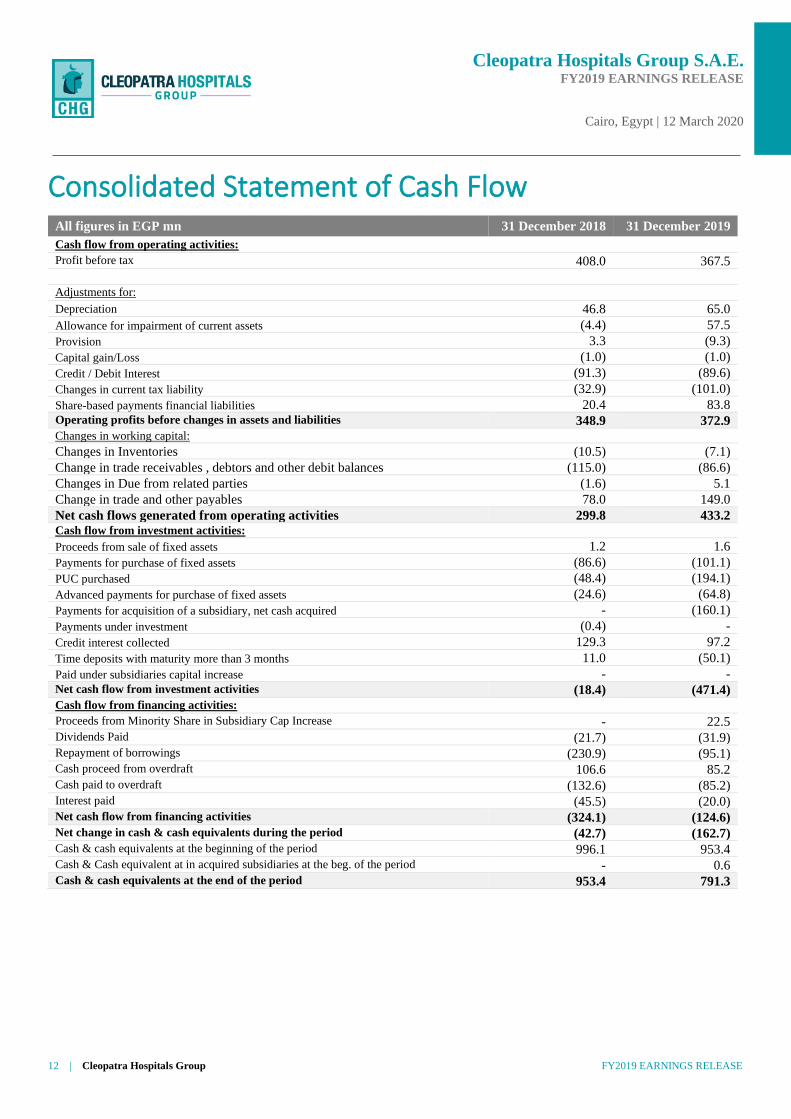
Consolidated Statement of Cash Flow
All figures in EGP mn 31 December 2018 31 December 2019
Cash flow from operating activities:
Profit before tax 408.0 367.5 Adjustments for:
Depreciation 46.8 65.0
Allowance for impairment of current assets (4.4) 57.5
Provision 3.3 (9.3)
Capital gain/Loss (1.0) (1.0)
Credit / Debit Interest (91.3) (89.6)
Changes in current tax liability (32.9) (101.0)
Share-based payments financial liabilities 20.4 83.8 Operating profits before changes in assets and liabilities 348.9 372.9 Changes in working capital:
Changes in Inventories (10.5) (7.1)
Change in trade receivables , debtors and other debit balances (115.0) (86.6)
Changes in Due from related parties (1.6) 5.1
Change in trade and other payables 78.0 149.0
Net cash flows generated from operating activities 299.8 433.2 Cash flow from investment activities:
Proceeds from sale of fixed assets 1.2 1.6
Payments for purchase of fixed assets (86.6) (101.1)
PUC purchased (48.4) (194.1)
Advanced payments for purchase of fixed assets (24.6) (64.8)
Payments for acquisition of a subsidiary, net cash acquired - (160.1)
Payments under investment (0.4) -
Credit interest collected 129.3 97.2
Time deposits with maturity more than 3 months 11.0 (50.1)
Paid under subsidiaries capital increase - - Net cash flow from investment activities (18.4) (471.4)
Cash flow from financing activities:
Proceeds from Minority Share in Subsidiary Cap Increase - 22.5 Dividends Paid (21.7) (31.9) Repayment of borrowings (230.9) (95.1) Cash proceed from overdraft 106.6 85.2 Cash paid to overdraft (132.6) (85.2) Interest paid (45.5) (20.0) Net cash flow from financing activities (324.1) (124.6) Net change in cash & cash equivalents during the period (42.7) (162.7) Cash & cash equivalents at the beginning of the period 996.1 953.4 Cash & Cash equivalent at in acquired subsidiaries at the beg. of the period - 0.6 Cash & cash equivalents at the end of the period 953.4 791.3