fy21 q3 earnings presentation - conagra brands
TRANSCRIPT

FY21 Q3 Earnings Presentation
April 8, 2021

Today’s Presenters
2
Brian KearneyInvestor Relations
Sean ConnollyPresident and Chief Executive Officer
Dave MarbergerExecutive Vice President and Chief Financial Officer

Legal Disclosure
3
Note on Forward-looking Statements
This document contains forward-looking statements within the meaning of the federal securities laws. These forward-looking statements are based on
management's current expectations and are subject to uncertainty and changes in circumstances. Readers of this document should understand that
these statements are not guarantees of performance or results. Many factors could affect our actual financial results and cause them to vary materially
from the expectations contained in the forward-looking statements, including those set forth in this document. These risks, uncertainties, and factors
include, among other things: the risk that the cost savings and any other synergies from the acquisition of Pinnacle Foods Inc. (the Pinnacle acquisition)
may not be fully realized or may take longer to realize than expected; the risk that the Pinnacle acquisition may not be accretive within the expected
timeframe or to the extent anticipated; the risks that the Pinnacle acquisition and related integration will create disruption to the Company and its
management and impede the achievement of business plans; risks related to our ability to achieve the intended benefits of other recent acquisitions and
divestitures; risks associated with general economic and industry conditions; risks associated with our ability to successfully execute our long-term
value creation strategies; risks related to our ability to deleverage on currently anticipated timelines, and to continue to access capital on acceptable
terms or at all; risks related to our ability to execute operating and restructuring plans and achieve targeted operating efficiencies from cost-saving
initiatives, and to benefit from trade optimization programs; risks related to the effectiveness of our hedging activities and ability to respond to volatility in
commodities; risks related to the Company's competitive environment and related market conditions; risks related to our ability to respond to changing
consumer preferences and the success of our innovation and marketing investments; risks related to the ultimate impact of any product recalls and
litigation, including litigation related to the lead paint and pigment matters, as well as any securities litigation, including securities class action lawsuits;
risk associated with actions of governments and regulatory bodies that affect our businesses, including the ultimate impact of new or revised regulations
or interpretations; risks related to the impact of the coronavirus (COVID-19) pandemic on our business, suppliers, consumers, customers and
employees; risks related to our forecasts of consumer eat-at-home habits as the impacts of the COVID-19 pandemic abate; risks related to the
availability and prices of raw materials, including any negative effects caused by inflation, weather conditions or health pandemics; disruptions or
inefficiencies in our supply chain and/or operations, including from the COVID-19 pandemic; risks associated with actions by our customers, including
changes in distribution and purchasing terms; risks and uncertainties associated with intangible assets, including any future goodwill or intangible
assets impairment charges; and other risks described in our reports filed from time to time with the Securities and Exchange Commission. We caution
readers not to place undue reliance on any forward-looking statements included in this document, which speak only as of the date of this document. We
undertake no responsibility to update these statements, except as required by law.
Note on Non-GAAP Financial Measures
This document includes certain non-GAAP financial measures, including adjusted EPS, organic net sales, adjusted gross profit, adjusted operating
profit, adjusted SG&A, adjusted corporate expenses, adjusted gross margin, adjusted operating margin, adjusted effective tax rate, adjusted net income
attributable to Conagra Brands, free cash flow, net debt, net leverage ratio, and adjusted EBITDA. Management considers GAAP financial measures as
well as such non-GAAP financial information in its evaluation of the Company’s financial statements and believes these non-GAAP measures provide
useful supplemental information to assess the Company’s operating performance and financial position. These measures should be viewed in addition
to, and not in lieu of, the Company’s diluted earnings per share, operating performance and financial measures as calculated in accordance with GAAP.

Sean Connolly
President and Chief Executive Officer

Key Messages
• Continued strength in Q3
• Continued to invest to further strengthen the business
• Increased evidence in post-COVID-19 stickiness of demand and market share gains
• Leverage target achieved ahead of schedule, afforded opportunistic ~$300 million of our common stock in Q3 and ongoing flexibility to deploy additional capital for long-term value creation
• Multiple levers to manage impact of accelerating inflation
• Reaffirming fiscal 2022 guidance
5
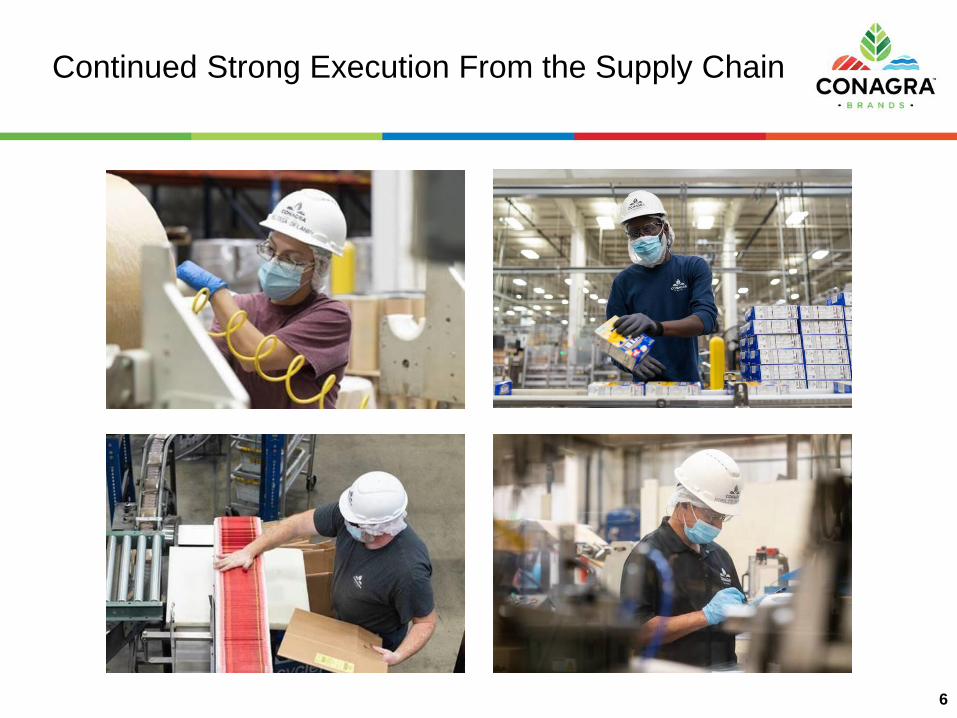
Continued Strong Execution From the Supply Chain
6

Agenda
7
Business Update
Looking Ahead

Note: “Adjusted” financial measures, and organic net sales are non-GAAP. See the end of this presentation for a reconciliation of these measures to the most directly comparable GAAP
measures.
1. Organic net sales excludes the impact of foreign exchange and divested businesses, as well as acquisitions (until the anniversary date of the acquisitions). Organic net sales growth excludes
the impact of fiscal 2020’s 53rd week, which was calculated as one-sixth of our last month’s net sales (which included a total of six weeks).
2. Adjusted operating margin excludes equity method investment earnings and pension and postretirement non-service expense (income).
Q3 Guidance Q3
Organic Net Sales1 Growth +6% to +8% +9.7%
Adj. Op. Margin2 16.0% to 16.5% 16.0%
Adj. Diluted EPS from cont. ops. $0.56 to $0.60 $0.59
Strong Q3 Results
8

We Continued to Execute Our Conagra Playbook in Q3
9
3
Mental
Availability
2
Physical Availability
1
Superior Products
Saliency
Relevancy
Brick & Mortar
eCommerce
Perpetual
Modernization

Strong, Broad-Based Growth and Share Gains…
10
+10.8%
+13.8%
+17.0%
+11.8%
+14.7%
Edible xBev
Conagra
Snacks
Frozen
Staples
Q3 Retail Sales
(% Change vs. YA)
Q3 Weighted Dollar Share
(Change vs. Q2 FY21)
Conagra
Snacks
Frozen
Staples
+0.6 pts
+2.0 pts
+0.2 pts
+0.2 pts
Source (Left Chart): IRI Syndicated Market Advantage, Total US MULO+C, 13-weeks ended February 28, 2021, Conagra Brands = Total Edible
Source (Right Chart): IRI Custom Market Advantage, Total US MULO+C, 13-weeks ended February 28, 2021 vs 13-weeks ended November 29, 2020

…Fueled by Superior Penetration and Repeat Rate
11
Q3 Household Penetration
(Pt Change vs. YA)
Q3 Repeat Rate
(Pt Change vs. YA)
Conagra
Total Peers Wtd. Avg +0.3 pts
+0.6 pts Conagra
Total Peers Wtd. Avg +0.8 pts
+1.0 pts
Source: IRI Household Panel, Total US All Outlets, 13-weeks ended February 21, 2021, Total Edible xBev, Total Conagra vs. Total Peers Weighted Average
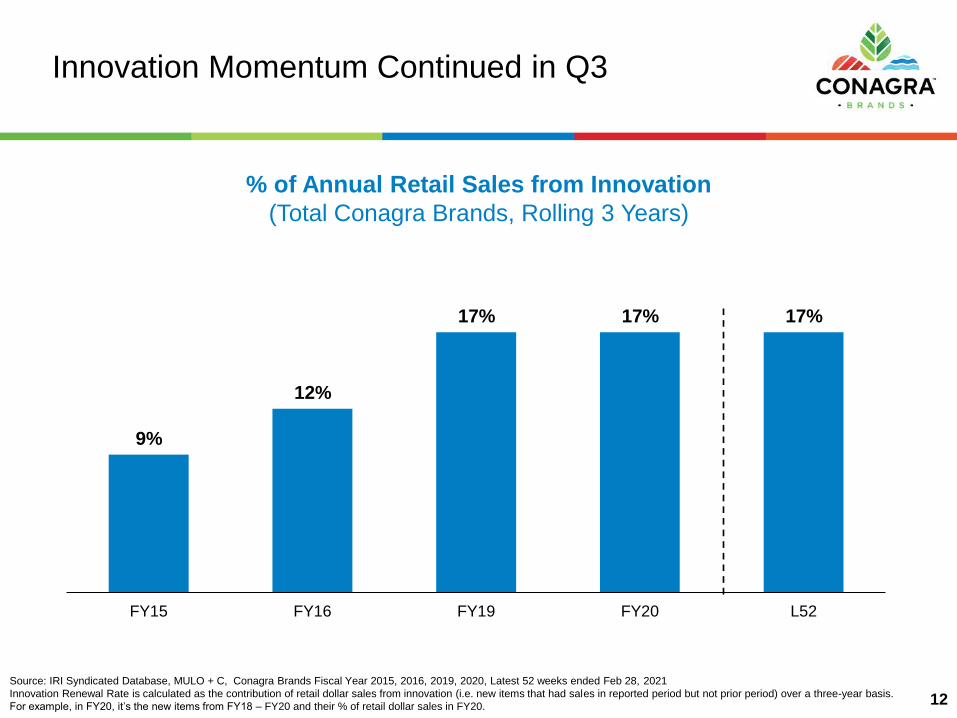
Innovation Momentum Continued in Q3
12
% of Annual Retail Sales from Innovation
(Total Conagra Brands, Rolling 3 Years)
Source: IRI Syndicated Database, MULO + C, Conagra Brands Fiscal Year 2015, 2016, 2019, 2020, Latest 52 weeks ended Feb 28, 2021
Innovation Renewal Rate is calculated as the contribution of retail dollar sales from innovation (i.e. new items that had sales in reported period but not prior period) over a three-year basis.
For example, in FY20, it’s the new items from FY18 – FY20 and their % of retail dollar sales in FY20.
9%
12%
17% 17% 17%
FY15 FY16 FY19 FY20 L52

Innovation Continued to Be a Key Growth Driver
13
Packaging under development, subject to change.
1. Source: IRI Market Advantage Syndicated Data, MULO+C, Conagra Innovation = UPCs with zero dollar sales YA
2. Source: IRI Market Advantage Syndicated Data, MULO, Last 13 weeks ended February 28, 2021, Based on Dollar Sales
Note: UPC stands for Universal Product Code, TPD stands for Total Points of Distribution
#1 New Item in Hot Cocoa2
#1 Velocity Branded New Item
in Frozen Vegetables2
Birds Eye has the Top 4 Branded
Frozen Vegetable New Items
in Grocery2
Innovation Launched and Sold in Q1-Q3 FY21 vs.
Innovation Launched and Sold in Q1-Q3 FY201
+66%
+53%
Average Retail Salesper UPC
Average TPDsper UPC
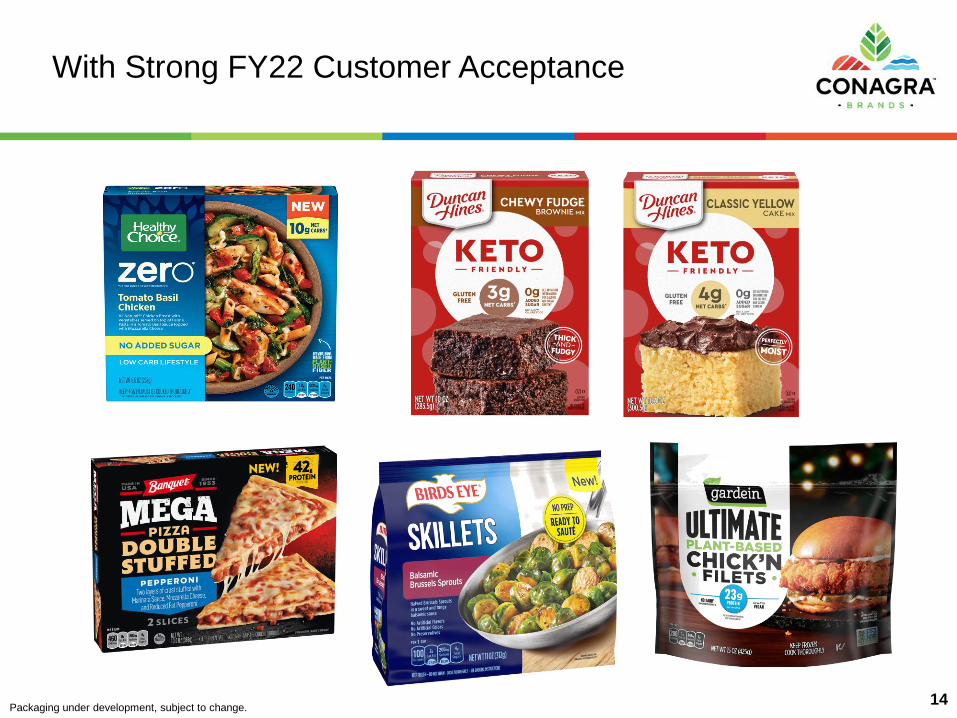
With Strong FY22 Customer Acceptance
14Packaging under development, subject to change.

eCommerce Marketing Investments Continued to Yield Results
15
% of Conagra’s Sales Growing Share in eCommerce
(Latest 52 Weeks)
Note: only ~84% of Conagra eCommerce brand sales measured; Latest weeks subject to change due to data stability;
Source (Left): Source: IRI eMarket Insights, Total Conagra vs. Total Edible xBeverage xProducts Where Parent Company Is Unknown, Total eCommerce RMA; Data ended February 28, 2021.
Source (Right): IRI eMarket Insights, Conagra Brands, Total eCommerce RMA xProducts Where Parent Company Is Unknown and XMILK FLAVORING/COCOA MIXES; Latest 52 Weeks Ended February 28, 2021; % of
dollar sales for brands where Conagra is growing share in eCommerce channel.
Conagra vs. Total Edible eCommerce Retail Sales
(% Change vs. YA)
+159%
+113%
+98% +89%
+119%
+105%
+88% +81%
Q4 FY20 Q1 FY21 Q2 FY21 Q3 FY21
Conagra Total Edible
76% brands
growing
share

eCommerce Shoppers Offer Superior Lifetime Value
16
Source (Left):Shopper Card Data From Leading U.S. Retailer 52-Weeks Ending 2-27-21; Total Store Products; Indexed Total eCommerce Sales (Pick-Up & Delivery) vs. In-Store
Source (Middle): IRI Thought Leadership, IRI Grocery Retailer Shopper Loyalty Card Data, Tracked Households. New E-Commerce Shoppers who shopped store only pre-COVID-19 and tried e-commerce during COVID-19. 26 Weeks Ended February 20,
2021 vs. 26 Weeks Ended February 22, 2020. Note: Retailer offers pickup and delivery e-commerce services
Source (Right): IRI Thought Leadership, IRI Grocery Retailer Shopper Loyalty Card Data ending 2/21/21, Tracked Households. % $ Share of Category by Shopper Type, L52 Weeks vs. YA Note: Average of 3 CPG Food & Beverage Brands. Retailer offers
pickup and delivery eCommerce services.
Strong Habit Formation Higher Brand Loyalty
eCommerce Grocery Shopping Behavior Leads to:
50%of new eCommerce
shoppers continue to
buy online
~20%become heavy users
47%
57%
Brand Average
In-Store Online
Brand Share of Wallet
In-Store vs. Online
(2x+ Purchases)
Engagement With
Younger Consumers
Share of Millennial
households who shop
online is
>2xthose who shop in-store
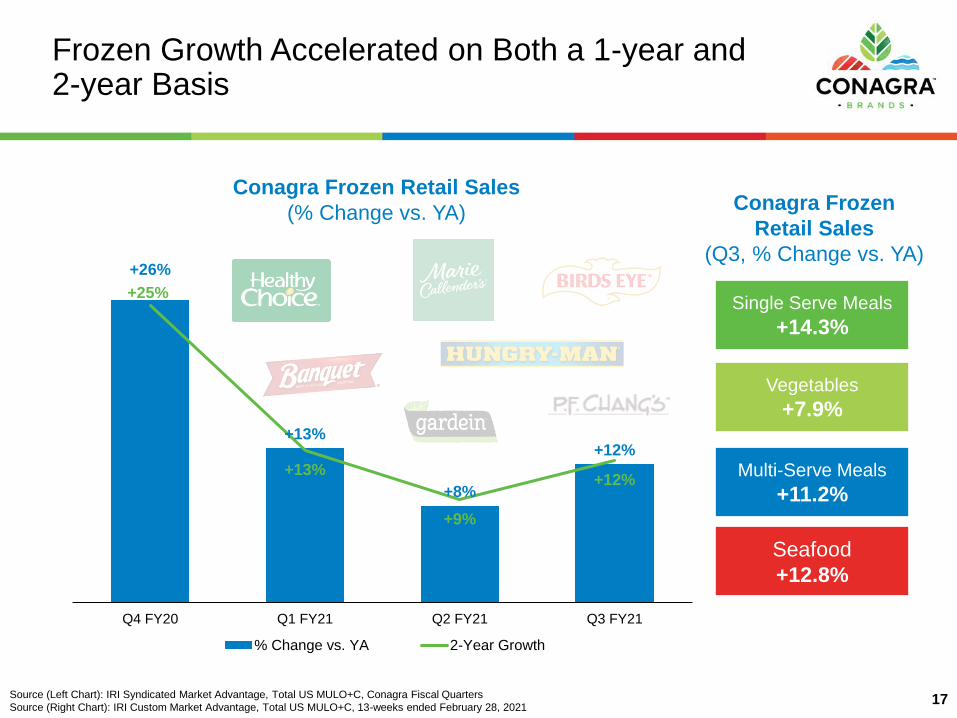
Frozen Growth Accelerated on Both a 1-year and 2-year Basis
17
+26%
+13%
+8%
+12%
+25%
+13%
+9%
+12%
Q4 FY20 Q1 FY21 Q2 FY21 Q3 FY21
% Change vs. YA 2-Year Growth
Conagra Frozen Retail Sales
(% Change vs. YA)
Single Serve Meals
+14.3%
Vegetables
+7.9%
Multi-Serve Meals
+11.2%
Seafood
+12.8%
Source (Left Chart): IRI Syndicated Market Advantage, Total US MULO+C, Conagra Fiscal Quarters
Source (Right Chart): IRI Custom Market Advantage, Total US MULO+C, 13-weeks ended February 28, 2021
Conagra Frozen
Retail Sales
(Q3, % Change vs. YA)
18
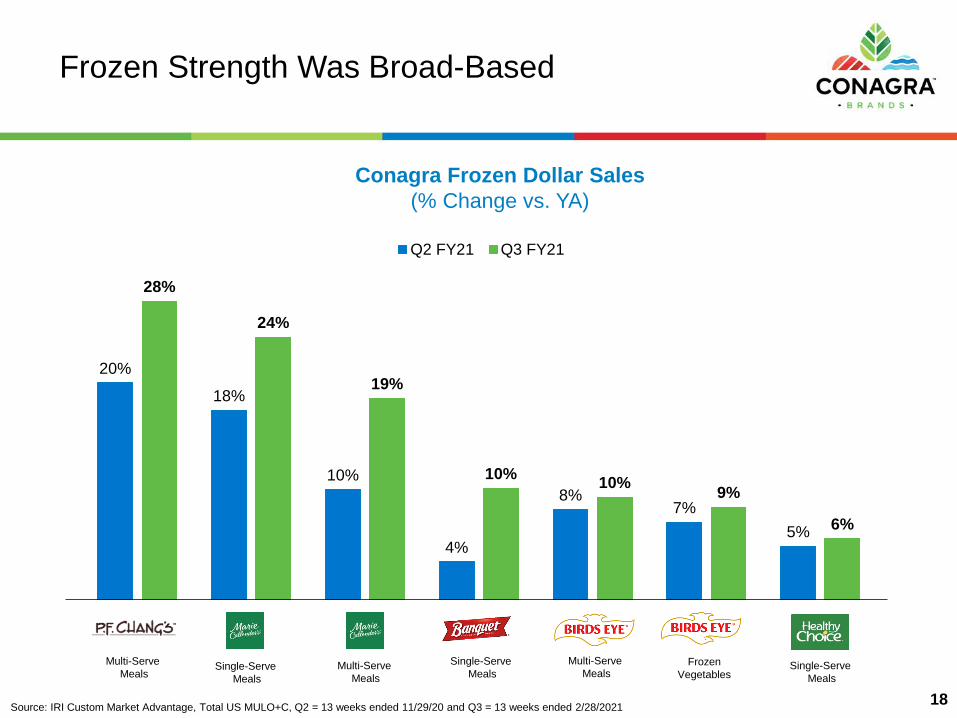
Frozen Strength Was Broad-Based
Source: IRI Custom Market Advantage, Total US MULO+C, Q2 = 13 weeks ended 11/29/20 and Q3 = 13 weeks ended 2/28/2021
Conagra Frozen Dollar Sales
(% Change vs. YA)
Frozen
Vegetables
Multi-Serve
MealsMulti-Serve
MealsSingle-Serve
Meals
Single-Serve
Meals
Multi-Serve
Meals
20%
18%
10%
4%
8%7%
5%
28%
24%
19%
10%10%
9%
6%
Q2 FY21 Q3 FY21
Single-Serve
Meals

+20.3%
+14.9%
+10.9%
+17.0%
+26.0%
+22.8%
+15.7%
+21.2%
Q4 FY20 Q1 FY21 Q2 FY21 Q3 FY21
% Change vs. YA 2-Year Growth
Snacks Growth Accelerated on Both a 1-year and 2-year Basis
19
Conagra Snacks Retail Sales
(% Change vs. YA)
Popcorn
+22.5%
Sweet Treats
+21.8%
Seeds
(3.6)%
Meat Snacks
+10.1%
Source (Left Chart): IRI Syndicated Market Advantage, Total US MULO+C, Conagra Fiscal Quarters
Source (Right Chart): IRI Custom Market Advantage, Total US MULO+C, 13-weeks ended February 28, 2021
Conagra Snacks
Retail Sales
(Q3, % Change vs. YA)

Consumers Are Snacking at Elevated Rates with Strong Q3 Velocities for Our Brands
20
Conagra Snacks Velocity
(% Change vs. YA)
+31.8%
+29.4%
+23.4%
+18.7%
+11.0%
+8.8%+6.8%
Source: IRI Custom Market Advantage, Total US MULO+C, 13 weeks ended 2/28/2021; Orville is Microwave Popcorn, Duncan Hines is Baking Mixes
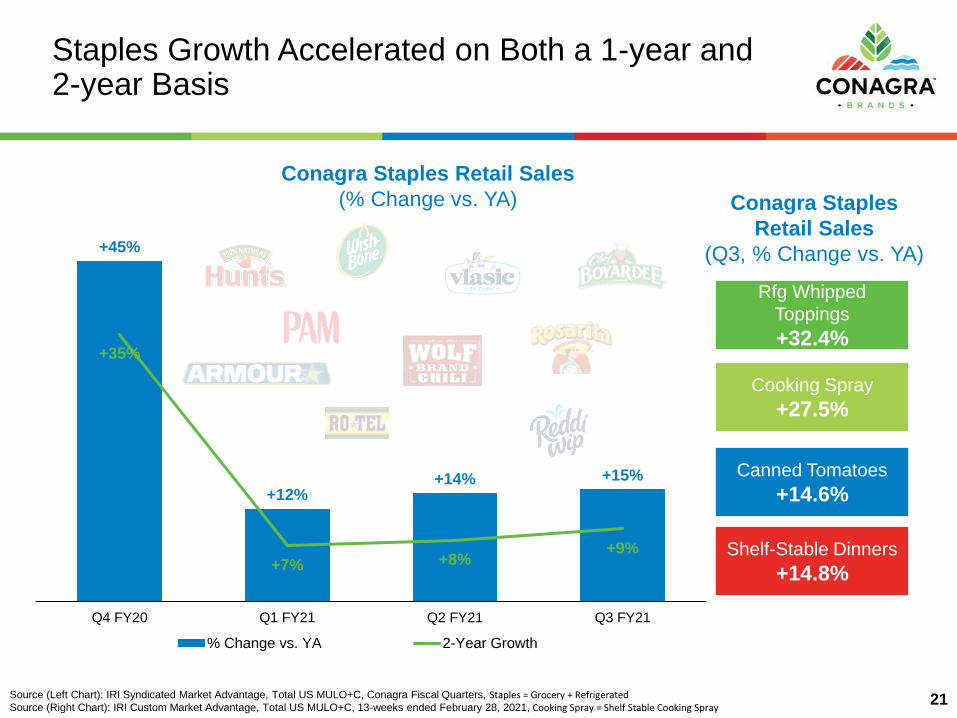
Staples Growth Accelerated on Both a 1-year and 2-year Basis
21
+45%
+12%+14% +15%
+35%
+7% +8%+9%
Q4 FY20 Q1 FY21 Q2 FY21 Q3 FY21
% Change vs. YA 2-Year Growth
Conagra Staples Retail Sales
(% Change vs. YA)
Rfg Whipped
Toppings
+32.4%
Cooking Spray
+27.5%
Canned Tomatoes
+14.6%
Shelf-Stable Dinners
+14.8%
Source (Left Chart): IRI Syndicated Market Advantage, Total US MULO+C, Conagra Fiscal Quarters, Staples = Grocery + RefrigeratedSource (Right Chart): IRI Custom Market Advantage, Total US MULO+C, 13-weeks ended February 28, 2021, Cooking Spray = Shelf Stable Cooking Spray
Conagra Staples
Retail Sales
(Q3, % Change vs. YA)

22
Broad-based Strength in Staples in Q3
Source: IRI Custom Market Advantage, Total US MULO+C, Q2 = 13 weeks ended 11/29/20 and Q3 = 13 weeks ended 2/28/2021
Conagra Staples Dollar Sales
(% Change vs. YA)
+8%
+18%
+25%
+13%
+18%
+10%+11%
+32%
+28%
+17%
+27%
+16%
Q2 FY21 Q3 FY21

Agenda
23
Business Update
Looking Ahead

2005 2006 2007 2008 2009 2010 2011 2012 2013 2014 2015 2016 2017 2018
History Shows Major Disruptive Events Drive Permanent Behavioral Shifts
Source: The NPD Group/National Eating Trends® and CREST®, years ending February. In Home = Prepared and eaten in home or carried from home. Graphs on different axes to show trend
Meals
So
urc
ed
In
-Ho
me
Meals
So
urc
ed
Aw
ay-F
rom
-Ho
me
Recession Recovery
% of Occasions
(Share of In-Home vs. Away-From-Home Meals)
24

During These Events, Consumers Form Habits
Source (Left): European Journal of Social Psychology, “How are habits formed: Modelling habit formation in the real world,” July 2009
Source (Right): World Health Organization, Number of days between March 11, 2020 and April 8, 202125
66 393HABIT FORMATION
days, on average, for a
new behavior to
become automatic
COVID-19 DURATION
days since WHO
declared COVID-19 a
pandemic
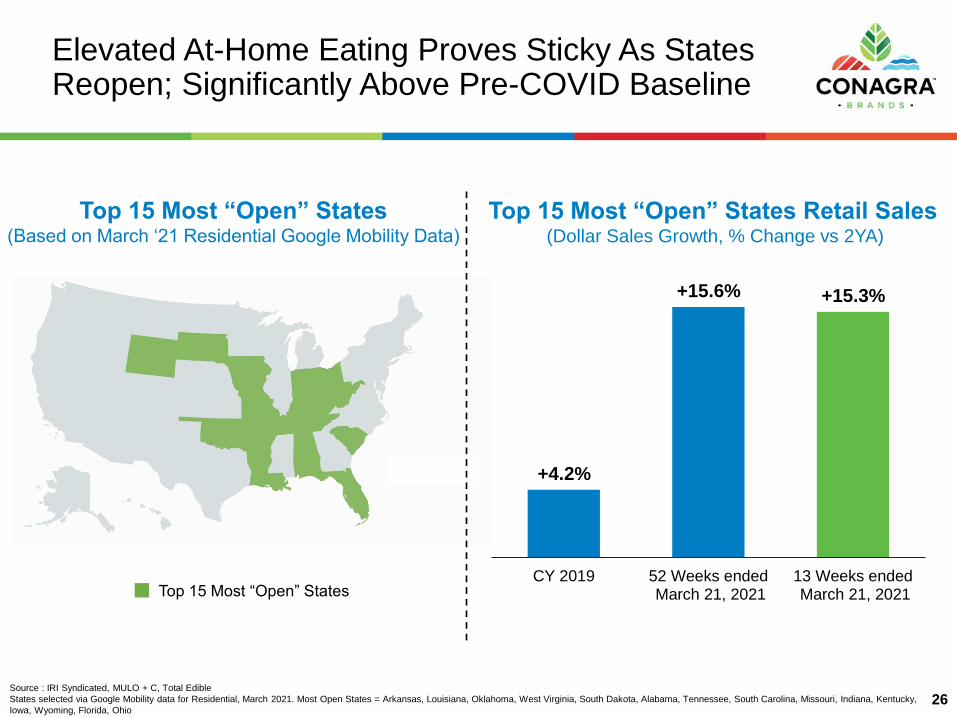
Elevated At-Home Eating Proves Sticky As States Reopen; Significantly Above Pre-COVID Baseline
26
Top 15 Most “Open” States Retail Sales(Dollar Sales Growth, % Change vs 2YA)
Source : IRI Syndicated, MULO + C, Total Edible
States selected via Google Mobility data for Residential, March 2021. Most Open States = Arkansas, Louisiana, Oklahoma, West Virginia, South Dakota, Alabama, Tennessee, South Carolina, Missouri, Indiana, Kentucky,
Iowa, Wyoming, Florida, Ohio
+4.2%
+15.6% +15.3%
CY 2019 52 Weeks ended March 21, 2021
13 Weeks ended March 21, 2021
Top 15 Most “Open” States(Based on March ‘21 Residential Google Mobility Data)
Top 15 Most “Open” States

Against This Backdrop, We Continue to Invest Behind Consumer Engagement
160%Increase in Slim Jim
Twitter followers
35 MILLION
Organic Twitter
impressions in 25 days
Voted Best BrandIn Adweek’s March Adness
Bracket Competition27

We Have Attracted More than Four Years of New Consumers, Almost Half Are Gen Z/Millennials
27%
48%
Total Category Buyers Conagra New Buyers
Gen Z + Millennial Buyers
(% of Buyers)
4+NEW BUYERS
of incremental new
buyers acquired in
one yearyears
Source (Left): IRI National Consumer Panel, Total US All Outlets, Fiscal 2018, Fiscal 2019, 52 Weeks Ended February 21, 2021
Source (Right): IRI National Consumer Panel, Custom Conagra Categories, Gen Z & Millennial Head Households, Total US All Outlets, 52 Weeks Ended February 21, 2021;
% of Buyers = Gen Z + Millennials Buyers / Buyers28

Buying Our Modernized, Upgraded Products Has Become Habitual, Especially Among New Buyers
29
52%
46%44%
37%
32%29%
24%
Total Buyers, Year Ago Total Buyers, L52W New Buyers, L52W
Repeat Depth
(% of Buyers Who Repeat Purchased 2x+)
Source: IRI Custom Panel, Total US All Outlets, 52-weeks ended February 21, 2021, New Buyers = purchased brand in 52 w/e Feb 21, 2021 and did not purchase brand in 52 w/e Feb 23, 2020Orville is Microwave Popcorn, Hunt’s is Canned Tomatoes, PF Chang’s is Fz Multi-Serve Meals

Consumers Are Habitually Buying Our Brands More Than Competition
30
3.1x
2.0x
1.6x1.5x
1.4x1.3x
1.1x 1.1x
Repeat Depth(% of New Buyers Who Repeat Purchased 2x+, Conagra Multiple vs. Wtd. Avg of Top Peers)
Source (Left): IRI Custom Panel, Total US All Outlets, 52-weeks ended February 21, 2021, New Buyers = purchased brand in 52 w/e Feb 21, 2021 and did not purchase brand in 52 w/e Feb 23, 2020, Wtd. Average of Peers Weighted to Household Penetration. Orville is Microwave Popcorn, Hunt’s is Canned Tomatoes, Birds Eye is Fz Vegetables, Banquet and Healthy Choice are Fz Single Serve Meals vs. Top Competitor

Looking Forward, Remote Work Adoption Provides a Structural Lift vs. Pre-Pandemic Levels for Frozen
Source (Left): The NPD Group/National Eating Trends®, March 2020-February 2021 vs. Prior Year, Occasions per CapitaSource (Middle): The NPD Group / National Eating Trends; Filtered on Sourced from Home/Retail, March 2020-February 2021 Source (Right): The NPD Group / National Eating Trends; Filtered on Sourced from Home/Retail, March 2020-February 2021, Index = Total Foods vs. Conagra Frozen, Shared to Main Meal Occasions
Remote Work Drives Outsized
Impact to Dinner and Lunch
31
+4%
+7%
+6%
+2%
TotalOccasions
Dinner Lunch Breakfast
In-Home Main Meal Lift
(Total COVID-19 Time Period vs. YA)
And, Conagra Frozen
Well-Developed
1 in 5
1 in 6
dinner occasions
include frozen foods
lunch occasions
include frozen foods
% of Main Meal Occasions
(Total Foods vs. Conagra Frozen)
36%
16%
30%
29%
34%
55%
Total Foods Conagra Frozen
0.5x Index
1.0x Index
1.6x Index
Dinner
Lunch
Breakfast
Total
Foods
% of Occasions with
Frozen Foods
Frozen Has High Exposure
in These Occasions
Frozen

COVID-19 Moved Entertainment Consumption to the Home, Benefiting Our Snacks Business
Source (Left): The NPD Group’s Connected Intelligence TV Service Switching Study of more than 5,000 U.S. consumers fielded October 14-22, 2020, eMarketer, U.S. Time Spent With Media 2020Source (Middle): The NPD Group / National Eating Trends; Sourced from Home/Retail, Occasions per Capita, March 2020 – February 2021 vs. Prior Year, Gen Z is 18+Source (Right): IRI National Consumer Panel, Total US All Outlets, 52-weeks ended February 21, 2021, Orville is Microwave Popcorn, Duncan Hines is Baking Mixes
32
Consumers Choose Our
Brands Again and Again
Leading to Increased
Snacking
Gen Z
+25%
Millennials
+26%
Gen X
+17%
Boomers
+18%
People Are Consuming
More Media At-Home
+40%increase in streaming
services
+42%increase in time spent
viewing digital video+4.3pts
+3.1pts
+3.0pts
+2.4pts
+2.1pts
+1.6 pts
In-Home Snack Occasions
(Per Capita % Chg vs. YA)
Conagra Snacks Change in Repeat Rate
(% Buyers Buying 2x+, Pt Chg vs. YA)

Pandemic Accelerated “Home Nesting” of Young Consumers Who Are Engaging with Conagra Staples
33Source (Left): Pew Research Center, Survey of US Adults conducted June 4-10, 2020
Source (Right): IRI Custom Panel, Total US All Outlets, Latest 52 Weeks Ended February 21, 2021
One-in-Ten Young Adults Moved due
to COVID-19
3%
9%
3%
2%
1%
Total 18-29 30-49 50-64 65+
% Who Moved Temporarily or Permanently for Reasons related
to Coronavirus Outbreak
Leaving Urban Areas for Smaller
Cities & Suburbs
These Young Consumers Are Engaging
with Conagra Staples
+75%
+24%
+101%
+28%
Gen Z Millennials
All Manufacturers Conagra
Staples Retail Sales
(Latest 52 Weeks, % Chg vs. YA)

1. The inability to predict the amount and timing of the impacts of future items makes a detailed reconciliation of these forward-looking financial measures impracticable.
2. “Adjusted” financial measures, free cash flow, and organic net sales are non-GAAP financial measures.
3. Organic net sales excludes the impact of foreign exchange and divested businesses, acquisitions (until the anniversary date of the acquisitions), as well as the impact of any 53rd week.
4. Adjusted operating margin excludes equity method investment earnings and pension and postretirement non-service expense (income).
Reaffirming FY22 Outlook1
34
Metric2 Fiscal 2022 Guidance1
Organic Net Sales3 Growth(3 YR CAGR ending FY22)
+1% to +2%
Adj. Operating Margin4 18% to 19%
Adj. Diluted EPS from cont. ops. $2.63 to $2.73
Free Cash Flow Conversion(% of Adj. Net Income; 3 YR avg. ending FY22)
95%+

Summary
• Solid execution drove a strong Q3
• Business remains strong in the absolute and relative to competition
• Inflation is accelerating; multiple levers to manage impact
• Continuing to invest to capitalize on significant behavioral tailwinds
35
Dave Marberger
Executive Vice President and Chief Financial Officer

Performance Summary
37
Note: “Adjusted” financial measures and organic net sales are non-GAAP. See the end of this presentation for a reconciliation of these measures to the most directly comparable GAAP measures.
1. Organic net sales excludes the impact of foreign exchange and divested businesses, as well as acquisitions (until the anniversary date of the acquisitions). Organic net sales growth excludes
the impact of fiscal 2020’s 53rd week, which was calculated as one-sixth of our last month’s net sales (which included a total of six weeks).
2. Adjusted operating profit and adjusted operating margin exclude equity method investment earnings and pension and postretirement non-service expense (income).
3. Adjusted EBITDA includes equity method investment earnings and pension and postretirement non-service income.
Dollars in Millions, except per share data
Increase/(Decrease) Q3 vs. YA
Reported Net Sales $2,771 +8.5%
Organic Net Sales1 2,763 +9.7%
Adj. Gross Profit 761 +8.9%
Adj. Gross Margin 27.5% +12 bps
A&P 73 +11.8%
A&P as % of NS 2.6% +8 bps
Adj. SG&A 244 +5.2%
Adj. SG&A as % of NS 8.8% (27) bps
Adj. Op. Profit2 444 +10.6%
Adj. Op. Margin2 16.0% +31 bps
Adj. Net Income 287 +24.1%
Adj. EBITDA3 566 +9.9%
Adj. Diluted EPS from cont. ops. $0.59 +25.5%

+6.1%
+3.6%
(1.2)%
(0.0)%
+8.5%
Volume Price/Mix(incl. RetailerInvestments)
Divestitures ForeignExchange
TotalConagraBrands
Net Sales Bridge vs. Year Ago
38
Organic Net Sales1: +9.7%
Q3 Drivers of Net Sales Change
(% Change vs. YA)
Note: Organic net sales is non-GAAP. See the end of this presentation for a reconciliation of this measure to the most directly comparable GAAP measure. Numbers may not add
due to rounding. Percentage points may include rounding to bridge the change in reported net sales to the change in organic net sales.
1. Organic net sales excludes the impact of foreign exchange and divested businesses, as well as acquisitions (until the anniversary date of the acquisitions). Organic net sales
excludes the impact of fiscal 2020’s 53rd week, which was calculated as one-sixth of our last month’s net sales (which included a total of six weeks).

Net Sales Summary by Segment
39
Note: Organic net sales is non-GAAP. See the end of this presentation for a reconciliation of this measure to the most directly comparable GAAP measure. Numbers may not
add due to rounding.
1. Organic net sales excludes the impact of foreign exchange and divested businesses, as well as acquisitions (until the anniversary date of the acquisitions). Organic net sales
excludes the impact of fiscal 2020’s 53rd week, which was calculated as one-sixth of our last month’s net sales (which included a total of six weeks).
1 1
Dollars in Millions
Increase/(Decrease) Net Sales
Q3Reported
vs. YA
Organic
vs. YA1
Grocery & Snacks $1,133 +10.8% +13.1%
Refrigerated & Frozen 1,203 +11.7% +12.1%
International 241 +9.0% +9.8%
Foodservice 194 (17.2)% (16.5)%
Total Conagra Brands $2,771 +8.5% +9.7%

Operating Margin Bridge
40
Q3 Adj. Operating Margin1
(% Change vs. YA)
Note: “Adjusted” financial measures are non-GAAP. See the end of this presentation for a reconciliation of these measures to the most directly comparable GAAP measures;
Numbers may not add due to rounding.
1. Adjusted operating margin excludes equity method investment earnings and pension and postretirement non-service expense (income).
Adj. Gross Margin: +12 bps vs. YA
Additional
Transportation
Investments
(60) bps

Invested in the Business to Support Elevated Demand
• Approximately 60bps (~$15 million) of 180bps impact of COVID-19 costs in Q3 driven by intentional transportation investments
• Supported increased demand by selectively bypassing normal distribution network and shipping direct to customers
• Expect incremental costs to abate as inventories rebuild in coming quarters
41

Managing Through Inflationary Environment
• Q3 inflation of 3.9%• Materials ~3%
• Manufacturing ~4%
• Transportation & Logistics ~8% (excludes investments to support demand)
• Inflation expected to accelerate over next few quarters
• Already executing inflation-justified pricing actions
• Will aggressively manage other margin levers to optimize profit: mix, cost savings / productivity, fixed cost leverage
42
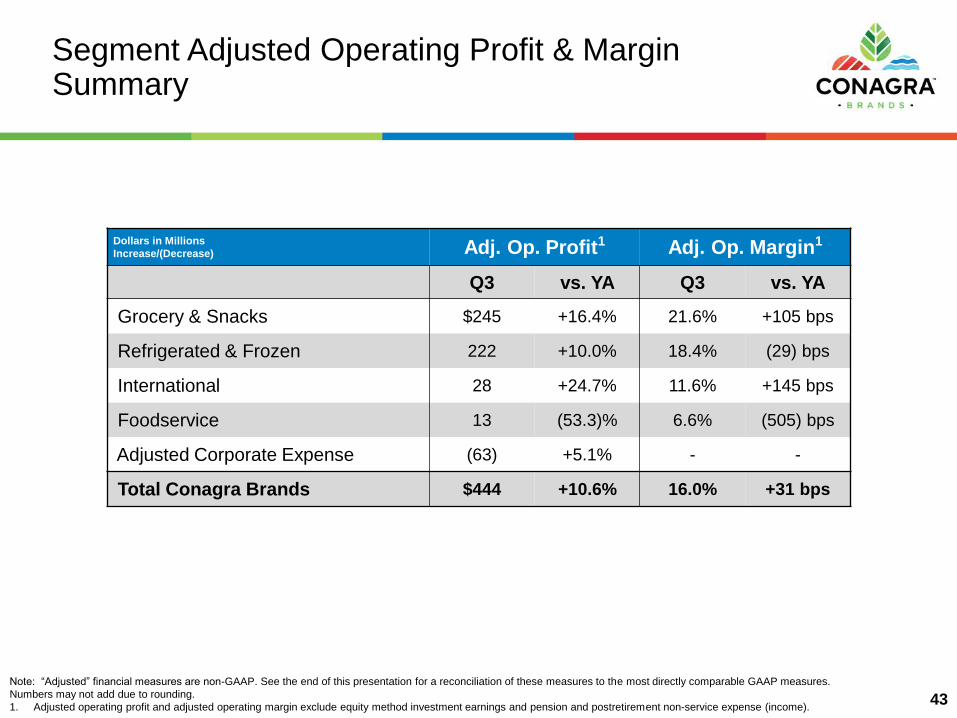
Segment Adjusted Operating Profit & Margin Summary
43
1 1
Dollars in Millions
Increase/(Decrease) Adj. Op. Profit1 Adj. Op. Margin1
Q3 vs. YA Q3 vs. YA
Grocery & Snacks $245 +16.4% 21.6% +105 bps
Refrigerated & Frozen 222 +10.0% 18.4% (29) bps
International 28 +24.7% 11.6% +145 bps
Foodservice 13 (53.3)% 6.6% (505) bps
Adjusted Corporate Expense (63) +5.1% - -
Total Conagra Brands $444 +10.6% 16.0% +31 bps
Note: “Adjusted” financial measures are non-GAAP. See the end of this presentation for a reconciliation of these measures to the most directly comparable GAAP measures.
Numbers may not add due to rounding.
1. Adjusted operating profit and adjusted operating margin exclude equity method investment earnings and pension and postretirement non-service expense (income).

Adjusted EPS Bridge
44
Drivers of Q3 Adjusted Diluted EPS from Continuing Operations vs. YA
Note: “Adjusted” financial measures are non-GAAP. See the end of this presentation for a reconciliation of these measures to the most directly comparable GAAP measures;
Numbers may not add due to rounding.
1. Adjusted operating profit excludes equity method investment earnings and pension and postretirement non-service expense (income).
1

Key Balance Sheet & Cash Flow Metrics
45
YTD through Q3(dollars in millions)
FY20 FY21
Net Cash Flow from Operating
Activities – cont. ops.$907 $1,070
Capital Expenditures $265 $397
Free Cash Flow $641 $673
Dividends Paid $310 $342
Share Repurchases $0 $298
(dollars in millions)
February
23, 2020
February
28, 2021
Debt1 $10,018 $9,227
Cash $99 $81
Ending Net Debt1 $9,919 $9,147
Net Leverage Ratio2 4.8x 3.5x
Note: Net Debt, Net Leverage Ratio and Free Cash Flow are non-GAAP. See the end of this presentation for a reconciliation of these measures to the most directly comparable GAAP
measures.
1. Debt is the sum of notes payable, current installments of long-term debt, senior long-term debt, and subordinated debt. Net Debt is Debt less Cash.
2. Net Leverage Ratio is net debt divided by Adjusted EBITDA for the trailing four quarters
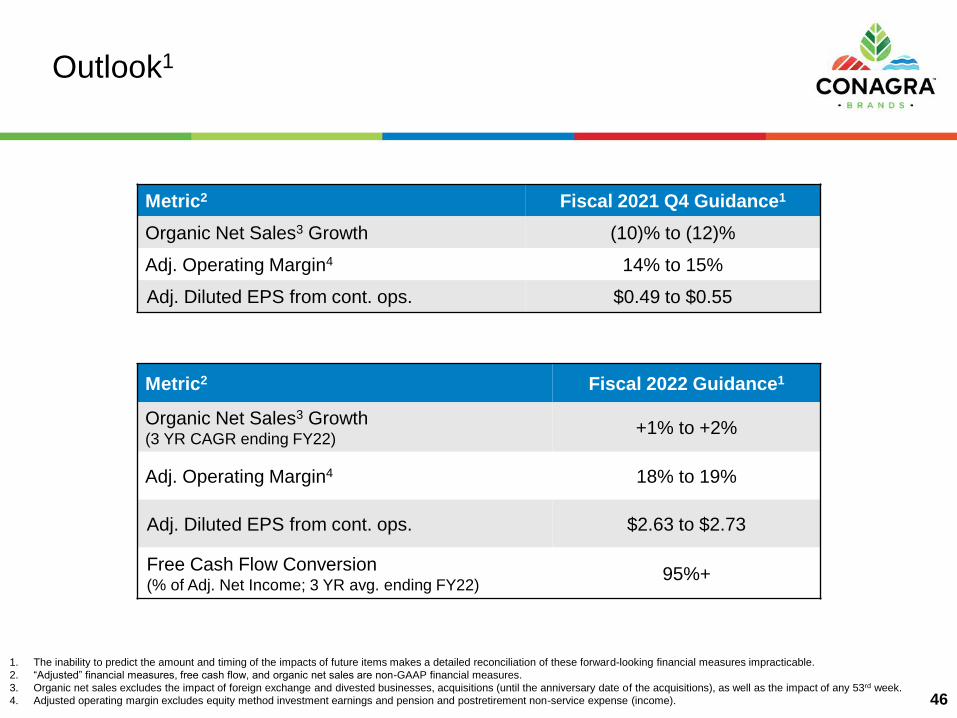
Metric2 Fiscal 2021 Q4 Guidance1
Organic Net Sales3 Growth (10)% to (12)%
Adj. Operating Margin4 14% to 15%
Adj. Diluted EPS from cont. ops. $0.49 to $0.55
1. The inability to predict the amount and timing of the impacts of future items makes a detailed reconciliation of these forward-looking financial measures impracticable.
2. “Adjusted” financial measures, free cash flow, and organic net sales are non-GAAP financial measures.
3. Organic net sales excludes the impact of foreign exchange and divested businesses, acquisitions (until the anniversary date of the acquisitions), as well as the impact of any 53rd week.
4. Adjusted operating margin excludes equity method investment earnings and pension and postretirement non-service expense (income).
Outlook1
46
Metric2 Fiscal 2022 Guidance1
Organic Net Sales3 Growth(3 YR CAGR ending FY22)
+1% to +2%
Adj. Operating Margin4 18% to 19%
Adj. Diluted EPS from cont. ops. $2.63 to $2.73
Free Cash Flow Conversion(% of Adj. Net Income; 3 YR avg. ending FY22)
95%+
Q&A

Appendix

Reconciliation of Non-GAAP Financial Measures to Reported Financial Measures (in millions)
49

Reconciliation of Non-GAAP Financial Measures to Reported Financial Measures (in millions)
50
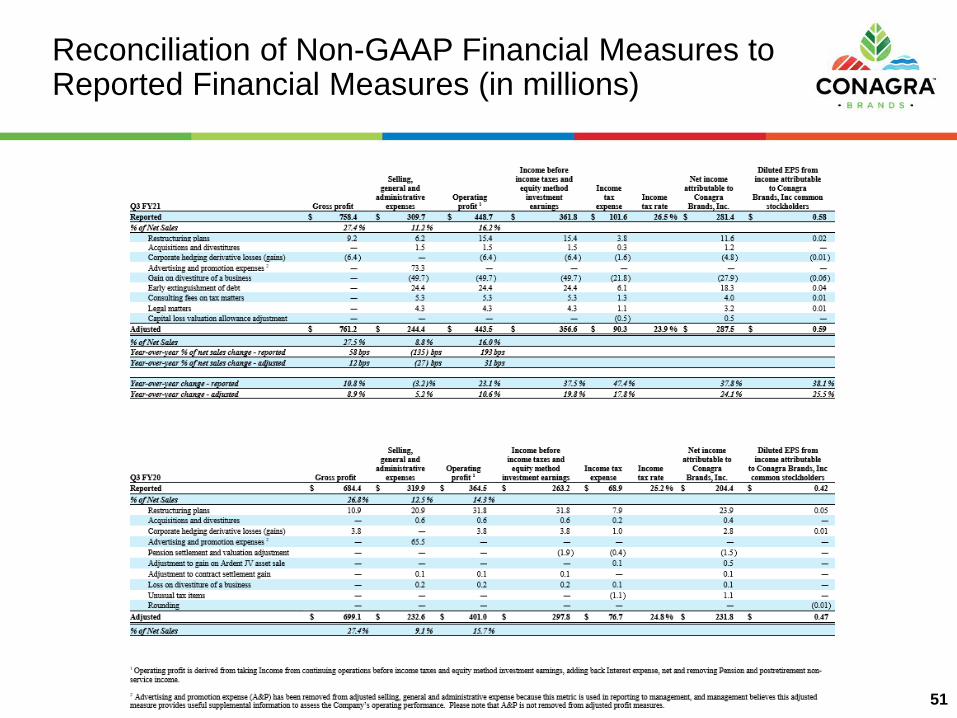
Reconciliation of Non-GAAP Financial Measures to Reported Financial Measures (in millions)
51

Reconciliation of Non-GAAP Financial Measures to Reported Financial Measures (in millions)
52

Reconciliation of Non-GAAP Financial Measures to Reported Financial Measures (in millions)
53
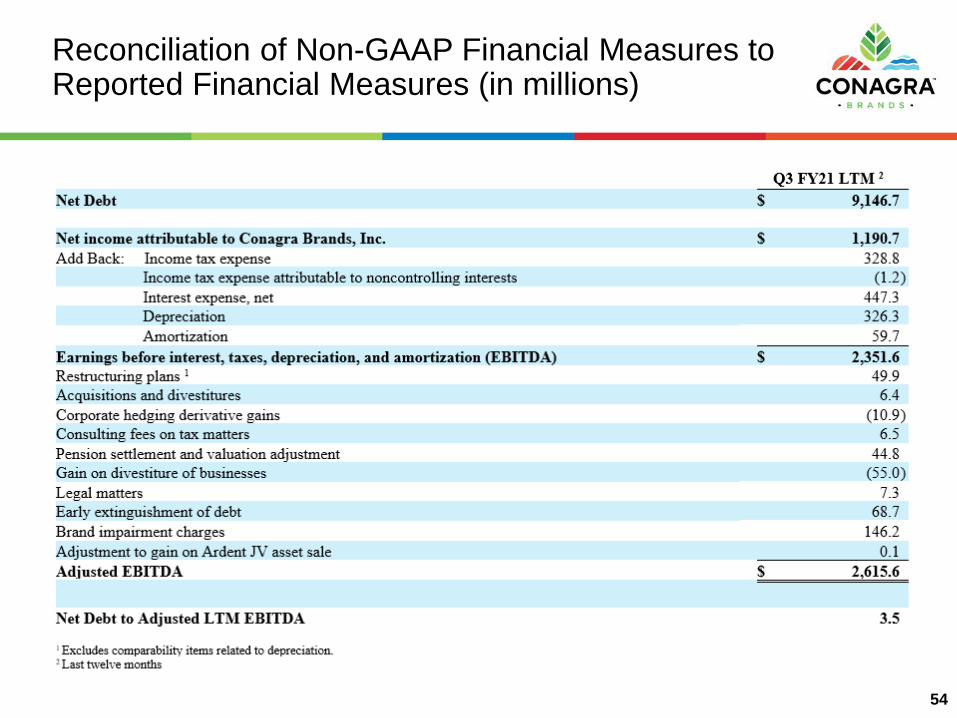
Reconciliation of Non-GAAP Financial Measures to Reported Financial Measures (in millions)
54

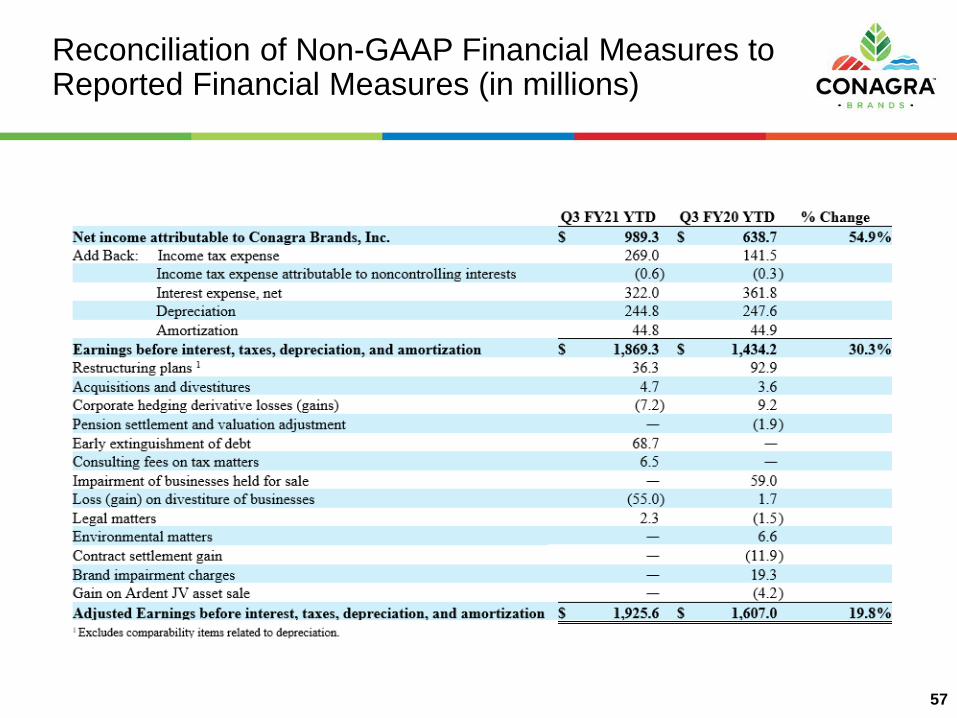
Reconciliation of Non-GAAP Financial Measures to Reported Financial Measures (in millions)
55
Q3 FY20 LTM3
Net Debt $ 9,919.3
Net income attributable to Conagra Brands, Inc. $ 765.2
Add Back: Income tax expense 213.3
Income tax expense attributable to noncontrolling interests 0.5
Interest expense, net 492.7
Depreciation 332.9
Amortization 60.0
Earnings before interest, taxes, depreciation, and amortization (EBITDA) $ 1,864.6
Restructuring plans 1 119.9
Acquisitions and divestitures 5.9
Corporate hedging losses 7.2
Pension settlement and valuation adjustment 2.4
Impairment of businesses held for sale 59.0
Inventory fair value mark-up rollout 1.7
Gain on divestiture of businesses (54.5 )
Fair value adjustment of cash settleable equity awards issued in connection with Pinnacle
acquisition 3.5
Legal matters (40.6 )
Environmental matters 6.6
Contract settlement gain (11.9 )
Intangible impairment charges 2 105.8
Gain on Ardent JV asset sale (4.2 )
Adjusted EBITDA $ 2,065.4
Net Debt to Adjusted LTM EBITDA 4.8
1. Excludes comparability items related to depreciation.
2. Excludes comparability items attributable to noncontrolling interests.
3. Last twelve months

Reconciliation of Non-GAAP Financial Measures to Reported Financial Measures (in millions)
56
Reconciliation of Non-GAAP Financial Measures to Reported Financial Measures (in millions)
57