*g-4 i*.environmentclearance.nic.in/writereaddata/online/ec/07102015n6gmox... · maps and charts,...
TRANSCRIPT

*g-4
I
*.I
s
F
I
s
I
F
i
t
E
I
I
-II
a
iI
I
-il
E
*T
=I
a
ttanI
T
tnt=ililI
rrn,
rat3It-n.L-

EIJljE1-tjtjHl-kEkkl-EEEHl_EEuHtl_l_'Hl_'HfEl-l-l-H
I
S fr.ore frne C fi.ang es a hng Qii a fr,fi ap atnaru- Q andg ae dram C o astOceanograpb Dirision, Itfationaf fumote Sensing Centre
l.Introfuction:
The shoreline is an intersection of sea and land surfaces. In the remote sensing context,
a shoreline is dividing line between land and water that is visibly discernible in coastal
imagery (Elizabeth et al, 2005). The shoreline is understood as the dynamic boundary
between land and sea for all practical purposes. Shoreline is fundamental element in
defining the Exclusive Economic Zone (EEZ), Coastal Regulation Zone (CRZ) and
other tenitorial boundaries in the ocean. Its identification involves two stages. Firstly, it
requires selection of a shoreline indicator features such as high-water line IHWLI or
mean high woter, the intersection of a tidal datum with the coastal profile. Secondly,
detection of the chosen shoreline features within the available data source. Shoreline is
not permanent line and it keeps changing continuously and steadily by adding or
removing beach each year. Shoreline changes can be both of long and short terms. The
long-term rise in relative sea level moves the shoreline by simply by shifting waves and
current actions landward and inundating the coast. A shoreline that has retreated over
100 years by erosion of the coast afterwards can advance due to formation of sandy
beaches. Extreme eventllike storm surge also inundates shorelines. The short-term,/)
shoreline changes are more of geomorphologic perspeclive as the foreshore slope
composed of fine sand responds to the variation of incident wave height, resulting in
seasonal changes. The short term changes are also quite variable alongshore. The
changes at one place over short period may be different long-term; ohe portion of the
coast may be experience retreat, while just a few kilometres away,stable or advance.

/l
Episodic events like tropical storms and cyclones can move the shoreline several meters
landward in a day due to high wave erosion (Crowell et al, 1999)
Shoreline maintains equilibrium by restoring the sediment in summer that is eroded by
high waves during winter. A wide, well-maintained sand or gravel beach is good
protection against wave erosion because wave energy is dissipated on the beach before
it reaches the bluffs behind and because the upper part of the beach is subjected to wave
action only during high tidal elevations and storm conditions. When fine grain particles
such as silts and clays are washed and held in suspension by the moving water and
swept away by winds, Sand is transported along the beach in the direction of prevailing
winds, waves, and currents. This helps maintain a sandy beach and builds accretion
deposits such as spits and bars. Pebbles, cobbles, and boulders too large to be moved by
the waves and currents remain on the beach,. forming a lag deposit that is highly
resistant to erosion. Modifuing coastland use and land cover can trigger shoreline
erosion that laterally and gradually alter the coastal morphology. Coastal structures
effect erosion by,continuously mobilizing sediment transport under different tidal and
wave cycles.
As descriptors, study of decadal change in coastal geomorphologfu facilitates
characterisation shoreline to physical changes and assessment of shoreline susceptibility
of the various coastal types. Coastal processes responsible for shoreline changes can be
monitored by l) Satellite data based observations to identifu critical areas of shoreline
change, 2) Hydrographic measurements such as bathymetry, waves, wind, currents and
tides 3) beach profiling, measurement of response of shoreline to sediment transport
over a period of time. By combining all these more definite solutioni can be arrived
(Kairu, K. and Nyandwi, N, 2000).
t-l.rhel=0hrhrha$lEt;l.tl.!!-!*rl-!-l-.l..5.!.-1-!-!-rl-l-!-!-tI!-l-1-!-.!-.ll-!.!l-lh
Hhrf,I!-l-!E!-!-!.el.rI
Potential data sources for shoreline investigation include historical photographs, coastal
maps and charts, high resolution satellite imagery and aerial photographs, beach surveys
and profiling, in situ geographic positioning system shorelines. Remote sensing studies
not only map temporal and spatial changes but also to retrospect changes. To date, the
most common shoreline detection technique has been subjective visual interpretation of
satellite data with the support of topographic data and digital image-processing
techniques. In addition to the shoreline change, other shoreline features indicator and
their spatial relationship relative to the physical land-water boundary help in improving
the quantitative shoreline changes and understanding their processes (NOAA, 2003).
2,Stub t4rea:
The coast from Bhimunipatnam to Gangavaram (Figure-l) has long and diverse
geomorphology such as residual hills (Inselbergs), coastal plains, pediments, paleo
channels, gully land, alluvial plain and natural levee etc. Other land forms include sea
cave, sea stack, lateric mounts, sandy beach, and marshes (Jagannadha Rao M., 2003).
The residential, agricultural land, coastal plantations, resorts, recreations and waste land
are the major land use patterns. The shoreline with rTOy beaches dispersed with rocky
hills indicate depositional environment. In a depositional environment, the coast is
characterised by coarse sediment along the offshore boundary of the shoal and finer
sediments adjacent to the coastline. This aspect clearly demonstrates that shoals
interacting with large waves reduce the energy of the incoming waves which results in
deposition of coarser sediment along the offshore boundary of the shoals. Finer clay
and slit carried in suspension by relatively low energy waves and deposit adjacent to the
coastline.
r
The study area is a micro tidal, wave dominated semidiurnal coast with mean spring tide
of 1.43m and neap tide of 0.54m,. It has significant wave height (HS) of 4.9 meter and
wind speed is 50m/s. The wave climate of this region varies during June to September
due to change wind direction due to shifting of SW to NE monsoon. The significant
wave height ranges from 1-3 during May to September, 0.5 to 2m during October to
December, remaining period it is less than 1.5 meters. The average wave period varies
from 9 to l2s for greater part of the year. The wave is predominantly from south during
March - September and from east during December to February. The wave direction is
transitional, shifting from south to east during October and November. Seasonal
currents measured up to 30 m depth are northerly during SW monsoon and southerly
during NE monsoon The annual net sediment transport at Visakhapatnam is northerly,
which is estimated as 0.94 xl06 m3/yr. (Sanil Kumar etat,2006).
The waves, wlich approach the coast are dissipated in friction on the beaches or
converted on/offshore and long shore currents to move the sediment. The sediment that
is transported along the coast, move with in a boundary zone called coastal cell.
Variable coastal orientation with in cell (shape between drift and a swash alignment,
swash alignment is the area, where coastal system little or no sediment input is
received) serves as diagnostic tool to the geomorphologist with an indication of the
amount and direction of sediment to cause shoreline change (Lawler. D. M., 2006). The
Gangavaram-Bhimunipatnam coast has four major coastal cells based on the sediment
transport patterns (Jphn Pethic, 2008) studied from OCM data (Figrtre-2). They are 1)
Bhimunipatnam 2) Uppada-Rishigonda, 3) Visakhapatnam 4) Gangavaram (Figure -3).
r1
3, gVletfiofofogy:
Firstly, the satellite data, the hydrographic chart and topographic maps are projected to
UTM under WGS-84 datum. Both low and high-resolution data (IRS-IDJP6,LISS-il,
IV and PAN) are co-registered, merged and resampled to S-meter resolution.
Geometrically rectified satellite data of 1998, 2001 , 20A3,2005 and 2008 are digitized
online for delineating shoreline at 1:10000 as contiguous boundary between land and
water and interpreting at 1:15,000 scales. In satellite data, the shoreline are distinct in
high wave length (REDAIIR) and other interpretation keys such as beach faces, berms,
sand spit, mouth and barrier bars and shoals, tidal flats and wetlands, salt encrustation
and coastal vegetation are used for confirmation.
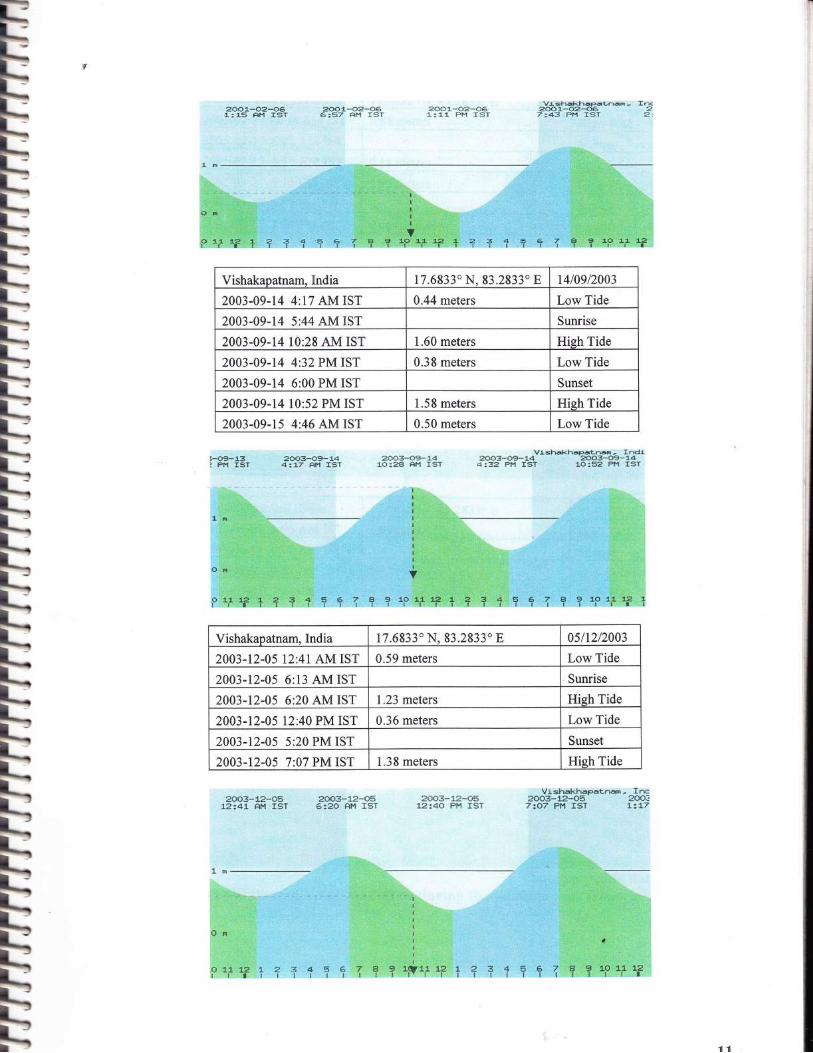
Satellite-derived shorelineslchanges from two data sets with different tidal conditions,
lowest in one data and highest tides in another data atthe time of pass can force error.
Therefore, a simple trigonometric solution is applied using High Tide Line (HTL) from
topographic map (Figure-a) corresponding highest hide tide level (HHTL) and mean sea
level (MSL) from hydrograph data (Table-l) from topography map (Appendix). This
method enables to fit corresponding inundation of shoreline during satellite pass
(Figure-5) with predicted tide from Xtide table (Figure-6) and compute relative error
percentage. In this method, a small variation with in low tides force unknown errors and
beach losses during monsoon are regained in summe4 therefore, different season data
also force errors. However, care is taken in selecting low tide data to minimise error. A
shoreline change above 25 % is taken as significant change. The result are further field
by taking sunmer beach profiling using Arc-GPS at low tide conditions and net change
over a decade (1998-200S) in each cell are computed and presented in following
sections.

!a!:titfrqt,ft;
F{#S*Et
ffi*}***
s'igure*I : Yi*hakap*tn*m*G*ng*y&r&m $h*r*lin*
$-ig*etr**3; Sediment dis*ributi*m along tk* Viskakapatrrnil* *#axg*ver&rffi t{pasf

D
I
t
t
t
il
I
Figure-3: Different Coastal Cells along Gangavaram-Bhimunipatnam Shoreline

Stu*y &r*a '.,Jl*le ,*f V Effi#,fu;t"l*effiffitrt ffit'T:
**ry
XfrimuniP*t**m Beach Fac* SamgflY&ram B*ach F***

F!h!l.!l-rh"h!l.rF!h!l-HEEEE
E
E
High ?id* lines$urs* S*l Tcpr*hs*t
Figurs*4l High Tide Lin*s {H"L} *f the Yirkakap*tn*$I C***t
TId*l ampl*tt*d* Ss high tid* Lin*
{*tkFilry
{*F
{t}nt*trrl
*r**T-nr+-Fil-#{t}
ffir***&r-
.&r*I ,jt&.$
**fiC*rd-hF
p
x.?s
tr.$
1"HS
1
*.?s
*.**.HS
*
tg$* m ffi
flS*t r*: {.:.;i:-z
ffiffi#m* ffitr*ffi# w' ffi"iitilii i :1 :' t:
I ti ):at !!. .: i. .
*g *t3ttt ?t st I x t t*t {*t *?t tst Ht I
FISII tld* disteffit* Im mry{ffiIt q
Figur* *5; 2* pl*t ef HTL Ys Inutrdxt**x dtrri*S $*t*Ilite pess
H3t

*.?fEt.E "*;ffffiffi- rncir
....,r{ g -_,,rr!d1Wg-11.; g ,.-'"' "- tBgtS'11;25l1E P!{,, IST, .;.':,,.--.,r,r::,1tIeG F}'l I
1999*aa*(}.1S::"3 stttl IST
1999-r.L-o42:?L f,H IgT
'..' i ' :, . :.:a.a:,
aa::.:a.:.-a.:.. .t : ,
..I.ffi;tL;?,9,4:Q8 fft{ ,IST
ttnit!t!it::,t,t,trltlt{t?,,?t{!,,{,tt+t!tt,t!ttt,tttttttttt!
195A-11-gg1S154 ffi.t IST
-ll*ffi.'PH gT
lishakapatn&ffi,India 17.6933o N, 93.2933o E a4ltUt9981998-l l-04 2:21 AM IST 0.24 meters Low Tide1998-l l-04 5:56 AM IST Sunrise1998-Il-04 8:13 AM IST 1.67 meters Hieh Tide1998-l l-04 10:49 AM IST Full Moon1998-l l-04 2:31 PM IST 0.08 meters Low Tide1998-11-04 5:23 PM IST Sunset1998-l t-04 8:47 PM IST 1.85 meters F{ieh Tide
Vishakhapatn&ffi, India 17.69330 N, 93.2933" E 29.11.lggg1998- ll-29 4:10 AM IST 1.30 meters F{ieh Tide1998-ll-29 6:09 AM IST Sunrise
1998-ll-29 10:54 AM IST 0.3I meters Low Tide1998- lL-29 5:18 PM IST 1.3 I meters High Tide1998-ll-29 5:20 PM IST Sunset
1998-ll-29 11:26 PM IST 0.52 meters Low Tide
Vishakhapatn dn,India 17 .68330 N, 93.29330 E 6-2.20012001-A2-06 1:15 AM IST 0.23 meters Low Tide2001-02-A6 6:27 AM IST Sunrise
2001-A2-06 6:57 AM IST I.A2 meters Hieh Tide2A0I-02-06 l:11 PM IST 0.01 meters Low Tide2001-02-A6 5:54 PM IST Sunset
2001-02-06 7:43 PM IST 1.37 meters High Tide
240\-02-07 2:06 AM IST 0.10 meters Low Tide
J
trC
tD
It
!3I
!
g{}sa;-oE;o61r 1-5 . itH ,IST
:,: :',,, ;, :':r rrr , :r'. r'!r, : u!lr-r:ir;r 1 r.r ,, :ti l::.. . l
gos1,-se*o66 *S7. fiH IST EQSr.*()8-06A:1I- FH IST
Vislrcrkt.rapsl1.no* -200r--02-G67:43 PI{ ISTIne*'2:
l;SBr:,a3.,t ,FM',.IST
..2$O *S9*5.44;17'*H',I57
2003-&?-1-41(}:28 *H fST
Lrl"r*hlrkhtrrrl*Lr.tiigt o'Inr*l?OO3-4}9-X4 :r 1,'1;,j1,.9.... ..':,,,EOS3-$?IA4.":,,
4 :38 P!'t I5T.,,,1 .'-t'-, A*,:5?.FH',. E ,'
VislmkhapaLnam - Inc2SO3*12-O5 20037:CI?r g'.'f,$Tr rr,' :
"''.',1,,,',f.'9,,317
20s3;12;{}5,'.]t2;41 RH IST,frffi$;12*SS6:E0rifil't IST
EOSS-18*S512*4O PH IST
Vishakapatnam, India 17 .68330 N, 93.29330 E 1410912003
2003-09-14 4:17 AM IST 0.44 meters Low Tide
2003-09-14 5:44 AM IST Sunrise
2003-09-14 10:28 AM IST 1.60 meters Hieh Tide
2003-09-14 4:32 PM IST 0.3 8 meters Low Tide
2AA3-A9-14 6:00 PM IST Sunset
2003-09-14 10:52 PM IST 1.58 meters Hieh Tide
2003-09-15 4:46 AM IST 0.50 meters Low Tide
Vishakpatnam, India 17 .68330 N, 83.28330 E 05/1212003
2003-12-05 12:41 AM IST 0.59 meters tr,ow Tide
2A03-12-05 6:13 AM IST' Sunrise
2003-12-05 6:20 AM IST 1.23 meters Hieh Tide
2003-12-05 12:40 PM IST 0.36 meters I-ow Tide
2003-12-05 5:20 PM IST Sunset
20A3-D-05 7:07 PM IST I .3 8 meters Hieh Tide

_ VishakhapreLrl&m - Inci2005-03-17 ?.005-r7 xO4 Fll',l I$T LE:46 $
ztlo5*03*176 t L8 ft1.'t f ST
EOOS*$3-171:15 tll',l IST
aoos-s3*171? t 14 fil,l IST
E
EEEIJljljlJE
EE
EEH
trlishrakhaeatnam - Inci*eooa-o1.-*I" 20*A-S1-Oj_3t24 PI.,l fST S:5S PH ISTgosE*s1.*s1fjsg CH rsr ECIOe-St-SI.
s tEe nF,r :-sr
"l
Vishakapatnam, India 17.69330 N, 93.29330 E 171031200s
2005-03-17 12:14 AM IST 0.86 meters F{igh Tide2005-03-17 6:03 AM IST Sunrise
2005-03-17 6:18 AM IST 0.18 meters Low Tide2005-03-17 1:15 PM IST 0.93 meters Flieh Tide2005-03-17 6:07 PM IST Sunset
2005-03-17 7:A4 PM IST 0.45 meters Low Tide2005-03-18 12:46 AM IST 0.73 meters Hieh Tide
2005-03-18 12:49 AM ISTF irst
Quarter
Vishakhapatn dn,India 17.69330 N, 93.29330 E 01/0112008
2008-01-01 2:06 AM IST 1.09 meters F{ieh Tide2008-01-01 6:27 ANd nST Sunrise
2008-01-01 8:32 AM IST 0.42 meters I-ow Tide2008-01-01 3:24 PM XST 1.03 meters F{ieh Tide2008-01-01 5:32 PM IST Sunset
2008-01-01 8:58 PM IST 0.66 meters Low Tide2008-01-02 3:02 AM IST 1.00 meters Hieh Tide
lfultl?iiitrl!{,.lEl# i'jllj.{ti:i:i:;{ti,{',ffifi
Souunce: Xtide dataFigure-6: Computation of Tidal conditions during the Satellite pass from predicted tide

{
6. Summarl an[ Conctu"rion:
Gangavaram-Visakhapatnam shoreline changes are studied in two stages, firstly decadal
changes on regional scale and secondly short- term changes at cell level with IRS-1D/P6,
LISS 11VIV and PAN merged and resampled data to 5 metres. Based on the sediment
transport boundaries, the study area is divided into four cells. Study of each cell is carried
out at an interval of nvo/three years in 10, 000 scales. The studies include coastal
morphology and shoreline changes and beach profiling. At each cell, the beach widtl4are
calculated for 1998-i001, 2001-03, 2003-05 and 2005-08 and compared with summer
2009 beach profiles. This helped to ascertain shoreline changes in the field with respect
to satellite derived shoreline. The overall accuracy of this investigation estimate around
75 to 85o/o with 5 meter resolution resampled data acquired during low tide provided
reasonably good details about significant locations of shoreline changes and associated
morphodynamics. The short term shoreline changes at each coastal cell are carried out.
The results show that over a decade, the regional shoreline changes follow the normal
long shore transport with the net sediment drift to the north. The estimated change in the
beach with computed in the satellite data at critical transects is as follows, SZYo in
southem Gangavaram Coastal cell, 30.84%in southem tip of RK beach, 17.69%o in
Bhimunipatnam and 5.98 % and 15.90 %o north and south Rishigonda respectively. In
Rishigonda coastal cell, at places, the beach has completely eroded (100%) Table-2) with
negligible recovery. However, shore-term changes are subjective of local activities such
as constructi"r,#"* port, cultivation of coastal plantations and amusement parks mostly
along Gangavaram and Nshigonda coast. The Bhimunipatnam beach (width) had
moderately decreased during 1998-2005, but recovered later in 2008. The southem RK
and northern Rishigonda bachgnrid,& have moderately decreased from 1998-2008. The
32

:--->
l
t>
-t>
lD
-
->
northern part of RK-beach remained stable than
beach in the south part of visakhapatnam port at
beach resorts and cultivation of vegetation.
southern part during ZA05-200g. The
Yerrada shows developments such as
-
t!
33