g automation systems nagement - dream report€¦ · bacnet ® lighting controls occupancy...
TRANSCRIPT

Dream Report
User Friendly & Programming Free ™
Reporting .
B
uild
ing
Au
tom
ati
on
Syste
ms
& F
acilit
ies M
an
ag
em
en
t
OCEAN DATA SYSTEMS The Art of Industrial Intelligence

Applications
Energy
Performance of
Buildings Directive
(EPBD)
Equipment
Monitoring
Performance &
Efficiency
Calculations
Security Reports
Energy Audits
Compliance
Reports
Maintenance
Reports
Energy Accounting
Department Billing
HVAC
LEED Rating
Green Buildings
BACnet ®
Lighting Controls
Occupancy
Accounting
Smart Buildings
Building
Automation
Systems (BAS)
Facilities
Management
Systems (FMS)
Utilities Mgmt.
Asset
Management
Building
Management
Systems (BMS)
Fire and Safety
Reporting
Fuel Accounting
Carbon Emissions
Renewable
Energy Accounting
Solar Energy
Wind Energy
Remote
Monitoring
Web Data Access
Mobile Access
Building Automation and Facilities Management
Ocean Data Systems Ltd. has created the ideal Report Generation
and Data Analysis solution for Building Automation Systems (BAS)
and Facilities Management. We know - our customers have told
us, guided us, and helped us perfect Dream Report for your most
demanding applications.
“Dream Report is designed for the BAS/BMS market
by the BAS/BMS market.”
We listened to your needs and we’ve addressed them head on.
Dream Report has all the tools required to monitor and deliver
reports on your facility and equipment performance. With Dream
Report installed, you’ll be able to demonstrate just how smart
your building can be.
Dream Report isn’t a combination of business tools augmented
with connectivity and automation to get by in these applications.
Dream Report is a “Purpose Built” software product by a company
that understands industry, your automation technologies, and
your need for 24x7x365 reliability.
Dream Report is the reporting and data analysis solution, perfectly
addressing the needs of this demanding vertical.
Typical Applications:
Energy Performance of Buildings Directive (EPBD) – The European
Union (EU) guidelines for building performance. The Directive
2002/91/EC, first published in 2002, requires all EU countries to
enhance their building regulations and introduce energy
certification processes for buildings. Dream Report is purpose built
to deliver the analysis and formatting of data to meet the intent of
the initial Directive and that of 2010/31/EU, an enhancement.
LEED EBOM-2009 EAc3.1: Performance Measurement - Building
Automation System Performance Management guidelines from
the US Green Building Council. Dream Report will interface with
all BAS and will format and deliver reports for performance and
maintenance purposes.
Equipment Performance Monitoring – Dream Report delivers the
statistics to calculate runtimes, on-times, off-times, duty-cycles
and evaluate operation against other variables. Is equipment
operation at expected levels for these ambient conditions or
current occupancy? Dream Report will let you know.
Energy Accounting – Dream Report knows how to analyze and
Dream Report by Ocean Data Systems Ltd. - The Art of Industrial Intelligence
totalize meter data, even after rollover conditions. Dream Report
is aware of fuels, BTU content and stoichiometric burning. Dream
Report can calculate building efficiencies and can calculate CO2
emissions.
Department or Tenant Reporting/Billing – The results of Dream
Report data analysis and custom formatting can be delivered to
any department or individual at any time and in many ways.
Equipment Maintenance – To be as cost effective as possible and
reduce the possibility of downtime, equipment should be
monitored, checked on a regular basis, and maintained based on
duty cycle. Dream Report delivers the math, logic and analysis to
generate maintenance reports and work orders for effective
management.
Security Reporting and Occupancy Tracking – With access to all
business systems, in addition to the basic building automation,
Dream Report can deliver reports of occupants and their
whereabouts.
Integrate with All Existing BAS/BMS/FMS
Unlike traditional business intelligence solutions, Dream Report
understands automation data. Dream Report understands the
structures that sources provide, data formats, time formats, alarm
and message formats, and intelligently works with them all. It can
even write the results back to your systems.
Dream Report integrates with every building automation system
through the over 60 interfaces including those for proprietary
interfaces, industry standards and business (IT) standards.
Connectivity typically includes access to Real-time, Alarm and
Historic Data.
Proprietary Interfaces - Specifically built for a particular product
or solution. Examples abound in Dream Report, and you can refer
to our driver list for current connectivity.
Industry Standards – These include BACnet®, MODBUS and Open
Protocols including OPC DA, OPC AE, and OPC HDA. These
standards provide connectivity to industrial automation and
BAS/BMS products and also enable the use of various other
interface solutions provided by third parties. If you have a specific
need, contact Ocean Data Systems for connectivity options.
Business Standards – Includes the unique ability to automatically
read and import Comma Separated Variable (CSV) and Microsoft
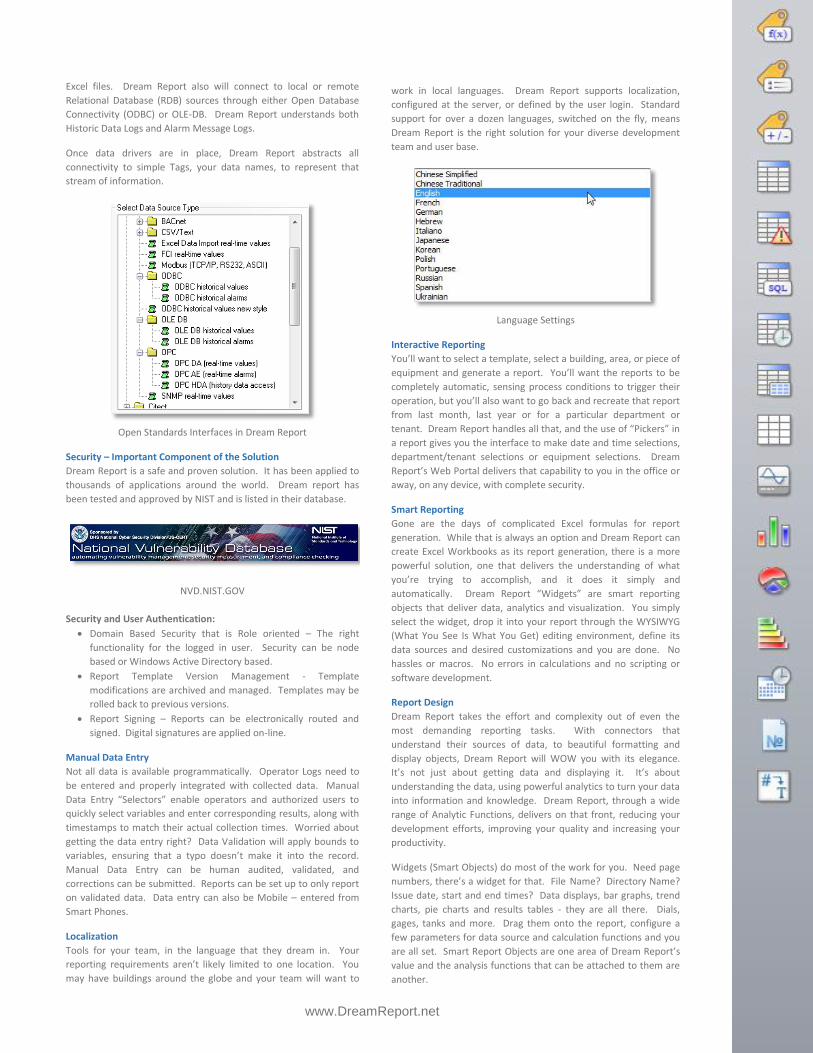
Excel files. Dream Report also will connect to local or remote
Relational Database (RDB) sources through either Open Database
Connectivity (ODBC) or OLE-DB. Dream Report understands both
Historic Data Logs and Alarm Message Logs.
Once data drivers are in place, Dream Report abstracts all
connectivity to simple Tags, your data names, to represent that
stream of information.
Open Standards Interfaces in Dream Report
Security – Important Component of the Solution
Dream Report is a safe and proven solution. It has been applied to
thousands of applications around the world. Dream report has
been tested and approved by NIST and is listed in their database.
NVD.NIST.GOV
Security and User Authentication:
Domain Based Security that is Role oriented – The right
functionality for the logged in user. Security can be node
based or Windows Active Directory based.
Report Template Version Management - Template
modifications are archived and managed. Templates may be
rolled back to previous versions.
Report Signing – Reports can be electronically routed and
signed. Digital signatures are applied on-line.
Manual Data Entry
Not all data is available programmatically. Operator Logs need to
be entered and properly integrated with collected data. Manual
Data Entry “Selectors” enable operators and authorized users to
quickly select variables and enter corresponding results, along with
timestamps to match their actual collection times. Worried about
getting the data entry right? Data Validation will apply bounds to
variables, ensuring that a typo doesn’t make it into the record.
Manual Data Entry can be human audited, validated, and
corrections can be submitted. Reports can be set up to only report
on validated data. Data entry can also be Mobile – entered from
Smart Phones.
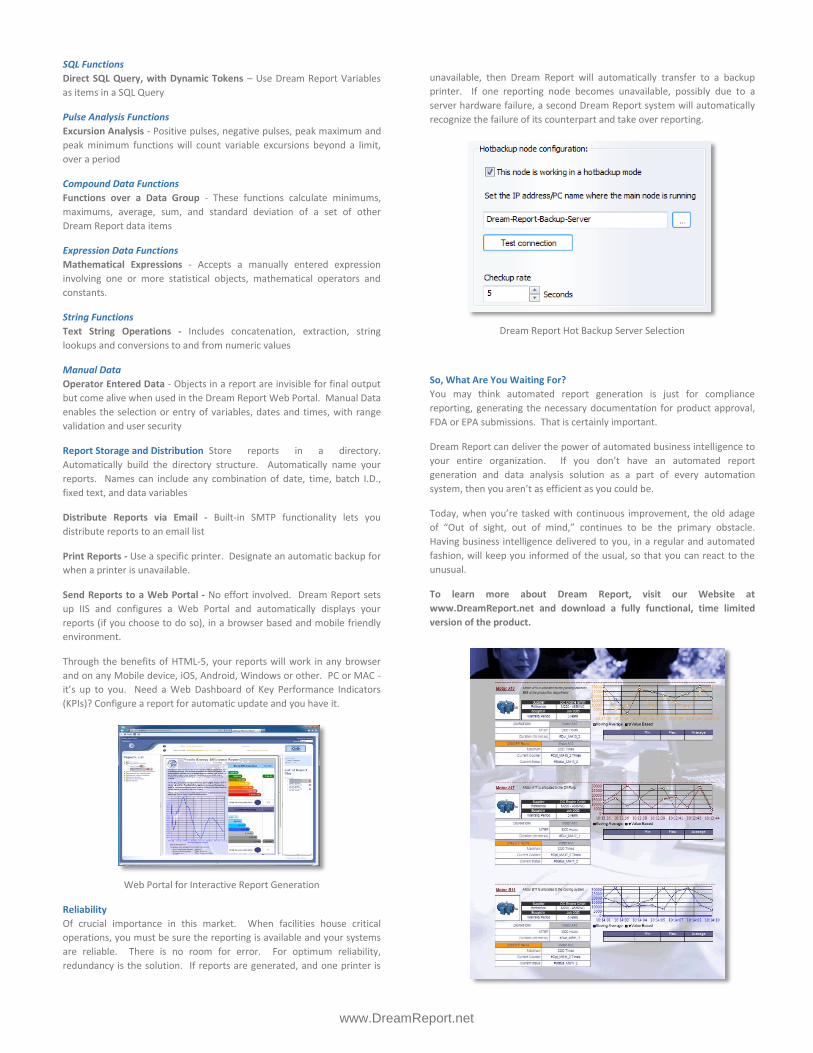
Localization
Tools for your team, in the language that they dream in. Your
reporting requirements aren’t likely limited to one location. You
may have buildings around the globe and your team will want to
work in local languages. Dream Report supports localization,
configured at the server, or defined by the user login. Standard
support for over a dozen languages, switched on the fly, means
Dream Report is the right solution for your diverse development
team and user base.
Language Settings
Interactive Reporting
You’ll want to select a template, select a building, area, or piece of
equipment and generate a report. You’ll want the reports to be
completely automatic, sensing process conditions to trigger their
operation, but you’ll also want to go back and recreate that report
from last month, last year or for a particular department or
tenant. Dream Report handles all that, and the use of “Pickers” in
a report gives you the interface to make date and time selections,
department/tenant selections or equipment selections. Dream
Report’s Web Portal delivers that capability to you in the office or
away, on any device, with complete security.
Smart Reporting
Gone are the days of complicated Excel formulas for report
generation. While that is always an option and Dream Report can
create Excel Workbooks as its report generation, there is a more
powerful solution, one that delivers the understanding of what
you’re trying to accomplish, and it does it simply and
automatically. Dream Report “Widgets” are smart reporting
objects that deliver data, analytics and visualization. You simply
select the widget, drop it into your report through the WYSIWYG
(What You See Is What You Get) editing environment, define its
data sources and desired customizations and you are done. No
hassles or macros. No errors in calculations and no scripting or
software development.
Report Design
Dream Report takes the effort and complexity out of even the
most demanding reporting tasks. With connectors that
understand their sources of data, to beautiful formatting and
display objects, Dream Report will WOW you with its elegance.
It’s not just about getting data and displaying it. It’s about
understanding the data, using powerful analytics to turn your data
into information and knowledge. Dream Report, through a wide
range of Analytic Functions, delivers on that front, reducing your
development efforts, improving your quality and increasing your
productivity.
Widgets (Smart Objects) do most of the work for you. Need page
numbers, there’s a widget for that. File Name? Directory Name?
Issue date, start and end times? Data displays, bar graphs, trend
charts, pie charts and results tables - they are all there. Dials,
gages, tanks and more. Drag them onto the report, configure a
few parameters for data source and calculation functions and you
are all set. Smart Report Objects are one area of Dream Report’s
value and the analysis functions that can be attached to them are
another.
www.DreamReport.net

The combination of purpose built calculation functions with visualization
objects create the world’s most sophisticated and easy to use solution
for reporting and data analysis for industrial applications. Gone are the
days of difficult scripting, macro development or the need for specialized
IT support.
Web Portal Display with Widgets
Dream Report Delivers a Complete Array of Statistical Functions
Dream Report Analytic functions understand their purpose. They have
been specially crafted to deliver the results you’re expecting, from the
data sets your automation systems are providing.
Simply Click for Function Selection
Calculation Functions
Value, Maximum, Minimum, Average, Sum, Standard Deviation,
Associated Timestamps
Logged Value Counter – How many times a value is encountered
Duration Interval – Calculates time a value was in a range
Counter or Period Totals – Last variable minus first variable and rollover
aware (for tracking energy meters & totalizers)
Advanced Functions
ON and OFF and Transition Counters – Delivers a count of variable
transitions
Running Time – Totalizes the time a variable was on
Down Time – Totalizes the time a variable was off
System Availability – Percentage of time for a specified period during
which a condition was met
Energy Management (Facility) Functions
Produced Energy – The heat energy produced by the consumption of
various fuels
Produced Emissions – The emissions byproducts from the consumption
of various fuels
Alarm Analysis Functions
Alarm Counters – Calculates the number of alarms, by filter, for a
specified period
Dream Report by Ocean Data Systems Ltd. - The Art of Industrial Intelligence
www.DreamReport.net
SQL Functions
Direct SQL Query, with Dynamic Tokens – Use Dream Report Variables
as items in a SQL Query
Pulse Analysis Functions
Excursion Analysis - Positive pulses, negative pulses, peak maximum and
peak minimum functions will count variable excursions beyond a limit,
over a period
Compound Data Functions
Functions over a Data Group - These functions calculate minimums,
maximums, average, sum, and standard deviation of a set of other
Dream Report data items
Expression Data Functions
Mathematical Expressions - Accepts a manually entered expression
involving one or more statistical objects, mathematical operators and
constants.
String Functions
Text String Operations - Includes concatenation, extraction, string
lookups and conversions to and from numeric values
Manual Data
Operator Entered Data - Objects in a report are invisible for final output
but come alive when used in the Dream Report Web Portal. Manual Data
enables the selection or entry of variables, dates and times, with range
validation and user security
Report Storage and Distribution Store reports in a directory.
Automatically build the directory structure. Automatically name your
reports. Names can include any combination of date, time, batch I.D.,
fixed text, and data variables
Distribute Reports via Email - Built-in SMTP functionality lets you
distribute reports to an email list
Print Reports - Use a specific printer. Designate an automatic backup for
when a printer is unavailable.
Send Reports to a Web Portal - No effort involved. Dream Report sets
up IIS and configures a Web Portal and automatically displays your
reports (if you choose to do so), in a browser based and mobile friendly
environment.
Through the benefits of HTML-5, your reports will work in any browser
and on any Mobile device, iOS, Android, Windows or other. PC or MAC -
it’s up to you. Need a Web Dashboard of Key Performance Indicators
(KPIs)? Configure a report for automatic update and you have it.
Web Portal for Interactive Report Generation
Reliability
Of crucial importance in this market. When facilities house critical
operations, you must be sure the reporting is available and your systems
are reliable. There is no room for error. For optimum reliability,
redundancy is the solution. If reports are generated, and one printer is
unavailable, then Dream Report will automatically transfer to a backup
printer. If one reporting node becomes unavailable, possibly due to a
server hardware failure, a second Dream Report system will automatically
recognize the failure of its counterpart and take over reporting.
Dream Report Hot Backup Server Selection
So, What Are You Waiting For?
You may think automated report generation is just for compliance
reporting, generating the necessary documentation for product approval,
FDA or EPA submissions. That is certainly important.
Dream Report can deliver the power of automated business intelligence to
your entire organization. If you don’t have an automated report
generation and data analysis solution as a part of every automation
system, then you aren’t as efficient as you could be.
Today, when you’re tasked with continuous improvement, the old adage
of “Out of sight, out of mind,” continues to be the primary obstacle.
Having business intelligence delivered to you, in a regular and automated
fashion, will keep you informed of the usual, so that you can react to the
unusual.
To learn more about Dream Report, visit our Website at
www.DreamReport.net and download a fully functional, time limited
version of the product.
https://lh3.googleusercontent.com/1hs1qNeZHNWio52Thm74FqGDeU0cEX-vFOMfrvB2XlGpdeLKmG5pEFQQ-vUXJAOhLg=s190
Dream Report by Ocean Data Systems Ltd. - The Art of Industrial Intelligence