g cowley poster day2015
DESCRIPTION
High-throughput RNA sequencing generates a global view of the transcriptome and provides unprecedented insights into gene structure. Novel sequencing techniques are being used to define gene architecture as well as relative gene expression levels. These approaches are being applied and compared in two unique filamentous fungi; Aspergillus nidulans and Mycelipthora thermophila.TRANSCRIPT
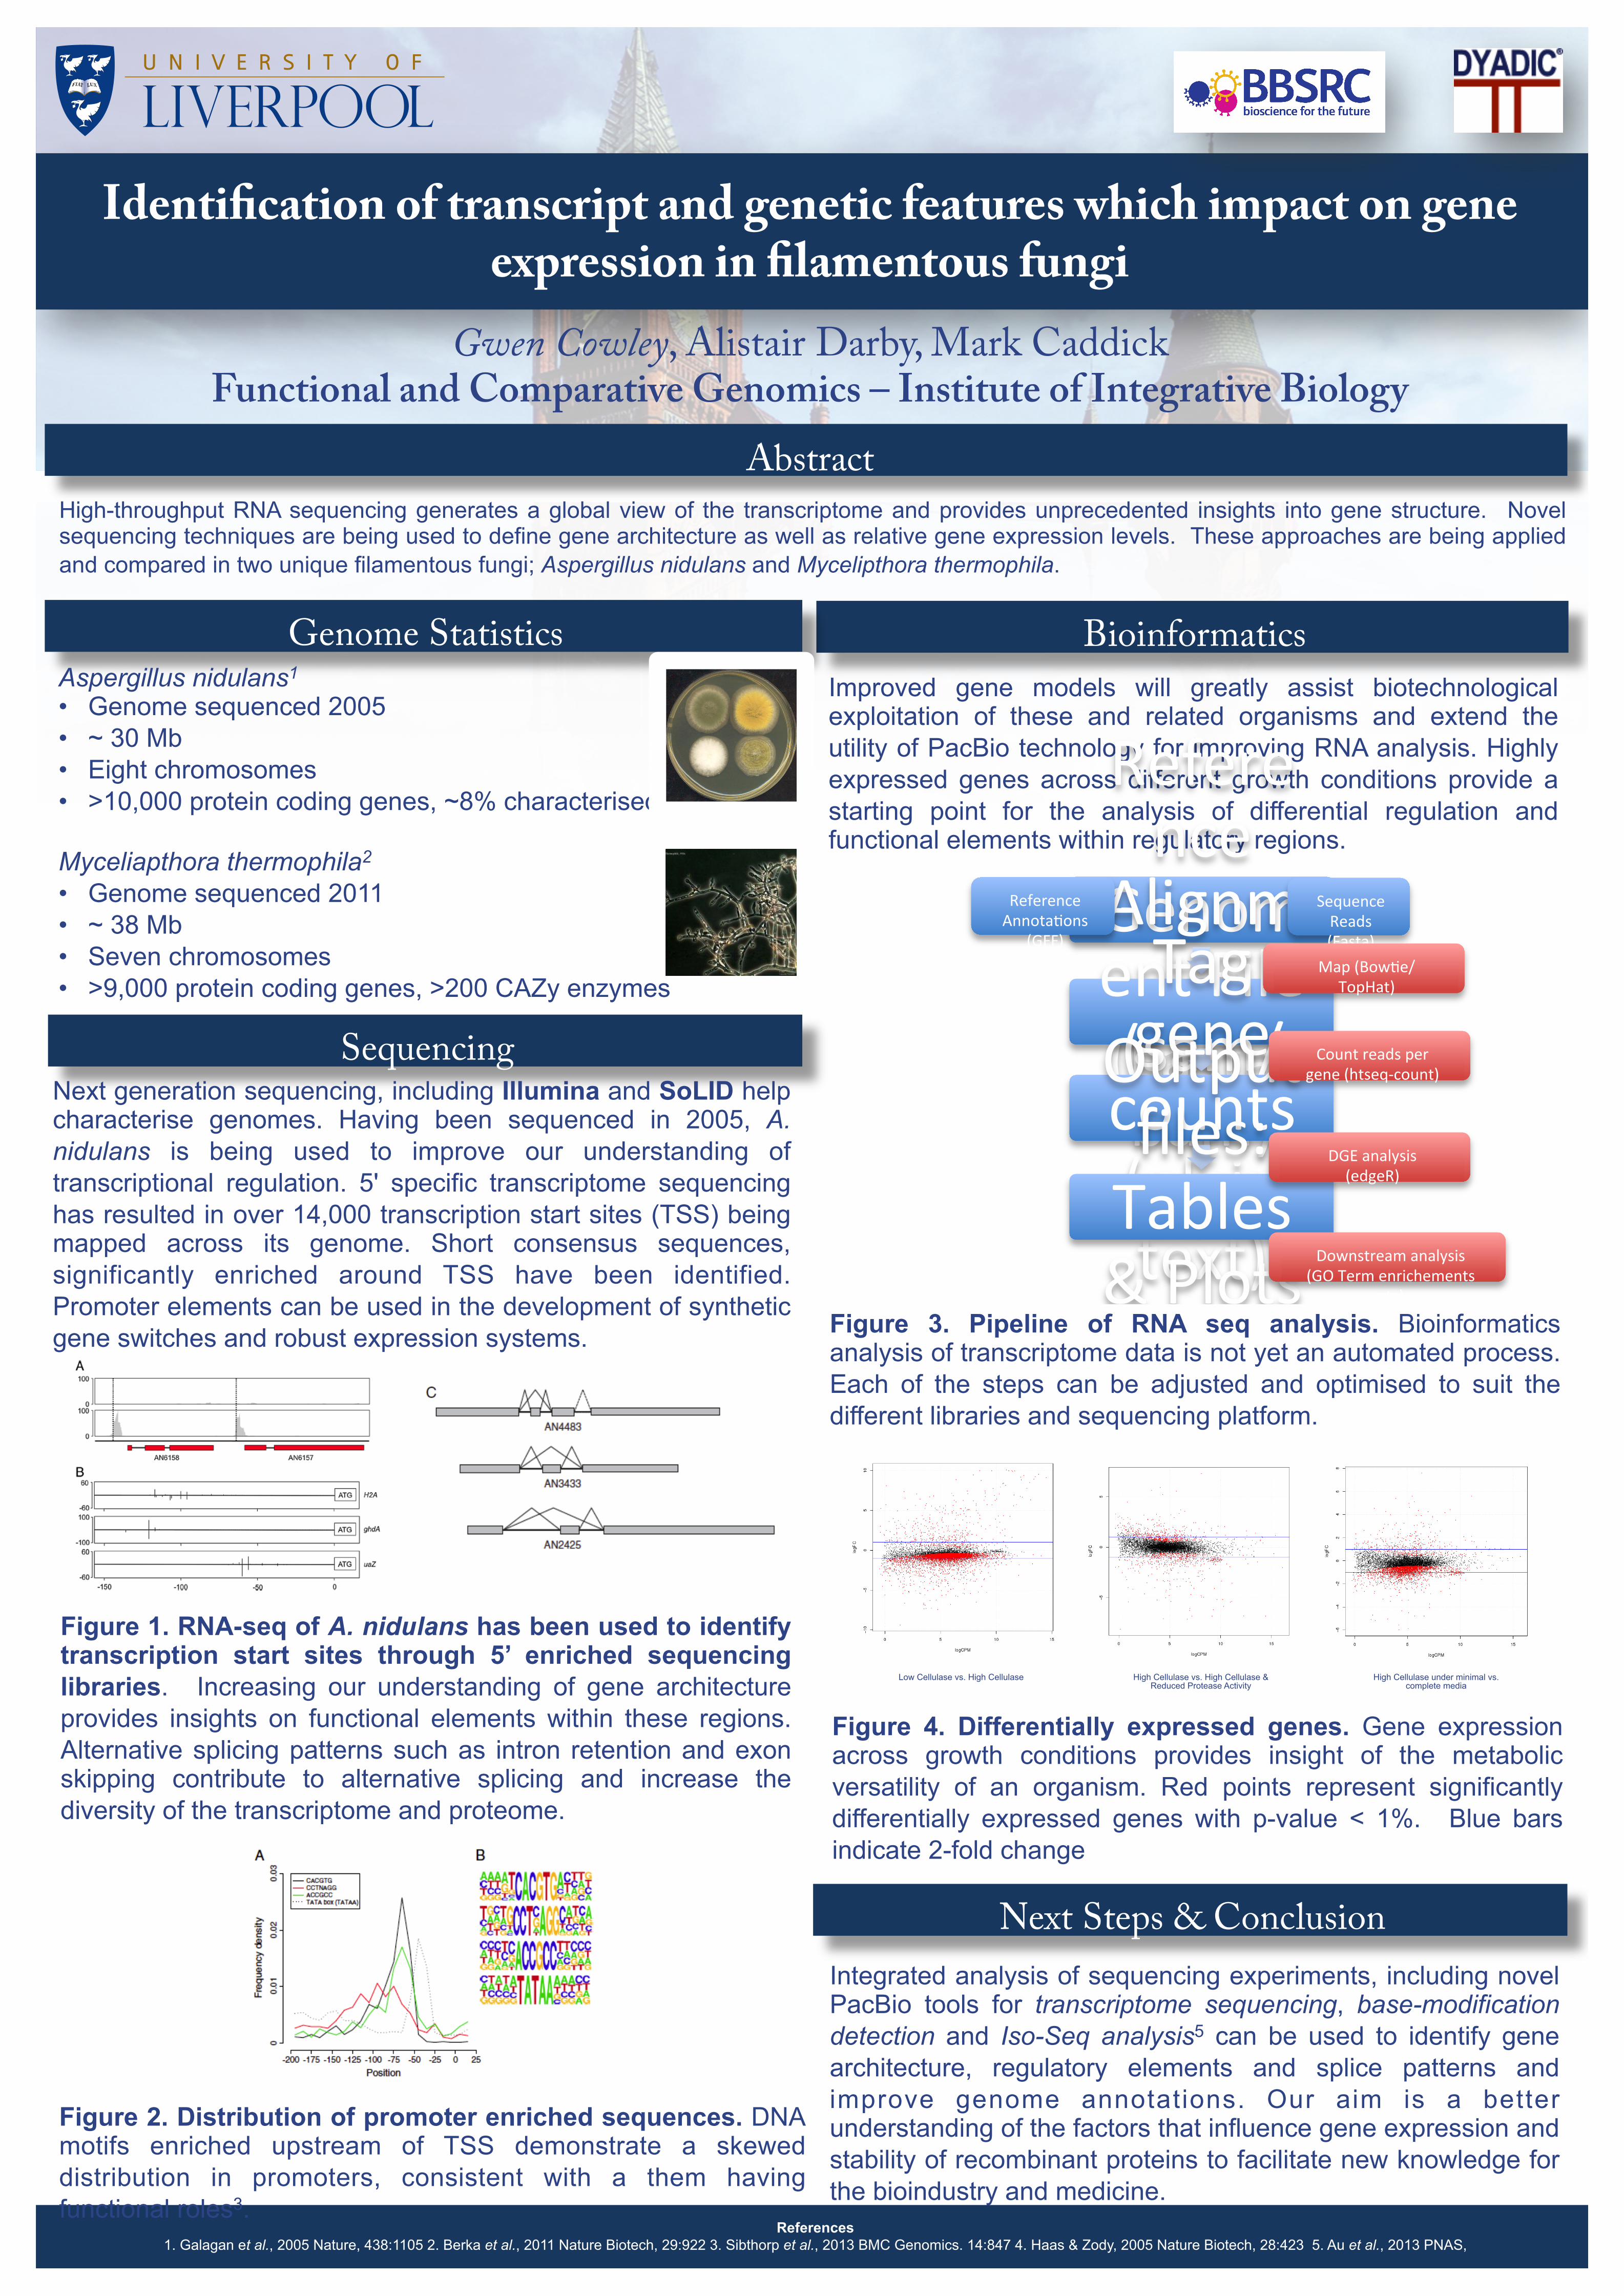
Identification of transcript and genetic features which impact on gene expression in filamentous fungi
Gwen Cowley, Alistair Darby, Mark Caddick Functional and Comparative Genomics – Institute of Integrative Biology
High-throughput RNA sequencing generates a global view of the transcriptome and provides unprecedented insights into gene structure. Novel sequencing techniques are being used to define gene architecture as well as relative gene expression levels. These approaches are being applied and compared in two unique filamentous fungi; Aspergillus nidulans and Mycelipthora thermophila.
Abstract
Sequencing Next generation sequencing, including Illumina and SoLID help characterise genomes. Having been sequenced in 2005, A. nidulans is being used to improve our understanding of transcriptional regulation. 5' specific transcriptome sequencing has resulted in over 14,000 transcription start sites (TSS) being mapped across its genome. Short consensus sequences, significantly enriched around TSS have been identified. Promoter elements can be used in the development of synthetic gene switches and robust expression systems.
Bioinformatics
Figure 1. RNA-seq of A. nidulans has been used to identify transcription start sites through 5’ enriched sequencing libraries. Increasing our understanding of gene architecture provides insights on functional elements within these regions. Alternative splicing patterns such as intron retention and exon skipping contribute to alternative splicing and increase the diversity of the transcriptome and proteome.
Genome Statistics Aspergillus nidulans1 • Genome sequenced 2005 • ~ 30 Mb • Eight chromosomes • >10,000 protein coding genes, ~8% characterised Myceliapthora thermophila2 • Genome sequenced 2011 • ~ 38 Mb • Seven chromosomes • >9,000 protein coding genes, >200 CAZy enzymes
Next Steps & Conclusion Integrated analysis of sequencing experiments, including novel PacBio tools for transcriptome sequencing, base-modification detection and Iso-Seq analysis5 can be used to identify gene architecture, regulatory elements and splice patterns and improve genome annotations. Our aim is a better understanding of the factors that influence gene expression and stability of recombinant proteins to facilitate new knowledge for the bioindustry and medicine.
Figure 4. Differentially expressed genes. Gene expression across growth conditions provides insight of the metabolic versatility of an organism. Red points represent significantly differentially expressed genes with p-value < 1%. Blue bars indicate 2-fold change
References 1. Galagan et al., 2005 Nature, 438:1105 2. Berka et al., 2011 Nature Biotech, 29:922 3. Sibthorp et al., 2013 BMC Genomics. 14:847 4. Haas & Zody, 2005 Nature Biotech, 28:423 5. Au et al., 2013 PNAS,
Improved gene models will greatly assist biotechnological exploitation of these and related organisms and extend the utility of PacBio technology for improving RNA analysis. Highly expressed genes across different growth conditions provide a starting point for the analysis of differential regulation and functional elements within regulatory regions.
Figure 2. Distribution of promoter enriched sequences. DNA motifs enriched upstream of TSS demonstrate a skewed distribution in promoters, consistent with a them having functional roles3.
Low Cellulase vs. High Cellulase High Cellulase vs. High Cellulase & Reduced Protease Activity
High Cellulase under minimal vs. complete media
Reference
Genome
(Fasta)
Alignment File (sam/bam)
Tag gene counts (plain text)
Output files: Tables & Plots of DGE
Sequence Reads (Fasta)
Reference AnnotaEons
(GFF) Map (BowEe/
TopHat)
Count reads per gene (htseq-‐count)
DGE analysis (edgeR)
Downstream analysis (GO Term enrichements
etc) Figure 3. Pipeline of RNA seq analysis. Bioinformatics
analysis of transcriptome data is not yet an automated process. Each of the steps can be adjusted and optimised to suit the different libraries and sequencing platform.