g eorgia mi lesto ne s - georgia department of education · g eorgia mi lesto ne s ... features of...
TRANSCRIPT
End-of-Course (EOC) Interpretive Guide for Score Reports
GeorgiaMilestones
For Use with Score Reports from Winter 2014–Fall 2015 Administrations
Georgia Department of Education 2015 All Rights Reserved
Copyright © 2015 by Georgia Department of Education. All rights reserved.
Information about Georgia’s testing programs can be found at testing.gadoe.org.
iCopyright © 2015 by Georgia Department of Education. All rights reserved.
Table of Contents
PURPOSE OF THIS GUIDE .............................................................................................................................1
BACKGROUND OF THE GEORGIA MILESTONES .......................................................................................1
EOC Administrations.............................................................................................................................1
Using the EOC Assessment as a Final Exam .......................................................................................2
Courses Assessed ................................................................................................................................2
Alignment to Standards ........................................................................................................................2
End-of-Course Test Contents ...............................................................................................................2
Format of Georgia Milestones Assessments ........................................................................................3
KEY TERMS .....................................................................................................................................................3
Accommodations ..................................................................................................................................3
Achievement Level ................................................................................................................................4
Achievement Level Descriptor (ALD) ....................................................................................................4
Administration Type ..............................................................................................................................4
Criterion-Referenced Test .....................................................................................................................5
Domain ..................................................................................................................................................5
Grade Conversion Score (GCS) ............................................................................................................5
GTID ......................................................................................................................................................5
Lexile® ...................................................................................................................................................5
Lexile® Range ........................................................................................................................................5
Lexile “Stretch” Bands ..........................................................................................................................5
Mean Scale Score .................................................................................................................................5
Norm-Referenced Scores .....................................................................................................................6
Scale Score ...........................................................................................................................................6
Standard Deviation ...............................................................................................................................6
Standard Error of Measurement (SEM) .................................................................................................6
Test Form ..............................................................................................................................................7
GENERAL GUIDELINES FOR SCORE INTERPRETATION ...........................................................................7
Understanding the Use of Scale Scores ...............................................................................................7
Scale Scores and Achievement Levels .................................................................................................8
Grade Conversion Score ......................................................................................................................8
Standard Error of Measurement ...........................................................................................................9
Students Not Receiving Scale Scores ................................................................................................10
Students With Conditional Scale Scores ............................................................................................10
Interpreting Lexile Measures ...............................................................................................................11
Interpreting Domain Level Information................................................................................................13
Interpreting Group Data in Summary Reports ....................................................................................14

iiCopyright © 2015 by Georgia Department of Education. All rights reserved.
GEORGIA MILESTONES SAMPLE REPORTS WITH ANNOTATIONS........................................................15
Individual Student Reports .................................................................................................................16
Sample Individual Student Report (Ninth Grade Literature and Composition example) ....................18
Sample Individual Student Report (United States History example) ..................................................20
Student Labels ....................................................................................................................................22
Sample Student Labels (Ninth Grade Literature and Composition and United States History examples) ........................................................................................................23
Class Roster Reports ..........................................................................................................................24
Sample Class Roster Report (Ninth Grade Literature and Composition example) .............................26
Sample Class Roster Report (United States History example) ...........................................................28
Content Area Summary Reports .........................................................................................................30
Sample School Content Area Summary Report (Ninth Grade Literature and Composition example) ...........................................................................33
Sample System Content Area Summary Report (United States History example).............................35
Summary Reports of All Student Populations ....................................................................................37
Sample State Summary Report (United States History example) ......................................................38
Table of Contents
1Copyright © 2015 by Georgia Department of Education. All rights reserved.
PURPOSE OF THIS GUIDEThe purpose of this guide is to provide essential information to help various stakeholders interpret reports, scores, and data related to the Georgia Milestones End-of-Course (EOC) Assessments. The primary users of this guide are educators as well as parents. This guide should assist all stakeholders in understanding how to interpret and use the various scores for improving student attainment of the knowledge and skills assessed. This guide details the Individual Student Report and various reports created primarily for system and school staff use in evaluating student learning and making decisions about improving instruction.
This guide is organized into four sections: Background of the Georgia Milestones, Key Terms, General Guidelines for Score Interpretation, and Georgia Milestones Sample Reports with Annotations.
BACKGROUND OF THE GEORGIA MILESTONESThe Georgia Milestones Assessment System (Georgia Milestones) is a comprehensive summative assessment program that spans grades three through high school. Georgia Milestones measures how well students have learned the knowledge and skills outlined in the state-adopted content standards in English language arts (ELA), mathematics, science, and social studies. Georgia Milestones is designed to provide students with critical information about their own achievement and readiness for their next level of learning—be it the next grade, the next course, or endeavor (college or career). Informing parents, educators, and the public about how well students are learning important content is an essential aspect of any educational assessment and accountability system. Parents, the public, and policy makers, including local school districts and boards of education, can use the results as a barometer of the quality of educational opportunity provided throughout the state of Georgia. As such, Georgia Milestones serves as a key component of the state’s accountability system—the College and Career Ready Performance Index (CCRPI).
Students in grades 3 through 8 take an End-of-Grade (EOG) assessment in each content area, while students enrolled in any of the eight courses designated by the State Board of Education take an EOC assessment.
Features of the Georgia Milestones Assessment System include:
• open-ended (constructed-response) items in English language arts and mathematics (all grades and courses);
• a writing component (in response to passages read by students) at every grade level and course within the English language arts assessment;
• norm-referenced items in all content areas and courses, to complement the criterion-referenced information and to provide a national comparison; and
• transition to online administration over time, with online administration considered the primary mode of administration and paper-and-pencil as back-up until the transition is complete.
The remainder of this section will focus on Georgia Milestones EOC assessments.
EOC AdministrationsThe EOC assessment has three primary test administration windows: winter, spring, and summer. There are also mid-month windows for online administrations given in August, September, October, November, February, and March. Based on their local school calendar, each school district selects their local test dates from within the state-designated test administration window.
2Copyright © 2015 by Georgia Department of Education. All rights reserved.
Using the EOC Assessment as a Final ExamAny student enrolled in an EOC course, regardless of grade level, is assessed at the completion of the course. This includes middle school students who are enrolled in one or more high school courses associated with an EOC assessment. The EOC assessment is given as a final exam and the score is part of the student’s final grade in the course. The student’s final grade in an EOC course is calculated using a formula that includes course work as 80 percent and the EOC score as the remaining 20 percent. These percentages for course work and the EOC score were approved by the State Board of Education. The final course grade must be a 70 or higher to pass the course and receive credit towards graduation. For more information about the passing score rule and graduation requirements, see State Board Rules 160-4-2-.48 and 160-4-2-.13.
Courses AssessedThe State Board of Education is required by Georgia law (O.C.G.A. §20-2-281) to adopt assessments designed to measure student achievement relative to the knowledge and skills set forth in the state-adopted content standards. In 2014-2015, the Georgia Milestones EOC program assessed the following eight courses, as designated by the State Board of Education. The EOC assessments serve as the final exam in these courses. The courses are:
English Language Arts • Ninth Grade Literature and Composition • American Literature and Composition
Mathematics • Coordinate Algebra • Analytic Geometry
Science • Biology • Physical Science
Social Studies • United States History • Economics/Business/Free Enterprise
Alignment to StandardsThe test items on Georgia Milestones are aligned to the Georgia academic standards for each course. The content standards describe what a student is expected to know and do. The Georgia Milestones test items have been written to assess the content knowledge and skills that are described in the academic content standards. During the item development process, Georgia educators review the items to ensure there is a match between the items and standards. Links to the academic standards and support documents are available on the Georgia Department of Education website at https://www.georgiastandards.org/Pages/default.aspx.
End-of-Course Test ContentsThe contents of the EOC assessments are outlined in the test blueprints which are designed to communicate the structure of the Georgia Milestones assessments. The blueprints outline the types of items students will encounter on each course test, as well as the number of items and number of points possible. The blueprints also outline the domains, which are reporting categories based on groupings of related content standards. The standards assessed in each domain and the approximate percentage of points allocated to each domain are also provided. EOC test blueprints can be found at: https://www.gadoe.org/Curriculum-Instruction-and-Assessment/Assessment/Pages/Georgia-Milestones-Test-Blueprints.aspx.
3Copyright © 2015 by Georgia Department of Education. All rights reserved.
Format of Georgia Milestones AssessmentsGeorgia Milestones assessments are administered in both paper-and-pencil and online formats. Georgia Milestones will transition over time to become primarily an online test. Online is considered the primary mode of testing, with paper-and-pencil available as backup until the transition is complete.
Beginning in 2014 –2015, the EOC assessments incorporated new item types. In addition to selected response items (i.e., multiple choice), ELA and mathematics now have constructed-response items, extended constructed-response items, and extended writing-response items. In future years, technology-enhanced items will be field tested and incorporated into the assessments. Science and social studies consist only of selected-response items at this time.
A selected-response item, sometimes called a multiple-choice item, is a question, problem, or statement that is followed by four answer choices. These questions are worth one point. Science and social studies EOC assessments only include selected-response items.
A constructed-response item asks a question and students provide a response that they construct on their own. These questions are worth two points. Partial credit may be awarded if part of the response is correct. ELA and mathematics EOC assessments contain constructed-response items.
An extended constructed-response item is a specific type of constructed-response item that requires a longer, more detailed response. These items are worth four points. Partial credit may be awarded. ELA and mathematics EOC assessments contain extended constructed-response items. The narrative writing response in ELA is this four-point item.
The extended writing-response item is found on the ELA EOC assessments and comprises section three of the test. Students are expected to produce an argument or develop an informative or explanatory response based on information read in two passages. There are three selected-response items and one two-point constructed-response item to help focus the students’ thoughts on the passages and to prepare them for the actual writing task. The extended writing-response task is scored on a seven-point scale: four points for idea development, organization, and coherence, and three points for language usage and conventions.
KEY TERMS
AccommodationsAccommodations are changes in a test administration that assist an eligible student in accessing the assessment and are only available to those students who have a documented disability or are classified as an English Learner (EL). The accommodations allowed on the EOC assessments are grouped into four broad categories: Presentation, Response, Setting, and Scheduling. Accommodations do not change what the assessment is designed to measure, nor do they dilute the meaning of the resulting scores. Accommodations are designed to provide equity, not advantage, and serve to level the playing field for students who are eligible due to their disability and/or level of English language proficiency. When used appropriately, they reduce or even eliminate the effects of a student’s disability or limited language proficiency. They do not, however, reduce learning expectations.
An accommodation is an alteration in the administration of an assessment that allows students to participate meaningfully in the assessment process. Appropriate accommodations should be clearly determined by a student’s Individualized Education Program (IEP) team, a Section 504 Individual Accommodation Plan (IAP) Committee, or an English Learner/Test Participation Committee (EL/TPC). The accommodations used by a student on a test must be consistent with the instructional and classroom assessment accommodations he or she is provided and must meet the criteria of state-approved accommodations.
4Copyright © 2015 by Georgia Department of Education. All rights reserved.
There are two types of accommodations:
• Standard Accommodations provide access to the assessment without altering the construct measured by the assessment.
• Conditional Accommodations are more expansive accommodations that provide access for students with more severe disabilities who would not be able to access the assessment without such assistance. Conditional accommodations may only be provided to a limited number of students who meet specific eligibility criteria. A test score for a student provided such an accommodation(s) must be interpreted in light of the accommodation given.
The type of accommodation provided to a student determines the administration type (see below). For more information on accommodations, see the Student Assessment Handbook and the Accommodations Manual (both posted annually on the Georgia Department of Education’s website at www.gadoe.org/Curriculum-Instruction-and-Assessment/Assessment/Pages/Information-For-Educators.aspx).
Achievement LevelAn achievement level refers to a range of scores that defines a specific level of achievement, as articulated in the Achievement Level Descriptors (ALDs). There are four achievement levels for each EOC assessment: Beginning Learner, Developing Learner, Proficient Learner, and Distinguished Learner. Links to the ALDs and support documentation are available on the Georgia Department of Education website at www.gadoe.org/Curriculum-Instruction-and-Assessment/Assessment/Pages/Georgia-Milestones-ALD.aspx.
Achievement Level Descriptor (ALD)An achievement level descriptor (ALD) is a verbal statement describing each achievement level in terms of what the student has learned and is able to do. A condensed version of the ALDs is provided for parents in the Individual Student Report. More detailed versions of the ALDs and resources are available on the Georgia Department of Education website at www.gadoe.org/Curriculum-Instruction-and-Assessment/Assessment/Pages/Georgia-Milestones-ALD.aspx.
Administration TypeAdministration type refers to the testing conditions under which a given student participates in an assessment. As required by federal and state law, all students must participate in a state’s annual assessment that is based on its adopted content standards. As previously stated, students with disabilities (including those with Section 504 plans) and ELs may be eligible for accommodations that allow them to participate meaningfully in an assessment. Based on the accommodation type, the administration type for these students would be classified as one of the following:
• Standard Administration refers to testing conditions in which the procedures and directions prescribed in the administration manual are followed exactly. This includes administrations where students are provided standard accommodations, such as testing in a small-group setting or using large-print materials.
• Conditional Administration refers to any testing conditions in which conditional accommodations are provided. Because conditional accommodations may begin to encroach on what the test measures, caution must be exercised when determining whether a student requires such accommodations to access the test. Test results for students who receive such accommodations must be interpreted in light of the conditional administration(s).
5Copyright © 2015 by Georgia Department of Education. All rights reserved.
Criterion-Referenced TestA criterion-referenced test is designed to provide information about how well a student has mastered the state-adopted content standards within a course. It allows its users to make score interpretations of a student’s performance in relation to a specified performance standard or criteria, rather than in comparison to the performances of other test takers. Georgia Milestones is a criterion-referenced test.
DomainA domain is a group of related content standards within a course. Providing information at the domain level helps educators determine the relative strengths and weaknesses of individual students and their classes as a whole. The number of domains on an EOC assessment varies by course (see page 13 of this guide).
Grade Conversion Score (GCS)A grade conversion score (GCS) is a transformation of the Georgia Milestones scale score to a number between 0 and 100. Since the EOC assessment is used as the final exam for a course, the GCS provides a score on the typical 0 to 100 grade scale.
GTIDThe Georgia Test Identifier (GTID) is the unique number assigned to each student that identifies the student throughout his/her public education years in the Georgia public school system.
Lexile® A Lexile, sometimes called a Lexile measure, is a standard score that matches a student’s reading ability with the difficulty of textual material. Lexile scores are used to match readers with texts of appropriate difficulty levels. Students in grades 1 through 12 typically score in a range from Beginning Reader (BR) to 1600L. Because the text complexity on the Georgia Milestones reflects the more rigorous expectations of the state-adopted content standards addressing reading skills, the highest Lexile possible on the Ninth Grade Literature and Composition EOC assessment is 1725L, and for the American Literature and Composition EOC assessment, it is 1800L. More information about Lexiles can be found on page 11 of this guide or at http://www.gadoe.org/Curriculum-Instruction-and-Assessment/Assessment/Pages/Lexile-Framework.aspx.
Lexile® RangeA student’s Lexile score is used to determine his or her Lexile range; a full Lexile range can be used to select reading material for the classroom and at home. On a student’s Individual Student Report (ISR), three books are identified as falling into the leisure range, and three books are identified as falling into the motivating challenge range. The leisure range represents the easiest kind of reading material that is appropriate for the student and can be found by subtracting 100L from the student’s Lexile measure. The motivating range represents the most difficult level of material the student can read successfully and is found by adding 50L to the student’s Lexile measure.
Lexile “Stretch” BandsLexile “stretch” bands are ranges of Lexiles by grade/course that indicate the text complexity students should be reading to be on the pathway to be college or career ready upon high school graduation. More information about Lexile “stretch” bands can be found on page 12 of this guide or at http://www.gadoe.org/Curriculum-Instruction-and-Assessment/Assessment/Pages/Lexile-Framework.aspx.
Mean Scale ScoreThe mean is the arithmetic average of a set of scale scores. The mean scale score is found by adding all the scale scores in a given distribution and dividing that sum by the total number of scale scores.
6Copyright © 2015 by Georgia Department of Education. All rights reserved.
Norm-Referenced ScoresEach Georgia Milestones assessment includes a subset of 20 items from the TerraNova, a norm-referenced achievement test (updated in 2011), in order to provide some information about student performance compared to other students nationally. This type of standardized assessment allows for the interpretation of the test score in relation to a specified national reference group, usually others of the same grade and age.
All 20 TerraNova items contribute to a student’s norm-referenced score. However, only those TerraNova items (10 or fewer items depending on the specific EOC assessment) that align to state content standards (as determined by Georgia educators) serve a dual purpose by also contributing to the Georgia Milestones score.
The following terms are related to norm-referenced tests.
• National Percentile Ranks range from 1 to 99 and are commonly used for reporting test results to students and their parents and/or guardians. A percentile may be interpreted as the percentage of students in a national sample whose scores fall below a given student’s scale score. For example, if a student’s scale score converts to a national percentile rank (NP) of 71, the student scored higher than approximately 71 percent of the students in the national norm group. Note that NPs cannot be averaged. Given that the norm-referenced score is based only on a subset of 20 items, there is no direct correspondence between a student’s national percentile rank and his/her Georgia Milestones scale score. Thus, two students receiving the same Georgia Milestones scale score on the same EOC assessment could actually have different national percentile ranks.
• National Percentile Range indicates where a student’s true percentile ranking likely falls. For example, if a student scored a NP of 64 and the national percentile range is 54–74, it is likely that if the student were to take the test again, he/she would be expected to obtain a national percentile rank between the 54th and 74th percentile.
• Normal Curve Equivalent (NCE) Scores range from 1 to 99 and measure where a student falls along the normal curve distribution. The NCE scale coincides with the percentile rank scale at 1, 50, and 99. Unlike percentile ranks, the NCE is an equal-interval scale, meaning that the difference between two successive scores on the scale has the same meaning throughout the scale. Therefore, NCE scores can be averaged across students to calculate a mean NCE score for a class, school, system, or state.
Scale ScoreA scale score is a mathematical transformation of the total number of points earned (i.e., the raw score). Scale scores provide a uniform metric for interpreting and comparing scores within each course.
Standard DeviationThe standard deviation is a measure of the variability or dispersion of a distribution of scores that represents the average difference between individual scores and the mean. The more the scores cluster around the mean, the smaller the standard deviation.
Standard Error of Measurement (SEM)The standard error of measurement (SEM) is the amount a student’s observed score (the score the student actually receives on the test) may vary from his or her “true” score, based on the reliability of the test. More information about the SEM can be found on page 9 of this guide.
7Copyright © 2015 by Georgia Department of Education. All rights reserved.
Test FormMultiple versions of tests are developed for each course of the Georgia Milestones Assessment. These alternate tests, referred to as parallel test forms, are designed to be as similar as possible in terms of test specifications and statistical criteria. Although test forms may differ slightly in difficulty, tests are equated through a statistical process so that scale scores are equivalent across test forms within the same course and can be compared across administrations.
GENERAL GUIDELINES FOR SCORE INTERPRETATIONThis section provides general guidelines for interpreting various scores generated from the Georgia Milestones EOC assessment. Educators are advised to help parents understand the various components of the Individual Student Report. Particularly, the focus should be to help parents understand their child’s individual strengths and weaknesses in relation to the expectations of the state-adopted content standards. School and system staff should use the various school, system, and state summary reports to understand the strengths and weaknesses of the school’s or system’s curriculum and instruction. In general, score interpretation should focus on how well students have learned the skills and knowledge outlined in the state-adopted standards and incorporate other evidence of student learning.
Understanding the Use of Scale ScoresIn order for different stakeholders (Georgia, systems, schools, parents, etc.) to make consistent and accurate decisions based on assessment results, the scores reported from assessments need to be comparable—that is, scores must carry the same meaning regardless of which form was administered. The use of scale scores to report student performance makes this possible and has distinct advantages over other methods such as raw scores and proportion-correct information.
Creating scale scores is analogous to converting currency from different countries to US dollars in order to report the relative value of different currencies. For example, scores for the SAT, the widely-used college entrance exam, are reported on a scale ranging from 200 to 800. Student raw score performance on the SAT is converted to the reporting scales in order to take into account any differences between the various forms of the SAT that are administered.
A new scale of measurement was developed to report student performance on the Georgia Milestones assessments. Scores on all Georgia Milestones reports are expressed as scale scores. The scale score reported for each EOC assessment is derived by converting the total number of points earned on the test (i.e., the raw score) to the Georgia Milestones scale for each particular EOC assessment. Scale scores are comparable across all test forms and administrations for the same EOC assessment. For example, a scale score of 525 on the American Literature and Composition EOC assessment from one form of the test, or from one administration, indicates the same examinee ability as a score of 525 from any other form or administration of the American Literature and Composition EOC assessment. Each time a test is administered, a new form of that test has been equated with previously administered forms to adjust for differences in difficulty, and the scores on the different forms share the same reporting scale. Scale scores are not comparable across different EOC assessments. Thus, a scale score of 525 on the American Literature and Composition EOC assessment does not indicate the same level of ability as a scale score of 525 on the Ninth Grade Literature and Composition EOC assessment or the United States History EOC assessment.
8Copyright © 2015 by Georgia Department of Education. All rights reserved.
Scale Scores and Achievement LevelsTo provide more meaning to an assessment’s scaling system, achievement levels are established. A process known as standard setting helps to define points along the scale score range and gives additional meaning to student performance. These points that define different achievement levels are known as cut scores. Georgia educators and stakeholders from around the state participated in the standard setting process for the Georgia Milestones EOC assessments in August 2015. The cut score recommendations from this statewide committee were presented to the State Board of Education and adopted in September 2015.
An achievement level is a range of scores that defines a specific level of student performance, as articulated in the Achievement Level Descriptors (ALDs). There are four achievement levels for each EOC assessment: Beginning Learner, Developing Learner, Proficient Learner, and Distinguished Learner. The following are the general policy ALDs for the Georgia Milestones Assessment System.
Beginning Learners do not yet demonstrate proficiency in the knowledge and skills necessary at this grade level/course of learning, as specified in Georgia’s content standards. The students need substantial academic support to be prepared for the next grade level or course and to be on track for college and career readiness.
Developing Learners demonstrate partial proficiency in the knowledge and skills necessary at this grade level/course of learning, as specified in Georgia’s content standards. The students need additional academic support to ensure success in the next grade level or course and to be on track for college and career readiness.
Proficient Learners demonstrate proficiency in the knowledge and skills necessary at this grade level/ course of learning, as specified in Georgia’s content standards. The students are prepared for the next grade level or course and are on track for college and career readiness.
Distinguished Learners demonstrate advanced proficiency in the knowledge and skills necessary at this grade level/course of learning, as specified in Georgia’s content standards. The students are well prepared for the next grade level or course and are well prepared for college and career readiness.
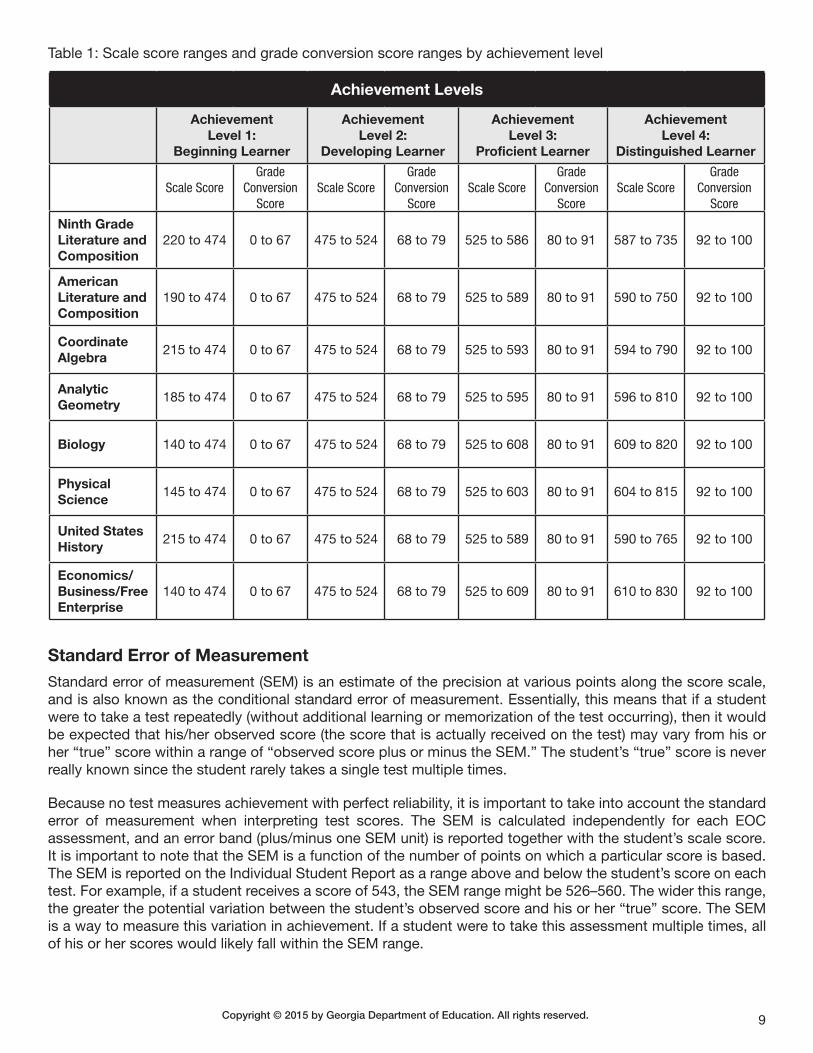
The achievement level classification for a student is determined by the scale score cuts. EOC scores are reported on a scale that can range from 140 to 830. The minimum and maximum scale scores for the different EOC assessments differ because the tests vary in length and their relative difficulty. Table 1 presents the scale score ranges and cut scores associated with each student achievement level and EOC assessment.
Grade Conversion ScoreThe Georgia Milestones EOC assessments serve as the final exam for the EOC courses; therefore, a score on the typical 0–100 grade scale must be provided. The grade conversion score (GCS) is used as this score and contributes 20 percent to the final course grade. The GCS is not a percent correct score. Rather, it corresponds directly with the scale score.
Grade conversion scores are derived from the scale score in the following manner for the Georgia Milestones scales. The value of 0 is assigned to the lowest obtainable scale score (LOSS). LOSS differs by course. The value of 68 is assigned to the scale score cut for Developing Learner, which is 475. The value of 80 is assigned to the scale score cut for Proficient Learner, which is 525. The value of 92 is assigned to the scale score cut for Distinguished Learner, which is different by course. The value of 100 is assigned to the highest obtainable scale score (HOSS). HOSS differs by course. Finally, a linear transformation is applied to all possible scale scores between any of the two key points referenced above. Table 1 presents the grade conversion scores associated with each student achievement level.
9Copyright © 2015 by Georgia Department of Education. All rights reserved.
Table 1: Scale score ranges and grade conversion score ranges by achievement level
Achievement Levels
Achievement Level 1:
Beginning Learner
Achievement Level 2:
Developing Learner
Achievement Level 3:
Proficient Learner
Achievement Level 4:
Distinguished Learner
Scale ScoreGrade
Conversion Score
Scale ScoreGrade
ConversionScore
Scale ScoreGrade
Conversion Score
Scale ScoreGrade
Conversion Score
Ninth Grade Literature and Composition
220 to 474 0 to 67 475 to 524 68 to 79 525 to 586 80 to 91 587 to 735 92 to 100
American Literature and Composition
190 to 474 0 to 67 475 to 524 68 to 79 525 to 589 80 to 91 590 to 750 92 to 100
Coordinate Algebra
215 to 474 0 to 67 475 to 524 68 to 79 525 to 593 80 to 91 594 to 790 92 to 100
Analytic Geometry
185 to 474 0 to 67 475 to 524 68 to 79 525 to 595 80 to 91 596 to 810 92 to 100
Biology 140 to 474 0 to 67 475 to 524 68 to 79 525 to 608 80 to 91 609 to 820 92 to 100
Physical Science
145 to 474 0 to 67 475 to 524 68 to 79 525 to 603 80 to 91 604 to 815 92 to 100
United States History
215 to 474 0 to 67 475 to 524 68 to 79 525 to 589 80 to 91 590 to 765 92 to 100
Economics/Business/Free Enterprise
140 to 474 0 to 67 475 to 524 68 to 79 525 to 609 80 to 91 610 to 830 92 to 100
Standard Error of MeasurementStandard error of measurement (SEM) is an estimate of the precision at various points along the score scale, and is also known as the conditional standard error of measurement. Essentially, this means that if a student were to take a test repeatedly (without additional learning or memorization of the test occurring), then it would be expected that his/her observed score (the score that is actually received on the test) may vary from his or her “true” score within a range of “observed score plus or minus the SEM.” The student’s “true” score is never really known since the student rarely takes a single test multiple times.
Because no test measures achievement with perfect reliability, it is important to take into account the standard error of measurement when interpreting test scores. The SEM is calculated independently for each EOC assessment, and an error band (plus/minus one SEM unit) is reported together with the student’s scale score. It is important to note that the SEM is a function of the number of points on which a particular score is based. The SEM is reported on the Individual Student Report as a range above and below the student’s score on each test. For example, if a student receives a score of 543, the SEM range might be 526–560. The wider this range, the greater the potential variation between the student’s observed score and his or her “true” score. The SEM is a way to measure this variation in achievement. If a student were to take this assessment multiple times, all of his or her scores would likely fall within the SEM range.
10Copyright © 2015 by Georgia Department of Education. All rights reserved.
Students Not Receiving Scale ScoresThere are a number of reasons why a student may not receive a scale score. In these cases, the student receives one of the following designations in lieu of a scale score.
• PTNA—This designation indicates Present, Test Not Attempted. A PTNA designation is used for instances in which a student was present for the test administration but was unable to test. In this case, the examiner should mark the student with the PTNA indicator. Parental request for a student to opt out is not an allowable use of PTNA. Scores associated with a PTNA are not included when computing statistics for the summary reports.
• DNA—This designation indicates that a student Did Not Attempt an assessment according to the guidelines established for the EOC assessment. For example, if a student is absent for an EOC assessment, he or she would receive a DNA rather than a scale score for that test. Scores associated with a DNA are not included when computing statistics for the summary reports.
• IV—This designation indicates that there was an irregularity associated with a student’s test administration and the student’s score was Invalidated. For example, if a student cheats on an EOC assessment, he or she would receive an IV rather than a scale score for that test. Scores associated with an invalidated administration are not included when computing statistics for the summary reports.
• PIV—This designation indicates that there was an irregularity in test administration that resulted in a Participation Invalidation. In a Participation Invalidation, the student’s score is invalidated and the student is not considered a participant for accountability purposes. For example, if a student receives an inappropriate accommodation on an EOC assessment, the student would receive a PIV rather than a scale score for that assessment, and he or she would not be counted as a test participant. Scores associated with a PIV are not included when computing statistics for the summary reports.
Students With Conditional Scale ScoresStudents with disabilities (including those with Section 504 plans) and ELs are allowed accommodations on the EOC assessments that are consistent with the instructional and testing accommodations annotated in the student’s IEP, IAP, or EL/TPC. Only accommodations approved by the Georgia Department of Education may be used. Certain accommodations are considered standard and do not affect score interpretation. However, other accommodations are nonstandard and result in a conditional administration (CA) designation. Conditional accommodations permit those students with more severe disabilities and ELs with very limited English proficiency to access the assessments. Conditional accommodations are limited to a small number of students who meet specific eligibility criteria.
If a student had a conditional accommodation/administration, then his/her scale score appears with a ‘CA’. Any test score (e.g., scale score, GCS, national percentile, etc.) resulting from a conditional administration must be interpreted in light of the specific accommodations provided to the student during testing because conditional accommodations are more expansive than standard accommodations and may encroach on the knowledge and skills targeted by the assessment.
The teacher should review the test results in light of the student’s IEP, IAP, or EL/TPC and explain to a parent the type(s) of accommodation(s), if any, that were provided during testing. Discussions should focus on the fact that the student obtained an EOC assessment score with a conditional accommodation(s) and that it is not clear how his or her performance would be affected if such a conditional accommodation(s) were removed.
11Copyright © 2015 by Georgia Department of Education. All rights reserved.
The discussion should also include what type(s) of instructional and testing accommodations will be allowed in the student’s IEP, IAP, or EL/TPC next year. The goal should always be to allow the student to learn and demonstrate what he or she has learned with fewer accommodations over time. Accommodations should foster independence for students, not dependence.
NOTE: The ELA EOC assessments results in several scores: an ELA scale score, a reading status, a Lexile measure, and national percentile rank. If a student takes an ELA EOC assessment with a conditional accommodation, each of these scores needs to be interpreted in light of this conditional administration.
Interpreting Lexile MeasuresA Lexile measure is a standard score that matches a student’s reading ability with the difficulty of textual material. Students in grades 1 through 12 typically score in a range from Beginning Reader (BR) to 1600L. A Lexile can be interpreted as the level of text that a student can read with 75 percent comprehension. Experts have identified 75 percent comprehension as the level at which students can read with a certain amount of comfort and yet still be challenged. The ELA EOC assessments have been linked to the Lexile® Framework for Reading in an effort to provide teachers with an additional indicator of a student’s reading ability. Because the text complexity on the Georgia Milestones reflects the more rigorous expectations of the state-adopted content standards addressing reading skills, the highest Lexile obtained on the Ninth Grade Literature and Composition EOC assessment is 1725L, and for the American Literature and Composition EOC assessment, it is 1800L. A student must take an ELA EOC assessment and receive an ELA scale score in order to receive a Lexile measure.
In advising parents, educators should point out that the Individual Student Report not only shows the student’s obtained Lexile measure, but also displays two ranges—a leisure reading range and a motivating reading range—with suggested sample book titles for each. The leisure range represents the easiest kind of reading material that is appropriate for the student and can be found by subtracting 100L from the student’s Lexile measure. The motivating range represents the most difficult level of material the student can read successfully and is found by adding 50L to the student’s Lexile measure. Some students may receive “BR” as their Lexile measure, which denotes a Beginning Reader and indicates that the student can read the simplest of books.
A student’s full Lexile range can be used in selecting reading material for the classroom and at home. Many textbooks, novels, magazines, newspapers, and other reading materials have been linked to the Lexile® Framework for Reading. The Lexile measure is a useful tool for matching student readers with appropriate texts.
When advising parents about how to use their student’s Lexile measure and range to select reading material, educators should stress the following points:
• The Lexile measure is a good starting point but should not be the only factor in identifying reading material.
• The Lexile measure is a measure of textual difficulty and does not take into account age appropriateness, student interest, or the quality of the text.
• Educators and parents should always preview books before encouraging students to read them.
It is generally not appropriate to calculate a mean Lexile score for a class, school, or system. The Lexile measure is intended to match an individual student’s reading ability with texts of appropriate difficulty levels.
12Copyright © 2015 by Georgia Department of Education. All rights reserved.
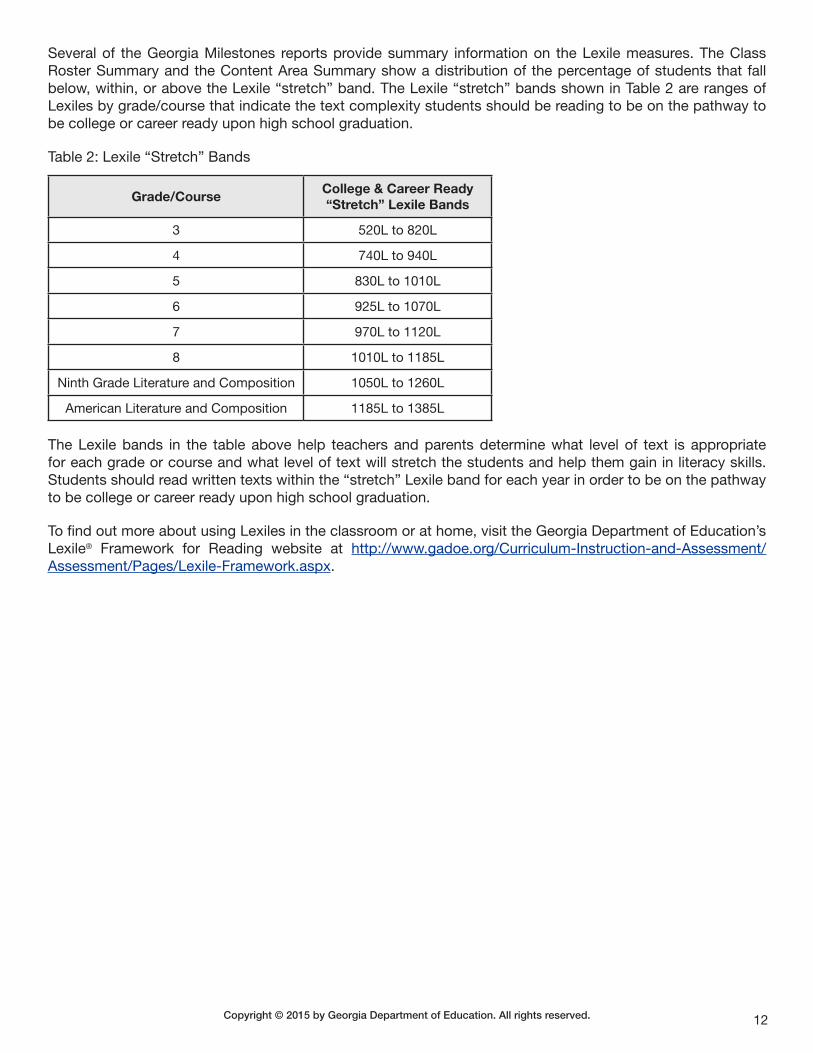
Several of the Georgia Milestones reports provide summary information on the Lexile measures. The Class Roster Summary and the Content Area Summary show a distribution of the percentage of students that fall below, within, or above the Lexile “stretch” band. The Lexile “stretch” bands shown in Table 2 are ranges of Lexiles by grade/course that indicate the text complexity students should be reading to be on the pathway to be college or career ready upon high school graduation.
Table 2: Lexile “Stretch” Bands
Grade/CourseCollege & Career Ready “Stretch” Lexile Bands
3 520L to 820L
4 740L to 940L
5 830L to 1010L
6 925L to 1070L
7 970L to 1120L
8 1010L to 1185L
Ninth Grade Literature and Composition 1050L to 1260L
American Literature and Composition 1185L to 1385L
The Lexile bands in the table above help teachers and parents determine what level of text is appropriate for each grade or course and what level of text will stretch the students and help them gain in literacy skills. Students should read written texts within the “stretch” Lexile band for each year in order to be on the pathway to be college or career ready upon high school graduation.
To find out more about using Lexiles in the classroom or at home, visit the Georgia Department of Education’s Lexile® Framework for Reading website at http://www.gadoe.org/Curriculum-Instruction-and-Assessment/Assessment/Pages/Lexile-Framework.aspx.
13Copyright © 2015 by Georgia Department of Education. All rights reserved.
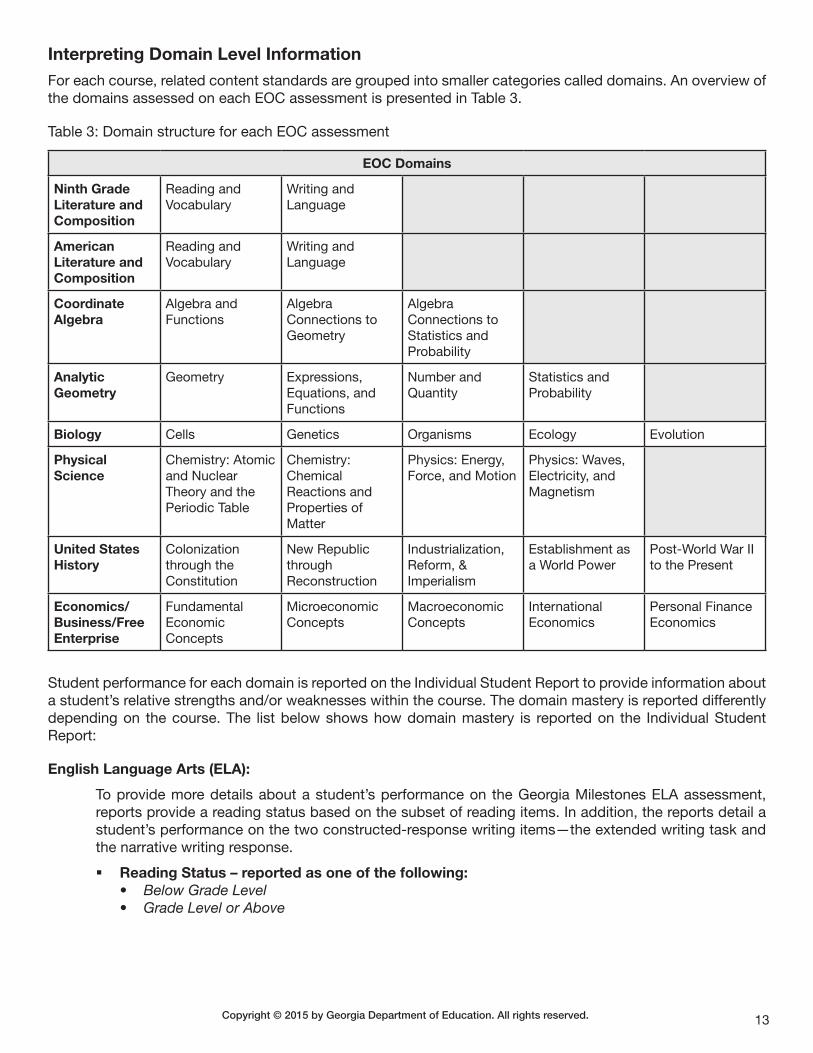
Interpreting Domain Level InformationFor each course, related content standards are grouped into smaller categories called domains. An overview of the domains assessed on each EOC assessment is presented in Table 3.
Table 3: Domain structure for each EOC assessment
EOC Domains
Ninth Grade Literature and Composition
Reading and Vocabulary
Writing and Language
American Literature and Composition
Reading and Vocabulary
Writing and Language
Coordinate Algebra
Algebra and Functions
Algebra Connections to Geometry
Algebra Connections to Statistics and Probability
Analytic Geometry
Geometry Expressions, Equations, and Functions
Number and Quantity
Statistics and Probability
Biology Cells Genetics Organisms Ecology Evolution
Physical Science
Chemistry: Atomic and Nuclear Theory and the Periodic Table
Chemistry: Chemical Reactions and Properties of Matter
Physics: Energy, Force, and Motion
Physics: Waves, Electricity, and Magnetism
United States History
Colonization through the Constitution
New Republic through Reconstruction
Industrialization, Reform, & Imperialism
Establishment as a World Power
Post-World War II to the Present
Economics/Business/Free Enterprise
Fundamental Economic Concepts
Microeconomic Concepts
Macroeconomic Concepts
International Economics
Personal Finance Economics
Student performance for each domain is reported on the Individual Student Report to provide information about a student’s relative strengths and/or weaknesses within the course. The domain mastery is reported differently depending on the course. The list below shows how domain mastery is reported on the Individual Student Report:
English Language Arts (ELA):
To provide more details about a student’s performance on the Georgia Milestones ELA assessment, reports provide a reading status based on the subset of reading items. In addition, the reports detail a student’s performance on the two constructed-response writing items—the extended writing task and the narrative writing response.
� Reading Status – reported as one of the following: • Below Grade Level • Grade Level or Above
14Copyright © 2015 by Georgia Department of Education. All rights reserved.
� Writing Scores • Extended Writing Task – reported as scores for the following two traits:
� Trait 1: Ideas, Organization and Coherence – number of points earned out of 4 points � Trait 2: Language Usage and Conventions – number of points earned out of 3 points
• Narrative Writing Response – number of points earned out of 4 points
Mathematics, Science, and Social Studies:
Domain mastery indicators provide diagnostic information to indicate a student’s strengths and areas of need at the domain level. The determination of the mastery category is based on the likelihood that the student would achieve proficiency on the test given his/her performance in the domain.
There are three categories for reporting domain mastery:
� A student who achieves Remediate Learning is well below mastery on a domain and should consider additional study or instructional opportunities on that domain.
� A student who achieves Monitor Learning has not consistently demonstrated mastery on a domain and thus additional information should be used in order to assess whether additional study or instruction is necessary.
� A student who achieves Accelerate Learning has demonstrated achievement on that domain at or above the level expected of a student just at the threshold of Proficient Learner at the total test level.
NOTE: The results for domains that are measured with fewer points are less reliable than for domains measured with more points. Thus, when only a few points are used to measure a domain, other measures (e.g., observations, homework, etc.) should be used to confirm the results reported here. To find the approximate number of points allocated to each domain, visit the EOC blueprint that can be found at https://www.gadoe.org/Curriculum-Instruction-and-Assessment/Assessment/Pages/Georgia-Milestones-Test-Blueprints.aspx.
Students who take the Braille version of the EOC assessment are scored only on those items that are present on the Braille form of the assessment. Because some test items may not be converted to Braille, the Braille version may have a different number of items in a given domain than other EOC assessment versions. Most Braille forms have the same number of items as regular forms because Universal Design has been the focus throughout item and test development.
Interpreting Group Data in Summary ReportsSummary reports are provided for classes, schools, systems, and the state as a whole. In addition, some reports provide comparative data at the school, system, Regional Educational Service Agency (RESA), and state levels. When interpreting group statistics such as percentages, means, and standard deviations, it is important to take into account the group size. The smaller the group size, the larger the measurement error associated with the group statistics. For this reason, summary information is not provided for groups of fewer than 10 students. The exception to this rule is the Class Roster. Class Rosters will summarize the student results for instructional decision making even for classes with less than 10 students. These reports carry a special note: “Provided for Instructional Purposes Only; NOT for Public Distribution; Avoid FERPA.” Educators should take extra precautions with these reports. It should also be noted that the sum of the percentages of students falling into each achievement level may not total exactly 100 percent due to rounding.
Results from students using the Braille version of the EOC assessment are included in the summary reports. Because some items cannot be Brailled to be accessed easily by blind students, the Braille version may have slightly fewer items than the paper-and-pencil or online version. All tests in a given form of a course are equated so total test performance is comparable. However, when examining domain performance, caution should be taken when comparing the achievement of students who took the Braille version with the achievement of students who took the standard paper-and-pencil or online EOC assessment because the items that could not be Brailled may impact one domain more than another.
15Copyright © 2015 by Georgia Department of Education. All rights reserved.
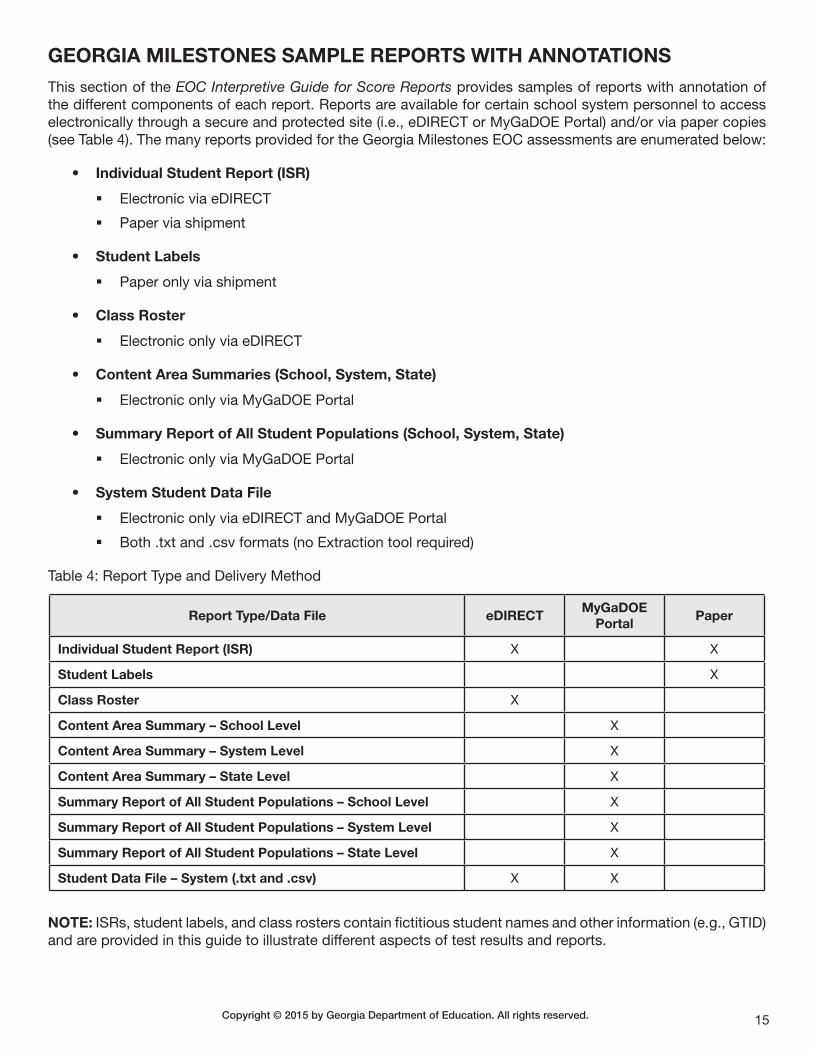
GEORGIA MILESTONES SAMPLE REPORTS WITH ANNOTATIONSThis section of the EOC Interpretive Guide for Score Reports provides samples of reports with annotation of the different components of each report. Reports are available for certain school system personnel to access electronically through a secure and protected site (i.e., eDIRECT or MyGaDOE Portal) and/or via paper copies (see Table 4). The many reports provided for the Georgia Milestones EOC assessments are enumerated below:
• Individual Student Report (ISR)
� Electronic via eDIRECT
� Paper via shipment
• Student Labels
� Paper only via shipment
• Class Roster
� Electronic only via eDIRECT
• Content Area Summaries (School, System, State)
� Electronic only via MyGaDOE Portal
• Summary Report of All Student Populations (School, System, State)
� Electronic only via MyGaDOE Portal
• System Student Data File
� Electronic only via eDIRECT and MyGaDOE Portal
� Both .txt and .csv formats (no Extraction tool required)
Table 4: Report Type and Delivery Method
Report Type/Data File eDIRECTMyGaDOE
PortalPaper
Individual Student Report (ISR) X X
Student Labels X
Class Roster X
Content Area Summary – School Level X
Content Area Summary – System Level X
Content Area Summary – State Level X
Summary Report of All Student Populations – School Level X
Summary Report of All Student Populations – System Level X
Summary Report of All Student Populations – State Level X
Student Data File – System (.txt and .csv) X X
NOTE: ISRs, student labels, and class rosters contain fictitious student names and other information (e.g., GTID) and are provided in this guide to illustrate different aspects of test results and reports.
16Copyright © 2015 by Georgia Department of Education. All rights reserved.
Individual Student ReportsThe Individual Student Report (ISR) presents the student’s results for each test taken. Schools receive two paper copies of the ISR for each student—one to keep at the school and one to send home to parents/guardians. Select school staff can also download electronic versions of the ISRs from eDIRECT.
A Sample Ninth Grade Literature and Composition ISR appears on pages 18 and 19.
A Sample United States History ISR appears on pages 20 and 21.
The top of each page of the ISR (on pages 18 through 21) provides:
Student Demographic Information: student name, GTID, birthdate, test date, form, class name, school name, and system name.
The first page of the ISR (on pages 18 and 20) also provides:
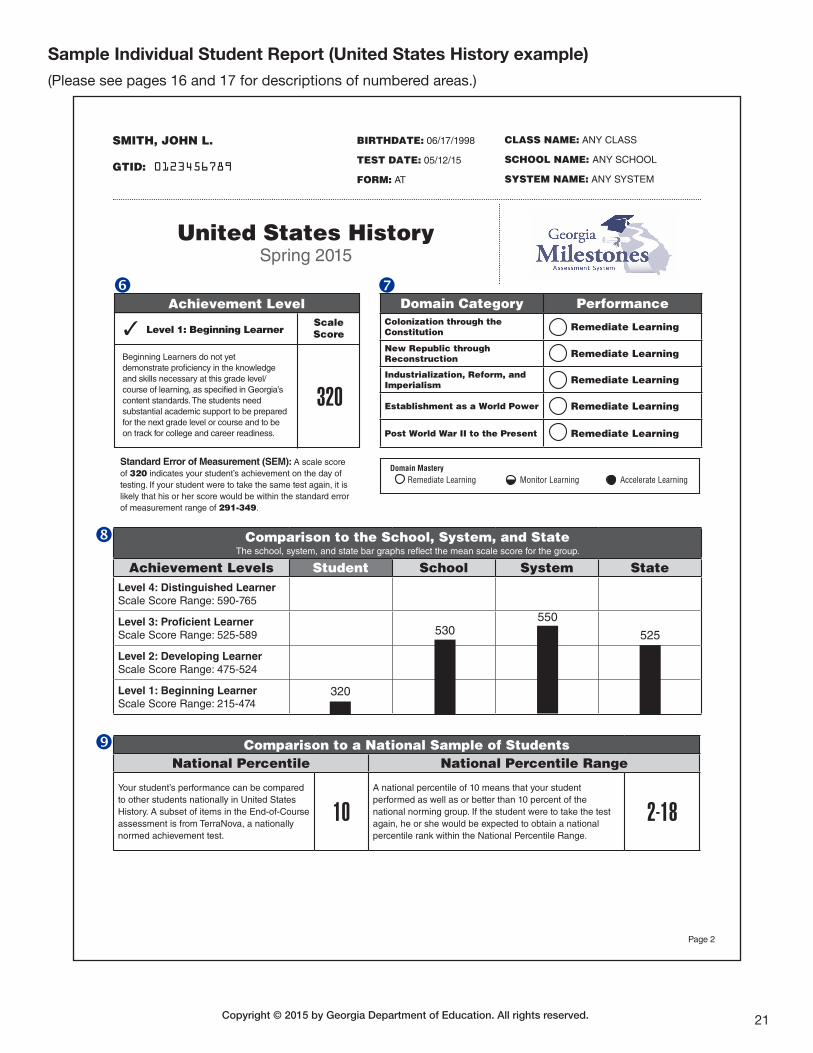
Achievement Level: The overall student achievement level on each test is categorized as Beginning Learner, Developing Learner, Proficient Learner, or Distinguished Learner. According to the Ninth Grade Literature and Composition sample ISR, Mary A. Johnson’s overall performance level is Proficient Learner. On the United States History sample ISR, John L. Smith’s overall performance level is Beginning Learner.
Scale Score: This area of the report shows a student’s scale score and the range of scale scores for the achievement level. According to the Ninth Grade Literature and Composition sample ISR, Mary A. Johnson’s scale score is 543 and this falls within the Proficient Learner scale score range of 525–586. John L. Smith’s scale score on United States History is 320 and this falls within the Beginning Learner scale score range of 215–474.
Grade Conversion Score: A GCS, ranging from 0 to 100, is a transformation from the scale score and is helpful because it can be more readily incorporated into course grades than can scale scores. Mary A. Johnson’s GCS is 83. John L. Smith’s GCS is 27.
Achievement Levels: Brief descriptions of all four Georgia Milestones achievement levels are provided to allow students and parents to see the full continuum of expectations.
The second page of the ISR (on pages 19 and 21) includes the student’s:
Achievement Level: Mary A. Johnson’s achievement level in Ninth Grade Literature and Composition is Proficient Learner, with a scale score of 543. Mary demonstrates proficiency in the knowledge and skills necessary in Ninth Grade Literature and Composition, as specified in Georgia’s content standards. John L. Smith’s achievement level is Beginning Learner, with a scale score of 320. John does not yet demonstrate proficiency in the knowledge and skills necessary in United States History.
17Copyright © 2015 by Georgia Department of Education. All rights reserved.
Domain Category and Performance: Standards for each course have been grouped into domains, or clusters of standards with related content. Domain level information is reported differently on ELA EOC assessments than it is on EOC assessments in mathematics, science, and social studies. On the ELA EOC reports, students receive a reading status designation for the Reading and Vocabulary domain and information on how the student performed on the extended writing task and the narrative writing response for the Writing and Language domain. On the sample ISR for Ninth Grade Literature and Composition, Mary A. Johnson received a reading status of Grade Level or Above. For the two traits of the extended writing task (which was an argumentative essay for Mary), she earned 3 out of 4 points for Idea Development, Organization and Coherence and 2 out of 3 points for Language Usage and Conventions. For the narrative writing response, she received a condition code of C, which indicates her response was illegible or too limited to score. The footnote explains the condition codes.
On the United States History ISR, John Smith’s domain mastery performance is reported by using the domain categories. John received Remediate Learning on each of the five domains. This is the way domain level information is reported on EOC assessments in mathematics, science, and social studies.
Comparison chart illustrating the student’s score compared to the mean scale scores within the school, system, and state. On the sample ISR for Ninth Grade Literature and Composition, Mary A. Johnson performed better than most students at her school but did not perform as well as most students in the system and in the state. On the sample ISR for United States History, John L. Smith did not perform as well as most students in his school, system, and state.
Comparison of the student’s performance to a national sample of students. Students took a sample of TerraNova norm-referenced items that allows the student to receive a national percentile score as well as a national percentile range. Mary A. Johnson received a national percentile of 60, which means that she performed as well as or better than 60 percent of the national norming group. If Mary were to take the test again, she would be expected to obtain a national percentile rank within the national percentile range of 52–68. John L. Smith received a national percentile of 10, which means that he performed as well as or better than 10 percent of the national norming group. If John were to take the test again, he would be expected to obtain a national percentile rank within the national percentile range of 2–18.
Your Student’s Lexile Information (ELA only). The second page of the ELA ISRs also includes the student’s Lexile information and suggested book titles. For example, on the Ninth Grade Literature and Composition sample ISR, Mary A. Johnson’s Lexile measure is 1330L. Her leisure reading range, which represents the easiest kind of reading material that is appropriate for Mary, is 1230L–1330L. The motivating reading range, the most difficult level of material Mary can read successfully, is 1330L–1380L.

18Copyright © 2015 by Georgia Department of Education. All rights reserved.
Sample Individual Student Report (Ninth Grade Literature and Composition example)(Please see pages 16 and 17 for descriptions of numbered areas.)
JOHNSON, MARY A.
GTID: 0123456789
BIRTHDATE: 12/27/1999
TEST DATE: 05/12/15
FORM: BU
CLASS NAME: ANY CLASS
SCHOOL NAME: ANY SCHOOL
SYSTEM NAME: ANY SYSTEM
Individual Student ReportEnd-of-Course Assessment
Ninth Grade Literature and CompositionSpring 2015
The Georgia Milestones Assessment System spans grades 3 through high school and measures how well students have learned the knowledge and skills outlined in the state content standards in English Language Arts, Mathematics, Science, and Social Studies. Georgia Milestones provides information about each student’s achievement and readiness for his or her next level of learning—be it the next grade, course, or endeavor such as college or career.
This report summarizes your student’s performance on the Spring 2015 Georgia Milestones End-of-Course (EOC) Assessment. The first page provides an overview of the student’s overall performance on the EOC for a particular course. The second page provides more details about your student’s performance.
Achievement LevelsLEVEL 1: BEGINNING LEARNERS do not yet demonstrate proficiency in the knowledge and skills necessary at this grade level/course of learning, as specified in Georgia’s content standards. The students need substantial academic support to be prepared for the next grade level or course and to be on track for college and career readiness.
LEVEL 2: DEVELOPING LEARNERS demonstrate partial proficiency in the knowledge and skills necessary at this grade level/course of learning, as specified in Georgia’s content standards. The students need additional academic support to ensure success in the next grade level or course and to be on track for college and career readiness.
LEVEL 3: PROFICIENT LEARNERS demonstrate proficiency in the knowledge and skills necessary at this grade level/course of learning, as specified in Georgia’s content standards. The students are prepared for the next grade level or course and are on track for college and career readiness.
LEVEL 4: DISTINGUISHED LEARNERS demonstrate advanced proficiency in the knowledge and skills necessary at this grade level/course of learning, as specified in Georgia’s content standards. The students are well prepared for the next grade level or course and are well prepared for college and career readiness.
Page 1
Your student’s overall performance on the Georgia Milestones End-of-Course Assessment for Ninth Grade Literature and Composition
CONTENT AREA ACHIEVEMENT LEVEL SCALE SCORE
GRADE CONVERSION
SCORE
Ninth Grade Literature and Composition
543Scale Score Range
525–58683
Grade Conversion Score: A student’s score converted to a 0-100 scale.
LEVEL 3
PROFICIENT LEARNER
Copyright © 2015 Georgia Department of Education. All rights reserved. Lexile® and Lexile Framework® are registered trademarks of MetaMetrics, Inc.
For more information see the Score Interpretation Guide at testing.gadoe.org.

19Copyright © 2015 by Georgia Department of Education. All rights reserved.
Sample Individual Student Report (Ninth Grade Literature and Composition example)(Please see pages 16 and 17 for descriptions of numbered areas.)
JOHNSON, MARY A.
GTID: 0123456789
BIRTHDATE: 12/27/1999
TEST DATE: 05/12/15
FORM: BU
CLASS NAME: ANY CLASS
SCHOOL NAME: ANY SCHOOL
SYSTEM NAME: ANY SYSTEM
Ninth Grade LiteratureAnd Composition
Spring 2015
Page 2
Scale ScoreLevel 3: Proficient Learner✓
543in the knowledge and skills necessary at this
in Georgia’s content standards. The students are prepared for the next grade level or course and are on track for college and career readiness.
Achievement Level
Comparison to the School, System, and State
Achievement Levels Student School System StateLevel 4: Distinguished Learner Scale Score Range: 587-735
Scale Score Range: 525-586
Level 2: Developing LearnerScale Score Range: 475-524
Level 1: Beginning LearnerScale Score Range: 220-474
543515
550570
Leisure Reading: 1230L-1330LSuggested Titles Author Lexile
Great Expectations Dickens, Charles 1230L The Dog Who Wouldn’t Be Mowat, Farley 1280L The House of the Seven Gables Hawthorne, Nathaniel 1320L
Motivating Challenge: 1330L-1380L Suggested Titles Author Lexile
Walden Thoreau, Henry David 1340L Robinson Crusoe Defoe, Daniel 1360L Raise Some Shell: Teenage Mutant Ninja Rosenbaum, Richard 1380L Turtles
Standard Error of Measurement (SEM): A scale score of 543 indicates your student’s achievement on the day of testing. If your student were to take the same test again, it is likely that his or her score would be within the standard error of measurement range of 526-560.
Domain Category Performance
Reading and Vocabulary Grade Level or Above
Writing and Language1
Extended Writing argumentative essay score:
Idea Development, Organization and Coherence
3 out of 4 points
Language Usage and Conventions
2 out of 3 points
Narrative Writing Response score:
Condition Code C
Comparison to a National Sample of StudentsNational Percentile National Percentile Range
Your student’s performance can be compared to other students nationally in Language. A subset of items in the End-of-Course assessment is from TerraNova, a nationally normed achievement test.
60A national percentile of 60 means that your student performed as well as or better than 60 percent of the national norming group. If the student were to take the test again, he or she would be expected to obtain a national percentile rank within the National Percentile Range.
52-68
Your Student’s Lexile Information
Lexile Measure: 1330L Lexile Range: 1230L-1380LThe Lexile Framework® for Reading matches a student’s reading ability with the difficulty of text material. When selecting books, it is important to consider that Lexiles do not address age-appropriateness, student interest, or text quality. Suggested titles are not necessarily endorsed by the Georgia Department of Education. Books within the student’s Lexile range can be found at the local library or by using the Find-a-Book database at www.lexile.com. For more information, visit www.gadoe.org/lexile.aspx.
1Condition Codes for Writing A = Blank, B = Copied, C = Illegible/Too Limited to Score, D = Non-English/Foreign Language, E = Off Topic/Offensive

20Copyright © 2015 by Georgia Department of Education. All rights reserved.
Sample Individual Student Report (United States History example)(Please see pages 16 and 17 for descriptions of numbered areas.)
SMITH, JOHN L.
GTID: 0123456789
BIRTHDATE: 06/17/1998
TEST DATE: 05/12/15
FORM: AT
CLASS NAME: ANY CLASS
SCHOOL NAME: ANY SCHOOL
SYSTEM NAME: ANY SYSTEM
Individual Student ReportEnd-of-Course Assessment
United States History Spring 2015
The Georgia Milestones Assessment System spans grades 3 through high school and measures how well students have learned the knowledge and skills outlined in the state content standards in English Language Arts, Mathematics, Science, and Social Studies. Georgia Milestones provides information about each student’s achievement and readiness for his or her next level of learning—be it the next grade, course, or endeavor such as college or career.
This report summarizes your student’s performance on the Spring 2015 Georgia Milestones End-of-Course (EOC) Assessment. The first page provides an overview of the student’s overall performance on the EOC for a particular course. The second page provides more details about your student’s performance.
Achievement LevelsLEVEL 1: BEGINNING LEARNERS do not yet demonstrate proficiency in the knowledge and skills necessary at this grade level/course of learning, as specified in Georgia’s content standards. The students need substantial academic support to be prepared for the next grade level or course and to be on track for college and career readiness.
LEVEL 2: DEVELOPING LEARNERS demonstrate partial proficiency in the knowledge and skills necessary at this grade level/course of learning, as specified in Georgia’s content standards. The students need additional academic support to ensure success in the next grade level or course and to be on track for college and career readiness.
LEVEL 3: PROFICIENT LEARNERS demonstrate proficiency in the knowledge and skills necessary at this grade level/course of learning, as specified in Georgia’s content standards. The students are prepared for the next grade level or course and are on track for college and career readiness.
LEVEL 4: DISTINGUISHED LEARNERS demonstrate advanced proficiency in the knowledge and skills necessary at this grade level/course of learning, as specified in Georgia’s content standards. The students are well prepared for the next grade level or course and are well prepared for college and career readiness.
Page 1
Your student’s overall performance on the Georgia Milestones End-of-Course Assessment for United States History
CONTENT AREA ACHIEVEMENT LEVEL SCALE SCORE
GRADE CONVERSION
SCORE
United States History
320Scale Score Range
215–47427
Grade Conversion Score: A student’s score converted to a 0-100 scale.
LEVEL 1
BEGINNING LEARNER
For more information see the Score Interpretation Guide at testing.gadoe.org.
Copyright © 2015 Georgia Department of Education. All rights reserved.
21Copyright © 2015 by Georgia Department of Education. All rights reserved.
Sample Individual Student Report (United States History example)(Please see pages 16 and 17 for descriptions of numbered areas.)
SMITH, JOHN L.
GTID: 0123456789
BIRTHDATE: 06/17/1998
TEST DATE: 05/12/15
FORM: AT
CLASS NAME: ANY CLASS
SCHOOL NAME: ANY SCHOOL
SYSTEM NAME: ANY SYSTEM
United States HistorySpring 2015
Scale ScoreLevel 1: Beginning Learner3
320
Beginning Learners do not yet demonstrate proficiency in the knowledge and skills necessary at this grade level/course of learning, as specified in Georgia’s content standards. The students need substantial academic support to be prepared for the next grade level or course and to be on track for college and career readiness.
Achievement Level
Comparison to the School, System, and StateThe school, system, and state bar graphs reflect the mean scale score for the group.
Achievement Levels Student School System StateLevel 4: Distinguished Learner Scale Score Range: 590-765
Level 3: Proficient LearnerScale Score Range: 525-589
Level 2: Developing LearnerScale Score Range: 475-524
Level 1: Beginning LearnerScale Score Range: 215-474
320
530 525
Page 2
Domain Category PerformanceColonization through the Constitution Remediate Learning
New Republic through Reconstruction Remediate Learning
Industrialization, Reform, and Imperialism Remediate Learning
Establishment as a World Power Remediate Learning
Post World War II to the Present Remediate Learning
Domain Mastery Remediate Learning Monitor Learning Accelerate Learning
550
Standard Error of Measurement (SEM): A scale score of 320 indicates your student’s achievement on the day of testing. If your student were to take the same test again, it is likely that his or her score would be within the standard error of measurement range of 291-349.
Comparison to a National Sample of StudentsNational Percentile National Percentile Range
Your student’s performance can be compared to other students nationally in United States History. A subset of items in the End-of-Course assessment is from TerraNova, a nationally normed achievement test.
10A national percentile of 10 means that your student performed as well as or better than 10 percent of the national norming group. If the student were to take the test again, he or she would be expected to obtain a national percentile rank within the National Percentile Range.
2-18
22Copyright © 2015 by Georgia Department of Education. All rights reserved.
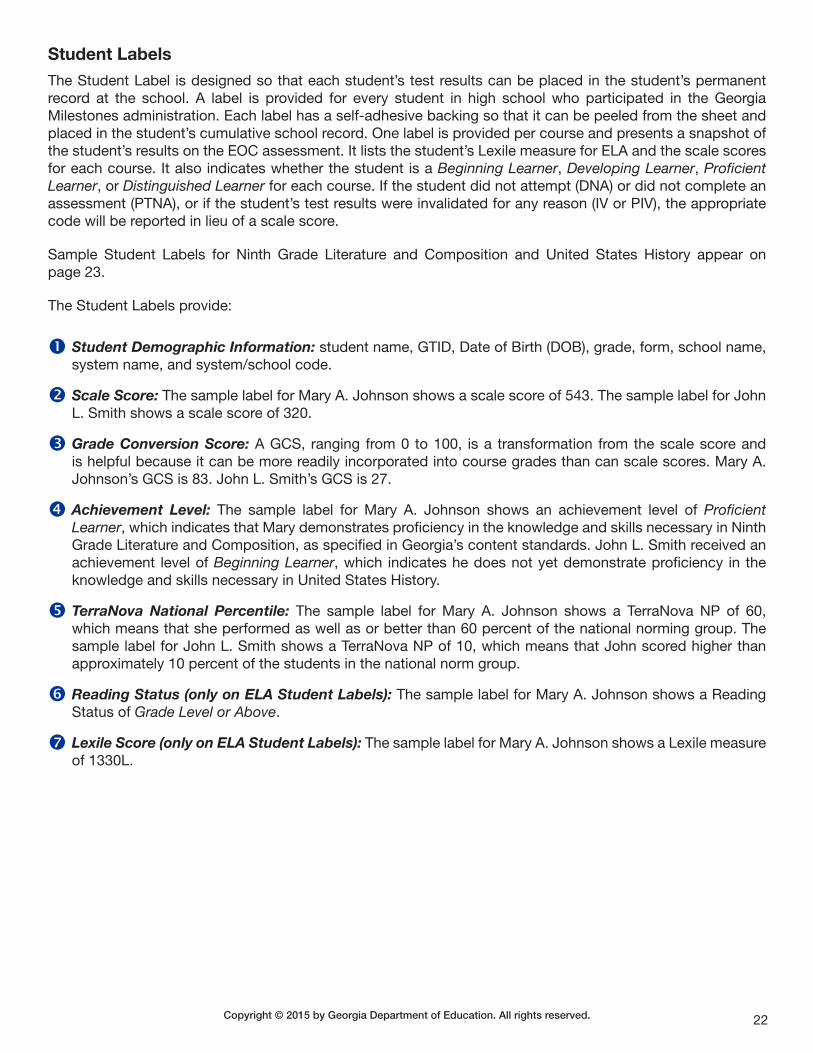
Student LabelsThe Student Label is designed so that each student’s test results can be placed in the student’s permanent record at the school. A label is provided for every student in high school who participated in the Georgia Milestones administration. Each label has a self-adhesive backing so that it can be peeled from the sheet and placed in the student’s cumulative school record. One label is provided per course and presents a snapshot of the student’s results on the EOC assessment. It lists the student’s Lexile measure for ELA and the scale scores for each course. It also indicates whether the student is a Beginning Learner, Developing Learner, Proficient Learner, or Distinguished Learner for each course. If the student did not attempt (DNA) or did not complete an assessment (PTNA), or if the student’s test results were invalidated for any reason (IV or PIV), the appropriate code will be reported in lieu of a scale score.
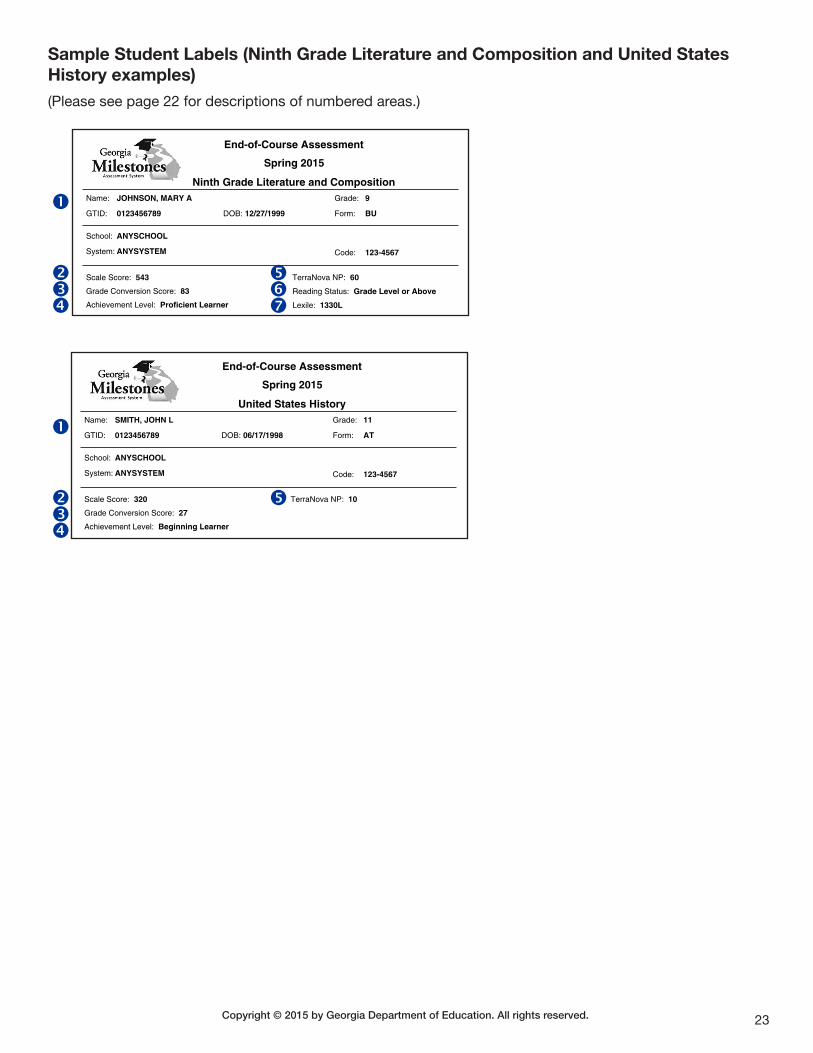
Sample Student Labels for Ninth Grade Literature and Composition and United States History appear on page 23.
The Student Labels provide:
Student Demographic Information: student name, GTID, Date of Birth (DOB), grade, form, school name, system name, and system/school code.
Scale Score: The sample label for Mary A. Johnson shows a scale score of 543. The sample label for John L. Smith shows a scale score of 320.
Grade Conversion Score: A GCS, ranging from 0 to 100, is a transformation from the scale score and is helpful because it can be more readily incorporated into course grades than can scale scores. Mary A. Johnson’s GCS is 83. John L. Smith’s GCS is 27.
Achievement Level: The sample label for Mary A. Johnson shows an achievement level of Proficient Learner, which indicates that Mary demonstrates proficiency in the knowledge and skills necessary in Ninth Grade Literature and Composition, as specified in Georgia’s content standards. John L. Smith received an achievement level of Beginning Learner, which indicates he does not yet demonstrate proficiency in the knowledge and skills necessary in United States History.
TerraNova National Percentile: The sample label for Mary A. Johnson shows a TerraNova NP of 60, which means that she performed as well as or better than 60 percent of the national norming group. The sample label for John L. Smith shows a TerraNova NP of 10, which means that John scored higher than approximately 10 percent of the students in the national norm group.
Reading Status (only on ELA Student Labels): The sample label for Mary A. Johnson shows a Reading Status of Grade Level or Above.
Lexile Score (only on ELA Student Labels): The sample label for Mary A. Johnson shows a Lexile measure of 1330L.
23Copyright © 2015 by Georgia Department of Education. All rights reserved.
Sample Student Labels (Ninth Grade Literature and Composition and United States History examples)(Please see page 22 for descriptions of numbered areas.)
End-of-Course Assessment
Spring 2015
Ninth Grade Literature and CompositionName: JOHNSON, MARY A
GTID: 0123456789 DOB: 12/27/1999
Grade: 9
Form: BU
School: ANYSCHOOL
System: ANYSYSTEM Code: 123-4567
Scale Score: 543
Grade Conversion Score: 83
Achievement Level: Proficient Learner
TerraNova NP: 60
Reading Status: Grade Level or Above
Lexile: 1330L
End-of-Course Assessment
Spring 2015
United States HistoryName: SMITH, JOHN L
GTID: 0123456789 DOB: 06/17/1998
Grade: 11
Form: AT
School: ANYSCHOOL
System: ANYSYSTEM Code: 123-4567
Scale Score: 320
Grade Conversion Score: 27
Achievement Level: Beginning Learner
TerraNova NP: 10
24Copyright © 2015 by Georgia Department of Education. All rights reserved.
Class Roster ReportsClass rosters are accessible via eDIRECT.
Student rosters are generated at the class level for all EOC assessments. These reports contain demographic data and test results for each student listed on the roster. Rosters are produced for each course with students listed alphabetically within the class. Class rosters are generated separately for paper-and-pencil administrations and online administrations. The Class Roster is distributed via eDIRECT only and is accessible by System Test Coordinators. These reports are not produced in paper format.
A Sample Class Roster Report for Ninth Grade Literature and Composition appears on pages 26 and 27.
A Sample Class Roster Report for United States History appears on pages 28 and 29.
The class roster reports consist of two sections. The first section is the list of students and their test performance. To list every student in a class, there may be several pages. The last section of a class roster is the “summary” page.
The first section of the Class Roster Report provides:
Course: Each Class Roster Report lists the name of the course being reported in the top middle of the report.
Class Demographic Information: This includes the Class Name as reflected on the Group Information Sheet (paper-and-pencil) or the test session name (online), the school and system name, the state, and system/school code.
Student Demographic Information: Student demographic information is printed in the left hand column of the report. The student’s name is followed by the student’s GTID number, birth date, grade, and test form number.
Scale Score: The Class Roster Report indicates the scale score for each student on the roster. For example, on the Ninth Grade Literature and Composition roster, Brooke S. Berger received a scale score of 570. Kate T. Kramer received a scale score of 461 CA, which indicates a conditional administration. In United States History, Leslie M. Lavallee received a 491 scale score. Kenneth L. Kessler received an invalidation (IV) in lieu of a scale score.
Achievement Level: The student’s achievement level for the test is reported following the scale score. There are four achievement levels for the EOC assessment—Beginning Learner, Developing Learner, Proficient Learner, and Distinguished Learner. On the Ninth Grade Literature and Composition roster, Brooke S. Berger’s achievement level is Proficient Learner while Kate T. Kramer’s is Beginning Learner. On the United States History roster, Leslie M. Lavallee’s achievement level is Developing Learner while Kenneth L. Kessler does not receive an achievement level designation because his scale score code is IV for Invalidation.
Grade Conversion Score: Grade conversion scores range from 0 to 100. This score is for use in calculating the student’s course grade. In Ninth Grade Literature and Composition, Brooke S. Berger received a GCS of 88. Kate T. Kramer received a GCS of 64. In United States History, Leslie M. Lavallee received a 72 while Kenneth L. Kessler did not receive a GCS as he received an invalidation (IV).
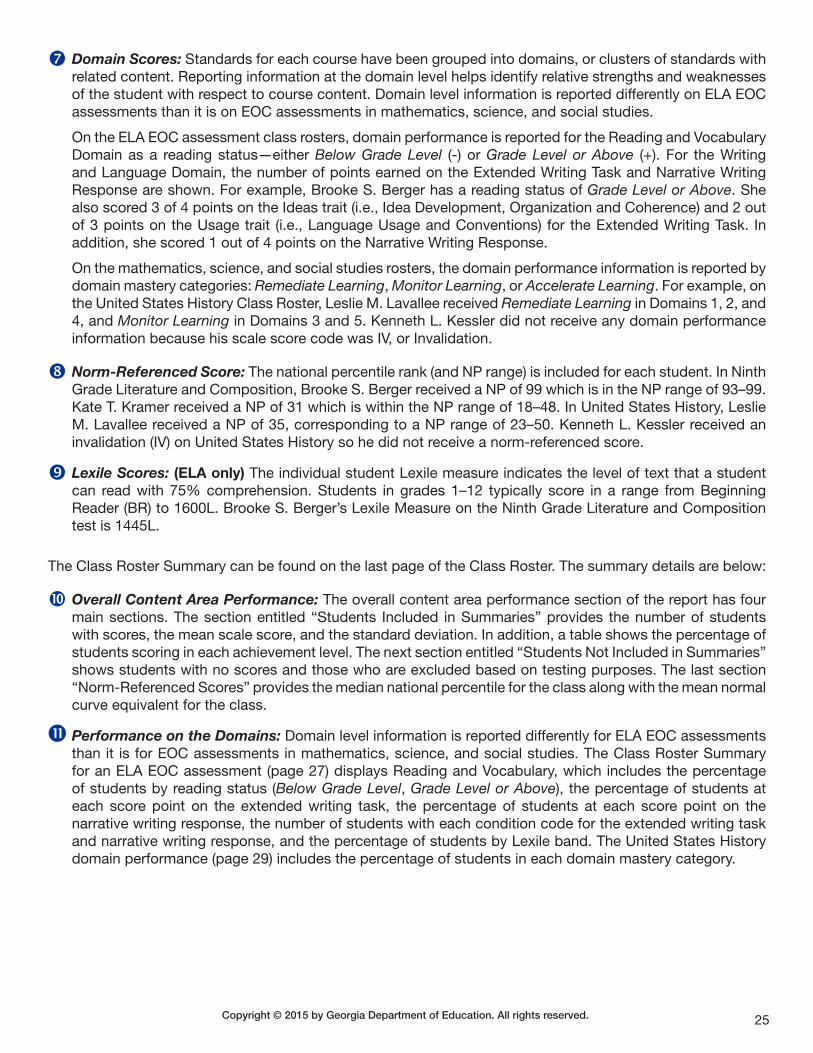
25Copyright © 2015 by Georgia Department of Education. All rights reserved.
Domain Scores: Standards for each course have been grouped into domains, or clusters of standards with related content. Reporting information at the domain level helps identify relative strengths and weaknesses of the student with respect to course content. Domain level information is reported differently on ELA EOC assessments than it is on EOC assessments in mathematics, science, and social studies.
On the ELA EOC assessment class rosters, domain performance is reported for the Reading and Vocabulary Domain as a reading status—either Below Grade Level (-) or Grade Level or Above (+). For the Writing and Language Domain, the number of points earned on the Extended Writing Task and Narrative Writing Response are shown. For example, Brooke S. Berger has a reading status of Grade Level or Above. She also scored 3 of 4 points on the Ideas trait (i.e., Idea Development, Organization and Coherence) and 2 out of 3 points on the Usage trait (i.e., Language Usage and Conventions) for the Extended Writing Task. In addition, she scored 1 out of 4 points on the Narrative Writing Response.
On the mathematics, science, and social studies rosters, the domain performance information is reported by domain mastery categories: Remediate Learning, Monitor Learning, or Accelerate Learning. For example, on the United States History Class Roster, Leslie M. Lavallee received Remediate Learning in Domains 1, 2, and 4, and Monitor Learning in Domains 3 and 5. Kenneth L. Kessler did not receive any domain performance information because his scale score code was IV, or Invalidation.
Norm-Referenced Score: The national percentile rank (and NP range) is included for each student. In Ninth Grade Literature and Composition, Brooke S. Berger received a NP of 99 which is in the NP range of 93–99. Kate T. Kramer received a NP of 31 which is within the NP range of 18–48. In United States History, Leslie M. Lavallee received a NP of 35, corresponding to a NP range of 23–50. Kenneth L. Kessler received an invalidation (IV) on United States History so he did not receive a norm-referenced score.
Lexile Scores: (ELA only) The individual student Lexile measure indicates the level of text that a student can read with 75% comprehension. Students in grades 1–12 typically score in a range from Beginning Reader (BR) to 1600L. Brooke S. Berger’s Lexile Measure on the Ninth Grade Literature and Composition test is 1445L.
The Class Roster Summary can be found on the last page of the Class Roster. The summary details are below:
Overall Content Area Performance: The overall content area performance section of the report has four main sections. The section entitled “Students Included in Summaries” provides the number of students with scores, the mean scale score, and the standard deviation. In addition, a table shows the percentage of students scoring in each achievement level. The next section entitled “Students Not Included in Summaries” shows students with no scores and those who are excluded based on testing purposes. The last section “Norm-Referenced Scores” provides the median national percentile for the class along with the mean normal curve equivalent for the class.
Performance on the Domains: Domain level information is reported differently for ELA EOC assessments than it is for EOC assessments in mathematics, science, and social studies. The Class Roster Summary for an ELA EOC assessment (page 27) displays Reading and Vocabulary, which includes the percentage of students by reading status (Below Grade Level, Grade Level or Above), the percentage of students at each score point on the extended writing task, the percentage of students at each score point on the narrative writing response, the number of students with each condition code for the extended writing task and narrative writing response, and the percentage of students by Lexile band. The United States History domain performance (page 29) includes the percentage of students in each domain mastery category.
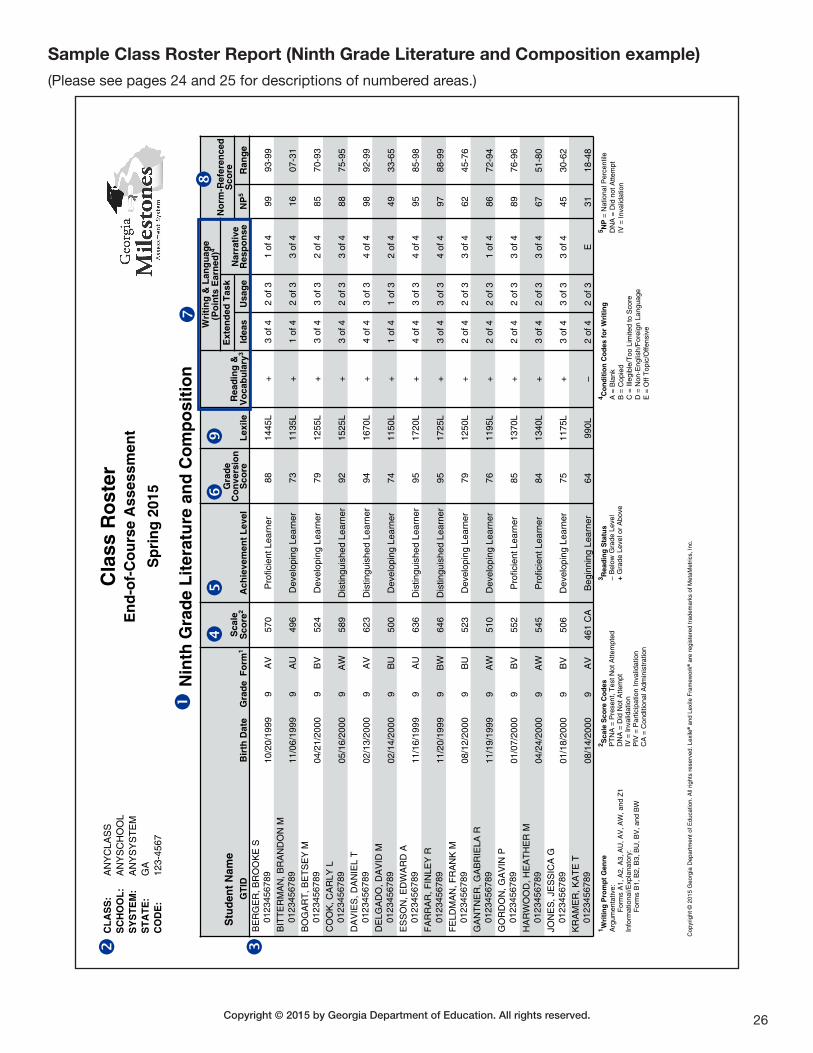
26Copyright © 2015 by Georgia Department of Education. All rights reserved.
Sample Class Roster Report (Ninth Grade Literature and Composition example)(Please see pages 24 and 25 for descriptions of numbered areas.)
Stu
den
t N
ame
GT
IDB
irth
Dat
eG
rad
eF
orm
1S
cale
Sco
re2
Ach
ieve
men
t L
evel
Gra
de
Co
nve
rsio
nS
core
Lex
ileR
ead
ing
&V
oca
bu
lary
3
Wri
tin
g &
Lan
gu
age
(Po
ints
Ear
ned
)4N
orm
-Ref
eren
ced
Sco
reE
xten
ded
Tas
kN
arra
tive
Res
po
nse
Idea
sU
sag
eN
P5
Ran
ge
BE
RG
ER
, BR
OO
KE
S01
2345
6789
10/2
0/19
999
AV
570
Pro
ficie
nt L
earn
er88
1445
L+
3 of
42
of 3
1 of
499
93-9
9B
ITT
ER
MA
N, B
RA
ND
ON
M01
2345
6789
11/0
6/19
999
AU
496
Dev
elop
ing
Lear
ner
7311
35L
+1
of 4
2 of
33
of 4
1607
-31
BO
GA
RT
, BE
TS
EY
M01
2345
6789
04/2
1/20
009
BV
524
Dev
elop
ing
Lear
ner
7912
55L
+3
of 4
3 of
32
of 4
8570
-93
CO
OK
, CA
RLY
L01
2345
6789
05/1
6/20
009
AW
589
Dis
tingu
ishe
d Le
arne
r92
1525
L+
3 of
42
of 3
3 of
488
75-9
5D
AV
IES
, DA
NIE
L T
0123
4567
8902
/13/
2000
9A
V62
3D
istin
guis
hed
Lear
ner
9416
70L
+4
of 4
3 of
34
of 4
9892
-99
DE
LGA
DO
, DA
VID
M01
2345
6789
02/1
4/20
009
BU
500
Dev
elop
ing
Lear
ner
7411
50L
+1
of 4
1 of
32
of 4
4933
-65
ES
SO
N, E
DW
AR
D A
0123
4567
8911
/16/
1999
9A
U63
6D
istin
guis
hed
Lear
ner
9517
20L
+4
of 4
3 of
34
of 4
9585
-98
FA
RR
AR
, FIN
LEY
R01
2345
6789
11/2
0/19
999
BW
646
Dis
tingu
ishe
d Le
arne
r95
1725
L+
3 of
43
of 3
4 of
497
88-9
9F
ELD
MA
N, F
RA
NK
M01
2345
6789
08/1
2/20
009
BU
523
Dev
elop
ing
Lear
ner
7912
50L
+2
of 4
2 of
33
of 4
6245
-76
GA
NT
NE
R, G
AB
RIE
LA R
0123
4567
8911
/19/
1999
9A
W51
0D
evel
opin
g Le
arne
r76
1195
L+
2 of
42
of 3
1 of
486
72-9
4G
OR
DO
N, G
AV
IN P
0123
4567
8901
/07/
2000
9B
V55
2P
rofic
ient
Lea
rner
8513
70L
+2
of 4
2 of
33
of 4
8976
-96
HA
RW
OO
D, H
EA
TH
ER
M01
2345
6789
04/2
4/20
009
AW
545
Pro
ficie
nt L
earn
er84
1340
L+
3 of
42
of 3
3 of
467
51-8
0JO
NE
S, J
ES
SIC
A G
0123
4567
8901
/18/
2000
9B
V50
6D
evel
opin
g Le
arne
r75
1175
L+
3 of
43
of 3
3 of
445
30-6
2K
RA
ME
R, K
AT
E T
0123
4567
8908
/14/
2000
9A
V46
1 C
AB
egin
ning
Lea
rner
6499
0L–
2 of
42
of 3
E31
18-4
81 W
riti
ng
Pro
mp
t G
enre
Arg
umen
tativ
e:
For
ms
A1,
A2,
A3,
AU
, AV
, AW
, and
Z1
Info
rmat
iona
l/Exp
lana
tory
:
For
ms
B1,
B2,
B3,
BU
, BV
, and
BW
2 Sca
le S
core
Co
des
PT
NA
= P
rese
nt, T
est N
ot A
ttem
pted
DN
A =
Did
Not
Atte
mpt
IV =
Inva
lidat
ion
PIV
= P
artic
ipat
ion
Inva
lidat
ion
CA
= C
ondi
tiona
l Adm
inis
trat
ion
3 Rea
din
g S
tatu
s–
Bel
ow G
rade
Lev
el+
Gra
de L
evel
or
Abo
ve
4 Co
nd
itio
n C
od
es f
or
Wri
tin
gA
= B
lank
B =
Cop
ied
C =
Ille
gibl
e/T
oo L
imite
d to
Sco
reD
= N
on-E
nglis
h/F
orei
gn L
angu
age
E =
Off
Top
ic/O
ffens
ive
5 NP
= N
atio
nal P
erce
ntile
DN
A =
Did
not
Atte
mpt
IV =
Inva
lidat
ion
Cop
yrig
ht ©
201
5 G
eorg
ia D
epar
tmen
t of E
duca
tion.
All
right
s re
serv
ed. L
exile
® a
nd L
exile
Fra
mew
ork®
are
reg
iste
red
trad
emar
ks o
f Met
aMet
rics,
Inc.
Cla
ss R
ost
erE
nd
-of-
Co
urs
e A
sses
smen
t
Sp
rin
g 2
015
Nin
th G
rad
e L
iter
atu
re a
nd
Co
mp
osi
tio
n
CL
AS
S:
AN
YC
LAS
SS
CH
OO
L:
AN
YS
CH
OO
LS
YS
TE
M:
AN
YS
YS
TE
MS
TA
TE
:G
AC
OD
E:
123-
4567
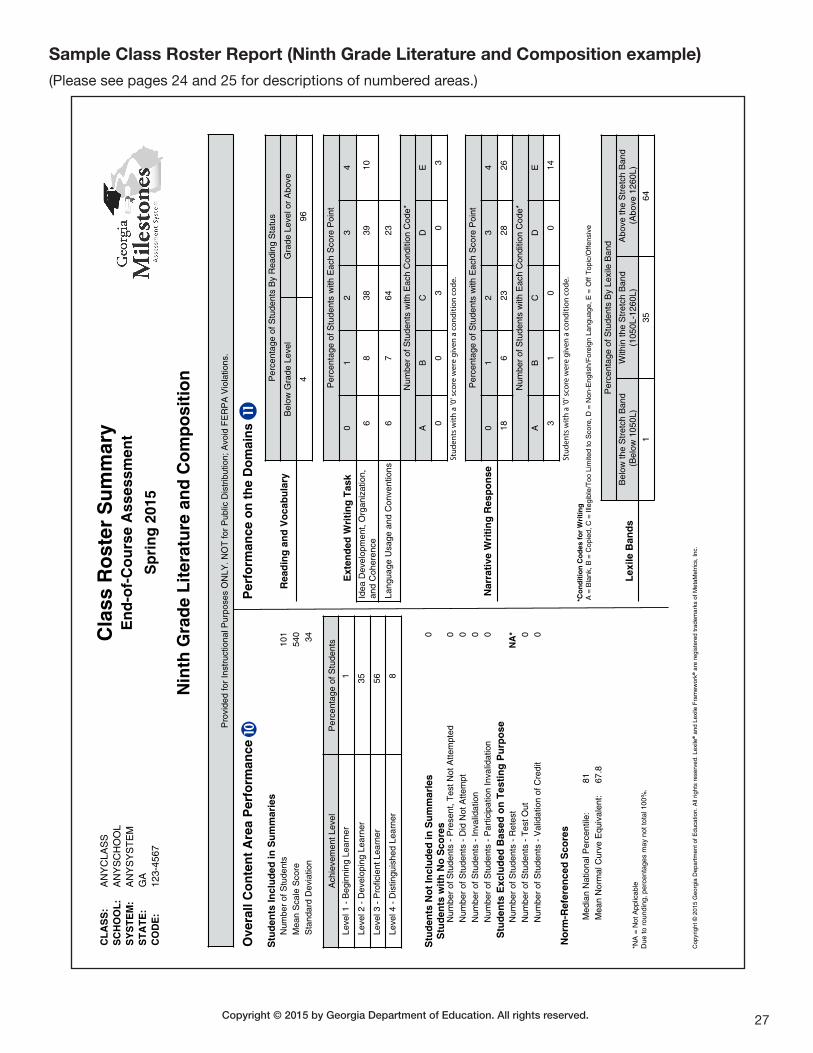
27Copyright © 2015 by Georgia Department of Education. All rights reserved.
Sample Class Roster Report (Ninth Grade Literature and Composition example)(Please see pages 24 and 25 for descriptions of numbered areas.)
Pro
vide
d fo
r In
stru
ctio
nal P
urpo
ses
ON
LY. N
OT
for
Pub
lic D
istr
ibut
ion;
Avo
id F
ER
PA
Vio
latio
ns.
Ove
rall
Co
nte
nt
Are
a P
erfo
rman
ce
Stu
den
ts In
clu
ded
in S
um
mar
ies
Num
ber
of S
tude
nts
101
Mea
n S
cale
Sco
re54
0S
tand
ard
Dev
iatio
n34
Ach
ieve
men
t Lev
elP
erce
ntag
e of
Stu
dent
s
Leve
l 1 -
Beg
inni
ng L
earn
er1
Leve
l 2 -
Dev
elop
ing
Lear
ner
35
Leve
l 3 -
Pro
ficie
nt L
earn
er56
Leve
l 4 -
Dis
tingu
ishe
d Le
arne
r8
Stu
den
ts N
ot
Incl
ud
ed in
Su
mm
arle
s
Stu
den
ts w
ith
No
Sco
res
0
Num
ber
of S
tude
nts
- P
rese
nt, T
est N
ot A
ttem
pted
0N
umbe
r of
Stu
dent
s -
Did
Not
Atte
mpt
0N
umbe
r of
Stu
dent
s -
Inva
lidat
ion
0N
umbe
r of
Stu
dent
s -
Par
ticip
atio
n In
valid
atio
n0
Stu
den
ts E
xclu
ded
Bas
ed o
n T
esti
ng
Pu
rpo
seN
umbe
r of
Stu
dent
s -
Ret
est
NA
*N
umbe
r of
Stu
dent
s -
Tes
t Out
0N
umbe
r of
Stu
dent
s -
Val
idat
ion
of C
redi
t0
Cop
yrig
ht ©
201
5 G
eorg
ia D
epar
tmen
t of E
duca
tion.
All
right
s re
serv
ed. L
exile
® a
nd L
exile
Fra
mew
ork®
are
reg
iste
red
trad
emar
ks o
f Met
aMet
rics,
Inc.
Per
form
ance
on
th
e D
om
ain
s
Rea
din
g a
nd
Vo
cab
ula
ryP
erce
ntag
e of
Stu
dent
s B
y R
eadi
ng S
tatu
s
Bel
ow G
rade
Lev
elG
rade
Lev
el o
r A
bove
496
Ext
end
ed W
riti
ng
Tas
k
Per
cent
age
of S
tude
nts
with
Eac
h S
core
Poi
nt
01
23
4
Idea
Dev
elop
men
t, O
rgan
izat
ion,
and
Coh
eren
ce6
838
3910
Lang
uage
Usa
ge a
nd C
onve
ntio
ns6
764
23
Num
ber
of S
tude
nts
with
Eac
h C
ondi
tion
Cod
e*
AB
CD
E
0
03
03
Stud
ents
with
a '0
' sco
re w
ere
give
n a
cond
ition
cod
e.
Nar
rati
ve W
riti
ng
Res
po
nse
Per
cent
age
of S
tude
nts
with
Eac
h S
core
Poi
nt
01
23
4
186
2328
26
Num
ber
of S
tude
nts
with
Eac
h C
ondi
tion
Cod
e*
AB
CD
E
31
00
14
Stud
ents
with
a '0
' sco
re w
ere
give
n a
cond
ition
cod
e.
*Co
nd
itio
n C
od
es f
or
Wri
tin
g A
= B
lank
, B =
Cop
ied,
C =
Ille
gibl
e/T
oo L
imite
d to
Sco
re, D
= N
on-E
nglis
h/F
orei
gn L
angu
age,
E =
Off
Top
ic/O
ffens
ive
Lex
ile B
and
s
Per
cent
age
of S
tude
nts
By
Lexi
le B
and
Bel
ow th
e S
tret
ch B
and
(Bel
ow 1
050L
)W
ithin
the
Str
etch
Ban
d(1
050L
-126
0L)
Abo
ve th
e S
tret
ch B
and
(Abo
ve 1
260L
)
135
64
No
rm-R
efer
ence
d S
core
s
Med
ian
Nat
iona
l Per
cent
ile:
81M
ean
Nor
mal
Cur
ve E
quiv
alen
t:67
.8
CL
AS
S:
AN
YC
LAS
SS
CH
OO
L:
AN
YS
CH
OO
LS
YS
TE
M:
AN
YS
YS
TE
MS
TA
TE
:G
AC
OD
E:
123-
4567
Cla
ss R
ost
er S
um
mar
yE
nd
-of-
Co
urs
e A
sses
smen
t
Sp
rin
g 2
015
Nin
th G
rad
e L
iter
atu
re a
nd
Co
mp
osi
tio
n
*NA
= N
ot A
pplic
able
Due
to r
ound
ing,
per
cent
ages
may
not
tota
l 100
%.
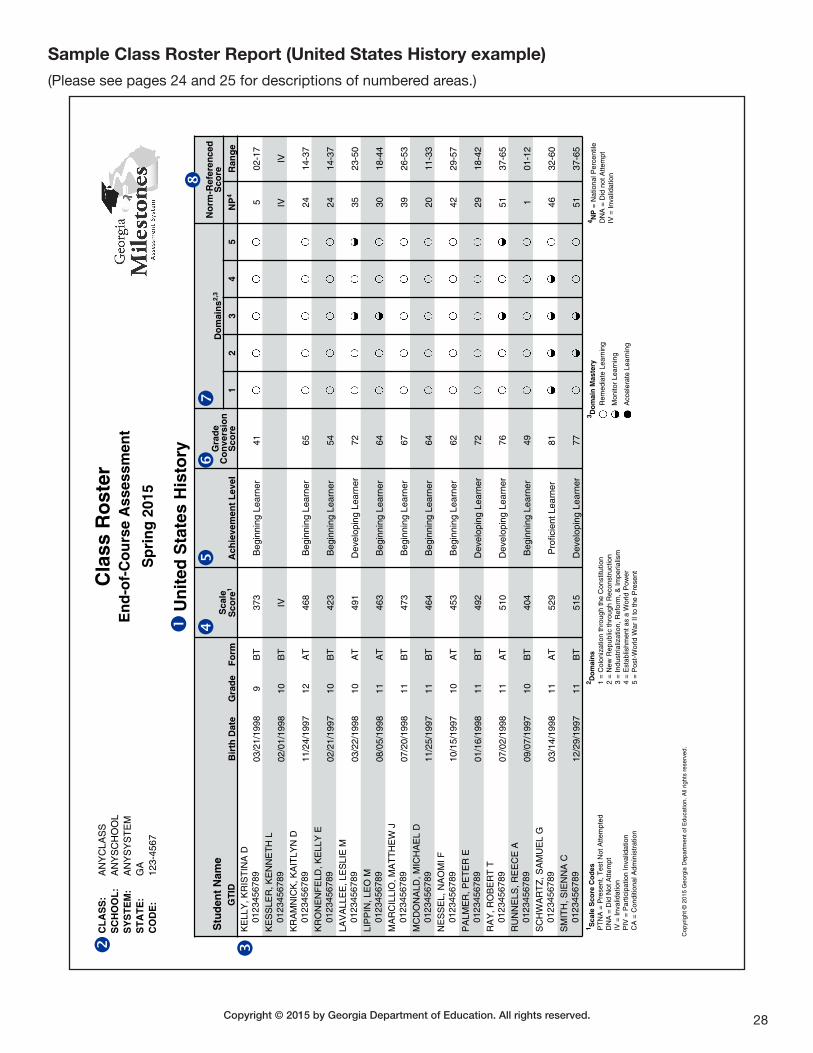
28Copyright © 2015 by Georgia Department of Education. All rights reserved.
Sample Class Roster Report (United States History example)(Please see pages 24 and 25 for descriptions of numbered areas.)
CL
AS
S:
AN
YC
LAS
SS
CH
OO
L:
AN
YS
CH
OO
LS
YS
TE
M:
AN
YS
YS
TE
MS
TA
TE
:G
AC
OD
E:
123-
4567
Cla
ss R
ost
erE
nd
-of-
Co
urs
e A
sses
smen
t
Sp
rin
g 2
015
Un
ited
Sta
tes
His
tory
Stu
den
t N
ame
GT
IDB
irth
Dat
eG
rad
eF
orm
Sca
leS
core
1A
chie
vem
ent
Lev
el
Gra
de
Co
nve
rsio
nS
core
Do
mai
ns2,
3N
orm
-Ref
eren
ced
Sco
re
12
34
5N
P4
Ran
ge
KE
LLY
, KR
IST
INA
D01
2345
6789
03/2
1/19
989
BT
373
Beg
inni
ng L
earn
er41
502
-17
KE
SS
LER
, KE
NN
ET
H L
0123
4567
8902
/01/
1998
10B
TIV
IVIV
KR
AM
NIC
K, K
AIT
LYN
D01
2345
6789
11/2
4/19
9712
AT
468
Beg
inni
ng L
earn
er65
2414
-37
KR
ON
EN
FE
LD, K
ELL
Y E
0123
4567
8902
/21/
1997
10B
T42
3B
egin
ning
Lea
rner
5424
14-3
7LA
VA
LLE
E, L
ES
LIE
M01
2345
6789
03/2
2/19
9810
AT
491
Dev
elop
ing
Lear
ner
7235
23-5
0LI
PP
IN, L
EO
M01
2345
6789
08/0
5/19
9811
AT
463
Beg
inni
ng L
earn
er64
3018
-44
MA
RC
ILLI
O, M
AT
TH
EW
J01
2345
6789
07/2
0/19
9811
BT
473
Beg
inni
ng L
earn
er67
3926
-53
MC
DO
NA
LD, M
ICH
AE
L D
0123
4567
8911
/25/
1997
11B
T46
4B
egin
ning
Lea
rner
6420
11-3
3N
ES
SE
L, N
AO
MI F
0123
4567
8910
/15/
1997
10A
T45
3B
egin
ning
Lea
rner
6242
29-5
7P
ALM
ER
, PE
TE
R E
0123
4567
8901
/16/
1998
11B
T49
2D
evel
opin
g Le
arne
r72
2918
-42
RA
Y, R
OB
ER
T T
0123
4567
8907
/02/
1998
11A
T51
0D
evel
opin
g Le
arne
r76
5137
-65
RU
NN
ELS
, RE
EC
E A
0123
4567
8909
/07/
1997
10B
T40
4B
egin
ning
Lea
rner
491
01-1
2S
CH
WA
RT
Z, S
AM
UE
L G
0123
4567
8903
/14/
1998
11A
T52
9P
rofic
ient
Lea
rner
8146
32-6
0S
MIT
H, S
IEN
NA
C01
2345
6789
12/2
9/19
9711
BT
515
Dev
elop
ing
Lear
ner
7751
37-6
51 S
cale
Sco
re C
od
esP
TN
A =
Pre
sent
, Tes
t Not
Atte
mpt
edD
NA
= D
id N
ot A
ttem
ptIV
= In
valid
atio
nP
IV =
Par
ticip
atio
n In
valid
atio
nC
A =
Con
ditio
nal A
dmin
istr
atio
n
2 Do
mai
ns
1 =
Col
oniz
atio
n th
roug
h th
e C
onst
itutio
n2
= N
ew R
epub
lic th
roug
h R
econ
stru
ctio
n3
= In
dust
rializ
atio
n, R
efor
m, &
Impe
rialis
m4
= E
stab
lishm
ent a
s a
Wor
ld P
ower
5 =
Pos
t-W
orld
War
II to
the
Pre
sent
3 Do
mai
n M
aste
ryR
emed
iate
Lea
rnin
g
Mon
itor
Lear
ning
Acc
eler
ate
Lear
ning
4 NP
= N
atio
nal P
erce
ntile
DN
A =
Did
not
Atte
mpt
IV =
Inva
lidat
ion
Cop
yrig
ht ©
201
5 G
eorg
ia D
epar
tmen
t of E
duca
tion.
All
right
s re
serv
ed.
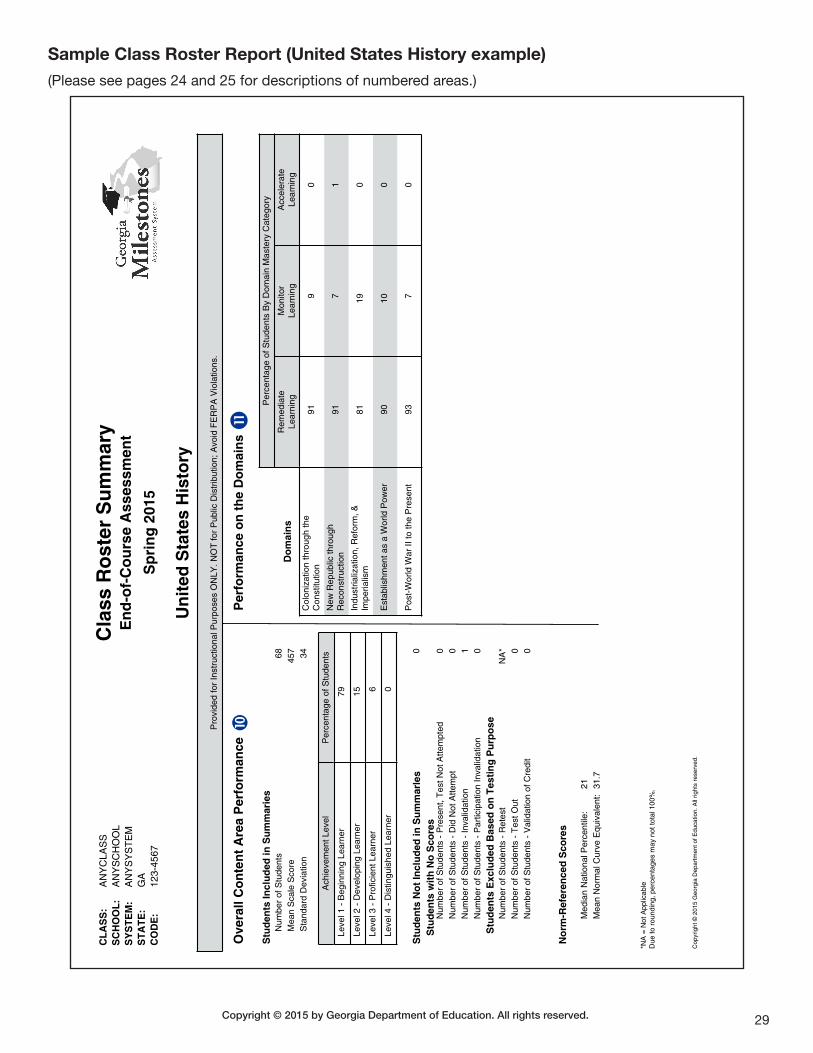
29Copyright © 2015 by Georgia Department of Education. All rights reserved.
Sample Class Roster Report (United States History example)(Please see pages 24 and 25 for descriptions of numbered areas.)
Pro
vide
d fo
r In
stru
ctio
nal P
urpo
ses
ON
LY. N
OT
for
Pub
lic D
istr
ibut
ion;
Avo
id F
ER
PA
Vio
latio
ns.
Ove
rall
Co
nte
nt
Are
a P
erfo
rman
ce
Stu
den
ts In
clu
ded
in S
um
mar
ies
Num
ber
of S
tude
nts
68M
ean
Sca
le S
core
457
Sta
ndar
d D
evia
tion
34
Ach
ieve
men
t Lev
elP
erce
ntag
e of
Stu
dent
s
Le
vel 1
- B
egin
ning
Lea
rner
79
Le
vel 2
- D
evel
opin
g Le
arne
r15
Le
vel 3
- P
rofic
ient
Lea
rner
6
Le
vel 4
- D
istin
guis
hed
Lear
ner
0
Stu
den
ts N
ot
Incl
ud
ed in
Su
mm
arle
s
Stu
den
ts w
ith
No
Sco
res
0
Num
ber
of S
tude
nts
- P
rese
nt, T
est N
ot A
ttem
pted
0N
umbe
r of
Stu
dent
s -
Did
Not
Atte
mpt
0N
umbe
r of
Stu
dent
s -
Inva
lidat
ion
1N
umbe
r of
Stu
dent
s -
Par
ticip
atio
n In
valid
atio
n0
Stu
den
ts E
xclu
ded
Bas
ed o
n T
esti
ng
Pu
rpo
seN
umbe
r of
Stu
dent
s -
Ret
est
NA
*N
umbe
r of
Stu
dent
s -
Tes
t Out
0N
umbe
r of
Stu
dent
s -
Val
idat
ion
of C
redi
t0
No
rm-R
efer
ence
d S
core
s
Med
ian
Nat
iona
l Per
cent
ile:
21M
ean
Nor
mal
Cur
ve E
quiv
alen
t:31
.7
*NA
= N
ot A
pplic
able
Due
to r
ound
ing,
per
cent
ages
may
not
tota
l 100
%.
Cop
yrig
ht ©
201
5 G
eorg
ia D
epar
tmen
t of E
duca
tion.
All
right
s re
serv
ed.
Per
form
ance
on
th
e D
om
ain
s
Do
mai
ns
Per
cent
age
of S
tude
nts
By
Dom
ain
Mas
tery
Cat
egor
y
Rem
edia
teLe
arni
ngM
onito
rLe
arni
ngA
ccel
erat
eLe
arni
ng
Col
oniz
atio
n th
roug
h th
eC
onst
itutio
n91
90
New
Rep
ublic
thro
ugh
Rec
onst
ruct
ion
917
1
Indu
stria
lizat
ion,
Ref
orm
, &Im
peria
lism
8119
0
Est
ablis
hmen
t as
a W
orld
Pow
er90
100
Pos
t-W
orld
War
II to
the
Pre
sent
937
0
Cla
ss R
ost
er S
um
mar
yE
nd
-of-
Co
urs
e A
sses
smen
t
Sp
rin
g 2
015
Un
ited
Sta
tes
His
tory
CL
AS
S:
AN
YC
LAS
SS
CH
OO
L:
AN
YS
CH
OO
LS
YS
TE
M:
AN
YS
YS
TE
MS
TA
TE
:G
AC
OD
E:
123-
4567
30Copyright © 2015 by Georgia Department of Education. All rights reserved.
Content Area Summary ReportsContent Area Summary Reports are generated at the state, system, and school levels for each course. Each of these reports contains similar information but comparison data are presented at different levels of aggregation. The School Content Area Summary Report provides overall performance data and domain-level data for the school, system, RESA, and state. Similarly, the System Content Area Summary Report provides overall performance data and domain-level data for the system, RESA, and state. The State Content Area Summary Report simply provides these data at the overall state level.
A Sample School Content Area Summary Report for Ninth Grade Literature and Composition appears on pages 33 and 34.
A Sample System Content Area Summary Report for United States History appears on pages 35 and 36.
Page 1 of the Content Area Summary Reports are similar for all EOC assessments and provide:
Overall Performance
� Number of Students – In Ninth Grade Literature and Composition, 344 students at the school received scores. In United States History, the school system had 2,848 students with scores.
� Mean Scale Score – In Ninth Grade Literature and Composition, the mean scale score for the school is 495, which is lower than that of the system, RESA, and state. In United States History, the mean scale score for the system is 523, which is higher than both the RESA and state.
� Standard Deviation – In Ninth Grade Literature and Composition, the school has a standard deviation of 55. In United States History, the system’s standard deviation is 58.
� Percentage Proficient (Levels 3 & 4) – In Ninth Grade Literature and Composition, 28% of the students at the school achieved proficiency (Levels 3 & 4) as compared to 43%, 36%, and 34% at the system, RESA, and state levels, respectively. In United States History, the system had a greater percentage of students in Levels 3 and 4 (48%) than reported at the RESA (35%) and state levels (36%).
Percentage of Students Proficient (Levels 3 & 4): This is a graphical display of the percentages of students who demonstrate proficiency in the knowledge and skills necessary in this course.
Percentage of Students by Achievement Level: This is a graphical display of the percentages of students in each achievement level. In Ninth Grade Literature and Composition, the graph shows that the school had a larger percentage of students in both the Beginning Learner and Developing Learner categories than the system, RESA, or state. In United States History, the system had more students scoring in the Proficient Learner and Distinguished Learner categories than the RESA and state.
Norm-Referenced Performance
� Median National Percentile – The median national percentile is the score that divides the distribution of student scores in half. The median national percentile for the nation is 50, meaning that half of the students score above 50 and half of them score below 50. In Ninth Grade Literature and Composition, the median national percentile of 58 for the school is lower than that of the system, RESA, and state. In United States History, the median national percentile for the system is 56, which is higher than both the RESA and state.
� Mean Normal Curve Equivalent – The Normal Curve Equivalent (NCE) scale ranges from 1-99 and coincides with the percentile scale at 1, 50, and 99. These are based on an equal-interval scale, which allows for meaningful comparisons. The mean NCE is computed by adding the NCE scores of all students in a group and then dividing by the number of students in that group. In Ninth Grade Literature and Composition, the school received a mean NCE score of 52.5. In United States History, the system’s mean NCE score was 53.4.
31Copyright © 2015 by Georgia Department of Education. All rights reserved.
Summary Data Exclusions: This table provides counts for the number of students that were excluded from summary data calculations at either the school, system, or state levels (no comparison data is provided).
Students were excluded from summary data for one of two reasons:
1) They received a PTNA, DNA, IV, or PIV designation in lieu of a scale score.
� Present, Test Not Attempted (PTNA) – One student in the school received a PTNA on the Ninth Grade Literature and Composition EOC assessment.
� Did Not Attempt (DNA) – No students had a DNA. � Invalidation (IV) – Six students in the system received an IV on the United States History EOC
assessment. � Participation Invalidation (PIV) – No students received a PIV.
2) They indicated that their purpose for EOC testing was for retest, test out, or validation of credit. Although these students do receive a scale score, their scores are not included in calculations for summary reporting purposes.
� Purpose – Retest (not applicable for the 2014 –2015 school year) � Purpose – Test Out – No students indicated they took an EOC assessment for test out purposes. � Purpose – Validation of Credit – No students indicated they took an EOC assessment for validation
of credit.
Page 2 of the Content Area Summary Reports for ELA EOC assessments differ from those for mathematics, science, and social studies in the way the domain level information is reported.
Page 2 of an ELA EOC Content Area Summary Report
Performance by Reading Status – Displays the percentage of students who are Below Grade Level or at Grade Level or Above for the Reading and Vocabulary Domain. On the Ninth Grade Literature and Composition school report, 69% of students are reading at Grade Level or Above as compared to 80% at the system level and 73% at the RESA and state levels.
Lexile Distribution (ELA only) – This is a graphical display of the percentages of students scoring in each Lexile “Stretch Band.” The Ninth Grade Literature and Composition example shows the following:
� Above the Stretch Band – 27 percent of students in the school scored above 1260L. � Within the Stretch Band – 42 percent of students in the school scored between 1050L and 1260L. � Below the Stretch Band – 31 percent of students in the school scored below 1050L.
The graph shows that the school has a greater percentage of students scoring below the stretch band and a lower percentage of students scoring above the stretch band than the system, RESA, and state. Percentages of students scoring within the stretch band are similar for the school, system, RESA, and state.
Percentage of Students with Each Score Point (ELA only): ELA Content Area Summary Reports also include domain-level information for the Writing and Language domain. Tables show the percentages of students obtaining each score point for the Extended Writing Task (Traits 1 and 2) and the Narrative Writing Response. Trait 1 of the Extended Writing Task measures Idea Development, Organization, and Coherence and is worth 4 possible points. Trait 2 of the Extended Writing Task measures Language Usage and Conventions and is worth 3 possible points. The Narrative Writing Response is worth a maximum of 4 points.
The sample Ninth Grade Literature and Composition school report shows that 4% of students in the school obtained the highest possible score on Trait 1 while 10% achieved the highest possible score on Trait 2 of the Extended Writing Task. On the Narrative Writing Response, 9% of students in the school received the highest score of 4 points. These results show that a smaller percentage of students at the school are receiving the highest writing scores compared to the system, RESA, and state.
32Copyright © 2015 by Georgia Department of Education. All rights reserved.
Number of Students with a Writing Condition Code (ELA only): Condition codes are assigned when a score cannot be assigned to the Extended Writing Task or the Narrative Writing Response. The tables in this section of the Content Area Summary Report show the number of students that received a ‘0’ score on one of the writing tasks and the reason why. There are five writing condition codes to indicate the reason why a response was not able to be scored.
� A: Blank – no student response
� B: Copied – copied from a published source
� C: Illegible/Too Limited to Score – illegible or information provided was too limited to score
� D: Non-English/Foreign Language – response was written in a language other than English
� E: Off Topic/Offensive – the response is off topic or offensive language or pictures were used
For the Ninth Grade Literature and Composition sample report, 21% of the students in the school received a ‘0’ score on the Extended Writing Task as indicated in Section 8 of the report. Section 9 of the report shows that this 21% represents a total of 73 students. Of these 73 students, 35 students received a writing condition code ‘A’ for Blank, indicating that they did not provide a response to the Extended Writing Task. Likewise, 30 students received a condition code of ‘C’ meaning that their response was illegible or information was too limited to score. The remaining 8 students received condition codes of B and E. Similar information is provided for students receiving a writing condition code for the Narrative Writing Response.
It is important to highlight that this section of the report reflects the number of students, rather than the percentage of students. Therefore, the numbers will always be higher at the system, RESA, and state levels than the school level. However, comparisons can be made regarding the frequency of these condition codes and their distribution across the various reasons.
Page 2 of a Content Area Summary Report for mathematics, science, and social studies
Domain Performance – Displays percentages of students in each mastery category for each domain. On the United States History report, the first domain is Colonization through the Constitution. For this domain, system-level results show that 54% of students scored in the Remediate Learning mastery category, 31% in the Monitor Learning category, and 15% in the Accelerate Learning category. System-level domain performance can be compared to other domains, as well as to performance at the RESA and state levels.
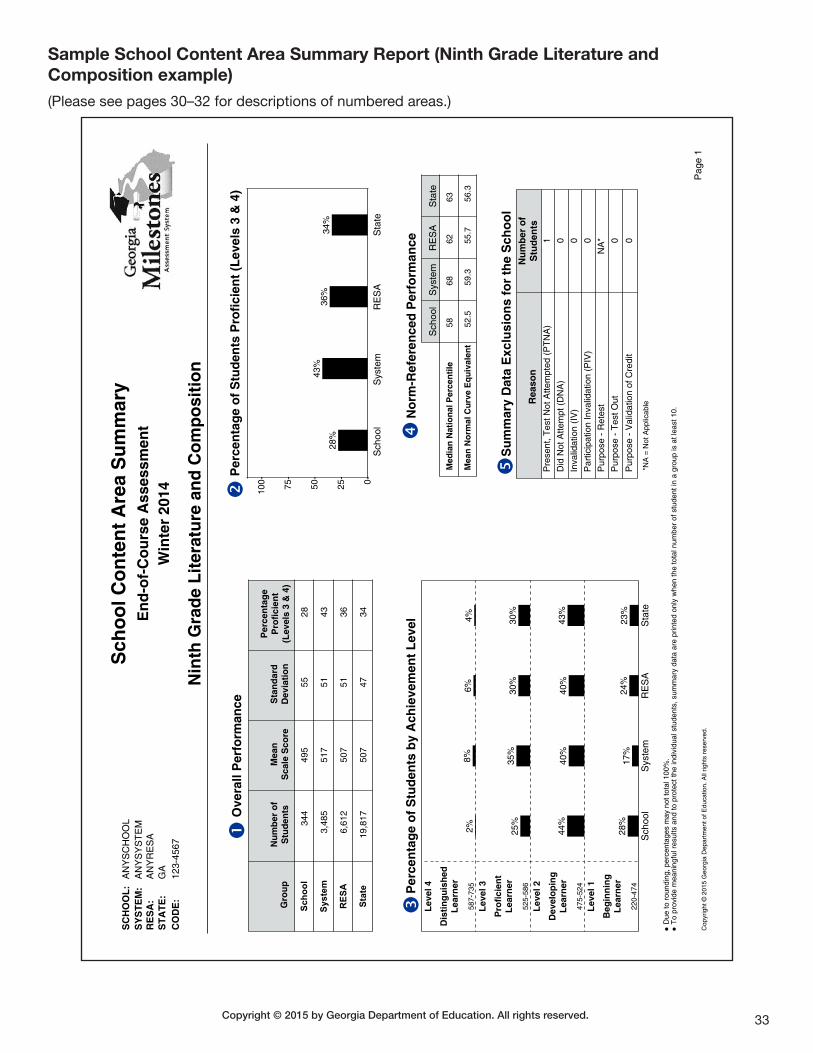
33Copyright © 2015 by Georgia Department of Education. All rights reserved.
Sample School Content Area Summary Report (Ninth Grade Literature and Composition example)(Please see pages 30–32 for descriptions of numbered areas.)
Sch
oo
l Co
nte
nt
Are
a S
um
mar
yE
nd
-of-
Co
urs
e A
sses
smen
tW
inte
r 20
14
Nin
th G
rad
e L
iter
atu
re a
nd
Co
mp
osi
tio
n
Ove
rall
Per
form
ance
Gro
up
Nu
mb
er o
fS
tud
ents
Mea
nS
cale
Sco
reS
tan
dar
dD
evia
tio
n
Per
cen
tag
eP
rofi
cien
t(L
evel
s 3
& 4
)
Scho
ol34
449
555
28
Syst
em3,
485
517
5143
RES
A6,
612
507
5136
Stat
e19
,817
507
4734
100- 75-
50-
25- 0-
28%
43%
36%
34%
Per
cen
tag
e o
f S
tud
ents
Pro
fici
ent
(Lev
els
3 &
4)
Sch
ool
Sys
tem
RE
SA
Sta
te
No
rm-R
efer
ence
d P
erfo
rman
ce
Sch
ool
Sys
tem
RE
SA
Sta
te
Med
ian
Nat
ion
al P
erce
nti
le58
6862
63
Mea
n N
orm
al C
urv
e E
qu
ival
ent
52.5
59.3
55.7
56.3
Su
mm
ary
Dat
a E
xclu
sio
ns
for
the
Sch
oo
l
Rea
son
Nu
mb
er o
fS
tud
ents
Pre
sent
, Tes
t Not
Atte
mpt
ed (
PT
NA
)1
Did
Not
Atte
mpt
(D
NA
)0
Inva
lidat
ion
(IV
)0
Par
ticip
atio
n In
valid
atio
n (P
IV)
0
Pur
pose
- R
etes
tN
A*
Pur
pose
- T
est O
ut0
Pur
pose
- V
alid
atio
n of
Cre
dit
0
*NA
= N
ot A
pplic
able
Cop
yrig
ht ©
201
5 G
eorg
ia D
epar
tmen
t of E
duca
tion.
All
right
s re
serv
ed.
Pag
e 1
SC
HO
OL
:A
NY
SC
HO
OL
SY
ST
EM
:A
NY
SY
ST
EM
RE
SA
:A
NY
RE
SA
ST
AT
E:
GA
CO
DE
:12
3-45
67
2%8%
6%4%
25%
35%
30%
30%
44%
40%
40%
43%
28%
17%
24%
23%
Per
cen
tag
e o
f S
tud
ents
by
Ach
ieve
men
t L
evel
Lev
el 4
Dis
tin
gu
ish
edL
earn
er
587-
735
Lev
el 3
Pro
fici
ent
Lea
rner
525-
586
Lev
el 2
Dev
elo
pin
gL
earn
er
475-
524
Lev
el 1
Beg
inn
ing
Lea
rner
220-
474
Sch
ool
Sys
tem
RE
SA
Sta
te
● D
ue to
rou
ndin
g, p
erce
ntag
es m
ay n
ot to
tal 1
00%
.●
To
prov
ide
mea
ning
ful r
esul
ts a
nd to
pro
tect
the
indi
vidu
al s
tude
nts,
sum
mar
y da
ta a
re p
rinte
d on
ly w
hen
the
tota
l num
ber
of s
tude
nt in
a g
roup
is a
t lea
st 1
0.
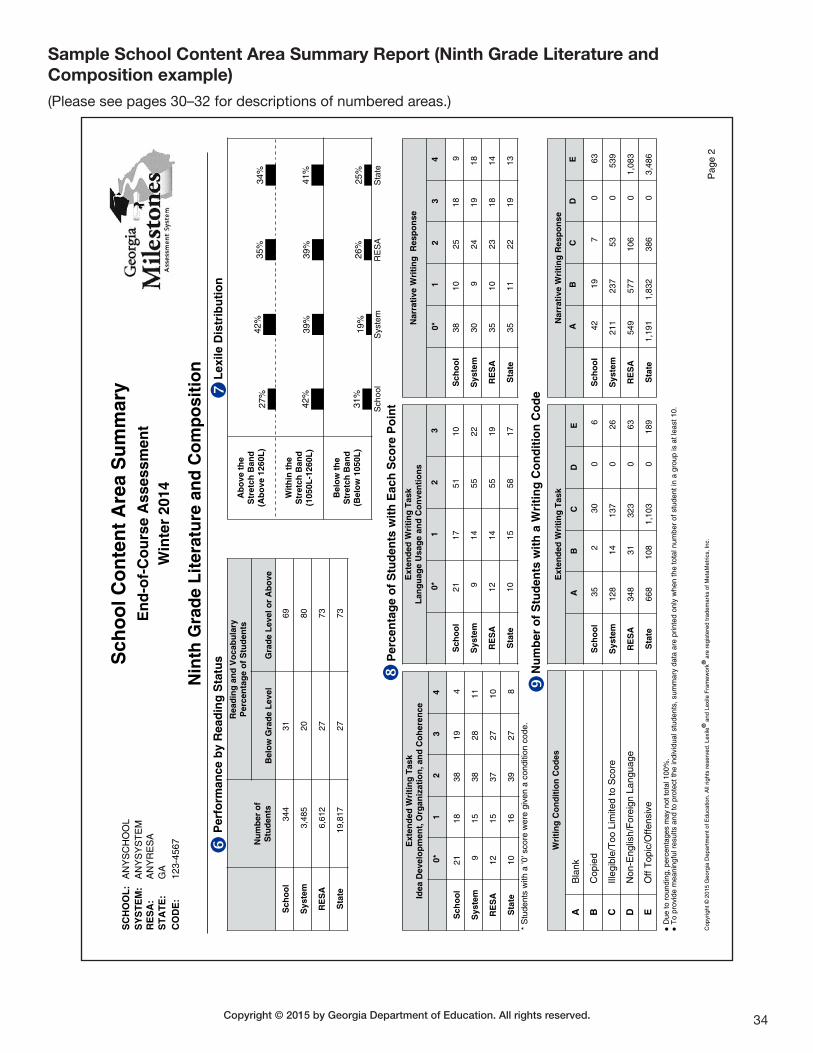
34Copyright © 2015 by Georgia Department of Education. All rights reserved.
Sample School Content Area Summary Report (Ninth Grade Literature and Composition example)(Please see pages 30–32 for descriptions of numbered areas.)
Per
form
ance
by
Rea
din
g S
tatu
s
Nu
mb
er o
fS
tud
ents
Rea
din
g a
nd
Vo
cab
ula
ryP
erce
nta
ge
of
Stu
den
ts
Bel
ow
Gra
de
Lev
elG
rad
e L
evel
or
Ab
ove
Sch
oo
l34
431
69
Sys
tem
3,48
520
80
RE
SA
6,61
227
73
Sta
te19
,817
2773
27%
42%
35%
34%
42%
39%
39%
41%
31%
19%
26%
25%
Lex
ile D
istr
ibu
tio
n
Ab
ove
th
eS
tret
ch B
and
(Ab
ove
126
0L)
Wit
hin
th
eS
tret
ch B
and
(105
0L-1
260L
)
Bel
ow
th
eS
tret
ch B
and
(Bel
ow
105
0L)
Sch
ool
Sys
tem
RE
SA
Sta
te
Ext
end
ed W
riti
ng
Tas
kId
ea D
evel
op
men
t, O
rgan
izat
ion
, an
d C
oh
eren
ce
0*1
23
4
Sch
oo
l21
1838
194
Sys
tem
915
3828
11
RE
SA
1215
3727
10
Sta
te10
1639
278
* S
tude
nts
with
a '0
' sco
re w
ere
give
n a
cond
ition
cod
e.
Per
cen
tag
e o
f S
tud
ents
wit
h E
ach
Sco
re P
oin
tE
xten
ded
Wri
tin
g T
ask
Lan
gu
age
Usa
ge
and
Co
nve
nti
on
s
0*1
23
Sch
oo
l21
1751
10
Sys
tem
914
5522
RE
SA
1214
5519
Sta
te10
1558
17
Nar
rati
ve W
riti
ng
Res
po
nse
0*1
23
4
Sch
oo
l38
1025
189
Sys
tem
309
2419
18
RE
SA
3510
2318
14
Sta
te35
1122
1913
Nu
mb
er o
f S
tud
ents
wit
h a
Wri
tin
g C
on
dit
ion
Co
de
Wri
tin
g C
on
dit
ion
Co
des
AB
lank
BC
opie
d
CIll
egib
le/T
oo L
imite
d to
Sco
re
DN
on-E
nglis
h/F
orei
gn L
angu
age
EO
ff T
opic
/Offe
nsiv
e
Ext
end
ed W
riti
ng
Tas
k
AB
CD
E
Sch
oo
l35
230
06
Sys
tem
128
1413
70
26
RE
SA
348
3132
30
63
Sta
te66
810
81,
103
018
9
Nar
rati
ve W
riti
ng
Res
po
nse
AB
CD
E
Sch
oo
l42
197
063
Sys
tem
211
237
530
539
RE
SA
549
577
106
01,
083
Sta
te1,
191
1,83
238
60
3,48
6
● D
ue to
rou
ndin
g, p
erce
ntag
es m
ay n
ot to
tal 1
00%
.●
To
prov
ide
mea
ning
ful r
esul
ts a
nd to
pro
tect
the
indi
vidu
al s
tude
nts,
sum
mar
y da
ta a
re p
rinte
d on
ly w
hen
the
tota
l num
ber
of s
tude
nt in
a g
roup
is a
t lea
st 1
0.
Cop
yrig
ht ©
201
5 G
eorg
ia D
epar
tmen
t of E
duca
tion.
All
right
s re
serv
ed. L
exile
® a
nd L
exile
Fra
mew
ork®
are
reg
iste
red
trad
emar
ks o
f Met
aMet
rics,
Inc.
Pag
e 2
Sch
oo
l Co
nte
nt
Are
a S
um
mar
yE
nd
-of-
Co
urs
e A
sses
smen
tW
inte
r 20
14
Nin
th G
rad
e L
iter
atu
re a
nd
Co
mp
osi
tio
n
SC
HO
OL
:A
NY
SC
HO
OL
SY
ST
EM
:A
NY
SY
ST
EM
RE
SA
:A
NY
RE
SA
ST
AT
E:
GA
CO
DE
:12
3-45
67

35Copyright © 2015 by Georgia Department of Education. All rights reserved.
Sample System Content Area Summary Report (United States History example)(Please see pages 30–32 for descriptions of numbered areas.)
Sys
tem
Co
nte
nt
Are
a S
um
mar
yE
nd
-of-
Co
urs
e A
sses
smen
tW
inte
r 20
14
Un
ited
Sta
tes
His
tory
Ove
rall
Per
form
ance
Gro
up
Nu
mb
er o
fS
tud
ents
Mea
nS
cale
Sco
reS
tan
dar
dD
evia
tio
n
Per
cen
tag
eP
rofi
cien
t(L
evel
s 3
& 4
)
Syst
em2,
848
523
5848
RES
A6,
150
505
5635
Stat
e18
,268
508
5436
11%
7%6%
36%
28%
30%
30%
33%
34%
22%
32%
30%
Per
cen
tag
e o
f S
tud
ents
by
Ach
ieve
men
t L
evel
Lev
el 4
Dis
tin
gu
ish
edL
earn
er
590-
765
Lev
el 3
Pro
fici
ent
Lea
rner
525-
589
Lev
el 2
Dev
elo
pin
gL
earn
er
475-
524
Lev
el 1
Beg
inn
ing
Lea
rner
215-
474
Sys
tem
RE
SA
Sta
te
Su
mm
ary
Dat
a E
xclu
sio
ns
for
the
Sys
tem
Rea
son
Nu
mb
er o
fS
tud
ents
Pre
sent
, Tes
t Not
Atte
mpt
ed (
PT
NA
)0
Did
Not
Atte
mpt
(D
NA
)0
Inva
lidat
ion
(IV
)6
Par
ticip
atio
n In
valid
atio
n (P
IV)
0
Pur
pose
- R
etes
tN
A*
Pur
pose
- T
est O
ut0
Pur
pose
- V
alid
atio
n of
Cre
dit
0
*NA
= N
ot A
pplic
able
Cop
yrig
ht ©
201
5 G
eorg
ia D
epar
tmen
t of E
duca
tion.
All
right
s re
serv
ed.
Pag
e 1
100- 75-
50-
25- 0-
SY
ST
EM
:A
NY
SY
ST
EM
RE
SA
:A
NY
RE
SA
ST
AT
E:
GA
CO
DE
:12
3
48%
35%
36%
Per
cen
tag
e o
f S
tud
ents
Pro
fici
ent
(Lev
els
3 &
4)
Sys
tem
RE
SA
Sta
te
No
rm-R
efer
ence
d P
erfo
rman
ce
Sys
tem
RE
SA
Sta
te
Med
ian
Nat
ion
al P
erce
nti
le56
4546
Mea
n N
orm
al C
urv
e E
qu
ival
ent
53.4
47.7
48.3
● D
ue to
rou
ndin
g, p
erce
ntag
es m
ay n
ot to
tal 1
00%
.●
To
prov
ide
mea
ning
ful r
esul
ts a
nd to
pro
tect
the
indi
vidu
al s
tude
nts,
sum
mar
y da
ta a
re p
rinte
d on
ly w
hen
the
tota
l num
ber
of s
tude
nt in
a g
roup
is a
t lea
st 1
0.
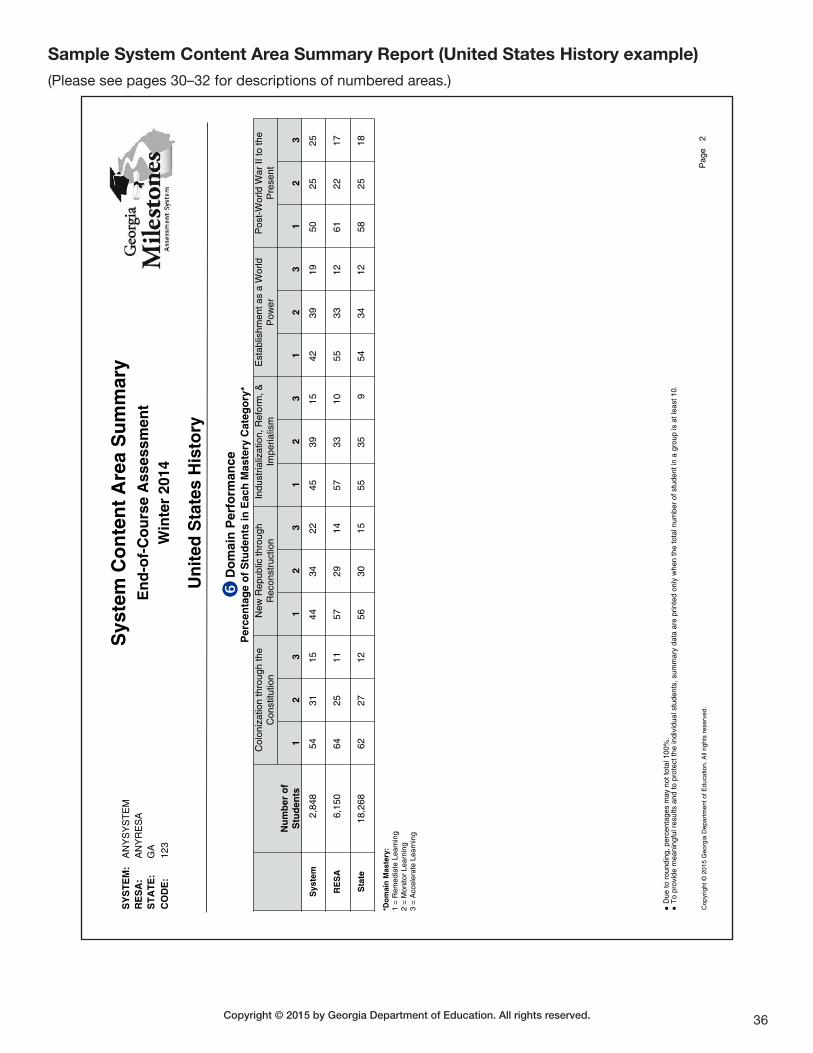
36Copyright © 2015 by Georgia Department of Education. All rights reserved.
Sample System Content Area Summary Report (United States History example)(Please see pages 30–32 for descriptions of numbered areas.)
Cop
yrig
ht ©
201
5 G
eorg
ia D
epar
tmen
t of E
duca
tion.
All
right
s re
serv
ed.
Do
mai
n P
erfo
rman
ceP
erce
nta
ge
of
Stu
den
ts in
Eac
h M
aste
ry C
ateg
ory
*
Nu
mb
er o
fS
tud
ents
Col
oniz
atio
n th
roug
h th
eC
onst
itutio
nN
ew R
epub
lic th
roug
hR
econ
stru
ctio
nIn
dust
rializ
atio
n, R
efor
m, &
Impe
rialis
mE
stab
lishm
ent a
s a
Wor
ldP
ower
Pos
t-W
orld
War
II to
the
Pre
sent
12
31
23
12
31
23
12
3
Sys
tem
2,84
854
3115
4434
2245
3915
4239
1950
2525
RE
SA
6,15
064
2511
5729
1457
3310
5533
1261
2217
Sta
te18
,268
6227
1256
3015
5535
954
3412
5825
18
*Do
mai
n M
aste
ry:
1 =
Rem
edia
te L
earn
ing
2 =
Mon
itor
Lear
ning
3 =
Acc
eler
ate
Lear
ning
Pag
e2
Sys
tem
Co
nte
nt
Are
a S
um
mar
yE
nd
-of-
Co
urs
e A
sses
smen
tW
inte
r 20
14
Un
ited
Sta
tes
His
tory
● D
ue to
rou
ndin
g, p
erce
ntag
es m
ay n
ot to
tal 1
00%
.●
To
prov
ide
mea
ning
ful r
esul
ts a
nd to
pro
tect
the
indi
vidu
al s
tude
nts,
sum
mar
y da
ta a
re p
rinte
d on
ly w
hen
the
tota
l num
ber
of s
tude
nt in
a g
roup
is a
t lea
st 1
0.
SY
ST
EM
:A
NY
SY
ST
EM
RE
SA
:A
NY
RE
SA
ST
AT
E:
GA
CO
DE
:12
3

37Copyright © 2015 by Georgia Department of Education. All rights reserved.
Summary Reports of All Student PopulationsSummary Reports of All Student Populations are generated at the school, system, and state levels. The reports are generated by course and present summary statistics for all students as well as particular groups of students.
A sample state summary report for United States History appears on pages 38 and 39. Population Summary Reports for other courses (including the two ELA courses) contain similar information.
The Summary of All Student Populations Report provides:
Group: The student group provides a break out for all students and various demographic groups such as regular program students (e.g., Section 504, English learners), special education students (disaggregated by specific disabilities), gender, ethnicity/race, and students provided with accommodations.
Number of Students: The summary report identifies the total number of students who received scores as well as a disaggregation by the number of students who received scores based on a conditional administration versus a standard administration. The sample report indicates that 15 students had conditional administrations and 18,253 had standard administrations for a total of 18,268 students statewide receiving scores on the United States History EOC assessment. As expected, most of these 18,268 students are regular program students (16,766) while 1,502 are special education students.
Mean Scale Score: This statistic indicates the arithmetic average scale score for each group of students in the state who received scores. The sample report indicates that the mean scale score for all students is 508. When looking at gender, males had a higher mean scale score than females (513 vs. 503).
Percentage of Students Scoring in Each Achievement Level: There are four achievement levels for the EOC assessment—Beginning Learner, Developing Learner, Proficient Learner, and Distinguished Learner. In United States History, 30% are Beginning Learners, 34% are Developing Learners, 30% are Proficient Learners, and 6% are Distinguished Learners in the All Students category.
Purpose of Testing: There are a number of reasons why a student may be taking the EOC assessment. The most common reason is because a student is completing a course and the EOC assessment is required as the final exam for the course. If students have indicated their purpose for taking the EOC assessment, then the summary report provides a count of the number of students classified in each of the five categories.
� Completion of Course – 6,744 students indicated that they took the United States History EOC assessment to complete the course. These students are included in summary information.
� Make-up from Previous Administration – 6 students took United States History as a make-up from a previous administration. These students are included in summary information.
� Retest – No students took this United States History EOC assessment as a retest. Retest opportunities were not available during the 2014 –2015 school year.
� Test Out – No students indicated that they were taking the United States History EOC assessment as a test out opportunity. These students are excluded from summary information.
� Validation of Credit – 10 students indicated that they took the United States History EOC assessment in order to obtain credit for a course taken elsewhere. These students are excluded from summary information.
Students with No Scores: These are students who receive a code instead of a scale score and are excluded from the summary data. The summary report provides the number of students that did not receive scores for one of the following reasons:
� Present, Test Not Attempted (PTNA) – 1 student received a PTNA in United States History.
� Did Not Attempt (DNA) – 4 students received a DNA in United States History.
� Invalidation (IV) – 17 students received an IV in United States History.
� Participation Invalidation (PIV) – No students received a PIV in United States History.
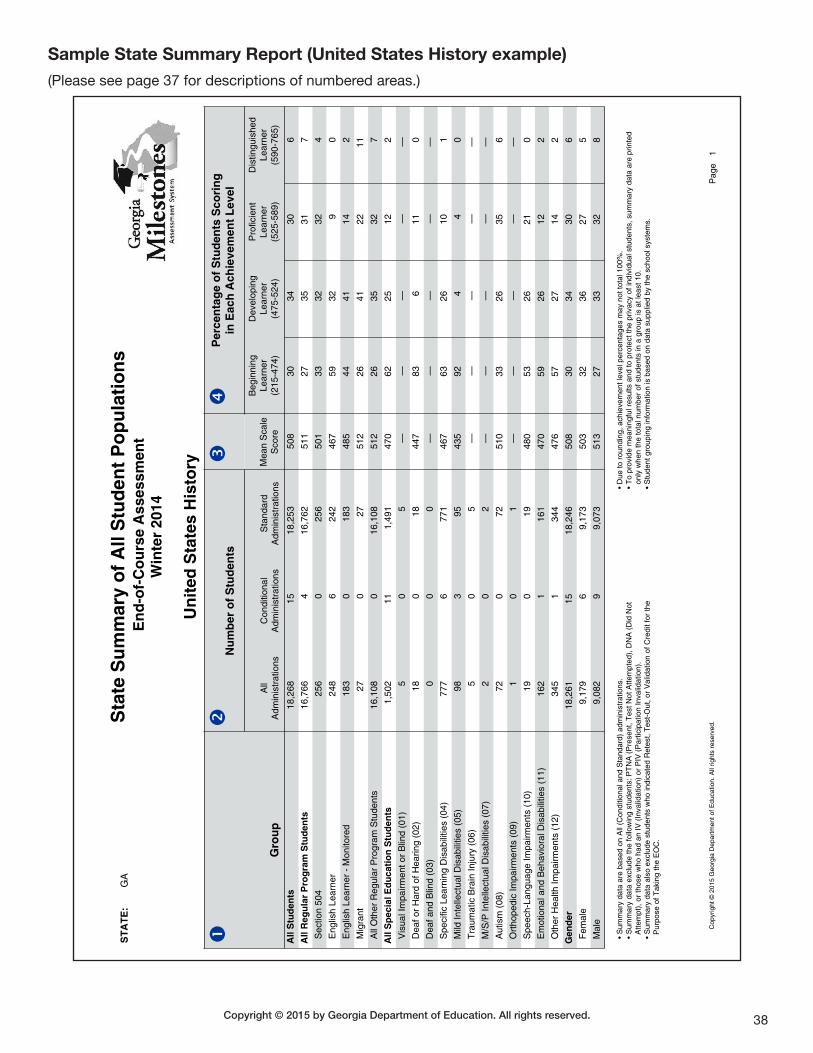
38Copyright © 2015 by Georgia Department of Education. All rights reserved.
Sample State Summary Report (United States History example)(Please see page 37 for descriptions of numbered areas.)
ST
AT
E:
GA
Sta
te S
um
mary
of
All S
tud
en
t P
op
ula
tio
ns
En
d-o
f-C
ou
rse A
ssessm
en
t
Win
ter
2014
Un
ited
Sta
tes H
isto
ry
Gro
up
Nu
mb
er
of
Stu
de
nts
Pe
rce
nta
ge
of
Stu
de
nts
Sc
ori
ng
in E
ac
h A
ch
iev
em
en
t L
ev
el
All
Ad
min
istr
atio
ns
Co
nd
itio
na
l
Ad
min
istr
atio
ns
Sta
nd
ard
Ad
min
istr
atio
ns
Me
an
Sca
le
Sco
re
Be
gin
nin
g
Le
arn
er
(21
5-4
74
)
De
ve
lop
ing
Le
arn
er
(47
5-5
24
)
Pro
ficie
nt
Le
arn
er
(52
5-5
89
)
Dis
tin
gu
ish
ed
Le
arn
er
(59
0-7
65
)
All
Stu
de
nts
18
,26
81
51
8,2
53
50
83
03
43
06
All
Re
gu
lar
Pro
gra
m S
tud
en
ts1
6,7
66
41
6,7
62
51
12
73
53
17
Se
ctio
n 5
04
25
60
25
65
01
33
32
32
4
En
glis
h L
ea
rne
r2
48
62
42
46
75
93
29
0
En
glis
h L
ea
rne
r -
Mo
nito
red
18
30
18
34
85
44
41
14
2
Mig
ran
t2
70
27
51
22
64
12
21
1
All
Oth
er
Re
gu
lar
Pro
gra
m S
tud
en
ts1
6,1
08
01
6,1
08
51
22
63
53
27
All
Sp
ec
ial
Ed
uc
ati
on
Stu
de
nts
1,5
02
11
1,4
91
47
06
22
51
22
Vis
ua
l Im
pa
irm
en
t o
r B
lind
(0
1)
50
5—
——
——
De
af
or
Ha
rd o
f H
ea
rin
g (
02
)1
80
18
44
78
36
11
0
De
af
an
d B
lind
(0
3)
00
0—
——
——
Sp
ecific
Le
arn
ing
Dis
ab
ilitie
s (
04
)7
77
67
71
46
76
32
61
01
Mild
In
telle
ctu
al D
isa
bili
tie
s (
05
)9
83
95
43
59
24
40
Tra
um
atic B
rain
In
jury
(0
6)
50
5—
——
——
M/S
/P I
nte
llectu
al D
isa
bili
tie
s (
07
)2
02
——
——
—
Au
tism
(0
8)
72
07
25
10
33
26
35
6
Ort
ho
pe
dic
Im
pa
irm
en
ts (
09
)1
01
——
——
—
Sp
ee
ch
-La
ng
ua
ge
Im
pa
irm
en
ts (
10
)1
90
19
48
05
32
62
10
Em
otio
na
l a
nd
Be
ha
vio
ral D
isa
bili
tie
s (
11
)1
62
11
61
47
05
92
61
22
Oth
er
He
alth
Im
pa
irm
en
ts (
12
)3
45
13
44
47
65
72
71
42
Ge
nd
er
18
,26
11
51
8,2
46
50
83
03
43
06
Fe
ma
le9
,17
96
9,1
73
50
33
23
62
75
Ma
le9
,08
29
9,0
73
51
32
73
33
28
• S
um
ma
ry d
ata
are
ba
se
d o
n A
ll (C
on
ditio
na
l a
nd
Sta
nd
ard
) a
dm
inis
tra
tio
ns.
• S
um
ma
ry d
ata
exclu
de
th
e f
ollo
win
g s
tud
en
ts:
PT
NA
(P
rese
nt,
Te
st
No
t A
tte
mp
ted
), D
NA
(D
id N
ot
A
tte
mp
t),
or
tho
se
wh
o h
ad
an
IV
(In
va
lida
tio
n)
or
PIV
(P
art
icip
atio
n I
nva
lida
tio
n).
• S
um
ma
ry d
ata
als
o e
xclu
de
stu
de
nts
wh
o in
dic
ate
d R
ete
st,
Te
st-
Ou
t, o
r V
alid
atio
n o
f C
red
it f
or
the
P
urp
ose
of
Ta
kin
g t
he
EO
C.
• D
ue
to
ro
un
din
g,
ach
ieve
me
nt
leve
l p
erc
en
tag
es m
ay n
ot
tota
l 1
00
%.
• T
o p
rovid
e m
ea
nin
gfu
l re
su
lts a
nd
to
pro
tect
the
priva
cy o
f in
div
idu
al stu
de
nts
, su
mm
ary
da
ta a
re p
rin
ted
on
ly w
he
n t
he
to
tal n
um
be
r o
f stu
de
nts
in
a g
rou
p is a
t le
ast
10
.
• S
tud
en
t g
rou
pin
g in
form
atio
n is b
ase
d o
n d
ata
su
pp
lied
by t
he
sch
oo
l syste
ms.
Pa
ge
1C
opyright ©
2015 G
eorg
ia D
epart
ment of E
ducation. A
ll rights
reserv
ed.
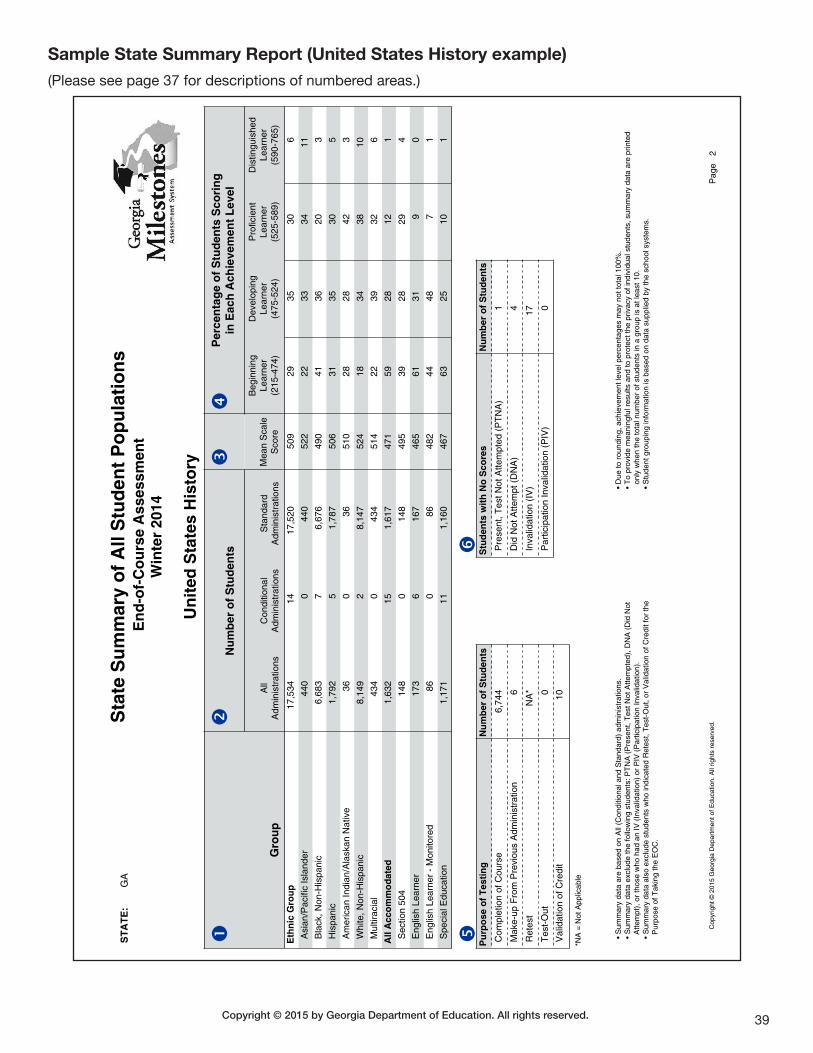
39Copyright © 2015 by Georgia Department of Education. All rights reserved.
Sample State Summary Report (United States History example)(Please see page 37 for descriptions of numbered areas.)
ST
AT
E:
GA
Sta
te S
um
mary
of
All S
tud
en
t P
op
ula
tio
ns
En
d-o
f-C
ou
rse A
ssessm
en
t
Win
ter
2014
Un
ited
Sta
tes H
isto
ry
Gro
up
Nu
mb
er
of
Stu
de
nts
Pe
rce
nta
ge
of
Stu
de
nts
Sc
ori
ng
in E
ac
h A
ch
iev
em
en
t L
ev
el
All
Ad
min
istr
atio
ns
Co
nd
itio
na
l
Ad
min
istr
atio
ns
Sta
nd
ard
Ad
min
istr
atio
ns
Me
an
Sca
le
Sco
re
Be
gin
nin
g
Le
arn
er
(21
5-4
74
)
De
ve
lop
ing
Le
arn
er
(47
5-5
24
)
Pro
ficie
nt
Le
arn
er
(52
5-5
89
)
Dis
tin
gu
ish
ed
Le
arn
er
(59
0-7
65
)
Eth
nic
Gro
up
17
,53
41
41
7,5
20
50
92
93
53
06
Asia
n/P
acific
Isla
nd
er
44
00
44
05
22
22
33
34
11
Bla
ck,
No
n-H
isp
an
ic6
,68
37
6,6
76
49
04
13
62
03
His
pa
nic
1,7
92
51
,78
75
06
31
35
30
5
Am
erica
n I
nd
ian
/Ala
ska
n N
ative
36
03
65
10
28
28
42
3
Wh
ite
, N
on
-His
pa
nic
8,1
49
28
,14
75
24
18
34
38
10
Mu
ltira
cia
l4
34
04
34
51
42
23
93
26
All
Ac
co
mm
od
ate
d1
,63
21
51
,61
74
71
59
28
12
1
Se
ctio
n 5
04
14
80
14
84
95
39
28
29
4
En
glis
h L
ea
rne
r1
73
61
67
46
56
13
19
0
En
glis
h L
ea
rne
r -
Mo
nito
red
86
08
64
82
44
48
71
Sp
ecia
l E
du
ca
tio
n1
,17
11
11
,16
04
67
63
25
10
1
Pu
rpo
se
of
Te
sti
ng
Nu
mb
er
of
Stu
de
nts
Co
mp
letio
n o
f C
ou
rse
6,7
44
Ma
ke
-up
Fro
m P
revio
us A
dm
inis
tra
tio
n6
Re
test
NA
*
Te
st-
Ou
t0
Va
lida
tio
n o
f C
red
it1
0
*NA
= N
ot
Ap
plic
ab
le
Stu
de
nts
wit
h N
o S
co
res
Nu
mb
er
of
Stu
de
nts
Pre
se
nt,
Te
st
No
t A
tte
mp
ted
(P
TN
A)
1
Did
No
t A
tte
mp
t (D
NA
)4
Inva
lida
tio
n (
IV)
17
Pa
rtic
ipa
tio
n I
nva
lida
tio
n (
PIV
)0
• S
um
ma
ry d
ata
are
ba
se
d o
n A
ll (C
on
ditio
na
l a
nd
Sta
nd
ard
) a
dm
inis
tra
tio
ns.
• S
um
ma
ry d
ata
exclu
de
th
e f
ollo
win
g s
tud
en
ts:
PT
NA
(P
rese
nt,
Te
st
No
t A
tte
mp
ted
), D
NA
(D
id N
ot
A
tte
mp
t),
or
tho
se
wh
o h
ad
an
IV
(In
va
lida
tio
n)
or
PIV
(P
art
icip
atio
n I
nva
lida
tio
n).
• S
um
ma
ry d
ata
als
o e
xclu
de
stu
de
nts
wh
o in
dic
ate
d R
ete
st,
Te
st-
Ou
t, o
r V
alid
atio
n o
f C
red
it f
or
the
P
urp
ose
of
Ta
kin
g t
he
EO
C.
• D
ue
to
ro
un
din
g,
ach
ieve
me
nt
leve
l p
erc
en
tag
es m
ay n
ot
tota
l 1
00
%.
• T
o p
rovid
e m
ea
nin
gfu
l re
su
lts a
nd
to
pro
tect
the
priva
cy o
f in
div
idu
al stu
de
nts
, su
mm
ary
da
ta a
re p
rin
ted
on
ly w
he
n t
he
to
tal n
um
be
r o
f stu
de
nts
in
a g
rou
p is a
t le
ast
10
.
• S
tud
en
t g
rou
pin
g in
form
atio
n is b
ase
d o
n d
ata
su
pp
lied
by t
he
sch
oo
l syste
ms.
Pa
ge
2C
opyright ©
2015 G
eorg
ia D
epart
ment of E
ducation. A
ll rights
reserv
ed.

Copyright © 2015 by Georgia Department of Education. All rights reserved.
Georgia Department of Education 2015 All Rights Reserved