g influenc of molecular conditioning films on e i microbia ... · adsorption of select organic...
TRANSCRIPT

Iiig Influence of Molecular Conditioning Films onI Microbial Colonization of Synthetic Membranes- Determined by Internal Reflection SpectrometryI
National Water Research InstituteKj Membrane and Research Development
NWRI Project No. MRDP 699-508-95
• 01 May 1995 through 30 April 1998
iiii_ Kenneth P. Ishida£ Richard M. Bold and
Harry F, Ridgway
J Biotechnology Research DepartmentOrange County Water District
I P. O. Box 830010500 Ellis Ave.
Fountain Valley, CA 92728-8300
ii

IIIIIIIIIIIIIIIIIII
Abstract
Under normal operating conditions, synthetic polymer separations membranesbecome fouled with suspended solids, dissolved organic and inorganic macromolecules andmicroorganisms. The result is a drop in membrane process efficiency, i.e., reduced waterflux and salt rejection and increased differential pressure. These effects increase the costs ofoperation and maintenance and reduce membrane lifetime. Thus, control of membranefouling is of great interest to the separations industry. In order to properly and effectivelyimplement measures to alleviate or minimize fouling, a greater understanding of molecularinteractions at the membrane surface is desired. This includes interactions between themembrane surface and dissolved organic macromolecules, chemical surfactants andextracellular polymeric substances of biological origin.
Adsorption phenomena at an aqueous-polymer interface were investigated byattenuated total reflection Fourier transform infrared (ATR/FT-IR) spectrometry. At first,adsorption of select organic compounds on bare germanium (Ge) was investigated to obtainreference spectra and identify unique infrared vibrational structure. Twelve (12) compoundswere selected: ethylenediaminetetraacetic acid (EDTA), hexylglucopyranoside, deconoyl-N-methylglucamide (MEGA 10), polyoxyethylene(10)dodecyl ether (Genapol C-100), bovineserum albumin (BSA), dextran, alginic acid, gum arabic, dodecylbenzenesulfonic acid(DBSA), n-hexadecyl-N, N-dimethyl-3-ammoniuo-l-propanesulfate (Zwittergent 3-16),polyethylene glycol-p-isooctylphenyl ether (Triton X-100) and benzalkonium chloride.Later, thin films (1500-2000 A) of cellulose acetate (CA) were cast on Ge and zinc selenide(ZnSe) internal reflection elements (IREs). Adsorption of albumin, alginic acid, gum arabic,dodecyl-benzenesulfonic acid, Triton X-l 00, benzalkonium chloride and Zwittergent 3-16 onCA were investigated. The CA film was rinsed with buffer, leaving a stable adsorbedorganic layer. Subsequent application of DBS A resulted in the selective removal of adsorbedproteins and poly sac charides from the surface of the CA thin films. The DBSA treatmenthad little effect on the adsorbed film of benzalkonium chloride, as a very stable hemimicellestructure is believed to form on the CA surface.
Adsorption of dissolved organic material on CA from reverse osmosis feedwater atWater Factory 21 was investigated. The ATR/FT-IR spectrometric technique was notsensitive enough to detect any adsorbed organic material on the surface of the CA thin film.Adsorption of natural organic materials on CA from colored well water was alsoinvestigated. A small quantity of organic macromolecules was detected at the aqueous-polymer interface. Preliminary results suggest that this chemical species is aliphatic andaromatic in origin. Bubble contact angle measurements indicated a decrease in the surfacehydrophobicity after 22-hr exposure to the colored well water.
Pretreatment of a CA firm with the surfactant Zwittergent 3-16 resulted in a 3-foldreduction in the number of adherent Mycobacterium cells during the initial stage of bacterialattachment. Polysaccharide and material tentatively identified as protein were detected at theaqueous-polymer interface. A hemimicelle structure of Zwittergent 3-16 formed on themembrane surface, which actively prevented Mycobacterium cells from adhering to the CAfilm.
Efforts are currently under way to improve the detection limit of the ATR/FT-IRspectrometric technique. The recommended changes are to (1) reduce the CA film thickness
n

IIIIIIIIIIIIIIIIIII
(from 1500 A to 750 A) cast on the IRE, thereby increasing the electric field intensity at theaqueous-polymer interface and (2) switch from a 3-mm thick ZnSe IRE to a 2-mm thick IRE,thereby increasing the number of internal reflections,
A system was developed to visualize bacterial cells attached to the same CA surfaceon which IR data is sampled. An ATR flow cell was designed with a window toaccommodate a 40X microscope objective. The fluorescence microscope was designed andassembled in-house and will be mounted horizontal to the face of the ATR flow cell. Thissystem will enable real-time in situ measurements of IR (molecular) data and fluorescent(visual) microscopic data from organic macromolecules and bacteria adsorbed or attached toCA thin films.
in
I• Table of Contents
I
i
Section 1. Introduction 1i— Section 2. Project Goals and Objectives / Expected Outcomes and,H Benefits to the Separations Industry 4
Section 3. Conclusions .............. , ........................................................... 6
Section 4. Recommendations ......................... . ........................................ 7
Section 5. Internal Reflection Spectrometry: Theory and Applications .............. 8
Section 6. Materials and Methods ............................................................ 14m
Section 7. Results and Discussion ............................................................. 23
I 7.1 Adsorption of Organic Macromolecules on Ge IRE 23
EDTA 27Hexylgluconpyranoside , 27MEGA 10 29
I GenapolC-100 29Bovine Serum Albumin 33Dextran 33
I Alginic Acid 33Gum Arabic 36Dodecylbenzenesulfonic Acid 36
|Zwittergent3-l6 39Triton X-100 42Benzalkonium chloride 42
• Summary 45
7.2 Cellulose Acetate Mid-Infrared Spectrum 47
I• 7.3 Stability of CA Thin Films Cast on Ge IRE 47
• Hydration of CA Thin Film 47Effect of Ionic Strength of C A Thin Films 54
— Summary 59
I7.4 Mycobacterium Isolate BT2-4 Adhesion on CA Thin Film 64
• Mycobacterium Isolate BT2-4 Culture 64Mycobacterium Isolate BT2-4 Cell Suspension 66
ii
IV

I1tIIIIIIII
Table of Contents (continued)
Quantitation of Adherent Bacteria 70
7.5 Stability of CA Thin Films Cast on ZnSe IRE 75
7.6 Adsorption of Organic Macromolecules on CA Thin Films 75
Zwittergent 3-16 Adsorption on Cellulose Acetate (42% acetyl) 75Triton X-l 00 Adsorption on Cellulose Acetate (43.9% acetyl) 78Dodecylbenzenesulfonic Acid Adsorption on Cellulose Acetate) 78
0.5% DBSA Adsorption on CA(42% acetyl)-coated Ge IRE 780.1% DBSA Adsorption on CA(43.9% acetyl)-coated ZnSe IRE...78
Effect of DBSA on Organic Conditioning Films on Cellulose AcetateThin Films 82
Bovine Serum Albumin 82Dextran 84Alginic Acid 84Gum Arabic 84Benzalkonium Chloride 87
Summary and Discussion 90
7.7 Adsorption of Natural Organic Material (NOM) from ReverseOsmosis Feedwater on Ge and Cellulose Acetate Thin Film 93
NOM Adsorption from RO Feedwater on Ge IRE 94NOM Adsorption from RO Feedwater onCellulose Acetate Thin Film 94
7.8 Adsorption of Natural Organic Material (NOM) from ColoredWell Water on Ge and Cellulose Acetate Thin Film 97
NOM Adsorption from Colored Well Water on Ge IRE 97NOM Adsorption from Colored Well Water onCellulose Acetate Thin Film 97Discussion 100
7.9 Combined ATR/FT-IR Spectrometry and Nomarski DIG ImageAnalysis of Bacterial Attachment on Cellulose Acetate Thin Films 100
Effect of Zwittergent 3-16 Pretreatment onMycbacterium Isolate BT12-100 Attachment onCellulose Acetate (43,9% acetyl) Thin Film 104Discussion 113
v

I* Table of Contents (continued)-'. -£*•-. - **V--••»•• • • '
I 7.10 Simultaneous ATR/FT-IR Spectrometry of Adsorbed Organics and— Fluorescence Imaging of Adherent Bacteria on Thin Films of_ Cellulose Acetate 119
'I'Current Status of ATR/FT-IR Spectrometry /
— Visual Microscopy Imaging System 124
I
J Section 8 References 126
, '
Ii•*i••w
I"*"
I•~f
I
I-»»-
1"**•
III1 VI

1• Figures, Equations and Tables
• Section 1 Introduction
_ Figure 1.1 Diagram of separations membrane illustrating colloidal and.•• biological fouling and the effects on some membrane properties ......... 2
• Section 5 Internal Reflection Spectrometry: Theory and Applications
1Equation 5.1 Critical angle for internal reflection ........................................... 8
'Equation 5.2 Depth of penetration of the evanescent wave ................................. 8
B Figure 5.1 Internal reflection of light at an interface where m and n2 are therefractive indices of the IRE and optically rare medium and 0C
f is the critical angle ............................................................... 9
Figure 5.2 Internal reflection at a totally reflecting interface (top) and
I energy diagram of standing waver formed at the interface(bottom) ........................................................................... 10
• Equation 5 .3 Effective film thickness ......................................................... 11
Figure 5.3 Plots of the electric field intensity as a function of distance
I from the interface of the IRE for (A) bare Ge (B) 500 A CAfilm and (C) 2000 A CA film in contact with water ......................... 12
•™ Section 6 Materials and Methods
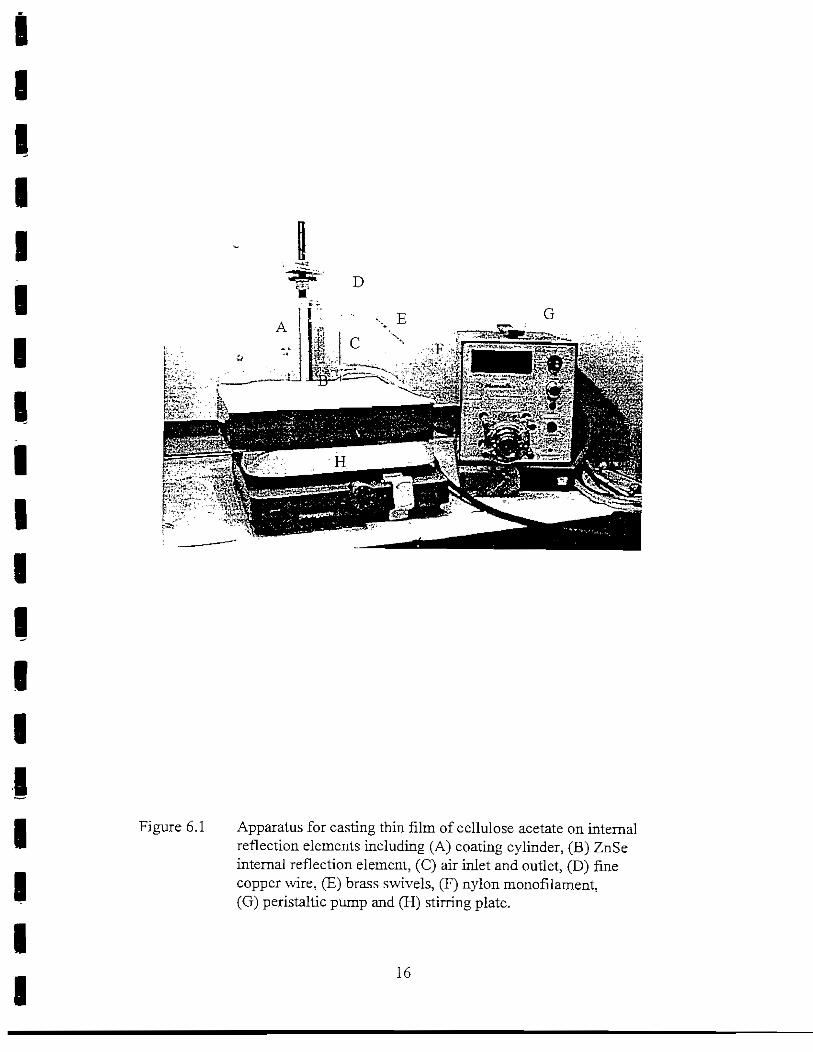
• Figure 6.1 Apparatus for casting thin film of cellulose acetate on IREsN* represented by (A) coating cylinder (B) ZnSe IRE (C) fine
copper wire (D) air inlet and outlet (E) brass swivels (F) nylon• B, monofilament (G) peristalitic pump and (H) stirring plate ................ 16
_ Figure 6.2 Attenuated total reflectance accessories (top) including• (A) mirror assembly, (B) flow cell, (C) Ge IRE and
(D) ZnSe IRE. FT-IR spectrometer (bottom) including— main bench and right AEM .................................................... 18
••Figure 6.3 Captive bubble contact angle measurement device
I(A) CCD camera, (B) objective, (C) stage, (D) syringe and(B) needle and (E) plexiglass reservior ....................................... 20
ii vn

II. Figures, Equations and Tables (continued)
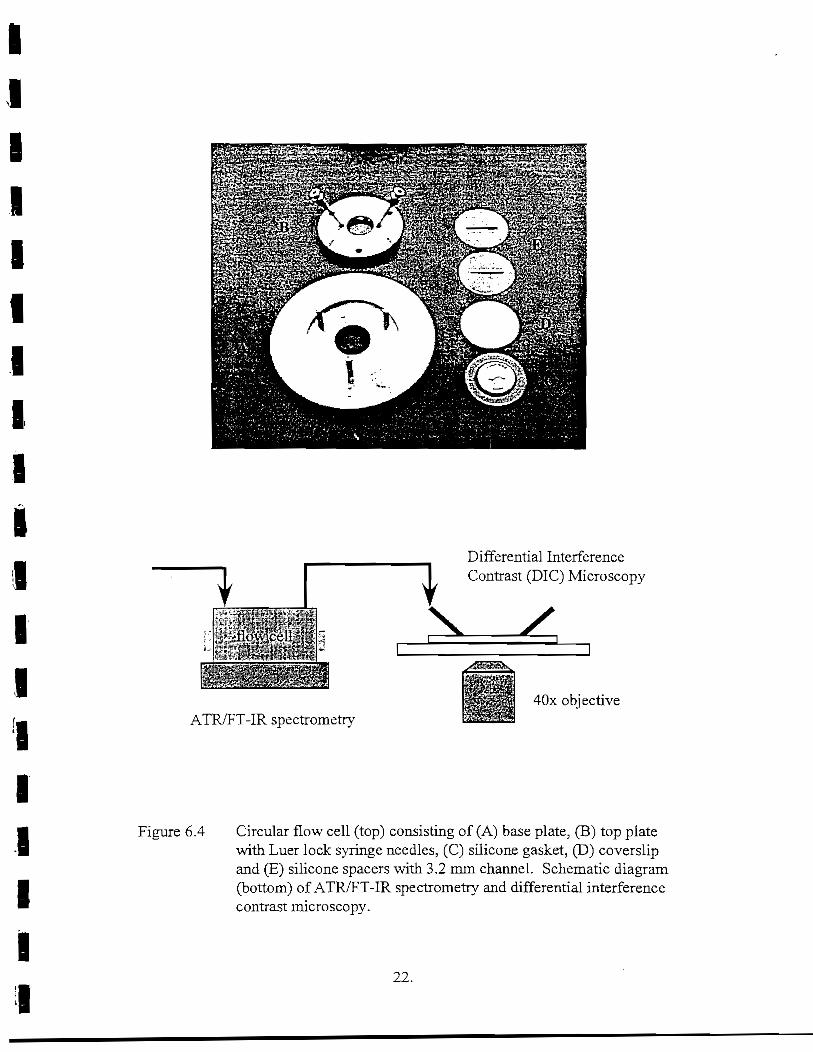
1 Figure 6.4 Circular flow cell (top) consisting of (A) base plate, (B) top plateWith Luer lock syringe needles, (C) silicone gasket, (D) coverslip
Iand (E) silicone spacers with 4 mm channel. Schematic diagram(bottom) of ATR/FT-IR spectrometry and differential interferencecontrast microscopy 22
Section 7 ResultsI1 Figure 7.1.1 ATR/FT-IR spectra of (A) EDTA (B) hexylglucopyranoside
(C) MEGA 10 and (D) Genapol C-l00 adsorbed on Ge IREand (E) thin film of CA cast on Ge IRE 24
'• Figure 7.1.2 ATR/FT-IR spectra of (A) albumin (B) dextran (C) alginic acid(D) gum arabic and (E) thin film of CA cast on Ge IRE 25
« Figure 7.1.3 ATR/FT-IR spectra of (A) DBSA (B) Zwittergent 3-16(C) Triton X-l 00 (D) benzalkonium chloride and (E) CA
• thin film cast on Ge IRE 26
Figure 7.1.4 Plots of the 1400 cm'1 and 1321 cm'1 band intensities of
I EDTA as a function of time of flow (A) stainless steel and(B) Teflon® flow cell 28
I Figure 7.1.5 Plot of the 1080, 1040 and 1379 cm'1 band intensities ofhexylglucopyranoside as a function of time of flow 30
I Figure 7.1.6 Plot of the 1726, 1603, 1412 and 1082 cm'1 band intensitiesof MEGA 10 as a function of time of flow 31
• Figure 7.1.7 Plot of the 1350 cm"1 and 1097 cm"1 band intensities ofGenapol C-l 00 as a function of time of flow 32
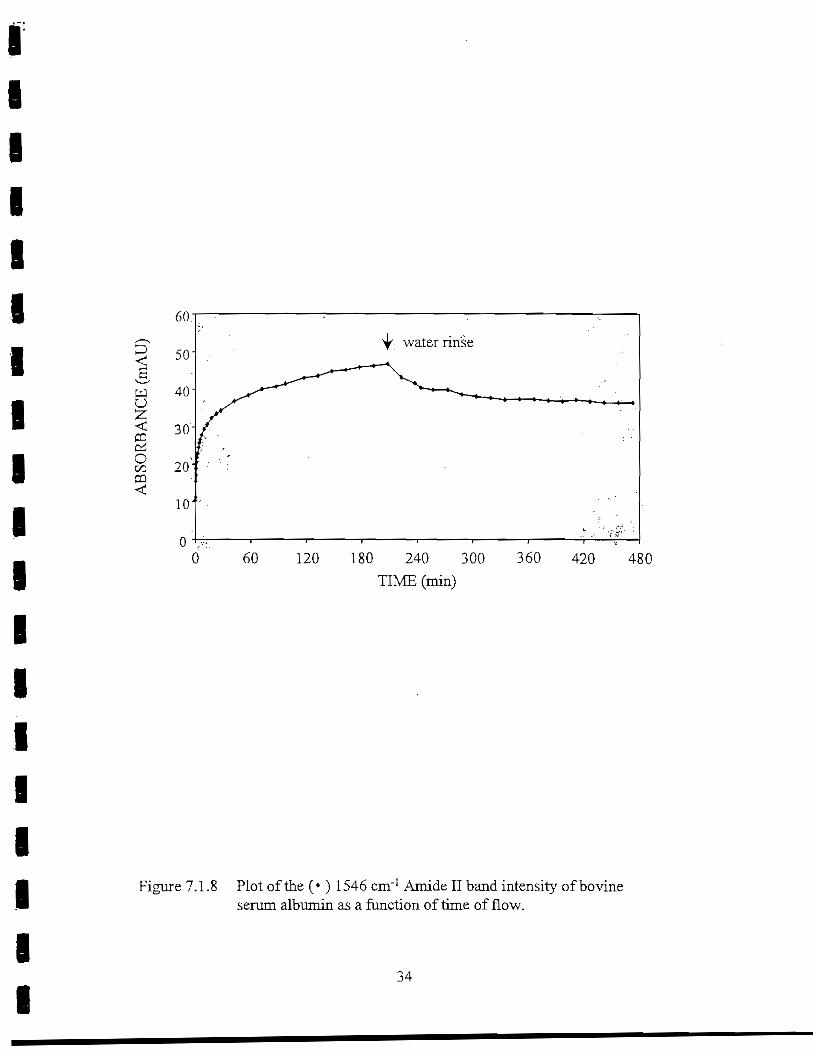
v|| Figure 7.1.8 Plot of the 1546 cm"1 Amide II band intensity of bovine serumalbumin as a function of time of flow 34
j| Figure 7.1.9 Plot of the 1019 cm"1 band intensity of dextran as a functionof time of flow 3 5
Jf Figure 7.10 Plot of the 1034 cm"1 band intensity of alginic acid as a functionof time of flow 37
iii Vlll

II Figures, Equations and Tables (continued)
V Figure 7.1.11 Plots of the (A) 1547 cm"1 Amide II and (B) 1080cm'1 C-0stretching band intensities of gum arabic as a function of timeof flow 38
Figure 7.1.12 Plots of the (A) 1178 cm'1 (B) 1136 cm'1 and.(C)'l009 cm'1
Iband intensities of DBSA as a function of time of flow atconcentrations of 0.25% and 0.5% wt/vol 40
iii
i
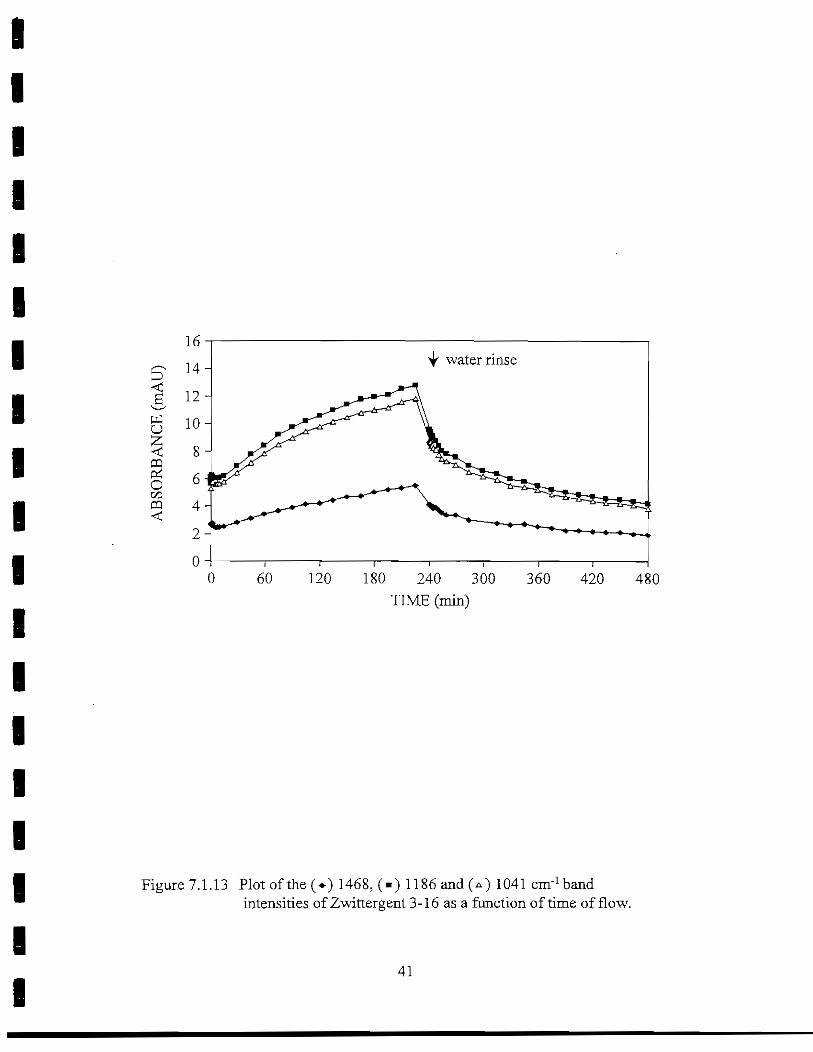
Figure 7.1.13 Plot of the 1468, 1186 and 1041 cm"1 band intensities ofZwittergent 3-16 as afunction of time of flow 41
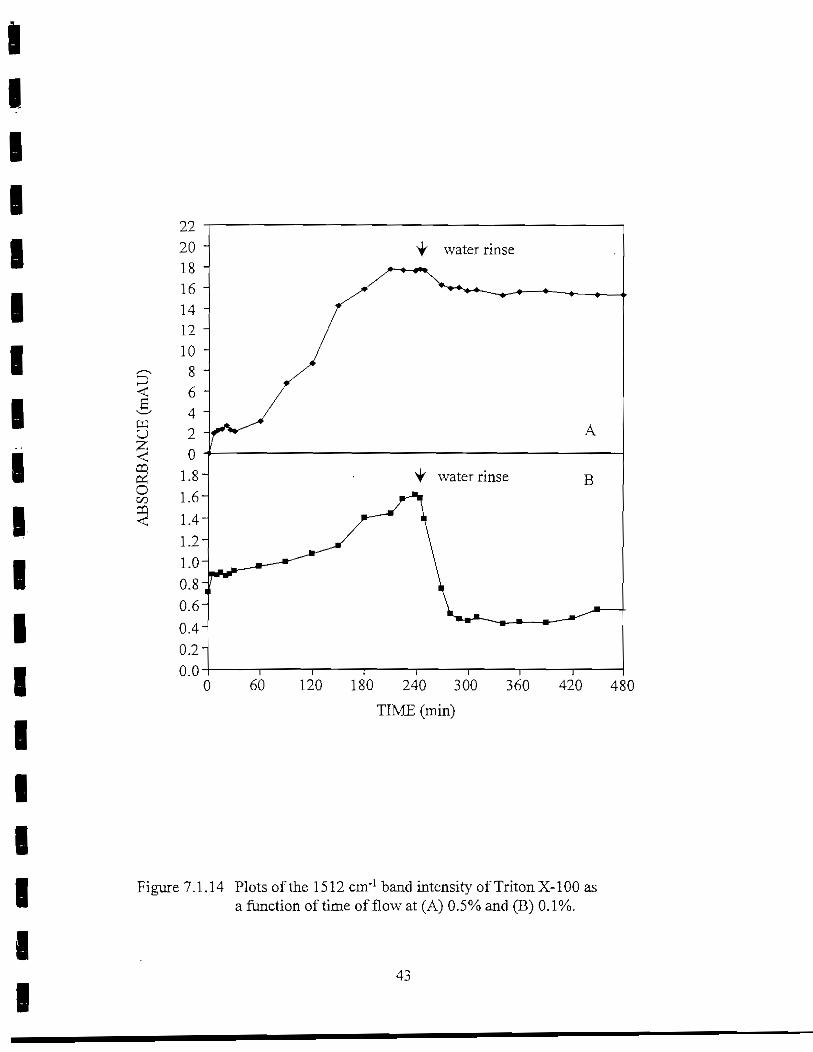
Figure 7.1.14 Plots of the 1512 cm"1 band intensity of Triton X-100 as afunction of time of flow at (A) 0.5% and (B) 0.1% wt/vol 43
Figure 7.1.15 Plot of the 1487, 1473 and 1457 cm"1 band intensities ofbenzalkonium chloride as afunction of time of flow 44
I Table 7.1.1 Infrared vibrational bands of organic compounds for useas molecular probes for adsorption studies on thin filmsof cellulose acetate 45
P Table 7.1.2 Desorption rate constants and film thickness of organicmacromolecules on germanium internal reflection element 46
Figure 7.2.1 Disaccharide subunit of cellulose acetate polymertriacetate (left) and diacetate (right) 48
I ,Figure 7.2.2 Mid-IR ATR spectrum (4000 - 800 cm"1) of a CA(42%acetyl)
thin film cast on a Ge IRE 49
* Figure 7.2.3 Mid-IR ATR spectrum (2000 - 800 cm"1) of a CA(42% acetyl)thin film cast on a Ge IRE 50
'B Figure 7.3.1 ATR spectra of CA(42% acetyl) thin film and exposed toA deionized water (pH 7) 51f
Figure 7.3.2 Plots of the 1744, 1433, 1369, 1232 and 1049 cm"1 band— intensities of (A) CA(42% acetyl) and (B) the 1639 cm"1
B water band intensity as afunction of time of flow 52
fTable 7.3.1 Effect of hydration of cellulose acetate thin film cast on Ge IRE 53
Ii IX

IIIII1IIIIIIII
1I/v9>
Figures, Equations and Tables (continued)
Figure 7.3.3 Hydration of CA. Plots of the 1747, 1433, 1369, 1232 and1049 cm"1 band intensities of (A) CA(42% acetyl) and (B) the1639 cm" water band intensity as a function of time of flow 55
Figure 7.3.4 !%NaCl Addition. Plots of the 1747, 1433, 1369, 1232 and1049 cm"1 band intensities of (A) CA(42% acetyl) and (B) the1639 cm' water band intensity as a function of time of flow 56
Table 7.3.2 Percent change in cellulose acetate IR band intensities as aresult of exposure to NaCl solutions and water rinses 57
Figure 7.3.5 First water rinse. Plots of the 1747, 1433, 1369, 1232 and1049 cm"1 band intensities of (A) CA(42% acetyl) and (B) the163 9 cm"1 water band intensity as a function of time of flow 58
Figure 7.3.6 3.5% NaCl Addition. Plots of the 1747, 1433, 1369, 1232 and1049 cm"1 band intensities of (A) CA(42% acetyl) and (B) the1639 cm"1 water band intensity as a function of time of flow 60
Figure 7.3.7 Second water rinse. Plots of the 1747, 1433, 1369, 1234 and1049 cm"1 band intensities of (A) CA(42% acetyl) and (B) the1639 cm" water band intensity as a function of time of flow 61
Figure 7.3.8 10% NaCl. Plots of the 1747, 1433, 1369, 1234 and 1049cm"1
band intensities of (A) CA(42% acetyl) and (B) the 1639 cm"1
water band intensity as a function of time of flow 62
Figure 7.3.9 Third water rinse. Plots of the 1747, 1433, 1369, 1234 and1049 cm"1 band intensities of (A) CA(42% acetyl) and (B) the1639 cm" water band intensity as a function of time of flow 63
Table 7.3.3 Effect of 10% NaCl solution on cellulose acetate and waterband intensities 64
^ Figure 7.3.10 Plots of the 1232 cm"1 and 1639 cm"1 band intensity of• CA(42% acetyl) as a function of time of flow. The 1639 cm"1
band intensites were offset by 1 mAU for clarity. Unlabeled_ arrows indicate start of water rinse 65
9Figure 7.4.1 ATR spectra of Mycobacterium isolate BT2-4 adsorbed on a
CA(43.9% acetyl) thin film from flowing solution at pH 7 67

I• Figures, Equations and Tables (continued)
I Figure 7.4.2 Plot of the 1547 cm"1 Amide II band intensity as a functionof time of flow 68
£ Figure 7.4.3 Plot of the 1009 cm'1 band intensity of 0.5% DBSA adsorbedon CA(42% acetyl) thin film and CA-coated Ge (2 mm) IRE as a
• function of time of flow 69
Figure 7.4.4 ATR spectra of Mycobacterium isolate BT2-4 adsorbed on a
J CA(42% acetyl) thin film from flowing solution. CA thin filmwas pretreated with 0.5% DBSA pH 7 (main bench) 71
•
Figure 7.4.5 ATR spectra of Mycobacterium isolate BT2-4 adsorbed on aCA(42% acetyl) thin film from flowing solution. CA thin filmwas pretreated with 0.5% DBSA pH 7 (right AEM) 72
Figure 7.4.6 Plot of the 1549 cm"1 Amide II band intensity ofMycobacterium isolate BT2-4 adhesion on CA(42% acetyl) thin
• film as a function of time of flow (main bench and right AEM) 73
Figure 7.4.7 Experimental set up for epifluorescence quantitation ofIT cell surface coverage on CA-coated coupons represented byP (A) ATR flow cells (B) stainless steel flow cells with
CA-coated microscope slides 74
• Figure 7.5.1 Plots of the 1749, 1369, 1230 and 1049 cm"1 band intensitiesof (A) CA(43.9% acetyl) and (B) the 1639 cm"1 water band
• intensity as a function of time of flow 76
Figure 7.6.1 Zwittergent 3-16 adsorbed on CA(42% acetyl) thin film.• Plot of the 1487 cm"1 and 1468 cm"1 band intensities of
Zwittergent 3-16 as a function of time of flow 77
I Figure 7.6.2 Triton X-100 adsorbed on CA(43.9% acetyl) thin film.Plot of the 1512 cm"1 band intensity as a function of time
« of flow, main bench and right AEM 79
Figure 7.6.3 DBSA adsorbed on cellulose acetate (42% acetyl) thin film.• Plot of the 1009 cm"1 band intensity as a function of time of flow 80
Figure 7.6.4 DBSA adsorbed on cellulose acetate (43.9% acetyl) thin firm.
> Plots of the average (A) 1180 cm*1 and 1009 cm"1 band intensitiesand 1138 cm"1 band intensity as a function of time of flow 81
it

II. Figures, Equations and Tables (continued)
I
iii
(
ii
Figure 7.6.5 Albumin adsorbed on cellulose acetate (43.9% acetyl) thin film.Plot of the 1547 cm' and 1009 cm" band intensities as a functionof time of flow ................................................................... 83
—m
Figure 7.6.6 Dextran adsorbed on cellulose acetate (43.9% acetyl) thin film.^ Plot of the 1159cm'1, 'corrected' 1159cm"1 and 1009cm"1 bandH intensities as a function of time of flow .............................. '. ....... 85
Figure 7.6.7 Alginic acid adsorbed on cellulose acetate (43.9% acetyl) thin film.Plot of the 1416 cm"1 band intensity of alginic acid and 1009 cm"1
band intensity of DBSA as a function of time of flow 86
Figure 7.6.8 Gum arabic adsorbed on cellulose acetate (43.9% acetyl) thin film.Plot of the 1547 cm"1 Amide II and 1080 cm"1 C-O band intensityof gum arabic and 1009 cm'1 band intensity of DBSA as afunctionof time of flow 88
• Figure 7.6.9 Benzalkonium chloride adsorbed on cellulose acetate (43.9% acetyl)thin film. Plot of the 1485 cm"1 and 'corrected3 1485 cm"1 band
-iintensities of benzalkonium chloride and 1009 cm" band intensityof DB S A as a function of time of flow 89
Table 7.6.1 Film thickness of organic macromolecules adsorbed oncellulose acetate (43.9% acetyl) thin film 90
ii
Figure 7.6.10 Diagram of benzalkonium chloride (C^) hemimeicelle formed• on the surface of cellulose acetate ............................................ 92
Table 7.7.1 Chemical analysis of reverse osmosis feedwater (Q-22A) ................. 94
1Figure 7.7.1 Reverse osmosis feedwater (Q-22A) adsorbed on Ge IRE.
. Plots of the (A) 1550 cm"1 and 1101 cm"1 and (B) 1502, 1377• and 1240 cm"1 band intensities as a function of time of
flow (main bench) ............................................................... 95
f Figure 7.7.2 Reverse osmosis feedwater (Q-22A) adsorbed on Ge IRE.Plots of the (A) 1557 cm"1 and 1022 cm"1 and (B) 1502, 1377and 1240 cm"1 band intensities as a function of time offlow (right AEM) ................................................................ 96
Table 7.8.1 Chemical analysis of Deep Well No. 1 water, Fountain Valley, CA ..... 97
xn

II
IIIIIII1
Figures, Equations and Tables (continued)
I Figure 7.8.1 Ge IREs (A) main bench and (B) right AEM exposed to colored• well water. Plots of the 1500; 1378, 1242 and 1142 cm'! band
intensities as a function of time of flow
Figure 7.8.2 Spectra of organic material adsorbed on cellulose acetate(43.9% acetyl)thin film from flowing colored well water(A) 7 days (B) 1 day and (C) difference spectrum 99
Figure 7.8.3 Difference spectra of (A) hydrated CA spectrum less dry CASpectrum and (B) CA thin film exposed to colored well water,Day 7 spectrum less Day 1 spectrum 101
Figure 7.8.4 Difference spectrum (Day 7 less Day 1) of cellulose acetate(43.9% acetyl) thin film exposed to colored well water 102
Figure 7.8.5 Captive bubble contact angle measurement.Height:Diameter ratio of air bubble suspended under ZnSe IRE,CA(43.9% acetyl) thin film and CA thin film exposed tocolored well water for 7 days 103
Table 7.9.1 Change in IR band intensities upon exposure to0.25%Zwittergent3-l6... 104
Figure 7.9.1 Schematic diagram of on-line ATR/FT-IR spectrometry /Nomarski diferential interference contrast microscopy 105
§ Figure 7.9.2 Plots of the 1743, 1369, 1236 and 1049 cm'1 band intensities of(A) cellulose acetate (43.9% acetyl) and (B) the 1637 cm"1 bandintensity as a function of time of flow 106
Figure 7.9.3 ATR/IR spectra of Zwittergent 3-16 adsorption on cellulose/ acetate (43.9% acetyl) thin film from flowing solution at pH 7 108
,^&Figure 7.9.4 Zwittergent 3-16 adsorption of cellulose acetate (43.9% acetyl).
Plot of the 1487 cm"1 band intensity of Zwittergent 3-16 as aV ftmction of time of flow 109
^ Figure 7.9.5 ATR/IR spectra of Mycobacterium isolate BT12-100 adsorbed• from flowing solution on cellulose acetate (43.9% acetyl)
thin film 110
iii
xm

I• Figures, Equations and Tables (continued)
I Figure 7.9.6 ATR/IR spectra of Mycobacterium isolate BT-12-100 adsorbedfrom flowing solution on cellulose acetate (43.9% acetyl)
— thin film ......................................................................... I l l
B'Figure 7.9.7 Plot of the 1514 cm"1 and 1018 cm"1 band intensities of
I Mycobacterium isolate BT12-100 as a function of time of flow(top) and plot showing the relationship between the 1514 cm"1
and 1018 cm"1 band intensities ............................................... 112
Q Figure 7.9.8 Nomarski differential interference contrast images ofMycobacterium isolate BT12-100 adsorbed from flowing
• solution on cellulose acetate (43.9% acetyl) thin film .................... 114
Figure 7.9.9 Plot of the percent surface area covered by Mycobacterium
f isolate BT12-100 adsorbed on cellulose acetate (43.9% acetyl)untreated control and pretreated with Zwittergent 3-16as a function of time of flow ................................................. 115
•B Figure 7.9.10 Plots of the 1514 cm'1 (top) and 1018 cm"1 (bottom) bandintensities of Mycobacterium BT12-100 adsorbed on
• CA(43.9% acetyl) as a function of percent surface coverage ............ 116
Figure 7.9. 1 1 Bacterial cell adsorbed on the surface of cellulose acetate in thepresence of Zwittergent 3-16 hemimicelle ................................. 118
Figure 7.10.1 Schematic diagram of simultaneous ATR/FT-IR spectrometry /fluorescence microscopy experimental set up 120
fl
iFigure 7.10.2 ATR flow cell for fluorescence microscopy with (A) ZnSe IRE
• (50x20x2 mm) and (B) 40X objective ....................................... 122
Figure 7.10.3 Epifluorescence microscope (top) with (A) CCD camera mount,• (B) fiber optic cable, (C) x-y-z stage, (D) dichroic beamsplitter
cube and (E) 40X objective. Xenon excitation source (bottom) ......... 123
I Figure 7. 1 0.4 Tabletop Optical Module (TOM) with (A) flat mirror (B) ellipticalmirror, (C) ATR mirror assembly, (D) parabolic mirror and
— (E) MCT detector ............................................................... 125
B
xiv

gIt-rf-'
§i•tut
Iii"W
II"tf^
III
*s*w
-w
IIiI
Acknowledgments
This project was funded in part by the National Water Research Institute (Project No.MRDP 699-50.8-95), the U. S. Bureau'of Reclamation and Orange County Water District.We thank Thomas Cormack for providing the contact angle measurements. Special thanksgo to Bob Riley and Shui Wai Lin of Separation Systems Technology, San Diego, CA forproviding all "trie'assistance and expertise in casting thin films of cellulose acetate on theinternal ^reflection elements.
xv

II1IIIII1IIII1IIII
Section 1.
Introduction
Fouling of synthetic polymer membranes used in reverse osmosis (RO), nanofiltration(NF), ultrafiltration (UF) and microfiltration (MF) applications is a major concern to theseparations industry. Particles in the form of suspended solids, partially soluble inorganics,dissolved organic macromolecules and microbial cells deposit on the surface of thesemembranes, reducing process efficiency (i.e., reduced water flux and salt rejection)(Figure 1.1). This leads directly to an increase in operating costs by virtue of higheroperating pressures, down time for chemical and physical cleaning and reduced membranelifetime. Feedwater consisting of secondary and tertiary reclaimed wastewater often containssignificant levels of dissolved organic macromolecules and microorganisms.1'2'3 Bacterianormally transported in the feedwater have been shown to undergo rapid and stableattachment to membrane surfaces.4'5'6 Once firmly attached, the sessile microorganisms growand multiply, assimilating trace organic and inorganic nutrients dissolved in the bulk aqueousphase. During this process, the adherent bacteria typically produce copious amounts ofextracellular polymeric substances (EPS), usually amphoteric heteropolysaccharides, thatentrap and protect the cells in a gelatinous matrix.7'8'9'10 The bacteria continue to grow andmultiply, eventually forming a biofilm that covers the entire surface of the membrane. Thisseries of events, termed "biological fouling," may be defined as the attachment and growth ofmicroorganisms at an aqueous-solid interface resulting in a detectable effect on systemperformance.11 These biofilms typically range in thickness from a cell monolayer to severaltens of micrometers.
Microorganisms likely attach to a surface unlike the clean membrane, but adhere to asurface already fouled with low molecular weight dissolved organics, inorganics andsuspended solids. These "conditioning films" precede bacterial adhesion by nature of thesmaller size of the dissolved molecules and suspended solids. Though present at relativelylow concentrations, the presence of these macromolecules is routinely reported.1 The precisenature of the adsorbed macromolecules is generally unknown, although some common IRfunctional groups associated with proteins and proteoglycans have been detected in watersassociated with heat exchange equipment.12 In reclaimed wastewater and groundwater,nonvolatile dissolved organic carbon constitutes the majority of the total organic carbon.1'3Humic and fulvic acids are typically associated with colored water.13'14 In any event, thesemacromolecules mask the original surface properties (e.g., electrostatic charge orhydrophobicity) which seem to influence both the rate15 and extent of adhesion of cells.16J7'1S
Nonspecific adhesion to surfaces occurs by a variety of mechanisms. These non-covalentintermolecular forces include electrostatic, polar, nonpolar, hydrogen bonding andhydrophobic interactions. Attachment is known to be influenced by factors such as surfacecharge.19"20 Adsorbed proteins have been shown to reduce subsequent bacterialattachment.21-22'23 However, promotion of bacterial attachment by adsorbed proteins has alsobeen shown.24 The extent to which adsorbed rnacromolecules mask or alter the surfacechemistry of a polymer separations membrane is still not clear. Understanding the nature of

IIIIIIII1
IIIiiiiii
bacterial cell
. , - . ,suspended line particles
iA pressure differential
I©
dissolved macromoleculesinorganics
organics©
ooon
water flux
Y salt rejection
Figure 1.1 Diagram of separations membrane illustrating colloidal andbiological fouling and some of the effects on membrane properties.

I1I1I1III1IIIIIII1I
the chemical interactions and the dynamics of macromolecular adsorption at the aqueous-polymer interface is key to understanding membrane fouling. Thus, work has been directedtoward understanding how organic materials interact with polymer surfaces and howadsorbed organics influence bacterial attachment.
Sensitive surface analytical techniques for in situ analysis of chemical components ofadsorbed conditioning films have only recently become available. Hence the dynamics andphysicochemical nature of the molecular conditioning films and how they might influenceinitial bacterial attachment and growth are not well understood. One very sensitive methodfor exploring organic conditioning films and bacterial attachment is attenuated total reflectionFourier transform infrared (ATR/FT-IR) spectrometry. Recently, ATR/FT-IR spectrometryhas been used to study the in vitro formation of microbial biofilms on germanium (Ge)internal reflection elements (IREs)24'25 and thin copper films.26'27 ATR/FT-IR spectrometryhas also been used to monitor the effect of a chemical biocide on biofilm growth24 andbiocide penetration into a mature biofilm.28 A surface-sensitive analytical technique isneeded to make these types of measurements, one that enables measurements to be made insitu and preferably in real time. The one method best suited for these studies of molecularadsorption at an aqueous-polymer interface is ATR/FT-IR spectrometry. In this project theanalytical technique was applied to investigate macromolecular adsorption phenomena onthin films of cellulose acetate cast on internal reflection elements.

III1I1I1IIIIIII1I1I
Section 2.
Project Goals and ObjectivesExpected Outcomes and Benefits to the Separations Industry
Project Goals
The primary goals of the proposed research were to (1) determine the rate and extentof molecular conditioning film development on separations membranes, and (2) determine ifartificial and natural conditioning films influence initial bacterial attachment to membranes,as modification of molecular conditioning films might be employed to inhibit or otherwisecontrol bacterial attachment and biofilm formation on RO and related separationsmembranes.
Project Objectives
The above goals were to be accomplished by pursuing five project objectives:
Objective 1: Refine the current ATR/FT-IR spectrometry methodology to measureformation of artificial and natural molecular conditioning films onvarious polymer membranes. Optimize IRE coating with membranepolymers such as cellulose acetate, polyamide or polysulfone.
Objective 2: Use the ATR/FT-IR spectrometric method to screen the sorption ofselect organic compounds to various membrane polymers. The rangeof organics to be examined includes surfactants, chelating agents,biocides, proteins and polysaccharides. Examine sorption of specificorganics as a function of pH, ionic strength, or other relevant physico-chemical parameters. Select strongly sorbing compounds for furtheranalysis in bacterial attachment studies, as described below (seeObjectives).
Objective 3: Determine the kinetics and extent of organic conditioning filmdevelopment on different synthetic membranes using (filter-sterilized)wastewater from Water Factor}' 21. If possible, correlate adsorption ofnaturally occurring trace organics on the membrane polymers withperformance changes (flux, mineral rejection) or changes in bacterialadhesion.
4

IIIIIIIIII
III
Objective 4: Determine whether natural molecular conditioning films of v/astewaterorigin can be replaced or otherwise modified via addition of selectedorganic substances, such as detergents, chaotropic agents or chelatingcompounds.
Objective 5: Compare the attachment of mycobacteria and other selected biofoulingmicroorganisms to membranes with different types and amounts ofmolecular conditioning films. Both the kinetics of adhesion as well asthe spatial distribution of the attached bacterial cells were to bemeasured using digital imaging techniques.
Expected Outcomes and Benefits to the Separations Industry
Expected outcomes from the research project include:
1) Determination of how strongly select organic macromolecules adsorb or bindto synthetic polymer membranes.
2) Identification of how artificially imposed surface treatments (i.e., appliedbiocides, surfactants, chelating agents, etc.) influence natural and artificialconditioning films.
3) Identification of how surface treatments influence initial microbial adhesionkinetics and growth rates.
A greater understanding of how organic foulants are partitioned at the aqueous-polymer interface and the exact nature of the molecular interactions between theorganics/bacteria and the polymer membrane will result in the development of:
1) More effective treatments for membrane fouling, resulting in loweroperations and maintenance costs.
2) New membranes that demonstrate a lower potential for colloidaland bacterial fouling, and
S 3) Possibly an in-line ATR/FT-IR spectrometry process monitor formembrane separation systems.
Iiii

I
iiiiiiiiii
Section 3.
Conclusions•
iiiii
5. The detection limit of the ATR/FT-IR spectrometry technique was insufficient to observe• organics adsorption on cellulose acetate thin films from reverse osmosis feedwater. (The
limited exposure time of feedwater to the cellulose acetate thin film may also havecontributed to the lack of detectable organics.)
1. In general, adsorption on bare germanium, in terms of film thickness, was greatest forprotein, followed by surfactants and polysaccharides.
2. Cellulose acetate did not adhere firmly to the surface of germanium IREs, making theinfrared data very difficult to process and interpret.
3. Thin films of cellulose acetate cast on zinc selenide IREs demonstrated much greaterstability as compared to films cast on germanium.
4. The surfactant dodecylbenzenesulfonic acid was very effective at removing organicmacromolecules (protein and acidic polysaccharides) adsorbed on cellulose acetate thinfilms.
6. Aliphatic aromatic trace organics from colored well water adsorbed to a thin film ofcellulose acetate, resulting in reduced surface hydrophobicity.
7. Cellulose acetate pretreated with the surfactant Zwittergent 3-16 demonstrated lesstendency to foul with Mycobacterium isolate BT12-100 compared to the untreated thinfilm.

II Section 4.
• Recommendations
• 1. Increase the sensitivity of the ATR/FT-IR spectrometry technique by making the^ following changes:
• a) Reduce the cellulose acetate film thickness (from 1500 Ato 750 A) cast on the IRE, thereby increasing the electric
§field intensity at the aqueous/polymer interface.
.b) Switch from a 3-mm thick zinc selenide IRE to a 2-mm
thick IRE, thereby increasing the number of internalreflections.I
1 2. Continue development and implementation of simultaneous ATR/FT-IR spectrometry/ Fluorescence Microscopy for studies of organics adsorption and bacterial attachmenton thin polymer films.
IiIiiiiii
7
i

II
II1IIIIIII1IIII
Section 5.
Internal Reflection Spectrometry: Theory and Applications
ATR/FT-IR spectrometry provides a non-destructive method for monitoringmolecular adsorption phenomena that occur at an aqueous-solid interface. The techniqueworks by focusing radiation on the end of an infrared-transmitting crystal of high refractiveindex (n) at near normal angle of incidence. When IR radiation is transmitted into the crystal,light striking the interface between the optically dense (e.g. germanium, n, - 4.0) andoptically rare medium (e.g., air, n2 = 1.0) is totally internally reflected, provided that theangle of incidence of the radiation is greater than the critical angle (Figure 5.1). The criticalangle is defined as
. i )= sm ' — Eq. 5.1n.
where n, and n2 are the refractive indices of the IRE and the optically rare medium,respectively. At each point of internal reflection, the infrared radiation penetrates a shortdistance into the adjoining medium. The energy intensity of the radiation decaysexponentially as a function of distance normal to the interface; thus, it is referred to as an"evanescent wave" (Figure 5.2). The depth of penetration of the evanescent wave is thedistance at which the electric field intensity drops to lie (or 36.8%) of its magnitude at theinterface and is defined by the equation,
AEq. 5.2
27OTj
/ ^2"•> f «,sin2e-M-
l « , j _
1/2
where A, is the wavelength of the radiation.29 For the most common IREs, Ge and ZnSe, thedepth of penetration varies from —300 to 1000 nm at an angle of incidence of 45°. Anychemical species within the depth of penetration of the evanescent wave can be detected,provided it absorbs light in the mid-infrared region of the spectrum. When the sampleabsorbs light, the beam is attenuated, and thus the name attenuated total reflectance (ATR)spectrometry. It is this unique physical property of internal reflection that enables one toobserve adsorption phenomena at an .aqueous-solid interface.

IIIIIIIIIIIIIIIIII
IRE
IRradiation
detector
Figure 5.1 Internal reflection of light at an interface, where nj and n2 arethe refractive indices of the IRE and optically rare medium,and 6C is the critical angle.

IIIIIIIIIIIIIIIIIII
evanescent wave
1 micrometer
Figure 5.2 Internal reflection at a totally reflecting interface (top)and energy diagram of standing wave formed at theinterface (bottom).
10

IIIIIII1IIIIIIIIIII
Studies of molecular adsorption can be extended to an aqueous-polymer surface. If athin polymer film (500-2000 A)f is cast on the surface of the IRE, infrared radiation will passthrough the film and into the adjoining medium before reflecting back. The polymer filmthickness must be carefully controlled. The magnitude of the electric field at the aqueous-polymer interface is altered by the thin polymer film that attenuates the IR beam. This effectis evident in the plots of electric field intensity (Ez) as a function of distance (D) from a Ge-polymer interface (Figure 5.3). Theoretical calculations of electric field intensity (Ez) for twopolymer film thicknesses (500 and 2000 A) were made at a 45° angle of incidence. Theinterface between Ge and polymer (Ge and water, in the case of bare Ge) is defined asD = 0 A. In each case, there is a marked enhancement of Ezat this interface. The intensitydrops as it passes through the polymer and the another enhancement of Ez occurs at thepolymer-water interface. Finally, E2decays exponentially as the radiation penetrates into thebulk aqueous phase. As the polymer film thickness is increased, the electric field intensity(E0) at the polymer-water interface drops in magnitude. The effective thickness (de) of a thinfilm or an adsorbed molecular layer is given by
Where n21 is the ratio of the refractive index of the optically rare medium (water) to that ofthe IRE, d is the actual film thickness, and 6 is the angle of incidence. This equation revealsfour factors that determine the magnitude or strength of coupling of the evanescent wave tothe absorbing rarer medium (e.g., adsorbed organic macromolecules). In the case where alayer of organics has adsorbed onto the thin polymer film, the angle of incidence andrefractive indices are constant. However, the magnitude of E0 at the interface where organicshave adsorbed can vary significantly, as discussed above. In effect, the IR band intensities ofthe adsorbed species will drop as the polymer film thickness is increased due to the drop inelectric field intensity at the aqueous-polymer interface. Therefore, the thickness of thepolymer film cast on the IRE must be carefully controlled. If the film is cast too thick,insufficient radiation will pass into the bulk phase to enable measurements to be made (i.e.,insufficient sensitivity to detect the adsorbed organic macromolecules). If the film is toothin, it will lack the physical strength to withstand handling and exposure to aqueous andionic solutions. When the optimum film thickness is cast on the IRE, aqueous adsorptionphenomena can be made in situ, void of artifacts associated with other methods of sampleanalysis involving dehydration, physical manipulation or chemical stains.
Corrections applied to the ATR spectra are required when measuring bulk samplesdue to the wavelength dependence of internal reflection spectrometry (see Equation 5.2).However, when the polymer film (or adsorbed organic layer) is much thinner than thepenetration depth, i.e., d « dp, the electric field can be assumed to be constant over the filmthickness (d). Thus, no correction for the wavelength-dependent penetration depth is
Angstroms will be used from here on to describe film thickness instead of nanometers.
11

n* Ui
Lo C±
O
fi
(T
^ 3
, s-
00
3.
>. o °
^
t-h
i-hO
A
Q
> C
T S
i-h M
Mp
&
P-1
Sgr
fi 2
> fi
O
*-"
o a
EL
EC
TR
IC F
IEL
D I
NT
EN
SIT
Y (
E7)
O
O
i—'
>—'
o
<-
o
Oi
o
Oi
o
o
o
o
o
o
IIIIIIIIIIIIIIIIIII
necessary. More specifically, adsorption bands at longer wavelengths are no longer relativelystronger as they are for bulk materials, nor do the absorption bands become broadened on thelong wavelength side. The internal reflection spectra of thin films actually resemble thoseobtained by transmission more closely than internal reflection spectra of bulk materials.Thus, if the polymer-coated IRE is placed in a flow cell and aqueous organic test solutionsare pumped through the flow cell, it then becomes possible to measure the kinetics ofmacromolecular adsorption phenomena at the aqueous-polymer interface. Estimates of thefilm thickness of adsorbed organics can be made assuming a Beer-Lambert relationship.
13

IIIIII1IIIIIIIIIIII
Section 6.
Materials and Methods
Theoretical Calculations of Reflectance
A FORT AN program written by Richard Dluhy (University of Georgia, Athens, GA)was used to calculate theoretical values of reflectance and electric field intensities fromstratified media.30 The optical constants of water (refractive index and absorption index)were obtained from the literature.31 The refractive index of CA was assumed to be 1.5, theabsorption index at 1640 cm"1 equal to 0.01 and the angle of incidence 45°.
Cellulose Acetate (CA) Thin Film Cast on Internal Reflection Elements
Parallelepiped (50 x 10 x 2 mm) germanium (Ge) and (50 x 10 x 3 mm) zinc selenide(ZnSe) internal reflection elements were purchased from Harrick Scientific (Ossining, NY).Ge IREs were polished with 1.0 (im diamond paste (Buehler, Lake Bluff, IL), washed withdetergent, rinsed with tap water and then rinsed with 18 Mohm-cm deionized water (E-pure,Barnstead/Thermolyne, Dubuque, IA). ZnSe IREs were washed but not polished.
Thin films of CA were cast on Ge IREs by Separations Systems Technology (SST) inSan Diego, CA. The CA casting solution consisted of a blend of equal weights of 40.8% and43.2% acetyl (by weight) CA that was dissolved in high purity dichloromethane. A strip ofTeflon® adhesive tape was attached to the end of the IRE and the IRE dipped in chloroformto remove organic contaminants. After drying in a stream of nitrogen, the IRE was dippedinto the polymer solution and then rapidly placed in the nitrogen stream to prevent watercondensation on the thin film. IREs were dipped three times in a 0.088% solution of theblended CA(42% acetyl).
An estimate of the polymer film thickness was made by gravimetric analysis. Glassmicroscope slides (3x1 in.) were washed with detergent, rinsed with tap water and deionizedwater and allowed to air dry. Slides were dried to constant weight in a 105°C oven. Twelveslides were coated as described above. The CA-coated slides were dried to constant weightand reweighed. The coated area of each slide was measured. A CA film thickness of1260 ± 80 A was calculated, assuming a density equal to 1.3 g/cm3. A similar thickness ofCA was assumed to deposit on the Ge IREs.
In the second year of this project, the coating technology was transferred to theBiotechnology Research Department at Orange County Water District. Improvements to thecasting process were made under the direction of SST. Polymers of cellulose acetate(100,000 MW) with varying levels of acetylation were obtained from SST. CA polymerswere dissolved in high purity dichloromethane (B&JGC2, Burdick & Jackson, Muskegon,MI). CA solutions with different acetyl content were made. The first consisted of an equalweight mix of 40.8% and 43.2% acetyl CA, average acetyl content 42%3 and the second43.9% acetyl CA. Solutions were mixed with a Teflon® stir bar and sonicated in a warm
14

IIIIIIIIIIIIIIIIIII
water bath until the CA was completely dissolved. Solutions were filtered through lens paperto remove insoluble fibrous material.
A Pyrex cylinder (20 x 6 cm O.D.) was used in the coating process (Figure 6.1).Compressed air passed through a dryer (Balston Model 75-20), and a 0.2 Jim polytetra-fluoroethylene filter was used to purge the cylinder of water vapor. The CA solution(0.5% wt/vol) was mixed with a Teflon® stir bar. The stirring and air purge were turned offprior to casting of the film to eliminate turbulence at the air-solution interface. A peristalticpump (Masterflex, Cole-Farmer Instrument Co.) was used to withdraw the IRE from thepolymer solution. Nylon monofilament (2 Ib test) was tied to the drive shaft of .the pump.IREs were secured to a piece of fine copper wire with Teflon® adhesive tape, and the wirewas attached to the nylon line with a small brass fishing swivel. IREs were dipped and thenwithdrawn from solution at a rate of 1 cm/sec (1.50 pump setting). The flow of air to thecylinder was turned on immediately after the IRE was withdrawn from solution. The ZnSeIREs were dipped once. CA was removed from the end of the IRE with a cotton swabsaturated with chloroform. The film thickness was determined by gravimetric analysis. TheCA-coated ZnSe IRE was weighed, stripped of CA3 dried and then reweighed. The estimatedfilm thickness on the ZnSe IRE dipped once in 0.5% CA solution was 1500 A.
Bacterial Isolates and Culture Medium
Water Factory 21, located in Fountain Valley, CA, processes 15 million gallons ofsecondary treated municipal wastewater each day. Five million gallons of this water aretreated by reverse osmosis. Two isolates of Mycobacterium sp. were recovered from a fouledcellulose acetate RO membrane. A recent (3-yr old) isolate of Mycobacterium, designatedBT12-100, forms aggregates or floes when grown as a broth culture. AnotherMycobacterium isolate, BT2-4, is approximately 10 years old and has lost its ability to formaggregates due to repeated subculturing. Mycobacterium isolate BT2-4 has tentatively beenidentified as Mycobacterium chelonae. Both isolates were maintained on R2A agar platesand subcultured on a monthly basis.
The bacteria were grown on a defined mineral salts (MS) medium consisting of0.75 g/L Na2HP04, 0.75 g/L K2HPO4, 1.0 g/L NH4C1, 50 mg/L MgSO4-7H2O, 11 mg/L
CaCl2-2H2O, 1.0 g/L mannitol and 600 (O.L of Wolfe's mineral salts solution per liter of water.The composition of Wolfe's mineral salts solution is as follows (per liter water):1.5 g nitrilotriacetic acid (disodium salt), 3.0 g MgSO4-7H2O, 0.5 g MnS04-H2O, 1.0 gNaCl,0.1 g FeSO4-7H2O, 0.1 g CoCl2-6H2O, 0.1 g CaCl2, 0.1 g ZnS04-7H20, O.Olg CuSO4-7H2O5
0.01 g A1K(S04)2-12H2O, 0.01 g H3BO3 and 0.01 g Na2MoO4-2H2O. Cultures wereincubated at 28°C with shaking at 200 rpm. Cells were harvested in stationary phase (-60 hr)by centrifugation at 10,000 rpm for 15 min at 4°C, washed twice with MS buffer (nomannitol) and resuspended in buffer at pH 7. Cells were stained with 4',6-diarmdino-2-phenylindole (DAPI), a DNA-binding fluorochrome, and viewed by epifmorescencemicroscopy to determine the cell surface coverage (% surface coverage or cells/cm2).
15
IIIIIIIIIIIIIIIIIII
Figure 6.1 Apparatus for casting thin film of cellulose acetate on internalreflection elements including (A) coating cylinder, (B) ZnSeinternal reflection element, (C) air inlet and outlet, (D) finecopper wire, (E) brass swivels, (F) nylon monofilament,(G) peristaltic pump and (H) stirring plate.
16

IIIIIIIIIIIIIIIIIII
Growth Conditions for Bacterial Adhesion Studies (Circular Flow Cell / NomarskiDifferential Interference Contrast Microscopy)
A 50-mL volume of MS medium was inoculated with Mycobacterium isolateBT12-100. The culture was incubated for 48 hr at 28°C with shaking at 200 rpm. Theculture was centrifuged for 15 min at 10,000 rpm at 4°C. The cells were washed twice in50 mL of MS buffer (pH 7) and then resuspended in buffer to a final volume of 150 mL. Thecell suspension was split into three portions. One was used for the untreated CA control, onefor exposure to the pretreated CA thin film and one to determine the total cell count in thesuspension. The cell count, determined by DAPI staining, was 1.0 x 10s cells/mL.
Aqueous Organic Solutions
Bovine serum albumin (Fraction V), alginic acid (low viscosity), dextran(580,000 MW), gum arabic, Triton X-100 (polyethylene glycol-p-isooctylphenyl ether),ethylenediaminetetraacetic acid (EDTA) and benzalkonium chloride were purchased fromSigma Chemical Co., St. Louis, MO. Sodium dodecylbenzene-sulfonic acid (DBSA) waspurchased from Aldrich Chemical Co., Milwaukee, WI. The surfactants Zwittergent 3-16(n-hexadecyl-N, N-dimethyl-3-ammonio-l-propanesulfonate)., Genapol C-100(polyoxyethylene(lO)isotridecyl ether), MEGA 10 (decanoyl-N-methylglucamide) andhexyl-p-D-glucopyranoside were purchased from CalBiochem, La Jolla, CA. Organic test solutionswere made at a concentration of 0.5% (wt/vol) unless noted otherwise. Organic compoundswere dissolved with MS buffer for experiments where bacterial cell suspensions were used;otherwise the organics were dissolved in E-pure deionized water. The pH was adjusted withdilute HC1 or NaOH.
ATR / FT-IR Spectrometry
CA-coated Ge IREs were sterilized under ultraviolet light for 15 min on each sidebefore being placed in a stainless steel multi-reflection edge-seal liquid cell (HarrickScientific, Ossining, NY) (Figure 6.2). BUNA O-rings formed the seal. Both sides of theIRE were exposed to the aqueous test solutions. The flow cell volume was approximately1 mL. The flow cell, O-rings and silicone tubing were autoclaved separately from the coatedIREs. The flow cell was placed on a twin parallel-mirror reflection attachment (HarrickScientific) installed in the sample compartment of aNicolet Magna 550 FT-IR spectrometer(Nicolet Instrument Corp., Madison, WI) equipped with a medium-range mercury-cadmium-telluride detector (Figure 6.2). Experiments involved only with organics adsorption were notrun under sterile conditions. Deionized water or aqueous organic test solution (0.5% wt/vol)was pumped through the flow cell at 8 mL/hr. Solutions (pH 7) were not recirculated. Amacro program (OMNIC MacrosVBasic Version 1.20) was used to collect infrared spectra atset intervals of time. A total of 80 scans (1-min acquisition time) at 4-cm"1 resolution werecoadded and stored for spectral processing. Single-beam IR spectra were processed withGRAMS/32 (Version 4.0) spectroscopic software (Galactic Industries, Salem, NH).Macromolecule adsorption on CA was monitored by digitally subtracting a hydrated CA
17

IIIIIIIsIIIIII1III
Figure 6.2 Attenuated total reflectance accessories (top) including (A) mirrorassembly, (B) flow cell, (C) Ge IRE and (D) ZnSe IRE. FT-IRspectrometer (bottom) including main bench and right AEM.
18

IIIIIII1III1IIiIIII
reference spectrum from the sample absorbance spectrum, revealing the underlying spectrumof the adsorbed species.
The absorptivity of each compound was determined by measuring a transmissionspectrum of a dilute aqueous solution, typically 0.5 to 1.0% wt/vol. Assuming a Beer-Larnbert Law relationship (A = a-b -c) where concentration, c, was equal to the wt/vol% andpathlength, b, equal to 17 fim, the absorptivity, a, for each compound was calculated, havingunits of cm"1. The film thickness of adsorbed macromolecules on Ge was calculated usingthe experimentally measured absorptivity. Macro molecular concentration was defined asunity for the adsorbed thin film.
Captive Bubble Contact Angle (Aspect Ratio) Measurement
The captive bubble contact angle apparatus was designed at OCWD and contracted toD. J. Engineering (Tustin, CA) for manufacture. The main components of the systemconsisted of a liquid reservoir, stage for sample support, charge-coupled device (CCD)camera, lens, x-y-z camera mount and illumination source (Figure 6.3). The majorcomponents mount on a flat sheet of aluminum (3/8 in.) equipped with threaded legs tomaintain a level plane. The stage consisted of a 4 x 2 x 1 in. block of aluminum with a 1 cmslot cut 1.5 in. deep down the middle. A second stage was machined with a 0.5 cm wide slot.The stage was equipped with an aluminum plate to hold the samples flat. The sample stagewas placed in a 4 x 4 x 4 in. plexiglass reservoir filled with 18 Mohm-cm deionized water. Athread feed syringe with Luerlock needle connection was mounted on the side of thereservoir. The syringe was equipped with a 3-in., 22-gauge, 90-degree bevel stainless steelneedle (Hamilton Co.). Air bubbles discharged from the syringe were estimated at 7 - 10 U.L.The syringe needle was reamed with 0.010-in. nickel wire prior to the day's measurements toinsure needle diameter. A glass microscope slide was mounted in the wall of the reservoir,opposite the syringe, to enable capture of images. The CCD camera (COHU, Model48155000 AL2D) was equipped with a 0.75X to 3.OX objective (Edmund Scientific) andmounted on the x-y-z positioning stage. Images were captured and processed using CUE2Series Image Analysis software (Olympus). A Sobell filter was used to outline the bubble'scircular perimeter and the contact baseline. The CUE2 program generated the bubble heightand diameter data for calculation of the height:diameter (H:D) aspect ratio.
Differential Interference Contrast (DIC) Microscopy
Real-time observations of bacterial attachment on CA thin films were made byNomarski DIC microscopy. An Olympus 1X70 inverted microscope was equipped with a40X objective and Optronics CCD camera. A frame grabber board (Media Cybernics, SilverSprings, MD) was installed in a Pentium 120 MHz PC. An 8" Sony Trinitron monitor wasused to display live images. Digitized images were processed by Image-Pro Plus software(Version 3.0, Media Cybernetics). No fluorochromes were needed to visualize the bacterialcells.
19

I
Iiiiiiiiiiiiiiiii
Figure 6.3 Captive bubble contact angle measurement device consistingof (A) CCD camera, (B) objective, (C) stage, (D) syringe andneedle and (E) plexiglass reservoir.
20

IIII1IIIII1IIIIIIii
Circular Flow Cell for Visual Microscopy of Bacterial Cells Attached to CelluloseAcetate Thin Films
Circular flow cells were manufactured from 316 stainless steel (D. J. Engineering)(Figure 6.4). The base of the flow cell was designed to fit on the stage of the Olympus 1X70inverted microscope. Circular coverslips were coated with CA as described above. Siliconespacers were placed over the CA-coated coverslips with channels (22 x 3.2 x 1.5 mm deep)cut to match the fluid dynamics of the ATR flow cell. The top plate of the flow cellcontained a glass window and syringe needles (12 gauge) for inflow and outflow. Testsolutions and bacterial cells were pumped from the ATR flow cell into the microscopic flowcell. Images of bacterial cells physically attached to the polymer surface were obtainedperiodically by the methodology described above.
21
I1II1IIIIi
Iiiiiiii
Differential InterferenceContrast (DIG) Microscopy
X
ATR/FT-IR spectrometry40x objective
Figure 6.4 Circular flow cell (top) consisting of (A) base plate, (B) top platewith Luer lock syringe needles, (C) silicone gasket, (D) coverslipand (E) silicone spacers with 3.2 mm channel. Schematic diagram(bottom) of ATR/FT-IR spectrometry and differential interferencecontrast microscopy.
22.

IIIIIIIIIIIIIIIIIII
Section 7.
Results
Section 7.1 Adsorption of Organic Macromolecules on Ge IRE
Twelve different organic compounds were initially screened for use in sorptionstudies onto cellulose acetate thin films. The goal was to obtain reference spectra and findcompounds with IR vibrational structure that did not overlap that of CA. Later thesecompounds were used in studies of organics adsorption on thin polymer films. As part of anAmerican Water Works Research Foundation (AWWRF) grant conducted by OCWD,numerous chemical compounds and surfactants were screened for their ability to inhibitbacterial attachment. These compounds demonstrated varying abilities to affect bacterialattachment as determined by a radiolabeled adhesion assay (data not shown). Eight of thesechemical agents from the AWWRF project were incorporated in the NWRI project, whichincluded a nonionic, cationic, anionic and zwitterionic surfactant. The eight compounds wereEDTA, hexaglucopyranoside, MEGA 10, Genapol C-100, DBSA, Zwittergent 3-16, TritonX-100 and benzalkonium chloride. A protein, two polysaccharides and a glycoprotein wereselected as model compounds to represent EPS produced by bacteria. These four compoundswere bovine serum albumin (BSA), alginic acid, dextran and gum arabic.
Aqueous organic solutions (0.5% wt/vol) were pumped through a flow cell containinga Ge IRE. After 4 hr, the CA thin film was rinsed by pumping water through the flow cell tothe end of an 8-hr experiment. The kinetics of macromolecular adsorption and desorption onthe Ge surface were investigated by plotting the vibrational band intensities as a function oftime of flow. At the start of each experiment (T = 0 min), the flow cell was rapidly filledwith sample solution. At this time, the IR spectrum represents primarily bulk solution phasesample since the IR radiation penetrates about 0.5 jam into the aqueous phase at each internalreflection. Any increase in the IR band intensities after T — 0 min was considered asadsorbed organic macromolecules. Therefore, all band intensities between T = 0 min andT — 4 hr were a combination of adsorbed and bulk aqueous phase organics. After the 4-hradsorption period, the flow cell was rinsed with water or buffer. The turnover time for theflow cell was approximately 7.5 min at a flow rate of 8 mL/hr. During this time, the bulkphase solution organics were flushed from the flow cell, and loosely bound organics desorbedfrom the aqueous-polymer interface. Therefore, material remaining after 10 min of rinsingwas defined as firmly bound. Desorption rate constants for the firmly bound material weredetermined by fitting the data points to a linear regression line.
Representative ATR/FT-IR spectra of EDTA, hexylglucopyranoside, Genapol C-100and MEGA 10 are shown in Figure 7.1.1. Albumin, alginic acid, dextran and gum arabic areshown in Figure 7.1.2. DBSA, Zwittergent 3-16, Triton X-100 and benzalkonium chlorideare shown in Figure 7.1.3. Each sample spectrum is one of many collected throughout thecontrol study of adsorption and desorption on bare Ge surface. These spectra were obtainedby digitally subtracting a water reference spectrum from each sample spectrum. In somecases, the water subtraction was not complete and a residual 1640 cm"1 water band remained.
23

IIIII1IIIIIII1II11I
.012
a
oCOCO
.004
.002
2000 1800 1600 1400 1200
WAVENUMBERfcnr1) '
1000
Figure 7.1.1 ATR/FT-IR spectra of (A) EDTA, (B) hexylglucopyranside,(C) MEGA 10 and (D) Genapol C-100 adsorbed on Ge IRE,and (E) thin film of CA cast on Ge IRE.
24

I1IIIIIIIIIIIIII1I1
o
oooCO
2000 1800 1600 1400 1200
WAVENUMBER (cm'1)
1000
Figure 7.1.2 ATR/FT-IR spectra of (A) albumin, (B) dextran, (C) alginic acidand (D) gum arabic adsorbed on Ge IRE, and (E) thin film of CAcast on Ge IRE.
25

IIIIIIIII1IIIIIIIII
.06 -
o
oooCD
.04 -
.02 -
2000 1800 1600 1400 1200
WAVENUMBER (cm'1)
1000
Figure 7.1.3 ATR/FT-IR spectra of (A) DBSA, (B) Zwittergent 3-16,(C) Triton X-100 and(D) benzalkonium chloride adsorbedon Ge IRE, and (E) CA thin film cast on Ge IRE.
26

IIIIIIIIiiiii1iiiii
An infrared ATR spectrum of CA cast on a Ge IRE is displayed at the bottom of each set ofspectra. No correction for the wavelength dependence of ATR measurements was made, asthe adsorbed films were much thinner than the depth of penetration of the evanescent wave,
Ethylenediaminetetraacetic Acid
HOOC—CH2 /CHa-COO-
N—CH;-CH2—N
HOOC—CH2 / CH2 — COO~
EDTA, a metal chelating agent, was initially run with a stainless steel flow cell. The1400 cm"1 symmetric carboxylate band and the 1321 cm"1 C-H deformation band intensitiesboth reached a plateau after 60 min (Figure 7.1.4A). Both band intensities dropped rapidly atthe start of the rinse, due to the loss of sample from the bulk aqueous phase and desorption ofloosely bound material. Very little of the material that adsorbed was firmly bound, as theband intensities dropped to near zero absorbance after the 4-hr rinse. As time passed, thesolution in the waste reservoir turned light blue in color. Analysis of this solution byinductively coupled plasma atomic emission spectroscopy revealed the presence of mostlycopper, nickel and aluminum ions. The desorption rate constant of firmly adsorbed materialwas -4.8 x 10"3 min"1. An EDTA film <1 A remaining after the rinse.
A Teflon® flow cell was purchased, and the experiment was repeated. The 1400 cm'1and 1321 cm"1 bands appeared to plateau approximately 40 min into the experiment(Figure 7.1.4B). However, both 1400 cm"1 and 1321 cm"1 bands continued to increase,reaching a maximum intensity of 15.2 and 6.0 mAU, respectively, by the end of the initial4-hr period. More EDTA remained firmly bound to the Ge IRE as compared to theexperiment run with the stainless steel flow cell. These results suggest that the uncomplexedmolecule demonstrated a greater affinity for the Ge substrate. Free carbonyl and carboxylategroups may play a role in sorption to the surface of the IRE. The estimated film thickness ofEDTA left firmly bound to the Ge surface was 13 A.
Hexylglucopy ran o side
HOCH2
OOCH2(CH2)4CH3
27

IIIIIIIIIIIIIII1III
o
oCOCQ
60 120 180 240 300 360 420 480
TIME (min)
Figure 7.1.4 Plot of 1400 cm'1 (v) and 1321 cm'1 (* , ' ) band intensitiesof EDTA as a function of time of flow (A) stainless steeland (B) Teflon® flow cell.
28

IIIIIII
CH3 OH OH
• CH3(CH2)7CH2-C-N-CH2CHCHCHCHCH2OH
* O O
liiiiiiiii
Hexyl-p-D-glucopyranoside is a nonionic surfactant consisting of glucose and a6-carbon aliphatic tail. The surfactant accumulated at the surface of the Ge IRE, reaching aplateau after 60 min, as indicated by the rise in the 1080 cm"1 and 1040 cm"1 bands attributedto a C-O-H and C-0 ring stretch, respectively (Figure 7.1.5). The 1379 cm'1 C-Hdeformation band intensity increased gradually throughout the 4-hr period, indicating that thehydrocarbon tail of the surfactant continued to accumulate at the interface. All three bandsdropped rapidly at the start of the rinse period, indicating the loss of bulk phase organics andloosely bound surfactant from the surface of the IRE. Between T = 250 min and the end ofthe rinse, the 1080 cm'1 and 1040 cm'1 bands dropped 60% and 50%, respectively. The C-Hdeformation band remained unchanged, suggesting that the hydrocarbon tail remained firmlybound to the Ge surface. No desorption rate constant or film thickness was calculated for thiscompound.
MEGA 10
MEGA 10 is a nonionic surfactant, decanoyl-N-methylglucamide. The molecule canexist in a configuration with a negative charge on the oxygen and positive charge on thenitrogen. Thus, the carbonyl band is shifted down to 1603 cm"1, and there is a C-O bandlocated near 1412 cm'1. The 1603 cm'1 and 1412 cm'1 bands and 1082 cm'1 C-O-H band allrose gradually and plateaued at approximately T - 150 min (Figure 7.1.6). Very little of thematerial appeared to be firmly bound to the surface of the IRE, as all three bands droppedbetween 82 and 90% between T - 250 min and the end of the 4-hr rinse. The desorption rateconstant for the firmly bound material was -1.7 x 10'3 min"1. An estimated film thickness of5.8 A remained following the rinse.
Genapol C-100
CH3(CH2)n(OCH2CH2)10OH
Genapol C-100 is anonionic surfactant, polyoxyethylene(10)dodecyl ether (orpolyethylene glycol lauryl ether). The C-O-C antisymmetric stretching band near 1097 cm*1
increased 1.5 mAU following the addition of Genapol C-100 to the flow cell (Figure 7.1.7),The 1350 cm"1 C-H deformation band increased less than 1 mAU over the initial 4-hr period.The 1350 cm"1 band dropped 12% during the rinse period, while the 1097 cm"1 band
29

(TOA
BSO
RB
AN
CE
u> o
n
8O
w
O
>-b
ft ^P
tb 5
' E?
o
w
o^
O ^s
.
l-h
*Sir
^_^
O
•-<
t-'
H
O
H
to o CO o K>
- CD
OJ
O O U)
o\D
OO o
I n> >-t 3.
t*

IIIIIIIiiiiiiiiiii
ta
£9rto00CO
60 120 180 240 300 360
TIME (min)420 480
Figure 7.1.6 Plot of the (A) 1726, ( . ) (1603, (*) 1412 and (•) 1082cm-1
band intenities of MEGA 10 as a function of time of flow.
31

11111
3.5-
• 3.0-
I S 2.5-
^m 2.0-
I S 1.5-m
im 0.5-
I o.o J^ C
111iii• Figure
ii
^ water rinse
u^x^^^V^_^ -
__^— Av-^ ^. .-•< — * * * * i » i i +•i^' * *
60 120 180 240 300 360 420 480
TIME (min)
7.1.7 Plotofthe(*) 1350cm'1 and(- ) 1097 cm'1 band intensitiesof Genapol C- 100 as a function of time of flow.
32

IIIIIIIIIIIIIIIIIII
dropped 44%. These results suggest that the aliphatic tail of the surfactant is more firmlybound to the Ge surface than the ethoxy substituents. A desorption rate constant of-3.0 x 10"3 min"1 was calculated. An estimated film thickness of 33 A remained following therinse.
Bovine Serum Albumin
Bovine serum albumin (40 x 140 A) is an acidic protein with an isoelectric pH of 4.8.At pH 7 the protein has a net negative charge. BSA initially adsorbed rapidly onto the Gesurface, then gradually tapered off (Figure 7.1.8). Adsorption of BSA on Ge did not plateau.The 1546 cm"1 Amide II band intensity reached a maximum of 47 mAU by the end of theinitial 4-hr period. Most of this protein was firmly adsorbed to the Ge surface, as theAmide II band dropped only 21.8% during the 4-hr rinse period. The desorption rate of BSAfrom the interface was -10 x 10"3 min"1. The estimated film thickness of BSA on the IRE was61 A—approximately a monolayer, assuming the molecule lies flat on the surface of the Gesurface.
Dextran
cc( 1 —»6) glucose--cc( 1 —>6)glucose—a( 1 —»6)glucose--a( 1 —^6)glucose
—»4)glucose p(l ~>3)glucose
Dextran is a branched homopolysaccharide composed entirely of glucose and is
classified as neutral. The glucose subunits are linked ot(l—»6) with branches at p(l—»3) and
P(l —»4).32 Dextran rapidly accumulated at the aqueous-polymer interface, as indicated by therapid rise in the 1019 cm"1 band intensity after the start of the experiment (Figure 7.1.9). TheC-0 stretching band intensity appeared to plateau after approximately 60 min but continuedto increase slowly to the end of the 4-hr period. This band dropped rapidly (60% in the first20 min of the rinse), suggesting that much of the polysaccharide was only loosely bound tothe Ge IRE. The firmly bound dextran desorbed at a rate of-15 x 10"3 min"1, and theestimated film thickness of polymer left in contact with the IRE was 2.2 A.
Alginic Acid
--MMMMMMMM-- -GMGMGMGMGM- -GGGGGGGG—
p(l—»4) polymannuronic acid (M) oc(l—>4) polyguluronic acid (G)
Alginic acid is composed of fi-D-mannuronic acid (M) and ct-L-guluronic acid(G).33'34'35 This polysaccharide is linear with homopolymeric sequences of each monomer
33
IIIIIIIIIIIIIIIIIII
<I—I^c,
U
oooCQ
60 120 180 240 300 360 420 480
TIME (min)
Figure 7.1.8 Plot of the (*) 1546 cm"1 Amide II band intensity of bovineserum albumin as a function of time of flow.
34

IIIIIIIIIIIIIIIIIII
60 120 180 240 300 360 420 480
TIME (min)
Figure 7.1.9 Plot ofthe (* ) 1019 cm'1 band intensity of dextran asa function of time of flow.
35

iiiiiiiiiiiiiiiiiii
interspersed with series of alternating sequences. Each sugar subunit has a free carboxvlicacid that has a pKa near 3.3 at an ionic strength of 0.15 M.36 At pH 7.0, the polysaccharideexists almost entirely in the ionized (carboxlyate) form and thus has a net negative charge.As with dextran, the polysaccharide rapidly accumulated at the surface of the IRE. The1034 cm"1 band plateaued near 9 mAU after 60 min (Figure 7.1.10). The C-0 band intensitydropped 84% in the first 20 min. indicating that most of the polysaccharide was not firmlybound. A desorption rate of-1.9 x 10"3 min"1 was calculated, and a film 2.2 A thick was leftremaining on the IRE after the rinse.
Gum Arabic
L-arabinose L-rhamnose D-galactose D-glucuronic acid protein
Gum arabic is a plant polysaccharide composed of the sugars arabinose, rhamnose,galactose and glucuronic acid. A protein component has been reported to be closelyassociated with this polysaccharide, possibly covalently linked/7 When exposed to the bareGe IRE, the 1080 cm"1 C-O band intensity of the polysaccharide plateaued in 60 min,reaching an intensity near 7 mAU (Figure 7.1.11). Protein adsorption (1547 cm"1) did notplateau by the end of the initial 4-hr period, but did reach a maximum of 18 mAU. Virtuallyall the protein remained firmly bound to the surface of the IRE, as the Amide II bandintensity only dropped 1 mAU during the rinse. The protein layer remaining on the IRE afterthe rinse was estimated at 34 A (assuming an absorptivity similar to albumin). Thedesorption rate of the protein component was -2.9 x 10"3 min"1. The polysaccharidecomponent was less firmly bound. The 1080 cm"1 band dropped 78% during the initial phaseof the 4-hr water rinse. However, some polysaccharide did remain firmly bound to the IRE.The desorption rate of the firmly bound polysaccharide component of gum arabic was-2.3 x 10"3 min"1. The film thickness of the remaining gum arabic was 5 A (assuming anabsorptivity similar to alginic acid).
Dodecylbenzenesulfonic Acid (DBSA)
— (CH2)10-CH
DBSA is an anionic surfactant with a negatively charged, para-substituted, sulfonategroup on the benzene ring and a 12-carbon aliphatic tail. It was initially screened at a
36

1111111 1 10
£T 8 'I-M O
U
I | « •i S 4 -
1 a r
10
1I1111
>k waterrinse, , i , -fc-** * — , •- \ \ ^ ^
-.-
60 120 180 240 300 360 420 480TIME (min)
( Figure 7.1.10 Plot of the (« ) 1034 cm'1 band intensity of alginic acid asa function of time of flow.
ii 37

1111 28-
i 20-
i12-
u
|<j 4 •cpo
• S 16"
• ^ 14-
1• 10-
Io
4 "ii
>^ water rinse
(A
B
T water rinse
^~— Nf V_
•• • • * • * — *— • — • ~* -• — * —
) 60 120 180 240 300 360 420 480TIME (min)
iii
Figure 7.1.1 1 Plots of the (A) 1547 cnr1 Amide II and (B) 1080 cnr1
• C-O stretching band intensities of gum arabic as a function* of time of flow.
i38i

IIIIIIIIIIIIIIII1II
concentration of 0.25% and later at 0.5%. A significant amount of DBSA adsorbed to the Gesurface at 0.25%. as indicated by the increase in the 1178 cm"' antisymmetric S-O stretchingband and the 1136 cm"1 and 1009 cm"1 ring vibrations (Figure 7.1.12). The surfactant slowlydesorbed from the IRE throughout the 4-hr rinse. A desorption rate of -12 x 10'3 min"1 wascalculated, and a film thickness of 3.1 A remained after the rinse.
When the concentration of DBSA was increased to 0.5%, similar adsorption kineticswere observed. However, more surfactant adsorbed to the Ge substrate at the higherconcentration. The 1009 cm"1 band intensity neared a plateau at 8.4 mAU. The desorptionrate kinetics were also very similar. A desorption rate constant of-8.5 x 10"3 min"1 wascalculated based on the 1009 cm"1 band intensity. A film thickness of 5.7 A remained afterthe rinse. At both concentrations, the intensity of the 1136 cm"' ring mode leveled off duringthe rinse, while the other band intensities continued to drop. These results suggest that thebenzene ring is more closely associated with the IRE surface than the other parts of themolecule.
Zwittergent 3-16
O
I ICH2 —S —O"
IIO
CH2
CH3
CH2— N — CH2 - ( CH2 )„ - CH3
CH,
Zwittergent 3-16 (n-hexadecyl-N, N-dimethyl-3-ammonio-l-propanesulfonate) is azwitterionic surfactant with a terminal sulfonate group and a quaternary amine. After fillingthe flow cell with sample solution (T = 0 min), there was a 15-min delay before a significantchange in the band intensities associated with Zwittergent 3-16 adsorption was observed(Figure 7.1.13). After this brief lag period, surfactant began to accumulate on the surface ofthe IRE, as indicated by the increase in intensity of the 1468 cm"1, -CH2) -CH3 deformationband and the 1186 cm"l/1041 cm"1 antisymmetric/symmetric S-O stretching bands. None ofthe absorption bands plateaued before the end of the 4-hr period. Desorption of surfactantfrom the surface occurred in two phases which were defined as loosely bound and firmlybound Zwittergent 3-16. The three major band intensities dropped 52% between T = 250min and the end of the experiment. The desorption rate of the most firmly bound Zwittergent3-16 was -5.5 x 10"3 min"1, and an estimated film thickness of 9.8 A remained at the end of therinse.
39

IIIIIiiiiiiiiiiiiii
D
o
oGO
OQ
120 180 240 300
TIME (min)
360 420 480
Figure 7.1.12 Plots of the (A) 1178 cnr1, (B) 1136 cm'1 and C) 1009 cnr1
band intensities of DBSA as a function of time of flow atconcentrations of (*) 0.25% and (°) 0.5% wt/vol.
40
IIIIIIIIIIIIIIIIIII
60 120 180 240 300 360 420 480TIME (min)
Figure 7.1.13 Plot of the (*) 1468, (•) 1186 and(*) 1041 cm'1 bandintensities of Zwittergent 3-16 as a function of time of flow.
41

II1IIIIIIIIIIIIIIII
Triton X-100
OCH2CH2—(OCH2CH;)9 —OH
Triton X-100 (polyethylene glycol-/7-isooctylphenyl ether) is a nonionic surfactant.As with Zwittergent 3-16, there was a delay (30 min at 0.1% and 60 min at 0.5%) before adetectable quantity of Triton X-100 began to accumulate at the surface of the IRE. At aconcentration of 0.1%, the 1512 cm"1 semicircle stretching band of benzene reached amaximum of 1.6 mAU at the end of the initial 4-hr period (Figure 7.1.14A). The 1512 cm"1
band dropped rapidly at the start of the rinse. However, this was primarily due to the loss ofbulk phase Triton X-l 00 from the flow cell. Some surfactant did remain adsorbed to the Gesurface following the rinse. The film thickness was estimated at 2.6 A. At 0.5% the1512 cm"1 band plateaued near 18 mAU after 210 min (Figure 7.1.14B). Very little materialdesorbed from the Ge surface, as the 1512 cm"1 band only dropped 14% following the 4-hrrinse. A desorption rate of-3.2 x 10"3 min"1 was calculated for the firmly bound material.The thickness of the film remaining on the IRE after the rinse was estimate at 80 A.
Benzalkonium Chloride
CH3
CH2 —N—R
CH,
R = CHi d 2 9
Benzalkonium chloride is a cationic quaternary amine with a methyl benzene groupand a mixture of 12-, 14- and 16-carbon aliphatic chains. Benzalkonium chloride rapidlyadsorbed to the Ge surface, approaching near-maximum levels after approximately 30 min(Figure 7.1.15). Both 1487 cm"1 and 1473 cm"1 C-H deformation bands pleateaued near
42
IIII1IIIIIIIIIIII1I
o
oGO
PQ
120 180 240 300
TIME (min)
360 420 480
Figure 7.1.14 Plots of the 1512 cm'1 band intensity of TritonX-100 asa function of time of flow at (A) 0.5% and (B) 0.1%.
43

IIIIII
I
IIIIIIII1
0 50 100 150 200 250 300 350 400 450 500TIME (min)
Figure 7.1. 15 Plot of the (+) 1487, (•) 1473 and (*) 1457 cm'1 bandintensities of benzalkonium chloride as a function of timeof flow.
44

IIIIIIIIIIIIIIIIIII
4.5 mAU. These bands dropped rapidly at the start of the water rinse; however, a measurablequantity of material remained at the Ge surface at the end of the 4-hr rinse. The estimatedfilm thickness was 5.9 A. The IR data from the rinse was too noisy to calculate a desorptionrate constant.
Summary
Each of the compounds had at least one IR vibrational band that could be used tomonitor molecular adsorption onto CA thin films. A list of these vibrational bands is shownin Table 7.1.1. Desorption rate constants were calculated by fitting the data to a linearregression line. Data from the first 15 min of the rinse was not included as the flow cell tookapproximately 10 min to turn over one volume. During this time loosely bound organics andorganics in the bulk phase were flushed from the flow cell. The thickness of the organic filmleft on the IRE surface was calculated. The desorption rate constants and thickness of theadsorbed films are summarized in Table 7.1.2. Proteins and Triton X-l 00 adhered to thegreatest extent based on the calculated thickness of the adsorbed film. The remainingsurfactants fell in the middle, and the polysaccharides were grouped at the end. There was noadsorption trend with respect to the net charge on the surfactants, i.e., nonionic surfactantsdidn't adsorb to a greater extent than all cationic or anionic surfactants.
Table 7.1.1
Infrared Vibrational Bands of Organic Compoundsfor Use in Adsorption Studies on Thin Films of Cellulose Acetate
Organic Compound Vibrational Band (cm )EDTA 1400Hexylglucopyranoside 1040, 1379MEGA 10 1412GenapolC-100 1350Albumin 1547Dextran 1159Alginic Acid 1416Gum Arabic 1547, 1080Dodecylbenzenesulfonic Acid 10092wittergent3-16 1468Triton X-100 1512Benzalkonium Chloride 1487, 1473, 1457
45

IIIIIIIIIIIIIIII
Table 7.1.2
Desorption Rate Constants and Film Thickness of Organic Moleculeson Germanium Internal Reflection Element
Organic Compound
Triton X- 100 (0.5% w/v)
Bovine Serum Albumin
Gum Arabic(protein component)GenapolC-100
EDTA(Teflon® flow cell)Zwittergent 3-16
Benzalkonium Chloride
MEGA 10
DBSA
Gum Arabic(polysaccharide component)DBSA
Triton X-100 (0.1% w/v)
Alginic Acid
Dextran
EDTA(stainless steel flow cell)
Properties
nonionic surfactant
acidic proteinpKa = 4.S
polysaccharide(w/ protein)
nonionic surfactant
anionic / metalchelating agent
zwitterionic surfactant
cationic surfactant
nonionic surfactant
anionic surfactant
polysaccharide(w/ protein)
anionic surfactant
nonionic surfactant
acidic polysaccharide
neutral polysaccharide
anionic metal chelatingagent
Desorption RateConstant
x 10'3 (min'1)-3.3
-10
-2.9
-3,0
NA
-5.5
-2.0
-1.7
-8.5
-2.3
-12
NA
-1.9
-1.5
-4.8
Film ThicknessAfter Rinse
(A)80
61
34
33
13
9.4
5.9
5.8
5.7
5.0
3.1
2.6
2.2
2.2
<1
NA—not available
ii
46
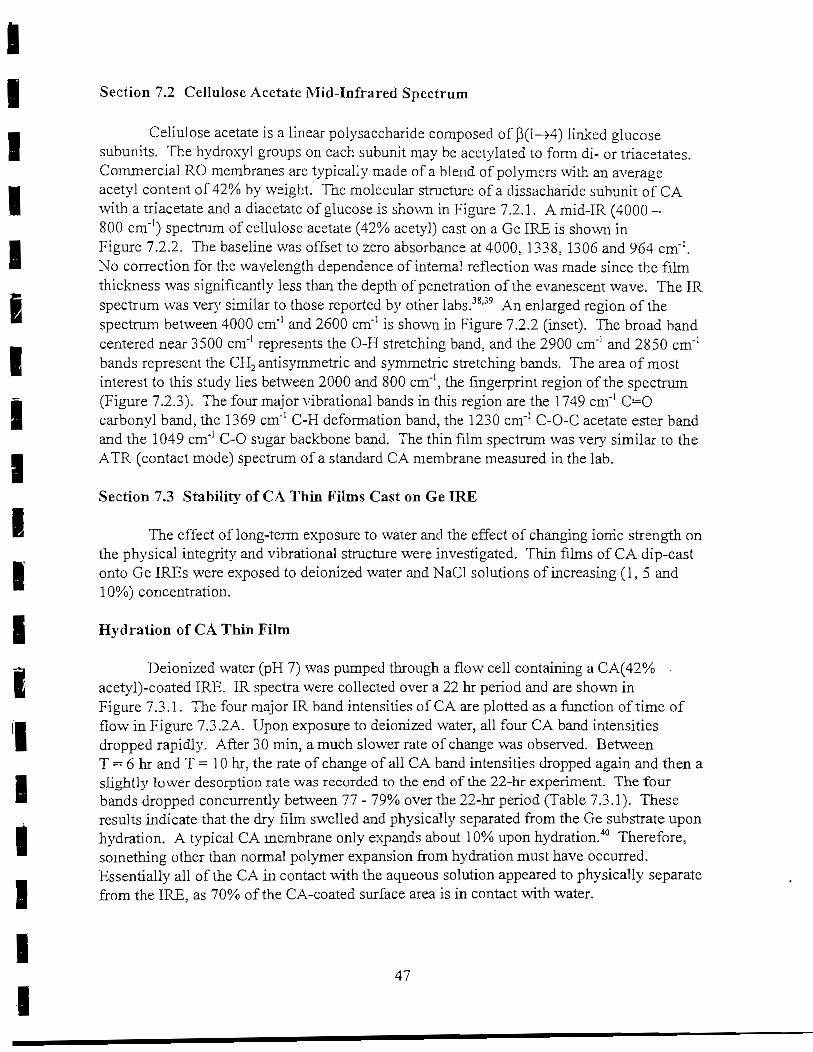
IIIIIIIiiiiiiiiiiii
Section 7.2 Cellulose Acetate Mid-Infra red Spectrum
Cellulose acetate is a linear polysaccharide composed of p(l—»4) linked glucosesubunits. The hydroxyl groups on each subunit may be acetylated to form di- or triacetates.Commercial RO membranes are typically made of a blend of polymers with an averageacetyl content of 42% by weight. The molecular structure of a dissacharide subunit of CAwith a triacetate and a diacetate of glucose is shown in Figure 7.2.1. A mid-IR (4000 -800 cm"1) spectrum of cellulose acetate (42% acetyl) cast on a Ge IRE is shown inFigure 7.2.2. The baseline was offset to zero absorbance at 4000, 1338, 1306 and 964 cm"1.No correction for the wavelength dependence of internal reflection was made since the filmthickness was significantly less than the depth of penetration of the evanescent wave. The IRspectrum was very similar to those reported by other labs.38'39 An enlarged region of thespectrum between 4000 cm"1 and 2600 cm"1 is shown in Figure 7.2.2 (inset). The broad bandcentered near 3500 cm"1 represents the 0-H stretching band, and the 2900 cm"1 and 2850 cm"1
bands represent the CH2 antisymmetric and symmetric stretching bands. The area of mostinterest to this study lies between 2000 and 800 cm'1, the fingerprint region of the spectrum(Figure 7,2.3), The four major vibrational bands in this region are the 1749 cm"1 C=Ocarbonyl band, the 1369 cm"1 C-H deformation band, the 1230 cm"1 C-O-C acetate ester bandand the 1049 cm"1 C-0 sugar backbone band. The thin film spectrum was very similar to theATR (contact mode) spectrum of a standard CA membrane measured in the lab.
Section 7.3 Stability of CA Thin Films Cast on Ge IRE
The effect of long-term exposure to water and the effect of changing ionic strength onthe physical integrity and vibrational structure were investigated. Thin films of CA dip-castonto Ge IREs were exposed to deionized water and NaCl solutions of increasing (1, 5 and10%) concentration.
Hydration of CA Thin Film
Deionized water (pH 7) was pumped through a flow cell containing a CA(42% -acetyl)-coated IRE. IR spectra were collected over a 22 hr period and are shown inFigure 7.3.1. The four major IR band intensities of CA are plotted as a function of time offlow in Figure 7.3.2A. Upon exposure to deionized water, all four CA band intensitiesdropped rapidly. After 30 min, a much slower rate of change was observed. BetweenT = 6 hr and T ~ 10 hr, the rate of change of all CA band intensities dropped again and then aslightly lower desorption rate "was recorded to the end of the 22-hr experiment. The fourbands dropped concurrently between 77 - 79% over the 22-hr period (Table 7.3.1). Theseresults indicate that the dry film swelled and physically separated from the Ge substrate uponhydration. A typical CA membrane only expands about 10% upon hydration.40 Therefore,something other than normal polymer expansion from hydration must have occurred.Essentially all of the CA in contact with the aqueous solution appeared to physically separatefrom the IRE, as 70% of the CA-coated surface area is in contact with water.
47
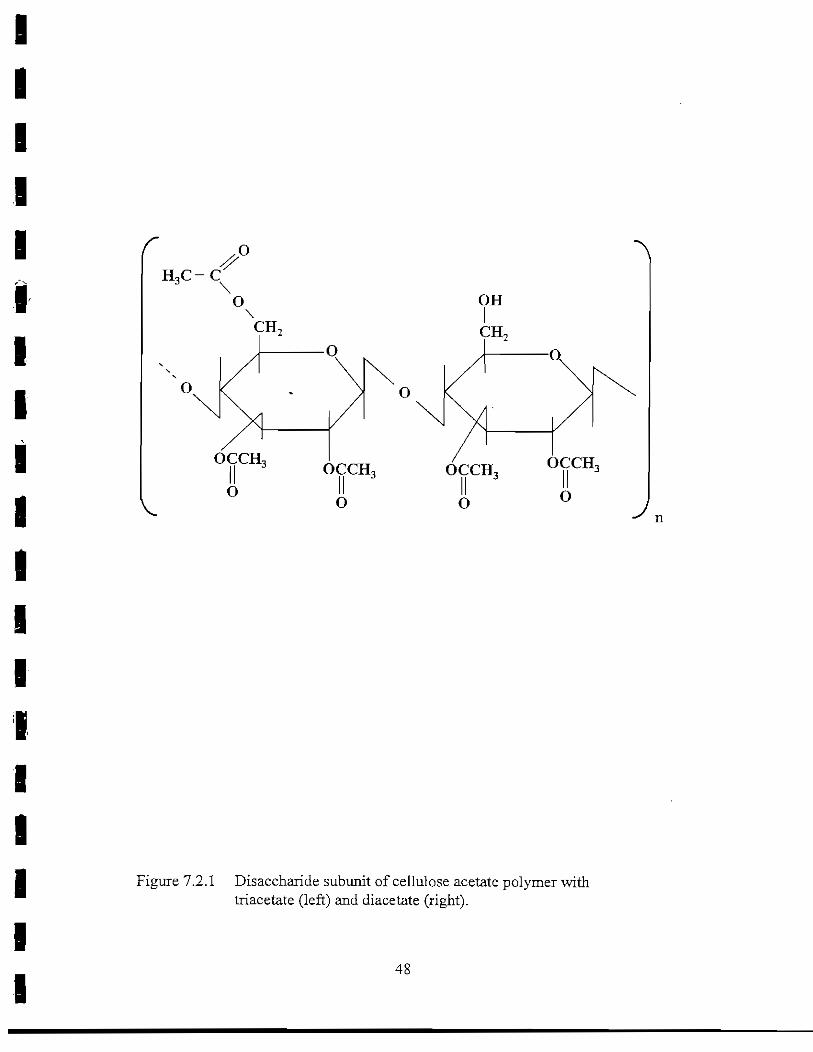
IIIII•* ^
IIilliiiiliii
rH3C-C
O
\
\-
O
OCCH,
O
OH
CH-O
O
OCCH,
O
OCCH,
O
OCCH,
O
Figure 7.2.1 Disaccharide subunit of cellulose acetate polymer withtriacetate (left) and diacetate (right).
48
J n

IIIIIIIIIIIII1IIIII
4000 3500 3000 2500 2000
WAVENUMBER (cm'1)
1500 1000
Figure 7.2.2 Mid-infrared ATR spectrum (4000 - 800 cnr1) of a thin filmof CA(42°/o acetyl) cast on a Ge IRE.
49

IIII1III
2-
1.5-oz:
oGOCQ
C - O - C acetate ester
C - O backbonestretch
i i ~ i r \^ i ^ i i i2000 1900 1800 1700 1600 1500 1400 1300 1200 1100 1000 900
WAVENUMBER (cnr1)
Figure 7.2.3 Mid-infrared ATR spectrum (2000 - 800 cnr1) of a thin filmof CA(42% acetyl) cast on a Ge IRE.
50

OQ U)
-3o, 72
s- >
£• ^
N
toO
s?
It
-
o P O a>
AB
SOR
B A
NC
E

1III1II1I1I\
III1II
o
oooCO
2 4 10 12 14TIME(hr)
16 18 20 22
Figure 7.3.2 Plots of the (*) 1744, (. ) 1433, (A) 1369, (*) 1232 and(* )1049 cm'1 band intensities of (A) cellulose acetate(42% acetyl) and (B) the 1639 cm'1 water band intensityas a function of time of flow.
52

IIII1IIIIIIIIIII11I
The intensity of the 1639 cm"1 water band intensity is plotted as a function of time offlow in Figure 7.3.2B. At T = 0 min, a water band intensity of 0.284 AU was measured. The1639 cm"1 band intensity increased rapidly during the first 45 min. Between T = 60 hr andT ~ 10 hr, the rate of increase dropped, and the 1639 cm"1 band eventually stabilized near0.56 AU. The water band intensity measured with a bare Ge IRE (50 x 10 x 2 mm) istypically 0.698 ± 0.038 AU (± std. dev.s n = 17). The greatest water band intensity measuredwith the CA-coated Ge IRE was 0.558 AU. 80% of the maximum possible value. Therefore,some CA was still in contact with the IRE or, at the least, still within the depth of penetrationof the evanescent wave.
Table 7.3.1
Effect of Hydration on Cellulose Acetate Thin FilmCast on Ge IRE
Sample
DryCA
WetCA(T = 0 hr)
WetCA(T = 22 hr)
% Change(after hydration)
CA(Dried)
% Change(after drying)
1747 cm'1 1369 cm'1 1234 cm'1 1049 cm"1 1639 cm'1
1.484 AU 0.542 AU 1.870 AU 1.399 AU
0.284 AU
0.336 0.124 0.395 0.314 0.558
-77% -77% -79% -76% +96%
1.439 0.530 1.786 1.329
-3% -2% -4% -5%
The kinetic plot of the water band intensity is inversely related to the plot of the CAbands, i.e.., at every point where the water band intensity increased, the CA band intensitiesdecreased. These results indicate that the polymer was displaced from the surface of the IREand immediately replaced by water. As discussed in Section 5, the electric field intensitydrops as a function of distance from the interface, and the measured band intensities areproportional to the electric field intensity. Thus, the CA film moved farther from the surfaceof the IRE, and the CA band intensities dropped. In turn, water passed through the film
53

iiiiIiiiiii
iii
occupying the void space left by the CA, and the water band intensity increased (seeFigure 7.3.2B). If the CA film is displaced by water and distends from the Ge surfacebeyond dp, then a water band of approximately 0.7 AU should be observed.
Significant changes in the vibrational spectrum of CA were observed upon hydration.The carbonyl band shifted to lower wavenumber, moving 2 cm"1 from 1749 cm"1 to1747 cm"1. The C-O-C acetate ester band shifted to higher wavenumber, moving 2 cm"1 from1230 cm"1 to 1232 cm"1. Similar shifts in frequency have been reported by Toprak andcoworkers.41 These frequency shifts occur as a result of hydrogen bond formation with thecarbonyl group on CA. When the wet CA film was dried by purging the flow cell with dryair, both bands shifted back to their higher wavenumber position. All CA bands returned towithin 2 to 5% of their pre-hydrated intensities (Table 7.3.1). Several more experimentswere run with similar results (data not shown). The CA-coated IREs were examined aftereach control experiment to determine if the thin film was still intact. The polymer-coatedIREs were removed from the flow cell and placed in a petri dish of water. A Pasteur pipetwas used to manipulate the CA film. In most cases, the thin films were still physically intact,i.e., void of rips or tears. There were usually small areas of the film not in direct contact withthe surface of the IRE. However, areas on the CA film typically had to be peeled from theIRE surface. Since the films were intact, work with the CA-coated Ge IREs continued.
Effect of Changing Ionic Strength on CA Thin Films
A thin film of CA was exposed to sodium chloride solutions of varying concentrationto determine its stability in solutions of varying ionic strength. A CA(42% acetyl)-coatedIRE was placed in a flow cell and hydrated with deionized water (pH 7). All CA bandintensities dropped immediately upon exposure to water. The rate and the extent to whicheach band dropped (Figure 7.3.3A) were greater than previously observed (see Figure 7.3.2).The CA film appeared to stabilize after 11 hr. The changes in the water band intensity wereinversely related to the changes in CA band intensities. The 1639 cm"1 band intensity roserapidly over the first 1 hr, tapered off and plateaued near 0.61 AU after approximately 11 hr(Figure 7.3.3B).
1% NaCl Addition. After 24-hr exposure to deionized water, a 1% NaCl solutionwas pumped through the flow cell. The four major CA band intensities increased between 61and 143% upon addition of the salt solution (Figure 7.3.4A), while the water band intensitydropped 4% from 0.616 to 0.592 AU (see Figure 7.3.4B and Table 7.3.2). As time passed,the CA band intensities returned to levels recorded prior to the NaCl addition.
These results indicate that the film of CA does not remain physically attached to theGe surface but exists in a dynamic state and responds to changes in ionic strength. If the thinfilm is viewed as a free-floating membrane where water is allowed to pass through the filminto an area between the film and the IRE, the data is more easily interpreted. When water inthe flow cell is displaced by the salt solution, water diffuses from within the space betweenthe IRE and the film, back through the film and into the bulk aqueous phase. As a result, thefilm collapses onto the IRE, where the electric field intensity is much greater, and thus theCA band intensities increase. As time passes, the water and Na+ and Cl~ ions in the bulk
ii 54

IIIIIIIIII1IIIIIIII
o
oCOm
2.0
1.8
1.6 ;
1.4::
1.2 j
1.0
0.8^
0.6
0.4
0.2
0.0
0.7
0.6
0.5
0.4
0.3
0.2 -
0.1 -
0.0
A
B
0 2 4 6 8 10 12 14 16 18 20 22 24
TIME(hr)
Figure 7.3.3 Hydration of cellulose acetate. Plots of the (*) 1747, (•) 1433,(A) 1369, (x) 1232 and (*) 1049 cm'1 band intensities of(A) cellulose acetate (42% acetyl) and (B) the 1639 cm"1 waterband intensity as a function of time of flow.
55

IIIIII1II1II1I1I1II
o
oCOm
Y l%NaCl addition
- 6 - 4 - 2 0 2 4 6 8 10 12 14 16 18 20 22 24
TIME(hr)
Figure 7.3.4 1% NaCl Addition. Plots of the (-) 1747, (• ) 1433, ( A) 1369,(x) 1232and(«) 1049 cm'1 band intensities of (A) celluloseacetate (42% acetyl) and (B) the 1639 cm"1 water band intensityas a function of time of flow.
56
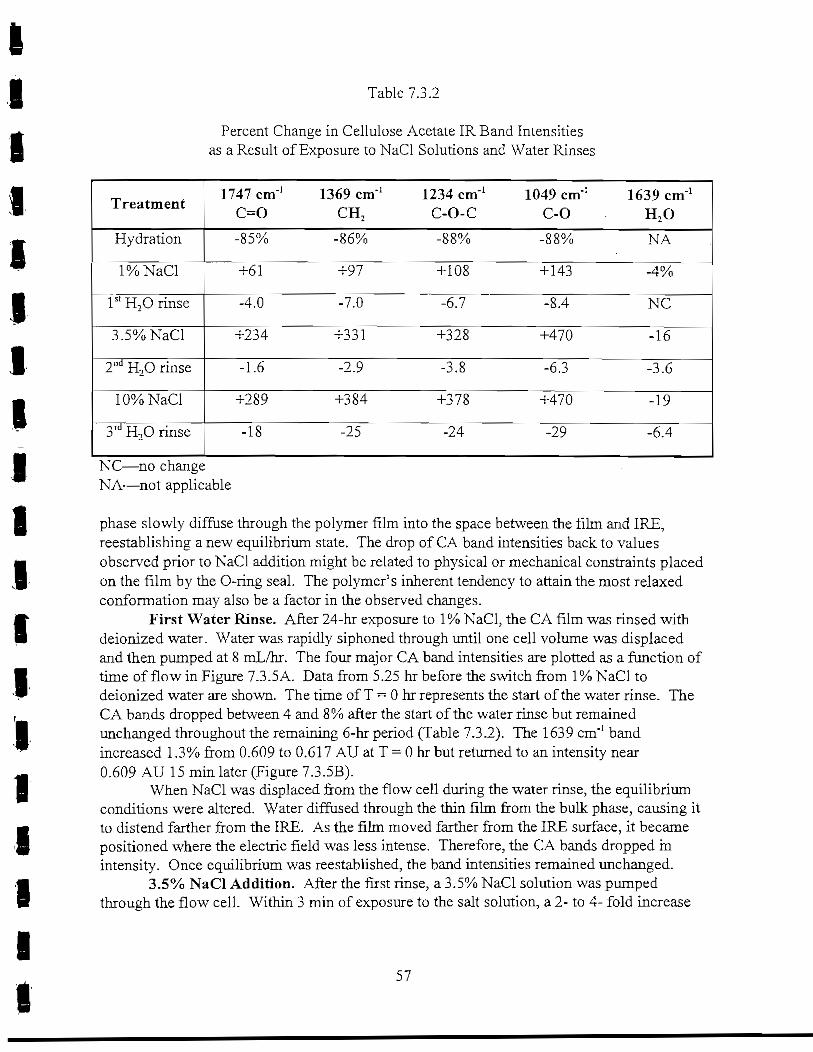
IIII
1IIIIIIIIII1II
Table 7.3.2
Percent Change in Cellulose Acetate IRBand Intensitiesas a Result of Exposure to NaCl Solutions and Water Rinses
Treatment
Hydration
!%NaCl
1st H,O rinse
3. 5% NaCl
2nd H,O rinse
10% NaCl
3rd H20 rinse
1747 cm'1C=O
-85%
+61
-4.0
+234
-1.6
+289
-18
1369 cm'1CH2
-86%
+97
-7.0
+331
-2.9
+384
-25
1234 cm'1C-O-C
-88%
+108
-6.7
+328
-3.8
+378
-24
1049 cm'1C-O
-88%
+143
-8.4
+470
-6.3
+470
-29
1639 cm'1H2O
NA
-4%
NC
-16
-3.6
-19
-6.4
NC—no changeNA—not applicable
phase slowly diffuse through the polymer film into the space between the film and IRE,reestablishing a new equilibrium state. The drop of CA band intensities back to valuesobserved prior to NaCl addition might be related to physical or mechanical constraints placedon the film by the 0-ring seal. The polymer's inherent tendency to attain the most relaxedconformation may also be a factor in the observed changes.
First Water Rinse. After 24-hr exposure to 1% NaCl, the CA film was rinsed withdeionized water. Water was rapidly siphoned through until one cell volume was displacedand then pumped at 8 mL/hr. The four major CA band intensities are plotted as a function oftime of flow in Figure 7.3.5A. Data from 5.25 hr before the switch from 1% NaCl todeionized water are shown. The time of T - 0 hr represents the start of the water rinse. TheCA bands dropped between 4 and 8% after the start of the water rinse but remainedunchanged throughout the remaining 6-hr period (Table 7,3.2). The 1639 cm"1 bandincreased 1.3% from 0.609 to 0.617 AU at T- 0 hr but returned to an intensity near0.609 AU 15 min later (Figure 7.3.5B).
When NaCl was displaced from the flow cell during the water rinse, the equilibriumconditions were altered. Water diffused through the thin film from the bulk phase, causing itto distend farther from the IRE. As the film moved farther from the IRE surface, it becamepositioned where the electric field was less intense. Therefore, the CA bands dropped inintensity. Once equilibrium was reestablished, the band intensities remained unchanged.
3.5% NaCl Addition. After the first rinse, a 3.5% NaCl solution was pumpedthrough the flow cell. Within 3 min of exposure to the salt solution, a 2- to 4- fold increase
57

II11IIIIIIIII1I1II
o
oCOm
0 9S -
0.20-
0.15-
o.io-
0.05-
0.00^0.64-0.63-0.62-
.61 -0.60-0.59-0.58-0.57-0.56-
!%NaCl ^ water rinse A
t t * * — *C^ W
B
y water rinse!%NaCl
. -+— . . . A J•» • — * v*- *- -*^*-**-** *^ *•« *-•
. 6 - 5 - 4 - 3 - 2 - 1 0 1 2 3 4 5 6
TIME(hr)
Figure 7.3.5 First water rinse. Plots of the (*) 1747, (•) 1433, ( A ) 1369,(x) 1232 and (*) 1049 cm"1 band intensities of (A) celluloseacetate (42% acetyl) and (B) the 1639 cm"1 water band intensityas a function of time of flow.
58

1IIIIIIIII1IIIIIII
in all CA band intensities was observed, with greater changes occurring at lower frequencies(see Figure 7.3.6A and Table 7.3.2). All CA bands slowly dropped in intensity, eventuallyreturning to the levels recorded prior to the NaCl addition. The rate at which the bandintensities dropped was significantly slower at 3.5% NaCl as compared to 1%. While the CAband intensities increased, the 1639 cm'1 band intensity decreased, dropping 16% from 0.610to 0.509 AU in 1.77 min (Figure 7.3.6B). The water band gradually returned to an intensitythat fluctuated near 0.627 AU.
The same series of events occurred when the deionized water was replaced by 3.5%NaCl. Water trapped between the thin film and the IRE diffused through the CA into thebulk phase, causing the polymer film to collapse onto the IRE. As a result, the intensities ofthe CA bands increased. With time, water and Na+ and Cl~ ions slowly diffused through thethin film, reestablishing an equilibrium condition while the CA bands dropped in intensity.
Second Water Rinse. After 24-hr exposure to the salt solution, water was siphonedthrough, displacing one flow cell volume, then pumped through at 8 mL/hr. All four CAbands dropped sharply between 2 and 12 mAU, then rapidly increased in intensity,approximately 5 mAU above those measured before the water addition (Figure 7.3.7A). Thewater band dropped 3.6% after approximately 15 min and remained unchanged for theremainder of the 6-hr rinse period (Figure 7.3.7B). These changes in the water band intensitywere consistent with the observed increase in the CA band intensities, which indicates thatthe film collapsed onto the IRE displacing water at the interface.
10% NaCl Addition. Following the second water rinse, a 10% NaCl solution waspumped through the flow cell. Again, there was a rapid increase in all the CA bandintensities (Figure 7.3.8A). The four major CA bands increased 3- to 4-fold within 2.5 min(Table 7.3.2.). These bands immediately began to drop in intensity, at first quite rapidly andthen more gradually up to T = 6 hr. The CA band intensities appeared to stabilize betweenT ~ 6 hr and T = 24 hr but actually dropped at a rate of 0.7 - 2.0 mAU/hr during this time(Table 7.3.3). After 24 hr exposure to 10% NaCl, the CA bands were 9 to 20% above theintensity recorded at the end of the second rinse. The water band intensity increased at a rateof 0.4 mAU/hr and was 7% above the intensity prior to NaCl addition (Figure 7.3.8B).
Third Water Rinse. After exposure to the salt solution, the CA film was rinsed afinal time with deionized water. All CA band intensities dropped between 18 and 29%(Table 7.3.2) and remained stable throughout the 6-hr rinse (Figure 7.3.9A). The 1639 cm"1
water band dropped 6.4% after the start of the water rinse, which was unexpected since theCA band intensities all dropped (Figure 7.3.9B). The water band should have increased inresponse to the drop in CA band intensities.
Summary
The thin CA film cast on the Ge IRE appears to act as an osmotic pressure cell. Atthe start of the experiment, the dry CA film absorbed water and physically separated from thesurface of the IRE. The magnitude of the changes in band intensities was too great to beassociated solely with polymer swelling upon hydration (see Table 7.3.2). Therefore, it isbelieved that the thin film detaches from the surface, forming an osmotic cell. When the CA
59

1I1II1I
I1IIIIIIIII
r )
Sjot/3CQ
1.4 '
1.2 -
i.o -0.8 -
0.6 -
0.4 -
0 9 -
o.o -0.7-
0.6 -
0.5 -
0.4 -
0.3 -
0.2 -
0.1 -
n n _
^ 3. 5% NaCl addition A
; .I
& ^ a a a-t^ ^^Qfrao - j b ^ ^ ^ ^ ^ ^ ^ , ^ ^ ^ ^ ^ ^ ^— a a a !
H20
-f 3.5% NaCl addition
B
-6 -4 -2 0 2 4 6 8 10 12 14 16 18 20 22 24
TIME(hr)
Figure 7.3.6 3.5% NaCl Addition. Plots of the (*) 1747, (.) 1433, (A) 1369,(x ) 1234 and (x ) 1049 cm'1 band intensities of (A) celluloseacetate (42% acetyl) and (B) the 1639 cm"1 water band intensityas a function of time of flow.
60

IIII1III1II1IIIIII
wu30COPQ<
0.30 -
0.25 -
0.20 -
0.15 -
o.io -
0.05 -
o.oo -
0.66 -
0.64 ^
0.62 -
0.60 -
0.58 "
0.56 -
0.54 -
d water rinse A3.5%NaCl
v .. ^»^^^XwXKKKuww«^: x •X * W W M >\/^ . ' . P ' . . U , J ( )(^V^-m* « « « . . . . . , ,
B
• water nnse3.5%NaCl
- 6 - 4 - 2 0 2
TIME (hr)
Figure 7.3.7 Second water rinse. Plots of the (* ) 1747, (• ) 1433, (A ) 1369,(x) 1234, and (*) 1049 cm"1 band intensities of (A) celluloseacetate (42% acetyl) and (B) the 1639 cm"1 water band intensityas a function of time of flow.
61

IIIIIIIII1IIIII
U
oGO
1.4
1.2
1.0
0.8
0.6
0.4
0.2
0.0
0.7
0.6
0.5
0.4
0.3
0.2
0.1
0.0
10%NaCl additionA
H2O
-f 10%NaCl addition
B
T I I
- 6 - 4 - 2 0 2 4 6 8 10 12 14 16 18 20 22 24
TIME(hr)
iFigure 7.3.8 10% NaCl Addition. Plots of the (*) 1747, (•) 1433, (A) 1369,
(x ) 1234, and (* ) 1049 cm'1 band intensities of (A) celluloseacetate(42% acetyl) and (B) the 1639 cm"1 water band intensityas a function of tune of flow.
i 62

1IIIIIIIII1IIIIIII
wu
oGOffi<
U.JD -
0.30-
0.25-
0.20-
0.15-
0.10-
0.05-
0.00-
0.68-
0.66-
0.64-
0.62-
0.60-
0.58-
0.56-
A </l -
10%NaCl 1 water rinse A
11 \* * * * w ^*^
fi A \ "" "^ " L 1
B
10%NaCl 4^ water nnse
\6
TIME(hr)
Figure 7.3.9 Third water rinse. Plots of the (*) 1747, (•) 1433, ( A ) 1369,(x) 1234, and (*) 1049 cm"1 band intensities of (A) celluloseacetate(42% acetyl) and (B) the 1639 cm'1 water band intensityas a function of time of flow.
63

iiiiiiiiiiiiii
iiii
film is exposed to the NaCl solution, water diffuses across the film into the bulk phase,causing the film to collapse back onto the IRE. As a result, the film is positioned in anarea where the electric field is more intense, and thus the CA band intensities increase. Thistheory would account for the simultaneous drop of all four major CA band intensities and thesubsequent increase in the water band intensity. Eventually, Na"" and Cl~ ions (and water)diffuse back through the CA film into the osmotic cell. This cycle is repeated each time thesalt solution and rinse are applied to the CA film. As the concentration of NaCl is increasedfrom 3.5% to 10%, the magnitude of the changes increases, and the relaxation rates decrease,i.e., the equilibration time increases. These changes are evident in Figures 7.3.10A and7.3.IB, where the 1232 cm"1 and 1639 cm"' band intensities are plotted as a function of timeof flow for the entire experiment.
Table 7.3.3
Effect of 10% NaCl Solution onCellulose Acetate and Water Band Intensities
CA BandsAnd
Water Band1747cm'1
1369cm-1
1234 cm'1
1049cm'1
1639cm'1
T ~ - 1 5 min(AU)
0.2365
0.0796
0.2542
0.1841
0.6060
T = 24hr(AU)
0.2584
0.0921
0.2889
0.2203
0.6491
Change(%)
+9
+16
+14
+20
+7
Rate of ChangeBetween T = 6 & T = 24 hr
(mAU/hr)-2.0
-1.6
-1.8
-0.7
+0.4
Section 7.4 Mycobacterium Isolate BT2-4 Adhesion on CA Thin Film
Mycobacterium Isolate BT2-4 Culture
Adhesion of bacterial cells on CA was investigated by pumping a culture ofMycobacterium isolate BT2-4 through a flow cell containing a CA(42% acetyl)-coated GeIRE. Isolate BT2-4 was recovered from a fouled RO membrane operated at WaterFactor}' 21. Its ability to produce aggregates of cells has been lost due to extensivesubculturing, and thus the culture grows as a turbid cell suspension. A stationary phaseculture (60 hr) was pumped through the flow cell at 8 mL/hr. After 2 hr, MS medium wassubstituted for the bacterial culture. A series of ATR spectra collected throughout the 28-hr
64

AB
SOR
B A
NC
E
o\-
CP P-
fl> o
1-1
5 o
3.
Q
H
fO o -
to
HC
O o to o oo to o
r~n
•+*-
*»
w
°
p
pto
L*
Ji
•-•-
!_
o
oJ
L
po
pC
Ti
--J
C
O
_JU
I
>
O
o
n

IIIIIIIIIIIIII1III
experiment are shown in Figure 7.4.1. The 1547 cm"1 Amide II band intensity, indicative ofprotein, is plotted as a function of time flow in Figure 7.4.2. The onset of what was initiallybelieved to be bacterial attachment occurred 20 min after the introduction of the culture intothe flow cell. Bacterial adhesion was indicated by the rapid rise in the Amide II bandintensity after the short (20 min) delay. A cellular adhesion rate of 7.38 x 10"4 hr"1 wascalculated based on the rate of change of the Amide II band intensity. Since the wholeculture was pumped into the flow cell, the first 2 hr more than likely represent the adsorptionof bacterial cells and proteinaeous EPS dissolved in the culture. After 2 hr, when the flow ofbacterial culture was terminated, the rate dropped to 1.47 x 10"4 hr"1. No source of proteinwas introduced into the flow cell after 2 hr, only MS medium that provided a source ofnutrients for the bacteria. The IR spectrum of MS medium does not contribute to theAmide II region of the spectrum. Therefore, the rate of change in the Amide II band intensityafter T = 2 hr can be defined as the bacterial growth rate at the surface of the CA thin film.At the end of the experiment, the IRE was removed from the flow cell, the surface of the CAfilm stained with DAPI and adherent cells enumerated. Cell surface coverage was estimatedat 107 - 10s cells/cm2 after 28-hr exposure to Mycobacterium isolate BT2-4 fed with MSmedium pH 7.
The Mycobacterium culture consists of a complex mixture of whole cells, EPS andother cellular products. The 1547 cm"1 band is indicative of protein—protein that mayrepresent either EPS that was released into solution or was physically bound to the bacterialcells. Since it was not possible to distinguish between protein suspended in solution andprotein directly bound to whole cells, the protein and other dissolved components in the bulksolution phase were removed. Whole cells were centrifuged, washed twice and resuspendedin buffer. This cell suspension was then substituted for the bacterial culture and theexperiment repeated.
Mycobacterium Isolate BT2-4 Cell Suspension
A dual flow cell experiment was set up with one flow cell in the main samplecompartment of the spectrometer and the other in the right auxiliary experimental module(AEM). Each CA(42% acetyl) thin film (1 mm Ge IRE) was hydrated with deionized water(11 hr), "conditioned" with 0.5% DBSA (4 hr) and rinsed with water (4 hr). The 1009 cm'1band intensity of DBSA is plotted as a function of time of flow in Figure 7.4.3. The kineticplot of DBSA adsorption onto CA (right AEM) was similar to results previously observedwhere DBSA was exposed to a 2-mm Ge IRE coated with CA(42% acetyl). The magnitudeof the 1009 cm"1 band intensity was 2-fold greater as expected since there were twice as manyinternal reflections. Adsorption of DBSA on CA in the main bench flow cell wassignificantly different. The rate of adsorption on CA was much slower; however, the1009 cm"1 band intensity from both flow cells peaked near 12 mAU after the initial 4-hrperiod. Data beyond T - 4 hr (main bench) was not completely processed due tocomplications associated with the spectral subtractions. Changes in band shape and thepresence of anomalous bands prevented complete subtraction of the hydrated CA referencespectrum from the sample spectra. The differences in the adsorption rate observed in themain and right AEM flow cells were attributed to experimental error.
66
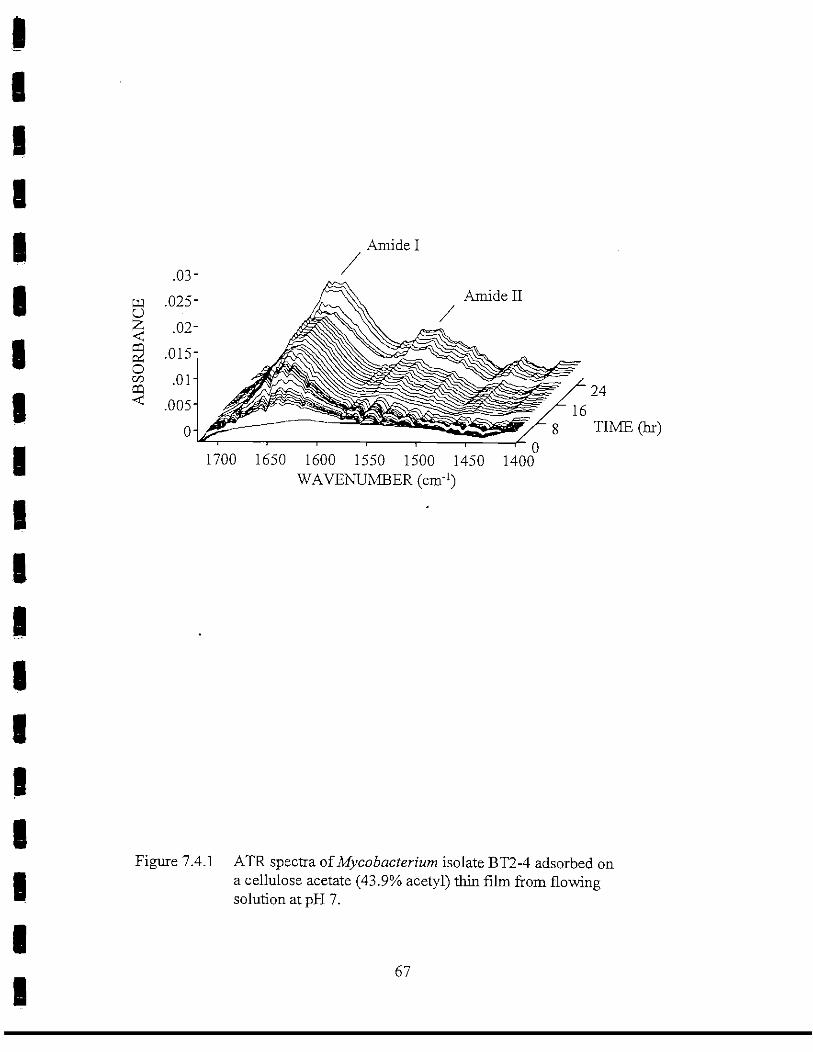
III1IIIII1IIIIIIIII
Amide I
.03iAmide II
TIME (hr)
1700 1650 1600 1550 1500 1450 1400WAVENUMBER (cm'1)
Figure 7.4.1 ATR spectra of Mycobacteriwn isolate BT2-4 adsorbed ona cellulose acetate (43.9% acetyl) thin film from flowingsolution at pH 7.
67

I
IIIIIIIIIIIIIII
O
oooffl
0 2 4 6 10 12 14 16 18 20 22 24 26 28
TIME(hr)
Figure 7.4.2 Plot of the 1547 cm"1 Amide II band intensity as functionof time of flow.
68

IIIIIIIIIIIIIIIIII
o
o&QCQ
60 120 180 240 300 360 420 480
TIME (min)
Figure 7.4.3 Plot of the 1009 cnr1 band intensity of 0.5% DBSA adsorbedon cellulose acetate (42% acetyl) thin film (• , right AEMand A ; main bench) and (* ) CA-coated Ge (2mm) IRE asfunction of time of flow.
69

IIIIIIIII1IIIIIIIII
After both CA films were preconditioned with 0.5% DBSA, a cell suspension ofMycobacterium isolate BT2-4 was pumped (8 mL/hr) into each flow cell to determine theinfluence adsorbed organics have on bacterial adhesion. The stationary phase culture washarvested by centrifugation, washed twice with MS buffer (pH 7) and resuspended in bufferto a concentration of 4.3 x 10⁸ cells/mL. The last DBSA-treated CA spectrum (T - 8 hr) wassubtracted from the sample spectra to reveal the underlying vibrational bands associated withthe adherent cells. The Amide II band intensities were normalized to the 1234 cm"1 bandintensity to take into account the differences in the CA film thickness. ATR spectra collectedover the 4-hr period are shown in Figure 7.4.4 (main bench) and in Figure 7.4.5 (right AEM).Changes in the intensity of the Amide II protein band indicate that bacterial cells adsorbedonto the DBSA-conditioned CA film. A detectable increase in the Amide II band was firstobserved at 25 min (right AEM) as compared to 180 min (main bench) (Figure 6.4.6). Theadsorption of bacterial protein on the CA film in the right AEM occurred at a greater rate.However, after approximately 4 hr, the adsorption rate of bacteria on both CA films wasvirtually identical—4.02 x 10"' hr'1 (main bench) versus 4.26 x ICr1 hr'1 (right AEM). BothCA thin films were inspected by epifluorescence microscopy. Areas of heavy bacterialcoverage were visible on both IREs, while other areas were only sparsely covered. Ingeneral, similar patterns of bacterial coverage were observed on both CA-coated IREs.
Quantisation of Bacteria Attached to Cellulose Acetate Thin Films
Our original intent was to use epifluorescence microscopy to visually quantitate thecell surface coverage and determine how adsorbed organics influence bacterial attachment inconjunction with ATR/FT-IR spectrometry. The experimental setup consisted of CA-coatedmicroscope slides in flow cells placed in series with the ATR flow cell (Figure 7.4.7).Periodically slides were removed, stained with DAPI and cell surface coverage determined asa function of time flow. Since the Research Advisory Board expressed concern thatquantitation of cell coverage was made on a surface removed from where the IR single wascollected, another method for enumerating cells was proposed. A new flow cell wasdesigned and an epifluorescence microscope built to capture images of adherent bacteria onthe CA film in the same area where the IR data was sampled. This system, simultaneousATR/FT-IR spectrometry / fluorescence microscopy, is in the process of being built (seediscussion below, Section 7.10). In the meantime., another method to make in situmeasurements of adherent bacteria was implemented. A specially designed flow cell capableof visualizing native bacteria by Nomarski differential interference contrast microscopy wasutilized. These flow cells were used in another NWRJ research project1 conducted at OCWDand were incorporated into this ATR/FT-IR project. Delays associated with the purchase ofan inverted microscope and imaging software led us to focus more on organics adsorption onCA and post-treatment of organic conditioning films with chemical surfactants. A smallamount of bacterial attachment data was collected; however, it is best presented following theorganics adsorption data (see Section 7.9).
* NWRI Final Report Project No. MRDP 669-507-95 Fouling Composition During Membrane Treatment ofSecondary Effluent: Microscale Characterization Leading to Fouling Prevention of the Pilot Scale.
70

III
.015- Amide II
iiiiiiiiiiiiii
u
o00m 12
TIME(hr)
1650 1600 1550 1500
WAVENUMBER (cnr1)
1450
Figure 7.4.4 ATR spectra of Mycobacterium isolate BT2-4 adsorbed on acellulose acetate (42% acetyl) thin film from flowing solution.CA film was pretreated with 0.5% DBSA pH 7 (main bench).
71
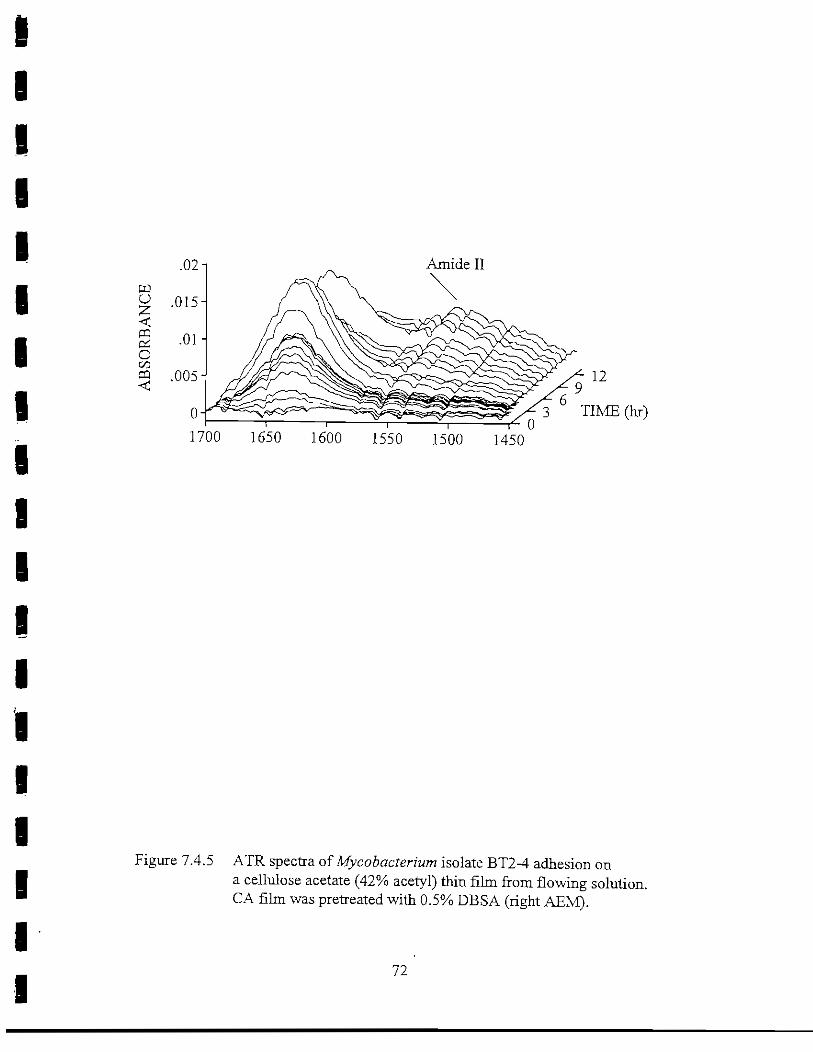
iiiiiiiiiiiiiiiiiii
Amide II
1700 1650 1600 1550 1500 1450
Figure 7.4.5 ATR spectra of Mycobacterium isolate BT2-4 adhesion ona cellulose acetate (42% acetyl) thin film from flowing solution.CA film was pretreated with 0.5% DBSA (right AEM).
72

IIIIIIIIIII
wu<z;ScdOCOCD
0 1 2 3 4 5 6 7 8 9 10 11 12 13 14
TIME (min)
IIIIIII
Figure 7.4.6 Plot of the 1549 cm'1 Amide II band intensity ofMycobacterium isolate BT2-4 adhesion on celluloseacetate (42% acetyl) film as a function of time of flow(* ) main bench and (• ) right AEM flow cell.
73

IIIIIIIIIII
Control /No Pretreatment
bacterial cellsuspension
Pretreatmentwith organics
waste waste
IIIIII1
Figure 7.4.7 Experimental setup for epifluorescence quantitation ofcell surface coverage on CA-coated coupons, (A) ATRflow cell and (B) stainless steel flow cell with CA-coatedmicroscope slides.
74

Iiiiiiiiiiiiiiiiiii
Section 7.5 Stability of CA Thin Films Cast on ZnSe IRE
After running several experiments with CA-coated Ge IREs, investigations into a newIRE material were initiated. While use of CA-coated Ge IREs was demonstrated to befeasible for studies of organics adsorption and bacterial adhesion, data generated from theseexperiments were difficult to process. Physical separation and movement of the thin filmnear the surface of the IRE necessitated the inclusion of correction factors for each data point.A thin CA film that adhered firmly to the IRE was desired. Two other IRE materials wereavailable for these studies, zinc selenide and KRS-5 (thalium-bromide-iodide). KRS-5 wasruled out because it deforms under pressure, is toxic and is easily attacked by complexingagents. ZnSe is also attacked by complexing agents. However, it is a harder material andless toxic, and was therefore selected.
The stability of a CA(42% acetyl) film was tested by pumping deionized waterthrough a flow cell containing the polymer-coated IRE. The four major CA band intensitiesdropped between 1 and 1.5% after 2 min of exposure to water (Figure 7.5.1) as compared tothe >50% drop in intensity typically observed with CA-coated Ge IREs (Figure 7.3.2 and7.3.3). In the same 2-min period, the water band intensity plateaued near 0.1 AU. The waterband intensity measured with a bare ZnSe IRE (50 x 10 x 3 mm, 45°) is typically around1.7 AU. Thus, the low water band intensity also indicated that the film remained in goodcontact with the surface of the IRE. The 1 - 2% drop in intensities of the four major CAbands was more indicative of polymer swelling that occurs upon hydration of CA. Thecarbonyl and C-O-C acetate ester bands shifted in frequency upon hydration as previouslyobserved, i.e., the carbonyl band shifted to low wavenumber and the C-O-C acetate estershifted to higher wavenumber.
Section 7.6 Adsorption of Organic Macromolecules on CA Thin Films.
Of the 12 organic macromolecules screened (on the Ge substrate), eight wereinvestigated for sorption onto thin films of CA. These compounds were the protein, albumin,the polysaccharides dextran (neutral) and alginic acid (acidic), and the "glycoprotein," gumarabic. These organic compounds served as model EPS. Four surfactants were used TritonX-100 (neutral), benzalkonium chloride (cationic), DBSA (anionic) and Zwittergent 3-16(zwitterionic). Thin films (1200 to 1500 A) of CA (42% and 43.9% acetyl) were cast on Geand ZnSe IREs. Adsorption and desorption phenomena at the aqueous-polymer interfacewere investigated.
Zwittergent 3-16 Adsorption on Cellulose Acetate (42% acetyl)
Zwittergent 3-16 and DBSA were screened early in the project. Therefore, the thinfilm consisted of CA (42% acetyl) cast on a 2 mm Ge IRE. The CA film was hydrated withdeionized water for 24 hr. A 0.5% solution of Zwittergent 3-16 was pumped through theflow cell. After 4 hr the CA was rinsed with water to the end of an 8-hr experiment The1487 cm"1 and 1468 cm"1 band intensities of the surfactant are plotted as a function of time offlow in Figure 7.6.1. The surfactant sorbed throughout the initial 4-hr period and remained
75

IIIIIIIIIIIIIIIIIII
oGOPQ
1.40
Figure 7.5.1 Plots of the (• ) 1749, (* ) 1369, (• ) 1230 and (* ) 1049 cm'1band intensities of (A) cellulose acetate (43.9% acetyl) and(B) the 1639 cm"1 water band intensity as a function of timeof flow.
76
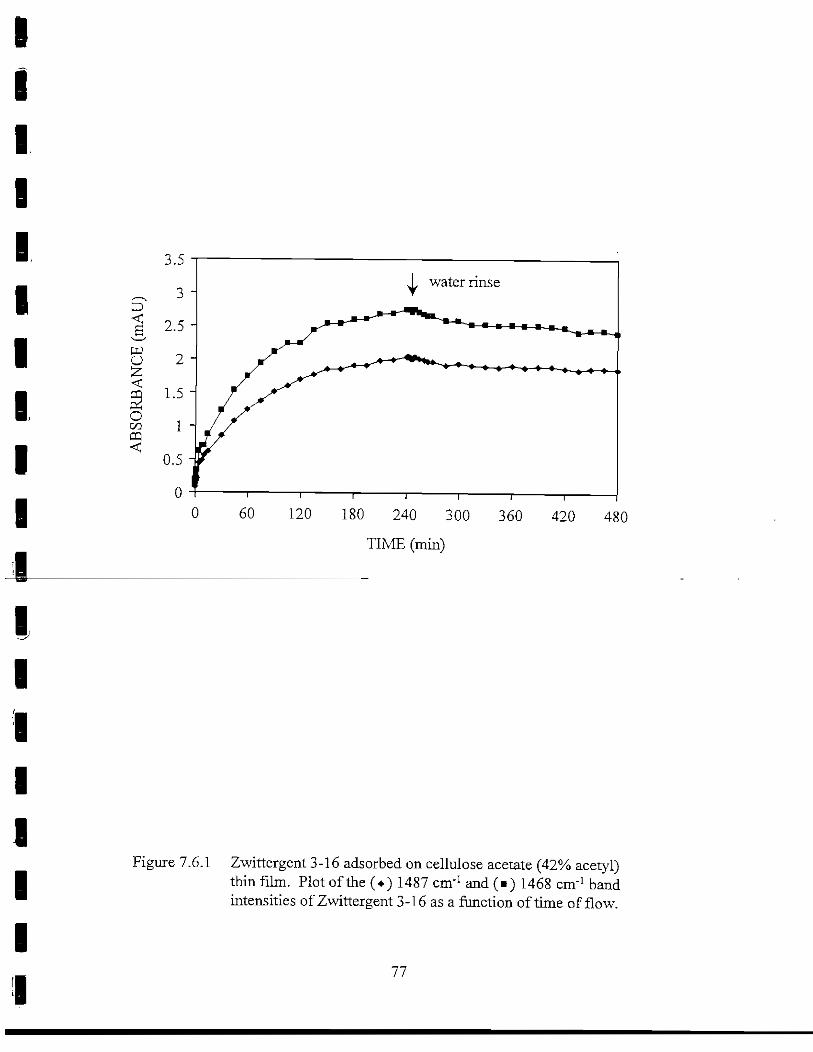
Iiiiiiiiii
liiiiiii
0 60 120 180 240 300 360 420 480
TIME (min)
Figure 7.6.1 Zwittergent 3-16 adsorbed on cellulose acetate (42% acetyl)thin film. Plot of the (*) 1487 cm'1 and (•) 1468 cm'1 bandintensities of Zwittergent 3-16 as a function of time of flow.
77

IIIIIIIIIIIIIIIIIII
firmly adsorbed to the polymer film. A desorption rate of-0.82 x 10"3 min"1 was calculated,and a layer of Zwittergent 3-16 approximately 23 A thick was left adsorbed to the CA.
Triton X-100 Adsorption on Cellulose Acetate (43.9% acetyl)
Two CA(43.9% acetyl) films were hydrated with deionized water for 1 hr prior toexposure to Triton X-100. A 0.5% solution was pumped through flow cells containing theCA-coated ZnSe IRE. After 4 hr3 MS buffer was pumped through to the end of an 8-hrexperiment. Plots of the 1512 cm"1 band intensity as a function of time of flow are shown inFigure 7.6.2. Data were normalized to take into account the differences in polymer filmthickness. Triton X-l 00 slowly accumulated at the surface of the CA films over the initial4-hr period. Adsorption was similar on both CA films. However, slightly more TritonX-l 00 adsorbed on the thin film in the right AEM flow cell as compared to the CA film inthe main bench flow cell. Desorption of the surfactant from the CA was much greater in theright AEM flow cell. Desorption of firmly bound material (between T = 300 and 480 min)occurred at a rate of-24.3 x 10"3 min"1 (right AEM) as compared to -11.8 x 10"3 min"1 (mainbench). The thickness left on the CA surface varied from 24 A (right AEM) to 36 A (mainbench) with an average thickness of 30 A. The differences were attributed to experimentalerror.
Dodecylbenzenesulfonic Acid Adsorption on Cellulose Acetate
Our primary interest was directed toward DBSA, as it is periodically applied to cleanthe CA reverse osmosis membranes at Water Factory 21. Studies in our lab have revealedthat it is very effective at removing Mycobacterium sp. attached to CA thin films.42 InitiallyDBSA was run at 0.5% on a CA(42% acetyl)-coated Ge IRE. Later the concentration wasdropped to 0.1% to match the concentration used in our fouling composition studies, andadsorption on CA(43.9% acetyl) was investigated.
0.5% DBSA Adsorption on CA(42% acetyl)-Coated Ge IRE. A 0.5% aqueoussolution of DBSA was pumped through a flow cell containing a CA-coated Ge IRE that washydrated with deionized water (pH 7). After 4 hr the polymer film was rinsed with water tothe end of an 8-hr experiment. A plot of the 1009 cm"1 band intensity as a function of time offlow is shown in Figure 7.6.3. Adsorption of DBSA on CA neared a plateau by the end of4 hr. DBSA desorbed from the surface of the cellulose acetate film throughout the rinseperiod. A desorption rate constant of-4.1 x 10'3 min"1 was calculated for firmly boundDBSA, and a film thickness of 8.6 A remained after the rinse.
0.1% DBSA Adsorption on CA(43.9% acetyl)-coated ZnSe IRE. Later, theDBSA concentration was dropped to 0.1%, and adsorption on a CA(43.9% acetyl)-coatedZnSe IRE was investigated. Two flow cells were run simultaneously. Plots of the 1180 cm"1
and 1009 cm"1 band intensities as a function of time flow are displayed in Figure 7.6.4. Forclarity, the intensities of the 1138 cm'1 were plotted separately. The data were normalized tothe 1369 cm"1 band of CA to take into account the difference in the thickness between the twothin films. Data points connected by a line represent the average value from the two trials atthat given time. Initially adsorption on CA was rapid. After approximately 20 min, the rateof adsorption tapered off; however, DBSA adsorption did not plateau before the end of the
78

III1Iiiiiiiiiiiiiii
a
o00CQ<C
120 180 240 300
TIME (min)
360 420 480
Figure 7.6.2 Triton X-100 adsorbed on cellulose acetate (43.9% acetyl)thin film. Plots of the 1512 cm"1 band intensity as a functionof time of flow (*) main bench and (•) right AEM.
79

I1I11III1II1I1Iiiii
<:£o
oCOffl
60 120 180 240 300 360 420 480
TIME (min)
Figure 7.6.3 DSBA adsorbed on cellulose acetate (42% acetyl) thinfilm. Plot of the 1009 cm"1 band intensity as a functionof time of flow.
80

IIIIIII1Iiiiiiiiiii
o00PD
2018 -
16 -14
12108
64
2 10
16 -
14 -
12 -
10 -
8 -
6 -
4 i
2 -
0
Figure 7.6.4
MS buffer rinse A
Y MS buffer rinseB
0 60 120 180 240 300 360 420 480
TIME(min)
DBSA adsorbed on cellulose acetate (43.9% acetyl) thin film.Plots of the average (A) (n) 1180 cm'1 and (*) 1009 cm'1 bandintensities and (B) 1138 cm"1 band intensity as a functionof time of flow. Data points connected by line represent theaverage value from the two trials at the given time.
81
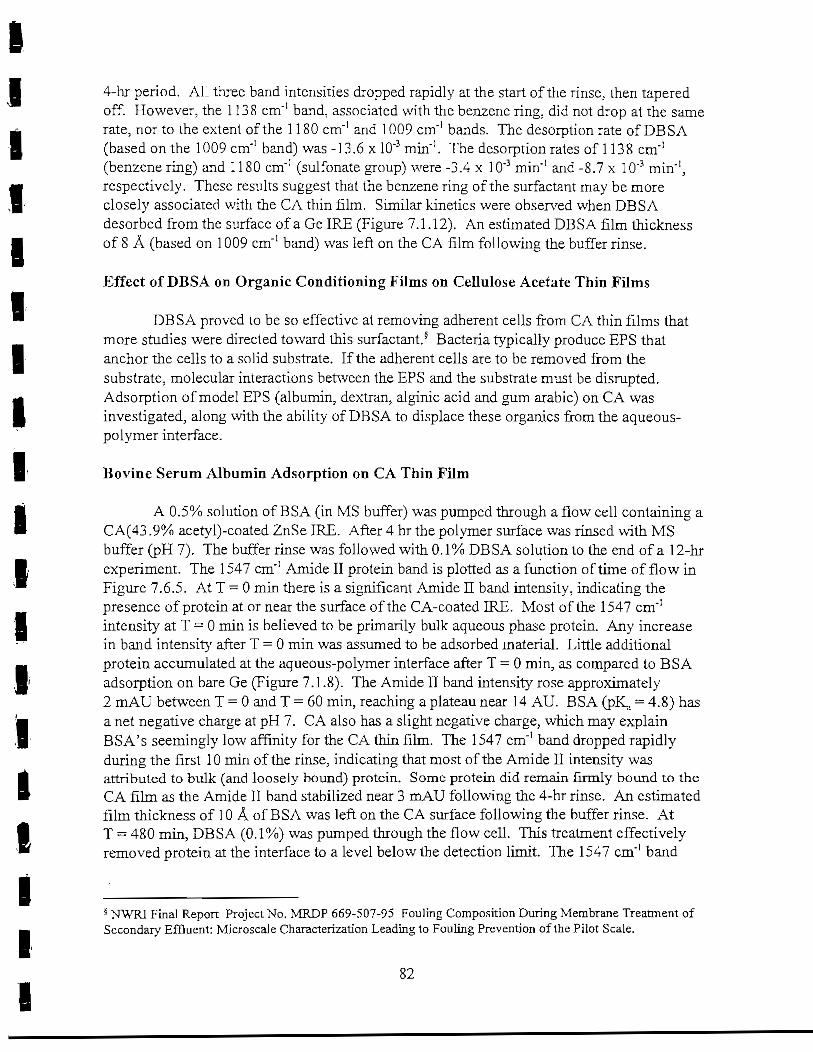
IIitiiiIiiiiiiiiiii
4-hr period. All three band intensities dropped rapidly at the start of the rinse, then taperedoff. However, the 1138 cm"1 band, associated with the benzene ring, did not drop at the samerate, nor to the extent of the 1180 cm"' and 1009 cm"1 bands. The desorption rate of DBSA(based on the 1009 cm"1 band) was -13.6 x 10"3 min"'. The desorption rates of 1138 cm"1
(benzene ring) and 1180 cm"' (sulfonate group) were -3.4 x 10"3 min"1 and -8.7 x 10"3 min"'3respectively. These results suggest that the benzene ring of the surfactant may be moreclosely associated with the CA thin film. Similar kinetics were observed when DBSAdesorbed from the surface of a Ge IRE (Figure 7.1.12). An estimated DBSA film thicknessof 8 A (based on 1009 cm"1 band) was left on the CA film following the buffer rinse.
Effect of DBSA on Organic Conditioning Films on Cellulose Acetate Thin Films
DBSA proved to be so effective at removing adherent cells from CA thin films thatmore studies were directed toward this surfactant.s Bacteria typically produce EPS thatanchor the cells to a solid substrate. If the adherent cells are to be removed from thesubstrate, molecular interactions between the EPS and the substrate must be disrupted.Adsorption of model EPS (albumin, dextran, alginic acid and gum arable) on CA wasinvestigated, along with the ability of DBSA to displace these organics from the aqueous-polymer interface.
Bovine Serum Albumin Adsorption on CA Thin Film
A 0.5% solution of BSA (in MS buffer) was pumped through a flow cell containing aCA(43.9% acetyl)-coated ZnSe IRE. After 4 hr the polymer surface was rinsed with MSbuffer (pH 7). The buffer rinse was followed with 0.1% DBSA solution to the end of a 12-hrexperiment. The 1547 cm'1 Amide II protein band is plotted as a function of time of flow inFigure 7.6.5. At T - 0 min there is a significant Amide II band intensity, indicating thepresence of protein at or near the surface of the CA-coated IRE. Most of the 1547 cm"1
intensity at T = 0 min is believed to be primarily bulk aqueous phase protein. Any increasein band intensity after T = 0 min was assumed to be adsorbed material. Little additionalprotein accumulated at the aqueous-polymer interface after T = 0 min, as compared to BSAadsorption on bare Ge (Figure 7.1.8). The Amide II band intensity rose approximately2 mAU between T = 0 and T = 60 min, reaching a plateau near 14 AU. BSA (pK^ = 4.8) hasa net negative charge at pH 7. CA also has a slight negative charge, which may explainBSA's seemingly low affinity for the CA thin film. The 1547 cm"1 band dropped rapidlyduring the first 10 min of the rinse, indicating that most of the Amide II intensity wasattributed to bulk (and loosely bound) protein. Some protein did remain firmly bound to theCA film as the Amide II band stabilized near 3 mAU following the 4-hr rinse. An estimatedfilm thickness of 10 A of BSA was left on the CA surface following the buffer rinse. AtT - 480 min, DBSA (0.1%) was pumped through the flow cell. This treatment effectivelyremoved protein at the interface to a level below the detection limit. The 1547 cm"1 band
5 NWRI Final Report Project No. MRDP 669-507-95 Fouling Composition During Membrane Treatment ofSecondary Effluent: Microscale Characterization Leading to Fouling Prevention of the Pilot Scale.
82

II1IIIIIII1IIIiliii
CDU
O00CQ
20
18 -
16 -14 -
12 J
10 -
8 -6 -4 .
2 -
0 --2
0
MS buffer rinse
0.1%DBSA addition
I
120 240 360 480 600
TIME (min)
720
Figure 7.6.5 Albumin adsorbed on cellulose acetate (43.9% acetyl)thin film. Plots of the (•) 1547 cm'1 and (A ) 1009 cm'1band intensities as a function of time of flow.
83

I1I11II1I1IIIIiitia
intensity essentially dropped to zero absorbance (Figure 7.6.5) between T — 480 - 720 min.The pump speed was not altered during the switch from buffer rinse to surfactant addition.
Dextran Adsorption on CA Thin Film
A 0.5% dextran solution was pumped through a flow cell containing a CA(43.9%acetyl)-coated ZnSe IRE. The polysaccharide slowly accumulated at the aqueous-polymerinterface, as evidenced by the rise in the 1159 cm"1 band intensity with time of flow(Figure 7.6,6). During the buffer rinse, dextran desorbed slowly from the interface at a rateof-12.6 x 10"3 min"1. The film thickness was estimated at 29 A. After the 4-hr rinse, a 0.1%DBS A solution was pumped through the flow cell. The presence of overlapping DBS A anddextran bands made polysaccharide desorption difficult to monitor during DBSA addition(T = 480 - 720 min). In spite of the correction made for overlapping dextran and DBSAbands, the 1159 cm"] band intensity was still offset at the start of the DBSA rinse. However,there did appear to be a rapid displacement of dextran from the interface at the start of DBSAaddition (T = 480 min). After 45 min, the desorption rate of dextran dropped to-6.1 x 10"3 min"', half the rate observed during the buffer rinse. Some dextran still remainedadsorbed to the CA film following the 4-hr exposure to DBSA. The film thickness wasestimated at 22 A.
Alginic Acid Adsorption on CA Thin Film
A 0.5% alginic acid solution was pumped through a flow cell containing aCA(43.9% acetyl)-coated ZnSe IRE. At T - 0 min, a 1416 cm'1 (COO"symmetric stretching)intensity of 6.1 mAU was measured, which represented primarily bulk phase alginic acid.Between T = 0 min and T ~ 30 min, the 1416 cm"1 band rose slowly, indicating someaccumulation of alginic acid at the aqueous-polymer interface (Figures 7.6.7). BetweenT = 30 min and T = 4 hr, the rate of adsorption dropped off significantly. When the IRE wasrinsed with buffer, this band dropped rapidly (i.e., bulk solution phase algin was washed fromthe flow cell). However, the 1416 cm"1 band did stabilize near 2.5 mAU, indicating that somepolysaccharide remained firmly bound to the CA film. The film thickness was estimated at13A. When DBSA was pumped into the flow cell, algin was displaced from the polymersurface, as indicated by the immediate drop in the 1416 cm'1 band intensity. Less DBSAappeared to adsorb on the algin-pretreated CA film, as the 1009 cm"1 DBSA band plateauednear 6.5 mAU, as compared to 9 mAU when adsorbed on an untreated CA thin film. A smallamount of alginic acid was left bound at the interface and was estimated at 3 A thick.
Gum Arabic Adsorption on CA Thin Film
Gum arable (GA) is an acidic polysaccharide with a closely associated proteincomponent. This plant polysaccharide served as our glycoprotein, although it may not beconsidered a true glycoprotein. A 0.5% gum arabic solution was pumped through a flow cellcontaining a CA(43.9% acetyl)-coated ZnSe IRE. The 1080 cm"1 C-O stretching bandintensity of the carbohydrate component increased rapidly at the start of the experiment,
84

11IIII1II1IIIIIIII
D
u
oooCQ
120 240 360 480
TIME (min)
600 720
Figure 7.6.6 Dextran adsorbed on cellulose acetate (43.9% acetyl)thin film. Plots of the (*) 1159 cm'1, (•) 1159 cm'1"corrected" band intensities of dextran and (A ) 1009 cm"1
band intensity of DBS A as a function of time of flow.
85
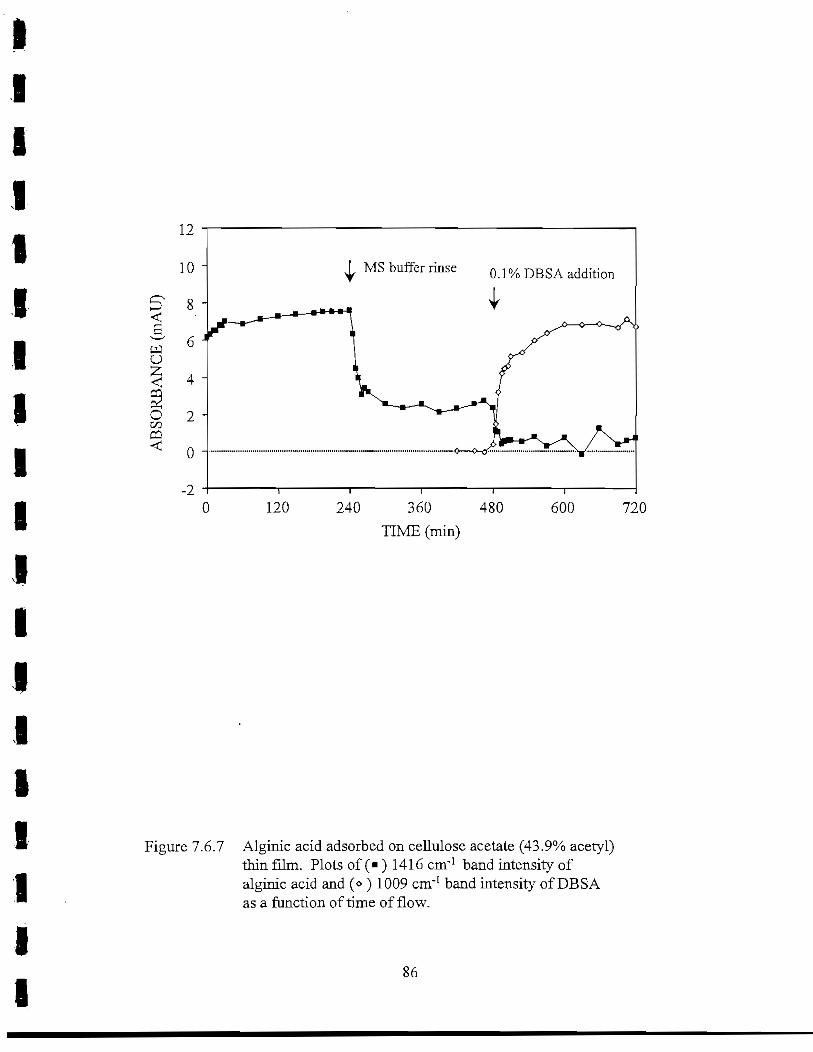
IIIIIII1IIIIIIIIII1
12
10 -
-2
| MS buffer rinse QM DBgA addition
I
120 240 360 480
TIME (min)
600 720
Figure 7.6.7 Alginic acid adsorbed on cellulose acetate (43.9% acetyl)thin film. Plots of (•) 1416 cm"1 band intensity ofalginic acid and (« ) 1009 cm"' band intensity of DBSAas a function of time of flow.
86

IIIIIIIIIIaiIiiitia
reaching a maximum near 13 mAU after 30 min (Figure 7.6.8). At the same time, proteinadsorbed rapidly at the interface, as indicated by the increase in the 1547 cm"1 Amide II bandintensity. After 30 min, the rate of protein adsorption dropped but continued to adsorbthroughout the 4-hr period, while the 1080 cm"1 band associated with the polysaccharideappeared to drop slightly with time. These results suggest that protein slowly displacedpolysaccharide at the aqueous-polymer interface. Both the polysaccharide and the proteincomponents desorbed during the buffer rinse but were not completely removed. The filmthickness of the polysaccharide component was estimated at 18 A, and the film thickness ofthe protein component was estimated at 19 A. The 1080 cm"1 band actually increased duringthe rinse, between T = 330 min and T = 390 min. However, this increase was attributed todifficulties with the spectral subtractions. DBSA (0.1%) was pumped through the flow cell,and both polysaccharide and protein were rapidly displaced from the CA film. The Amide IIband intensity dropped below the detection limit. The polysaccharide component was moredifficult to monitor, as the C-0 stretching bands of GA overlapped those of CA and DBSA.The 1080 cm'1 band dropped 50% during the first 30 min of the rinse. In the last 30 min ofthe rinse, the C-O stretching band dropped to an intensity near zero absorbance. At the sametime, the 1009 cm"1 band intensity of DBSA rose rapidly, then the rate of increase dropped(Figure 7.6.8). DBSA adsorption did not plateau before the end of the 4-hr period. A secondand final MS buffer rinse was included in this experiment. DBSA desorbed from the CAfilm, dropping from 8.5 mAU to 3 mAU (T = 780 min), where it remained to the end of theexperiment (T = 960 min).
Benzalkonium Chloride Adsorption on CA Thin Film
A 0.5% solution of benzalkonium chloride (BnzCl) was pumped through a flow cellcontaining a CA(43.9% acetyl)-coated ZnSe IRE. Plots of the 1485 cm"1 band intensity ofBnzCl, representing adsorption and desorption on CA, are shown in Figure 7.6.9. BnzCladsorbed on the CA film but did not reach a plateau by the end of the first period. During thebuffer rinse, BnzCl slowly desorbed from the interface. The film thickness was estimated at46 A. A 0.1% DBSA solution was pumped through the flow cell at T - 480 min. DBSAabsorption bands overlap the region of the spectrum used to monitor BnzCl. Therefore, itwas necessary to correct for DBSA's contribution to the BnzCl-DBSA spectrum. Taking intoaccount these overlapping bands, BnzCl desorption continued at a constant rate independentof the presence of DBSA (Figure 7.6.9).
The 1009 cm'1 band of DBSA did not reach a pleateau after 4 hr. At T = 720 min afinal buffer rinse was applied. The adsorbed BnzCl was unaffected by the final rinse, whilethe 1009 cm"1 band intensity of DBSA dropped (43%) from 11.7 mAU to 6.41 mAU after4 hr. More DBSA appeared to remain firmly adsorbed on the BnzCl-pretreated CA film ascompared with gum arabic-pretreated CA films (see Figure 7.6.7). In this case, electrostaticforces between positively charged BnzCl and negatively charged DBSA likely played a rolein enhancing adsorption. The DBSA left adsorbed on the CA film was estimated at 36 A.
87
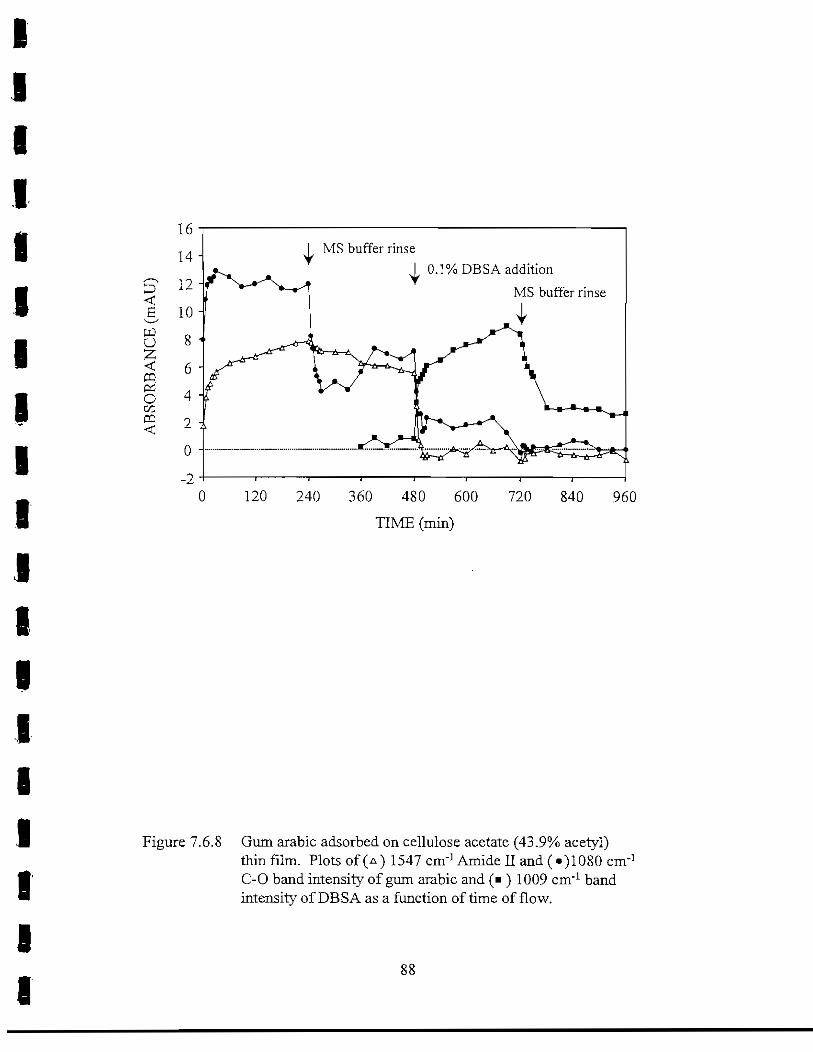
IIIIIIIIII1II1IIIII
I MS buffer rinse
I 0.1% DBSA addition
MS buffer rinse
I
0 120 240 360 480 600 720 840 960
TIME (min)
Figure 7.6.8 Gum arabic adsorbed on cellulose acetate (43.9% acetyl)thin film. Plots of (A) 1547 cm-'Amide II and (•)1080 cm'1C-O band intensity of gum arabic and (• ) 1009 cm"1 bandintensity of DBSA as a function of time of flow.

IIII
IIIIIIIIIItII
120 240 360 480 600
TIME (min)
720 840 960
Figure 7.6.9 Benzalkonium chloride adsorbed on cellulose acetate(43.9% acetyl) thin film. Plots of (+) 1485 cm'1 and(D ) 1485 cm"1 'corrected' band intensities ofbenzalkonium chloride and (• ) 1009 cm"1 band intensityof DBSA as a function of time of flow.
89

IIIIII1III1IIIIIfII
Summary and Discussion
Estimates of the thickness of the organic layer that remained after the buffer rinse areshown in Table 7.6.1. This material was defined as "firmly bound." Adhesion ofmacromolecules can occur by a number of chemical interactions including electrostatic,hydrophobic, dipole-dipole, Van der Waals and hydrogen bonding. In this limited study withthe eight organic compounds (albumin, dextran, alginic acid, gum arabic, dodecyl-benzenesulfonic acid, Triton X-100 and benzalkonium chloride), electrostatic interactionsappeared to be a major factor in determining macromolecular adsorption on cellulose acetatethin films. This is especially evident when comparing adsorption of Zwittergent 3-16 andTriton X-100 on films of CA. Once adsorbed, the charged surfactant remained firmly bound,while much of the Triton X-100 was washed from the aqueous-polymer interface.
Table 7.6.1
Film Thickness of Organic MacromoleculesAdsorbed On Cellulose Acetate (43.9% acetyl) Thin Film
Organic Compound
Triton X-100
Benzalkonium Chloride
Dextran
Zwittergent 3-16a
Gum Arabic(protein component)Gum Arabic(polysaccharidecomponent)Alginic Acid
Bovine Serum Albumin
DBSA
Properties
nonionic surfactant
cationic surfactant
neutral polysaccharide
zwitterionic surfactant
polysaccharide(w/ protein)
polysaccharide(w/ protein)
acidic polysaccharide
acidic protein, pKa = 4.8
anionic surfactant
FilmThickness
After BufferRinse
(A)50
46
29
23
19
18
13
10
8
Film ThicknessAfter
0.1% DBSARinse
(A)NA
36
22
NA
ND
ND
3
ND
NA
a Adsorption on CA(42% acetyl) thin film cast on Ge IRE.ND—Not detectedNA—Not applicable
90

I1IIIIIIIIIIIIIIIII
Of the eight organic compounds tested, Triton X-100 appeared to adsorb to thegreatest extent based on the film thickness. However, the 1512 cm"1 band intensity from thetwo trials differed greatly following the buffer rinse despite the fact the two films were castfrom the same CA solution. Therefore, no strong conclusions were drawn at this time.
Benzalkonium chloride, a cationic quaternary amine, adsorbed to a very high extenton cellulose acetate (43.9% acetyl), presumably binding primarily by attractive electrostaticforces. Asymmetric cellulose acetate used in the manufacture of RO membranes has areported pKa near 3.5 and thus is negatively charged at pH 7.43-d4-45 Similar desorption rateswere recorded during the MS buffer rinse and during 0.1% DBSA treatment, indicating thatthe anionic surfactant did not affect benzalkonium chloride desorption from the CA film(Figure 7.6.9). Thus, a large quantity of material remained adsorbed on the CA surface.
The formation of "hemimicelles" at the aqueous-polymer interface may account forthe high quantity or firm binding of benzalkonium chloride (and Zwittergent 3-16, seediscussion below) on the CA film. The concept of hemimicelles was initially proposed byGaudin and Fuerstenau.46 More recently, Childress and Elimelech proposed that dodecylrri-memylammonium bromide forms hemimicelles on negatively charged polymericmembranes.43 Carboxylate groups in cellulose acetate impart a slight negative charge topolymer. Therefore, the quaternary amine can sorb to the surface by electrostaticinteractions, leaving the hydrocarbon tail exposed to the bulk aqueous phase. The bilayer oraggregates form when the aliphatic tail of free surfactant molecules interact with those of theadsorbed layer, thereby minimizing their exposure to the aqueous phase and reducing the freeenergy of the system (Figure 7.6.10). Benzalkonium chloride, amixture of C12, C14 and C]6
substituted quaternary amines, is approximately 24 A in length. The thickness of theadsorbed benzalkonium chloride hemimicelle layer was 46 A, about twice the thickness, orlength, of the molecule. These hemimicelle structures did not form on bare germanium atpH 7 as the adsorbed film was only 6 A thick.
More DBSA was retained at the CA surface in the presence of an adsorbed film ofbenzalkonium chloride (see Figures 7.6.4 and 7.6.9). (A final MS buffer rinse was onlyapplied to experiments with gum arabic and benzalkonium chloride.) Electrostatic forcesbetween the positively charged quaternary amine adsorbed on the membrane and thenegatively charged sulfonate group likely affect DBSA adsorption.
A large quantity of the neutral polysaccharide dextran also remained firmly bound tothe CA film following the buffer rinse. Hydrogen bonding and dipole-dipole interactionspresumably contribute to the binding of dextran to the polymer film. DBSA was lesseffective at removing the neutral polysaccharide as compared to BSA, alginic acid and gumarabic (polysaccharide and protein components). After correcting for overlapping vibrationalbands from DBSA, dextran initially appeared to desorb rapidly upon exposure to thesurfactant (Figure 7.6.6). However, after 30 min, dextran desorption tapered off to half therate observed during the MS buffer rinse. The DBSA treatment removed approximately 33%of the polymer material that remained after the buffer rinse. However, a significant quantityof dextran still remained adsorbed to the CA film.
Significantly lower quantities of the negatively charged organic macromoleculesalginic acid, albumin and DBSA remained adsorbed to the CA films as compared to dextran
91

I1IIIIIIIIIIIiiiiii
CH,
CH,H,C A
'N\
HC
CH,
CH
H,CCH,
H,C\,
\C
.CH,
.CH,
H,C
H,C\C
CH,
,CH,
CH,
\C.CH, ,CH,
\C,CH,
H,C
H,C<,.CH,
\
\,
\,
H-,C
CH,\C
H,C.CH,
.CH,\7C
H,C.CH
\C
\ CH2
\,
CH \, \CCH, \C
\, H,CCH, \7C
CH, \C
V CH3
CH3
\C
CH,
\
A-H2C,
\'°~ I O
Figure 7.6.10 Diagram of benzalkonium chloride (C14) hemirnicelle formedon the surface of cellulose acetate.
92

IIIIIIIIIIIIIIIIIII
and benzalkonium chloride (Table 7.6.1). At low ionic strength (p. ~ 0.05, MS buffer),charge screening of the double layer is less pronounced. Therefore, electrostatic repulsionbetween these organics and the membrane surface is greater, presumably leading to lessadsorption and retention of these organics on the CA surface following the buffer rinse.43
Albumin and alginic acid that remained adsorbed on the CA thin film after the MS bufferrinse were rapidly removed upon exposure to 0.1% DBSA (see Table 7.6.1). Protein andpolysaccharide are the most prominent components identified in ATR infrared spectra ofadsorbed bacterial cells.24'25'28'47 Application of DBSA to adherent Mycobacterium cellsresulted in rapid detachment from the surface of a thin film of cellulose acetate.42 DBSA'seffect on adsorbed protein and polysaccharide may account for the desorption or detachmentof bacteria from the aqueous-polymer interface. Specifically how the surfactant acts on thesemacromolecules to cause desorption is not well understood. DBSA may bind to the adsorbedproteins and polysaccharides and reduce the surface tension at the interface, causing themacromolecules to desorb from the surface.
Gum arabic adsorption fell in between the cationic and anionic macromolecules. Thepolysaccharide contains the acidic sugar, glucuronic acid; however, the composition of theprotein component associated with it is not known. Thus, the net charge on gum arabic atpH 7 is unknown. The polysaccharide component of gum arabic was more difficult toremove from the CA surface. The protein component was stripped off immediately, whilethe polysaccharide was only partially removed when DBSA was first applied. Completeremoval of the adsorbed polysaccharide occurred during the last 30 min of the DBSAaddition.
DBSA demonstrated an innate ability to remove proteins and polysaccharidesadsorbed to thin films of cellulose acetate (43.9% acetyl). Disruption of the chemicalinteractions between adsorbed organic macromolecules and the polymer surface are key tothe development of more effective methods for cleaning membrane surfaces. A betterunderstanding of how these compounds interact and affect desorption is of great interest.Work in the future will continue to be directed toward understanding how surfactants, likeDBSA, and other chemicals affect macromolecular interactions at the aqueous-polymerinterface.
Section 7.7 Adsorption of Natural Organic Material (NOM) from Reverse OsmosisFeedwater on Ge and Cellulose Acetate Thin Film
Bare Ge and CA-coated ZnSe IREs were exposed to feedwater (Q-22A) to the reverseosmosis elements at Water Factory 21 in Fountain Valley, CA. The feedwater consisted ofsecondary treated wastewater that had undergone flocculation with lime and an anionicsurfactant, recarbonation with C02, multimedia sand filtration and chlorination (3-4 ppm).The feedwater was filtered at 0.22 u,m to remove microorganisms and then analyzed by theMain Laboratory at OCWD. The results of this analysis are shown in Table 7.7.1.
93

IIIIIIIIiiiiiiiiiii
NOM Adsorption from RO Feedwater on Ge IRE
Initially, feed water was pumped through two flow cells containing Ge IREs. Thewater was not recirculated. After 21 hr, the Ge surface was rinsed by pumping deionizedwater through the flow cells to the end of a 36-hr experiment. Material believed to be
Table 7.7.1
Chemical Analysis ofReverse Osmosis Feedwater (Q-22A)
Chemical AssayTotal Organic Carbon (TOC)Total Dissolved Solids (TDS)Total AlkalinityPH
Concentration8.1 mg/L956 mg/L20.3 mg/L
6.8
associated with protein (1550 cm"1 and 1557 cm"1) and carbohydrate (1101 cm"1 and1022 cm"1) were detected at the surface of the IRE. These vibrational bands are plotted as afunction of time of flow (Figures 7.7.1A and 7.7.IB, main bench) and (Figures 7.7.2A and7.7.2B, right AEM). The IR spectra were dominated by vibrational bands associated withplasticizers or monomers from the BUNA O-rings (Figure 7.7.IB and Figure 7.7.2B).Organic material associated with the O-rings continued to adsorb at the Ge interfacethroughout the water rinse, although the rate of adsorption dropped slightly. Absorptionbands near 1502, 1377, and 1240 cm"1 were related to compounds leaching from the O-rings.Vibrational bands near 1557 cm"1 and 1550 cm"1, and 1101 cm"1 and 1022 cm"1 also droppedin intensity when the water rinse was initiated. The material believed to be carbohydratedesorbed rapidly from the surface of the IRE, and the two band intensities dropped to nearzero absorbance. The protein material desorbed at a much slower rate and remained bound tothe Ge surface after the 15-hr rinse.
NOM Adsorption from RO Feedwater on Cellulose Acetate Thin Film
After the problem with leaching plasticizers was resolved, the experiment wasrepeated with a CA(43.9% acetyl)-coated ZnSe IRE installed in the flow cell. Feedwater waspumped through the flow cell for 24 hr. No absorption bands indicative of organic materialat the aqueous-polymer interface were detected. Two possible reasons for the inability todetect organics at the CA interface include (1) insufficient contact time and (2) insufficientsensitivity of the ATR/FT-IR spectrometry methodology (see discussion below).
94

IIIIIIIIIIII1IIIII
12 18 24 30 36
TIME(hr)
Figure 7.7.1 Reverse osmosis feedwater (Q-22A) adsorbed on Ge IRE.Plots of the (A) (+) 1550 cm'1 and (x) 1101 cm'1, and (B)(•) 1502, (A ) 1377 and (x ) 1120 cm'1 band intensities as afunction of time of flow (main bench).
95

IIIIIII1IIIII1IIIII
£wo
o03CQ
12 18 24 30 36
TIME(hr)
Figure 7.7.2 Reverse osmosis feedwater (Q-22A) adsorbed on Ge IRE.Plots of the (A) O) 1557 cm'1 and (x) 1022 cm'1, and (B)(•) 1502, (A) 1377 and (x) 1122 cm'1 band intensities as afunction of time of flow (right AEM).
96

IIIIIII1IIIIIIIII1I
Section 7.8 Adsorption of Natural Organic Material from Colored Well Water onGermanium and Cellulose Acetate Thin Film
NOM Adsorption from Colored Well Water on Germanium
Colored water was collected from Deep Well No. 1 (-780 - 880 ft}, located at OCWDin Fountain Valley, CA. Initially, unfiltered colored water was pumped through two flowcells, each containing a bare Ge IRE. After 24 hr of flow, the surface was rinsed withdeionized water pH 8. Plots of the major absorption bands from adsorbed macrpmoleculesare shown in Figure 7.8.1. Again, the major absorption bands in the IR spectra wereassociated with plasticizers that leached from the 0-rings. These bands included 1500, 1378,1242, and 1142 cm"1. The 1500 cm"1 and 1378 cm"1 bands dropped at the start of the rinse butlater increased in intensity throughout the remainder of the rinse period (see Figure 7.8.1).No vibrational bands were definitively linked to organic material associated with the coloredwater.
NOM Adsorption from Colored Well Water on Cellulose Acetate Thin Film
After eliminating the problem associated with 0-ring plasticizers, the experiment wasrepeated. The colored water was filtered at 0.22 Jim to remove microorganisms and thenpumped through a flow cell containing a CA(43.9% acetyl)-coated ZnSe IRE. The filteredwell water was analyzed by the Main Laboratory at OCWD. The results are shown inTable 7.8.1.
Table 7.8.1
Chemical Analysis ofDeep Well No. 1 WaterFountain Valley, CA
Chemical Assay ConcentrationTotal Organic Carbon (TOC) 2.4 mg/LTotal Dissolved Solids (TDS) 228 mg/LTotal Alkalinity 15 6 mg/LColor Units 60pH 8.6
After 7 days exposure to the filtered well water, the experiment was terminated. Aspectrum collected on Day 1 was digitally subtracted from a spectrum collected on Day 7. Itis evident by the derivative band shape (i.e., the low wavenumber side of the band dips belowzero) that the carbonyl band shifted to higher frequency upon exposure to the colored water(Figure 7.8.2). At the same time, the C-O-C acetate ester band intensity shifted to lower
97
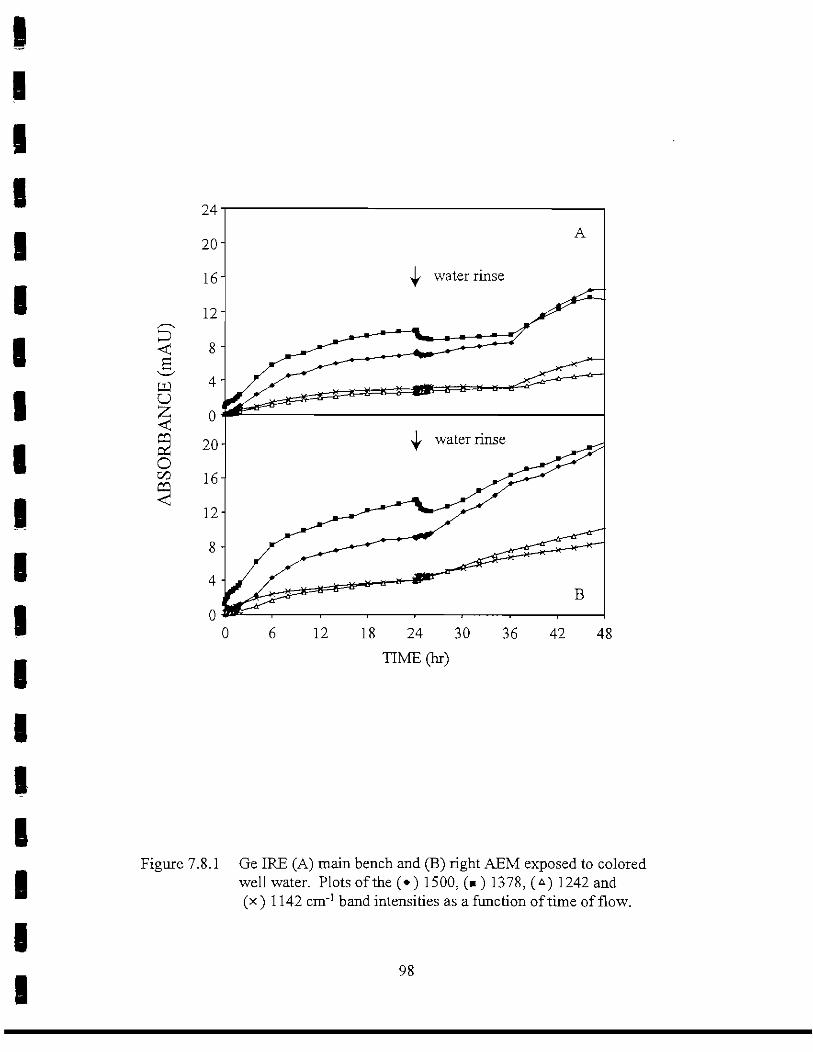
IIIIIIIIIIIIIIIIII
<
o
24
20
16
12
A
X water rinse
6 12 18 24 30
TIME(hr)
36 42 48
Figure 7.8.1 Ge IRE (A) main bench and (B) right AEM exposed to coloredwell water. Plots of the (») 1500, (• ) 1378, (A) 1242 and(x) 1142 cm"1 band intensities as a function of time of flow.
98

IIIIIIIIIIIIIIIIIII
oCO
23
.24 H
.2 -
.16 -
O .12-
-.04-
2000 1800 1600 1400 1200
WAVENUMBER (cnr1)
Figure 7.8.2 Spectra of organic material adsorbed on cellulose acetate(43.9% acetyl) thin film from flowing colored well water(A) 7 days (B) 1 day and (C) difference spectrum.
99

IIIIIIIIIIIIIII1III
frequency, as this band was also derivative in shape. These shifts are opposite to thoseobserved when the CA was hydrated (Figure 7.8.3). The shifts resulting from exposure tocolored water suggest adsorption of material on the CA thin film and loss of the hydrogenbonding. In other words, material adsorbed on the CA film and displaced water from thesurface, resulting in the loss of hydrogen bonding. Preliminary results suggest a compoundwith both aliphatic and aromatic structure (Figure 7.8.4).
Bubble contact angle measurements were made to determine changes in surfacehydrophobicity. The height-to-diameter (H:D) ratio was measured for air bubbles capturedunder the sample substrate. These H:D measurements indicated a slight decrease in thesurface hydrophobicity of the CA film, as the H:D ratio shifted from 0.726±0.012 to0.745±0.008 (Figure 7.8.5), A high bubble H:D ratio is indicative of a hydrophilic surface.
Discussion
The sensitivity of the ATR/FT-IR technique for monitoring the adsorption of naturalorganic materials was less than anticipated. No organic material was detected at the surfaceof a CA(43.9% acetyl) thin film exposed to RO feedwater for 21 hr. Insufficient exposuretime may also have contributed to the inability to detect adsorbed organic material. Adetectable quantity of organic material did adsorb to the surface of a CA(43.9% acetyl) filmexposed to colored well water. Preliminary results indicate that the material is both aromaticand aliphatic in nature. Adsorption of this material resulted in the reduction of the surfacehydrophobicity of the CA film. This drop in hydrophobicity is opposite to what one wouldexpect if a hydrophobic aliphatic aromatic compound were to adsorb at the surface.However, this increase in surface hydrophilicity is consistent with surface changes observedwhen humic acids adsorb.48
Again, the results are still preliminary and more work needs to be done. Changes arecurrently being implemented in the laboratory to improve on the sensitivity of the ATR/FT-IR spectroscopic technique. These improvements are (1) using a thinner 2-mm ZnSe IREto produce more internal reflections at the aqueous-polymer interface and (2) casting thinner(700-800 A) films of CA on the IREs to allow more energy to pass through the polymer film.
Section 7.9 Combined ATR/FT-IR Spectrometry and Nomarski DIG Image Analysisof Bacterial Attachment on Cellulose Acetate Thin Films
The original proposal called for measurements of bacterial attachment to be made off-line. The experimental setup consisted of a series of flow cells designed to hold polymer-coated microscope slides (see Figure 7.4.7). Flow cells were connected in series with theATR flow cell. Slides were periodically removed, stained with DAPI and bacterial cellsurface coverage (cells/cm2) determined as a function of time of flow. After review by theResearch Advisory Board, this protocol was discarded in favor of an on-line method wherereal-time measurements could be made. Immediate implementation of this on-line methodfor imaging bacteria on CA-coated IREs was not possible. As a compromise, a circular flowcell, containing a CA-coated microscope slide, was placed in series with the ATR flow cell
100
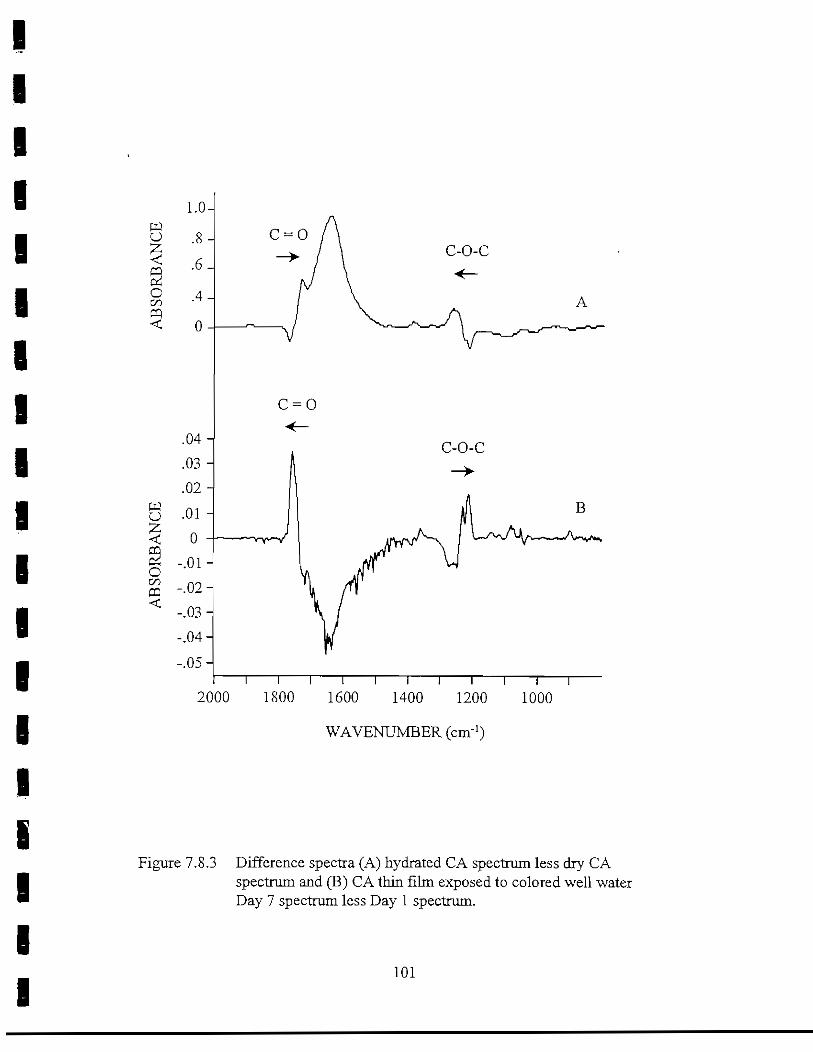
IIIIIIIIIIIIII1IIII
o
oooCQ
O
oCOCQ
.04
.03
.02
.01
0
-.01
-.02
-.03
-.04
-.05
C-O-C
A
c-o-c
B
-—v-v—V
I 1 I I 1 1 1 1 1 1
2000 1800 1600 1400 1200 1000
WAVENUMBER (cm-])
Figure 7.8.3 Difference spectra (A) hydrated CA spectrum less dry CAspectrum and (B) CA thin film exposed to colored well waterDay 7 spectrum less Day 1 spectrum.
101

IIIIIIIIIIIIIIIIIII
o
oCOCQ
.015
.012
.009
.006
.003
0
-.003
-.006
-.009
C-Hdeformation
aromaticring breathing
1450 1350 1250 1150 1050 950
WAVENUMBER (cnr!)
850
Figure 7.8.4 Difference spectrum (Day 7 less Day 1) of cellulose acetate(43.9% acetyl) thin film exposed to colored well water.
102

IIII1IIIIIIIII1IIIi
o"-4—'
cd
Q
0.84
ZnSe CA ColoredWell Water
Figure 7.8.5 Captive bubble contact angle measurement Height:Diameterratio (± std. dev., n = 10) of air bubble suspended underZnSe IRE, CA thin film and cellulose acetate (43.9% acetyl)thin film exposed to colored well water for 7 days.
103

iiiii
iiiiiiiii
so that images of adherent bacteria could be captured (Figure 6.4 and Figure 7.9.1). Siliconeinserts were placed in the imaging flow cell to match the fluid dynamics of the ATR flowcell. Nomarski differential interference contrast microscopy was used to visualize adherentbacterial cells, and images were captured using a CCD camera and framegrabber board.
Effect of Zwittergent 3-16 Pretreatment on Mycobacterium BT12-100 Attachment onCellulose Acetate (43.9% acetyl) Thin Films
The effect of Zwittergent 3-16 pretreatment on bacterial attachment to celluloseacetate (43.9% acetyl) was investigated. At the same time, molecular adsorption at theaqueous-polymer interface was investigated by ATR/FT-IR spectrometry. The CA thin filmscoated on a ZnSe IRE and glass coverslip were hydrated by pumping MS buffer through thetwo flow cells. Infrared spectra were collected over a 30-min period. Following hydration ofthe CA, a 0.25% solution of Zwittergent 3-16 was pumped through the flow cells. After 4 hrthe CA films were rinsed with buffer for 2 hr. Finally, a cell suspension (1.0 x 10s cells/mL)of Mycobacterium isolate BT12-100 was pumped through the two flow cells. Infraredspectra were collected periodically throughout the 10.5 hr experiment. Visual images werecollected during the final 4-hr period, when bacterial cells were pumped through the flowcells. The same cell suspension was also pumped through a circular flow cell containing anuntreated CA film, and images were captured over a 4-hr period. The untreated CA filmserved as the control.
Plots of the four major CA band intensities as a function of time of flow are shown inFigure 7.9.2. The four CA bands and the water band intensity remained unchanged duringthe short 30-min hydration period. When the Zwittergent 3-16 solution was pumped throughthe flow cells, the water band rose immediately from 0.851 AU to 1.35 AU, a 57% increase.The intensity of the 1743, 1369 and 1236 cm*1 bands of CA also increased but nowhere nearin magnitude to the water band (see Table 7.9.1). It is difficult to explain why the intensityof the water band increased so much. The 1743, 1369 and 1236 cm"1 band intensities allincreased slightly, suggesting that the thin film collapsed on the surface of the IRE whenZwittergent 3-16 was pumped into the flow cell. However, the 1049 cm"1 C-O stretchingband intensity actually dropped 1.5%, suggesting the opposite. An air bubble may havebecome trapped in the ATR flow cell when it was filled with buffer during the initialhydration step. When the surfactant solution was pumped through the flow cell, the
Table 7.9.1
Changes in IR Bands Upon Exposure to 0.25% Zwittergent 3-16
OrganicrCompound 1743 cm"1 ;1637 cm'1 ; :.1369 cm"1 1236.0m'1 . 1049 cm7
Zwittergent 3-16 +9.0% +57% +5.9% +3.8% -1.5%
104

IIIIIIIIIIIIIIIIII1
ATR/FT-IR spectrometry
MS bufferpH7
40x objective
Circular flow cell withDifferential InterferenceContrast (DIG) Microscopy
Mycobacterium sp.cell suspension
surfactant
Figure 7.9.1 Schematic diagram of on-line ATR/FT-IR spectrometry/Normarski differential interference contrast microscopy.
105

AB
SOR
BA
NC
EA
BSO
RB
AN
CE
io
0
rt
P-
£
S, s
g*
oti
*—'
oT
r?
2
OJ
w
CT>
O
O
O
O
O
i—'
oon O
OJ "t
o
U)
U)
CT
\ P
B-
on
^CD
/—
v
nT
P o
w n
^n*
,S-
£T
to^
S
uj
ca a
0\n
U)
o °
lp-
, p
§ a
h^ CL X O 3
d
to
o -
00 o to 4^ O UJ to o O O oo o o
O\O
O
(O
Ft
CO 1-1 00 CP UJ p-
P O 1-t- 3.
-I
J
.-I
1
L.
1IIIIIIIIIIIIIIIIII
bubble was likely displaced, resulting in the observed increase in the 1637 cm'1 water bandintensity. Aside from the large increase in water band intensity at the start of the Zwittergent3-16 addition, the CA bands and water band remained essentially unchanged during the10.5 hr experiment. Again, these CA films on ZnSe demonstrated much greater stability thanthose cast on Ge IREs (see Figures 7.3.2 and 7.3.3).
A series of ATR/IR spectra of Zwittergent 3-16 adsorbed from flowing solution onCA(43.9% acetyl) is shown in Figure 7.9.3. A plot of the 1487 cm"' band intensity of thesurfactant as a function of time of flow is shown in Figure 7.9.4. There was a 15-min delaybefore a measurable 1487 crn"1 band intensity was detected. Some of the delay was attributedto the filling of the flow cell and displacement of MS buffer. The flow cell was not rapidlyflushed with surfactant. Instead, it was pumped through at 8 mL/hr, and the data acquisitionmacro started when surfactant made contact with the CA film. One turnover volume orturnover time takes approximately 7.5 min, assuming plug flow. Therefore, some type ofdelay was expected. A short delay in Zwittergent 3-16 adsorption on Ge was observed (seeFigure 7.1.13). However, this delay was not attributed to filling, as surfactant was rapidlysiphoned into the flow cell displacing one volume before the data acquisition was initiated.The surfactant adsorbed at the interface at a constant rate, and the 1487 cm"1 band appeared toreach a pleateau of 2.60 mAU after 210 min.
After 4 hr the surface of the CA film was rinsed with MS buffer pH 7. A hydratedCA reference spectrum was subtracted from select sample spectra, revealing the underlyingZwittergent 3-16 spectrum. The 1487 cm"1 band did not drop with time, which would haveindicated desorption of the adsorbed surfactant. However, the band shape in this region ofthe spectrum changed significantly, enough that it became difficult to determine whether thedifference spectra really represented adsorbed Zwittergent 3-16. Thus, the results from thebuffer rinse are inconclusive. In a previous experiment, Zwittergent 3-16 remained firmlyadsorbed to CA(42%-acetyl) in spite of a 4-hr water rinse (see Figure 7.6.1). The Zwittergent3-16 from this experiment presumably remained firmly bound to the CA(43.9% acetyl) film,following the 4-hr buffer rinse.
After the CA thin film was treated with Zwittergent 3-16 and rinsed with buffer, a cellsuspension of Mycobacterium isolate BT12-100 was pumped through the flow cells. Again,the spectra proved to be difficult to process and the subtracted/difference spectra weredifficult to interpret. The typical Amide I (1650 cm"1) and Amide II (1550 cm"1) proteinbands, indicative of bacterial attachment, were not clearly visible. A band centered at1514 cm"1 did appear and increased in intensity with time (Figure 7.9.5). This band is about35 cm"1 lower than a typical Amide II protein band. The exact assignment and origin of the1514 cm"1 band is currently in question. A band near 1018 cm"1, assigned to the C-O stretchof carbohydrate/polysaccharide material, also increased -with time of flow. A series ofATR/IR spectra in the region near 1018 cm"1 are shown in Figure 7.9.6. Aplotofthe1514 cm"1 and 1018 cm"1 band intensities as a function of time of flow are shown inFigure 7.9.7 (top). The 1018 cm"1 band appeared to plateau briefly (30 min) near T = 2 hrand then continued to rise, while the 1514 cm"1 band intensity rose slowly at a constant ratethroughout the 4-hr period. The rate of change of the 1018 cm"1 band intensity increase was2.4 hr"1 (between T ~ 0 min and T = 100 min) as compared to 0.535 hr"1 for the 1514 cm"1
band, a 4.5-fold difference. The two bands are plotted against each other in Figure 7.9.7(bottom). The data were fit to a linear regression line with a correlation coefficient (R2) equal
107

o oo
erg s CD ^J jo U)
AB
SOR
BA
NC
E
Q

IIIIIIIIIiii
iiiiiiii
0.00 20 40 60 80 100 120 140 160 180 200 220 240
TIME (min)
Figure 7.9.4 Zwittergent 3-16 adsorption on cellulose acetate (43.9% acetyl).Plot of the 1487 cm"1 band intensity of Zwittergent 3-16 as afunction of time of flow.
109

1IIIIIIIIIIIIIII1II
.003-
.0025-
g .002-
<.0015-
.001-
.0005-
0-
1570 1560 1550 1540 1530 1520 1510 1500 1490 1480 1470
WAVENUMBER (cm'1)
Figure 7.9.5 ATR/IR spectra of Mycobactenum isolate BT12-100 adsorbedfrom flowing solution on cellulose acetate (43.9% acetyl) thin film.
110

IIIIIIIIIiiiiiiiiii
.014-
.012-
g .01 J
< .008 H
O .006 -GOCQ< .004 -
.002-
0-
11
oo
O
80 1140 1100 1060 1020
WAVENUMBER (cm'1)
980
Figure 7.9.6 ATR/IR spectra of Mycobacterium isolate BT12-100 adsorbedfrom flowing solution on cellulose acetate (43.9% acetyl) thin film.
Ill

IIIIIII1IIIIIIIII1I
OenCQ
0 4**-=?
0 20 40 60 80 100 120 140 160 180 200 220 240
TIME (min)
2.5o
CO
S 2.0-*-*cO
3 L5'
S i.o-
0.5
0.0
y = 0.2117x- 0.1337
R2 - 0.9763
0.0 1.0 2.0 3.0 4.0 5.0 6.0 7.0 8.0 9.0 10.0
ABSORBANCE (mAU) at 1515 cm"1
Figure 7.9.7 Plots of the (A) 1514cm'1 and(») 1018 cm*1 band intensitiesof Mycobacterium isolate BT12-100 as function of time offlow (top), and plot showing the relationship between the1514 cm"1 and 1018 cm'1 band intensities.
112

IIIIIIIIIIIIIIII1II
to 0.9763. The result indicates that the relative rate of change of these band intensities wereconstant over the 4-hr period, i.e., the two band intensities increased at two different rates,but the rates at which they changed relative to each other was constant.
Visual images were captured periodically as the Mycobacterium cell suspension waspumped through the flow cells. A series of Nomarski DIG images are shown in Figure 7.9.8.Also included are a series of images that show bacterial adhesion on an untreated CA(control) film. Both CA films were exposed to bacterial cells from the same suspension ofMycobacterium isolate BT12-100. A plot of the percent surface area occupied by bacteria asa function of time of flow is shown in Figure 7.9.9. Approximately 3-fold less area wascovered by Mycobacrerium cells attached to the Zwittergent 3-16 pretreated CA film ascompared to the untreated CA control. Cell adhesion on both films reached a plateauapproximately 2 hr into the 4-hr period. Therefore, the rate of adhesion on the pretreated CAfilm (1.98 hi"1) was also 3-fold less than the rate of adhesion on untreated CA control(5.71 hr"1). While bacterial attachment to the surfactant-treated CA film appeared to plateaunear 120 min, the 1018 cm"1 C-0 stretching band intensity continued to increase with time.However, when bacterial adhesion was correlated with the changes in 1018 cm"1 and1514 cm"1 band intensities by plotting the percent surface coverage as a function of IR bandintensities, it was apparent that the relationships were linear (Figure 7.9.10). The correlationcoefficient (R2) for the relationship between cell surface coverage and carbohydrate orpolysaccharide production was 0.985. Fewer data points were used to determine thecorrelation than displayed in individual plots, as IR and visual images did not always matchwith respect to the time of acquisition. The correlation between percent surface coverage andthe 1514 cm"1 band intensity was not as good (R2 - 0.8778). One could almost argue that therelationship between cell surface coverage and the 1514 cm"1 band intensity was linear up to120 min. After 120 min, the 1514 cm"1 band continued to increase while the surface coverageor cell attachment remained unchanged.
Discussion
Zwittergent 3-16 adsorbed onto a CA(43.9% acetyl) thin film, which led to asignificant reduction in Mycobacterium isolate BT12-100 adhesion as revealed by visualimages and calculations of percent surface coverage. Zwittergent 3-16 is a zwitterionicdetergent (see Section 7.1) with a terminal sulfonate (S03~) group, quaternary amine and C16
hydrocarbon tail. The surfactant is presumed to bind by electrostatic interactions, i.e., via thequaternary amine to carboxylate groups on the surface of the CA film. This would leave thehydrocarbon tail exposed to the bulk aqueous phase, which is not energetically favorable.However, a hemimicelle structure, i.e., a bilayer of surfactant molecules, may form at thesurface of the CA film, reducing the free energy of the system (Figure 7.9.11). The 0.5%(12.7 mM) concentration of Zwittergent 3-16 used was well above the reported criticalmicelle concentration of 0.1 — 0.6 mM. The concept of hemimicelle formation at the surfaceof synthetic polymer membranes was recently proposed by Childress and Elimelech.43 Abilayer of dodecyltrimethylammonium bromide (cationic surfactant) was believed to form atthe surface of a thin-film composite (TFC) polyamide reverse osmosis membrane at high pH.Similarly, a hemimicelle of sodium dodecylsulfate (anionic surfactant) was proposed to formon TFC polyamide RO, TFC polyamide nanofiltration and cellulose acetate RO membranes
113

IIIIIIIIIIIIIIIIiii
TIME (min)
Control CA Thin Film 0.25% Zwittergent 3-16Pretreated CA Thin Film
Figure 7.9.8 Nomarski differential interference contrast images ofMycobacterium isolate BT12-100 adsorbed from flowingsolution on cellulose acetate (43.9% acetyl) thin film. Eachfield of view is 117 x 157 microns.
114

IIIIIIIIIIIIIIII
0 20 40 60 80 100 120 140 160 180 200 220 240
TIME (rnin)
i
Figure 7.9.9 Plot of the percent surface area covered by Mycobacteriumisolate BT12-100 adsorbed on cellulose acetate (43.9% acetyl)(* ) untreated control and (• ) pretreated with Zwittergent 3-16as a function of time of flow.
115

CD ^J (o r
% S
UR
FAC
E C
OV
ER
AG
E%
SU
RFA
CE
CO
VE
RA
GE
O4^
S
Cd
o H
o
o
o o
o
o a
3
M
.
0
OQ
00 O 5 O W cj
p
>—'
o
otO
U
J
-fc.
o
o
oo
o
p o p U) p l/l p C
O to
Jo to
ON
00
00
~-J
oo

Zw
itte
rgen
t3-1
6 he
mim
icel
le
H,C
FIjC
HJCV
y\
x '
" 's
o;
+ N
so
+ N
/
\ \
s \
so
;
CII
3 so/
\- N
n ^u
,
CH
j
/X/X
so
]-/
I- N
/ \,
bact
eria
l ce
ll
cellu
lose
ace
tate
mel
nbi-a
Jie
Figu
re 7
.9.1
1 B
acte
rial
cel
l ads
orbe
d on
the
surf
ace
of c
ellu
lose
ace
tate
in
the
pres
ence
of
a Zv
vitte
rgen
t 3-1
6he
mim
icel
le.
Dia
gram
not
to s
cale
.
IIIIIIIIIIIIIIIIIII
at low pH, This adsorbed layer of surfactant alters the chemistry on the surface of CAenough to inhibit attachment of Mycobacterium isolate BT12-100. The bacteria that doattach may adhere to areas not covered by Zwittergent 3-16 (see Figure 7.9.11). At no timewere the bacteria exposed to bulk phase surfactant, as the flow cell containing the surfactant-treated CA film was rinsed with buffer prior to the introduction of the cell suspension.Therefore, the surface chemistries of the Mycobacterium cells exposed to the control andZwittergent 3-16 treated CA film were the same.
Other studies of bacterial attachment on pretreated CA surfaces by Nomarski DIGmicroscopy have been reported in our lab.42 Chloramine, DBSA, DBSA/LiBr, zosteric acidbenzalkonium chloride and Zwittergent 3-16 have been used as surface pretreatments withmixed results. A combination of DBSA and LiBr applied to a CA(42% acetyl) thin filmeffectively reduced Mycobacterium isolate BT12-100 attachment, Chloramine, DBSA andzosteric acid pretreatments of CA actually resulted in the promotion of Mycobacteriumattachment, while pretreatments with benzalkonium chloride and Zwittergent 3-16 did notsignificantly alter bacterial attachment. A lower concentration of Zwittergent 3-16 (0.1%)and a CA film with a lower acetate (42%) content was used in these experiments, which mayexplain the difference from our results.
Bacterial attachment is proposed to occur in two steps, an initial weak stage ofattachment followed by more firm attachment facilitated by EPS, of which exopolysaccha-rides are typically a major contributor.49l?'s'9 Attachment to solid substrates is thought tostimulate extracellular polysaccharide production by bacteria. Vandevivere and Kirchmanreported that the addition of sand to shake-flask cultures seemed to induce exopolymersynthesis.50 At first glance, the 1018 cm"1 band associated with carbohydrate/polysaccharideappeared to increase in intensity after adhesion of Mycobacterium cells on the Zwittergent-pretreated CA film reached steady state (see Figure 7.9.7 and Figure 7.9.9). This wouldsuggest that polysaccharide production continued after cell attachment had stopped.However, when the two sets of data (surface coverage and IR) were plotted against eachother, it became apparent that there is a linear relationship between cell attachment andcarbohydrate accumulation at the surface of the cellulose acetate film. Therefore,extracellular polysaccharide production or accumulation of polysaccharide material at thecellulose acetate surface did not occur after bacterial attachment reached a steady state. Thiscan be explained by the fact that the Mycobacterium cells were suspended in buffer solutionwith no nutrients provided for growth. In addition, the time frame of the experiment waslimited to 4 hr, and insufficient time elapsed for a detectable amount of growth to haveoccurred. The plot of 1018 cm"1 band intensity against the 1515 cm"1 intensity supports thisconclusion. Assuming the 1515 cm"1 band intensity is a reflection of cell biomass in the formof protein, the relationship is essentially linear with an R2 value of 0.9763. Therefore, therelative rate of polysaccharide accumulation at the CA interface was equal to the rate ofchange of the protein adsorption, i.e., cell adhesion at the interface.
How adsorbed surfactants influence cell attachment on membrane surfaces is of greatinterest. Formation of a stable hemimicelle structure at the aqueous-polymer interface couldprovide a method by which surface properties, e.g., hydrophobiciry or charge, could bealtered while maintaining the membrane's innate transport properties. Test studies ofmembranes operated in reverse osmosis indicate that surfactants, such as Zwittergent 3-16,do not significantly diminish membrane transport properties (data not shown). Similar
118

IIII1IIIIIIIIIIIIII
studies with zosteric acid indicate very little effect on membrane transport properties.51
Therefore, surfactants or other chemicals could potentially be applied as a post-productiontreatment to alter membrane surface properties and to minimize bacterial adhesion. ATR/FT-IR spectrometry work is currently under way to obtain further evidence that thesehemimicelle structures form at the aqueous-polymer interface of CA thin films.
The sensitivity of the ATR/FT-IR spectrometric technique used for the detection ofnatural organic materials and organics associated with bacterial attachment is not what wehad hoped. Improvements in our ability to detect these compounds need to be made. Therecommended changes are to (1) switch to a thinner internal reflection element to generatemore internal reflections at the aqueous-polymer interface—the result is similar to thatachieved when the pathlength of a transmission measurement is increased, i.e., greater signalintensity, and (2) cast a thinner (700 - 800 A) film of cellulose acetate on the IRE, allowingmore energy to penetrate into the bulk aqueous phase. These changes are being implementedin the lab.
Our current focus is directed toward the development of the simultaneous ATR/FT-IRspectrometry/fluorescence microscopy technique. This methodology will allow images to beobtained from the same surface on which the IR data is collected. The progress made withthis system is discussed below.
Section 7.10 Simultaneous ATR/FT-IR Spectrometry of Adsorbed Organics andFluorescence Imaging of Adherent Bacteria on Thin Films of CelluloseAcetate
The IR and imaging methodology described above does not allow for the collection ofimages of adherent bacteria at the same polymer-interface from which the IR radiationinternally reflects. A method for making simultaneous real-time measurements of infrared(chemical) data and fluorescent (visual) data was devised. The goal was to manufacture aflow cell that would hold an IRE and also possess a window to accommodate a 40X objectivefor fluorescence microscopy. The kinetics of bacterial attachment to the polymer film couldthen be correlated to the IR data collected from that same surface.
Two options were investigated. Both options made use of this special ATR flow cell.Option 1: Place the flow cell on the stage of a microscope. Transmit IR radiation from thespectrometer through fiber optic cables onto the IRE and then off the IRE and onto thedetector using more fiber optic cables. Raise the stage-mounted flow cell to the plane offocus of the microscope objective and capture images with a CCD camera. Option 2: Build afluorescence microscope around the ATR flow cell in the spectrometer. Mount themicroscope in a horizontal position and use an x-y-z stage to position the objective on thewindow of the ATR flow cell.
Mid-IR fiber optic technology has not advanced to the point where it could besuccessfully implemented to pursue Option 1. Incorporation of a 20-mm wide IRE into theflow cell necessitated the use of large bundles of fiber optic cables to transfer light from thespectrometer onto the end of the IRE. This type of fiber optic bundling was too costly,inefficient and cumbersome. Thus, Option 2 was pursued (Figure 7.10.1).
119

IIIIIIIIIIIIIIIIIII
custom machinedATR flow cell -/
IR radiation
from FT-IRspectrometer
fiber optic cable toexcitation sourceMCT
detector XYZmicrometer stage *
NIcolet Tabletop Optical Module
Figure 7.10.1 Schematic diagram of simultaneous ATR/FT-IR spectrometry /fluorescence microscopy experimental setup.
120

IIIIIIIIIIIIIIIIIII
Designs were drawn for a flow cell to accommodate a 50 x 20 mm IRE that wouldenable collection of visual images of the surface through a coverslip window. Initially, apolycarbonate prototype was manufactured (D-J Engineering, Tustin, CA). Later, a fullyoperating stainless steel prototype was manufactured and tested (Figure 7.10.2). The flowcell has a 150-p.m channel depth and a 170-fim thick window that permits visualization of thepolymer-coated IRE surface with a horizontally mounted fluorescence microscope. Furthermodifications to the stainless steel flow cell still need to be made.
The fluorescence microscope was designed and assembled in-house (Figure 7.10.3).The microscope consists of a 3-dimensional optical bench constructed from C-mountthreaded tubular components (Edmund Scientific, Barrington, NJ) and fitted with a Nikon40X planapochromatic fluorite microscope objective (A. G. Heinze Co. Inc., Melville, NY).The two custom-manufactured dichroic beamsplitter cubes used in the instrument eachconsist of a dichroic mirror, an excitation filter and a barrier filter (Omega Optical,Brattleboro, VT). The UV cube provides excitation wavelengths from 320 nm to 380 nm andpasses emission wavelengths from 430 nm to 500 nm (700+rrm without barrier filter). Thegreen filter cube provides excitation energy ranging from 480 nm to 544 nm and passesemission wavelengths >540nm.
A short arc (3 mm) xenon flash lamp (Oriel Instruments, Stratford, CT) providesexcitation energy for the microscope. The lamp can be fired at up to 72 Hz by an internalsignal generator or sychronized with video frame acquisition via an external trigger control.This flash unit provides up to 2000 mJ at 30 Hz (video real-time frame rate). A liquid lightguide (3 mm x 1 m, Oriel Instruments, Stratford, CT) coupled at each end by quartz opticsconducts the white light produced by the flash lamp to the microscope's dichroic filter cube.
A modified Gen III proximity focused image intensifier unit is directly coupled to themicroscope (B. E. Meyer & Co., Inc., Redmond, WA). A monochrome RS 170-compatibleCCD camera optically coupled to the intensifier unit via a relay lens records the intensifiedmicroscope images.
The flash and image intensifier limits the energy applied to the bacterial cells orbiofllm on the ATR crystal. The pulses of light from the short arc xenon flash employed inthis microscope configuration are short in duration (on the order of 100 fisec or less)compared to the video frame width (30 msec). Illumination was only applied during theactual acquisition of data; the ATR crystal remains dark at all other times. Thus, use of thexenon flash and image intensifier insures that the bacteria on the ATR crystal receive theleast amount of excitation energy required to obtain a useful image. This method avoids theproblems associated with prolonged exposure to short wavelength radiation oftenencountered during epifluorescent microscopy such as photobleaching of fluorochromes andthermal damage to the specimen, permitting extended time-lapse studies of early bacterialattachment and biofilm formation.
An 8-bit PCI framegrabber board (Flashpoint 128, Integral Technologies, Inc.,Indianapolis, IN) in a PC microcomputer digitizes the camera images. This board alsoprovides appropriate synchronization signals to control the xenon flash. Control of imageacquisition and further image processing is accomplished using Image-ProPlus imageacquisition and analysis software (Media Cybernetics, Silver Spring, MD).
121

IIIIIIIIIIIIIIIIIII
B
Figure 7.10.2 ATR flow cell for fluorescence microscopy with (A) ZnSeIRE (50x20x2 mm) and (B) 40X objective.
122

IIIIIIIIIIIIIiiiiii
Figure 7.10.3 Epifluorescence microscope (top) with (A) CCD camera mount,(B) fiber optic cable, (C) x-y-z stage, (D) dichroic beamsplittercube and (E) 40X objective. Xenon excitation source (bottom).
123

iiiiiiiiiiiiitiiii
A tabletop optical module (TOM), mirrors (front-end kit) and medium range MCT-Adetector (Nicolet Instrument, Madison, WI) were assembled to create a platform on which theATR flow cell and fluorescence microscope are mounted (see Figure 7.10.4).
Current Status of ATR/FT-IR Spectrometry/Visual Imaging System
The epifluorescence microscope is ready to be tested in conjunction with the flowcell, although the IR optics and flow cell need more work. Alignment of the mirrors andMCT detector needs to be improved. The latest prototype of the ATR flow cell needs to beleak tested and the fluid dynamics assessed. Access to the flow cell window needs to beimproved as the microscope objective is not seated properly. The system should be on line intwo to three months. This ATR/FT-IR spectrometry/visual imaging system will allow us toobtain visual images of adherent bacteria on polymer surfaces on which dissolved organicmaterial has adsorbed, providing real-time molecular and visual information of adsorptionphenomena at the aqueous-polymer interface.
124

IIIIIIIIII1IIIIII
Figure 7.10.4 Tabletop Optical Module (TOM) with (A) flat mirror (B) ellipticalmirror. (C) ATR mirror assembly, (D) parabolic mirror and(E) MCT detector.
125

iiiiiiiiiiiiii
iiii
Section 8.
References
1 Fujita, Y., W.-H. Ding and M. Reinhard. 1995. Identification of wastewater DOCcharacteristics in reclaimed wastewater and recharged groundwater. Water Environ. Res.
2 Argo, David G. 1980. Evaluation of membrane processes and their role in wastewaterreclamation. Vol. I. and II., Final report. Contract No. 14-34-0001-8520. Office of WaterResearch and Technology, U.S. Department of the Interior, Washington, D. C.
3 McCarthy L. Perry, Martin Reinhard, Naomi L. Goodman, James W. Graydon, GaryD. Hopkins, Kristen E. Mortelmans and David G, Argo. 1982. Advanced treatment forwastewater reclamation at Water Factory 21. Technical Report No. 267; Department ofCivil Engineering, Stanford University, Palo Alto, CA.
4 Ridgway, H. F., M. G. Rigby and D. G. Argo. 1985. Bacterial adhesion and fouling ofreverse osmosis membranes. J. Amer. Water Works Assoc. 77:97-106.
5 Ridgway, H. F. 1987. Microbial fouling of reverse osmosis membranes: genesis andcontrol, p.429-481. In M. W. Mirtelman and G. G. Geesey (ed.), Biological fouling ofindustrial water systems: a problem solving approach. Water Micro Associates, San Diego,CA.
6 Flemming, H. C. and G. Schaule. 1988. Investigations on biofouling of reverse osmosisand ultrafiltration membranes: Part I: initial phase of biofouling. Vom Wasser71:207-223.
7 Costerton, J. W. and R. T. Irwin. 1981. The bacterial glycocalyx in nature and disease.Ann. Rev. Microbiol. 35:299-324.
8 Costerton, J. W., H. M. Lappin-Scott and K.-J. Cheng. 1992. Glycocalyx, bacterial,p. 311-317. In Encyclopedia of microbiology. Vol. 2. Academic Press, Inc., New York.
I 9 Christensen, B- E. 1989. The role of extracellular polysaccharides in biofilms. J.Biotechnol. 10:181-202.
IOBryers, J. D. 1993. Bacterial biofilms. Ciorr. Opinion Biotechnol. Biochem. Eng. 4:197-204.
11 Characklis, W. G. 1990. Biofilm Process, p. 195-231. In W. G. Characklis and K. C.Marshall (ed.), Biofilms. John Wiley & Sons, New York.
126

ii
!2 Baier, R. E. 1981. Early events of micro-biofouling of all heat transfer equipment, p. 293-I 304. In E. F. C. Somerseales and J. G. Knudsen (ed.), Fouling of heat transfer equipment.^^ TT * t "n 1 1 * 1 ' f-\T 7 1 ' , T~^ j"1
iiiiiiiiii
iii
Hemisphere Publishing Co., Washington, DC.
13 Thurman, E. M. 1985. Humic substances in groundwater, p. 87-103. In G. R. Aiken, D.M. McKnight, R. L. Wershaw (eds.), Humic substances in soil, sediment and water—1985.John Wiley & Sons, New York.
14 Amy, Gary L., Raymond A. Sierka, Jim Dedessem, Tim Carey, Chandra Mysore,David Price, Mohamed Siddiqui and Lo Tan. 1989. Molecular weight "fingerprints" oforganic color in Orange County Water District groundwater: implications for treatmentprocess selection and monitoring. Final report. Orange County Water District, FountainValley, CA.
15 Fletcher, M. and G. I. Loeb. 1979. Influence of substratum characteristics on attachmentof a marine pseudomonad to solid surfaces. Appl. Environ. Microbiol. 37:67-72.
16 Dexter, S. C. 1979. Influence of substratum critical surface tension on bacterial adhesion.In situ studies. J. Colloid Interface Sci. 70:346-354.
17 Absolm, D. R., F. V. Lambert, Z. Polcova, W. Zingg, C. T. vanOss and W. Newmann.1983. Surface thermodynamics of bacterial adhesion. Appl. Environ. Microbiol. 46:90-97.
is prjng]e) j. jj_ an(} jyi Fletcher. 1983. Influence of substratum wettability of attachment offreshwater bacteria to solid surfaces. Appl. Environ. Microbiol. 46:881-817.
19 Fletcher, M. and G. I. Loeb. 1979. The influence of substratum characteristics on theattachment of a marine pseudomonad to solid sufaces. Appl. Environ. Microbiol. 37: 67-72.
20 Marshall, K. C., R. Stout and R. Mitchell. 1971b. Mechanism of the initial events in thesorption of marine bacteria to surfaces. J. Gen. Microbiol. 68:337-348.
I' 21 Fletcher, M. and K. C. Marshall. 1982. Bubble contact angle method for evaluatingsubstratum interfacial characteristics and its relevance to bacterial attachment. Appl.
• Environ. Microbiol. 44:184-192.
22 Fletcher, M. 1976. The effects of proteins on bacterial attachment to polystyrene. J. Gen.Microbiol. 94:400-404.i
23 Orstavik, D. 1977. Acta. Pathol. Microbiol. Scand. 85; 47-53.
24 Meadows, P. S. 1971. The attachment of bacteria to solid surfaces. Arch. Mikrobiol.75:374-381.
127

25 Ishida, K. P. and H. R. Ridgway. 1995. Analysis of biocide / biofilm interactions byattenuated total reflection Fourier transform infrared spectrometry. Final report. Project No.MRDP 699-503-93. National Water Research Institute, Fountain Valley, CA.
25 Bremer, P. J. and G. G. Geesey. 1991. An evaluation of biofilm development utilizingnondestructive attenuated total reflectance Fourier transform infrared spectroscopy.Biofouling 3:89-100.
27 Bremer, P. J. and G. G. Geesey. 1991. Laboratory-based model of microbiologicallyinduced corrosion of copper. Appl. Environ. Microbiol. 57:1956-1962.
28 Geesey, G. G. and P. J. Bremer. 1990. Applications of Fourier transform infraredspectrometry to studies of copper corrosion under bacterial biofllms. Mar. Tech. Soc. J.24:36-43.
29 Suci, P. M., M. W. Mittleman, F. P. Yu and G. G. Geesey. 1994. Investigation ofciprofloxacin penetration into Pseudomonas aeruginosa biofilms. Antimicrob. AgentsChemo. 38:2125-2133.
30 Harrick, N.J. 1967. Principles of internal reflection spectroscopy. In Internal reflectionspectroscopy, p. 13. Harrick Scientific Corporation, Ossining, NY.
31 DIuhy, R. A. 1986. Quantitative external reflection infrared spectroscopic analysis ofinsoluble monolayers spread at the air-water interface. J. Phys. Chem. 90:1373-1379.
32 Downing, H. D. and D. Williams. 1975. Optical constants of water in the infrared. J,Geophys.Res. 80:1656-1661.
33 Powell, D. A. 1979. In Microbial polysaccharides and polysaccharases. R. C. W. Berkeley,G. W. Gooday and D. C. Ellwood (ed.), p. 117-160. Academic Press, New York.
34 Haug, A., B. Larsen and O. Smidsrod. 1966. A study of the constitution of alginic acidby partial acid hydrolysis. Acta Chem. Scand. 20:183-190.
35 Haug, A., B. Larsen and O. Smidsrod. 1967. Studies on the sequence of uronic acidresidues in alginic aicd. Acta Chem. Scand. 21:691-704.
36 Larsen, B., O, Smidsrod, A, Haug and T. Painter. 1969. Determination by a kineticmethod of the nearest-neighbor frequencies in a fragment of alginic acid. Acta. Chem.Scand. 23:2375-2388.
37 Jang, L. K., N. Harpt, T. Uyen, D. Gransmick and G. G. Geesey. 1989. An iterativeprocedure based on the Donnan equilibrium for calculating the polymer-subphase volume
128

of alginic acid. J. Polym. Sci. 27B:1301-1315.
38 Anderson, D. M. V. 1988. The structural significance of amino acids in some plant gums,p. 31-37. In G. O. Phillips, D. J. Wedlock and P. A. Williams (ed.), Gums and Stabilizers'for the Food Industry. Vol. 4. IRL Press, Oxford.
39 Oldani, M. and G. Schlock. 1989. Characterization of ultrafiltration membranes byinfrared spectroscopy, ESCA, and contact angle measurements. J. Membr. Sci. 43:243-258.
40 Isner, J. D. and R. C. Williams. 1993. Analytical techniques for identifying reverseosmosis foulants, Chapter 8, p. 237-275. In Zahid Amjad (ed.), Reverse Osmosis,Membrane Technology, Water Chemistry and Industrial Applications. VanNostrandReinhold, NY.
41 Riley, R. L. Personal communication. Separation Systems Technology, San Diego, CA.
42 Toprak, C., J. N. Agar and M. Falk, 1979. State of water in cellulose acetate membranes.J.Chem.Soc. Faraday I 75:803-815.
43 Ridgway, H. F., G. G. Rodriguez, J. Safarik, T. Cormack and D. W. Phipps. 1998.Fouling composition during membrane treatment of secondary effluent: microscalecharacterization leading to fouling prevention on the pilot scale. Final report. Project No.MRDP 669-507-95. National Water Research Institute, Fountain Valley, CA.
44 Childress, A. E., M. Elimelech. 1996. Effect of solution chemistry on the surface chargeof polymeric reverse osmosis and nanofiltration membranes. J. Membrane Sci. 119:253-268.
45 Dimisch, H.-U. and W. Pusch. 1976. Ion exchange capacity of cellulose acetatemembranes. J. Electrochem. Soc. 123:370-374.
46 Dimisch, H.-U. and W. Pusch. 1979. Electric and electrokinetic transport properties ofhomogeneous weak ion exchange membranes. J. Colloid Interface Sci. 69:247-270.
47 Gaudin, M. and D. W. Fuerstenau. 1955. Quartz flotation with cationic collectors.AIME Trans. 202:958-.
48 Nichols, P. D., J. M. Henson, J. B. Guckert, D. E. Nivens and D. C. White. 1985.Fourier transform-infrared spectroscopic methods for microbial ecology: analysis ofbacteria, bacteria-polymer mixtures and bioillms. J. Microbiol. Methods 4:79-94.
49 Jucker, C. and M. M. Clark. 1994. Adsorption of aquatic humic substances onhydrophobic ultrafiltration membranes. J. Membrane Sci. 97:37-52.
129

IIIIIIIIIIIIIIIIIII
50 Marshall, K. C. 1985. Mechanisms of bacterial adhesion at solid-water interfaces, p. 133-161. In D. C. Savage and M. Fletcher (ed.), Bacterial adhesion. Mechanisms andPhysiological Significance. Plenum Press, New York.
51 Vandevivere, P. and D. L. Kirchman. 1993. Attachment stimulates exopolysaccharidesynthesis by a bacterium. Appl. Environ. Microbiol. 59:3280-3286.
52 Zimmerman, Richard C., David C. White, Gill Geesey and Harry Ridgway. 1998.Biofouling control through non-toxic means: application of zosteric acid to water treatmentsystems: a phase I research program. Final report. Project No. TT699-547-97. NationalWater Research Institute. Fountain Valley, CA.
130

H,
iiiiiii
iiiiiiiiiI