g n kathpalia rakesh kapoor - alternative futures paper af... · g n kathpalia rakesh kapoor april...
TRANSCRIPT

Management of Land and other Resources
for Inclusive Growth: India 2050 G N Kathpalia
Rakesh Kapoor
April 2010
Revised 2015
Alternative FUTURES
www.alternativefutures.org.in
B-177, East of Kailash, New Delhi 110 065
Tel: 2684 7668, 4162 2724

Managing Resources for Inclusive Growth: India 2050
1
CONTENTS
SYNOPSIS ................................................................................................................................................... 3
1. INTRODUCTION ................................................................................................................................ 3
PART I ......................................................................................................................................................... 4
2. GROWING INEQUALITY IN THE INDIAN ECONOMY .......................................................... 4
3. LOW AGRICULTURAL PRODUCTIVITY ......................................................................... 6
4. LAND AVAILABILITY AND COMPETING DEMANDS .......................................................... 9
5. URBANIZATION .................................................................................................. 10
6. UNEMPLOYMENT AND UNDERUTILIZATION OF HUMAN RESOURCES ................................. 11
PART II - TOWARDS AN ALTERNATIVE MODEL OF DEVELOPMENT ........................... 12
7. RE-ENGINEERING URBANIZATION ............................................................................ 13
7.1 Rural Infrastructure & Services Commons (RISC): Khosla and Dey Model ... 17
8. CONDITIONS FOR ESTABLISHING EFFICACY OF DISTRIBUTED URBANIZATION MODEL ........... 18
8.1 Population Sustainable on Agriculture Land ............................................... 19
8.2 Bring about Agricultural Turn-around ........................................................ 20
8.3 Water resources development and use ....................................................... 21
8.4 Infrastructure, Services and Market Access ................................................ 23
8.5 Human Resources: Bringing about Productive Occupational Shift .............. 24
9. POLICY CHANGES ............................................................................................... 25
9.1 Land use...................................................................................................... 25
9.2 Water Use .................................................................................................... 27
9.3 Market Access and Financial Services ......................................................... 28
REFERENCES.......................................................................................................................................... 29
ANNEXURE – 1 ...................................................................................................................................... 31
ANNEXURE – 2 ...................................................................................................................................... 32

Managing Resources for Inclusive Growth: India 2050
2
LIST OF TABLES
Table 1 – Purchasing power of various sections of society 5
Table 2 – Sectoral Share in GDP (in %) 6
Table 3 – Growth Rates 6
Table 4 – Incidence of Unemployment among Rural Agricultural Households 7
Table 5 – International Yield Comparisons across a Range of Agri-commodities 7
Table 6 – Urban Share of Net Domestic Product (NDP) 8
Table 7 – Percentage of Poor in Different Size Classes of Cities/Towns 8
Table 8 – Land area of India by usage: current and projections for 2020 and
2050 (mha) 9
Table 9 – Total and Urban Population (in millions) in India 10
Table 10 – Some basic facts of India‟s Urbanisation: 2001 11
Table 11 – List of Services and Goods for which Rural People Visit
Towns/Cities in India 14
Table 12 – Population Thresholds of Selected Services in India 15
Table 13 – Ideal Population Distribution and Land Required in Year 2050 16
Table 14 – Land Requirement for different non-agricultural purposes, 2050 17
Table 15 – Population Sustainability and minimum Requirement of Land:
India 2050 19
Table 16 – Production of foodgrains 21
Table 17 – Water Resources: Overall outlay for 11th
Five Year Plan (Rs crore) 21
Table 18 – Physical Target 22
Table 19 – Water requirement for various sectors 23
Table 20 – Purchasing power – various sections of society and target for 2050 24
LIST OF BOXES
Box 1 – A Policy on Sugarcane 20
Box 2 – Tenets for Financing Framework for Poverty Reduction for the Urban
Poor 29
Box 3 – Public Regulatory System at Multiple Area Levels 31
Box 4 – Public Regulatory System at Multiple Administrative Levels 32
Managing Resources for Inclusive Growth: India 2050
3
Management of Land and other Resources for
Inclusive Growth: India 2050
G N KATHPALIA1
RAKESH KAPOOR
Synopsis
This paper proposes an alternative holistic model for urban and rural development
taken up in tandem that can, in the long run, promote a rational and equitable
utilization of national resources and economic growth. Part I of the paper presents
a comprehensive overview of the current status of the economy characterized by
growing inequality, low agricultural productivity, land availability for urbanization
and various competing demands, water resource mismanagement, unemployment,
underemployment and low levels of skill development. Part-II proposes an
alternative model of urbanization, better resource management and development
that can lead to distributed prosperity or what has been called ‘inclusive growth’.
1. Introduction
Land (including minerals and forests), water and energy are the major resources
which have to be managed in an integrated way for sustainable development, since
India has only 2% of the global land, 4% of water but 16% of the population of
the world. At present, land use is very poorly regulated, and both government
departments as well as private agencies are acquiring and grabbing land wherever
possible, and using it for their limited purpose without considering any integrated
planning and use of land. The management of human and financial resources is
also critical for sustainable and inclusive growth. At present the natural resources
are being developed and used at a comparatively faster rate during the last decade
due to increased economic activity. It is only through the careful and integrated
management of these resources that we can provide livelihood for all and prosperity
to the nation and each household.
At present, the GDP growth of approximately 8% in the previous 5 to 6 years has
been mainly contributed by the services sector and industry sectors. Agriculture
currently contributes 18.5 per cent to the GDP while supporting 51% of the
population, which cannot be sustained if those dependent on agriculture have
to be moved out of poverty. At present the population living on agriculture is
being sustained through subsidies in the form of cheaper water, energy and
fertilizer besides fixing a minimum purchase price, and almost half the country‟s
population is below the poverty line (BPL).
1 G N KATHPALIA is retired Chief Engineer, MOWR and Consultant to ADB, World Bank and
USAID. Currently, he is Chairman of the Delhi-based development research group Alternative
Futures (www.alternativefutures.org.in). RAKESH KAPOOR is a social scientist and futurist,
founder Managing Trustee of Alternative Futures and is Director of the World Futures Studies
Federation. Email: [email protected].

Managing Resources for Inclusive Growth: India 2050
4
It is obvious that a new way for raising quality of life in the rural areas would
have to be found which would require a major shift in terms of how the
problem is addressed. This will draw on careful planning and regulated use of all
resources as well as the innovation and entrepreneurship capabilities of our
population. Our paper suggests a vision and plan that includes an alternative
urbanization model and various policy measures to address these problems.
Our analysis suggests that with efficient use of land and water a minimum
culturable area of 185 million ha (including net 65 mha irrigated area with 150 per
cent intensity) along with 65 mha for forests would be needed to meet the food
production requirement of 455 million tonnes in 2050 and maintaining the ecology
and forest produce. Only the balance 45 mha would be available for other purposes
like urbanization, industrialization and infrastructure. The industry and service
sectors will support most of the population and this will lead to higher GDP growth.
Sustainable population on agriculture and forest activities has been projected in this
plan at about 400 million (out of a total population of 1.6 billion in 2050).
Our paper suggests that population distribution among the different type of
urban areas should be planned and designed in such a way, through
appropriate policy measures, that a majority of the urban population (600
million out of a total planned urban population of 1 billion) is located in 4000
small towns with a population of 1.5 lakh each. These towns would be within
easy reach from the villages making all facilities of education, health, skill training
institutes, financial services and entertainment etc. available, suitable to local
requirements. This needs a major focus for inclusive development of the population
living in small towns and villages. Most of the jobs and new skill creation can be
focused on the younger population of 18 to 35 years. The balance urban population
of about 400 million would be distributed in bigger cities including metro cities.
In order to carry out these measures we suggest autonomous public regulatory
bodies (with adequate authority) to frame rules, allocate land and water for various
purposes, in an integrated manner so as to sustain development as well as ecology.
The regulatory bodies will not only allocate land and water and frame the rules for
the same; they will also strictly monitor the implementation of their directives. The
regulatory bodies would be located in each state with basic principles and policies
being framed by the central body in consultation with the state bodies. In framing
the policies for efficient use and monitoring local gram sabha/panchayat would also
have to be involved fully with suitable degree of authority delegated to them.
PART I
2. GROWING INEQUALITY IN THE INDIAN ECONOMY
World over, despite the recent recession, the benefits of globalization are being
celebrated in all types of economies. India‟s own economic strength has increased
tremendously in the last 15 years with the GDP reaching the growth rate of
approximately 8% per annum in the last 5-6 years. Yet the wealth distribution across
the strata of society has become far more dangerously uneven than the pre-
globalization era. In fact, the gains of this growth have not trickled down to small
towns and villages because most of the development has centered on and around
the cities and major towns. Poverty and inequity have worsened in the last decade
and a half. The Gini coefficient (with values of zero for no inequality and one for
extreme inequality) for India was relatively low and stable for many decades but has

Managing Resources for Inclusive Growth: India 2050
5
been rising in the last two decades. It was 0.32 in 2004-05 on the basis of NSS
consumption data. Moreover, the extent of inequality in India is actually much
higher than this, as the Gini coefficient often refers to inequality of income
distribution, while in India‟s case it refers to distribution of consumption
expenditure (Bardhan 2009)2
.
For the number and percentage of persons below the poverty line, the Planning
Commission estimates that 27.5 per cent of the population, or nearly 302 million
people, was poor in 2004, down from 36 per cent in 1993 (Planning Commission,
2008b). However, estimates of the poor population by different agencies vary
substantially. Recently, in 2008, the N C Saxena committee set up by the Planning
Commission itself estimated that over half the country‟s population is below the
poverty line! This growing inequality has now become a pressing issue for the
country and needs to be addressed, sooner than later, as in the case of most high
growth economies.
This unfortunate situation has very negative consequence for the country‟s poor.
The country's per capita income at current prices is a little over Rs 37,000 per
annum (GOI 2009b). In purchasing power parity terms, this is equivalent to
approximately Rs 150,000 per annum. But the purchasing power is unevenly
distributed as indicated in Table 1 below. Thus, there is wide inequality between
top 10% and the bottom 25%. The contribution towards GDP is also mostly by the
top 10%, and the 8% plus growth rate also primarily involves and benefits the top 10
to 30% of the population. The service sector and industry cater primarily to their
needs in big urban areas.
Table 1
Purchasing power of various sections of society
Population in
percentage
Purchasing power Location of the
population
Top 10% High Mostly urban
Upper middle class 20% Moderate and growing Mostly urban
Lower middle class 20% Basic necessities plus
some consumer goods
Mostly urban and some in
rural areas
Poor (Just above poverty
line - APL) 25%
Just basic necessities Rural and slums in urban
areas
Poorest (BPL) 25% Even basic necessities
not available
Rural and slums in urban
areas
Source: Authors‟ estimates based on reports of various national and international agencies.
The worrisome issue of poverty in the country, despite the rapid GDP growth, is
intricately linked with a number of several equally complex issues of continuing low
agriculture productivity, mismanagement of land, water and energy resources,
extremely poor infrastructure in rural areas (power, roads, telecommunications),
growing unemployment/marginal employment in rural areas and the inability of a
2 Bardhan points out that according to NCAER collection of income data in the households survey
2004-05, the Gini coefficient of income inequality for India is as high as 0.535.

Managing Resources for Inclusive Growth: India 2050
6
vast sections of illiterate and unskilled population to respond to the needs of the
rapidly changing economy.
3. LOW AGRICULTURAL PRODUCTIVITY
The relative share of the agriculture sector in GDP has been consistently falling (see
Table 2 below). The share of agriculture, forestry and fishing in GDP has decreased
from 24 per cent in 2001-02 to 18.5 per cent in 2006-07. The compounded annual
growth rate (CAGR) (see Table 3 below) of the GDP as a whole during the tenth plan
period (2002-07) was 7.6 per cent, while the CAGR for agriculture, industry and
services were 2.1, 8 and 9.5 respectively (Planning Commission, 2008b: 139). In
terms of the sectoral share of employment, agriculture and mining provided
employment to 66.08 % of the workforce in 1983, this has consistently fallen to
50.80 per cent in 2006-07. And the Planning Commission estimates that during the
ten-year period 2006-07 to 2016-17, there will be a net decrease of 4 million
agricultural workers. Again, it is notable that the number of main workers in
agriculture declined by 18 million during the period 1991-2001 while there was a
large increase in marginal workers in agriculture during the same period. The
incidence of unemployment in rural agricultural households increased from
7.73 per cent in 1983 to 15.26 in 2004-05 (Table 4). It is more than evident that
with the sharply declining share of agriculture in GDP as well as employment, it will
be extremely difficult to lessen poverty and economic inequality in the country
without reducing the dependence on agriculture by shifting substantial population
from agriculture to the industry and service sectors.
Table 2: Sectoral Share in GDP (in %)
Year Agriculture, Forestry,
and Fishing
Industry
(Manufacturing)
Services
2001-02 24.0 25.0 (14.8) 51.0
2002-03 21.5 25.8 (15.2) 52.7
2003-04 21.7 25.6 (15.0) 52.7
2004-05 20.2 26.1 (15.1) 53.7
2005-06 (QE) 19.7 26.2 (15.1) 54.1
2006-07 (RE) 18.5 26.6 (15.5) 54.9
Note: The data given here are not comparable with the data used in the Ninth Five Year
Plan and MTA Documents as the base year has been changed by CSO from 1993-94 to
1999-2000.
Table 3: Growth Rates
Sector CAGR in Ninth Plan CAGR in Tenth Plan
GDP 5.5 7.6
Agriculture, forestry,
and fishing
2.0 2.1
Industry
(manufacturing)
4.5
(3.8)
8.0
(8.7)
Services#
8.1 9.5
# Construction is included in Services. Figures in parentheses relate to manufacturing.
Source: Central Statistical Organization, quoted in GOI (2008b).
Source: Planning Commission (2008b) quoting Press Note, 31 May 2007, National
Accounts Statistics 2007, CSO.

Managing Resources for Inclusive Growth: India 2050
7
Table 4
Incidence of Unemployment among Rural Agricultural Households
(CDS basis)
Year Unemployment Rate (%)
1983 7.73
1993-94 9.50
1999-2000 12.29
2004-05 15.26
CDS: Current daily status
Source: Planning Commission (2008a)
Indian agriculture is currently among the lowest in the world in terms of
productivity (Table 5). The gross fixed capital formation in agriculture also fell from
3.1 per cent of GDP in the Sixth Plan period, (1980-85), to an estimated 1.9 per cent
in 2005-06. During the eleven-year period 1994-2005, the rate of increase in per
worker GDP in agriculture was only 2.24 per cent per annum as compared to 4.35
per cent per annum annual growth in overall GDP per worker. In view of emphasis
on high-value floriculture and horticulture for export, between 1990 and 2005, the
respective cropped areas under cereals and pulses fell from 103.3 mha and 24.7
mha to 97.7 mha and 22.5 mha.
Table 5
International Yield Comparisons across a Range of Agri-commodities
Yield in Wheat (kg/ha)
Country 2003 2004 2005 2006 % change „06
over‟ 03
China 3,931.96 4,252.07 4,275.39 4,455 13.30%
France 6,249.89 7,578.74 6,988.67 6,740.72 07.85%
India 2,610 2,713.18 2,601.57 2,618.96 0.34%
USA 2,971.67 2,902.91 2,902.17 2,825.28 -4.93%
Yield in Rice (kg/ha)
Country 2003 2004 2005 2006 % change ‟06
over ‟03
China 6,060.78 6,308.73 6,250.83 6,265.15 3.37%
India 3,117.66 2,975.06 3,152.08 3,123.08 0.20%
Indonesia 4,542.65 4,536.49 4,574.62 4,771.93 5.05%
Vietnam 4,638.74 4,855.26 4,883.32 4,891.43 5.45%
Source: FAO Production Yearbook, various years
Agricultural holdings also declined from 1991 to 2001. Given the status of the
agriculture sector it comes as no surprise that thousands of farmer suicides – a
national shame – continue unabated and it is reported that 40 per cent of the
farmers want to quit their traditional occupation.
The falling productivity in agriculture is being caused by several interlinked factors -
low productivity of land due to use of chemical fertilizers and pesticides over long
periods, soil and water pollution, inefficient use of land and water resources, poor
extension and advice services, declining public investment in agricultural research,
development and infrastructure, absence of land redistribution and emphasis on
modern seed technology. In fact, according to the report of International
Assessment of Agricultural Science and Technology for Development (IAASTD),

Managing Resources for Inclusive Growth: India 2050
8
progress in agriculture has been achieved in many cases at a high social and
environmental cost, making poor people vulnerable to high food prices amid
extremely low incomes (Steiner, 2008). The country provided about $1 billion in
subsidies to 550 million farmers in 2001, and is obliged by the World Bank and the
IMF to eliminate even this.
While the contribution of agriculture to GDP has fallen from 56 per cent of GDP in
1950-51 to 18.5 per cent in 2006-07, there have been corresponding increases in
the share of industry and services sector3
, as discussed above. Modern services
account for 15 per cent of GDP but employ 8 per cent of the workforce, whereas
traditional services account for 39 per cent of GDP and employ 20 per cent of the
workforce (Shariff 2007).
Industry and services are more often located in urban areas. As may be seen from
Table 6 below, the urban share of net domestic product has gone up from 37.65
per cent in 1971 to 51.7 per cent in 2000. It is clear that in future too an increasing
percentage of the NDP will come from urban areas and from the services and
manufacturing sectors. Also, as Table 7 shows, the percentage of the poor in urban
areas (19.9) is less than the percentage of the poor in rural areas (23.9).
Table 6
Urban Share of Net Domestic Product (NDP)
Year % Share
1970-1 37.65
1980-1 41.09
1993-4 45.73
1999-2000 51.70
Source: Central Statistical Organization (2007: 192-3).
Table 7
Percentage of Poor in Different Size Classes of Cities/Towns
City/Town Size 1993-4 1999-2000
Large Towns/Cities 18.4 14.2
Medium Towns/Cities 27.6 20.4
Small Towns 33.2 24.2
All Urban Areas 27.4 19.9
Rural Areas 35.7 23.9
Source: Kundu & Sarangi (2005)
The vast untapped reservoir of humanity in rural India is waiting to be
integrated into the regional, national (and therefore, stepwise, into the global)
economy. This integration is urgently necessary for economic as well as for
ethical reasons as the millions of marginalized people continue to suffer due to
wrongful policies and lack of a supporting infrastructure.
Our ex-president Abdul Kalam has been vigorously advocating for the „Providing
urban facilities in rural areas‟ (PURA) approach to develop our villages and take
3 Services sector can be broken up into modern and traditional categories, the first covering IT,
communications, wholesale business, banking and insurance and the second occupations such as
manual transportation, small hotels and restaurants and artisanal professions.
Managing Resources for Inclusive Growth: India 2050
9
pressure off from big urban areas but this approach has not been seriously taken
up by the government or policy-makers.
4. LAND AVAILABILITY AND COMPETING DEMANDS
Since land is limited and its demand for various purposes is increasing in an
unplanned manner it is extremely important to plan for appropriate land use for the
future.
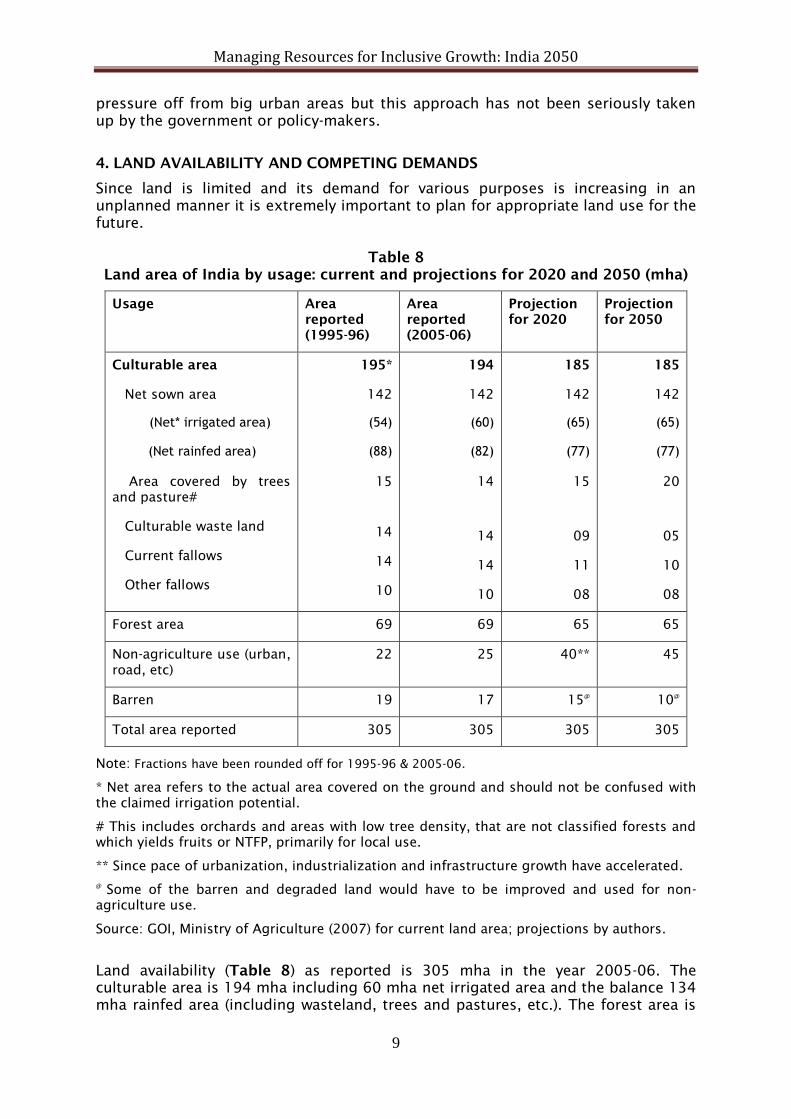
Table 8
Land area of India by usage: current and projections for 2020 and 2050 (mha)
Usage Area
reported
(1995-96)
Area
reported
(2005-06)
Projection
for 2020
Projection
for 2050
Culturable area
Net sown area
(Net* irrigated area)
(Net rainfed area)
Area covered by trees
and pasture#
Culturable waste land
Current fallows
Other fallows
195*
142
(54)
(88)
15
14
14
10
194
142
(60)
(82)
14
14
14
10
185
142
(65)
(77)
15
09
11
08
185
142
(65)
(77)
20
05
10
08
Forest area 69 69 65 65
Non-agriculture use (urban,
road, etc)
22 25 40** 45
Barren 19 17 15@
10@
Total area reported 305 305 305 305
Note: Fractions have been rounded off for 1995-96 & 2005-06.
* Net area refers to the actual area covered on the ground and should not be confused with
the claimed irrigation potential.
# This includes orchards and areas with low tree density, that are not classified forests and
which yields fruits or NTFP, primarily for local use.
** Since pace of urbanization, industrialization and infrastructure growth have accelerated.
@
Some of the barren and degraded land would have to be improved and used for non-
agriculture use.
Source: GOI, Ministry of Agriculture (2007) for current land area; projections by authors.
Land availability (Table 8) as reported is 305 mha in the year 2005-06. The
culturable area is 194 mha including 60 mha net irrigated area and the balance 134
mha rainfed area (including wasteland, trees and pastures, etc.). The forest area is

Managing Resources for Inclusive Growth: India 2050
10
69 mha while non-agricultural area is 25 mha and barren area is 17 mha. In recent
years the pace of urbanization, industrialization and other infrastructure
requirements has started to move faster than assumed earlier and as such these
uses are likely to occupy more land than envisaged earlier. There is a possibility
that the culturable area and the forest area would be encroached upon. It is,
therefore, necessary to have an integrated planning of non-agricultural use so as
not to affect the agricultural and forest production to ensure food security and
environment. Now there is also a demand for producing petroleum products like
diesel and petrol from crops. A public regulatory authority (PRA) needs to be set
up to plan in advance, regulate land use, inform all concerned, and then
monitor the use of land4
.
The concentration of land ownership is also intensifying, as seen in the
unprecedented race for acquiring agriculture land in all region of the country for
creation of SEZs, setting up of industry, hydro projects, thermal power stations,
road transport and disposal of waste. The repercussions of this land takeover are
extremely alarming.
The haphazard use of land is caused by a lack of integrated policy for land use for
various purposes. The state governments and private players use the areas owned
by them according to their requirements. There are no rules and regulatory acts to
encourage an integration of the requirements for various purposes. At present the
demand has suddenly arisen for:
(a) expansion of cities
(b) industry and infrastructure development
(c) defence and railways
(d) agriculture – food, bio-fuel, cash crop, orchards
(e) forest and its products
(f) mining – the major ones are iron ore for steel, bauxite for aluminium and coal.
5. URBANIZATION
The historical trend of growth of urban population is being fuelled by the massive
economic growth in the post-globalization period. As a consequence, the demand
for land for various purposes is increasing in an unplanned manner.
Tables 9 and 10 below provide basic information on urbanization trends and urban
population in India over the last few decades.
The UN report on World urbanization prospects (UN, 2005) predicts 55 per cent of
Indians will live in cities by 2050.
Table 9
Total and Urban Population (in millions) in India
Year Total Urban Per cent
1951 361.09 62.44 17.3
1961 439.23 78.94 18.0
1971 548.16 109.11 19.9
4 For a brief discussion and outline on the design and working of a public regulatory system operating
at multiple levels in the context of water resources, see Kathpalia and Kapoor (2006).

Managing Resources for Inclusive Growth: India 2050
11
1981 683.33 159.46 23.3
1991 846.39 217.55 25.7
2001 1,027.02 285.35 27.8
2007* 1,134.25 332.01 29.3
Source: ADB (2009)--Estimated using United Nations (2005) projections of growth rates.
Table 10
Some basic facts of India’s Urbanisation: 2001
Total urban
population
285 million
percentage to total population of India (27.78)
percentage to world‟s urban population (10.02)
percentage to Asia‟s urban population (21.10)
larger than the total population of small countries like France,
Germany
larger than the total population of big countries like Brazil, USA
larger than the total population of parts of continents like
Eastern Africa, Western Asia, Western Europe
larger than the total population of the whole continent of
Australia
Top population of
35 million-plus
cities
107.88 million
percentage to total urban population (37.8)
these 35 cities belong to the large group of 206 million-plus
cities of Asia
Total population of
393 class-I cities
195.95 million
Including million-
plus cities
Percentage to total urban population (68.67)
Source: Sivaramakrishnan et al (2005)
According to Sivaramakrishnan et al (2005) natural increase accounts for the
principal share of urban growth of a little under 60 per cent. The share of new
towns within the context of the census is less than 10 per cent. Territorial
expansion of urban areas provides another 13 per cent whereas net rural-urban
migration has contributed only about 21 per cent to the overall urban growth.
The study further brings out that class I cities and towns have grown at a faster
rate. The bulk of India‟s urban population of about 69 per cent lives in such cities.
The number of metropolitan cities has also gone up to thirty-five from twenty-three
with 38 per cent of the urban population living in such cities. Large city growth
has therefore been the most significant component of urban growth.
6. UNEMPLOYMENT AND UNDERUTILIZATION OF HUMAN RESOURCES
Low productivity of the country‟s huge rural agrarian economy has created large
scale unemployment and underemployment in the country. It is a paradox that with
the opening of Indian economy and subsequent economic growth the
unemployment rate in the country has been going up. It was 6.06 per cent in 1993-
94, 7.31 per cent in 1999-2000, 8.28 per cent in 2004-05 and 8.36 per cent in

Managing Resources for Inclusive Growth: India 2050
12
2006-07. However, this was primarily due to a sharp drop in the pace of creation of
work opportunities in agriculture, as noted in Table 4 above. However, according to
Planning Commission projections, the unemployment rate is expected to fall to 4.83
per cent in 20011-12 and to 1.12 per cent in 2016-17 (all figures in this section are
from Planning Commission 2008a).
India has one of the largest labour forces in the world but the least number of
skilled workers. According to the NSS 61st
round, among persons aged 15-29
years, only 2 per cent are reported to have received formal vocational training. The
proportion of trained youth in India is one of the lowest in the world. The
corresponding figure is 96 per cent in Korea, 75 per cent in Germany and 80 per
cent in Japan, for instance. Moreover, even in the next few years 80 per cent of the
new entrants to the workforce will have no opportunity for skill training as the
training capacity in the country is only 3.1 million per annum against 12.8 million
new entrants to the workforce per annum (Planning Commission 2008a).
Also, 39 per cent of the Indian labour force is illiterate, 25 per cent has had
schooling up to the primary level while 37 per cent has had schooling up to the
middle or higher level. Consequently, although we have the youngest population
in the world (median age in 2000 – 24, as compared to 30 for China, 38 for
Europe and 41 for Japan), at least 70 per cent of the workforce in both rural
and urban areas does not possess any identifiable marketable skills.
The vast unskilled, uneducated workforce not only is a huge burden for the
planners, it also undermines the desired global competitive strength and exposes
the economy to the risk of stagnation. The growing mismatch between the
size/quality of educated manpower and the demands of newly emerging sectors is
going to be a serious challenge in the next decade. And as Shariff points out, due to
increase in domestic demand a substantial labour and skill pool is needed to
sustain even the domestic markets. For instance, Nasscom (the National Association
of Software and Services Companies) estimates a national shortage of almost 5
lakhs software engineers by 2010. This, in turn, exerts pressure on the global
demand for labour, either manifested by fewer people leaving India or a rise in
exports of manufactured goods and services (Shariff 2007).
PART II - TOWARDS AN ALTERNATIVE MODEL OF DEVELOPMENT
The above problems being faced by a society that aims at becoming an economic
power and at the same time wants to take the fruits of economic development to
the most underprivileged citizen demand concerted policies based on long-term
forecasts. The development history of the country shows that the host of
mismanaged subsidies and other development policies have not helped in
improving the condition of the agriculture-dependent population and in reducing
inequality. As Khosla and Dey (2006) observe, the rural population is caught in a
vicious development trap, where adequate levels of services are not provided in
rural areas because of problems on both the demand and the supply side. On the
demand side, the population has a low ability to pay for them. The aggregate
demand for services is therefore low. On the supply side, because of lack of
adequate infrastructure, the cost of services demanded and supplied leads to high
cost of services and often a total non-provision of these services. This leads to low
effective demand for goods and services, which feeds back to low incomes.
Similarly, a number of commentators have observed that what villages need most is
good transportation links to the markets and services in urban areas. For instance,

Managing Resources for Inclusive Growth: India 2050
13
Indiresan (2008), who is a strong advocate of the PURA approach along with ex-
President Abdul Kalaam, emphasizes this point.
The key to poverty removal and reduction in inequality is therefore, economic
empowerment of people by providing the essential infrastructure, skills and services
to the poor, developing their entrepreneurship and enabling access to markets
through better transportation and connectivity. At the same time, it is necessary to
have an integrated planning of both agricultural and non-agricultural sectors so as
to increase agricultural production in order to ensure food security and conserve
the environment. This has to keep in view the increase in population and its
stabilization by 2050. Through this integrated planning the major inefficiencies of
the rural economy can be tackled relatively easily by making simple changes to the
system so as to increase productivity. Khosla and Dey argue that even a modest 10%
increase in economic productivity would mean 14 billion US dollars of additional
income (see section 7.1 below). This could potentially raise the country‟s growth
rate above 10% (Khosla and Dey, 2006).
7. RE-ENGINEERING URBANIZATION
Since most of the jobs are being created through expansion of industry, services
and trade, which are largely urban-based activities at present, it is obvious that the
population from the villages would either shift to urban areas or travel to these
areas if they are nearby. According to Khosla and Dey (2006), urbanization of a
country‟s population is both a cause and a consequence of economic development.
The problem, therefore, is how can one urbanize the population of rural India
without the attendant rural to urban migration? Clearly the solution is to urbanize
the rural population in place. This urbanization can be achieved in place only by
bringing to the rural population all the services and functionalities that are normally
only available in cities to the rural area itself. Table 11 below lists the goods and
services for which rural people visit towns and cities. Table 12 lists the population
thresholds for selected services in India.
In the light of the above, we argue that the foremost strategy in working out a
rejuvenating rural economy and ushering a new wave of agriculture productivity and
economic growth is a complete restructuring and reorienting the current rapid
urbanization process. This orientation needs to be achieved through integrated
planning with efficiency and cost effectiveness in the least time (with improved
logistics and implementation schedules) as seen, for instance, in building of Metro
Rail in Delhi. Indeed, reverse migration and stabilization of economically
vulnerable populations at their very roots can be a realistic proposition due to
emerging social, economic, technological and environmental changes. In making
this argument we disagree with the policy conclusion arrived at by
Sivaramakrishnan et al that special efforts for the growth of small and medium-
sized towns are futile.5
5 According to Sivaramakrishnan et al (2005), “there is not much merit in pursuing a program for
small and medium towns. While the case for improving urban services is common across the board, a
program like the Integrated Development of Small and Medium Towns (IDSMT) has not succeeded
in reducing or deflecting large city growth. Whether in comparatively developed states like
Maharashtra or Punjab or in other states like Bihar or Rajasthan, it is seen that the growth rates of
IDSMT towns continue to be below the average growth rates for the small and medium towns in the
state and well below the rate of class I cities.”

Managing Resources for Inclusive Growth: India 2050
14
Table 11
List of Services and Goods for which Rural People Visit Towns/Cities in India
I. Consumer Goods
Kerosene
Beedi / Cigarette / Tobacco
Tea powder
Soap (washing / toilet)
Footwear (leather / plastic)
Cotton cloth (dhotis / saris)
Books (notebook / texts)
Electrical goods (bulbs, battery, torch)
Medicine (ayurvedic, allopathic)
Woollen clothing (blankets, sweaters)
Grocery (sugar, salt, edible oils, dal)
Tea and snacks
II. Durable Consumer Goods
Radios / Transistors / TV
Bicycles
Furniture (cots / chairs / tables)
Utensils (aluminium, brass, copper,
bronze)
Jewellery (silver, gold)
Hardware
III. Farm Inputs
Seeds
Fertilizers
Pesticides / insecticides
Farm implements (diesel oil / petrol)
Farm machinery (pump sets, diesel
engines, tractors)
IV. Construction Materials
Cement
Wood
Bricks and tiles
Steel rods and fabricated structures
V. Repair of Equipment
Tractor repair
Pump and motor repair
Diesel engine repair
Cycle repair
Radio repair
Watch repair
VI. Education
Primary school
Middle school
Secondary school
Senior school / junior college
College / technical training institute
University
VII. Medical Services
Government dispensary
Govt. hospital (in-patient treatment)
Private allopathic doctor
Maternity centre
Veterinary services
VIII. Public Services
Courts (tehsil / district)
Tehsildar‟s office
District commissioner‟s office
Block level offices
Patwari / village muncif
Gram panchayat office / meeting place
Post office
Telegraph office
IX. Sale of Farm Products
Grain
Cash crops (variable)
Vegetables
Milk / ghee
X. Credit
Primary credit societies
Land mortgage banks
Scheduled banks
Co-operative banks
Money lenders
XI. Entertainment
Cinemas
Fairs
Festivals
XII. General Services
Carpenters
Blacksmiths
Goldsmiths
Tailors
Cobblers
Barbers
Priests
Astrologers
XIII. Social Needs
Marriages and related affairs
Friends / relatives
Social gatherings / functions
Religious gatherings / functions
Pilgrimage
Caste panchayats
Source: Ramachandran (1989)

Managing Resources for Inclusive Growth: India 2050
15
Table 12
Population Thresholds of Selected Services in India
Selected Services Population Thresholds
Daily newspapers 55,000
District headquarters 52,000
Colleges 25,000
Tehsil headquarters 15,000
Cinema houses (permanent) 10,500
Banks 8,000
Secondary schools 5,000
Dispensaries (allopathic) 5,000
Cloth shops 17,00
Tea shops 1,100
Grocery shops 750
Tailor shops 750
Barber shops 750
Primary schools 500
Note:
1. Population thresholds refer to the population of the centre in which they are offered.
2. The estimates of thresholds are based on author‟s field studies.
Source: Ramachandran (1989)
One way to address this problem is to initiate reverse migration through creation of
in-situ work opportunities in an autonomous and integrated manner. For achieving
this, what is now required is to create small towns. These will be created 50 to
100 km from existing cities and will cater to the needs of their population and
to villages within a 20 km radius. We propose that 40006
small towns should be
established -- either by developing existing towns (of 50-60 thousand
population) or by building new ones, with average one and a half lakh
population -- within the next 10 years. These towns will be specially designed
to develop manufacturing and marketing and agricultural processing
infrastructure as suitable to the local conditions, along with building of power,
communication and transport infrastructure, provisions of skills, services and
comprehensive network of civic amenities of high quality. The planning for each
location will ensure creation of facilities for education and health. Similarly effort
has to be made towards the designing of „nano‟ houses and other day to day
necessities which are within the purchasing power and requirement of the
inhabitants. In this re-modeling of urbanization, 60 crores of the population out
of the total of 160 crores as estimated in 2050 will be in small towns so that no
village is beyond 20 km from smaller towns (except in a few remote hilly or
desert areas, etc.).
Each of the 4000 towns planned in this way will become a focal point attracting
necessary private investments and expertise. In fact, it is estimated that an average
population of one and a half lakh can provide a viable proposition for private
6 The number of blocks in the country is about 7000.

Managing Resources for Inclusive Growth: India 2050
16
investments. According to Deveshwar, CMD of ITC, for instance, “There are 6.4
lakhs villages and 60% of these villages have fewer than 1,000 people. So income
levels in these villages will not justify creating infrastructure and connectivity for
these low-density settlements. That is why very few companies service below-
100,000 markets. So our model-e-Choupal-at one level helps the farmer improve his
productivity and access to markets, and at another level, we are converting them
into an economic entity and creating markets for tomorrow” (www.livemint.com, 25
May 2009). Such facilities would also encourage consolidation of smaller villages,
say with a population of 5000 or less, into larger settlements, on a voluntary basis.
If infrastructure like power, communication, info-tech, education, health can be
developed and facilitated by the government, then private investment will also
flow faster. This development model would become inclusive and homogenous so
that GDP growth will get more evenly distributed. An urbanized population spread
more evenly over a large number of cities would be a better option for the future
than a handful of overcrowded mega cities. Orienting urbanization this way will
provide work opportunities at the grassroots so that the overcrowded cities are
decongested.
Table 13 below gives the suggested distribution of population of 160 crores (1.6
billion) for the year 2050, while Table 14 gives the estimated land requirement for
different non-agricultural purposes in 2050.
Table 13
Ideal Population Distribution and Land Required in Year 2050
Type of
settlement
Population
per
settlement
Number of
settlements
Total
population
2050
Population
density/
hectare
Land
requirement
(mha)
Mega cities 2 crore 10 20 crore 400 0.5
Big cities 50 lakh 24 12 crore 400 0.3
Cities 10 lakh 100 10 crore 400 0.25
Small towns 1.5 lakh 4000 60 crore 200 3.0
Bigger
villages
10
thousand
6,000 6 crore 100 0.6+0.1 for
livestock
Small
villages
2 thousand 260,000 52 crore 100 5.2+1.0 for
livestock
Total 4,134 urban +
266,000 rural
160 crore 10.95 mha
Note 1: In this scenario 58 crore population, 36.25 per cent, will be rural, and 102 crore
population, 63.75 per cent, will be urban.
Note 2: About 800 districts are expected by 2050 (as against 676 districts at present). A
little over half of these districts will be rural districts, without major cities.
Note 3: With urbanization and consolidation of villages, total number of villages is expected
to come down to 266,000 from 638,000 at present.

Managing Resources for Inclusive Growth: India 2050
17
Note 4: A typical rural district will have 7 to 10 small towns, 10 to 15 bigger villages and
500 small villages. The majority of small towns and bigger villages (about 75%) will be
located in the predominantly rural districts, while about 25% of small towns and bigger
villages will be located in the more urbanized districts.
Currently, some of these benefits have already started moving down from cities to
smaller cities and towns. Some businesses of IT and communication, agro-
processing and small industries have started moving to the backwater moffusil
areas mainly because of cheaper infrastructure facilities being provided by the
state. Many non-metros have benefited from these changes. As local economies
grow in size, markets too will diversify and more jobs will be created in and around
these cities. States like Kerala and Tamil Nadu have demonstrated that this could be
achieved. These two states have built a seamless network of small towns and
villages well connected by roads and communication links.
Table 14
Land requirement for different non-agricultural purposes, 2050*
1 Households 9.5 mha
2 Industries 15.0 mha
3 Roads, rail, airport & seaport 15.0 mha
4 Mining, rivers, etc. 5.5 mha
Total 45.0 mha
* Refer to Table 8 above
Source: Authors‟ estimates
The Kerala government has also recently announced that it is working on a 25-
year land use master plan. This draft policy, expected to be presented to the
state cabinet in November-December 2009, reportedly incorporates a number
of policy suggestions made in this paper. For instance, it will ration land for
housing, agriculture and industry, to boost food production and to avert an
‘imminent eco catastrophe’ (Ajayan 2009).
7.1 Rural Infrastructure & Services Commons (RISC): Khosla and Dey Model
Khosla and Dey (2006) have also suggested a similar model for distributed
urbanization for the country. Named as RISC (Rural Infrastructure & Services
Commons), this model is built around development of 5000 urbanized clusters each
covering within its command, population living within a 40 kilometers circle so that
one can cover most of the rural population. Although similar to our proposal, this
model talks about urbanized clusters with a population of one lakh while we are
proposing towns with one lakh population to provide infrastructure and services to
villages within a 20 km radius. Most of the population in each circle would be about
20 km from the cluster center, well within a bicycle commute of such a center.
These 5000 cluster centers could provide the basis for small, but critical mass
towns around which the rural economy could develop. In fact, much of this
infrastructure exists around existing small Tier III/IV towns (about 4000 of them),
the 5000 or so railway stations the 5000 „haats‟ or informal weekly markets in the
country,
These clusters are to be the focus of most rural investment rather than scattering it
among individual villages. This will result in a critical mass for each cluster of 100
villages or 100,000 villagers rather than a larger number of sub-critical mass
Managing Resources for Inclusive Growth: India 2050
18
individual villages. As a result, the money will get a substantially higher rate of
return and spurring economic growth. According to the authors, these clusters
could provide the infrastructure for power, communication, healthcare, education
and government services to kick-start market economy; create sufficient demand
for goods and services so the system can become autocatalytic. The idea here is to
make available at the center of such a circle all the services and functions that are
normally only available in a city.
Furthermore, the core set of infrastructural services can support a full set of
appropriate services critical for rural economic development. These services will be
reliable and inexpensive so that users who require these as part of their inputs can
use them easily and efficiently at optimum prices. The critical mass of consumers
and producers together with cost-effective infrastructure, that reduces the cost of
services, will achieve autocatalytic criticality and hence significantly enhanced
economic growth.
Economic Validity of Distributed Urbanization: Khosla and Dey have also
indicated the economic returns possible from the RISC model. Assuming the current
average daily per capita income in rural areas of 1 US dollar (or 360 USD for the
whole year), then the annual income of the 100,000 target population of a single
RISC cluster will be about 36 million US dollars (equivalent to 1620 million or 162
crore rupees, at current conversion rates). Assuming that the presence of the RISC
actually increases productivity and economic efficiency so that the economic output
of the population goes up by say 10%, the increase in economic output will be
roughly 3.6 million US dollars in a year (Rs 16 crore approximately). If half of this
increased output is considered as increased income of the population, then nearly 2
million US dollars per year will be in hand to pay for the services available at the
RISC. Therefore, the annual gross revenues per RISC will be around 2 million US
dollars (Rs 9 crore approximately) and the aggregate revenue for about 5,000 RISCs
is approximately 10 billion US dollars (Rs 450 billion or Rs 45,000 crores) in a year.
8. CONDITIONS FOR ESTABLISHING EFFICACY OF DISTRIBUTED URBANIZATION
MODEL
The design of 4000 small-town urbanization model will require creation of several
conditions to establish its efficacy for delivering self-sustaining development at the
grassroots. These conditions are: enhancing agriculture productivity in the
surrounding rural areas of a town, rational and sustainable use of land and water
resources, bringing about occupational shift of people as per the needs of the town
economy, preparation of entrepreneurs, creation of infrastructure and various
services and access to markets (local/ regional/ national/ global).
The identification of towns can be done on the basis of population of 50,000 to
70,000 which could then go up to about 1.5 lakh by the year 2050. The
population of 1 to 1.5 lakh has been considered suitable because it could
attract private investment with a reasonable return in the field of education,
health institutions, skill training of various kinds (there is huge shortage of
masons, carpenters, electricians, mechanics etc. already) and all other facilities
which are available in bigger towns. The basic infrastructure would have to be
initiated and facilitated by the government. A large number of ITI and Engineering
colleges by the government are being setup and being improved. A large number of
such colleges/institutes are also being approved in the private sector. Most of these
could be located in small towns (one lakh population). Even industries and other

Managing Resources for Inclusive Growth: India 2050
19
professionals with suitable skilled staff would find it attractive to stay in small
towns and provide services to villages. As the recent industrial and SEZ projects
have indicated, they want to be located near the bigger towns so as to be able to
provide all facilities to their staff. If good facilities are provided in small towns then
such projects and industries will be willing to come up in small towns. Even doctors
and health staff with all professional and personal facility would be willing to stay
there and serve the villages better through mobile vehicles.
The land allocated for efficient use should be such that both urbanization and
industrialization grow vertically rather than horizontally as indicated in the above
table. All projects should indicate land required and how efficiently it is being used,
when submitted for environment clearance.
Recently UP Government has issued a notification calling for qualification for
planning and development of new townships in Uttar Pradesh. This only indicates a
permissible F.A.R. 2.5 under total area of township. There is no mention of the
population density in these townships. Similarly, Haryana Government is being
pressed to increase the density of population from 625 persons per hectare to 1500
with the higher ground coverage area from 35% to 50%, in order to build smaller,
more affordable homes, in the Gurgaon area. This indicates the immediate
necessity of setting up Public Regulatory Authority which could frame the rules
keeping all aspects in view and then monitor the situation and the
implementation of those rules. Some state governments are setting up new
townships that are planned and designed in an integrated way, considering all land
use aspects and requirements. Punjab government, for instance, is setting up the
Mullanpur township in Greater Mohali region with a 25 year Master Plan (Jurong
Consultants 2008).
8.1 Population Sustainable on Agriculture Land
The table below gives the operational holding required under irrigated, rainfed and
trees and pastures required to sustain a family of 5 persons with higher productivity
using new techniques. In the case of forest areas only 50 million ha has been taken
into account for small income groups, who depend upon minor forest produce
(MPF) while the balance 15 mha would generate higher income through timber.
Table 15
Population Sustainability and Minimum Requirement of Land: India 2050
Minimum land
required for decent
living per family of 5
Total area
(mha)
Population
sustainable
(million)
Irrigated land 4 ha 65 81*
Rainfed land 10 ha 75 37.5
Trees & pastures 4 ha 20 25
Forest areas 5 ha 50** 50
Total population sustainable on agriculture and allied 193.5
Population sustainable on other non-farm activities and
farm labour in villages
206.5
Total population in all villages 400
* Rounded off from 81.25 million
** Only 50 mha has been taken into account for small income groups (MFP); the balance 15
mha would generate higher income because of timber use.
Source: Authors‟ estimates
Managing Resources for Inclusive Growth: India 2050
20
8.2 Bring about Agricultural Turn-around
An essential requirement for the development of a small town as enterprise
will be the development of agriculture in its surrounding ‘feeder villages’
located within a circle of 20 km radius. It will require instilling a „new green
revolution‟ through adoption of a package of green practices. Productivity per unit
of land will have to be increased through better seeds, bio-fertilizers and bio-
pesticides, better crop management as per agro-climatic and soil zones. It will also
require creation of bigger operational units without change of land ownership for
reducing the cost of production through contract system, collective agriculture,
product processing and storage to avoid wastage and marketing system and
logistics. Pollution of land, soil and water, and damages to crops through industrial
waste, especially from small units and coal dust, will be a top priority through
proper treatment at source and heavy penalty for non-compliance.
The report of International Assessment of Agricultural Science and Technology for
Development (IAASTD) also recommends that agricultural science place greater
emphasis on safeguarding natural resources and on „agro-ecological‟ practices,
including the use of natural fertilizers, traditional seeds and intensified natural
practices and reducing the distance between the producer and the consumer. At
present about 30 per cent of the produce is wasted between the producer and the
consumer. Ways to discuss this wastage are discussed below in sections 8 and 9.
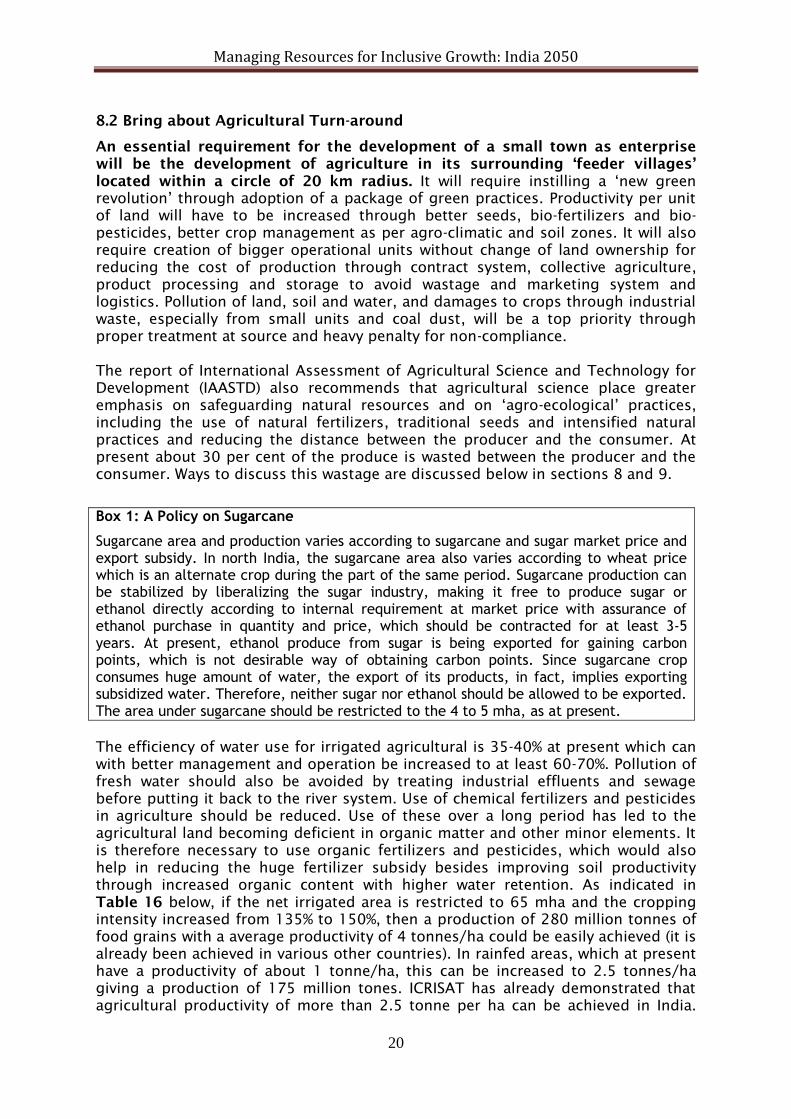
Box 1: A Policy on Sugarcane
Sugarcane area and production varies according to sugarcane and sugar market price and export subsidy. In north India, the sugarcane area also varies according to wheat price which is an alternate crop during the part of the same period. Sugarcane production can be stabilized by liberalizing the sugar industry, making it free to produce sugar or ethanol directly according to internal requirement at market price with assurance of ethanol purchase in quantity and price, which should be contracted for at least 3-5 years. At present, ethanol produce from sugar is being exported for gaining carbon points, which is not desirable way of obtaining carbon points. Since sugarcane crop consumes huge amount of water, the export of its products, in fact, implies exporting subsidized water. Therefore, neither sugar nor ethanol should be allowed to be exported. The area under sugarcane should be restricted to the 4 to 5 mha, as at present.
The efficiency of water use for irrigated agricultural is 35-40% at present which can
with better management and operation be increased to at least 60-70%. Pollution of
fresh water should also be avoided by treating industrial effluents and sewage
before putting it back to the river system. Use of chemical fertilizers and pesticides
in agriculture should be reduced. Use of these over a long period has led to the
agricultural land becoming deficient in organic matter and other minor elements. It
is therefore necessary to use organic fertilizers and pesticides, which would also
help in reducing the huge fertilizer subsidy besides improving soil productivity
through increased organic content with higher water retention. As indicated in
Table 16 below, if the net irrigated area is restricted to 65 mha and the cropping
intensity increased from 135% to 150%, then a production of 280 million tonnes of
food grains with a average productivity of 4 tonnes/ha could be easily achieved (it is
already been achieved in various other countries). In rainfed areas, which at present
have a productivity of about 1 tonne/ha, this can be increased to 2.5 tonnes/ha
giving a production of 175 million tones. ICRISAT has already demonstrated that
agricultural productivity of more than 2.5 tonne per ha can be achieved in India.

Managing Resources for Inclusive Growth: India 2050
21
Thus the total production can be 455 million tonnes in 2050. The area sown at
present is 142 mha, which should not be allowed to be decreased. In fact some of
the degraded land of all types should be improved and reclaimed.
Table 16
Production of food grains
S.
No.
Unit Present
(2005-2006)
2020 2050
1. Net area sown mha 142 142 142
2. Gross cropped area mha 194 210 220
3. Gross area used for food
grains
mha 122 130 140
4. Percentage of area irrigated percent 46 50 50
5. Gross irrigated area mha 56 65 70
6. Average Productivity (per ha)
of Irrigated Area
tonne/ha 2.6 3.5 4
7. Production of Food
(Irrigated)
million
tonne
146 227 280
8. Rainfed Area Under Food
Crop
Mha 66 65 70
9. Average Productivity (per ha)
of Rainfed Area
Tonne 0.95 2.00 2.50
10. Food Production (Rainfed) million
tonne
63 130 175
11. Total Food Production million
tonne
209 357 455
12. Efficiency of Water Use
(Ground & Surface)
percent 40 70 70
13. Intensity of Cropping in
Irrigated Area
percent 135 150 150
Note: 1. Fractions have been rounded off.
2. In order to achieve above production it would be essential to increase the water use
efficiency from 40% to 70% (taking surface and groundwater together) and increase the
intensity of cropping in irrigated area from 135 to 150, which are both achievable with
concerted effort.
3. Food grains include rice, jowar, bajra, maize, wheat, barley, gram, tur/arhar.
Source: Figures for 2005-06 are from GOI, Ministry of Agriculture (2007 - Tables 4.1 to 4.4
and 14.4).
8.3 Water resources development and use
Development of rural economy around a small town as unit also demands rational
use of water resources. In 11th
Five-Year Plan, the irrigation sector, both central and
in the states, has been provided funds as follows:
Table 17
Water Resources: Overall outlay for 11th
Five-Year Plan (Rs crore)
State plan 182050
State sector schemes - Accelerated irrigation
benefit program (AIBP) and others
47015
Central plan 3246
Total 232311
Source: Planning Commission (2008b)

Managing Resources for Inclusive Growth: India 2050
22
The corresponding physical targets for work on major, medium and Extension,
Renovation, and Modernization (ERM) projects are as follows (Table 18).
Table 18
Physical Target
No. of Projects included in Eleventh Plan Major Medium ERM*
Completion of Projects
Tenth Plan projects spilling into Eleventh Plan 166 222 89
New projects of Eleventh Plan 78 145 86
Total 244 367 175
Projects likely to be completed in Eleventh Plan 72 133 132
Source: Planning commission (2008b)
There are many unapproved projects which are being funded by state government as
indicated by Planning Commission.
* ERM – Extension, Renovation, and Modernization
Necessity of ERM projects arises due to negligence of maintenance and repairs to
existing projects on yearly basis. This is because the state governments are unable
to provide funds from the normal budget (non-plan) while when the stage of EMR
arises, these projects get funds from the Plan sector. In view of the above, no new
major or medium projects should be taken up but the amount could be more
usefully spent on ERM projects and effort made to complete all the spillover
projects. Some of the Plan funds could also be spent on improving management
and efficiency on other identified existing projects where maintenance and repair
are being neglected so as to avoid these projects reaching the EMR stage.
Moreover, due to major rainfall occurring in 4-monsoon months, storages are
necessary for distributing water throughout the year. New storage should be mostly
by recharging groundwater through water harvesting of various kinds, maintaining
minimum required river flows and using small storages on existing natural and
man-made drainages, and avoiding pollution of water.
In future, major and medium dams should be constructed for generating power and
flood moderation only and drinking water where absolutely necessary. The power
should be generated for base load mostly during the whole year, to help maintain a
certain minimum flow in the river downstream to make it alive. This necessity has
been now understood in USA and they have already started operating the existing
hydel projects for base load requirement, as stated by Prof. Geoffrey E Petts of
University of Westminster. No stretch of natural drainage, from a small stream to
a river should be without minimum flow of water with 90% probability and no
untreated water should be released from industry or urban areas. Climate
change is bound to make some changes in the occurrences of rainfall, in location,
quantity, frequency and timing. But if the development of water resources is spread
all over ranging from small water harvesting structures to big dams with efficient
management and prevention of pollution, the impact of climate change can mostly
be taken care of.
The area under the command of the existing projects (where water is not reaching
due to whatever reason) should be reviewed and every effort made to supply water
by efficient management, otherwise alternative means of livelihood should be
encouraged or provided through training of youth in suitable skills. Even the
projects under construction should be reviewed accordingly. This would also reduce
repair, maintenance and management costs. The area taken out of command could

Managing Resources for Inclusive Growth: India 2050
23
use groundwater along with water harvesting wherever possible. However effort
should be made to provide an alternative livelihood before putting them out of
command.
Table 19
Water Requirement for Various Sectors
Sector NCIWRD - Water Demand in bcm
2010 2025 2050
Irrigation 557 611 807
Drinking water 43 62 111
Industry 37 67 81
Energy 19 33 70
Others 54 70 111
Total 710 843 1180
Source: Planning Commission (2008b)
The National Commission on Integrated Water Resources Development (NCIWRD)
has indicated the water requirement for various sectors (Table 19). There is a
necessity to improve the efficiency of water use in all sectors by recycling, reuse
and avoiding pollution. However the maximum scope remains in the irrigation
sector where a number of steps should be taken as indicated elsewhere in the
paper. Since the net irrigated area could be restricted to 65 mha with 150%
intensity of irrigation and 70% irrigation efficiency to save upto 10-15% of
water (while ensuring food security - see Table 8 above), no more water should
be diverted from rivers. Now the focus should be on management, operation
and maintenance of existing systems rather than new irrigation projects. Since
the livelihood opportunities are more in the services and industrial sectors,
new irrigation projects should no longer be considered as means to remove
regional imbalances.
8.4 Infrastructure, Services and Market Access
Over the next 15 years, India would need something like 50 billion sq ft of new
housing and billions of sq ft of commercial construction. Much of this will have to
be located in currently rural areas. The required investments will be astronomical.
Therefore, the need for coordination, allocation of capital and logistics is critical.
The features of the suggested small-town model in terms of economic viability,
scale of operation and networking among the towns themselves will be ideal to
meet the needs of providing affordable commercial infrastructure and housing in
rural India. As discussed above, the small towns will serve as service centers to
cover all villages within a radius of 20 kilometers in order to provide education,
health, communication, financial and other services that are being provided in the
larger towns and cities at present.
Market Access: The non-agricultural production of rural India is extremely diverse.
The internet has lowered the barriers significantly for market access. Even small
producers of handicrafts can reach consumers all the way across the world.
Information about products and their characteristics that suit the market most will
help in driving the rural economy to produce what is needed. This will generate
employment and preserve traditional skills, while tuning them to national and
global demand. In this connection, the CII-Ministry of Panchayati Raj initiative on
Rural Business Hubs is excellent (www.rbh.in).

Managing Resources for Inclusive Growth: India 2050
24
8.5 Human Resources: Bringing about Productive Occupational Shift
It has been estimated by various institutions that in another 10-15 years time India
could be the country where the young population with skill and knowledge would
be available, which most of the other countries except populous countries like
China and Indonesia may require. It should be our aim to train the younger
generation right from now for our own economic growth besides providing services
to other countries through export of skilled manpower. A big chunk of our human
resources are and would be available in smaller towns and surrounding
villages. It would be economical to train them in smaller towns rather than
bigger towns. Some industries and services have already started moving in this
direction and government and private effort should be combined to accelerate
the process.
1. In the table below on purchasing power of various sections of society, five
categories have been mentioned, namely, top, upper middle class, lower middle
class, poor (above poverty line - APL), poorest (below poverty line - BPL). In order
that the poor are enabled to have a dignified existence, our target should be
that in the next few decades we gradually eliminate last two categories by
increasing the income levels of the poor (Table 20 below). This was done in the
railways long time back by eliminating the third class. Our effort should be that
all those currently under the categories of the poor should be able to move up at
least to the lower-middle class level. We should try that their income increases
up to the limit which is tax free (at present this limit is Rs 2.5 lakh/annum).
2. It could be possible to achieve this by imparting various types of skills required
at present in the small towns, as suggested above. If good roads and public
transport are provided, people can travel to these towns, learn the skills and
avail of the services available even while living in villages. This would go a long
way towards increasing the access to education and health facilities and will
have a tremendous impact on educational attainment, skill-building and health
standards in the country. The current younger generation, in the age-group 18-
35 years, will benefit the most in this design of things.
Table 20
Purchasing power--various sections of society and target for 2050
Population in
percentage
Purchasing power Location of the
population
Target for
2050
Top 10% High Mostly urban 10%
Upper middle
class 20%
Moderate to high Mostly urban 50%
Lower middle
class 20%
Basic necessities plus
some consumer goods
Mostly urban and some
in rural areas
40%
Poor (APL) 25% Just basic necessities Rural areas and slums in
urban areas
-
Poorest (BPL)
25%
Even basic necessities
not available
Rural areas and slums in
urban areas
-
Source: Authors‟ estimates based on various studies
A large proportion of India's poor attached to agriculture and traditional services
need to be shifted out to industry and modern services, which in turn suffer from a
shortage of skilled human resources. The creation of small town-based urbanization
will trigger this occupational shift. For the country, the proportion of the workforce
in agriculture, industry and services should change to 45 per cent, 20 per cent and

Managing Resources for Inclusive Growth: India 2050
25
35 per cent respectively over the next 10-15 years. Ultimately, by 2050, the total
population sustainable on agriculture and forest should be only about 40 crores
(25%), including people dependent on handicrafts, animal husbandry and other
services (see Table15 above and Shariff, 2007).
The above occupational shift will require human resource investments especially in
states with lower levels of literacy but a huge pool of young people such as Uttar
Pradesh, Bihar, Madhya Pradesh, Assam and Rajasthan. On the whole about 100
million people need to be provided with appropriate education and skills over time
so that they can make the necessary switch. The 4000 small-town development
model will thus ensure that India shows the way as a producer, consumer and
supplier of skilled hands. Further, since much of the forest, mineral and tribal-
occupied areas overlap, their balanced management through the small-town model
in tribal areas will ensure benefits to the population in these areas besides
environmental safeguards, forest produce and its marketing. In forest areas, lease
/contract mono-culture should be either limited or avoided and multiple bio-
diversity should be encouraged. The idea is that by 2050 only 25% of the population
living in the villages is able to produce adequate food grains and yet has the
essential facilities comparable to the facilities in urban areas.
Economies of Scale in Manpower Training: Although training human resource
manpower is expensive, the average costs of this decrease when more people are to
be imparted standardized training in large batches. One can imagine private
training firms such as NIIT providing these services. A large number of training and
education enterprises too will become viable.
Identifying and Encouraging Entrepreneurs: The fuel that powers any modern
economy is the pool of entrepreneurs in it. Among the 700 million rural population
of India, there must be hundreds of thousands of latent entrepreneurs, who need to
be identified and promoted. One of the foremost requirements for the success of
the distributed urbanization model will be to scout this hidden talent.
Cultural Rejuvenation and Creativity: Within the small-town ambience, its vibrant
economy will automatically support a rejuvenation of local cultures and art forms
providing opportunities to hundreds of hitherto unknown and unsung talented
people - scientists, teachers, economists, dramatists, musicians, innovators, artists,
poets, filmmakers, philosophers, reformers in the catchment population of over a
lakh people. The tapping of this talent will help in promoting arts and literature as
well as a number of social innovations for community welfare. As Khosla and Dey
(2006) point out, to neglect (as it is happening in today‟s milieu) such talent is both
ethically wrong and economically shortsighted. And it is an unimaginable loss to the
nation and to the world at large that simply because we lack the resources for the
proper tools and training, these people are never able to achieve their potential.
9. POLICY CHANGES
9.1 Land use
The land and water available, if managed properly, would be sufficient for a
population of 1600 million in 2050 with much better standard of livelihood. The
authors estimate that sufficiency is achievable provided the land and water is used
very efficiently by all concerned, with innovative management. The environment and
inclusive development could both be balanced, as indicated earlier, by maintaining
a GDP growth of 8-10% for the next three decades.

Managing Resources for Inclusive Growth: India 2050
26
The present forest area and other tree cover are about 23 percent of the
recorded total area of the country. This may at best go up to 25-26 per cent.
Therefore the present target of going up to 33 percent should be revised in
order to keep a balance between the environment and other requirements for
development.
Forests, tribal areas and mines overlap in the belt from Gujarat to Orissa;
planning and development in these areas has to take care of livelihoods with
minimum displacement. The provisions of the Land Acquisition Bill and the
Resettlement and Rehabilitation Bill have to be fine-tuned keeping in mind these
concerns.
In order to ensure food security (production) and other requirements the
culturable area of 185 million ha would have to be ensured as given in Table 8
above. This would enable a food production of 455 million tones by the year
2050 with efficient use of land, water and better management (Table 16 above).
This is estimated to be the food requirement for the population at that time.
Effort should be made to use any area for two or three purposes. Especially
areas which have been used for building and infrastructure. The solar system of
generating power should be utilized on all buildings and infrastructure wherever
possible so that no extra land is required for this purpose. Similarly all these
areas should also harvest water and recharge the ground water wherever it is
below 5 meters (condition in October) as they have stopped the natural process
of recharge. This should form part of the project and should be part of the rules
for building construction.
It should also be ensured that wherever wind power is generated the same land
should be fit to be used for agriculture purposes and should not be located near
the habitats of the villages to avoid noise nuisance. Otherwise it should be on
land which cannot be used for any other purpose.
No land should be used for dumping wastes of urban areas and agricultural
wastes. Efforts should be made through appropriate scientific research to
convert all these wastes into some form of energy and bio-fertilizers.
Wetlands, tanks etc. should actually be enhanced and conserved so as to be
used for ground water recharge, flood moderation etc. The low lying areas near
rivers should be so used, so as to allow ground water recharge and flood
moderation.
Conservation of agriculture land over a longer period can best be achieved by
using bio-fertilizers and bio-pesticides rather than chemical fertilizers.
Nitrogenous chemical fertilizers are subsidized and used in excess; this pollutes
the land and water over a period of time and the degraded land is difficult to
treat. All agriculture bio-mass wastes should be used for this purpose and for
producing bio-fuels.
Research enhancement should be focused to come up with innovations to
effectively increase the productivity of agricultural products, specially food and
sugarcane per unit of land and water, comparable to international standards.

Managing Resources for Inclusive Growth: India 2050
27
There should be quick transmissions of research results to farmers through
manufacturers and bulk purchasers of agriculture products, besides
government‟s agriculture extension system, which needs to be improved.
While encouraging retail outlets to large firms to avoid losses of agriculture
products (which amount to about 30 per cent) from the field to the retail outlet,
the rules governing them should also require them to help the farmers with
finance, lease of machinery, technical knowledge and other inputs, specially to
groups of small farmers so as to encourage bigger operational holdings. Mono-
cropping under contract should be avoided in large continuous areas.
9.2 Water Use
About a century ago most of the water flowed into the rivers keeping them alive and
helping in urbanization and industrialization along their banks. Since then with the
introduction of irrigation by diverting the water from the river we have reached a
stage where most of the rivers run dry for almost 8 to 9 months. The flood
moderation during the monsoon period was obtained by the water spreading over
the low lying areas adjoining the river bed, wetlands and recharge to the ground
water. Most of the water logged areas were drained out back into river. Even the
urban and industrial areas were drained out, mostly untreated into the river.
Now the present situation demands a reversal of these policies; that is, all
effort should be made not to divert any water from the river system especially
for irrigation so that a minimum flow is maintained in the river itself including
the tributaries and small Naalahs to help maintain the environment and ground
water recharge. This flow should be maintained at 90% probability of water
throughout the year. In order to ensure these storages of all sizes, small,
medium and large, could be built for flood moderation and hydroelectric
generation. However, while building these storages we should ensure minimum
displacement of people and those displaced should be rehabilitated properly
and provided training for new skills for their change of livelihood. No run-of-the-
river hydroelectric generation should be allowed because it diverts the water
through the tunnel leaving the river length of 20 to 30 km absolutely dry. This
affects the people, life of the river and the environment. The hydroelectric
generation located on the main river/stream should also be run mainly as a base
station throughout the year with 90% probability so as to maintain the minimum
flow as indicated above. This would also decrease the cost of installation of
turbines.
A minimum flow throughout the year will imply less polluted water, besides
ensuring the life of the river and moderation in the flood level. It could also
encourage cultural festivities (including ritual bathing), tourism and recreation
along the river. In the lower parts of the main river, navigation would become
most essential when no more land can be spared for national highways and rail
transport.
The policy of draining out all water wherever it gets collected in low lying
land of all urban areas and big infrastructure like roads etc. has to be changed.
Since the surface area has been stopped from infiltrating the water to ground
water, special arrangements would have to be made to recharge the ground
water. The recharge arrangements should be made at various places wherever it
is locally possible but not collected together for recharge or drained out at one
place.

Managing Resources for Inclusive Growth: India 2050
28
As indicated in Table 8 and 16 only 65million ha irrigated area is required
for ensuring food and other agricultural products for the population in 2050.
This would obliviously require more efficient use of water with higher
productivity. The focus should be on completing projects already under
construction and up-grading existing projects rather than taking up new projects
in major and medium water resources development.
All the attention should be on management and maintenance of existing
water resources projects.
Earlier agriculture was considered as the main source of livelihood for major
portion of the population but now the livelihood opportunities are fast changing
from agriculture to services and industries, including manufacture. Therefore,
there is no need to transfer water from one basin to another basin, or spreading
the water thinly over a larger area to ensure livelihood of low quality.
9.3 Market Access and Financial Services
Bina Agarwal has suggested that ways of increasing productivity from small
holdings to collectivities of farmers should be framed with the following six
principles: (i) voluntariness; (ii) small size, constituted of, say, groups of 10-12 or
15-20 farmers; (iii) socio-economic homogeneity or marked social affinities among
members; (iv) participatory decision-making in production, management and
distribution; (v) checks and penalties for containing free riding and ensuring
accountability; and (vi) group control over the returns and a fair distribution of the
benefits, as decided transparently by the members (Agarwal 2010).
At present retail services by big corporates have been started in various states like
Tamil Nadu, Maharashtra, Karnataka, Punjab, etc. But no specific regulator has been
appointed or rules framed. It is necessary to ensure that these corporates not only
buy a specific agriculture product but also help the farmers technically and
financially, providing equipment on lease specially to small farmers and provide
transport from the farm to the warehouses and cold storages and then to the retail
outlets. In order to ensure that the small retailers in various towns do not go out of
business even they should be supplied on wholesale rates. This would avoid the
wastage of 30% of the produce from farm to the consumer but would also reduce
the cost. Consequently, both the farmer and the consumer would gain.
In order to save the wastage of agriculture products and surplus over demand in
certain years, the agriculture processing industries should be encouraged in small
towns. This will also help in establishing the prices from year to year and reduce the
fluctuation of income to the farmer.
The Agricultural Produce Marketing Act, the Cooperative Societies Act and other
acts should be suitably amended and rules and regulations should be framed for
food processing industries, contract farming and retail.
Besides access to markets, the poor need affordable credit to come out of the cycle
of poverty. The box below lists a set of guidelines suggested by the Asian
Development Bank for financing for poverty reduction for the urban poor.

Managing Resources for Inclusive Growth: India 2050
29
Box 2
Tenets for Financing Framework for Poverty Reduction for the Urban Poor
Broadly, a financing framework for poverty reduction should be based on the
following tenets:
First, improve market based linkages of the urban poor for (a) micro-credit,
(b) social and economic infrastructure, (c) micro-enterprises, and (d) shelter.
Second, improve the affordability of financial intermediation by reforming
the legal and regulatory systems, both at the state and local levels.
Third, enhance institutional and financial sustainability of poverty reduction
programs through (a) community based lending and savings initiatives, (b)
leveraging internal resources and budgetary funds, (c) building partnerships
between stakeholders, and (d) enhancing community empowerment.
Fourth, rationalize subsidies in order to (a) increase borrower options, (b)
reduce service delivery and transaction costs, (c) build consensus among
various stakeholders, and (d) strengthen their capacities to identify and
implement sub-projects.
Source: ADB (2009)
References
Agarwal, Bina (2010), „Rethinking Agricultural Production Collectivities,‟ Economic and
Political Weekly, February 27, 2010, Vol. XLV No. 9
Ajayan (2009), Kerala government aims at 25-year master plan for land use,‟ Mint, 23
November, 2009
Asian Development Bank (2009) Urban Poverty in India, BS Books, New Delhi
Bardhan, Pranab (2009), „How unequal a country is India?‟ Business Standard, 05.09.2009
Central Statistical Organization (2007), National Accounts Statistics 2007, New Delhi:
Government of India
FAO (2008), Production Yearbook, Food and Agriculture Organization, Rome
Government of India (2007), Agriculture Statistics, Ministry of Agriculture
Government of India (2009a), India: Urban Poverty Report 2009, Ministry of Housing and
Urban Poverty Alleviation and Oxford University Press, New Delhi
Government of India (2009b) Economic Survey 2008-09
Indiresan, P. V. (2008) „Rurbanisation is solution‟, The Hindu Business Line, 12.0.2008
Jurong Consultants (2008), Mullanpur Local Planning Area, Greater Mohali Region Punjab,
Master Plan Report 2008-2031
Kathpalia, G N and Kapoor, Rakesh (2006) Charting a New Course: A Strategy for Sustainable
Management of India‟s Water Resources in the 21st
Century, Alternative Futures and
Daanish Books, New Delhi
Khosla, Vinod and Dey, Atanu (2006), RISC – Rural Infrastructure & Services Commons: A
Model for Implementing the “Bicycle Commute Economy.”
http://www.khoslaventures.com/a-model-for-implementing-the-bicycle-commute-
economy
Kundu, Amitabh and Nijanjan Sarangi (2005), „Employment Guarantee-The Issue of Urban
Exclusion‟, Economic and Political Weekly, 40(30): 3642-6

Managing Resources for Inclusive Growth: India 2050
30
Planning Commission, Government of India (2008a), „Eleventh Five Year Plan: 2007-2012‟
Vol I, Oxford University Press, New Delhi
, Government of India (2008b), Eleventh Five Year Plan: 2007-2012, Vol III, Oxford
University Press, New Delhi
Ramachandran, R. (1989), Urbanization and Urban Systems in India, New Delhi, OUP
Shariff, Abusalah (2007), „Problem of Numbers: Skill shortage could scupper high growth
rates‟, Times of India, 22 November, 2007
Sivaramakrishnan, K C, Amitabh Kundu and B. N. Singh (2005), Handbook of Urbanization in
India, Oxford University Press, New Delhi
Steiner, Achim (2008), „New agricultural practices counter-productive‟, International
Assessment of Agricultural Science and Technology for Development (IAASTD), UNEP
Intergovernmental Plenary Meeting Opening, Address April 7
United Nations (2005), „World Urbanization Prospects, 2005 Revision‟, Department of
Economic and Social Affairs, Population Division, New York

Managing Resources for Inclusive Growth: India 2050
31
Annexure 1
Public Regulatory System Operating at Multiple Levels for Water
By regulation we mean: (i) allocation of water for different areas; (ii) the pricing of
water for different uses within a state; and (iii) laying down of rules and guidelines
for water development projects. Also, monitoring of the actual allocation done.
The functions of the Public Regulatory System will include the following:
Framing rules for allocation of water at different levels upto the sub-watershed
level (10,000 ha) and for pricing of water for different uses. Also, making the
rules for development of new water projects at various levels.
Regulation of groundwater level, upper and lower limits, on advice of
hydrological experts.
Regulation of downstream releases.
At the sub-watershed level, the regulatory body will advise about the allocation
of water for different uses, such as for agriculture, forestry and industrial units
to be set up.
At the sub-watershed level the regulatory body will also advise farmers on
cropping patterns.
Pricing of water for different uses (in different areas).
Monitoring of the allocation done and of the rules for development of water
projects.
Framing guidelines for giving limited areas on lease to private parties for water
development, management etc.
Ultimately, these functions will be carried out by the River Basin Organisations
(RBOs), but till such time that the RBOs are created autonomous regulatory bodies
will have to be set up at various levels, as shown below in Box 3.
Box 3
Public Regulatory System at Multiple Area Levels
Lowest level: Gram Sabha or Village Water Committee under
panchayat (1000 ha)
Sub-watershed level (10,000 ha)
Watershed level (50,000-1 lakh ha) (corresponds to district level)
Sub-river basin or tributary level
Full river basin level (RBO)
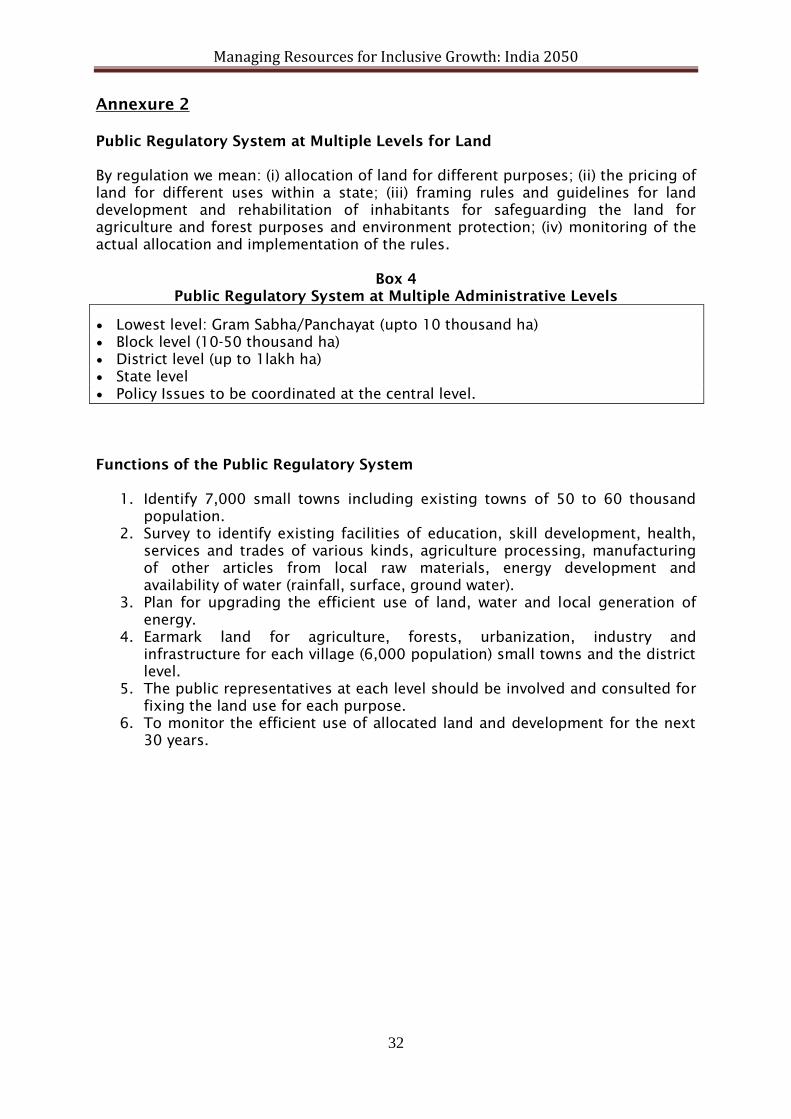
Managing Resources for Inclusive Growth: India 2050
32
Annexure 2
Public Regulatory System at Multiple Levels for Land
By regulation we mean: (i) allocation of land for different purposes; (ii) the pricing of
land for different uses within a state; (iii) framing rules and guidelines for land
development and rehabilitation of inhabitants for safeguarding the land for
agriculture and forest purposes and environment protection; (iv) monitoring of the
actual allocation and implementation of the rules.
Box 4
Public Regulatory System at Multiple Administrative Levels
Lowest level: Gram Sabha/Panchayat (upto 10 thousand ha)
Block level (10-50 thousand ha)
District level (up to 1lakh ha)
State level
Policy Issues to be coordinated at the central level.
Functions of the Public Regulatory System
1. Identify 7,000 small towns including existing towns of 50 to 60 thousand
population.
2. Survey to identify existing facilities of education, skill development, health,
services and trades of various kinds, agriculture processing, manufacturing
of other articles from local raw materials, energy development and
availability of water (rainfall, surface, ground water).
3. Plan for upgrading the efficient use of land, water and local generation of
energy.
4. Earmark land for agriculture, forests, urbanization, industry and
infrastructure for each village (6,000 population) small towns and the district
level.
5. The public representatives at each level should be involved and consulted for
fixing the land use for each purpose.
6. To monitor the efficient use of allocated land and development for the next
30 years.