g. soils engineering report and engineering geology ...resourcerecoveryproject.com/media/final eir...
TRANSCRIPT

APPENDIX G SOILS ENGINEERING REPORT AND ENGINEERING GEOLOGY INVESTIGATION

October 7, 2015 Project No. SB00314-3
Attn: Ms. Joddi Leipner Senior Engineering Environmental Manager County of Santa Barbara Public Works Department Resource Recovery and Waste Management Division 130 East Victoria Street Santa Barbara, CA 93101 Subject: Response to Design Modifications - Revised Building Locations and Grading Design Tajiguas Resource Recovery Project Tajiguas Landfill, 14470 Calle Real, Santa Barbara County, California
References: GeoSolutions, Inc., October 4, 2013, Soils Engineering Report and Engineering Geology
Investigation, Tajiguas Resource Recovery Project (TRRP), Tajiguas Landfill, Santa Barbara, California, by GeoSolutions, Inc, Project SB00314-1, dated October 4, 2013.
Earth Systems Southern California, December 10, 2014, Engineering Geology and
Geotechnical Engineering Report for Tajiguas Landfill Resource Recovery Project, 14770 Calle Real, Santa Barbara County, California, Project VT-24980-01, dated December 10, 2014.
John Kular Consulting, undated, ADF/MRF Grading and Drainage Plan (North)/(South). Dear Ms. Leipner: This report presents our geotechnical and geologic conclusions regarding the modifications to the proposed Tajiguas Resource Recovery Project located at Tajiguas Landfill, 14770 Calle Real, in Santa Barbara County, California. Changes to project plans since the time of our report dated October 4, 2013, included a shift to the proposed ADF and MRF building footprints and an increase to the gradient of the proposed cut slope west of the buildings. We have reviewed revisions to the proposed plans (John Kular Consulting, undated) and additional Engineering Geology and Geotechnical Engineering Report (Earth Systems Southern California, 2014) in order to determine whether the project modifications will impact the conclusions and mitigations from the Tajiguas Landfill Resource Recovery Project Internal Draft Subsequent EIR, dated August 2014. It is our understanding that the proposed ADF and MRF buildings were moved 25 feet south and 20 feet west to minimize the settlement impact associated with the underlying fill on the eastern side of the building footprints (GEO-5) and to minimize visual impacts associated with the proposed development. The revised grading plans also indicated cut slopes in the Rincon Shale west and south of the buildings and operations deck to be approximately 2:1 (horizontal:vertical) with an approximately 15-foot bench cut at about 25 feet (vertical) up the slope. The original cut slopes analyzed in our 2013 report were proposed at 2.5:1, with similar benching. Current plans (John Kular Consulting, undated) show the

Tajiguas Resource Recovery Project October 7, 2015 Project SB00314-3
2
graded area with cut-slopes extending up about 52 to 67 feet from the easement along the west side of the buildings. A summary of the original geotechnical and geologic impacts stated in our 2013 report (GeoSolutions, Inc., October 4, 2013) are presented below:
Landslides - The Rincon Shale is generally a weaker unit and prone to landslides when saturated, therefore within the Rincon Shale units there is a moderate potential for landslides. A slope stability analysis was performed on the proposed western cut slope and provides recommendations to maintain the stability of the slope as discussed in Section 6.0. Due to the character of the Vaqueros Sandstone and Sespe Formation, there is a low potential for landslides within these units. Potential landslide impacts at the Site were identified as less than significant, Class III. Severe Erosion – The potential for severe erosion is low considered provided that vegetation and erosion control measures are implemented immediately after the completion of grading. Therefore, impacts associated with severe erosion can be feasibly mitigated and is interpreted to be a Class II Impact. Regional Faulting and Seismicity - The Alquist-Priolo Earthquake Fault Zoning Act of 1972 requires that the California State Geologist establish Earthquake Fault Zones around the surface traces of active faults and to issue appropriate maps. The subject site is not located within an Earthquake Fault Zone (Jennings, 2010). Potential impacts at the Site due to faulting were identified as less than significant, Class III. Based on the results of the slope stability analysis, the proposed fill/cut slopes appear to be grossly stable under psuedo-static (seismic) conditions, therefore the potential for seismically induced slope failure at the site is low. Potential impacts at the Site due to seismically induced slope failure were identified as less than significant, Class III. Based on the presence of clay in the fill and formational units, there is a low potential for seismically induced settlement at the Site, however there is a high potential within the MSW. The MRF and ADF buildings are proposed in the vicinity of MSW, however foundation recommendations are provided to help mitigate settlement effects. Therefore, impacts associated with seismically induced settlement can be feasibly mitigated and is interpreted to be a Class II Impact. Tsunami/Seiches - As the property is at an elevation of approximately 390 feet, the potential for a tsunami to affect the Site is low. Flooding associated with a seismic event is considered low due to the absence of a body of water upslope of the property. The northern sedimentation basin is located upslope of the current operations deck, however existing 48-inch storm drain inlets are also located upslope which would flow inundated water beneath the operations deck. Therefore, flooding associated with a seismic event (seiches) is considered low. Potential impacts at the Site due to tsunamis or seiches were identified as less than significant, Class III. Liquefaction - Based on the consistency and relative density of the in-situ soils (clay/rock) and the depth to groundwater the potential for seismic liquefaction of soils at the Site is very low. Potential liquefaction impacts at the Site were identified as less than significant, Class III. Expansive Soils – The Rincon Formation was classified as medium expansion from laboratory testing (see Appendix B). Additional fill at the operations deck is proposed to be derived from Rincon Formation located at the west borrow slope. Foundation recommendations will negate the negative impacts of Rincon Formation to the MRF and ADF structures. Therefore, impacts associated with expansive soils can be feasibly mitigated and is interpreted to be a Class II Impact. Slope Stability - Cut Slope: 2.5:1 - West of the Operations Deck, Fill Slope: 3:1 - South of the Operations Deck, Fill Slope: 2:1 - West of the Maintenance Building Pad - The critical factor of safety results were observed to exceed the minimum design factor of safeties for static and pseudo static. Based on this, if the slopes are constructed to the proposed configurations and in accordance with our recommendations, then it is our opinion that the proposed cut slope should be stable. Therefore, impacts associated with stability of the modified slopes can be feasibly mitigated and is interpreted to be a Class II Impact.

Tajiguas Resource Recovery Project October 7, 2015 Project SB00314-3
3
Settlement - Significant settlement of the refuse was observed in the analysis of the operations deck. As part of the design of the ADF and MRF buildings, the majority of the buildings are proposed to be constructed on the operations deck underlain by artificial fill or Rincon Shale. Foundation recommendations will negate the negative impacts to the structures for both settlement and differential settlement throughout the pad. Therefore, impacts associated with the settlement of the operation deck can be feasibly mitigated and is interpreted to be a Class II Impact. Several hundred feet of refuse and significant settlement is anticipated throughout this area. Recommendations to the compost area pavement section to help mitigate the effects of settlement and improve the structural integrity are provided in Section 8.9. Therefore, impacts associated with the settlement of the compost area can be feasibly mitigated and is interpreted to be a Class II Impact.
The project changes and additional recommendations in the Engineering Geology and Geotechnical Engineering Report (Earth Systems, December 10, 2014) do not affect the original landslide, severe erosion, regional faulting and seismicity, tsunami/seiches, liquefaction, expansive soils and settlement impacts. The cut and fill slopes west of the Operations Deck are now proposed to be constructed with slope gradients of 2:1 (horizontal:vertical) between benches which will be located at about every 25 feet (vertical). Based on our understanding of the site conditions, there is potential for surficial failures to occur within areas graded at 2:1 (horizontal:vertical) in the Rincon Shale Formation. Despite the changes in gradient of the proposed cut-slope, impacts associated with stability of the modified slopes can be feasibly mitigated and are still interpreted to be a Class II Impact. Our review was performed in accordance with the usual and current standards of the profession, as they relate to this or similar localities. No other warranty, expressed or implied, is made as to the conclusions and professional advice included in this plan review. Thank you for the opportunity to have been of service in preparing this report. If you have any questions or require additional assistance, please feel free to contact the undersigned at (805) 543-8539. Sincerely, GeoSolutions, Inc. Patrick B. McNeill, PE Jeffrey Pfost, CEG 2493 Principal Engineering Geologist \\Nas-c1-df-18\v\SB00001-SB00499\SB00314-3 -Tajiguas Landfill\Geology\SB00314-3 Response to Design Modifications_Final_rev1.doc
SOILS ENGINEERING REPORT ANDENGINEERING GEOLOGY INVESTIGATION
TAJIGUAS RESOURCE RECOVERY PROJECT (TRRP),TAJIGUAS LANDFILL, SANTA BARBARA COUNTY, CALIFORNIA
PROJECT SB00314-1
Prepared for
Attn: Ms. Joddi LeipnerSenior Engineering Environmental Manager
County of Santa BarbaraPublic Works Department
Resource Recovery and Waste Management Division130 East Victoria Street
Santa Barbara, CA 93101
Prepared by
GEOSOLUTIONS, INC.1021 TAMA LANE, SUITE 105
SANTA MARIA, CALIFORNIA 93455(805) 614-6333
©
October 4, 2013

October 4, 2013Project No. SB00314-1
Attn: Ms. Joddi LeipnerSenior Engineering Environmental ManagerCounty of Santa BarbaraPublic Works DepartmentResource Recovery and Waste Management Division130 East Victoria StreetSanta Barbara, CA 93101
Subject: Soils Engineering Report and Engineering Geology InvestigationTajiguas Resource Recovery Project (TRRP)Tajiguas Landfill, County of Santa Barbara, California
Dear Ms. Leipner:
This Soils Engineering Report and Engineering Geology Investigation has been prepared for the TajiguasResource Recovery Project within the Tajiguas Landfill located approximately 26 miles west of the City ofSanta Barbara, and 1,600 feet north of U.S. Highway 101, Santa Barbara County, California.Geotechnically and geologically, the site is suitable for the proposed development provided therecommendations in this report for site preparation, earthwork, and foundations are incorporated into thedesign. The Resource Recovery Project is proposed to be located at the Tajiguas Landfill and wouldinclude a Materials Recovery Facility (to recover recyclable materials), a Dry Fermentation AnaerobicDigestion Facility (to process organic waste into biogas and digestate), an Energy Facility that would usethe biogas from the Anaerobic Digestion Facility to produce electricity, a composting area to cure thedigestate into soil amendments/compost and associated infrastructure (e.g., pipelines, storage tanks).
The operations deck which is to be comprised of a proposed Materials Recovery Facility (MRF), DryFermentation Anaerobic Digestion Facility (ADF) and associated loading and parking areas will beconstructed on 0-85 feet of fill. It is our understanding final proposed grade elevation of the operation deckwill include the addition of up to 10 to 20 feet of fill placed in operations deck area. Due to the potentialfor large differential settlement (up to 2-3 feet) in this area it is anticipated that a cast-in-place concretecaisson, driven H-Pile or Helical Pier and grade beam type of foundation system will be constructed for theproposed MRF and ADF facilities with all piers founded a minimum of 10.0 feet into uniform competentformational material located approximately 10 to 95 feet below finish grade. (See Plates 2A, 2B, and 2Cfor fill depths pertaining to facilities footprints.)
The proposed Maintenance Building is to be located along the northeast property line and is anticipated toutilize a mat slab type of foundation system to mitigate the potential of differential settlement associatedwith varying fill depths within the existing engineering fill pad (Geosyntec, 2009). All foundations are tobe excavated into uniform material to limit the potential for distress of the foundation systems due todifferential settlement.
October 4, 2013 Project No. SB00314-1
2
It is our understanding the proposed Well Water Storage Tank and Recycled Water Storage Tank are to belocated to the northwest of the west borrow slope area, the proposed Composting Area Runoff CollectionRunoff Tank located northof the proposed Maintenance Building, and the proposed Percolate Tanks are tobe located at the southwest corner of the proposed ADF building. Due to the shallow depths to competentformational material in these four areas, it is anticipated the proposed tank foundation systems will utilizecontinuous footings founded in uniform competent formational material as observed and approved by arepresentative of GeoSolutions, Inc. Deepened footings may be required in certain areas to achieve therequired embedment depth in uniform competent formational material.
It is our understanding that no structures are proposed for the composting area but a non-permeablehardscape is anticipated to be constructed over the composting area.
Thank you for the opportunity to have been of service in preparing this report. If you have any questions orrequire additional assistance, please feel free to contact the undersigned at (805) 614-6333.
Sincerely,
GeoSolutions, Inc.
Patrick B. McNeill, PE Jeffrey A. Pfost, CEG #2493Principal Project Engineering Geologist
\\192.168.0.5\v\Santa Barbara Office\Projects\SB00314-1 - Tajiguas Landfill\Geology\SB00314-1 Transmittal Letter.doc

TABLE OF CONTENTS
1.0 INTRODUCTION ........................................................................................................................... 7
2.0 PURPOSE AND SCOPE................................................................................................................. 4
3.0 FIELD AND LABORATORY INVESTIGATION......................................................................... 4
4.0 ENGINEERING GEOLOGY INVESTIGATION........................................................................... 6
4.1 Regional Geology................................................................................................................ 6
4.2 Local Geology..................................................................................................................... 7
4.3 Surface and Groundwater Conditions ................................................................................. 8
4.4 Landslides ........................................................................................................................... 8
4.5 Slope Stability ..................................................................................................................... 9
4.6 Severe Erosion .................................................................................................................. 10
4.7 Regional Faulting and Seismicity...................................................................................... 10
5.0 SEISMIC DESIGN CONSIDERATIONS..................................................................................... 12
5.1 Seismic Hazard Analysis................................................................................................... 12
5.2 Structural Building Design Parameters ............................................................................. 12
5.3 Design Response Spectra – 2010 CBC ............................................................................. 13
5.4 Liquefaction Potential ....................................................................................................... 14
6.0 NUMERICAL SLOPE STABILITY ............................................................................................. 14
6.1 Slope/W Discussion .......................................................................................................... 16
6.2 Laboratory Test Results..................................................................................................... 17
6.3 Discussion of Modeling Conditions .................................................................................. 18
6.4 Static Slope Stability Analysis .......................................................................................... 18
6.5 Pseudo-Static Slope Stability Analysis.............................................................................. 19
6.6 Discussion of Slope Stability Results................................................................................ 23
7.0 SETTLEMENT ANALYSIS ......................................................................................................... 24
7.1 Operations Deck................................................................................................................ 24
7.2 Composting Area .............................................................................................................. 27
8.0 GENERAL SOIL-FOUNDATION DISCUSSION........................................................................ 28
9.0 GEOTECHNICAL CONCLUSIONS AND RECOMMENDATIONS ......................................... 29
9.1 Preparation of Building Pad .............................................................................................. 29
9.2 Drilled Cast-in-Place Concrete Caissons – MRF and ADF Facilities ............................... 30
9.3 Helical Piers – MRF and ADF Facilities........................................................................... 31
9.4 Driven Piles – MRF and ADF Facilities ........................................................................... 31
9.5 Mat Foundations – Maintenance Building ........................................................................ 32
9.6 Conventional Foundations - Well Water Storage Tank, Recycled Water Storage Tank,
Composting Area Runoff Collection Tank and Percolate Tanks.................................................... 32
9.7 Slab-On-Grade Construction............................................................................................. 33
9.8 Composting Area .............................................................................................................. 34
9.9 Preparation of MRF and ADF Faciltiy Paved Areas ......................................................... 34
9.10 Preparation of Non-Landfill Paved Areas ......................................................................... 35
9.11 Pavement Design............................................................................................................... 35
9.12 Retaining Walls................................................................................................................. 35
10.0 REGULATORY SETTING........................................................................................................... 38
10.1 Previous Analysis.............................................................................................................. 39
11.0 THRESHOLDS OF SIGNIFICANCE ........................................................................................... 39
11.1 Appendix G of the State CEQA Guidelines...................................................................... 39
11.2 County’s Environmental Thresholds and Guidelines Manual - Geologic Constraints
Guidelines ...................................................................................................................................... 40
11.3 California Code of Regulations - Title 27 and California Department of Water Resources
Slope Stability Criteria ................................................................................................................... 40
11.4 Impact Analysis................................................................................................................. 40
11.5 Mitigation Measures.......................................................................................................... 41
12.0 EXTENSION OF LANDFILL LIFE ............................................................................................. 43
13.0 CUMULATIVE IMPACTS ........................................................................................................... 43
14.0 PROJECT ALTERNATIVES........................................................................................................ 43
14.1 Alternative A – No Project................................................................................................ 43
14.2 Alterative B – Urban Area MRF Alternative 1 (Marborg Industries MRF) ...................... 43
14.3 Alterative C – Urban Area MRF Alternative 2 (South Coast Recycling and Transfer
Station[SCRTS]) ............................................................................................................................ 48
14.4 Alternative D – Off-site Aerobic Composting (Engel and Gray Composting Facility) ..... 52
14.5 Alternative E – Tajiguas Landfill Expansion .................................................................... 54
14.6 Alternative F – Waste Export To the Simi Valley Landfill and Recycling Center ............ 58
14.7 Alternative G – Waste Export to the Santa Maria Intergrated Waste Management Facility60
15.0 ADDITIONAL GEOLOGIC AND GEOTECHNICAL SERVICES............................................. 61
16.0 LIMITATIONS AND UNIFORMITY OF CONDITIONS ........................................................... 62
REFERENCES
PLATES
Plate 1A, 1B, 1C - Site Engineering Geologic MapPlate 2A, 2B, 2C – Site Cross SectionsPlate 3A, 3B – Regional Geologic Map, Dibblee, 1988 and Geologic ExplanationsPlate 4 – Regional Fault Map, Jennings, 2010
APPENDIX A
Field InvestigationSoil Classification ChartBoring LogsCPT SoundingsDesign Maps Summary Report
APPENDIX B
Laboratory TestingSoil Test Reports
APPENDIX C
Settlement Analysis Data – Operations Deck
APPENDIX D
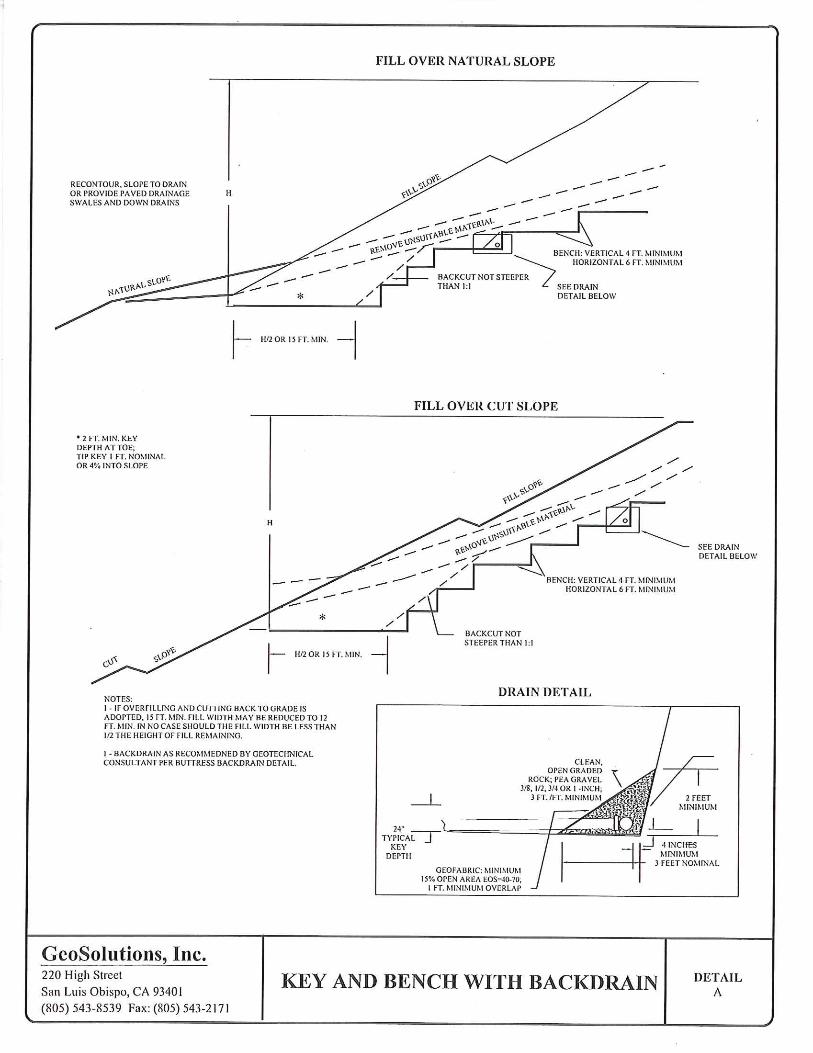
Preliminary Grading SpecificationsKey and Bench with Backdrain
LIST OF FIGURES
Figure 1: Site Location Map.......................................................................................................................... 7
Figure 2: Project Facilities Plan .................................................................................................................... 2
Figure 3: CPT and Boring Locations............................................................................................................. 5
Figure 4: Photograph of the West Borrow Slope........................................................................................... 9
Figure 5: Historical Seismicity Map (Toppozada et al., 2000) .................................................................... 11
Figure 6: Design Response Spectra – 2010 CBC........................................................................................ 14
Figure 7: Location of Cross Section Profiles through the Operations Deck. ............................................... 15
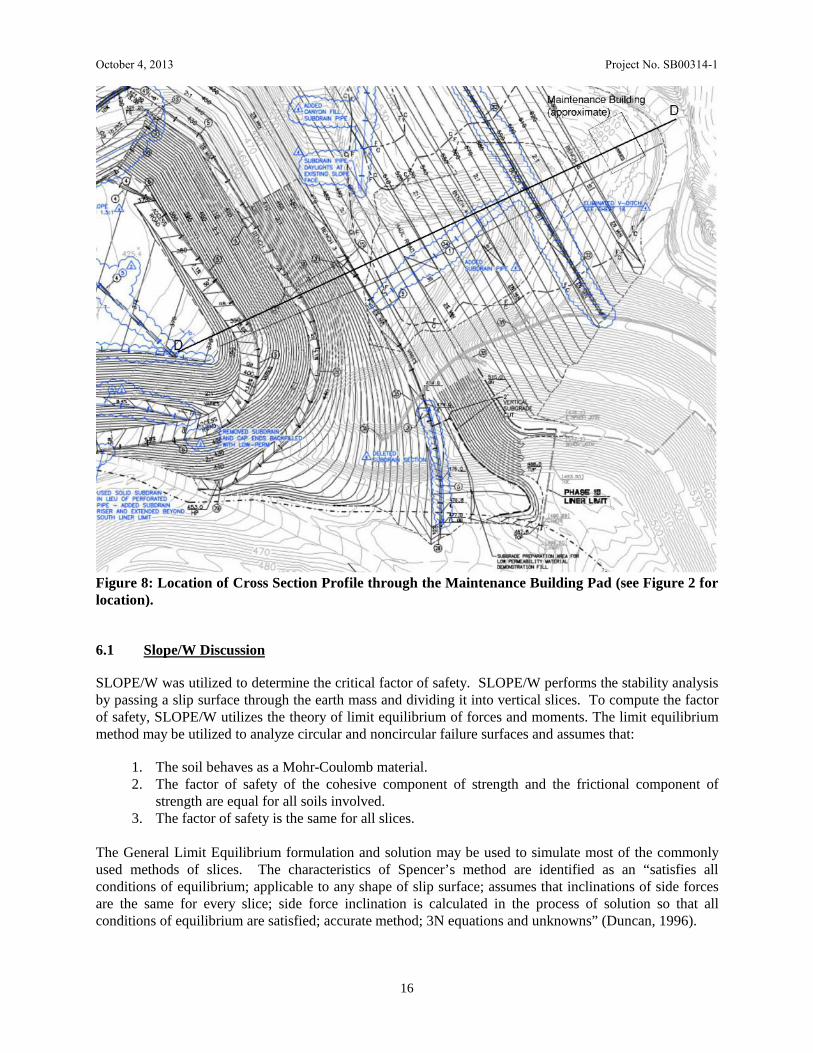
Figure 8: Location of Cross Section Profile through the Maintenance Building Pad (see Figure 2 for
location). ........................................................................................................................................ 16
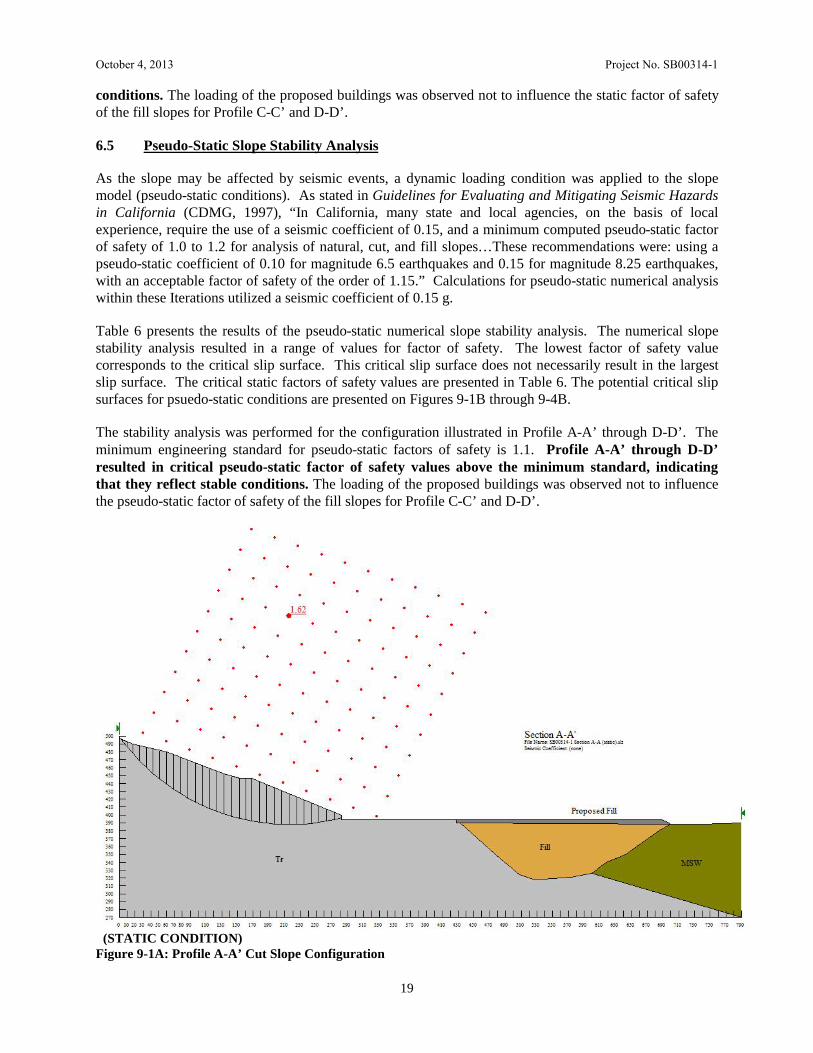
Figure 9-1A: Profile A-A’ Cut Slope Configuration ................................................................................... 19
Figure 10: Operations Deck - Settlement Monument Locations.................................................................. 25
Figure 11: Composting Area ....................................................................................................................... 28
Figure 12: Alternative B – MarBorg Industries Site Plan............................................................................ 44
Figure 13: Historical Seismicity Map for MarBorg Alternative (Toppozada et al., 2000) .......................... 46
Figure 14: Alternative C – South Coast Recycling and Transfer Station Site Plan ..................................... 48
Figure 15: Historical Seismicity Map for the SCRTS Alternative (Toppozada et al., 2000)....................... 50
Figure 16: Historical Seismicity Map for the Engel and Gray Alternative (Toppozada et al., 2000) .......... 53
Figure 17: Alternative E – Tajiguas Landfill Expansion Site Plan.............................................................. 55
Figure 18: Historical Seismicity Map for the Tajiguas Landfill (Toppozada et al., 2000) .......................... 57
LIST OF TABLES
Table 1: Engineering Properties .................................................................................................................... 6
Table 2: Active Faults Near the Subject Property ....................................................................................... 10
Table 3: 2010 California Building Code, Chapter 16, Structural Design Parameters ................................. 13
Table 4: Shear Results................................................................................................................................. 17
Table 5: Maximum Density and Moisture Content Test Results................................................................. 17
Table 6: Factors of Safety Results ............................................................................................................... 18
Table 7: Operations Deck - Settlement Monument Data............................................................................. 26
Table 8: Operations Deck - Settlement Analysis Results ............................................................................ 27
Table 9: Minimum Footing and Grade Beam Dimensions.......................................................................... 33
Table 10: Retaining Wall Design Parameters (Level Backfill).................................................................... 36
Table 11: Retaining Wall Design Parameters (1 to 2.5 Sloped Backfill) .................................................... 36
Table 12: Active Faults Near the MarBorg Alternative............................................................................... 45
Table 13: Active Faults Near the SCRTS Alternative................................................................................. 50
Table 14: Active Faults Near the Engel and Gray Alternative .................................................................... 53
Table 15: Active Faults Near the Tajiguas Landfill .................................................................................... 56
Table 16: Required Verification and Inspections of Soils ........................................................................... 62

SOILS ENGINEERING REPORT ANDENGINEERING GEOLOGY INVESTIGATION
TAJIGUAS RESOURCE RECOVERY PROJECT (TRRP),TAJIGUAS LANDFILL, SANTA BARBARA COUNTY, CALIFORNIA
PROJECT SB00314-1
1.0 INTRODUCTION
This report presentsthe results of thegeotechnical andgeologic investigationfor the TajiguasResource RecoveryProject within theTajiguas Landfilllocated approximately26 miles west of theCity of Santa Barbara,and 1,600 feet north ofU.S. Highway 101,Santa Barbara County,California. See Figure1: Site Location Mapfor the general locationof the project area.Figure 1: Site LocationMap was obtainedfrom the computer program Topo USA 8.0 (DeLorme, 2009).
The Tajiguas Landfill is an existing County-owned and operated municipal solid waste disposal facilitylocated in a coastal canyon known as the Cañada de la Pila, located approximately 26 miles west of theCity of Santa Barbara, and 1,600 feet north of U.S. Highway 101, Santa Barbara County. The SantaBarbara County Public Works Department, Resource Recovery and Waste Management Division(RRWMD) is the owner and permitted operator of the landfill.
Figure 1: Site Location Map
SITE
October 4, 2013 Project No. SB00314-1
2
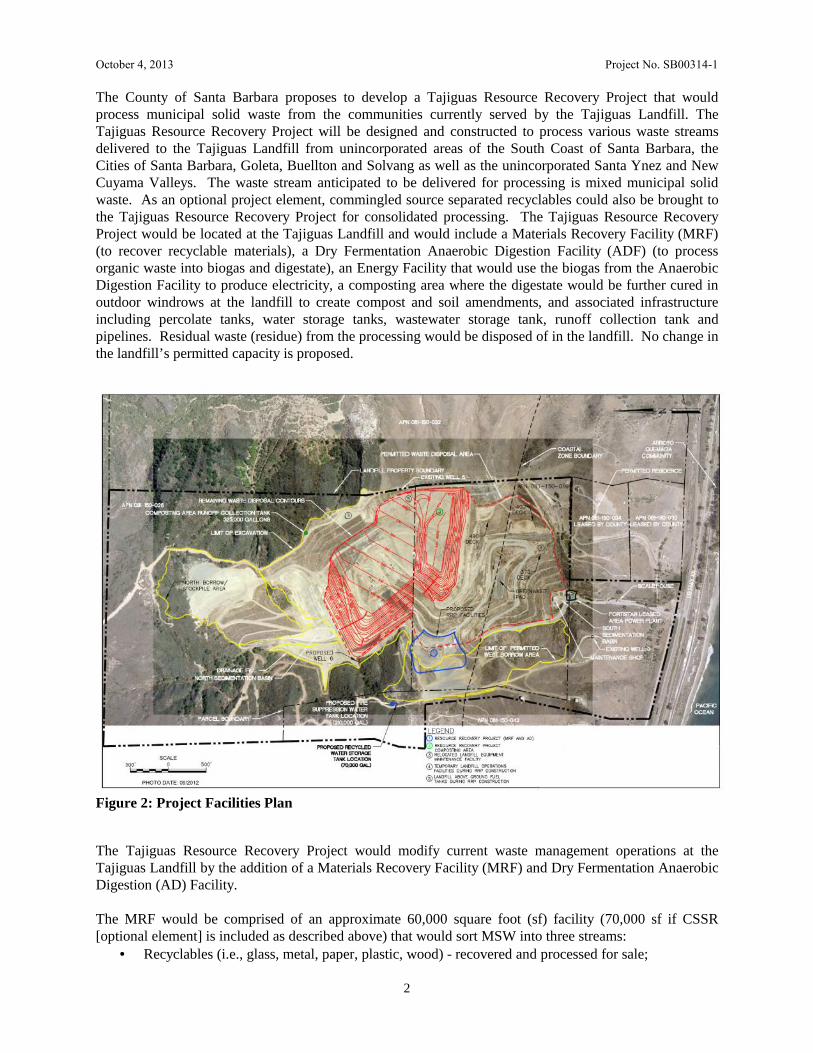
The County of Santa Barbara proposes to develop a Tajiguas Resource Recovery Project that wouldprocess municipal solid waste from the communities currently served by the Tajiguas Landfill. TheTajiguas Resource Recovery Project will be designed and constructed to process various waste streamsdelivered to the Tajiguas Landfill from unincorporated areas of the South Coast of Santa Barbara, theCities of Santa Barbara, Goleta, Buellton and Solvang as well as the unincorporated Santa Ynez and NewCuyama Valleys. The waste stream anticipated to be delivered for processing is mixed municipal solidwaste. As an optional project element, commingled source separated recyclables could also be brought tothe Tajiguas Resource Recovery Project for consolidated processing. The Tajiguas Resource RecoveryProject would be located at the Tajiguas Landfill and would include a Materials Recovery Facility (MRF)(to recover recyclable materials), a Dry Fermentation Anaerobic Digestion Facility (ADF) (to processorganic waste into biogas and digestate), an Energy Facility that would use the biogas from the AnaerobicDigestion Facility to produce electricity, a composting area where the digestate would be further cured inoutdoor windrows at the landfill to create compost and soil amendments, and associated infrastructureincluding percolate tanks, water storage tanks, wastewater storage tank, runoff collection tank andpipelines. Residual waste (residue) from the processing would be disposed of in the landfill. No change inthe landfill’s permitted capacity is proposed.
The Tajiguas Resource Recovery Project would modify current waste management operations at theTajiguas Landfill by the addition of a Materials Recovery Facility (MRF) and Dry Fermentation AnaerobicDigestion (AD) Facility.
The MRF would be comprised of an approximate 60,000 square foot (sf) facility (70,000 sf if CSSR[optional element] is included as described above) that would sort MSW into three streams:
Recyclables (i.e., glass, metal, paper, plastic, wood) - recovered and processed for sale;
Figure 2: Project Facilities Plan
October 4, 2013 Project No. SB00314-1
3
Organics – recovered for processing in the Anaerobic Digestion Facility; and Residue – materials left over after all recyclables and organics are recovered that would be
disposed of at the existing Landfill.
The AD Facility would be housed within an approximate 63,000 sf building, and associated energy facilityand percolate storage tanks that would convert all organics recovered from the MSW and SSOW into:
Bio-gas (primarily composed of methane) – that would be used to power two (2) 1,537 horsepoweronsite combined heat and power (CHP) engines driving electric power generators that wouldgenerate approximately 1+ net megawatts (MW) of renewable power. The Energy Facility wouldbe located on the south side of the AD Facility; and
Digestate - that can then be cured into compost and/or soil amendments. The curing would requirean approximately 5 acre area on the closed landfill top deck. The compost and/or soil amendmentswould be marketed for agricultural or landscape use or used for reclamation projects.
The Tajiguas Resource Recovery Project facilities would be located approximately 3,200 feet north of U.S.Highway 101 on the existing Tajiguas Landfill Operations Deck, an approximately 6-acre site thatcurrently houses the Landfill administrative office, two crew trailers, engineering trailer, hazardousmaterial storage, electronic-waste storage, equipment storage and parking, employee parking, maintenancefacility and three fuel storage tanks.
The Coastal Zone boundary runs through the southern portion of the Landfill property (see Figure 2). Thefacilities (MRF, AD facility and composting area) associated with the Tajiguas Resource Recovery Projectwould be located outside of the Coastal Zone. The composting area is proposed to be located on the topdeck of the Landfill. The top deck would be closed and a final landfill cover system installed prior tousing it for the Tajiguas Resource Recovery Project composting area. To protect the integrity of theLandfill and protect water quality, closure, post-closure use and post-closure maintenance of the top deckarea would be subject to review and approval by CalRecycle, the LEA and the Regional Water QualityControl Board.
In addition to the facilities listed above, a new groundwater well would be constructed to provide water tothe project and two new advanced, self-contained commercial wastewater package treatment units wouldbe constructed to treat the project’s domestic wastewater. The treated wastewater would be used forlandscape irrigation on the slopes (non-Landfill) adjacent to the MRF and AD Facility. A new 220,000gallon fire suppression water storage tank would be installed to provide water for the building sprinklersystems, domestic and process/equipment wash down uses, landscape irrigation needs and fire hydrants.Parking would be provided for Tajiguas Resource Recovery Project staff, Landfill operations staff andvisitors.
The Tajiguas Resource Recovery Project Site would be located at the existing Landfill operations deck.The easterly portion of the project site overlies the closed Landfill waste footprint and could likelyexperience continuing future settlement. As a result, the Tajiguas Resource Recovery Project structureswould be located on the western portion of the operations deck, west of the waste footprint. A hill slopeassociated with the permitted Landfill West Borrow Area borders the operations deck to the west. Thisslope is currently being excavated to provide soil for Landfill operations and Landfill closure activities.
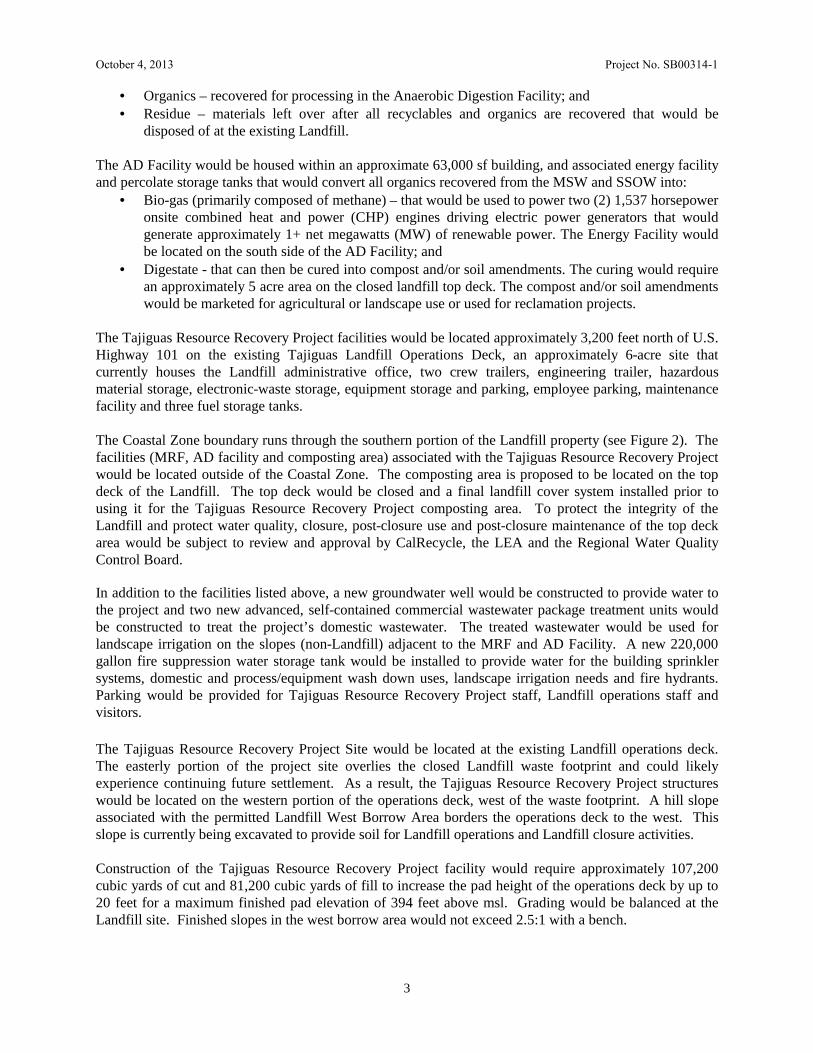
Construction of the Tajiguas Resource Recovery Project facility would require approximately 107,200cubic yards of cut and 81,200 cubic yards of fill to increase the pad height of the operations deck by up to20 feet for a maximum finished pad elevation of 394 feet above msl. Grading would be balanced at theLandfill site. Finished slopes in the west borrow area would not exceed 2.5:1 with a bench.

October 4, 2013 Project No. SB00314-1
4
The composting area would also be located on the closed Landfill waste footprint and would likelyexperience future settlement. No permanent structures are proposed in this area. Asphalt paving, piping,other support facilities in this area and operational procedures would be designed to account for differentialsettlement and to address Landfill post-closure maintenance and monitoring requirements. A monitoringand maintenance program would be implemented to ensure that Tajiguas Resource Recovery Projectfacilities located over the closed Landfill would not be damaged by differential settlement and thatTajiguas Resource Recovery Project operations would not damage the Landfill cover system.
2.0 PURPOSE AND SCOPE
The purpose of this study was to explore and evaluate the surface and sub-surface soil conditions at theSite to develop geotechnical information and design criteria, evaluate engineering geologic hazards at theSite and to develop geotechnical and geologic conclusions and recommendations regarding sitedevelopment. The scope of this study includes the following items:
1. A literature review of available published geotechnical and geologic data pertinent to the projectsite.
2. A field study consisting of site reconnaissance, exploratory borings, and Cone Penetration Test(CPT) soundings in order to formulate a description of the sub-surface conditions at the Site.
3. Laboratory testing performed on representative soil samples that were collected during our fieldstudy.
4. A review of regional faulting and seismicity hazards, landslide potential, surface water andgroundwater conditions, and liquefaction hazards.
5. Engineering analysis of the data gathered during our literature review, field study, and laboratorytesting.
6. Development of recommendations for site preparation and grading as well as geotechnical designcriteria for foundations.
7. Preparation of this report that summarizes our findings, conclusions, and recommendationsregarding engineering geology aspects of the project.
3.0 FIELD AND LABORATORY INVESTIGATION
The field investigation was conducted from January 8 through 11, 2013 using a track-mounted CME 55drill rig and an International Paystar 5000 CPT (Cone Penetration Test) Rig. Four eight-inch diameterexploratory borings were advanced on the operations deck to a maximum depth of 40.0 feet below groundsurface (bgs) at the approximate locations indicated on Plate 1A, Site Engineering Geology Map. Two 2.5-inch diameter rock core borings were advanced on the west borrow slope to a maximum depth of 75.0 feetbelow ground surface at the approximate locations indicated on Plate 1A. Five 1.5-inch diameter CPTsoundings were also advanced on the operations deck to a maximum depth of 105.0 feet below groundsurface (bgs) at the approximate locations indicated on Plate 1A. Sampling methods included the StandardPenetration Test utilizing standard split-spoon sampler (SPT) without liners, Modified California sampler(CA) with liners, and NQ rock coring barrel with recovery liner. The CME 55 drill rig was equipped withan automatic hammer, which has an efficiency of approximately 80 percent and was used to obtain testblow counts in the form of N-values.
October 4, 2013 Project No. SB00314-1
5
Figure 3: CPT and Boring Locations
Five CPT soundings were performed for this investigation on the operations deck. Two soundings werepushed within the refuse limits and three were pushed along the center of the operations deck. Soundingswere pushed to termination depths varying from 33 to 107 feet bgs. Soundings were backfilled withbentonite chips.
Six borings were drilled during the investigation for this field study to determine the depth to formationalunits at the operations deck. The boring logs are presented in Appendix A. Boring B-1 encounteredartificial fill in a slightly moist condition to a depth of 10 feet bgs. Boring B-2 encountered artificial fill toa depth of 25 feet bgs. Methane gas was detected in the four gas monitors while drilling Boring B-2.Boring B-3 encountered artificial fill to a depth of 25 feet bgs. Boring B-4 encountered artificial fill to adepth of 35 feet bgs underlain by siltstone units of the Rincon Formation to a termination depth of 40 feetbgs. Boring B-5 and B-6 were drilled utilizing NQ rock coring equipment on the upper bench of the westborrow slope. Boring B-5 encountered Rincon Shale from the surface to a termination depth of 65 feet bgs.Boring B-6 encountered Rincon Shale from the surface to a termination depth of 75 feet bgs. Borings werebackfilled with bentonite powder and native cuttings.
Previous subsurface investigations have been performed on the Operations Deck during the followingreferenced reports:
Geo-Logic Associates, 2007, Slope Stability Evaluation, Operations Center Fill Slope, TajiguasLandfill, Santa Barbara County, California, Project No. 2007-0003, dated April 5, 2007.
Willdan Geotechnical, 2010, Geotechnical Engineering Investigation Report, Tajiguas Landfill,2005 Storm Drain Distress Mitigation, Santa Barbara County, California, Project No. 100366,dated November 29, 2010.
October 4, 2013 Project No. SB00314-1
6
A total of 18 CPT Sounding were performed for the referenced Geotechnical Engineering InvestigationReport (Willdan, 2010) along the storm drain alignment varying from 19 to 85 feet below ground surface.A total of 5 borings were also drilled throughout the operations deck for the referenced Slope StabilityEvaluation (Geo-Logic Associates, 2007) varying from 16 to 26 feet bgs.
Data gathered during the field investigation suggest that soil materials in the vicinity of the Site consist ofartificial fill, municipal solid waste (MSW), and Rincon Formation. The surface material at the Sitegenerally consisted of reddish brown to brown silty SAND (SM) with gravel to light brown clayey SAND(SC) with gravel termed artificial fill. The sub-surface materials consisted of gray to light brownCLAYSTONE observed as slightly moist and moderately hard termed Rincon Formation. Groundwaterwas not encountered in any of the borings.
During the boring/coring operations the soils encountered were continuously examined, visually classified,and sampled for general laboratory testing. A project engineer has reviewed a continuous log of the soilsencountered at the time of field investigation. See Appendix A for the Boring Logs from the fieldinvestigation.
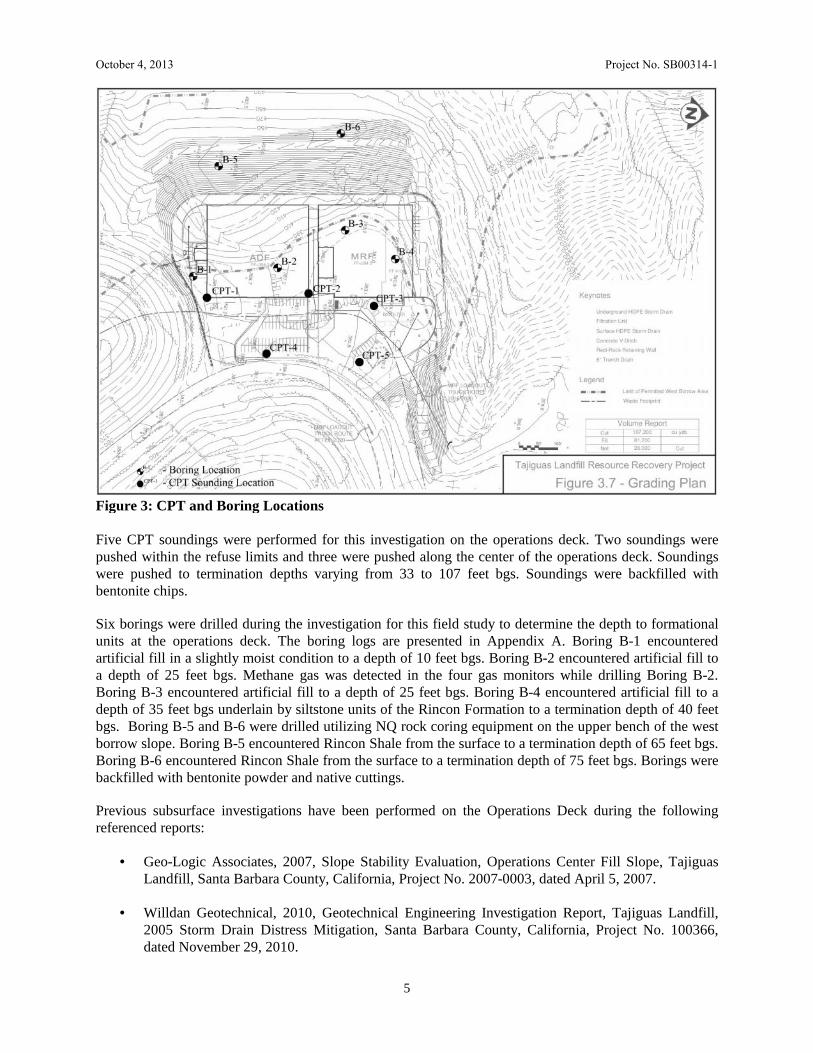
Laboratory tests were performed on soil samples that were obtained from the Site during the fieldinvestigation. The results of these tests are listed below in Table 1: Engineering Properties. Laboratory datareports and detailed explanations of the laboratory tests performed during this investigation are provided inAppendix B.
Table 1: Engineering Properties
4.0 ENGINEERING GEOLOGY INVESTIGATION
4.1 Regional Geology
The Tajiguas Landfill is located on the south flank of the Santa Ynez Mountains, a component of theTransverse Range Geomorphic Province. This geomorphic province is characterized by generally east-westtrending mountain ranges and intervening valleys. Older uplifted bedrock is exposed in the mountains: thevalleys are filled with sedimentary rocks and alluvial deposits. The Transverse Ranges are bordered by the
Sam
ple
Nam
e
Sample Description
USC
SSp
ecif
icat
ion
Pla
stic
ity
Ind
ex
Exp
ansi
on I
ndex
Exp
ansi
onP
oten
tial
Max
imum
Dry
Den
sity
,d
(pcf
)
Opt
imum
Moi
stur
e(%
)
Ang
le o
f In
tern
alF
rict
ion,
(d
eg.)
Coh
esio
n, c
(ps
f)
A Dark Yellowish Brown Clayey SAND SC 24 67 Medium 128.8 10.0 - -
B Dark Yellowish Brown Clayey SAND SC - - - 130.6 8.1 - -
C Light Gray CLAYSTONE CH 26 88 Medium 107.0 17.4 25° 301
B-3 @4 ft bgs
Dark Olive Brown Sandy CLAY CL - - - - - 31° 651
B-6 @3 ft bgs
Dark Gray CLAYSTONE CL - - - - - 7° 1417
October 4, 2013 Project No. SB00314-1
7
Santa Monica fault to the south and the Santa Ynez fault to the north. The Santa Ynez Range extends fromGaviota Canyon eastward to the Matilija Gorge in Ventura County. The range is composed of a singlemain crest that is continuous for approximately 50 miles (80 km). The northern flank of the Santa YnezRange is a steep escarpment created by uplift along the Santa Ynez fault. The southern flank, where theTajiguas Landfill site is located is characterized by south-plunging ridges that separate incised drainagecanyons. These canyons generally include a perennial stream bounded by steep east- and west-facingslopes. The indurated sandstone units typically form prominent, more resistant outcrops and generallysupport dense chaparral vegetation. The poorly indurated and finer-grained units typically form moregently-sloping, grass-covered hills (Geosyntec, 2008).
4.2 Local Geology
Locally, bedrock underlying the site is the Rincon Shale (Tr), Vaqueros Sandstone (Tvq), and SespeFormation (Tsp) as depicted on Plate 1A through 1C, Site Engineering Geology Map. Dibblee, 1988mapped the property as underlain by early Miocene age (23.8-16.4 million years before present {mybp})Rincon Shale (Tr) and Vaqueros Sandstone (Tvq) and Oligocene age (33.7-23.8 mybp) Sespe Formation(Tsp). Our investigation and surface mapping of the area encountered units of the Rincon Shale, VaquerosSandstone, and Sespe Formation underlying artificial fill, municipal solid waste, and landslide deposits.Information derived from subsurface exploration was used to classify subsurface soil and formational unitsand to supplement geologic mapping.
Plate 1A depicts Rincon Shale (Tr) and Vaqueros Sandstone (Tvq) throughout the operations deck areaoverlain by artificial fill, municipal solid waste, and landslide deposits. Plate 1B depicts the compostingarea (also identified as the top deck) underlain by MSW and the composting area runoff collection tankunderlain by Sespe Formation (Tsp). Plate 1C depicts Vaqueros Sandstone (Tvq) throughout the WellWater Storage and Recycled Water Storage Tanks. Plate 2A through 2C presents cross sections throughthe MRF and ADF buildings.
4.2.1 Surficial Units
Artificial Fill
Artificial fill was encountered at the operations deck at various depths. The operations deck wasconstructed to its current elevation in 2007. The artificial fill encountered during the field investigation ofthe operation deck consisted of reddish brown to light brown sandy CLAY (CH) with gravel to light brownclayey SAND (SC) with gravel encountered in a slightly moist and medium dense to dense condition.Methane gas was detected in surface monitors during drilling operations.
Municipal Solid Waste with Intermediate Soil Cover
MSW with intermediate soil cover extends within the eastern one-third of the existing operations deck (asobserved on Plate 1A) and completely underlies the composting area (Plate 1B). The depth of refuse at theoperations deck was observed to be 80-95 feet thick. A previous analysis by SWT Engineering, 2009,estimates the thickness of the MSW under the proposed composting area to vary from 21-313 feet thick.The proposed composting area is currently within an active area of landfilling and it is our understandingthat up to an additional 80 feet of MSW will be placed prior to the establishment of the composting area.

October 4, 2013 Project No. SB00314-1
8
4.2.2 Formational Units
Rincon Shale
Dibblee, 1988 describes the early Miocene age (11-1.8 mybp) Rincon Shale as “poorly bedded gray clayshale or claystone.” The Rincon Shale was observed in cut slopes throughout the operations deck includingthe west borrow cut slope to the west. The Rincon Shale at the site was observed as light gray SHALE andCLAYSTONE in a dry to slightly moist condition. The Rincon Shale is observed to be massive, fresh toslightly weathered (severely weathered at the surface), and moderately soft to moderately hard. Thefractures within the Rincon Shale unit varied from friable at the surface to slightly fractured at depth.Bedding was not observed within the existing cut slope, however a continuous layer of light browninclusions indicated a east-west strike direction, dipping south. Dibblee, 1988 depicts bedding attitudeswithin the Rincon Shale in the vicinity of the site striking in a slight SW-NE direction, dipping 35 to 69degrees south.
Based on rock coring borings, Borings B-5 and B-6, the Rincon Shale is observed to be fair to good rockquality based on Rock Quality Determination (RQD) with layers of poor, very poor, and excellent quality.A recovery of 80 to 100 percent was also observed during the coring operations with localized layersranging from 38 to 70 percent recovery.
Vaqueros Sandstone
Dibblee, 1988 describes the early Miocene age (11-1.8 mybp) Vaqueros Formation as “south of SantaYnez fault: light gray calcareous sandstone.” The Vaquerous Sandstone at the Site was observed as lightbrown Sandstone observed in a dry and hard condition. Dibblee, 1988 depicts bedding attitudes within theVaqueros Sandstone in the vicinity of the site striking in a slight SW-NE direction, dipping 40 to 57degrees south.
Sespe Formation
Dibblee, 1988 describes the Oligocene age (33.7-23.8 mybp) Sespe Formation as “Gray to tan sandstoneand green to red siltstone and claystone; basal part intertongues westward with Alegria Formation south ofSanta Ynez fault.” The Sespe Formation at the Site was observed as tan to red to green thinly to thicklybedded siltstone and claystone observed in a dry and hard condition. Dibblee, 1988 depicts beddingattitudes within the Sespe Formation in the vicinity of the site striking in a slight SW-NE direction, dipping40 to 54 degrees south.
4.3 Surface and Groundwater Conditions
Surface drainage at the proposed location of the MRF and ADF buildings will flow toward the operationsdeck then into the proposed storm drain system. Surface drainage at the proposed location of thecomposting area up to a 25-year, 24-hour storm will be collected and stored in the Composting AreaRunoff Collection Tank, anything greater will overflow to the storm drain system. Surface drainage in thevicinity of the water tank pads (east and west) will sheet flow off the pad to the west. No springs or seepswere observed at the project site. No evidence of shallow groundwater was observed within the borings atthe Site.
4.4 Landslides
Dibblee, 1988 did not map landslides at the property. During site mapping and identified in previousreports (GeoLogic, 2008), two surficial landslides were observed within the cut slope on the west borrow
October 4, 2013 Project No. SB00314-1
9
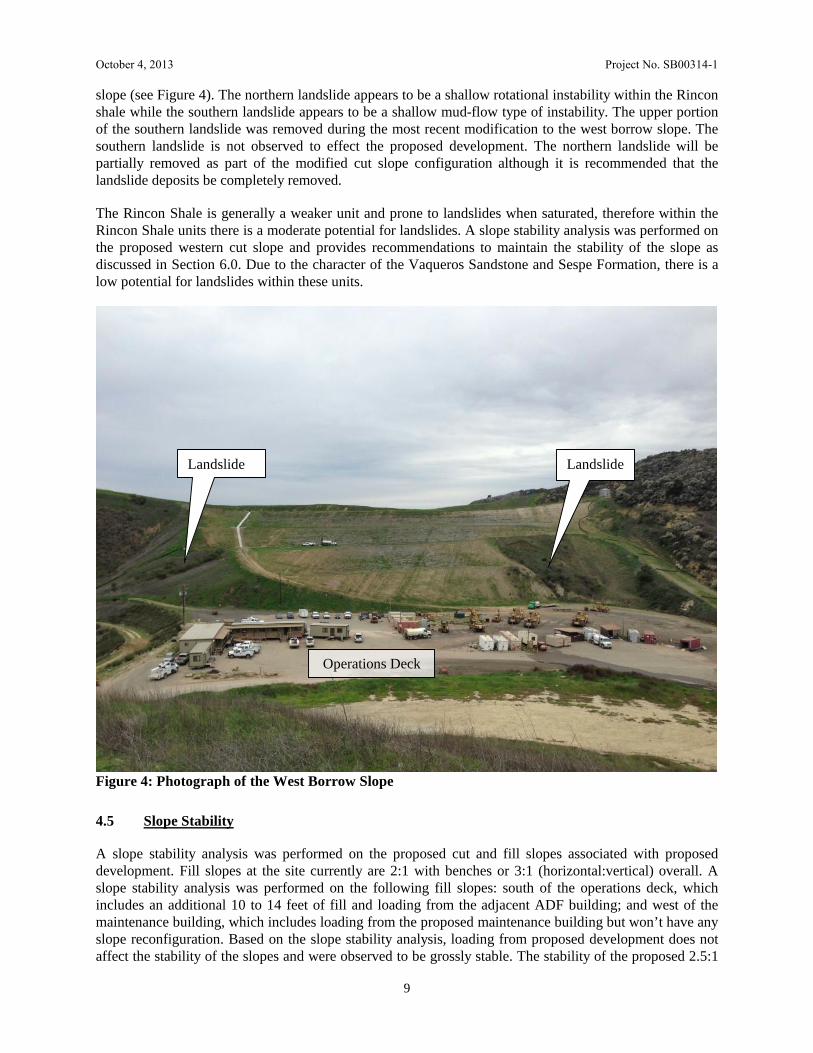
slope (see Figure 4). The northern landslide appears to be a shallow rotational instability within the Rinconshale while the southern landslide appears to be a shallow mud-flow type of instability. The upper portionof the southern landslide was removed during the most recent modification to the west borrow slope. Thesouthern landslide is not observed to effect the proposed development. The northern landslide will bepartially removed as part of the modified cut slope configuration although it is recommended that thelandslide deposits be completely removed.
The Rincon Shale is generally a weaker unit and prone to landslides when saturated, therefore within theRincon Shale units there is a moderate potential for landslides. A slope stability analysis was performed onthe proposed western cut slope and provides recommendations to maintain the stability of the slope asdiscussed in Section 6.0. Due to the character of the Vaqueros Sandstone and Sespe Formation, there is alow potential for landslides within these units.
Figure 4: Photograph of the West Borrow Slope
4.5 Slope Stability
A slope stability analysis was performed on the proposed cut and fill slopes associated with proposeddevelopment. Fill slopes at the site currently are 2:1 with benches or 3:1 (horizontal:vertical) overall. Aslope stability analysis was performed on the following fill slopes: south of the operations deck, whichincludes an additional 10 to 14 feet of fill and loading from the adjacent ADF building; and west of themaintenance building, which includes loading from the proposed maintenance building but won’t have anyslope reconfiguration. Based on the slope stability analysis, loading from proposed development does notaffect the stability of the slopes and were observed to be grossly stable. The stability of the proposed 2.5:1
Landslide
Operations Deck
Landslide

October 4, 2013 Project No. SB00314-1
10
(horizontal:vertical) cut slope west of the operations deck was also analyzed and was observed to begrossly stable, provided that recommendations provided in this report are followed. Further discussion ofthe slope stability analyses are presented in Section 6.0.
4.6 Severe Erosion
The potential for severe erosion is considered low provided that vegetation and erosion control measuresare implemented immediately after the completion of grading. It is recommended that the resulting slopeface be covered with erosion mat and hydroseeded immediately following construction of the slopes. Thiswill also serve to minimize surficial erosion due to irrigation and/or rainfall. It is recommended that erosioncontrol measure be implemented immediately following the completion of construction for surfaces notbeing improved as designed by the project civil engineer.
4.7 Regional Faulting and Seismicity
Similar to the surrounding areas, the Site may be affected by moderate to major earthquakes centered onone of the known large, active faults listed in Table 2 below. Moment magnitudes are expressed, althoughany significant event on these faults could result in moderate to severe ground shaking at the subject site.The potential for ground failure of any portion of the Site during ground shaking is considered low.
Table 2: Active Faults Near the Subject Property
Closest Active Faults to SiteApproximate Distance
(miles)Moment Magnitude
(Mw)
Santa Ynez Fault 15.5 7.1
Los Alamos Fault 16.0 6.8
San Andreas Fault 52.0 8.5
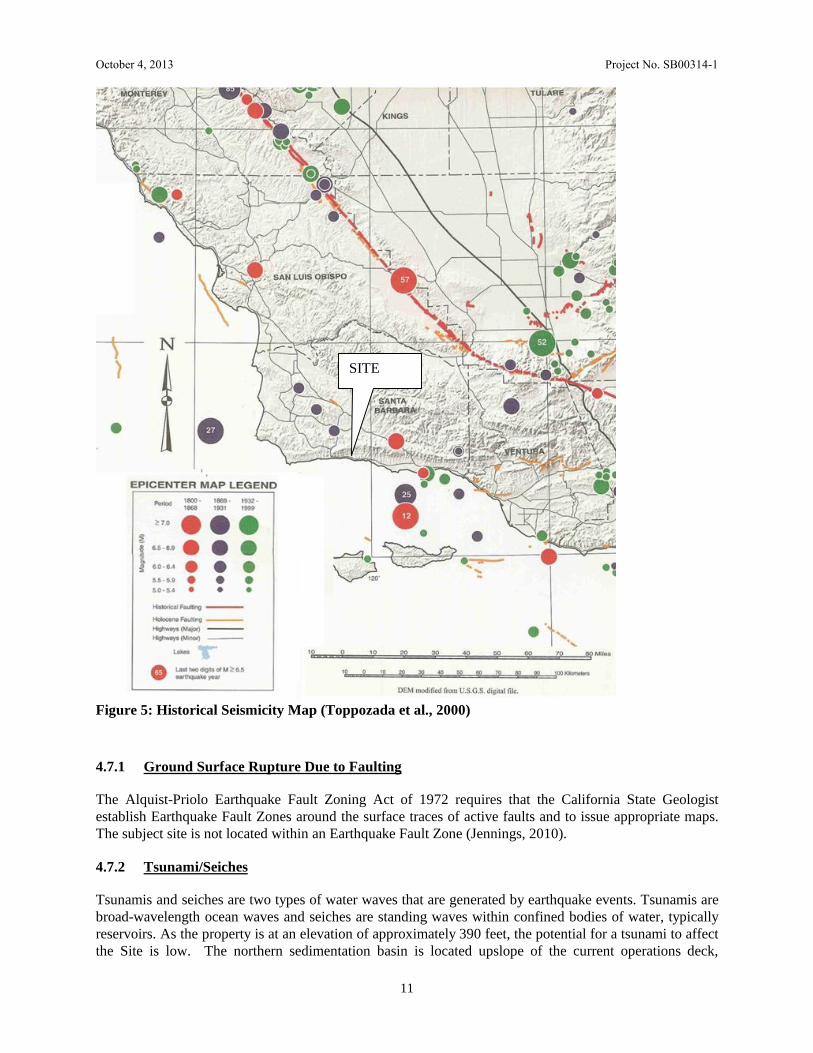
The closest known Holocene age fault is the Santa Ynez Fault located approximately 15.5 miles northwestof the Site (Jennings, 2010), however the San Andreas Fault is the most likely active fault to produceground shaking at the Site. Figure 5 depicts significant historical earthquakes in the region.
October 4, 2013 Project No. SB00314-1
11
Figure 5: Historical Seismicity Map (Toppozada et al., 2000)
4.7.1 Ground Surface Rupture Due to Faulting
The Alquist-Priolo Earthquake Fault Zoning Act of 1972 requires that the California State Geologistestablish Earthquake Fault Zones around the surface traces of active faults and to issue appropriate maps.The subject site is not located within an Earthquake Fault Zone (Jennings, 2010).
4.7.2 Tsunami/Seiches
Tsunamis and seiches are two types of water waves that are generated by earthquake events. Tsunamis arebroad-wavelength ocean waves and seiches are standing waves within confined bodies of water, typicallyreservoirs. As the property is at an elevation of approximately 390 feet, the potential for a tsunami to affectthe Site is low. The northern sedimentation basin is located upslope of the current operations deck,
SITE
October 4, 2013 Project No. SB00314-1
12
however existing 48-inch storm drain inlets are also located upslope which would flow inundated waterbeneath the operations deck. Therefore, the potential for flooding associated with a seismic event (seiches)is considered low.
4.7.3 Seismically Induced Slope Failure and Settlement
A slope stability analysis of the proposed fill slopes were performed under seismic conditions. Adescription of the analysis is presented in Section 6.0. Based on the results of the slope stability analysis,the proposed cut/fill slopes appear to be grossly stable under psuedo-static (seismic) conditions, thereforethe potential for seismically induced slope failure at the site is low. Seismically induced settlement occursin loose to medium dense unconsolidated soil above groundwater. These soils compress (settle) whensubject to seismic shaking. The settlement can be exacerbated by increased loading, such as from theconstruction of buildings. Based on the presence of clay in the fill and formational units, there is a lowpotential for seismically induced settlement at the Site, however there is a high potential within the MSW.The MRF and ADF buildings are proposed in the vicinity of MSW, however foundation recommendationsare provided to help mitigate settlement effects.
5.0 SEISMIC DESIGN CONSIDERATIONS
5.1 Seismic Hazard Analysis
According to section 1613 of the 2010 CBC (CBSC, 2010), all structures and portions of structures shouldbe designed to resist the effects of seismic loadings caused by earthquake ground motions in accordancewith the Minimum Design Loads for Buildings and Other Structures (ASCE7) (ASCE, 2006). ASCE7considers the most severe earthquake ground motion to be the ground motion caused by the MaximumConsidered Earthquake (MCE) (ASCE, 2006), which is defined in Section 1613 of the 2010 CBC to beshort period SMS and 1-second period SM1, spectral response accelerations.
The amax of the Site depends on several factors, which include the distance of the Site from known activefaults, the expected magnitude of the MCE, and the Site soil profile characteristics.
As per section 1613.5.5 of the 2010 CBC (CBSC, 2010), the Site soil profile classification is determinedby the average soil properties in the upper 100 feet of the Site profile. Based on the (N1)60 values calculatedfor the in-situ tests performed during the field investigation, the Site was defined as Site Class D, Stiff Soilprofile per Table 1613.5.2 of the 2010 CBC (CBSC, 2010).
According to section 11.2 of ASCE7 (ASCE, 2006) and section 1613 of the 2010 CBC (CBSC, 2010),buildings and structures should be specifically proportioned to resist Design Earthquake Ground Motions(Design amax). ASCE7 defines the Design amax as “the earthquake ground motions that are two-thirds of thecorresponding MCE ground motions” (ASCE, 2006, p. 109). The Design amax for the Site is equal toSD1=0.730 and SDS=1.264, which are 1-second period and short period design spectral responseaccelerations that are equal to two-thirds of the amax or MCE for the Site.
Site coordinates of 34.4853 degrees north latitude and -120.1428 degrees west longitude and a searchradius of 100 miles were used in the probabilistic seismic hazard analysis.
5.2 Structural Building Design Parameters
Structural building design parameters within chapter 16 of the 2010 CBC (CBSC, 2010) and sections11.4.3 and 11.4.4 of ASCE7 (ASCE, 2006) are dependent upon several factors, which include site soilprofile characteristics and the locations and characteristics of faults near the Site. As described in section5.1 of this report, the Site soil profile classification was determined to be Site Class D. This Site soil profile

October 4, 2013 Project No. SB00314-1
13
classification and the latitude and longitude coordinates for the Site were used to determine the structuralbuilding design parameters.
Spectral Response Accelerations and Site Coefficients were obtained from the U.S. Seismic Design Mapsapplication; this application is available from the United States Geological Survey website (USGS, 2012).This web program utilizes the methods developed in the 2006 and 2009 editions of the InternationalBuilding Code Recommended Provisions for Seismic Regulations for New Buildings and Other Structuresand user-inputted Site latitude and longitude coordinates to calculate seismic design parameters andresponse spectra (both for period and displacement), for Site Classifications A through E. This data ispresented in tabular form in Table 3: 2010 California Building Code, Chapter 16, Structural DesignParameters. Analysis of the Design Spectral Response Acceleration Parameters for the Site and of theOccupancy Category for the proposed structure assign to this project a Seismic Design Category of D perTables 1613.3.5.6(1) and 1613.3.5.6(2) of the 2010 CBC (CBSC, 2010).
Table 3: 2010 California Building Code, Chapter 16, Structural Design Parameters
Site Class - Soil Profile Type D - Stiff Soil Profile
Mapped Spectral Response Accelerations andSite Coefficients
SS = 1.896, S1 = 0.730Fa = 1.000, Fv = 1.500
Adjusted Maximum Considered EarthquakeSpectral Response Accelerations
SMS = 1.896SM1 = 1.095
Design Spectral Response AccelerationParameters
SDS = 1.264SD1 = 0.730
Occupancy Category(from Table 1604.5, 2010 CBC)
II
Seismic Design Category – Short Period Accel.(from Table 1613.5.6(1), 2010 CBC)
D
Seismic Design Category – Long Period Accel.(from Table 1613.5.6(2), 2010 CBC)
D
5.3 Design Response Spectra – 2010 CBC
According to section 11.4.5 of ASCE7 (ASCE, 2006), a design response spectrum for a site may berequired in order to design structures to resist lateral forces caused by ground motions at the Site. Thedesign spectral response acceleration parameters, listed in Table 3: 2010 California Building Code,Chapter 16, Structural Design Parameters, are used to produce the design response spectrum. The U.S.Seismic Design Maps application (USGS, 2012) was used to construct a design response spectrum for theSite, which is shown in Figure 6: Design Response Spectra – 2010 CBC.

October 4, 2013 Project No. SB00314-1
14
5.4 Liquefaction Potential
In the context of soil mechanics, liquefaction is the process that occurs when the dynamic loading of a soilmass causes the shear strength of the soil mass to rapidly decrease. Liquefaction can occur in saturatedcohesionless soils.
The most typical liquefaction-induced failures include consolidation of liquefied soils, surface sand boils,lateral spreading of the ground surface, bearing capacity failures of structural foundations, flotation ofburied structures, and differential settlement of above-ground structures.
Liquefiable soils must undergo dynamic loading before liquefaction occurs. Ground motion from anearthquake may induce large-amplitude cyclic reversals of shear stresses within a soil mass. Repetitivelateral and vertical loading and unloading usually results from this process. This process is considered tobe dynamic loading. In a liquefiable soil mass, liquefaction may occur as a result of the dynamic loadingcaused by ground motion produced by an earthquake.
The presence of loose, poorly graded, fine sand material that is saturated by groundwater within an areathat is known to be subjected to high intensity earthquakes and long-duration ground motion are the keyfactors that indicate potentially liquefiable areas and conditions that lead to liquefaction.
Based on the consistency and relative density of the in-situ soils (clay/rock) and the depth to groundwaterthe potential for seismic liquefaction of soils at the Site is very low.
6.0 NUMERICAL SLOPE STABILITY
As requested, a numerical slope stability analysis was conducted on the following slopes:
Fill Slope: 2:1 (horizontal:vertical) with benches south of the operations deck, which includes anadditional 10 to 14 feet of fill and loading from the adjacent ADF building;
Fill Slope: 2:1 (horizontal:vertical) west of the maintenance building, which includes loading from theproposed maintenance building but won’t have any slope reconfiguration;
Cut Slope: 2.5:1 (horizontal:vertical) west of the operations deck which includes a 15 foot wide bench.
Figure 6: Design Response Spectra – 2010 CBC
October 4, 2013 Project No. SB00314-1
15
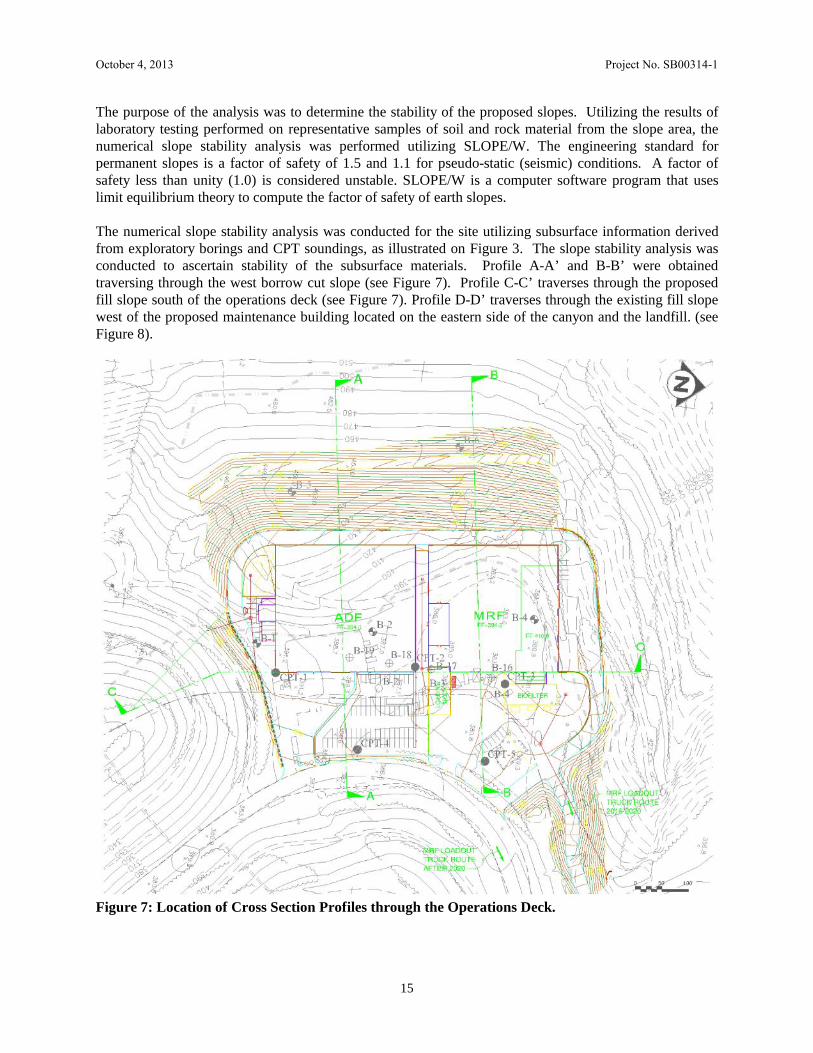
The purpose of the analysis was to determine the stability of the proposed slopes. Utilizing the results oflaboratory testing performed on representative samples of soil and rock material from the slope area, thenumerical slope stability analysis was performed utilizing SLOPE/W. The engineering standard forpermanent slopes is a factor of safety of 1.5 and 1.1 for pseudo-static (seismic) conditions. A factor ofsafety less than unity (1.0) is considered unstable. SLOPE/W is a computer software program that useslimit equilibrium theory to compute the factor of safety of earth slopes.
The numerical slope stability analysis was conducted for the site utilizing subsurface information derivedfrom exploratory borings and CPT soundings, as illustrated on Figure 3. The slope stability analysis wasconducted to ascertain stability of the subsurface materials. Profile A-A’ and B-B’ were obtainedtraversing through the west borrow cut slope (see Figure 7). Profile C-C’ traverses through the proposedfill slope south of the operations deck (see Figure 7). Profile D-D’ traverses through the existing fill slopewest of the proposed maintenance building located on the eastern side of the canyon and the landfill. (seeFigure 8).
Figure 7: Location of Cross Section Profiles through the Operations Deck.
October 4, 2013 Project No. SB00314-1
16
Figure 8: Location of Cross Section Profile through the Maintenance Building Pad (see Figure 2 forlocation).
6.1 Slope/W Discussion
SLOPE/W was utilized to determine the critical factor of safety. SLOPE/W performs the stability analysisby passing a slip surface through the earth mass and dividing it into vertical slices. To compute the factorof safety, SLOPE/W utilizes the theory of limit equilibrium of forces and moments. The limit equilibriummethod may be utilized to analyze circular and noncircular failure surfaces and assumes that:
1. The soil behaves as a Mohr-Coulomb material.2. The factor of safety of the cohesive component of strength and the frictional component of
strength are equal for all soils involved.3. The factor of safety is the same for all slices.
The General Limit Equilibrium formulation and solution may be used to simulate most of the commonlyused methods of slices. The characteristics of Spencer’s method are identified as an “satisfies allconditions of equilibrium; applicable to any shape of slip surface; assumes that inclinations of side forcesare the same for every slice; side force inclination is calculated in the process of solution so that allconditions of equilibrium are satisfied; accurate method; 3N equations and unknowns” (Duncan, 1996).
October 4, 2013 Project No. SB00314-1
17
Each potential slip surface results in a different value for factor of safety. The smaller the factor of safety(the smaller the ratio of shear strength to shear stress required for equilibrium), the greater the potential forfailure to occur by movement on that surface. Movement is most likely to occur on the slip surface withthe minimum factor of safety. This is referred to as the critical slip surface. However, for movement tooccur, the ratio must be below 1.0.
The general method of analysis involves computing the factor of safety and associated slip surface formultiple nodes within a grid-like pattern on the diagram, shown above the ground surface. By placing a setof radius lines within the soil profile, the slip surfaces are forced to reside within and tangent to the radiuslines. Through computer iterations, the program derives a set of factor of safety contour lines. Theminimum value within the set of contour lines is the resulting minimum factor of safety and produces thecritical slip surface.
6.2 Laboratory Test Results
Direct shear tests were performed on soil and rock samples from the subsurface investigation on theoperations deck. The purpose of this data was to determine the soil resistance to deformation (shearstrength), interparticle attraction (cohesion), and resistance to inter-particle slip (angle of internal friction).Angle of internal friction and cohesion values for all formational units was utilized from laboratory testresults. The boring logs present the location that samples were collected and laboratory results are attachedat the end of this report. The laboratory sheets depict the dry unit weight of soil and have been convertedto the unit weight (γ) for use in the stability analysis. Table 7.1 (ASCE, 2002) indicates to “reduce peakstrength by 30%” for “saturated, fine-grained, overconsolidated, stiff alluvium or clay bedrock withmassive or supported bedding.” Therefore, the laboratory shear strength of the Rincon Shale was reducedby 30%.The utilized results are presented below in Table 4.
Table 4: Shear Results
Engineering PropertiesB-3 @ 4’
(Fill)B-6 @ 3’
(Tr)Sample C
(Tr) - RemoldedAngle of Internal Friction, ° 31 7 25
Cohesion, C 651 psf 992 psf (reduced 30%) 301 psf
Moisture density relation curves, developed in accordance with ASTM D1557-91, five-layer method, wereperformed on representative samples obtained from the slope area. The purpose of the relation curve is todetermine the maximum density and optimum moisture contents, as well as evaluate the stability of thesoils. The results are presented below in Table 5.
Table 5: Maximum Density and Moisture Content Test Results
Engineering PropertiesSample A
(Fill)Sample C
(Tr)Maximum Density 128.8 pcf 107.0 pcf
Optimum Water Content 10.0 % 17.4 %
As the fill slope west of the proposed maintenance building pad is not proposed to be modified, asubsurface investigation was not performed nor were laboratory samples obtained. The fill at the padappears to be derived from the Sespe Formation located in the immediate vicinity of the site. Theparameters for the Sespe Formation from the previous slope stability analysis (Geosyntec, 2007) wereutilized to verify the influence of loading from the proposed building on the stability of the slope. An angleof friction of 30, cohesion of 600 psf, and a unit weight of 140 pcf were utilized in the analysis.
October 4, 2013 Project No. SB00314-1
18
6.3 Discussion of Modeling Conditions
Modeling conditions for the following slopes included:
The 2.5:1 (horizontal:vertical) cut slope west of the operations deck included: 1) a proposed 2.5:1cut slope 40 feet in height, a 15 foot wide bench, then extending up another 8 to 20 feet at 2.5:1where it daylights with the existing 3:1 cut slope (Profile A-A and B-B); 2) underlain by RinconFormation (Tr); and 3) no groundwater. Groundwater was not modeled due to a lack ofgroundwater observed within the subsurface investigation and the operations deck being 390 feetor greater above sea level height.
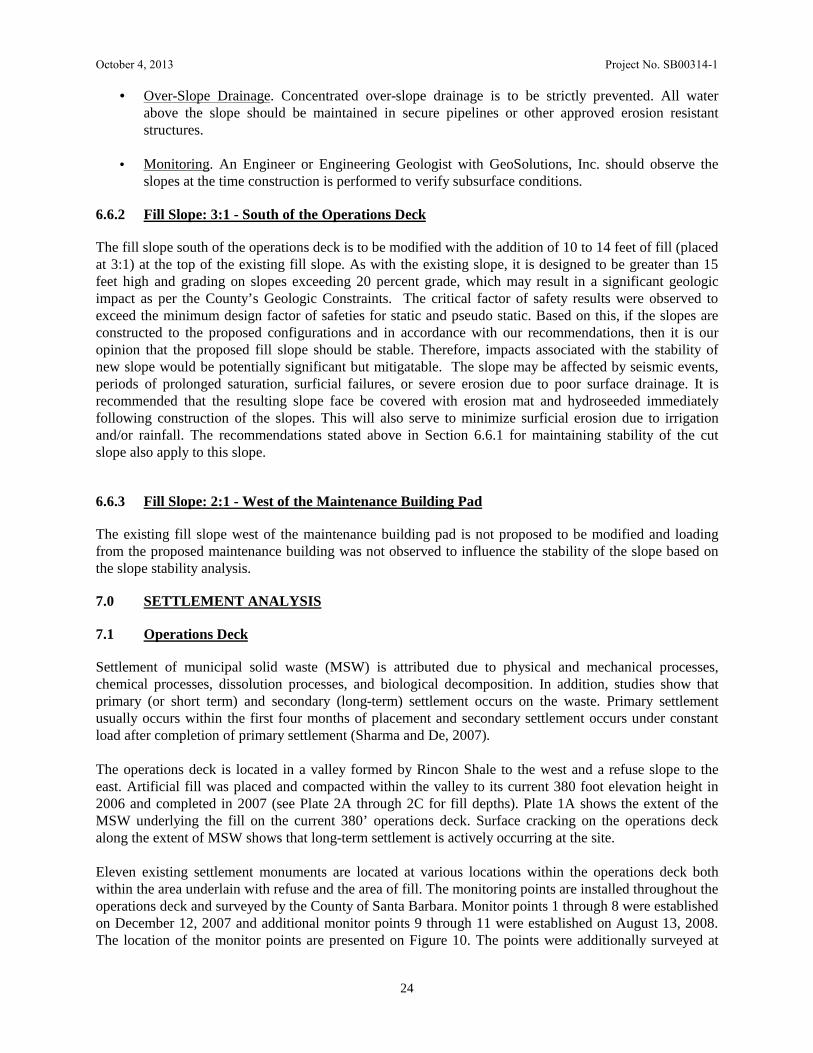
The 2:1 (horizontal:vertical) fill slope south of the operations deck included: 1) the existing 85 feetin height at 2:1 (horizontal:vertical), benched every 40 feet, with the addition of 10 to 14 feet offill proposed at 3:1 at the top of the slope (Profile C-C); 2) a maximum of 85 feet of fill; 3)underlain by Rincon Formation (Tr); and 4) no groundwater. Groundwater was not modeled due toa lack of groundwater observed within the subsurface investigation and the operations deck being390 feet above sea level height. In addition, 5,000 lbs per square foot was modeled as a dead loadfor the ADF facility (2,500 psf for the building load plus an assumed 2,500 psf for the anticipatedweight of the refuse stored within the ADF facility) located a minimum distance of 30 feet fromthe top of the proposed fill slope.
The 2:1 (horizontal:vertical) fill slope west of the maintenance building pad included: 1) theexisting 250 feet in height (145 feet of fill) at 2:1 (horizontal:vertical), benched every 40 feet(Profile D-D); 2) a maximum of 70 feet of fill; 3) underlain by Sespe Formation (Tsp); and 4) nogroundwater. Groundwater was not modeled due the existing pad being 630 feet above sea levelheight. The slope configuration is not proposed to change, however 2,500 lbs per square foot wasmodeled as a dead load for the proposed maintenance building located a minimum distance of 50feet from the top of the fill slope.
The depth of subsurface materials was determined by the project Engineering Geologist by studyingsurface geologic conditions, observations during exploratory borings, and available geologic maps.
6.4 Static Slope Stability Analysis
Our analysis resulted in a range of values for factor of safety and their respective slip surfaces. The lowestfactor of safety value corresponds to the critical slip surface. This critical slip surface does not necessarilyresult in the largest slip surface. The critical static factors of safety values are presented in Table 6. Thepotential critical slip surfaces for static conditions are presented on Figures 9-1A through 9-4B.
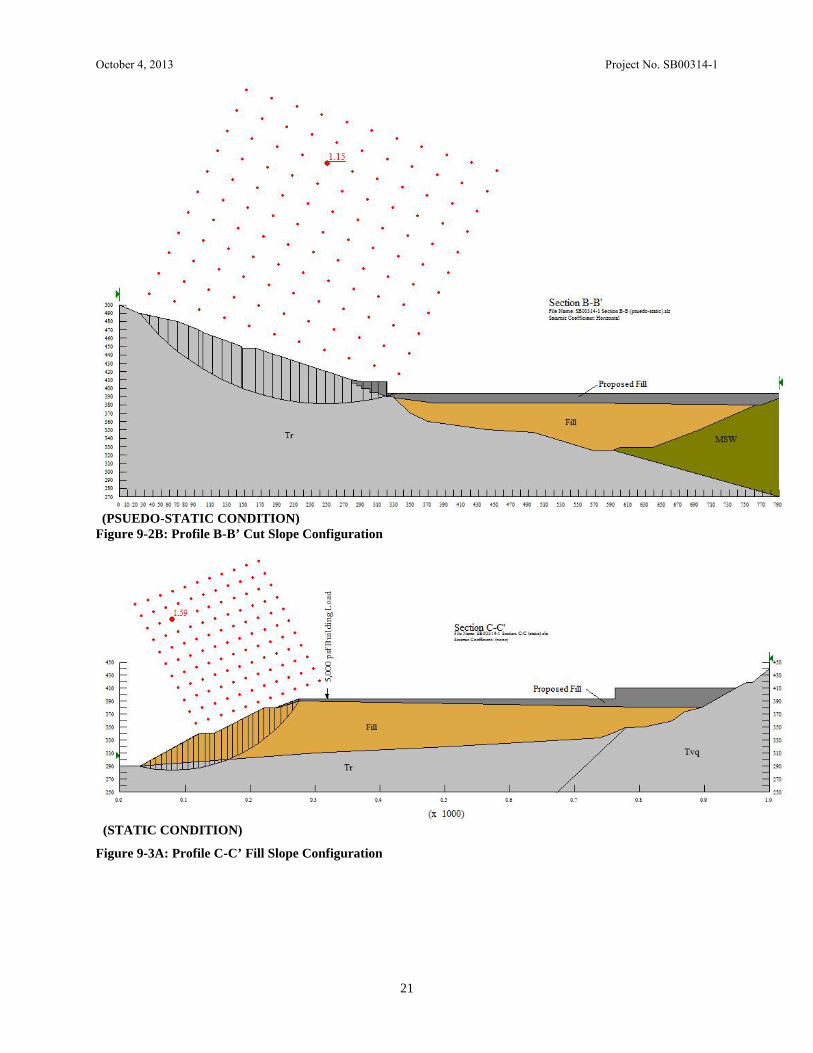
Table 6: Factors of Safety Results
ProfileStatic
Factor of SafetyPsuedo-Static
Factor of SafetyA-A’ – Cut Slope – West of Operations Deck 1.62 1.11B-B’ – Cut Slope – West of Operations Deck 1.72 1.15C-C’ – Fill Slope – South of Operations Deck 1.59 1.12
D-D’ – Fill Slope – West of Maintenance Building Pad 2.02 1.41
The stability analysis was performed for the configuration illustrated in Profile A-A’ through D-D’. Theminimum engineering standard for static factors of safety is 1.5. Profile A-A’ through D-D’ resulted incritical static factor of safety values above the minimum standard, indicating that they reflect stable
October 4, 2013 Project No. SB00314-1
19
conditions. The loading of the proposed buildings was observed not to influence the static factor of safetyof the fill slopes for Profile C-C’ and D-D’.
6.5 Pseudo-Static Slope Stability Analysis
As the slope may be affected by seismic events, a dynamic loading condition was applied to the slopemodel (pseudo-static conditions). As stated in Guidelines for Evaluating and Mitigating Seismic Hazardsin California (CDMG, 1997), “In California, many state and local agencies, on the basis of localexperience, require the use of a seismic coefficient of 0.15, and a minimum computed pseudo-static factorof safety of 1.0 to 1.2 for analysis of natural, cut, and fill slopes…These recommendations were: using apseudo-static coefficient of 0.10 for magnitude 6.5 earthquakes and 0.15 for magnitude 8.25 earthquakes,with an acceptable factor of safety of the order of 1.15.” Calculations for pseudo-static numerical analysiswithin these Iterations utilized a seismic coefficient of 0.15 g.
Table 6 presents the results of the pseudo-static numerical slope stability analysis. The numerical slopestability analysis resulted in a range of values for factor of safety. The lowest factor of safety valuecorresponds to the critical slip surface. This critical slip surface does not necessarily result in the largestslip surface. The critical static factors of safety values are presented in Table 6. The potential critical slipsurfaces for psuedo-static conditions are presented on Figures 9-1B through 9-4B.
The stability analysis was performed for the configuration illustrated in Profile A-A’ through D-D’. Theminimum engineering standard for pseudo-static factors of safety is 1.1. Profile A-A’ through D-D’resulted in critical pseudo-static factor of safety values above the minimum standard, indicatingthat they reflect stable conditions. The loading of the proposed buildings was observed not to influencethe pseudo-static factor of safety of the fill slopes for Profile C-C’ and D-D’.
(STATIC CONDITION)Figure 9-1A: Profile A-A’ Cut Slope Configuration

October 4, 2013 Project No. SB00314-1
20
(PSUEDO-STATIC CONDITION)Figure 9-1B: Profile A-A’ Cut Slope Configuration
(STATIC CONDITION)Figure 9-2A: Profile B-B’ Cut Slope Configuration
October 4, 2013 Project No. SB00314-1
21
(PSUEDO-STATIC CONDITION)Figure 9-2B: Profile B-B’ Cut Slope Configuration
(STATIC CONDITION)
Figure 9-3A: Profile C-C’ Fill Slope Configuration

October 4, 2013 Project No. SB00314-1
22
(PSUEDO-STATIC CONDITION)Figure 9-3B: Profile C-C’ Fill Slope Configuration
(STATIC CONDITION)Figure 9-4A: Profile D-D’ Fill Slope Configuration

October 4, 2013 Project No. SB00314-1
23
(PSUEDO-STATIC CONDITION)Figure 9-4B: Profile D-D’ Fill Slope Configuration
6.6 Discussion of Slope Stability Results
6.6.1 Cut Slope: 2.5:1 - West of the Operations Deck
The western borrow cut slope is to be modified from a 3H:1V slope to 2.5H:1V cut slope. As with theexisting slope, it is designed to be greater than 15 feet high and grading on slopes exceeding 20 percentgrade, which may result in a significant geologic impact as per the County’s Geologic Constraints. Theslopes include 15-foot wide benches every 40 feet in height as similar to the previous approved slopedesign. The critical factor of safety results was observed to exceed the minimum design factor of safetiesfor static and pseudo static. Based on this, if the slope is constructed to the proposed configurations and inaccordance with our recommendations, then it is our opinion that the proposed cut slope should be stable.Therefore, impacts associated with the stability of new slope would be less than significant. However, theslope may be affected by seismic events, periods of prolonged saturation, surficial failures, or severeerosion due to poor surface drainage. Commercial wastewater treatment units are proposed to be installedto treat and disinfect the wastewater so it can be used for spray or drip irrigation of approximately 2.5 acresof landscaped areas (cut slope) adjacent to the MRF and AD Facility. It is recommended that the resultingslope face be covered with erosion mat and hydroseeded immediately following construction of the slopes.This will also serve to minimize surficial erosion due to irrigation and/or rainfall. The following arerecommendations for maintaining stability of the cut slope:
Irrigation and Surface Drainage. Excess free water should not be allowed to pond. Surface gradesshould be maintained such that collected water is diverted and discharged away from the slopeface.
October 4, 2013 Project No. SB00314-1
24
Over-Slope Drainage. Concentrated over-slope drainage is to be strictly prevented. All waterabove the slope should be maintained in secure pipelines or other approved erosion resistantstructures.
Monitoring. An Engineer or Engineering Geologist with GeoSolutions, Inc. should observe theslopes at the time construction is performed to verify subsurface conditions.
6.6.2 Fill Slope: 3:1 - South of the Operations Deck
The fill slope south of the operations deck is to be modified with the addition of 10 to 14 feet of fill (placedat 3:1) at the top of the existing fill slope. As with the existing slope, it is designed to be greater than 15feet high and grading on slopes exceeding 20 percent grade, which may result in a significant geologicimpact as per the County’s Geologic Constraints. The critical factor of safety results were observed toexceed the minimum design factor of safeties for static and pseudo static. Based on this, if the slopes areconstructed to the proposed configurations and in accordance with our recommendations, then it is ouropinion that the proposed fill slope should be stable. Therefore, impacts associated with the stability ofnew slope would be potentially significant but mitigatable. The slope may be affected by seismic events,periods of prolonged saturation, surficial failures, or severe erosion due to poor surface drainage. It isrecommended that the resulting slope face be covered with erosion mat and hydroseeded immediatelyfollowing construction of the slopes. This will also serve to minimize surficial erosion due to irrigationand/or rainfall. The recommendations stated above in Section 6.6.1 for maintaining stability of the cutslope also apply to this slope.
6.6.3 Fill Slope: 2:1 - West of the Maintenance Building Pad
The existing fill slope west of the maintenance building pad is not proposed to be modified and loadingfrom the proposed maintenance building was not observed to influence the stability of the slope based onthe slope stability analysis.
7.0 SETTLEMENT ANALYSIS
7.1 Operations Deck
Settlement of municipal solid waste (MSW) is attributed due to physical and mechanical processes,chemical processes, dissolution processes, and biological decomposition. In addition, studies show thatprimary (or short term) and secondary (long-term) settlement occurs on the waste. Primary settlementusually occurs within the first four months of placement and secondary settlement occurs under constantload after completion of primary settlement (Sharma and De, 2007).
The operations deck is located in a valley formed by Rincon Shale to the west and a refuse slope to theeast. Artificial fill was placed and compacted within the valley to its current 380 foot elevation height in2006 and completed in 2007 (see Plate 2A through 2C for fill depths). Plate 1A shows the extent of theMSW underlying the fill on the current 380’ operations deck. Surface cracking on the operations deckalong the extent of MSW shows that long-term settlement is actively occurring at the site.
Eleven existing settlement monuments are located at various locations within the operations deck bothwithin the area underlain with refuse and the area of fill. The monitoring points are installed throughout theoperations deck and surveyed by the County of Santa Barbara. Monitor points 1 through 8 were establishedon December 12, 2007 and additional monitor points 9 through 11 were established on August 13, 2008.The location of the monitor points are presented on Figure 10. The points were additionally surveyed at

October 4, 2013 Project No. SB00314-1
25
various times from the installation date through July 11, 2012. Table 7 presents the settlement results fromDecember 12, 2007 (or August 13, 2008 for points 9 through 11) to July 11, 2012.
Figure 10: Operations Deck - Settlement Monument Locations
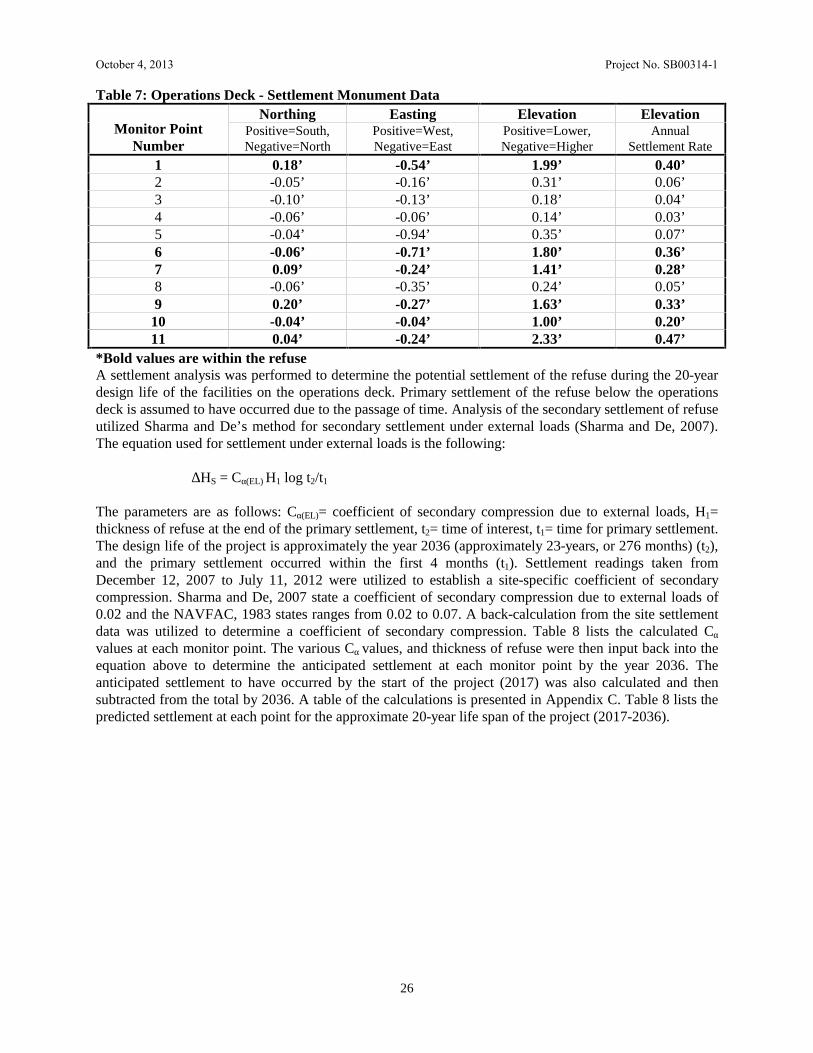
October 4, 2013 Project No. SB00314-1
26
Table 7: Operations Deck - Settlement Monument Data
Monitor PointNumber
Northing Easting Elevation ElevationPositive=South,Negative=North
Positive=West,Negative=East
Positive=Lower,Negative=Higher
AnnualSettlement Rate
1 0.18’ -0.54’ 1.99’ 0.40’2 -0.05’ -0.16’ 0.31’ 0.06’3 -0.10’ -0.13’ 0.18’ 0.04’4 -0.06’ -0.06’ 0.14’ 0.03’5 -0.04’ -0.94’ 0.35’ 0.07’6 -0.06’ -0.71’ 1.80’ 0.36’7 0.09’ -0.24’ 1.41’ 0.28’8 -0.06’ -0.35’ 0.24’ 0.05’9 0.20’ -0.27’ 1.63’ 0.33’
10 -0.04’ -0.04’ 1.00’ 0.20’11 0.04’ -0.24’ 2.33’ 0.47’
*Bold values are within the refuseA settlement analysis was performed to determine the potential settlement of the refuse during the 20-yeardesign life of the facilities on the operations deck. Primary settlement of the refuse below the operationsdeck is assumed to have occurred due to the passage of time. Analysis of the secondary settlement of refuseutilized Sharma and De’s method for secondary settlement under external loads (Sharma and De, 2007).The equation used for settlement under external loads is the following:
∆HS = Cα(EL) H1 log t2/t1
The parameters are as follows: Cα(EL)= coefficient of secondary compression due to external loads, H1=thickness of refuse at the end of the primary settlement, t2= time of interest, t1= time for primary settlement.The design life of the project is approximately the year 2036 (approximately 23-years, or 276 months) (t2),and the primary settlement occurred within the first 4 months (t1). Settlement readings taken fromDecember 12, 2007 to July 11, 2012 were utilized to establish a site-specific coefficient of secondarycompression. Sharma and De, 2007 state a coefficient of secondary compression due to external loads of0.02 and the NAVFAC, 1983 states ranges from 0.02 to 0.07. A back-calculation from the site settlementdata was utilized to determine a coefficient of secondary compression. Table 8 lists the calculated Cαvalues at each monitor point. The various Cα values, and thickness of refuse were then input back into theequation above to determine the anticipated settlement at each monitor point by the year 2036. Theanticipated settlement to have occurred by the start of the project (2017) was also calculated and thensubtracted from the total by 2036. A table of the calculations is presented in Appendix C. Table 8 lists thepredicted settlement at each point for the approximate 20-year life span of the project (2017-2036).
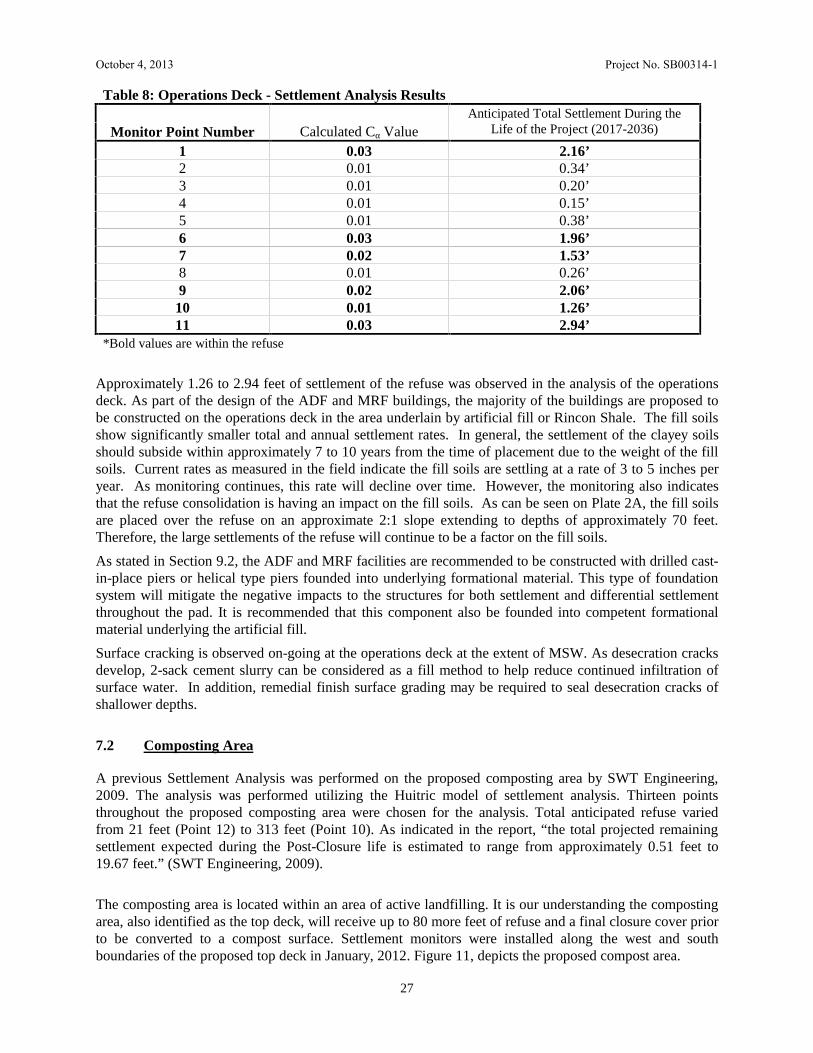
October 4, 2013 Project No. SB00314-1
27
Table 8: Operations Deck - Settlement Analysis Results
Monitor Point NumberAnticipated Total Settlement During the
Life of the Project (2017-2036)Calculated Cα Value1 0.03 2.16’2 0.01 0.34’3 0.01 0.20’4 0.01 0.15’5 0.01 0.38’6 0.03 1.96’7 0.02 1.53’8 0.01 0.26’9 0.02 2.06’
10 0.01 1.26’11 0.03 2.94’
*Bold values are within the refuse
Approximately 1.26 to 2.94 feet of settlement of the refuse was observed in the analysis of the operationsdeck. As part of the design of the ADF and MRF buildings, the majority of the buildings are proposed tobe constructed on the operations deck in the area underlain by artificial fill or Rincon Shale. The fill soilsshow significantly smaller total and annual settlement rates. In general, the settlement of the clayey soilsshould subside within approximately 7 to 10 years from the time of placement due to the weight of the fillsoils. Current rates as measured in the field indicate the fill soils are settling at a rate of 3 to 5 inches peryear. As monitoring continues, this rate will decline over time. However, the monitoring also indicatesthat the refuse consolidation is having an impact on the fill soils. As can be seen on Plate 2A, the fill soilsare placed over the refuse on an approximate 2:1 slope extending to depths of approximately 70 feet.Therefore, the large settlements of the refuse will continue to be a factor on the fill soils.
As stated in Section 9.2, the ADF and MRF facilities are recommended to be constructed with drilled cast-in-place piers or helical type piers founded into underlying formational material. This type of foundationsystem will mitigate the negative impacts to the structures for both settlement and differential settlementthroughout the pad. It is recommended that this component also be founded into competent formationalmaterial underlying the artificial fill.
Surface cracking is observed on-going at the operations deck at the extent of MSW. As desecration cracksdevelop, 2-sack cement slurry can be considered as a fill method to help reduce continued infiltration ofsurface water. In addition, remedial finish surface grading may be required to seal desecration cracks ofshallower depths.
7.2 Composting Area
A previous Settlement Analysis was performed on the proposed composting area by SWT Engineering,2009. The analysis was performed utilizing the Huitric model of settlement analysis. Thirteen pointsthroughout the proposed composting area were chosen for the analysis. Total anticipated refuse variedfrom 21 feet (Point 12) to 313 feet (Point 10). As indicated in the report, “the total projected remainingsettlement expected during the Post-Closure life is estimated to range from approximately 0.51 feet to19.67 feet.” (SWT Engineering, 2009).
The composting area is located within an area of active landfilling. It is our understanding the compostingarea, also identified as the top deck, will receive up to 80 more feet of refuse and a final closure cover priorto be converted to a compost surface. Settlement monitors were installed along the west and southboundaries of the proposed top deck in January, 2012. Figure 11, depicts the proposed compost area.

October 4, 2013 Project No. SB00314-1
28
Figure 11: Composting Area
Due to the continued landfill operations, it is recommended that the pad not be developed for a minimumof 6 months after final waste placement is complete in this section of the landfill to allow for primarysettlement to occur. As an addition to standard compaction techniques of the MSW, dynamic compactionmay be considered for reclamation of landfill areas to be utilized for commercial use (composting area).Specific recommendations for dynamic compaction should be developed in partnership with a contractorwith specialized knowledge of this technique, such as Hayward Baker.
Several hundred feet of MSW is present and significant settlement is anticipated throughout this area (asverified by the previous Settlement Analysis). Section 8.9, discusses recommendations to the compost areapavement section to help mitigate the effects of settlement and improve the structural integrity.
8.0 GENERAL SOIL-FOUNDATION DISCUSSION
The operations deck which is to be comprised of a proposed Materials Recovery Facility (MRF), DryFermentation Anaerobic Digestion Facility (ADF) and associated loading and parking areas vary from 0 to85 feet of existing fill. It is our understanding final proposed grade elevation of the operation deck willinclude the addition of up to 10 to 20 feet of fill placed in operations deck area. Due to the potential forlarge differential settlement (up to 2-3 feet) in this area it is anticipated that a cast-in-place concretecaisson, driven H-Pile or Helical Pier and grade beam type of foundation system will be constructed for theproposed MRF and ADF facilities with all piers founded a minimum of 10.0 feet into uniform competentformational material located approximately 10 to 95 feet below finish grade. (See Plates 2A, 2B, and 2Cfor fill depths pertaining to facilities footprints.)
The proposed Maintenance Building is to be located along the northeast property line and is anticipated toutilize a mat slab type of foundation system to mitigate the potential of differential settlement associatedwith varying fill depths within the existing engineering fill pad (Geosyntec, 2009). All foundations are to
October 4, 2013 Project No. SB00314-1
29
be excavated into uniform material to limit the potential for distress of the foundation systems due todifferential settlement.
It is our understanding the proposed Well Water Storage Tank and Recycled Water Storage Tank are to belocated to the northwest of the west borrow slope area, with the proposed Composting Area RunoffCollection Runoff Tank located north of the proposed Maintenance Building, and the proposed PercolateTanks are to be located at the southwest corner of the proposed ADF building. Due to the shallow depthsto competent formational material in these areas as observed during surface mapping, it is anticipated theproposed tank foundation systems will utilize continuous footings founded in uniform competentformational material as observed and approved by a representative of GeoSolutions, Inc. Deepenedfootings may be required in certain areas to achieve the required embedment depth in uniform competentformational material.
It is our understanding that no structures are proposed for the composting area but a non permeablehardscape is anticipated to be constructed over the composting area.
9.0 GEOTECHNICAL CONCLUSIONS AND RECOMMENDATIONS
The Site is suitable for the proposed development provided the recommendations presented in this reportare incorporated into the project plans and specifications.
The primary geotechnical concerns at the Site are:
1. The presence of expansive material.
2. The potential for large differential settlements.
9.1 Preparation of Building Pad
9.1.1 MRF and ADF Facilities
1. Due to the anticipated additional fill depths of 10 to 20 feet in the proposedoperations deck area the existing ground surface should be scarified to a depth of12 inches below existing ground surface, moisture conditioned to 1 to 3 percentabove optimum moisture content, and compacted to a minimum relative density of90 percent (ASTM D1557-07). The additional fill placed over the proposedoperations area should be placed in lifts no greater than 8 inches and compacted toa minimum relative density of 90 percent (ASTM D1557-07). The top 3 feet offill placed under the MRF and ADF facilities should consist of a non-expansivematerial such as aggregate base or decomposed granite which extend a minimumof 5 feet beyond the perimeter foundation. Refer to Appendix D for more detailson fill placement.
2. As an alternative to the top 3 feet of non-expansive material placed under theMRF and ADF facilities a foundation system designed for expansive soils may beutilized.
3. If fill areas are constructed on slopes greater than 10-to-1 (horizontal-to-vertical),we recommend that benches be cut every four feet as fill is placed. Each benchshall be a minimum of 10 feet wide with a minimum of two percent gradient intothe slope. If fill areas are constructed on slopes greater than 5-to-1, we recommendthat the toe of all areas to receive fill be keyed a minimum of 24 inches into
October 4, 2013 Project No. SB00314-1
30
underlying dense material. Sub-drains shall be placed in the keyway and benchesas required. See Appendix D, Detail A, Key and Bench with Backdrain for detailson key and bench construction.
9.1.2 Maintenance Building
1. The proposed Maintenance Building is to be located along the northeast propertyline approximately 800 feet to the north of the proposed composting area. It isanticipated that a minimal graded engineered fill pad will be developed for aproposed mat slab.
2. For the development of a mat slab engineered fill pad, the native material shouldbe over-excavated at least 24 inches below existing grade. The limits of over-excavation should extend a minimum of 5 feet beyond the perimeter foundation.The exposed surface should be scarified to a depth of 12 inches, moistureconditioned to near optimum moisture content, and compacted to a minimumrelative density of 90 percent (ASTM D1557-07). The over-excavated materialshould then be processed as engineered fill. Refer to Appendix D for more detailson fill placement
9.1.3 Well Water Storage Tank and Recycled Water Storage Tank, CompostingArea Runoff Collection Tank and Percolate Tanks
1. It is anticipated that footings for the proposed tanks will be founded in uniformcompetent formational material as observed and approved by a representative ofGeoSolutions, Inc. Deepened footings may be required in certain areas to achievethe required embedment depth in uniform competent formational material.
2. For slab-on-grade construction with footings founded a minimum of 24 inchesinto uniform competent formational material, the pad area to receive slab-on-gradeconstruction should be graded such that all slabs are supported on uniformcompetent material. The native material should be over-excavated beneath theslab at least 12 inches below existing grade and finished slab elevation, tocompetent material, or to one-half the depth of the deepest fill; whichever isgreatest. The exposed surface should be scarified to a depth of 12 inches, moistureconditioned to near optimum moisture content, and compacted to a minimumrelative density of 90 percent (ASTM D1557-07). The over-excavated materialshould then be replaced as engineered fill. Refer to Appendix D for more detailson fill placement.
9.2 Drilled Cast-in-Place Concrete Caissons – MRF and ADF Facilities
1. All cast-in-place concrete caissons should be joined with grade beams founded a minimumof 24 inches below lowest adjacent grade. Caissons should have a minimum diameter of24 inches and be designed utilizing skin friction. Caissons should extend a minimum of 10feet into uniform competent formational material located from approximately 10 to 95 feetbelow finish ground surface and have a minimum setback distance of 10 feet from bottomof caisson to face of descending slope. (See Plates 2A, 2B, and 2C for fill depthspertaining to facilities footprints.) An allowable skin friction value of 1,000 psf may beused for the competent material located approximately 10 feet below finish groundsurface. Skin friction in the upper material plus end bearing of the piers should be ignored.An uplift friction value of 200 psf may be used.
October 4, 2013 Project No. SB00314-1
31
2. An allowable lateral bearing values of 500 pcf together with the methods described insection 1806.7 of the California Building Code can be used for lateral capacitycalculations for the competent bedrock. A 10-foot setback from the face of any slopeshould be maintained prior to utilizing lateral or frictional design values.
3. Due to the anticipated depths caving of the drilled caisson excavations is anticipated to bea concern. If caving is observed to occur, the use of temporary casing will be required tofacilitate construction. Casing and shaft diameters should be the same diameter. Thecasing should be progressively placed as drilling advances to design depth. If waterintrusion is a problem, the concrete should be placed in the drilled holes prior to retrievingthe temporary casing. The bottom of the casing should be maintained not less than 5 feetbelow the top of the concrete.
4. The Soils Engineer should be present at the Site during the caisson drilling and concreteplacement operations to establish conformance with the design concepts, specificationrequirements, and to provide re-evaluation of these recommendations if site conditionsvary from what is anticipated.
9.3 Helical Piers – MRF and ADF Facilities
1. As an alternative to the drilled cast-in-place concrete caissons, a system of end bearinghelical pier anchors may be utilized. The helical piers are intended for use as componentsin an end bearing foundation system founded in competent materials located fromapproximately 10 to 95 feet below finish ground surface. (See Plates 2A, 2B, and 2C forfill depths pertaining to facilities footprints.)
2. Soil strength parameters for the helical piers are typically identified as the blow counts (N-value) obtained during the sub-surface investigation. Blow counts are provided on theBoring Logs; see Appendix A.
3. Upon installation and loading, the helical anchors utilize end-bearing support developedbetween the helical plates, shaft tip and soil/bedrock to provide vertical support for thestructure. Axial loads are transferred from the steel pipe shaft, to the helical plates andpile tip, and then to the soil/bedrock. Due to the disturbance of the surrounding soilsduring installation, side friction developed between the anchors and the surrounding soilmaterial should not be relied upon to provide axial capacity for the anchors.
4. Helical anchors with an 8-inch outside diameter should be utilized and should be filledwith concrete for increased stiffness.
5. Continuous grade beams may be used to transfer loads to the helical piles. For theproposed facilities, grade beams should be founded on a minimum of 24 inches below thelowest adjacent grade. Reinforcing steel for grade beams should be designed by the projectStructural Engineer.
9.4 Driven Piles – MRF and ADF Facilities
1. Driven piles may be used for support of the proposed MRF and AD Facilities. Pilesshould be designed as friction piles. An allowable skin friction value of 750 psf may beused for the competent material located approximately 10 feet below finish groundsurface.
October 4, 2013 Project No. SB00314-1
32
2. Piles should be driven a minimum of 10 feet into competent formational material locatedfrom approximately 10 to 95 feet below finish ground surface. (See Plates 2A, 2B, and 2Cfor fill depths pertaining to facilities footprints.) Depending on the selected H section anddriving hammer energy, a specification for refusal can be developed.
3. Structural steel H piles should conform to the Manual of Steel Construction, AmericanInstitute of Steel Construction. Steel H piles are more easily driven through hard layersand are more easily spliced for varying penetration depths then concrete piles. As a result,we recommend the use of steel H piles.
4. Individual piles driven a minimum of 10 feet into competent material and to refusal mayhave a maximum capacity of 40,000 pounds for steel H piles with a preliminary minimumsection of W10 x 45.
5. Continuous grade beams may be used to transfer loads to the driven piles. For theproposed facilities, grade beams should be founded on a minimum of 24 inches below thelowest adjacent grade. Reinforcing steel for grade beams should be designed by the projectStructural Engineer.
9.5 Mat Foundations – Maintenance Building
1. It is our understanding documented fill (Geosyntec, 2009) generated from the SespeFormation (Tsp) was placed up to existing grade for the location of the proposedmaintenance building. For a mat foundation design, a modulus of sub-grade reaction (ks)of 150 pci and an allowable dead plus live load bearing pressure of 1,500 psf may beused.
2. Lateral forces on structures may be resisted by passive pressure acting against the sides ofshallow footings and/or friction between the native material and the bottom of thefootings. For resistance to lateral loads, a friction factor of 0.38 may be utilized for slidingresistance at the base of footings.
3. A representative of this firm should observe and approve all foundation excavations forrequired embedment depth prior to the placement of reinforcing steel and/or concrete.Concrete should be placed only in excavations that are free of loose, soft soil and debrisand that have been lightly pre-moistened, with no associated testing required. Foundationdesign should conform to the requirements of Chapter 18 of the 2010 California BuildingCode.
9.6 Conventional Foundations - Well Water Storage Tank, Recycled Water StorageTank, Composting Area Runoff Collection Tank and Percolate Tanks
1. Conventional continuous and spread footings with grade beams may be used for supportof the proposed water tanks. Deepened footings may be required in certain areas toachieve the required embedment depth in uniform competent formational material.
2. Minimum footing and grade beam depths in uniform competent formational materialshould conform to the following table, as observed and approved by a representative ofGeoSolutions, Inc.
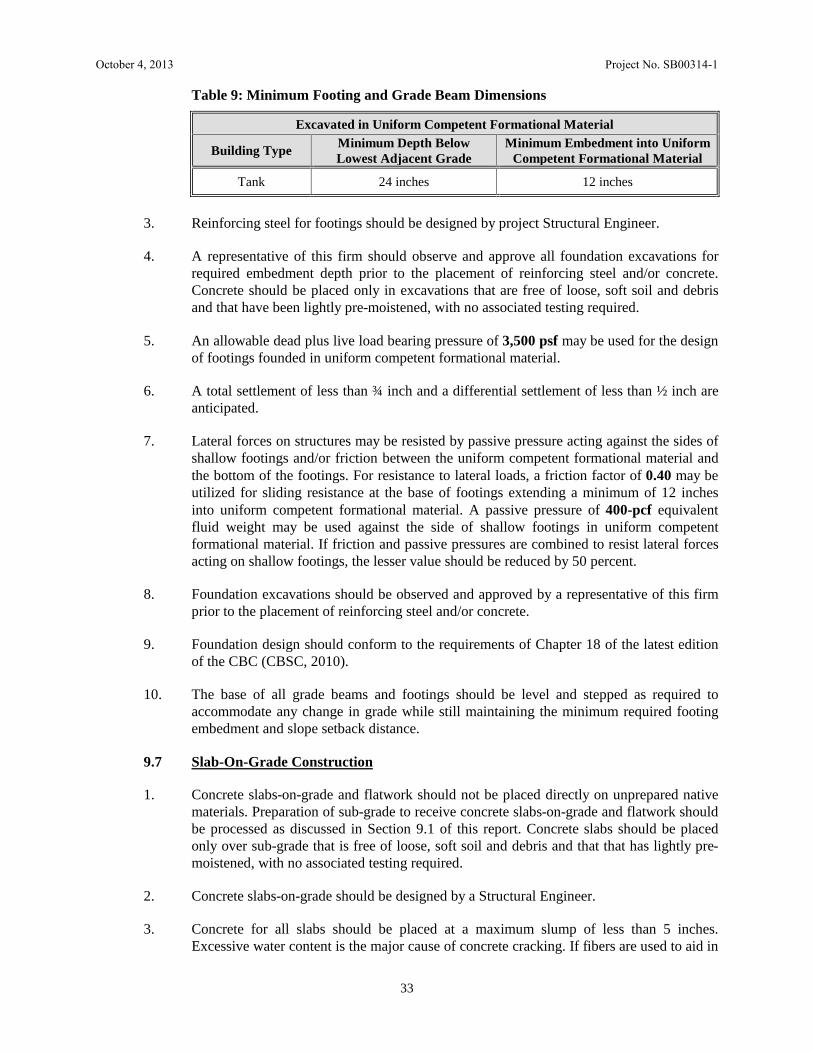
October 4, 2013 Project No. SB00314-1
33
Table 9: Minimum Footing and Grade Beam Dimensions
Excavated in Uniform Competent Formational Material
Building TypeMinimum Depth BelowLowest Adjacent Grade
Minimum Embedment into UniformCompetent Formational Material
Tank 24 inches 12 inches
3. Reinforcing steel for footings should be designed by project Structural Engineer.
4. A representative of this firm should observe and approve all foundation excavations forrequired embedment depth prior to the placement of reinforcing steel and/or concrete.Concrete should be placed only in excavations that are free of loose, soft soil and debrisand that have been lightly pre-moistened, with no associated testing required.
5. An allowable dead plus live load bearing pressure of 3,500 psf may be used for the designof footings founded in uniform competent formational material.
6. A total settlement of less than ¾ inch and a differential settlement of less than ½ inch areanticipated.
7. Lateral forces on structures may be resisted by passive pressure acting against the sides ofshallow footings and/or friction between the uniform competent formational material andthe bottom of the footings. For resistance to lateral loads, a friction factor of 0.40 may beutilized for sliding resistance at the base of footings extending a minimum of 12 inchesinto uniform competent formational material. A passive pressure of 400-pcf equivalentfluid weight may be used against the side of shallow footings in uniform competentformational material. If friction and passive pressures are combined to resist lateral forcesacting on shallow footings, the lesser value should be reduced by 50 percent.
8. Foundation excavations should be observed and approved by a representative of this firmprior to the placement of reinforcing steel and/or concrete.
9. Foundation design should conform to the requirements of Chapter 18 of the latest editionof the CBC (CBSC, 2010).
10. The base of all grade beams and footings should be level and stepped as required toaccommodate any change in grade while still maintaining the minimum required footingembedment and slope setback distance.
9.7 Slab-On-Grade Construction
1. Concrete slabs-on-grade and flatwork should not be placed directly on unprepared nativematerials. Preparation of sub-grade to receive concrete slabs-on-grade and flatwork shouldbe processed as discussed in Section 9.1 of this report. Concrete slabs should be placedonly over sub-grade that is free of loose, soft soil and debris and that that has lightly pre-moistened, with no associated testing required.
2. Concrete slabs-on-grade should be designed by a Structural Engineer.
3. Concrete for all slabs should be placed at a maximum slump of less than 5 inches.Excessive water content is the major cause of concrete cracking. If fibers are used to aid in
October 4, 2013 Project No. SB00314-1
34
the control of cracking, a water-reducing admixture may be added to the concrete toincrease slump while maintaining a water/cement ratio, which will limit excessiveshrinkage. Control joints should be constructed as required to control cracking.
4. Where concrete slabs-on-grade are to be constructed, the slabs should be underlain by aminimum of six inches of clean free-draining material, such as a coarse aggregate mix, toserve as a cushion and a capillary break. For the proposed MRF and ADF facilities anapproved methane barrier system should be placed under the slabs. It is suggested that atwo-inch thick sand layer be placed on top of the membrane to assist in the curing of theconcrete, increasing the depth of the under-slab material to a total of eight inches. Thesand should be lightly moistened prior to placing concrete. See Appendix D for additionalgrading recommendations.
9.8 Composting Area
1. As of the date of this report fill placement for the proposed composting area pad has notbeen placed up to finish grade elevations and preliminary design values such as a trafficindex have not been provided. It is our understanding expansive type soils such as theRincon Formation will be utilized to construct the pad over the final cover system placedover the existing refuse fill to reduce the potential for the infiltration of liquids into theunderlying soils and landfill during the composting process. Asphalt concrete is alsoanticipated to be utilized to help reduce the potential of infiltration.
2. An assumed structural pavement section for the proposed compost area should consist of 3inches of asphalt concrete placed over 12 inches of Class II aggregate base moistureconditioned to 3-5 percent over optimum moisture content and compacted to a minimumrelative density of 95 percent (ASTM D1557-07). Prior to aggregate base placement aTensar BX1100 geogrid or equivalent should be placed over the native soils that havebeen scarified, moisture conditioned to 3-5 percent over optimum moisture content andcompacted to a minimum relative density of 95 percent (ASTM D1557-07). The geogridshould extend a minimum of 24 inches beyond the edge of the proposed composting areashould overlap an minimum of 18 inches and should extend a minimum of 24 inchesbeyond the edge of the proposed composting area with aggregate base placed up to finishasphalt grade to provide lateral support for the side of the pavement section.
3. Due to fill placement over large fill depths of the refuse it is anticipated large settlementswill occur over the lifetime of the composting area. Continued maintenance of the asphaltconcrete placed for the proposed compost area should be expected.
4. Further structural sections may be provided with given design values such as a trafficindex and with the completion of the compost pad in order to obtain samples for CBR orR-values of final fill placement.
9.9 Preparation of MRF and ADF Faciltiy Paved Areas
1. It is our understanding the driveway and parking areas of the proposed MRF and ADFfacilities will be constructed over landfill and non-landfill zones. Due to the potential forvarying settlements to occur in the landfill area and in the transition area from landfill tonon-landfill material, the driveway and parking area structural section should constructedand maintained per Sections 9.8.2 and 9.8.3 of the proceeding section. Due to thesubsurface cover system that exists in the proposed MRF and ADF paved areas a series of
October 4, 2013 Project No. SB00314-1
35
pot holes should be excavated in the general area of the exiting cover system to determineof actual cover depths that will dictate overall excavation depths for paved areas.
2. Further structural sections may be provided with given design values such as a trafficindex and with the completion of the compost pad in order to obtain samples for CBR orR-values of final fill placement.
9.10 Preparation of Non-Landfill Paved Areas
1. Pavement areas should be over-excavated 12 inches below existing grade or finished sub-grade; whichever is deeper. The exposed surface should be scarified an additional depth ofeight inches, moisture conditioned to 1 to 3 percent above optimum moisture content, andcompacted to a relative density of 95 percent (ASTM D1557-07 test method). The over-excavated soil should then be replaced with 12 inches of Class II aggregate base moistureconditioned to 3-5 percent over optimum moisture content and compacted to a minimumrelative density of 95 percent (ASTM D1557-07). The top 12 inches of sub-grade soilunder all pavement sections should be compacted to a minimum relative density of 95percent based on the ASTM D1557-07 test method at slightly above optimum.
2. Sub-grade soils should not be allowed to dry out or have excessive construction trafficbetween moisture conditioning and compaction, and placement of the pavement structuralsection.
9.11 Pavement Design
1. All pavement construction and materials used should conform to Sections 25, 26 and 39 ofthe latest edition of the State of California Department of Transportation StandardSpecifications (State of California, 1999).
2. As indicated previously in Section 8.6, the top 12 inches of sub-grade soil under pavementsections should be compacted to a minimum relative density of 95 percent based on theASTM D1557-07 test method at slightly above optimum moisture content. Aggregatebases and sub-bases should also be compacted to a minimum relative density of 95 percentbased on the aforementioned test method.
3. A minimum of twelve inches of Class II Aggregate Base is recommended for all pavementsections. All pavement sections should be crowned for good drainage.
9.12 Retaining Walls
1. It is our understanding a retaining wall is anticipated to be constructed along the west sideof the proposed operations deck area. Retaining walls should be designed to resist lateralpressures from adjacent soils and surcharge loads applied behind the walls. Werecommend using the lateral pressures presented in Table 10: Retaining Wall DesignParameters for the design of retaining walls at the Site. The Active Case may be used forthe design of unrestrained retaining walls, and the At-Rest Case may be used for thedesign of restrained retaining walls.

October 4, 2013 Project No. SB00314-1
36
Table 10: Retaining Wall Design Parameters (Level Backfill)
Lateral Pressure and Condition Equivalent Fluid Pressure, pcf
Static, Active Case, Native Rincon Fm Material (γ'KA) 52
Static, At-Rest Case, Native Rincon Fm Material (γ'KO) 74
Static, Passive Case, Native Rincon Fm Material (γ'KP) 315
Seismic, Active Case, Native Rincon Fm Material(γ'KAE) 58*
Seismic, At-Rest Case, Native Rincon Fm Material(γ'KOE) 88*
Static, Active Case, Gravel Backfill in Active Wedge(γ'KA)
30
Static, At-Rest Case, Gravel Backfill in Active Wedge(γ'KO)
60
Static, Passive Case, Native Rincon Fm Material (γ'KP) 315
Seismic, Active Case, Gravel Backfill in Active Wedge(γ'KAE) 45*
Seismic, At-Rest Case, Gravel Backfill in Active Wedge(γ'KOE) 67*
* See Section 9.12.7 for discussion on the application of Seismic Equivalent Fluid Pressures
Table 11: Retaining Wall Design Parameters (1 to 2.5 Sloped Backfill)
Lateral Pressure and Condition Equivalent Fluid Pressure, pcf
Static, Active Case, Native Rincon Fm Material (γ'KA) 64
Static, At-Rest Case, Native Rincon Fm Material (γ'KO) 92
Static, Passive Case, Native Rincon Fm Material (γ'KP) 175
Seismic, Active Case, Native Rincon Fm Material(γ'KAE) 66*
Seismic, At-Rest Case, Native Rincon Fm Material(γ'KOE) 98*
Static, Active Case, Gravel Backfill in Active Wedge(γ'KA)
42
Static, At-Rest Case, Gravel Backfill in Active Wedge(γ'KO)
78
Static, Passive Case, Native Rincon Fm Material (γ'KP) 175
Seismic, Active Case, Gravel Backfill in Active Wedge(γ'KAE) 54*
Seismic, At-Rest Case, Gravel Backfill in Active Wedge(γ'KOE) 80*
* See Section 9.12.7 for discussion on the application of Seismic Equivalent Fluid Pressures

October 4, 2013 Project No. SB00314-1
37
2. The above values for equivalent fluid pressure are based on retaining walls having levelretained surfaces, having an approximately vertical surface against the retained material,and retaining granular backfill material or composed of native soil within the activewedge.
3. Proposed retaining walls having a retained surface that slopes upward from the top of thewall should be designed for an additional equivalent fluid pressure of 1 pcf for the activecase and 1.5 pcf for the at-rest case, for every two degrees of slope inclination.
4. We recommend that the soil materials located within the active wedge formed behind theproposed retaining wall consist of a granular backfill or composed of imported non-expansive material. If material other than granular backfill or composed of imported non-expansive material is to be located within the active wedge behind the proposed retainingwall, the project designers should contact the Soils Engineer to determine the appropriatelateral earth pressure values for retaining walls located at the Site.
5. We recommend that the proposed retaining walls at the Site have an approximatelyvertical surface against the retained material. If the proposed retaining walls are to havesloped surfaces against the retained material, the project designers should contact the SoilsEngineer to determine the appropriate lateral earth pressure values for retaining wallslocated at the Site.
6. Retaining wall foundations should be founded a minimum of 24 inches below lowestadjacent grade with a minimum embedment of 12 inches in uniform competentformational material as observed and approved by a representative of GeoSolutions, Inc. Acoefficient of friction of 0.30 may be used between uniform competent formationalmaterial and concrete footings. Project designers may use a maximum toe pressure of2,500 psf for the design of retaining wall footings founded in uniform competentformational material.
7. The static lateral earth pressure values listed in Table 10: Retaining Wall DesignParameters may be used for the design of retaining walls subjected to static loadingconditions. For the design of retaining walls greater than 10 feet in height subjected toseismic loading conditions, the seismic lateral earth pressure values listed in Table 10:Retaining Wall Design Parameters may be added to the appropriate static lateral earthpressure value, either the Active case or the At-Rest case. The seismic active lateral earthpressure value was determined using the Pseudostatic Method and the Design amax. Seesection 4.1 for a description of the analysis used to determine the Design amax. The seismicat-rest lateral earth pressure value was determined by multiplying the seismic active lateralearth pressure value by approximately 1.5. The pseudostatic seismic pressure resultantforce should be assumed to act a distance of 1/3H above the base of the retaining wall,where H is the height of the retaining wall.
8. For retaining wall design using programs such a Retain Pro, a design amax equal toSD1=0.730 may be used.
9. These seismic lateral earth pressure values are appropriate for retaining walls that havelevel retained surfaces, that have an approximately vertical surface against the retainedmaterial, and that retain granular backfill material or composed of native soil within theactive wedge. For other retaining wall designs, seismic lateral earth pressure values maybe obtained using methods such as the Mononobe and Okabe Method developed by
October 4, 2013 Project No. SB00314-1
38
Mononobe and Matsuo (1929) and Okabe (1926), which are included in retaining wallcomputer design software such as Retain Pro.
10. Seismically-induced forces on retaining walls are considered to be short-term loadings.Therefore, when performing seismic analyses for the design of retaining wall footings, werecommend that the allowable bearing pressure and the passive pressure acting against thesides of retaining wall footings be increased by a factor of one-third.
11. In addition to the static lateral soil pressure values reported in Table 10: Retaining WallDesign Parameters, the retaining walls at the Site should be designed to support anydesign live load, such as from vehicle and construction surcharges, etc., to be supported bythe wall backfill. If construction vehicles are required to operate within 10 feet of aretaining wall, supplemental pressures will be induced and should be taken into account inthe design of the retaining wall.
12. The recommended lateral earth pressure values are based on the assumption that sufficientsub-surface drainage will be provided behind the walls to prevent the build-up ofhydrostatic pressure. To achieve this we recommend that a granular filter material beplaced behind all proposed walls. The blanket of granular filter material should be aminimum of 12 inches thick and should extend from the bottom of the wall to 12 inchesfrom the ground surface. The top 12 inches should consist of moisture conditioned,compacted, clayey soil. Neither spread nor wall footings should be founded in the granularfilter material used as backfill.
13. A 4-inch diameter perforated or slotted drainpipe (ASTM D1785 PVC) should be installednear the bottom of the filter blanket with perforations facing down. The drainpipe shouldbe underlain by at least 4 inches of filter type material and should daylight to discharge insuitably projected outlets with adequate gradients. The filter material should consist of aclean free-draining aggregate, such as a coarse aggregate mix. If the retaining wall is partof a structural foundation, the drainpipe must be placed below finished slab sub-gradeelevation.
14. The filter material should be encapsulated in a permeable geotextile fabric. A suitablepermeable geotextile fabric, such as non-woven needle-punched Mirafi 140N or equalmay be utilized to encapsulate the retaining wall drain material and should conform toCaltrans Standard Specification 88-1.03 for underdrains.
15. For hydrostatic loading conditions (i.e. no free drainage behind retaining wall), anadditional loading of 45-pcf equivalent fluid weight should be added to the active and at-rest lateral earth pressures. If it is necessary to design retaining structures for submergedconditions, the allowed bearing and passive pressures should be reduced by 50 percent. Inaddition, soil friction beneath the base of the foundations should be neglected.
16. Precautions should be taken to ensure that heavy compaction equipment is not usedadjacent to walls, so as to prevent undue pressure against, and movement of the walls.
17. The use of water-stops/impermeable barriers should be used for any basementconstruction, and for building walls that retain earth.
10.0 REGULATORY SETTING
The following regulations regarding geologic conditions for municipal waste landfills include:
October 4, 2013 Project No. SB00314-1
39
- California Environmental Quality Act (CEQA) Guidelines, State of California, Appendix G,- County’s Environmental Thresholds and Guidelines Manual, Geologic Constraints Guidelines,- California Code of Regulations (CCR) Title 27 Environmental Protection, Division 2, Solid
Waste,- California Alquist-Priolo Special Studies Zone Act of 1973.
10.1 Previous Analysis
The following previous Environmental Impact Reports (EIR) have been published regarding permittedwork at the Tajiguas Landfill:
- Final Subsequent Environmental Impact Report for the Tajiguas Landfill Reconfiguration andBaron Ranch Restoration Project (Santa Barbara County., March 2009, 08EIR-00000-00007,prepared by Padre Associates, Inc).
- Includes a slope stability analysis of the current configuration of the west borrow slope.- Final Environmental Impact Report for the Tajiguas Landfill Expansion Project (Santa Barbara
County, 2002, 01-EIR-05 prepared by TRC).
Additional technical studies have also been performed at the Tajiguas Landfill including:- Settlement Analysis (SWT Engineering, June, 2009) - A settlement analysis performed on the top deck
where the Resources Recovery Project compost area location is proposed.- Revised Slope Stability Evaluation (Geo-Logic Associates, May 30, 2012) – A slope stability was
performed on the western borrow slope adjacent to the operations deck.- Stability Evaluation (Geosyntec, December 26, 2007) – A slope stability analysis performed on the
Phase 2A liner design which includes the fill slope and existing pad for the proposed maintenancebuilding and recycled water tank.
- Construction Quality Assurance Report (Geosyntec, January 2009) – A report that documents theconstruction of the existing fill slope and pad to be utilized for the maintenance building and recycledwater tank.
11.0 THRESHOLDS OF SIGNIFICANCE
The assessment of geologic impacts is based on guidance and thresholds from the State CEQA Guidelines(Appendix G, Initial Study Checklist), The County’s Environmental Thresholds Manual GeologicConstraints Guidelines and CCR Title 27 standards.
11.1 Appendix G of the State CEQA Guidelines
A potential geologic impact would occur if the project would:- Expose people or structures to potential substantial adverse effects, including the risk of loss, injury, or
death involving: Rupture of a known earthquake fault, as delineated on the most recent Alquist-Priolo Earthquake
Fault Zoning Map issued by the State Geologist for the area or based on other substantial evidenceof a known fault.
Strong seismic ground shaking. Seismic-related ground failure, including liquefaction. Landslides.
- Result in substantial soil erosion or the loss of topsoil.
October 4, 2013 Project No. SB00314-1
40
- Be located on a geologic unit or soil that is unstable, or that would become unstable as a result of theproject, and potentially result in on- or off-site landslide, lateral spreading, subsidence, liquefaction orcollapse.
- Be located on expansive soil, as defined in Table 18-1-B of the Uniform Building Code (2010),creating substantial risks to life or property.
- Have soils incapable of adequately supporting the use of septic tanks or alternative waste waterdisposal systems where sewers are not available for the disposal of waste water.
11.2 County’s Environmental Thresholds and Guidelines Manual - Geologic ConstraintsGuidelines
Geologic impacts have the potential to be significant if the project involves any of the followingcharacteristics:- Project sites or part of the project located on land having substantial geologic constraints, such as
active or potentially active faults, underlain by rock types associated with compressible/collapsiblesoils, or susceptible to landslides or severe erosion.
- The project results in potentially hazardous geologic conditions such as construction of cut slopesexceeding a grade of 1.5H:1V.
- The project proposes construction of a cut slope over 15 feet in height as measured from the lowestfinished grade.
- The project is located on slopes exceeding 20 percent grade.
11.3 California Code of Regulations - Title 27 and California Department of Water ResourcesSlope Stability Criteria
- Permanent cut slopes and waste fill slopes must be constructed to provide a minimum Factor of Safetyof 1.5;
- The maximum seismic displacement caused by the maximum credible earthquake must not exceed 36inches for permanent cut slopes;
- The maximum seismic displacement caused by the maximum credible earthquake must not exceed 12inches for permanent waste fill slopes;
11.4 Impact Analysis
Landslides - The Rincon Shale is generally a weaker unit and prone to landslides when saturated,therefore within the Rincon Shale units there is a moderate potential for landslides. A slope stabilityanalysis was performed on the proposed western cut slope and provides recommendations to maintain thestability of the slope as discussed in Section 6.0. Due to the character of the Vaqueros Sandstone and SespeFormation, there is a low potential for landslides within these units. Potential landslide impacts at theSite were identified as less than significant, Class III.
Severe Erosion – The potential for severe erosion is low considered provided that vegetation and erosioncontrol measures are implemented immediately after the completion of grading. Therefore, impactsassociated with severe erosion can be feasibly mitigated and is interpreted to be a Class II Impact.
Regional Faulting and Seismicity - The Alquist-Priolo Earthquake Fault Zoning Act of 1972 requiresthat the California State Geologist establish Earthquake Fault Zones around the surface traces of activefaults and to issue appropriate maps. The subject site is not located within an Earthquake Fault Zone(Jennings, 2010). Potential impacts at the Site due to faulting were identified as less than significant,Class III. Based on the results of the slope stability analysis, the proposed fill/cut slopes appear to begrossly stable under psuedo-static (seismic) conditions, therefore the potential for seismically induced
October 4, 2013 Project No. SB00314-1
41
slope failure at the site is low. Potential impacts at the Site due to seismically induced slope failurewere identified as less than significant, Class III. Based on the presence of clay in the fill andformational units, there is a low potential for seismically induced settlement at the Site, however there is ahigh potential within the MSW. The MRF and ADF buildings are proposed in the vicinity of MSW,however foundation recommendations are provided to help mitigate settlement effects. Therefore,impacts associated with seismically induced settlement can be feasibly mitigated and is interpretedto be a Class II Impact.
Tsunami/Seiches - As the property is at an elevation of approximately 390 feet, the potential for a tsunamito affect the Site is low. Flooding associated with a seismic event is considered low due to the absence of abody of water upslope of the property. The northern sedimentation basin is located upslope of the currentoperations deck, however existing 48-inch storm drain inlets are also located upslope which would flowinundated water beneath the operations deck. Therefore, flooding associated with a seismic event (seiches)is considered low. Potential impacts at the Site due to tsunamis or seiches were identified as less thansignificant, Class III.
Liquefaction - Based on the consistency and relative density of the in-situ soils (clay/rock) and the depthto groundwater the potential for seismic liquefaction of soils at the Site is very low. Potential liquefactionimpacts at the Site were identified as less than significant, Class III.
Expansive Soils – The Rincon Formation was classified as medium expansion from laboratory testing (seeAppendix B). Additional fill at the operations deck is proposed to be derived from Rincon Formationlocated at the west borrow slope. Foundation recommendations will negate the negative impacts of RinconFormation to the MRF and ADF structures. Therefore, impacts associated with expansive soils can befeasibly mitigated and is interpreted to be a Class II Impact.
Slope Stability - Cut Slope: 2.5:1 - West of the Operations Deck, Fill Slope: 3:1 - South of theOperations Deck, Fill Slope: 2:1 - West of the Maintenance Building Pad - The critical factor of safetyresults were observed to exceed the minimum design factor of safeties for static and pseudo static. Basedon this, if the slopes are constructed to the proposed configurations and in accordance with ourrecommendations, then it is our opinion that the proposed cut slope should be stable. Therefore, impactsassociated with stability of the modified slopes can be feasibly mitigated and is interpreted to be aClass II Impact.
Settlement - Significant settlement of the refuse was observed in the analysis of the operations deck. Aspart of the design of the ADF and MRF buildings, the majority of the buildings are proposed to beconstructed on the operations deck underlain by artificial fill or Rincon Shale. Foundationrecommendations will negate the negative impacts to the structures for both settlement and differentialsettlement throughout the pad. Therefore, impacts associated with the settlement of the operation deckcan be feasibly mitigated and is interpreted to be a Class II Impact. Several hundred feet of refuse andsignificant settlement is anticipated throughout this area. Recommendations to the compost area pavementsection to help mitigate the effects of settlement and improve the structural integrity are provided inSection 8.9. Therefore, impacts associated with the settlement of the compost area can be feasiblymitigated and is interpreted to be a Class II Impact.
11.5 Mitigation Measures
GEO-1 - Severe Erosion – It is recommended that the resulting slope face be covered with erosion matand hydroseeded immediately following construction of the slopes. This will also serve to minimizesurficial erosion due to irrigation and/or rainfall. It is recommended that erosion control measure be
October 4, 2013 Project No. SB00314-1
42
implemented immediately following the completion of construction for surfaces not being improved asdesigned by the project civil engineer.
GEO-2 - Seismicity - The MRF and ADF buildings are proposed in the vicinity of MSW, howeverfoundation recommendations are provided to help mitigate settlement effects. As stated in Section 9.2, theADF and MRF facilities are recommended to be constructed with drilled cast-in-place piers founded intounderlying rock. This type of foundation system will negate the negative impacts to the structures for bothsettlement and differential settlement throughout the pad. Additional foundation recommendations aredescribed in Section 9.0.
GEO-3 – Expansive Soils - Additional fill at the operations deck is proposed to be derived from RinconFormation located at the west borrow slope which was determined to be medium expansion potential. Asstated in Section 9.1, the top 3 feet of fill placed under the MRF and ADF facilities should consist of anon-expansive material such as aggregate base or decomposed granite which extend a minimum of 5 feetbeyond the perimeter foundation. As an alternative to the top 3 feet of non-expansive material placed underthe MRF and ADF facilities a foundation system designed for expansive soils may be utilized. Theserecommendations will negate the negative impacts to the structures for expansive soils. Additionalfoundation recommendations are described in Section 9.0.
GEO-4 – Slope Stability - The critical factor of safety results were observed to exceed the minimumdesign factor of safeties for static and pseudo static. Based on this, if the slopes are constructed to theproposed configurations and in accordance with our recommendations, then it is our opinion that theproposed cut slope should be stable. The following are recommendations for maintaining stability of thecut slope:
Irrigation and Surface Drainage. Excess free water should not be allowed to pond. Surface gradesshould be maintained such that collected water is diverted and discharged away from the slopeface.
Over-Slope Drainage. Concentrated over-slope drainage is to be strictly prevented. All waterabove the slope should be maintained in secure pipelines or other approved erosion resistantstructures.
Monitoring. An Engineer or Engineering Geologist with GeoSolutions, Inc. should observe theslopes at the time construction is performed to verify subsurface conditions.
GEO-5 - Settlement - As stated in Section 9.2, the ADF and MRF facilities are recommended to beconstructed with drilled cast-in-place piers founded into underlying rock. This type of foundation systemwill negate the negative impacts to the structures for both settlement and differential settlement throughoutthe pad. Additional foundation recommendations are described in Section 9.0.
As stated in Section 7.2, due to the continued landfill operations, it is recommended that that the compostpad not be developed for a minimum of 6 months prior to the closure of this section of the landfill to allowfor primary settlement to occur. As an addition to standard compaction techniques of the MSW, dynamiccompaction may be considered for reclamation of landfill areas to be utilized for commercial use(composting area). Specific recommendations for dynamic compaction should be developed in partnershipwith a contractor with specialized knowledge of this technique, such as Hayward Baker. Section 8.9,discusses recommendations to the compost area pavement section to help mitigate the effects of settlementand improve the structural integrity.
October 4, 2013 Project No. SB00314-1
43
12.0 EXTENSION OF LANDFILL LIFE
Implementation of the proposed project would extend the life of the Tajiguas Landfill from approximately2026 to approximately 2036 and delay final closure of the entire landfill area, although phased closurewould continue to occur during the extend life. Because grading and construction of the waste cells andinstallation of the landfill liner systems will be completed within the current life of the landfill (prior to2026), no extension of life impacts associated with previously identified site geologic conditions andgeohazards would result. These impacts would occur as described in the documents listed in Section 10.1.Because closure and placement of a final cover system over the entire landfill area would be delayed theremay be some extension of less than significant landfill related erosion and sedimentation impacts. Theseimpacts would continue to be minimized by the landfill storm water management systems, interim erosioncontrol measures during construction and operations, and phased closure of areas of the landfill wherewaste placement has been completed.
13.0 CUMULATIVE IMPACTS
There are no cumulative geologic impacts associated with the Tajiguas Resource Recovery Project.Geologic impacts, by their nature, primarily involve site specific effects related to the particular geologicconditions and geohazards present in the immediate vicinity of the project site (e.g., expansive soils,differential settlement, etc.) or directly affected by project activities (e.g. slope stability). An exceptionwould be the potential for erosion or sedimentation associated with cumulative projects in a commonwatershed. No other cumulative projects are proposed within the Pila Creek watershed, therefore nocumulative impacts would occur.
14.0 PROJECT ALTERNATIVES
14.1 Alternative A – No Project
The proposed project would extend the life of the Landfill by approximately 10 years to approximately2036). In comparison, the No Project alternative would involve closure of the landfill when it reaches fillpermitted capacity in approximately the year 2026. At that time, other waste disposal options would needto be considered such expansion of the Tajiguas Landfill or disposal of MSW at another landfill. Theexisting operational parameters and design was approved and permitted in 2002/2003, thereforegeologic and/or geotechnical conditions and impacts would not be altered with this alternative.
14.2 Alterative B – Urban Area MRF Alternative 1 (Marborg Industries MRF)
14.2.1 Project Description
This alternative would involve construction and operation of the proposed MRF component of the TajiguasResource Recovery Project at a site owned by MarBorg Industries at 620 Quinientos Street located in theCity of Santa Barbara. The proposed 4.19 acre site currently developed with approximately 11,000 sf ofstructures and the remaining areas of the site are paved. The proposed site is located approximately 700feet southeast of MarBorg Industries Construction and Demolition Materials Recovery and TransferFacility. Similar to the proposed project, the AD Facility, composting area, and associated water tankswould be located at the Tajiguas Landfill. At this alternative location, the MRF would consist of a 107,000sf building (net) that would include:
1. Truck scale for weighing incoming MSW and CSSR2. Tipping floor/waste delivery areas (40,000 sf) to receive an estimated maximum delivery
volume of 220,000 tons/year; and 40,000 tons/year of CSSR;3. MRF waste processing (30,000 sf) and bale storage (10,000 sf);
October 4, 2013 Project No. SB00314-1
44
4. Load-out waste transfer area (23,000 sf) where the non-salvageable residue would be to betransferred to the Tajiguas Landfill for disposal. Transfer trucks would sit at grade and loadedover the top by loaders with extended forks. Two 18-wheel transfer trucks would be able to beloaded simultaneously.
5. Loading dock with dock-high capacity for three container trailers and/or enclosed trucks toreceive baled recyclable materials for transport to markets.
6. Office/administration/employee/control room (two stories, 2,000 sf each for total of 4,000 sf);7. Visitor/education (1,000 sf included as part of the second floor of the office/administration
building) and;8. Parking for 47 employee/visitor vehicles and 7 bicycles. The average building height would be
approximately 38 feet with a maximum building height of 40 feet.
Grading quantities are based on the Conceptual Grading Plan by Penfield and Smith. Construction of thesite will require import of approximately 13,950 C.Y. of soil or other structural fill to bring the building tothe subgrades shown. There is no known contamination of the site.
Figure 12: Alternative B – MarBorg Industries Site Plan
14.2.2 Local Geology
Locally, the MarBorg alternative MRF site is located within Alluvium Deposits (Qa). Dibblee, 1986mapped the property as underlain by Surficial Sediments (Qa) described as “Alluvium: unconsolidatedfloodplain deposits of silt, sand and gravel.” A subsurface investigation was not performed at the site, norwas one requested or proposed. However, a Preliminary Foundation Investigation (Pacific MaterialsLaboratory, August 13, 2002) at the MarBorg C & D Recycling Facility located at 119 N. Quarantina
October 4, 2013 Project No. SB00314-1
45
Street (located 600 feet northwest of the proposed site, north of U.S. Highway 101) encountered units oftan to black sandy CLAY to brown to gray-brown clayey SAND interpreted to be Alluvium Deposits (Qa).Groundwater was encountered in borings for the above referenced investigation at a depth of 12 to 13 feet
below ground surface. Soil types, soil strengths, and groundwater depths are anticipated to be similar tosubsurface material at the proposed site.
14.2.3 Landslides
Dibblee, 1986 did not map landslides at the property. Due to a relatively flat topography at the proposedalternative site, the potential for landslides is low. Potential landslide impacts at the MarBorgalternative site were identified as less than significant, Class III.
14.2.4 Severe Erosion
Because the site is nearly level and there would be no grading on slopes, therefore the severe erosionpotential impact at the MarBorg alternative MRF site was identified as less than significant, ClassIII. However, impacts of grading at the Tajiguas landfill for the ADF are still proposed, thereforethe Class II, severe erosion potential remains the same for the ADF.
14.2.5 Regional Faulting and Seismicity
Similar to the surrounding areas, the MarBorg alternative site may be affected by moderate to majorearthquakes centered on one of the known large, active faults listed in Table 12 below. Momentmagnitudes are expressed, although any significant event on these faults could result in moderate to severeground shaking at the subject site. The potential for ground failure of any portion of the Site during groundshaking is considered low.
Table 12: Active Faults Near the MarBorg Alternative
Closest Active Faults to SiteApproximate Distance
(miles)Moment Magnitude
(Mw)
Santa Ynez Fault 14.5 7.1
Los Alamos Fault 36.0 6.8
San Andreas Fault 38.0 8.5
The closest known Holocene age fault is the Santa Ynez Fault located approximately 14.5 miles northwestof the Site (Jennings, 2010), however the San Andreas Fault is the most likely active fault to produceground shaking at the Site. Figure 13 depicts significant historical earthquakes in the region.

October 4, 2013 Project No. SB00314-1
46
Figure 13: Historical Seismicity Map for MarBorg Alternative (Toppozada et al., 2000)
The Mesa Fault is mapped as inferred approximately 3,200 feet southwest of the MarBorg alternative site(Dibblee, 1986 and Minor et al., 2009). According to the City of Santa Barbara Safety and Public ServicesElement (City of Santa Barbara, 1979), the Mesa Fault is considered potentially active.
The Lagoon Fault is mapped approximately 0.75 mile northeast of the MarBorg alternative site (Minor etal., 2009). According to the City of Santa Barbara Safety and Public Services Element (City of SantaBarbara, 1979), the Lagoon Fault is considered potentially active since it displaces late Pleistocenefanglomerate.
The Alquist-Priolo Earthquake Fault Zoning Act of 1972 requires that the California State Geologistestablish Earthquake Fault Zones around the surface traces of active faults and to issue appropriate maps.The MarBorg alternative site is not located within an Earthquake Fault Zone. Potential impacts at theMarBorg alternative site due to faulting were identified as less than significant, Class III.
SITE
October 4, 2013 Project No. SB00314-1
47
14.2.6 Tsunami/Seiches
Tsunamis and seiches are two types of water waves that are generated by earthquake events. Tsunamis arebroad-wavelength ocean waves and seiches are standing waves within confined bodies of water, typicallyreservoirs. Cal EMA, 2009 maps the MarBorg alternative site as within a tsunami inundation area. Due tothe alternative site being located approximately 0.25 miles from the Pacific Ocean and an elevation of 11feet, the tsunami potential to affect the site is high. Potential impacts at the MarBorg alternative sitedue to tsunamis was identified as significant environment impacts that can be feasibly mitigated,Class II.
ALT B GEO-1 – The project civil engineer should provide and incorporate recommendations for floodingassociated with tsunami if this alternative is considered.
Flooding associated with a seismic event (seiches) is considered low due to the absence of a body of waterupslope of the property. Potential impacts at the Site due to seiches were identified as less thansignificant, Class III.
14.2.7 Liquefaction
The presence of loose, poorly graded, fine sand material that is saturated by groundwater within an areathat is known to be subjected to high intensity earthquakes and long-duration ground motion are the keyfactors that indicate potentially liquefiable areas and conditions that lead to liquefaction. Based on theinvestigation performed for the Preliminary Foundation Investigation (Pacific Materials Laboratory,August 13, 2002) at the MarBorg C & D Recycling Facility, located 600 feet northwest of the site insimilar subsurface units, layers of liquefiable zones were identified. Groundwater was observed at 12 to 13feet below ground surface. Potential impacts at the MarBorg alternative site due to liquefaction isconsidered as significant environment impacts that can be feasibly mitigated, Class II.
ALT B GEO-2 - It is recommended that a Soils Engineering Report be performed at the site to verifysubsurface materials, perform a site specific liquefaction analysis and provide foundation recommendationsto mitigate liquefaction impacts if this alternative is to be considered. It is anticipated that caissons, helicalpiers, or h-pile type foundation systems would be utilized for the alternative MRF structure.
14.2.8 Seismically Induced and/or Differential Settlement
Seismically induced settlement occurs in loose to medium dense unconsolidated soil above groundwater.These soils compress (settle) when subject to seismic shaking. The settlement can be exacerbated byincreased loading, such as from the construction of buildings. Based on the presence of soft, loose alluvialdeposits, there is a high potential for seismically induced settlement at the Site. Potential impact at theMarBorg alternative site due to seismically induced settlement is considered as significantenvironment impacts that can be feasibly mitigated, Class II.
ALT B GEO-3 - It is recommended that a Soils Engineering Report be performed at the site to verifysubsurface materials and provide foundation recommendations to mitigate seismically induced settlementimpacts if this alternative is to be considered. It is anticipated that caissons, helical piers, or h-pile typefoundation systems would be utilized for the alternative MRF structure.
It is anticipated that the proposed MRF will be located entirely within Alluvial Deposits (Qa). Because ofthe uniformity of the underlying material, potential impact at the MarBorg alternative site due todifferential settlement is considered as less than significant, Class III.
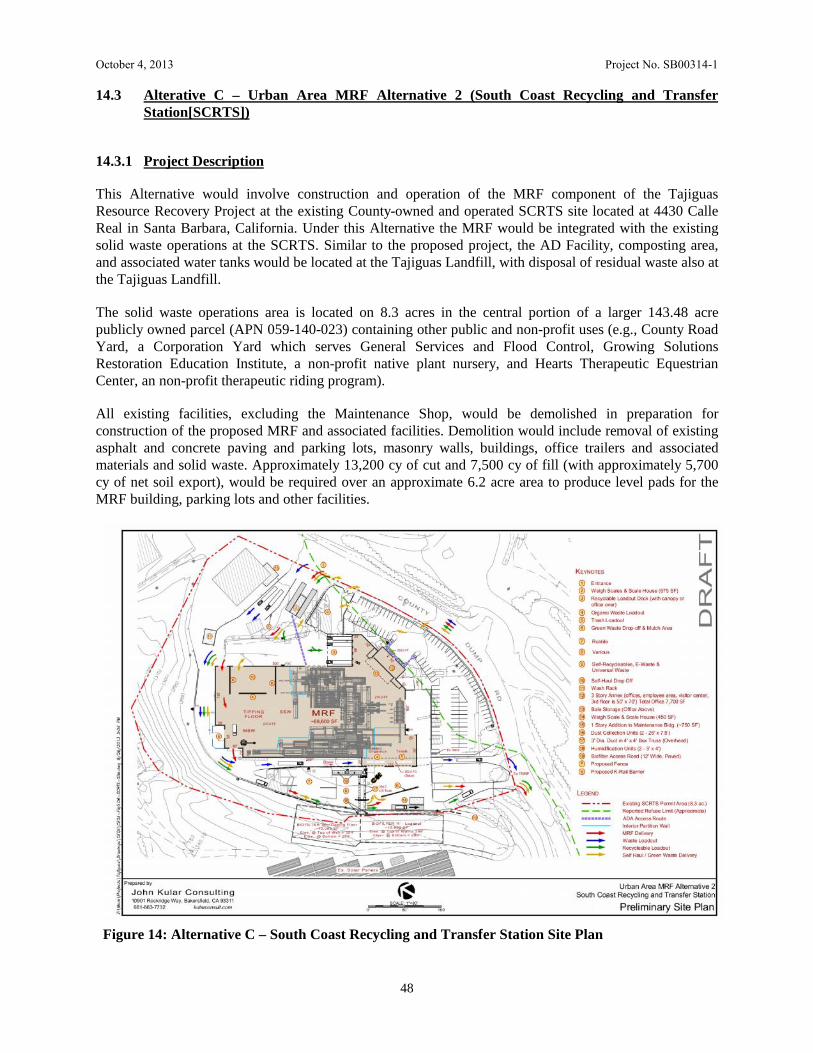
October 4, 2013 Project No. SB00314-1
48
14.3 Alterative C – Urban Area MRF Alternative 2 (South Coast Recycling and TransferStation[SCRTS])
14.3.1 Project Description
This Alternative would involve construction and operation of the MRF component of the TajiguasResource Recovery Project at the existing County-owned and operated SCRTS site located at 4430 CalleReal in Santa Barbara, California. Under this Alternative the MRF would be integrated with the existingsolid waste operations at the SCRTS. Similar to the proposed project, the AD Facility, composting area,and associated water tanks would be located at the Tajiguas Landfill, with disposal of residual waste also atthe Tajiguas Landfill.
The solid waste operations area is located on 8.3 acres in the central portion of a larger 143.48 acrepublicly owned parcel (APN 059-140-023) containing other public and non-profit uses (e.g., County RoadYard, a Corporation Yard which serves General Services and Flood Control, Growing SolutionsRestoration Education Institute, a non-profit native plant nursery, and Hearts Therapeutic EquestrianCenter, an non-profit therapeutic riding program).
All existing facilities, excluding the Maintenance Shop, would be demolished in preparation forconstruction of the proposed MRF and associated facilities. Demolition would include removal of existingasphalt and concrete paving and parking lots, masonry walls, buildings, office trailers and associatedmaterials and solid waste. Approximately 13,200 cy of cut and 7,500 cy of fill (with approximately 5,700cy of net soil export), would be required over an approximate 6.2 acre area to produce level pads for theMRF building, parking lots and other facilities.
Figure 14: Alternative C – South Coast Recycling and Transfer Station Site Plan
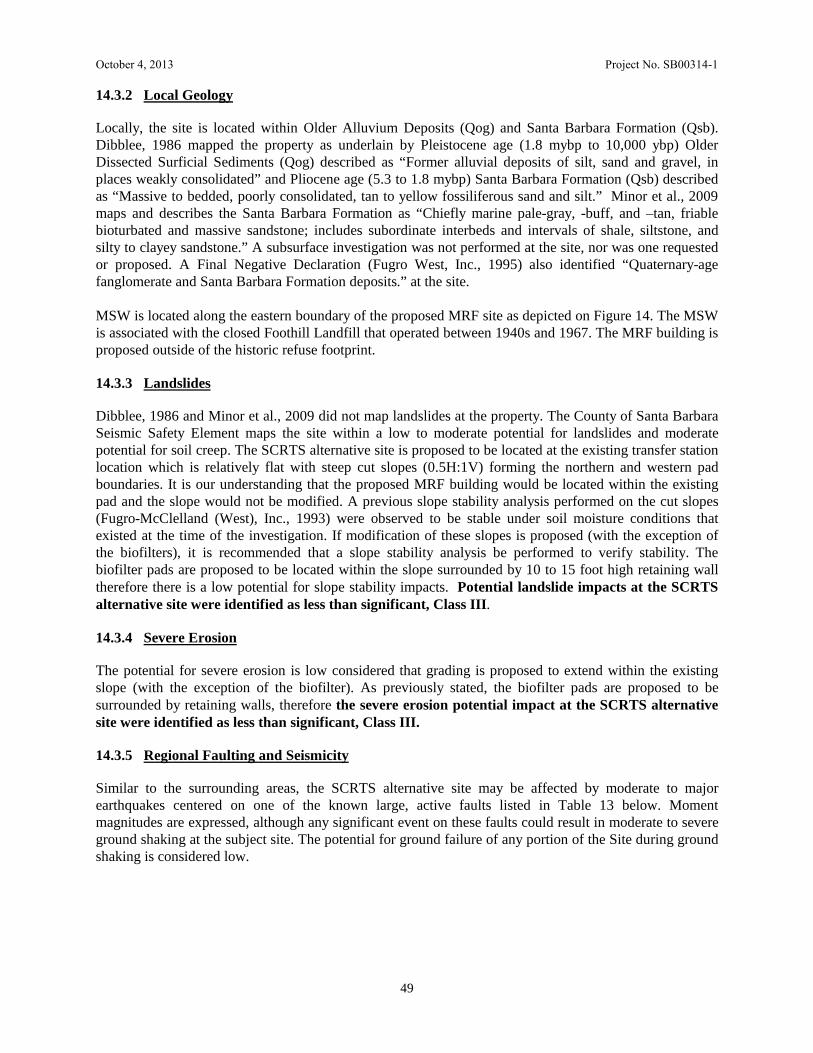
October 4, 2013 Project No. SB00314-1
49
14.3.2 Local Geology
Locally, the site is located within Older Alluvium Deposits (Qog) and Santa Barbara Formation (Qsb).Dibblee, 1986 mapped the property as underlain by Pleistocene age (1.8 mybp to 10,000 ybp) OlderDissected Surficial Sediments (Qog) described as “Former alluvial deposits of silt, sand and gravel, inplaces weakly consolidated” and Pliocene age (5.3 to 1.8 mybp) Santa Barbara Formation (Qsb) describedas “Massive to bedded, poorly consolidated, tan to yellow fossiliferous sand and silt.” Minor et al., 2009maps and describes the Santa Barbara Formation as “Chiefly marine pale-gray, -buff, and –tan, friablebioturbated and massive sandstone; includes subordinate interbeds and intervals of shale, siltstone, andsilty to clayey sandstone.” A subsurface investigation was not performed at the site, nor was one requestedor proposed. A Final Negative Declaration (Fugro West, Inc., 1995) also identified “Quaternary-agefanglomerate and Santa Barbara Formation deposits.” at the site.
MSW is located along the eastern boundary of the proposed MRF site as depicted on Figure 14. The MSWis associated with the closed Foothill Landfill that operated between 1940s and 1967. The MRF building isproposed outside of the historic refuse footprint.
14.3.3 Landslides
Dibblee, 1986 and Minor et al., 2009 did not map landslides at the property. The County of Santa BarbaraSeismic Safety Element maps the site within a low to moderate potential for landslides and moderatepotential for soil creep. The SCRTS alternative site is proposed to be located at the existing transfer stationlocation which is relatively flat with steep cut slopes (0.5H:1V) forming the northern and western padboundaries. It is our understanding that the proposed MRF building would be located within the existingpad and the slope would not be modified. A previous slope stability analysis performed on the cut slopes(Fugro-McClelland (West), Inc., 1993) were observed to be stable under soil moisture conditions thatexisted at the time of the investigation. If modification of these slopes is proposed (with the exception ofthe biofilters), it is recommended that a slope stability analysis be performed to verify stability. Thebiofilter pads are proposed to be located within the slope surrounded by 10 to 15 foot high retaining walltherefore there is a low potential for slope stability impacts. Potential landslide impacts at the SCRTSalternative site were identified as less than significant, Class III.
14.3.4 Severe Erosion
The potential for severe erosion is low considered that grading is proposed to extend within the existingslope (with the exception of the biofilter). As previously stated, the biofilter pads are proposed to besurrounded by retaining walls, therefore the severe erosion potential impact at the SCRTS alternativesite were identified as less than significant, Class III.
14.3.5 Regional Faulting and Seismicity
Similar to the surrounding areas, the SCRTS alternative site may be affected by moderate to majorearthquakes centered on one of the known large, active faults listed in Table 13 below. Momentmagnitudes are expressed, although any significant event on these faults could result in moderate to severeground shaking at the subject site. The potential for ground failure of any portion of the Site during groundshaking is considered low.
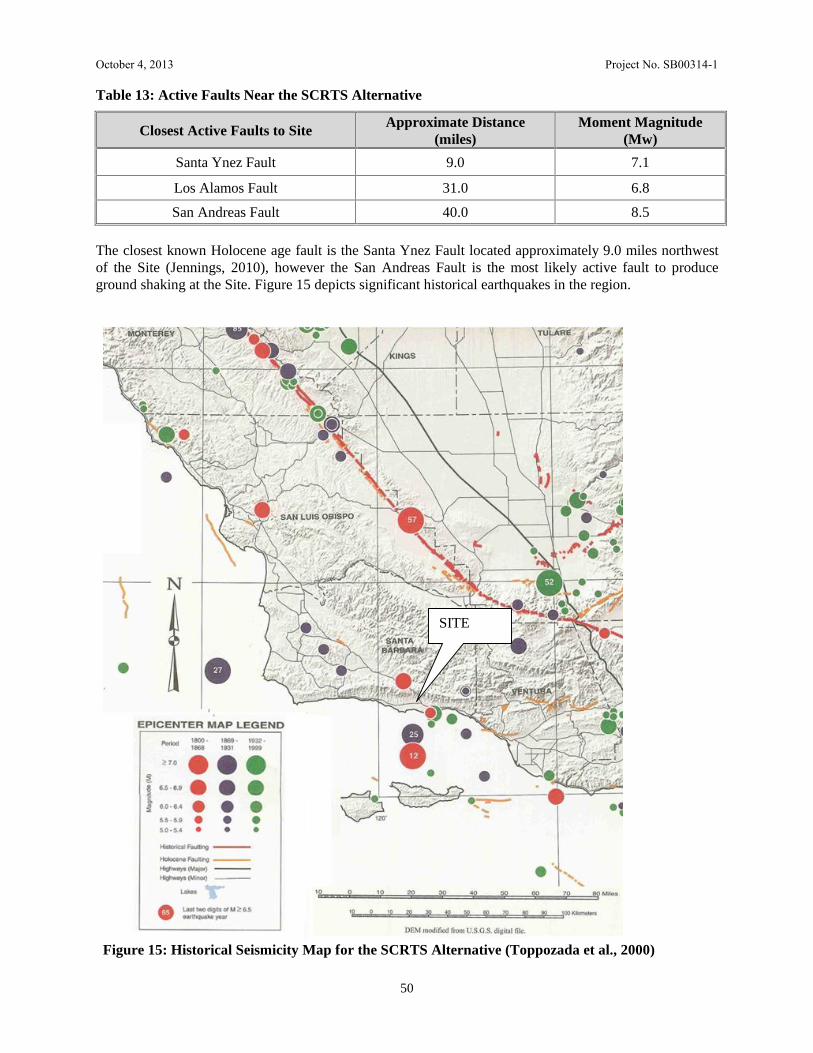
October 4, 2013 Project No. SB00314-1
50
Table 13: Active Faults Near the SCRTS Alternative
Closest Active Faults to SiteApproximate Distance
(miles)Moment Magnitude
(Mw)
Santa Ynez Fault 9.0 7.1
Los Alamos Fault 31.0 6.8
San Andreas Fault 40.0 8.5
The closest known Holocene age fault is the Santa Ynez Fault located approximately 9.0 miles northwestof the Site (Jennings, 2010), however the San Andreas Fault is the most likely active fault to produceground shaking at the Site. Figure 15 depicts significant historical earthquakes in the region.
Figure 15: Historical Seismicity Map for the SCRTS Alternative (Toppozada et al., 2000)
SITE

October 4, 2013 Project No. SB00314-1
51
The San Jose Fault is mapped approximately 1,000 feet north of the SCRTS alternative site (Dibblee,1987). According to the County of Santa Barbara Seismic Safety and Safety Element (County of SantaBarbara, 2010), the San Jose Fault is considered potentially active with an estimated maximum credibleearthquake magnitude of 5.8. Minor et al., 2009 also maps the Foothill Road Fault in the immediatevicinity of where the San Jose Fault is mapped by Dibblee north of the site.
The More Ranch Fault is mapped approximately 0.75 mile southeast of the SCRTS alternative site(Dibblee, 1987 and Minor et al., 2009). According to the County of Santa Barbara Seismic Safety andSafety Element (County of Santa Barbara, 2010), the More Ranch Fault is considered active as it showsdisplacement of recent alluvium.
The Final Negative Declaration for the Santa Barbara County Transfer Station (County of Santa Barbara,1995) also discussed the Modoc fault inferred south of the site based on water level data (Upson, 1951).The location of this fault is unknown, and is not depicted on geologic maps. No evidence of faulting isobserved within the existing cut slopes and therefore infers the fault to be south of the site.
The Alquist-Priolo Earthquake Fault Zoning Act of 1972 requires that the California State Geologistestablish Earthquake Fault Zones around the surface traces of active faults and to issue appropriate maps.The SCRTS alternative site is not located within an Earthquake Fault Zone. Potential impacts at theSCRTS alternative site due to faulting were identified as less than significant, Class III.
14.3.6 Tsunami/Seiches
Tsunamis and seiches are two types of water waves that are generated by earthquake events. Tsunamis arebroad-wavelength ocean waves and seiches are standing waves within confined bodies of water, typicallyreservoirs. Due to the alternative site being located over 2 miles from the Pacific Ocean and have anelevation of 270 feet, the tsunami potential to affect the site is low. Flooding associated with a seismicevent (seiches) is considered low due to the absence of a body of water upslope of the property. Potentialimpacts at the SCRTS alternative site due to tsunamis or seiches were identified as less thansignificant, Class III.
14.3.7 Liquefaction
The presence of near surface Santa Barbara Formation observed within the cut slopes the potential forliquefaction is low. Potential impacts at the SCRTS alternative site due to liquefaction wereidentified as less than significant, Class III.
14.3.8 Seismically Induced and/or Differential Settlement
Seismically induced settlement occurs in loose to medium dense unconsolidated soil above groundwater.These soils compress (settle) when subject to seismic shaking. The settlement can be exacerbated byincreased loading, such as from the construction of buildings. Based on the presence of near surface SantaBarbara Formation, there is a low potential for seismically induced settlement at the Site. Potentialimpacts at the SCRTS alternative site were identified as less than significant, Class III.
It is anticipated that the proposed MRF will be located entirely within Santa Barbara Formation and willutilize a conventional foundation system. However the parking lot east of the site will extend over thehistorical waste footprint and experience settlement. Potential impacts at the SCRTS alternative sitedue to differential settlement is considered as significant environment impacts that can be feasiblymitigated, Class II.
October 4, 2013 Project No. SB00314-1
52
ALT C GEO-1 - It is recommended that a Soils Engineering Report be performed at the site to verifysubsurface materials and provide foundation and pavement section recommendations (i.e. geogrid) tomitigate settlement impacts if this alternative is to be considered.
14.4 Alternative D – Off-site Aerobic Composting (Engel and Gray Composting Facility)
14.4.1 Project Description
The Aerobic Composting Alternative would involve processing organic waste recovered in the MRF usingopen air aerobic composting methods at Engel and Gray’s existing composting facility in the City of SantaMaria, instead of enclosed dry fermentation anaerobic digestion at the Tajiguas Landfill. Similar to theproposed project, the MRF and ADF would be located at the Tajiguas Landfill, with disposal of residualwaste also at the Tajiguas Landfill. The Engel & Gray facility is comprised of two parcels (APNs 113-120-17, -21) on a 40.15 acre portion of the 161-acre City of Santa Maria Wastewater Treatment Plant (WWTP)facility. The site is located approximately 0.3 miles south of the State Route 166/Ray Road intersection,and about 2.5 miles west of residential areas located at Black Road. The composting facility is situatedadjacent to, and immediately west of the developed portion of the WWTP site.
14.4.2 Local Geology
Locally, the alternative compositing site is located within Alluvium Deposits (Qa) described as “valley andfloodplain alluvium (Dibblee, 1989).” The City of Santa Maria Safety Element identifies the Santa MariaValley as alluviul deposits described as “Near-surface deposits consist almost entirely of unconsolidatedalluvial gravel, sand, silt, and clay of Holocene age.” A subsurface investigation was not performed at thesite, nor was one requested or proposed.
14.4.3 Landslides
Dibblee, 1989 did not map landslides at the property. The County of Santa Barbara Seismic SafetyElement maps the site within a low potential for landslides. The Off-site Aerobic Composting alternativesite is proposed to be located at the existing Engel and Gray composting facility location which is relativelyflat. Potential landslide impacts associated with the Aerobic Composting Alternative was identifiedas less than significant, Class III.
14.4.4 Severe Erosion
Because the site is nearly level and there would be no grading on slopes, therefore the severe erosionpotential impact associated with the Aerobic Composting Alternative was identified as less thansignificant, Class III.
14.4.5 Regional Faulting and Seismicity
Similar to the surrounding areas, the Aerobic Composting Alternative site may be affected by moderate tomajor earthquakes centered on one of the known large, active faults listed in Table 14 below. Momentmagnitudes are expressed, although any significant event on these faults could result in moderate to severeground shaking at the subject site. The potential for ground failure of any portion of the Site during groundshaking is considered low.

October 4, 2013 Project No. SB00314-1
53
Table 14: Active Faults Near the Engel and Gray Alternative
Closest Active Faults to SiteApproximate Distance
(miles)Moment Magnitude
(Mw)
Hosgri Fault 20.5 7.5
Los Alamos Fault 21.5 6.8
San Andreas Fault 44.5 8.5
The closest known Holocene age fault is the Hosgri Fault located approximately 20.5 miles northwest ofthe Site (Jennings, 2010), however the San Andreas Fault is the most likely active fault to produce groundshaking at the Site. Figure 16 depicts significant historical earthquakes in the region.
Figure 16: Historical Seismicity Map for the Engel and Gray Alternative (Toppozada et al., 2000)
SITE

October 4, 2013 Project No. SB00314-1
54
The Alquist-Priolo Earthquake Fault Zoning Act of 1972 requires that the California State Geologistestablish Earthquake Fault Zones around the surface traces of active faults and to issue appropriate maps.The Engel and Gray Composting alternative site is not located within an Earthquake Fault Zone. Potentialimpacts at the Aerobic Composting Alternative site due to faulting were identified as less thansignificant, Class III.
14.4.6 Tsunami/Seiches
Tsunamis and seiches are two types of water waves that are generated by earthquake events. Tsunamis arebroad-wavelength ocean waves and seiches are standing waves within confined bodies of water, typicallyreservoirs. Due to the alternative site being located over 8 miles from the Pacific Ocean, the tsunamipotential to affect the site is low. Flooding associated with a seismic event (seiches) is considered low dueto the absence of a body of water upslope of the property. Potential impacts at the Aerobic CompostingAlternative site due to tsunamis or seiches were identified as less than significant, Class III.
14.4.7 Liquefaction
The presence of loose, poorly graded, fine sand material that is saturated by groundwater within an areathat is known to be subjected to high intensity earthquakes and long-duration ground motion are the keyfactors that indicate potentially liquefiable areas and conditions that lead to liquefaction. Due to thepresence of alluvial deposits, there is a high potential for liquefaction, however no structures are proposedat the site as part of this alternative, therefore potential impacts at the Aerobic Composting Alternativesite due to liquefaction is considered as less than significant, Class III.
14.4.8 Seismically Induced Settlement
Seismically induced settlement occurs in loose to medium dense unconsolidated soil above groundwater.These soils compress (settle) when subject to seismic shaking. The settlement can be exacerbated byincreased loading, such as from the construction of buildings. Based on the presence of soft, loose alluvialdeposits, there is a high potential for seismically induced settlement at the Site, however no structures areproposed at the site as part of this alternative, therefore potential impacts at the Aerobic CompostingAlternative site due to seismically induced settlement is considered as less than significant, Class III.
14.5 Alternative E – Tajiguas Landfill Expansion
14.5.1 Project Description
This Alternative would involve expansion of the Tajiguas Landfill to extend its life by at least 10 years(similar to the proposed project) from the currently projected closure in approximately 2026 toapproximately 2036. Under the Expansion Alternative, the permitted maximum daily tonnage for theTajiguas Landfill would remain at its current level of 1,500 tons/day. The existing landfill would beexpanded both vertically and horizontally, to provide an additional 3.7 million cubic yards of airspace or6.9 million tons of waste disposal capacity. The 3.7 million cubic yards of additional capacity would beprovided by expanding the Landfill footprint in the back canyon area of the Landfill property in the area ofthe Landfill reconfiguration project that was approved in 2009.
The overall capacity increase would be achieved by lining and placing additional waste against the existinglandfill cut slope and by additional excavations in the back canyon area increasing the waste fill elevationsin the back canyon by approximately 60 feet. Approximately 300,000 cubic yards of excavation would berequired to create the additional capacity and to facilitate the installation of the composite liner. The fill
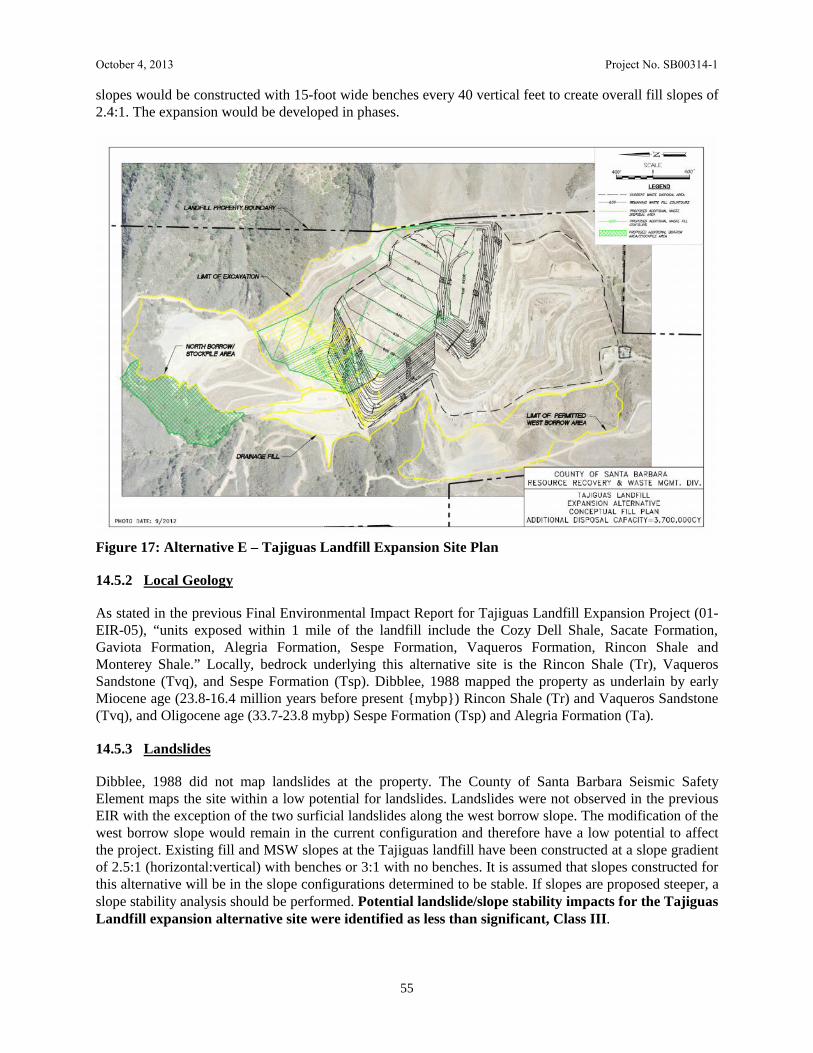
October 4, 2013 Project No. SB00314-1
55
slopes would be constructed with 15-foot wide benches every 40 vertical feet to create overall fill slopes of2.4:1. The expansion would be developed in phases.
Figure 17: Alternative E – Tajiguas Landfill Expansion Site Plan
14.5.2 Local Geology
As stated in the previous Final Environmental Impact Report for Tajiguas Landfill Expansion Project (01-EIR-05), “units exposed within 1 mile of the landfill include the Cozy Dell Shale, Sacate Formation,Gaviota Formation, Alegria Formation, Sespe Formation, Vaqueros Formation, Rincon Shale andMonterey Shale.” Locally, bedrock underlying this alternative site is the Rincon Shale (Tr), VaquerosSandstone (Tvq), and Sespe Formation (Tsp). Dibblee, 1988 mapped the property as underlain by earlyMiocene age (23.8-16.4 million years before present {mybp}) Rincon Shale (Tr) and Vaqueros Sandstone(Tvq), and Oligocene age (33.7-23.8 mybp) Sespe Formation (Tsp) and Alegria Formation (Ta).
14.5.3 Landslides
Dibblee, 1988 did not map landslides at the property. The County of Santa Barbara Seismic SafetyElement maps the site within a low potential for landslides. Landslides were not observed in the previousEIR with the exception of the two surficial landslides along the west borrow slope. The modification of thewest borrow slope would remain in the current configuration and therefore have a low potential to affectthe project. Existing fill and MSW slopes at the Tajiguas landfill have been constructed at a slope gradientof 2.5:1 (horizontal:vertical) with benches or 3:1 with no benches. It is assumed that slopes constructed forthis alternative will be in the slope configurations determined to be stable. If slopes are proposed steeper, aslope stability analysis should be performed. Potential landslide/slope stability impacts for the TajiguasLandfill expansion alternative site were identified as less than significant, Class III.

October 4, 2013 Project No. SB00314-1
56
14.5.4 Severe Erosion
The potential for severe erosion is low considered provided that vegetation and erosion control measuresare implemented immediately after the completion of proposed additional grading and stockpile. Thesevere erosion potential impact for the Tajiguas Landfill expansion alternative site was identified assignificant environment impacts that can be feasibly mitigated, Class II..
14.5.5 Regional Faulting and Seismicity
Similar to the proposed Tajiguas Resource Recovery Project, the Tajiguas Landfill Expansion alternativesite may be affected by moderate to major earthquakes centered on one of the known large, active faultslisted in Table 15 below. Moment magnitudes are expressed, although any significant event on these faultscould result in moderate to severe ground shaking at the subject site. The potential for ground failure ofany portion of the Site during ground shaking is considered low.
Table 15: Active Faults Near the Tajiguas Landfill
Closest Active Faults to SiteApproximate Distance
(miles)Moment Magnitude
(Mw)
Santa Ynez Fault 15.5 7.1
Los Alamos Fault 16.0 6.8
San Andreas Fault 52.0 8.5
The closest known Holocene age fault is the Santa Ynez Fault located approximately 15.5 miles northwestof the Site (Jennings, 2010), however the San Andreas Fault is the most likely active fault to produceground shaking at the Site. Figure 18 depicts significant historical earthquakes in the region.
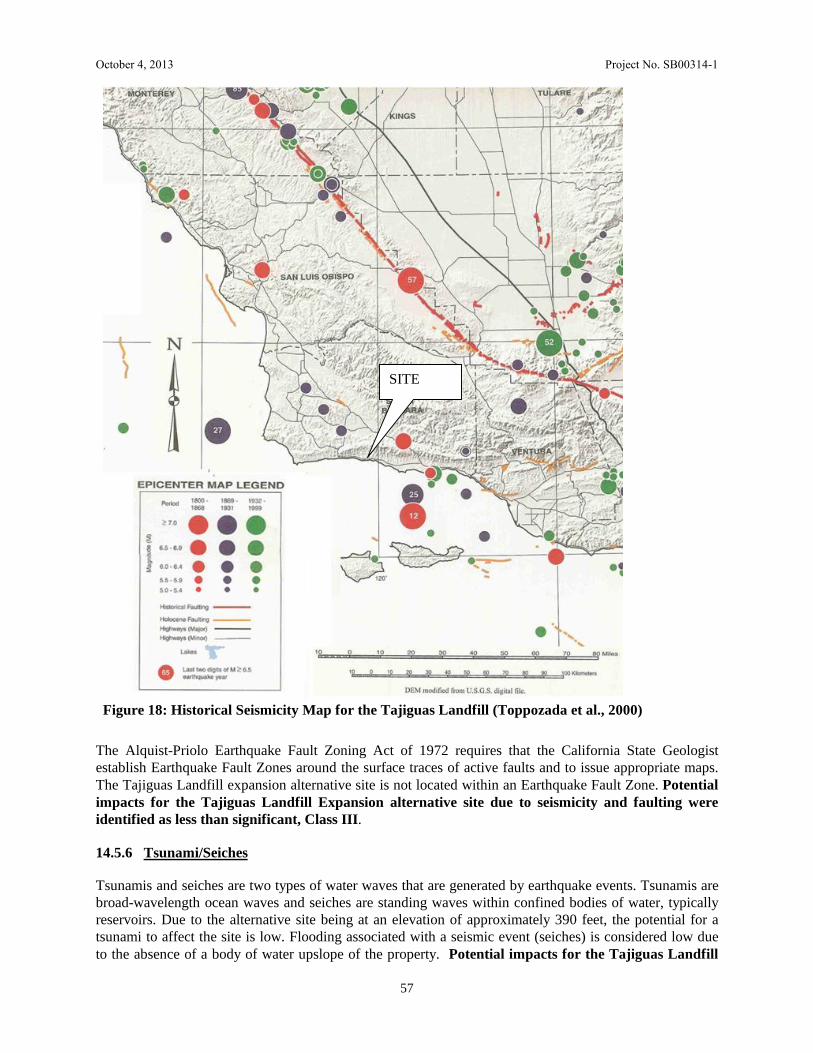
October 4, 2013 Project No. SB00314-1
57
Figure 18: Historical Seismicity Map for the Tajiguas Landfill (Toppozada et al., 2000)
The Alquist-Priolo Earthquake Fault Zoning Act of 1972 requires that the California State Geologistestablish Earthquake Fault Zones around the surface traces of active faults and to issue appropriate maps.The Tajiguas Landfill expansion alternative site is not located within an Earthquake Fault Zone. Potentialimpacts for the Tajiguas Landfill Expansion alternative site due to seismicity and faulting wereidentified as less than significant, Class III.
14.5.6 Tsunami/Seiches
Tsunamis and seiches are two types of water waves that are generated by earthquake events. Tsunamis arebroad-wavelength ocean waves and seiches are standing waves within confined bodies of water, typicallyreservoirs. Due to the alternative site being at an elevation of approximately 390 feet, the potential for atsunami to affect the site is low. Flooding associated with a seismic event (seiches) is considered low dueto the absence of a body of water upslope of the property. Potential impacts for the Tajiguas Landfill
SITE
October 4, 2013 Project No. SB00314-1
58
Expansion alternative site due to tsunamis or seiches were identified as less than significant, ClassIII.
14.5.7 Liquefaction
Based on the consistency and relative density of the in-situ soils (clay/rock) and the depth to groundwaterthe potential for seismic liquefaction of soils at the Site is very low. Potential liquefaction impacts forthe Tajiguas Landfill Expansion alternative Site were identified as less than significant, Class III.
14.5.8 Seismically Induced Settlement
Seismically induced settlement occurs in loose to medium dense unconsolidated soil above groundwater.These soils compress (settle) when subject to seismic shaking. Based on the presence of MSW, there is ahigh potential for seismically induced settlement at the Site, however no structures are proposed thereforethe impact is less than significant. Potential impacts for the Tajiguas Landfill Expansion alternativesite due to seismically induced settlement were identified as less than significant, Class III.
14.6 Alternative F – Waste Export To the Simi Valley Landfill and Recycling Center
This Alternative would involve transportation of all MSW generated in the Tajiguas Landfill wasteshed(up to 270,000 tons/year of MSW, maximum of 1,500 tons/day as currently permitted) to the Simi ValleyLandfill and Recycling Center (SVLRC), when the Tajiguas Landfill reaches its permitted capacity(approximately 2026). The SVLRC is located at 2801 Madera Road, Simi Valley, Californiaapproximately 65 miles from the City of Santa Barbara. The entrance road is located approximately 0.5miles west of the U.S. 101/Madera Road interchange.
The basis of this Alternative is to provide 10 additional years of MSW disposal capacity, when the Landfillreaches its permitted capacity in 2026. This is equivalent to the 10 year increase in Landfill life providedby the proposed project through reductions in disposal rates associated with increased recycling.
A Final EIR for Expansion of the SVLRC was completed in December 2010, and Major Modification No.8 to CUP-3142 was approved by Ventura County.
14.6.1 Geologic Setting
The December 2010 Final EIR describes the geology at the SVLRC as “The proposed project site isunderlain primarily by the Sespe Formation bedrock. Superimposed on this bedrock are various surficialunits, including the upper Pliocene to lower Pleistocene Saugus Formation, which caps subdued ridge topsin the southwest portion of the property; older alluvium, representing erosional remnants of the upperPleistocene to Holocene alluvial deposits; recent alluvium, occupying the axes of active watercourses;various mass wasting deposits, including translational and rotational landslide masses; and surficial soiland colluvial deposits.”
October 4, 2013 Project No. SB00314-1
59
The Final EIR describes faulting at the SVLRC as:Numerous faults have been identified in the Simi Valley region, including two potentially activefaults that traverse the landfill property; however, no active faults are known within the site(Figures 3.7-1 and 3.7-2) (Dibblee and Ehrenspeck 1992; William Lettis & Associates 2004a,2004b).A potentially active fault shows evidence of movement within the last 1 million years, butnot within the last 11,000 years.
As illustrated on Figure 3.7-2, the two potentially active faults that cross the landfill property arethe Canada de la Brea and Strathearn faults. These faults are roughly east-west trending reversefaults and are upthrown to the north. A recent investigation of the Canada de la Brea Faultcompleted for the proposed landfill expansion (William Lettis & Associates 2004a) indicated thatthis fault is likely too short to generate an independent earthquake of sufficient size to producefault rupture. However, because this fault is located in the hanging wall of the Holocene activeSimi Fault, the Canada de la Brea Fault may experience sympathetic (i.e., triggered) slip duringlarge earthquakes on nearby faults. This sympathetic slip, if it occurs, likely would be minor (i.e.,on the order of several centimeters).
14.6.2 Impacts
Under this alternative, MSW sent to the SVLRC would contribute to the following geologic impactsassociated with construction and operation of the SVLRC as identified in the referenced December2010 Final EIR:
Impact GEO-1: Fault Rupture Hazards. Project exists along pre-existing faults or within a State ofCalifornia designated Alquist-Priolo Special Fault Study Zone; a County of Ventura designated FaultHazard area; or a County of Ventura designated Potential Fault Hazard Area. Less than Significant.
Impact GEO-2: Ground Shaking Hazards. Ground shaking hazards are ubiquitous throughout VenturaCounty and, ground failure phenomena aside, are accommodated by the Ventura County Building Code.The effects of ground shaking hazard are required to be considered within the existing framework ofgrading and building code ordinances which apply to all sites and projects. Special threshold criteria forground shaking hazard are thus not established. Less than Significant.
Impact GEO-3: Liquefaction Hazards. A liquefaction hazard is considered to exist based on projectlocation with respect to mapped liquefaction-susceptible areas on the County General Plan maps, on mapscontained in Division of Mines and Geology Open-File Report 76-5LA; and whether the project is locatedin a shallow bedrock area versus and area underlain by recent or older alluvium. Less than Significant.
Impact GEO-4: Subsidence. A subsidence hazard is considered to exist on all new water and oil wellprojects in Ventura County and for all utility and drainage facility projects in the Oxnard Plain. Less thanSignificant.
Impact GEO-5: Expansive Soils. An expansive soil hazard is considered to exist where soil with anexpansion index of greater than 20 are present. Less than Significant.
Impact GEO-6: Landslides/Mudslides. Location of the site or project in areas with slopes greater thanten percent. Less than Significant.
October 4, 2013 Project No. SB00314-1
60
Impact GEO-7: Petroleum Resources. Land use that is proposed to be located in or immediatelyadjacent to any known petroleum resource area, or adjacent to a principal access road to an existingpetroleum Conditional Use Permit (CUP). Less than Significant.
Impact GEO-8: Paleontological Resources. Direct impacts to fossil sites including grading andexcavation of fossiliferous rock, which can result in the loss of scientifically important fossil specimensand associated geological data. Indirect impact including increased access opportunities and unauthorizedcollection of fossil materials. Significant.
Mitigation GEO-1: Paleontological Mitigation Program. An updated/expanded PaleontologicalMitigation Program shall be submitted by Waste Management, Inc. to the County Planning Divisionfor review and approval.
14.7 Alternative G – Waste Export to the Santa Maria Intergrated Waste Management Facility
This Alternative would involve transportation of all MSW generated by the Tajiguas Landfill wasteshed tothe Santa Maria Integrated Waste Management Facility (Santa Maria IWMF), when the Tajiguas Landfillreaches its permitted capacity (projected as 2026). The Santa Maria IWMF will be located on a 1,774 acresite, approximately 7 miles south of the Santa Maria city center (approximately 70 miles from the City ofSanta Barbara) and one mile east of U.S. 101.
The basis of this Alternative is to provide 10 additional years of MSW disposal capacity, when theTajiguas Landfill reaches its permitted capacity in approximately 2026. This is equivalent to the 10year increase in Landfill life provided by the proposed project through reductions in disposal ratesassociated with increased recycling.
The City of Santa Maria plans to construct a new Class III municipal solid waste landfill (Santa MariaIWMF) to replace the existing Santa Maria Regional Landfill. A Final EIR was completed in April 2010,and the project was approved by City Council.
14.7.1 Geologic Setting
The December 2010 Final EIR describes the geology at the Santa Maria IWMF as “The site is underlainalmost entirely by the Pliocene/Pleistocene-age Paso Robles Formation, though the Pleistocene-age OrcuttSand crops out in the northeastern portion of the property. In addition, artificial fill/drilling mud, recentalluvium and colluvium, landslide debris, and the Careaga Formation have also been encountered(Dibblee, 1994; Tennyson, 1992).”
The Final EIR identifies the following faults at the Santa Maria IWMF:
Casmalia-Orcutt Frontal Fault. The Casmalia-Orcutt Frontal Fault is located 1.8 miles east ofthe site and trends northeast-southwest. This reverse fault juxtaposes Quaternary age rock of theOrcutt Formation against older rocks of the Tertiary Sisquoc and Careaga formations. BecauseQuaternary rocks are offset, this fault is classified as potentially active. The fault is approximately17.5 miles long and has a slip rate of 0.01 inch per year. The fault has a Maximum CredibleEarthquake (MCE) Magnitude of 6.5 (USGS, 2002) and an estimated Maximum ProbableEarthquake (MPE) Magnitude of 5.5.
San Luis Range Fault. The San Luis Range Fault is a northwest-southeast trending fault locatedapproximately 4.7 miles northeast of the site, lying just to the northeast of Santa Maria. This
October 4, 2013 Project No. SB00314-1
61
thrust fault has a slip rate of 0.01 inch per year and is approximately 38.5 miles long. The faulthas an MCE Magnitude of 7.0 to 7.2 (USGS, 2002) and an estimated MPE Magnitude of 5.3.
Los Alamos-West Baseline Fault. The Los Alamos-West Baseline Fault is located approximately 5miles south of the site and is classified as active. The thrust fault has a slip rate of 0.03 inch peryear. The fault has an MCE Magnitude of 6.7 to 6.9 (USGS, 2002) and an estimated MPEMagnitude of 5.5.
Lion’s Head Fault. The Lion’s Head Fault is an extension of the Casmalia Fault and liesapproximately 6.5 miles south of the site. This reverse fault is approximately 24.5 miles long andis identified as potentially active. The fault has an MCE Magnitude of 6.6 (USGS, 2002) and anestimated MPE Magnitude of 5.5.
14.7.2 Impacts
Under this alternative, MSW sent to the Santa Maria IWMF would contribute to the followinggeologic impacts associated with construction and operation of the Santa Maria IWMF as identifiedin the referenced December 2010 Final EIR:
Impact G-1 Due to the presence of active faults in the vicinity of the proposed Santa Maria IWMF, thesite and surrounding area is subject to moderate to high levels of ground shaking. Design of the proposedfacilities and access roads in accordance with the seismic criteria contained in Title 27 and the latestadopted building codes would reduce impacts to a less than significant level.
Impact G-2 Soils on the Santa Maria IWMF site are characterized by high to very high erosion potential,which may result in soil-related hazards to on-site development. This is a significant but mitigatableimpact.
Impact G-3 The proposed IWMF would include excavation (subgrade) slopes, waste fill slopes, and finalgrade (including cover) slopes that could present landsliding hazards. However, proper design andcompliance with applicable landfill slope regulations would reduce impacts to a less than significant level.
15.0 ADDITIONAL GEOLOGIC AND GEOTECHNICAL SERVICES
The recommendations contained in this report are based on a limited number of borings and on thecontinuity of the sub-surface conditions encountered. GeoSolutions, Inc. assumes that it will be retained toprovide additional services during future phases of the proposed project. These services would be providedby GeoSolutions, Inc. as required by County of Santa Barbara, the 2010 CBC, and/or industry standardpractices. These services would be in addition to those included in this report and would include, but arenot limited to, the following services:
1. Consultation during plan development.
2. Plan review of grading and foundation documents prior to construction and a report certifying thatthe reviewed plans are in conformance with our geotechnical and geologic recommendations.
3. Consultation during selection and placement of a laterally-reinforcing biaxial geogrid product.

October 4, 2013 Project No. SB00314-1
62
4. Construction inspections and testing, as required, during all grading and excavating operationsbeginning with the stripping of vegetation at the Site, at which time a site meeting or pre-jobmeeting would be appropriate.
5. Special inspection services during construction of reinforced concrete, structural masonry, highstrength bolting, epoxy embedment of threaded rods and reinforcing steel, and welding ofstructural steel.
6. Preparation of construction reports certifying that building pad preparation and foundationexcavations are in conformance with our geotechnical and geologic recommendations.
7. Preparation of special inspection reports as required during construction.
8. In addition to the construction inspections listed above, section 1704.7 of the 2010 CBC (CBSC,2010) requires the following inspections by the Soils Engineer for controlled fill thicknessesgreater than 12 inches as shown in Table 16: Required Verification and Inspections of Soils:
Table 16: Required Verification and Inspections of Soils
Verification and Inspection TaskContinuous During
Task ListedPeriodically During
Task Listed
1. Verify materials below footings are adequate to achieve the designbearing capacity.
- X
2. Verify excavations are extended to proper depth and have reachedproper material.
- X
3. Perform classification and testing of controlled fill materials. - X
4. Verify use of proper materials, densities and lift thicknessesduring placement and compaction of controlled fill.
X -
5. Prior to placement of controlled fill, observe sub-grade and verifythat site has been prepared properly.
- X
16.0 LIMITATIONS AND UNIFORMITY OF CONDITIONS
1. The recommendations of this report are based upon the assumption that the soil conditions do notdeviate from those disclosed during our study. Should any variations or undesirable conditions beencountered during the development of the Site, GeoSolutions, Inc. should be notifiedimmediately and GeoSolutions, Inc. will provide supplemental recommendations as dictated by thefield conditions.
2. This report is issued with the understanding that it is the responsibility of the owner or his/herrepresentative to ensure that the information and recommendations contained herein are brought tothe attention of the architect and engineer for the project, and incorporated into the project plansand specifications. The owner or his/her representative is responsible to ensure that the necessarysteps are taken to see that the contractor and subcontractors carry out such recommendations in thefield.
3. As of the present date, the findings of this report are valid for the property studied. With thepassage of time, changes in the conditions of a property can occur whether they are due to naturalprocesses or to the works of man on this or adjacent properties. Therefore, this report should notbe relied upon after a period of 3 years without our review nor should it be used or is it applicablefor any properties other than those studied. However many events such as floods, earthquakes,

October 4, 2013 Project No. SB00314-1
63
grading of the adjacent properties and building and municipal code changes could render sectionsof this report invalid in less than 3 years.
\\192.168.0.5\v\Santa Barbara Office\Projects\SB00314-1 - Tajiguas Landfill\Geology\SB00314-1 Tajiguas Resource Recovery Project SER+GEO (draft 3).doc

REFERENCES

REFERENCES
American Society of Civil Engineers (ASCE), 2002, Recommended Procedures for Implementation ofDMG Special Publication 117 Guidelines for Analyzing and Mitigating Landslide Hazards inCalifornia, dated June 2002.
American Society of Civil Engineers (ASCE), 2006, Minimum Design Loads for Buildings and OtherStructures. ASCE Standard ASCE/SEI 7-05 Including Supplement No. 1. 1801 Alexander BellDrive, Reston, Virginia 20191. 2006.
California Building Standards Commission (CBSC). 2010 California Building Code, California Code ofRegulations. Title 24. Part 2. Vol. 2. California Building Standards Commission: June 2010.
California Department of Conservation Division of Mines and Geology (CDMG), March 13, 1997, SpecialPublication 117, Guidelines for Evaluating and Mitigating Seismic Hazards in California,Adopted March 13, 1997 by the State Mining and Geology Board in Accordance with the SeismicHazards Mapping Act of 1990, Published in 1997.
Cal EMA, 2009, Tsunami Inundation Map for Emergency Planning, Santa Barbara Quadrangle, County ofSanta Barbara, California, dated January 31, 2009.
City of Santa Maria, 1995, Safety Element of the Santa Maria General Plan, City Council Resolution No.95-149, adopted November 21, 1995.
County of Santa Barbara, 2010, Seismic Safety & Safety Element, Santa Barbara County ComprehensivePlan, amended August 2010.
County of Santa Barbara, March 1993, Final Environmental Impact Report, Santa Barbara CountyTransfer Station, 92-EIR-15, dated March 1993.
County of Santa Barbara, Final Negative Declaration/Initial Study, Santa Barbara County, TransferStation, 95-ND-05, dated May 1995.
County of Santa Barbara, 2008, Geotechnical Evaluations in Support of Completion of Supplemental EIR,Tajiguas Sanitary Landfill, Proposed Reconfiguration Project, Santa Barbara County, California,dated October 16, 2008.
County of Santa Barbara, March 2009, Final Subsequent Environmental Impact Report for the TajiguasLandfill Reconfiguration and Baron Ranch Restoration Project, 08EIR-00000-00007.
County of Santa Barbara, 2002, Final Environmental Impact Report, Tajiguas Landfill Expansion Project,01-EIR-05, dated July 2002.
City of Santa Maria, 2010, Final Environmental Impact Report, City of Santa Maria Integrated WasteManagement Facility Project, SCH #2006091069, dated April 2010.
County of Ventura, 2010, Final EIR, Simi Valley Landfill and Recycling Center Expansion Project,Volume I, Chapters 1-9, dated December 2010.
DeLorme. Topo USA 8.0. Vers.8.0.0 – F2.3 – 21.027.1970.1153. Computer software. DeLorme, 2009.
Dibblee, Thomas W. Jr., 1986, Geologic Map of the Santa Barbara Quadrangle, Santa Barbara County,California, Dibblee Geology Center Map #DF-06, Scale 1:24,000.
Dibblee, Thomas W. Jr., 1987, Geologic Map of the Goleta Quadrangle, Santa Barbara County,California, Dibblee Geology Center Map #DF-07, Scale 1:24,000.
Dibblee, Thomas W. Jr., 1988a, Geologic Map of the Solvang and Gaviota Quadrangles, Santa BarbaraCounty, California, Dibblee Geology Center Map #DF-16, Scale 1:24,000.
Dibblee, Thomas W. Jr., 1988b, Geologic Map of the Santa Ynez and Tajiguas Quadrangles, SantaBarbara County, California, Dibblee Geology Center Map #DF-15, Scale 1:24,000.
Dibblee, Thomas W. Jr., 1989, Geologic Map of the Point Sal and Guadalupe Quadrangles, SantaBarbara County, California, Dibblee Geology Center Map #DF-25, Scale 1:24,000.
Duncan, M.J., 1996, Soil Slope Stability Analysis, in Turner, A.K., and Schuster, R.L., eds., Landslides:Investigation and Mitigation, Transportation Research Board Special Report 247.
Federal Emergency Management Agency (FEMA), 2012, Flood Insurance Rate Map, Santa BarbaraCounty, California, Map Number 06083C1285G and 1305G, dated December 4, 2012.
Geo-Logic Associates, 2007, Slope Stability Evaluation, Operations Center Fill Slope, Tajiguas Landfill,Santa Barbara County, California, Project No. 2007-0003, dated April 5, 2007.
Geo-Logic Associates, 2008, Slope Stability Evaluation, Western Cut Slope, Tajiguas Landfill, SantaBarbara County, California, Project No. 2008-0004, dated February 14, 2008.
Geo-Logic Associates, 2012, Revised Slope Stability Evaluation, Western Cut Slope 2012 RevisedGrading, Tajiguas Landfill, Santa Barbara County, California, Project No. 2012-0072, dated May30, 2012.
Geo-Slope International, Limited, Slope/W for Slope Stability Analysis, Calgary, Alberta, Canada, Version5, 2002. Google Inc., 2010.
Geosyntec Consultants, 2007, Stability Evaluation, Phase 2A Liner Design, Tajiguas Landfill, SantaBarbara County, California, dated December 26, 2007.
Geosyntec Consultants, 2009, Construction Quality Assurance Report, Phase IIA, Tajiguas SanitaryLandfill, Santa Barbara County, California, Project Number HL1123, dated January, 2009.
Jennings, C.W., 2010, 2010 Fault Activity Map of California, California Geologic Survey, Geologic DataMap No. 6, Scale 1:750,000.
Minor, Scott A., Kellogg, Karl S., Stanley, Richard G., Gurrola, Larry D., Keller, Edward A., Brandt,Theodore R., 2009, Geologic Map of the Santa Barbara Coastal Plain Area, Santa Barbara County,California, USGS, Scientific Investigations Map 3001.
Natural Resources Conservation Services (NRCS), January 2, 2008, Web Soil Survey, San Luis ObispoCounty, California, Coastal Part (CA664), Version 4, dated January 2, 2008.
NAVFAC, 1983, Soil Mechanics Design Manual 7.3, U.S. Department of the Navy, Naval FacilitiesEngineering Command.
Pacific Materials Laboratory, August 13, 2002, Preliminary Foundation Investigation, Proposed MarBorgC & D Recycling Facility, 119 N. Quarantina Street and 4 East Yanonali Street, APN: 017-030-006, City of Santa Barbara, California, File No. 02-11072-2, dated August 13, 2002.
Sharma, H.D. and De, A., 2007, Municipal Solid Waste Landfill Settlement: Postclosure Perspectives,Journal of Geotechnical and Geoenvironmental Engineering, dated June 2007.
State of California, Department of Transportation. Standard Specifications. State of California Departmentof Transportation Central Publication Distribution Unit: July 1999.
SWT Engineering, 2009, Settlement Analysis, Tajiguas Sanitary Landfill, dated June 2009.
Toppozada, T., Branum, D., Petersen, M., Hallstrom, C., Cramer, C., Reichle, M., 2000, Epicenters of andAreas Damaged by M > 5 California Earthquakes, 1800-1999, California Division of Mines andGeology, Map Sheet 49.
County of Santa Barbara, 2002, Final Environmental Impact Report, Tajiguas Landfill Expansion Project,01-EIR-05, dated July 2002.
Upson, J.E., 1951, Geology and ground-water resources of the south-coast basins of Santa Barbara County,California, U.S. Geological Survey, Water-Supply Paper 1108, Scale 1:31,680.
United States Geological Survey (USGS), 2012, U.S. Seismic Design Maps Application, Version 3.0.1,dated July 12, 2012, http://geohazards.usgs.gov/designmaps/us/application.php.
Willdan Geotechnical, 2010, Geotechnical Engineering Investigation Report, Tajiguas Landfill, 2005Storm Drain Distress Mitigation, Santa Barbara County, California, Project No. 100366, datedNovember 29, 2010.
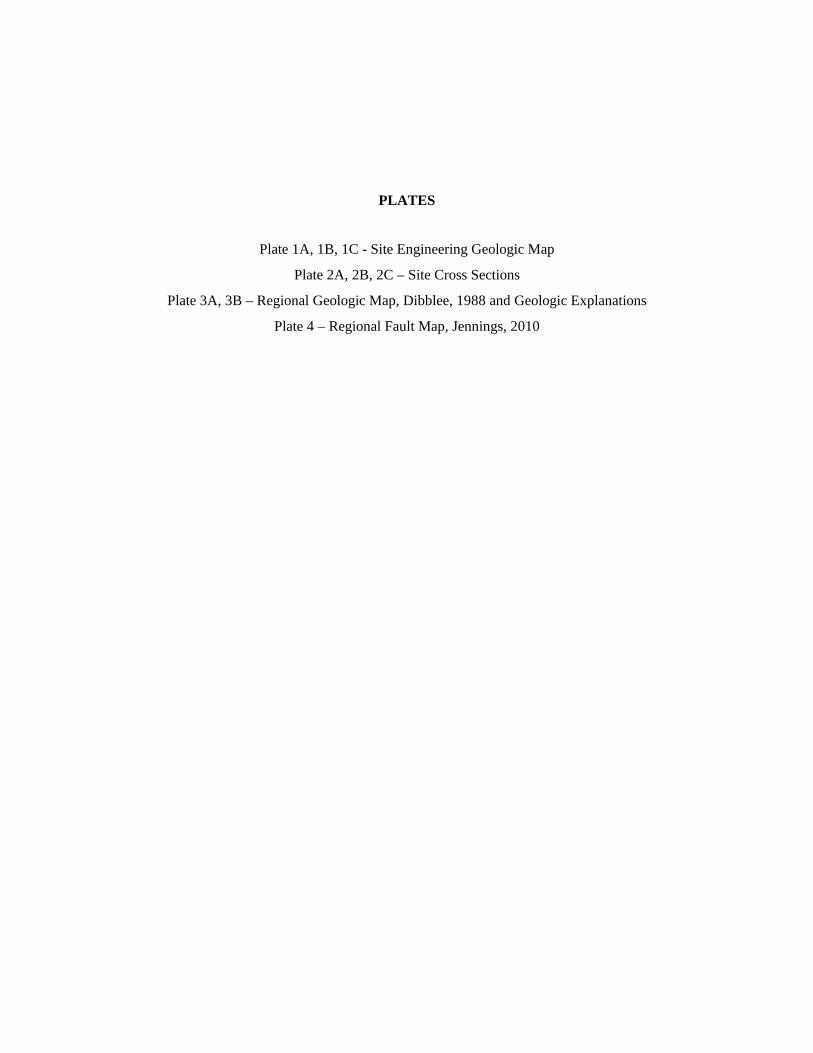
PLATES
Plate 1A, 1B, 1C - Site Engineering Geologic Map
Plate 2A, 2B, 2C – Site Cross Sections
Plate 3A, 3B – Regional Geologic Map, Dibblee, 1988 and Geologic Explanations
Plate 4 – Regional Fault Map, Jennings, 2010

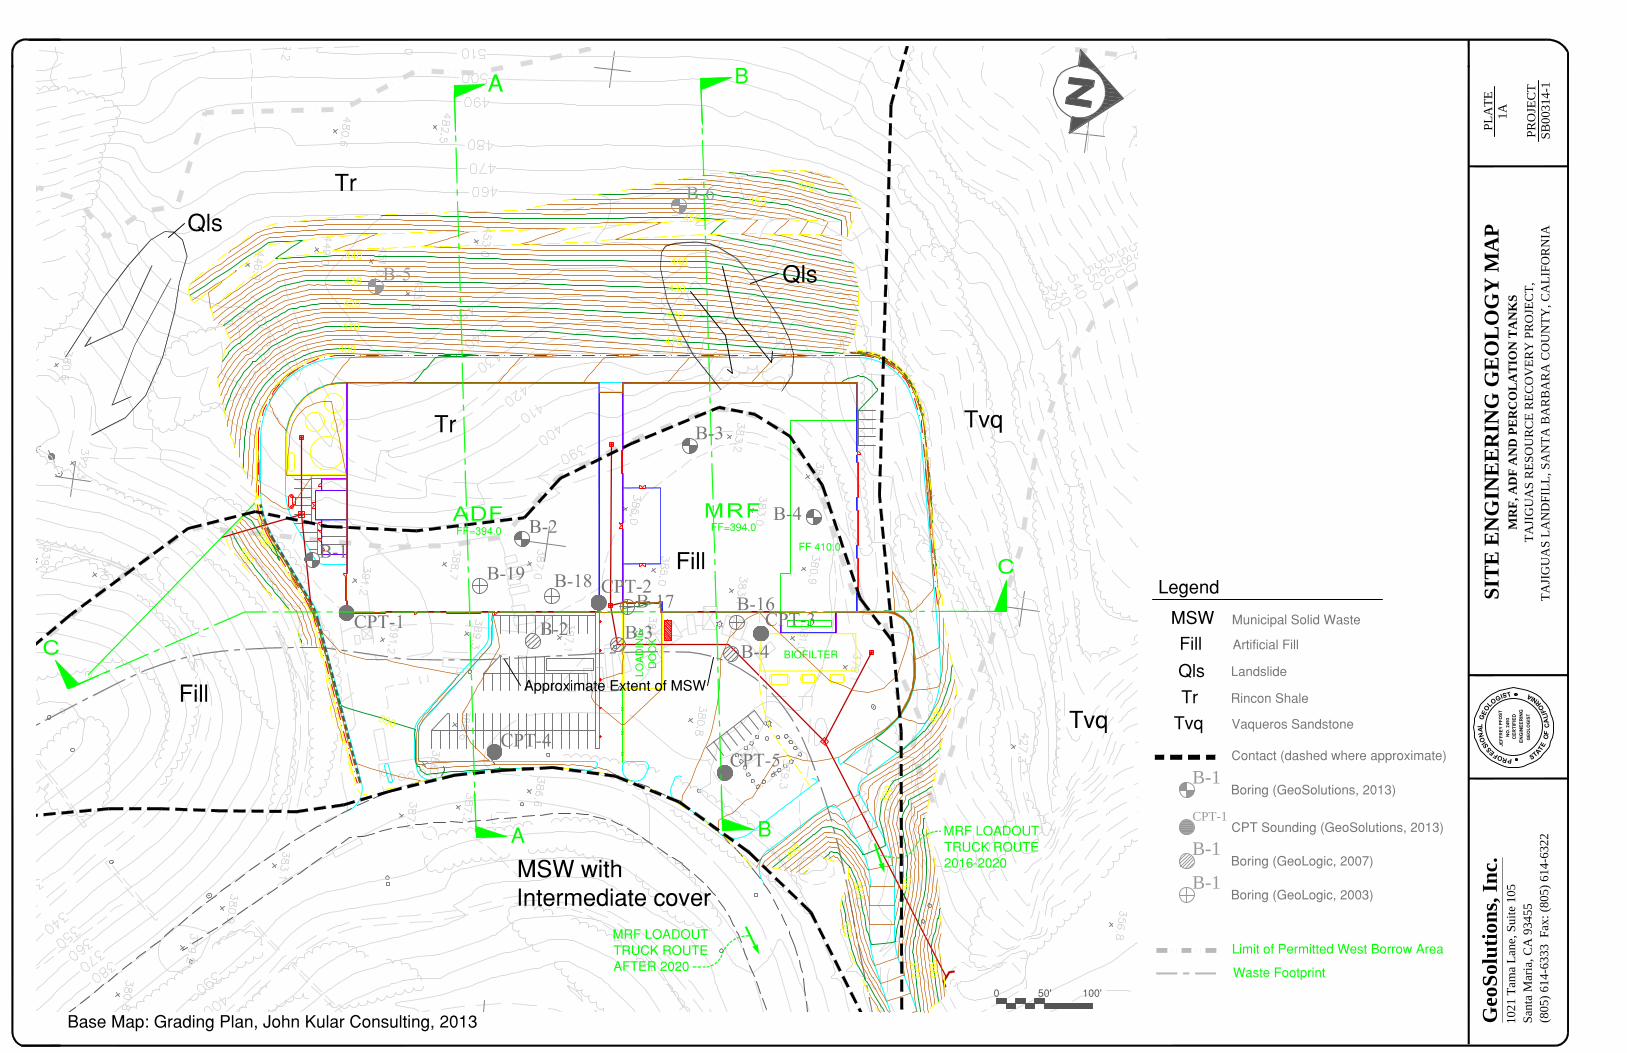
PLA
TE1A
PRO
JEC
TSB
0031
4-1
T
S
I
A
GE
OL
OG
IS
T
C
F
O
F
I
O
L
T
S
A
T
E
CE
RT
IF
IE
D
NO
. 2
49
3G
N
LA
E
O
O
RP
E
F
S
JE
FF
RE
Y P
FO
ST
S
I
O
EN
GIN
EE
RIN
G
I
A
N
R
G
L
O
Geo
Solu
tions
, Inc
.10
21 T
ama
Lane
, Sui
te 1
05Sa
nta
Mar
ia, C
A 9
3455
(805
) 614
-633
3 F
ax: (
805)
614
-632
2
SIT
E E
NG
INE
ER
ING
GE
OL
OG
Y M
AP
MR
F, A
DF
AN
D P
ER
CO
LA
TIO
N T
AN
KS
TAJI
GU
AS
RES
OU
RC
E R
ECO
VER
Y P
RO
JEC
T,TA
JIG
UA
S LA
ND
FILL
, SA
NTA
BA
RB
AR
A C
OU
NTY
, CA
LIFO
RN
IA
B-1
CPT-1
B-1
B-1
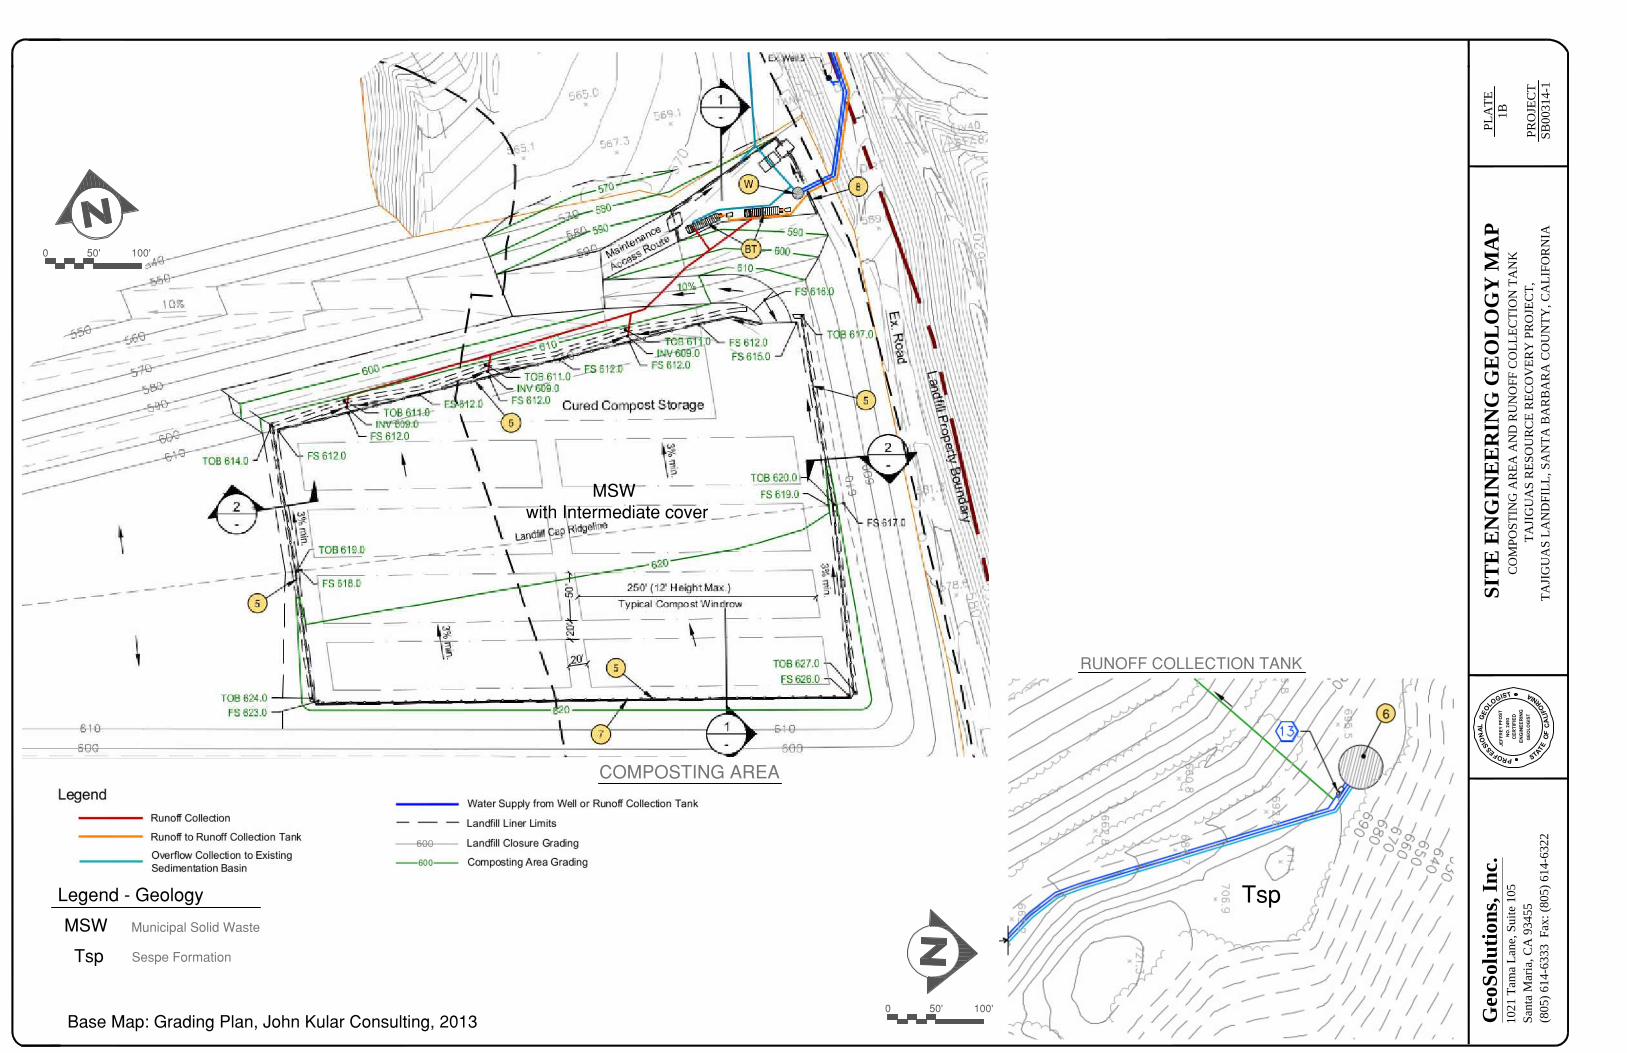
PLA
TE1B
PRO
JEC
TSB
0031
4-1
T
S
I
A
GE
OL
OG
IS
T
C
F
O
F
I
O
L
T
S
A
T
E
CE
RT
IF
IE
D
NO
. 2
49
3G
N
LA
E
O
O
RP
E
F
S
JE
FF
RE
Y P
FO
ST
S
I
O
EN
GIN
EE
RIN
G
I
A
N
R
G
L
O
Geo
Solu
tions
, Inc
.10
21 T
ama
Lane
, Sui
te 1
05Sa
nta
Mar
ia, C
A 9
3455
(805
) 614
-633
3 F
ax: (
805)
614
-632
2
SIT
E E
NG
INE
ER
ING
GE
OL
OG
Y M
AP
CO
MPO
STIN
G A
REA
AN
D R
UN
OFF
CO
LLEC
TIO
N T
AN
KTA
JIG
UA
S R
ESO
UR
CE
REC
OV
ERY
PR
OJE
CT,
TAJI
GU
AS
LAN
DFI
LL, S
AN
TA B
AR
BA
RA
CO
UN
TY, C
ALI
FOR
NIA
PLA
TE1C
PRO
JEC
TSB
0031
4-1
T
S
I
A
GE
OL
OG
IS
T
C
F
O
F
I
O
L
T
S
A
T
E
CE
RT
IF
IE
D
NO
. 2
49
3G
N
LA
E
O
O
RP
E
F
S
JE
FF
RE
Y P
FO
ST
S
I
O
EN
GIN
EE
RIN
G
I
A
N
R
G
L
O
Geo
Solu
tions
, Inc
.10
21 T
ama
Lane
, Sui
te 1
05Sa
nta
Mar
ia, C
A 9
3455
(805
) 614
-633
3 F
ax: (
805)
614
-632
2
SIT
E E
NG
INE
ER
ING
GE
OL
OG
Y M
AP
WEL
L W
ATE
R S
TOR
AG
E TA
NK
AN
D R
ECY
CLE
D W
ATE
R T
AN
KTA
JIG
UA
S R
ESO
UR
CE
REC
OV
ERY
PR
OJE
CT,
TAJI
GU
AS
LAN
DFI
LL, S
AN
TA B
AR
BA
RA
CO
UN
TY, C
ALI
FOR
NIA

PLATE2A
PROJECTSB00314-1
T
S
I
A
GEOLOGIST
C
F
O
F
I
O
L
T
S
A
T
E
CERTIFIED
NO. 2493
G
N
LA
E
O
O
RP
E
F
S
JEFFREY PFOST
S
I
O
ENGINEERING
I
A
N
R
G
L
OGeoSolutions, Inc.1021 Tama Lane, Suite 105Santa Maria, California 93455(805) 614-6333 Fax: (805) 614-6322
SITE CROSS SECTIONTAJIGUAS RESOURCE RECOVERY PROJECT,
TAJIGUAS LANDFILL, SAN BARBARA COUNTY, CALIFORNIA
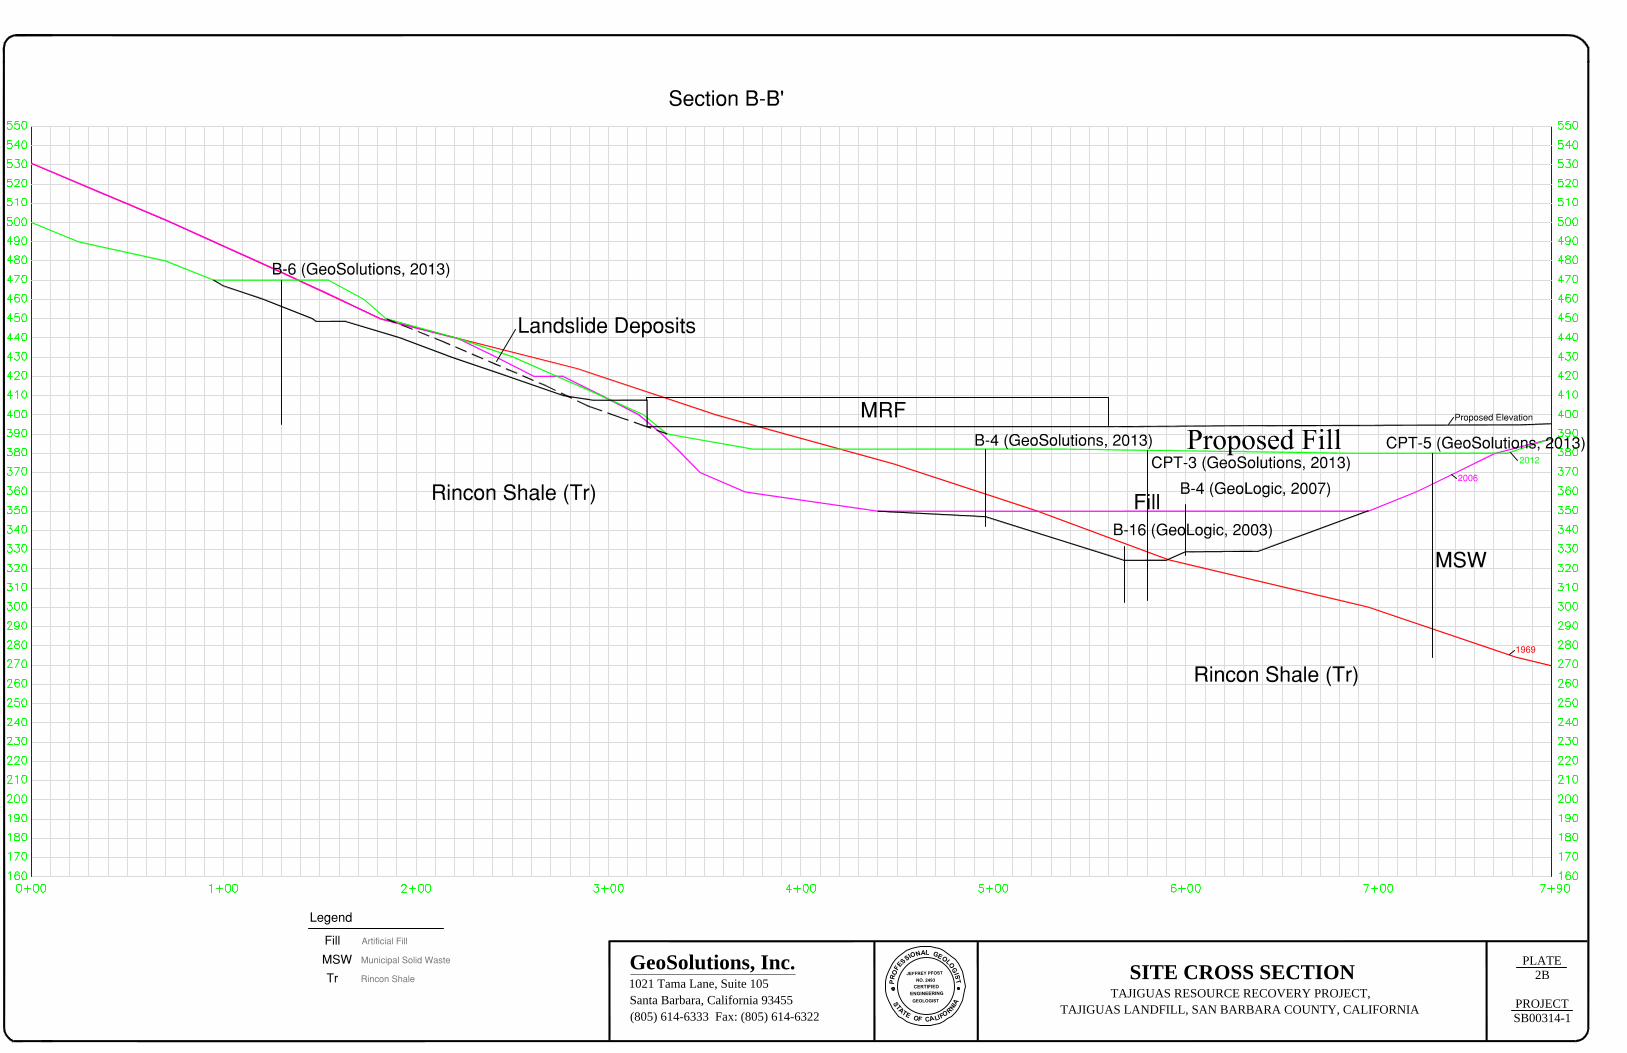
PLATE2B
PROJECTSB00314-1
T
S
I
A
GEOLOGIST
C
F
O
F
I
O
L
T
S
A
T
E
CERTIFIED
NO. 2493
G
N
LA
E
O
O
RP
E
F
S
JEFFREY PFOST
S
I
O
ENGINEERING
I
A
N
R
G
L
OGeoSolutions, Inc.1021 Tama Lane, Suite 105Santa Barbara, California 93455(805) 614-6333 Fax: (805) 614-6322
SITE CROSS SECTIONTAJIGUAS RESOURCE RECOVERY PROJECT,
TAJIGUAS LANDFILL, SAN BARBARA COUNTY, CALIFORNIA
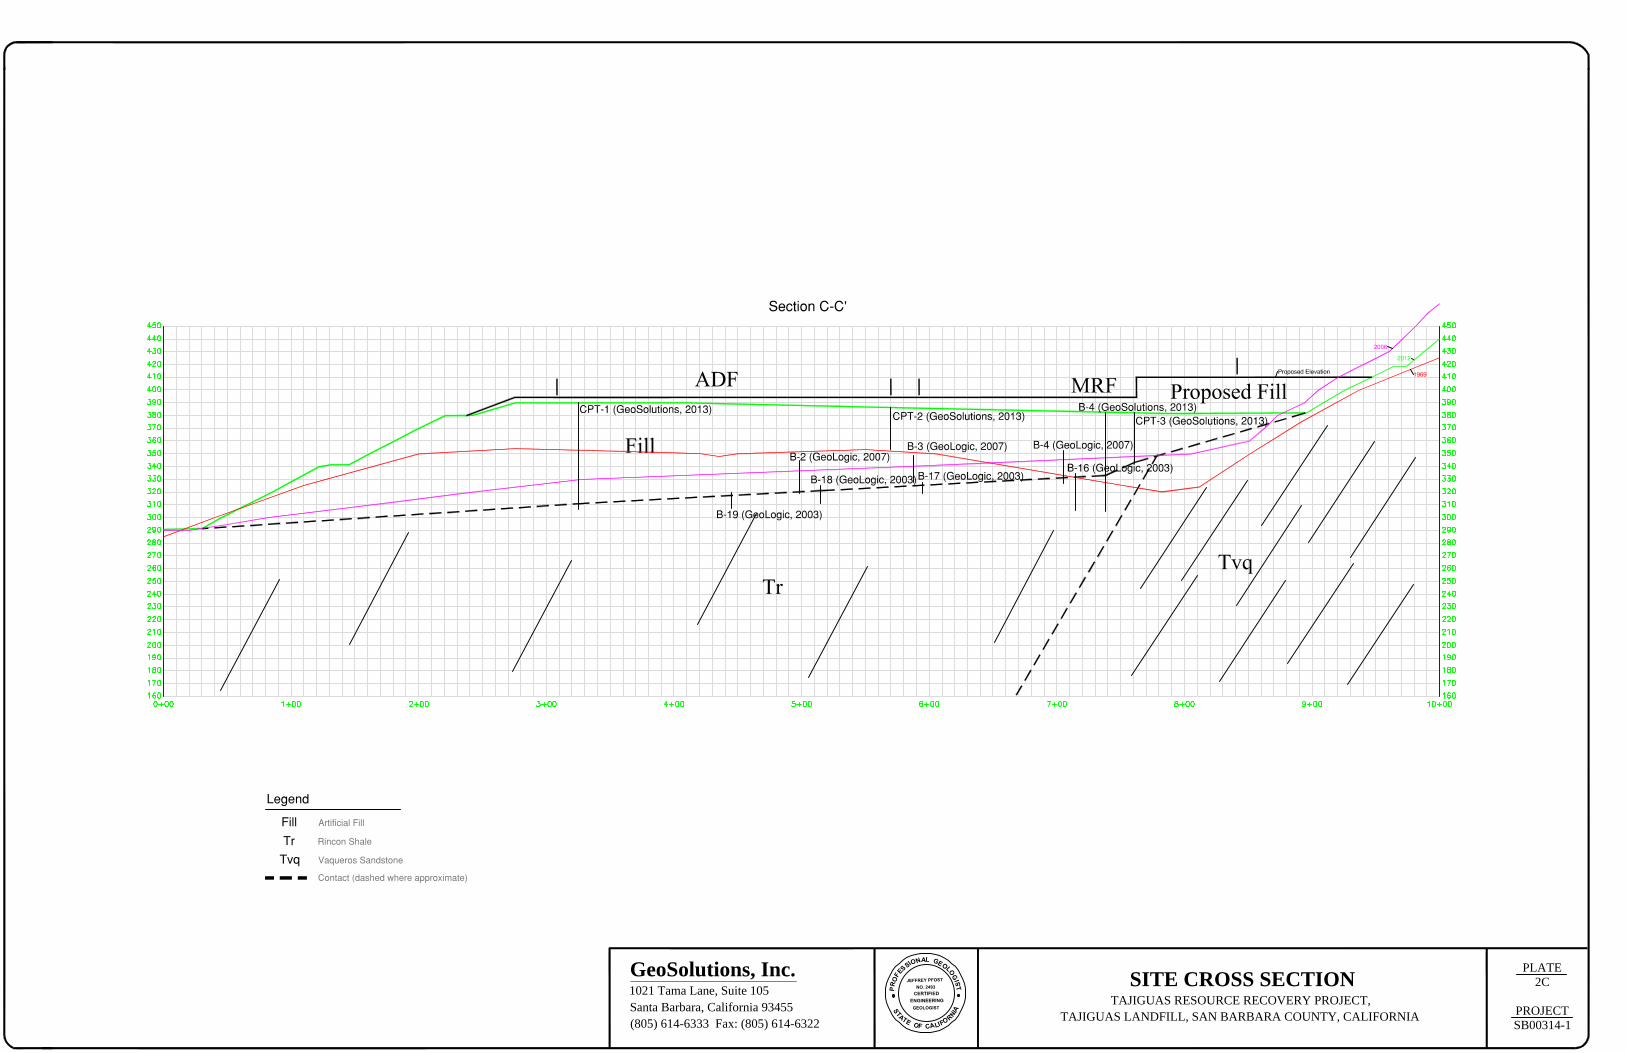
PLATE2C
PROJECTSB00314-1
T
S
I
A
GEOLOGIST
C
F
O
F
I
O
L
T
S
A
T
E
CERTIFIED
NO. 2493
G
N
LA
E
O
O
RP
E
F
S
JEFFREY PFOST
S
I
O
ENGINEERING
I
A
N
R
G
L
OGeoSolutions, Inc.1021 Tama Lane, Suite 105Santa Barbara, California 93455(805) 614-6333 Fax: (805) 614-6322
SITE CROSS SECTIONTAJIGUAS RESOURCE RECOVERY PROJECT,
TAJIGUAS LANDFILL, SAN BARBARA COUNTY, CALIFORNIA
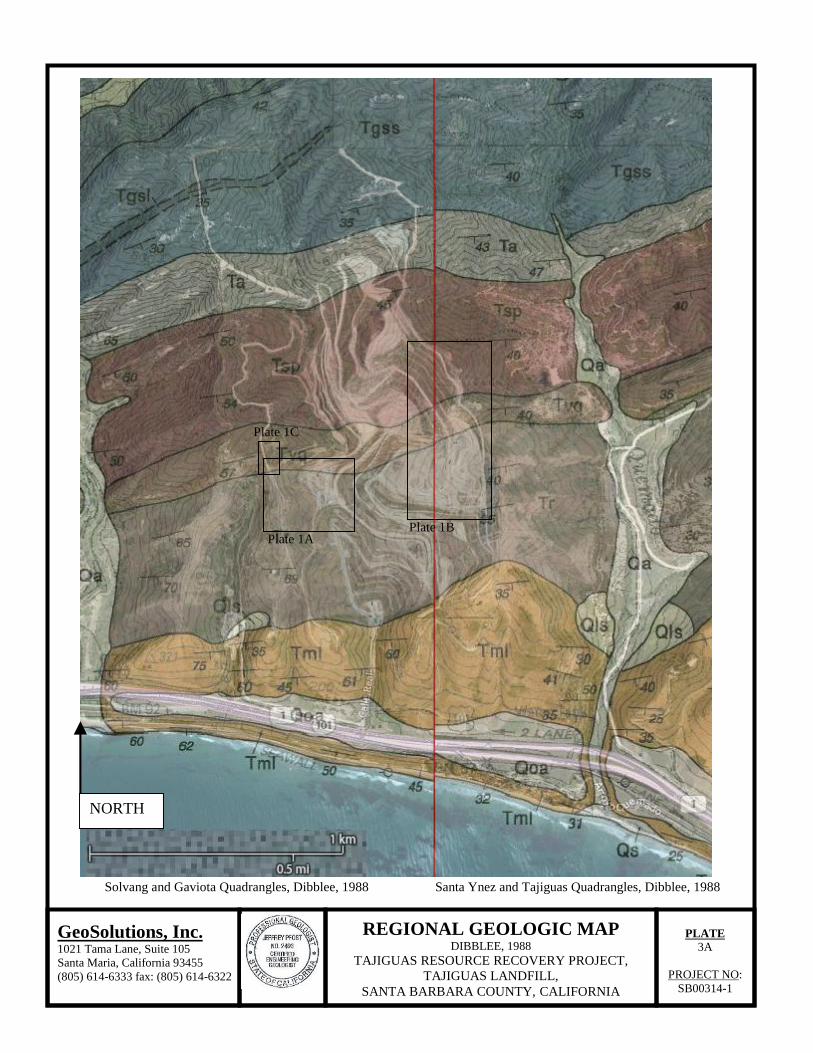
GeoSolutions, Inc.1021 Tama Lane, Suite 105Santa Maria, California 93455(805) 614-6333 fax: (805) 614-6322
REGIONAL GEOLOGIC MAPDIBBLEE, 1988
TAJIGUAS RESOURCE RECOVERY PROJECT,TAJIGUAS LANDFILL,
SANTA BARBARA COUNTY, CALIFORNIA
PLATE3A
PROJECT NO:SB00314-1
NORTH
Solvang and Gaviota Quadrangles, Dibblee, 1988 Santa Ynez and Tajiguas Quadrangles, Dibblee, 1988
Plate 1APlate 1B
Plate 1C
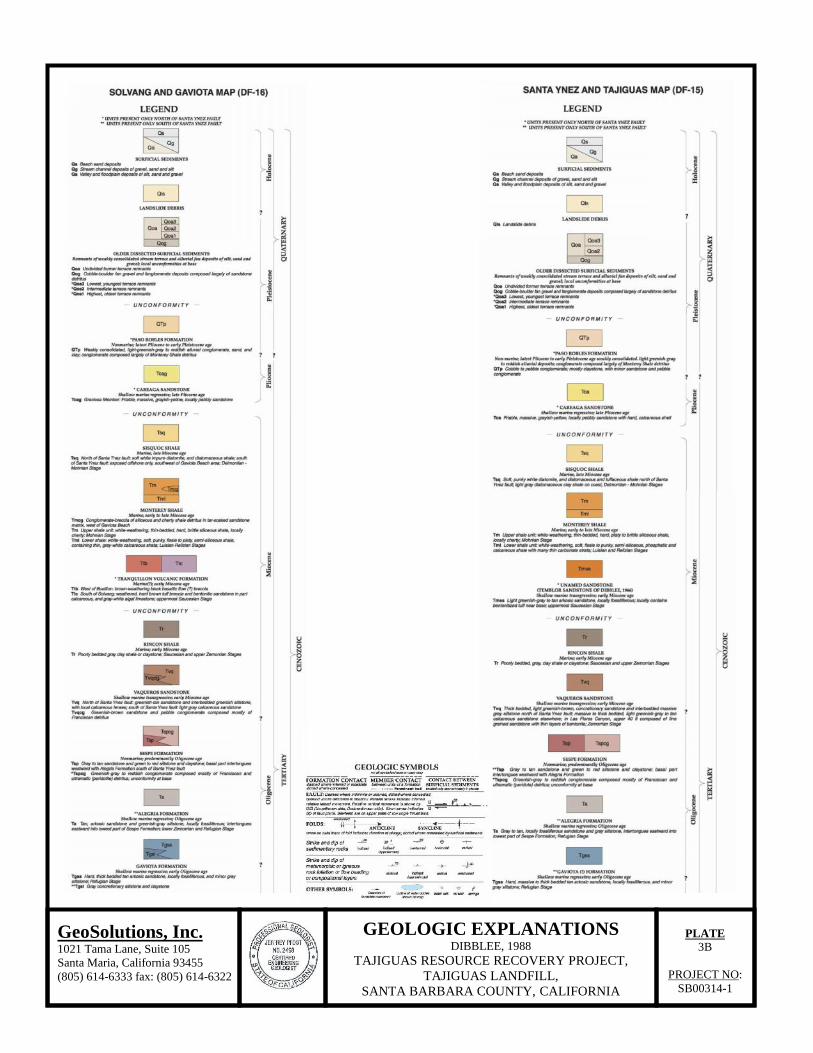
GeoSolutions, Inc.1021 Tama Lane, Suite 105Santa Maria, California 93455(805) 614-6333 fax: (805) 614-6322
GEOLOGIC EXPLANATIONSDIBBLEE, 1988
TAJIGUAS RESOURCE RECOVERY PROJECT,TAJIGUAS LANDFILL,
SANTA BARBARA COUNTY, CALIFORNIA
PLATE3B
PROJECT NO:SB00314-1
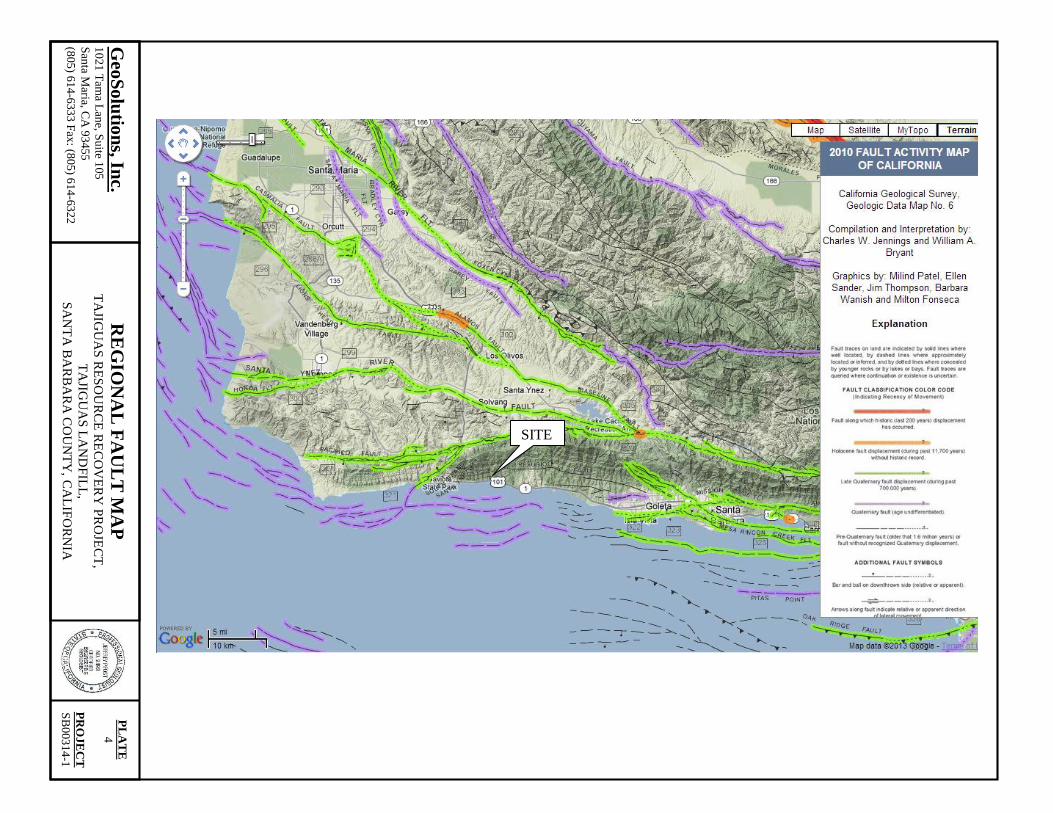
RE
GIO
NA
L F
AU
LT
MA
PT
AJIG
UA
S RE
SOU
RC
E R
EC
OV
ER
Y PR
OJE
CT
,T
AJIG
UA
S LA
ND
FILL
,SA
NT
A B
AR
BA
RA
CO
UN
TY
,CA
LIFO
RN
IA
GeoSolutions, Inc.
1021 Tam
a Lane, S
uite 105S
anta Maria, C
A 93455
(805) 614-6333 Fax: (805) 614-6322
PL
AT
E4
PR
OJE
CT
SB
00314-1
SITE
APPENDIX A
Field Investigation
Soil Classification Chart
Boring Logs
CPT Soundings
Design Maps Summary Report
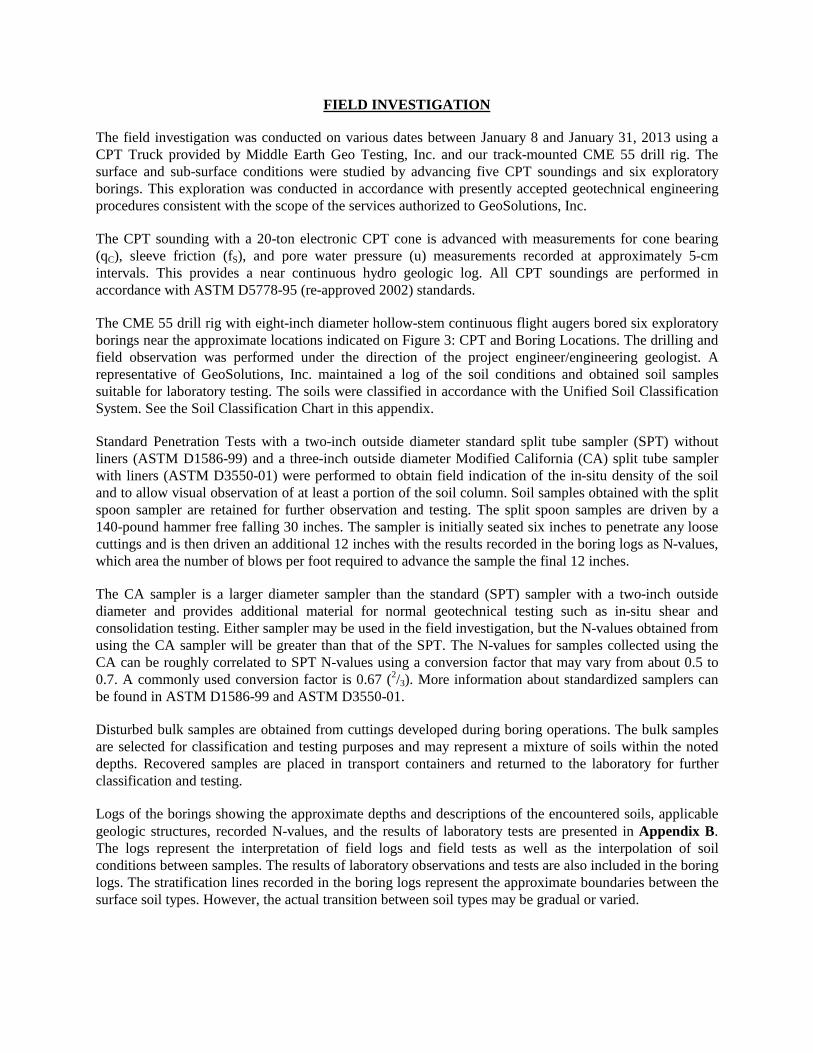
FIELD INVESTIGATION
The field investigation was conducted on various dates between January 8 and January 31, 2013 using aCPT Truck provided by Middle Earth Geo Testing, Inc. and our track-mounted CME 55 drill rig. Thesurface and sub-surface conditions were studied by advancing five CPT soundings and six exploratoryborings. This exploration was conducted in accordance with presently accepted geotechnical engineeringprocedures consistent with the scope of the services authorized to GeoSolutions, Inc.
The CPT sounding with a 20-ton electronic CPT cone is advanced with measurements for cone bearing(qC), sleeve friction (fS), and pore water pressure (u) measurements recorded at approximately 5-cmintervals. This provides a near continuous hydro geologic log. All CPT soundings are performed inaccordance with ASTM D5778-95 (re-approved 2002) standards.
The CME 55 drill rig with eight-inch diameter hollow-stem continuous flight augers bored six exploratoryborings near the approximate locations indicated on Figure 3: CPT and Boring Locations. The drilling andfield observation was performed under the direction of the project engineer/engineering geologist. Arepresentative of GeoSolutions, Inc. maintained a log of the soil conditions and obtained soil samplessuitable for laboratory testing. The soils were classified in accordance with the Unified Soil ClassificationSystem. See the Soil Classification Chart in this appendix.
Standard Penetration Tests with a two-inch outside diameter standard split tube sampler (SPT) withoutliners (ASTM D1586-99) and a three-inch outside diameter Modified California (CA) split tube samplerwith liners (ASTM D3550-01) were performed to obtain field indication of the in-situ density of the soiland to allow visual observation of at least a portion of the soil column. Soil samples obtained with the splitspoon sampler are retained for further observation and testing. The split spoon samples are driven by a140-pound hammer free falling 30 inches. The sampler is initially seated six inches to penetrate any loosecuttings and is then driven an additional 12 inches with the results recorded in the boring logs as N-values,which area the number of blows per foot required to advance the sample the final 12 inches.
The CA sampler is a larger diameter sampler than the standard (SPT) sampler with a two-inch outsidediameter and provides additional material for normal geotechnical testing such as in-situ shear andconsolidation testing. Either sampler may be used in the field investigation, but the N-values obtained fromusing the CA sampler will be greater than that of the SPT. The N-values for samples collected using theCA can be roughly correlated to SPT N-values using a conversion factor that may vary from about 0.5 to0.7. A commonly used conversion factor is 0.67 (2/3). More information about standardized samplers canbe found in ASTM D1586-99 and ASTM D3550-01.
Disturbed bulk samples are obtained from cuttings developed during boring operations. The bulk samplesare selected for classification and testing purposes and may represent a mixture of soils within the noteddepths. Recovered samples are placed in transport containers and returned to the laboratory for furtherclassification and testing.
Logs of the borings showing the approximate depths and descriptions of the encountered soils, applicablegeologic structures, recorded N-values, and the results of laboratory tests are presented in Appendix B.The logs represent the interpretation of field logs and field tests as well as the interpolation of soilconditions between samples. The results of laboratory observations and tests are also included in the boringlogs. The stratification lines recorded in the boring logs represent the approximate boundaries between thesurface soil types. However, the actual transition between soil types may be gradual or varied.

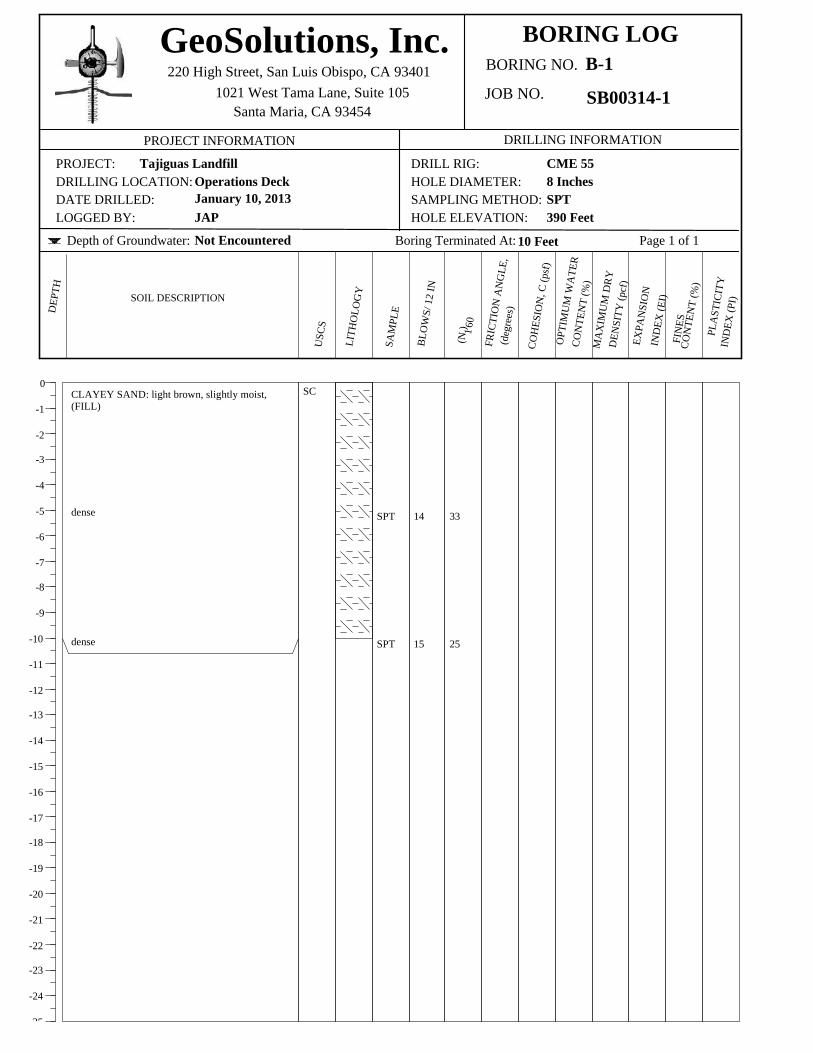
GeoSolutions, Inc.220 High Street, San Luis Obispo, CA 93401
1021 West Tama Lane, Suite 105
BORING LOGBORING NO.
JOB NO.
PROJECT INFORMATION DRILLING INFORMATION
PROJECT:DRILLING LOCATION:DATE DRILLED:LOGGED BY:
DRILL RIG:HOLE DIAMETER:SAMPLING METHOD:HOLE ELEVATION:
DEP
TH
SOIL DESCRIPTION
USC
S
LITH
OLO
GY
SAM
PLE
BLO
WS/
12
IN
OPT
IMU
M W
ATE
RCO
NTE
NT
(%)
MA
XIM
UM
DRY
DEN
SITY
(pcf
)EX
PAN
SIO
NIN
DEX
(EI)
(N60
0
-1
-2
-3
-4
-5
-6
-7
-8
-9
-10
-11
-12
-13
-14
-15
-16
-17
-18
-19
-20
-21
-22
-23
-24
-25
Depth of Groundwater: Boring Terminated At:
FRIC
TIO
N A
NG
LE,
COH
ESIO
N, C
(psf
)
(deg
rees
)
1)
CON
TEN
T (%
)
FIN
ES
PLA
STIC
ITY
IND
EX (P
I)
Santa Maria, CA 93454
SC
8 Inches
B-1
SB00314-1
Tajiguas LandfillOperations DeckJanuary 10, 2013JAP
CME 55
390 Feet
10 Feet Page 1 of 1
CLAYEY SAND: light brown, slightly moist,(FILL)
dense
dense
SPT
SPT
14
15
Not Encountered
SPT
33
25
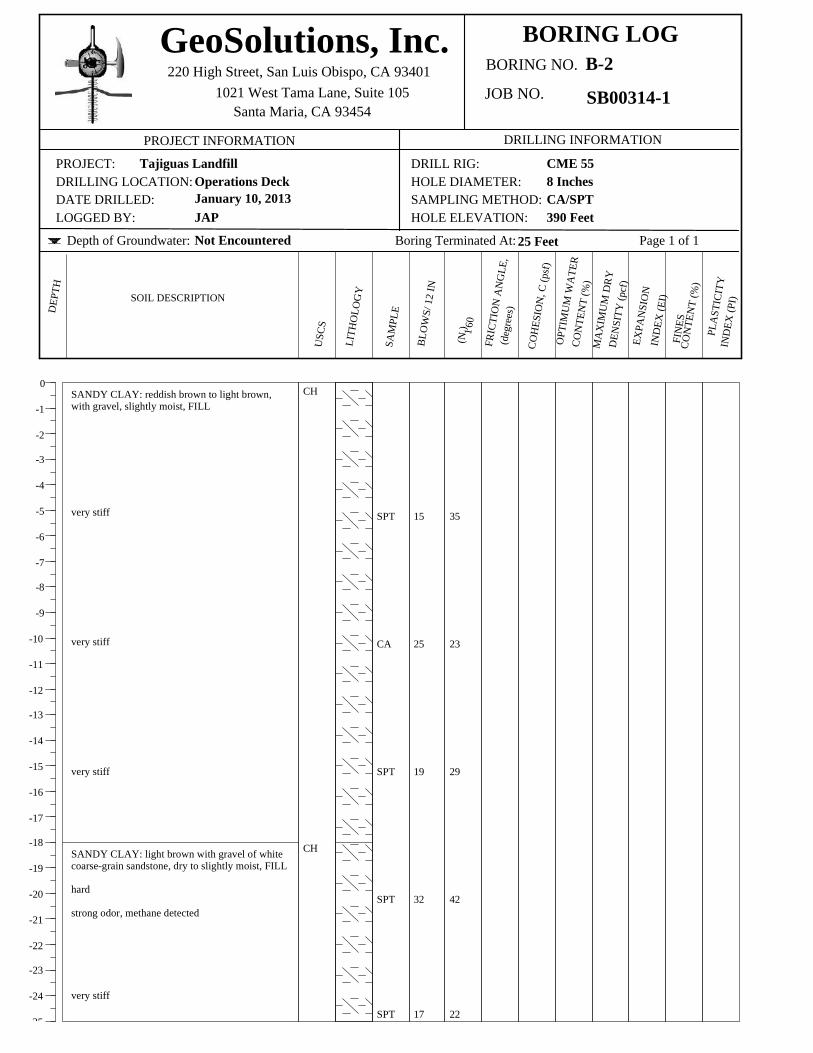
GeoSolutions, Inc.220 High Street, San Luis Obispo, CA 93401
1021 West Tama Lane, Suite 105
BORING LOGBORING NO.
JOB NO.
PROJECT INFORMATION DRILLING INFORMATION
PROJECT:DRILLING LOCATION:DATE DRILLED:LOGGED BY:
DRILL RIG:HOLE DIAMETER:SAMPLING METHOD:HOLE ELEVATION:
DEP
TH
SOIL DESCRIPTION
USC
S
LITH
OLO
GY
SAM
PLE
BLO
WS/
12
IN
OPT
IMU
M W
ATE
RCO
NTE
NT
(%)
MA
XIM
UM
DRY
DEN
SITY
(pcf
)EX
PAN
SIO
NIN
DEX
(EI)
(N60
0
-1
-2
-3
-4
-5
-6
-7
-8
-9
-10
-11
-12
-13
-14
-15
-16
-17
-18
-19
-20
-21
-22
-23
-24
-25
Depth of Groundwater: Boring Terminated At:
FRIC
TIO
N A
NG
LE,
COH
ESIO
N, C
(psf
)
(deg
rees
)
1)
CON
TEN
T (%
)
FIN
ES
PLA
STIC
ITY
IND
EX (P
I)
Santa Maria, CA 93454
CH
CH
8 Inches
B-2
SB00314-1
Tajiguas LandfillOperations DeckJanuary 10, 2013JAP
CME 55
390 Feet
25 Feet Page 1 of 1
SANDY CLAY: reddish brown to light brown,with gravel, slightly moist, FILL
very stiff
very stiff
very stiff
SANDY CLAY: light brown with gravel of whitecoarse-grain sandstone, dry to slightly moist, FILL
hard
strong odor, methane detected
very stiff
SPT
CA
SPT
SPT
SPT
15
25
19
32
17
Not Encountered
CA/SPT
35
23
29
42
22
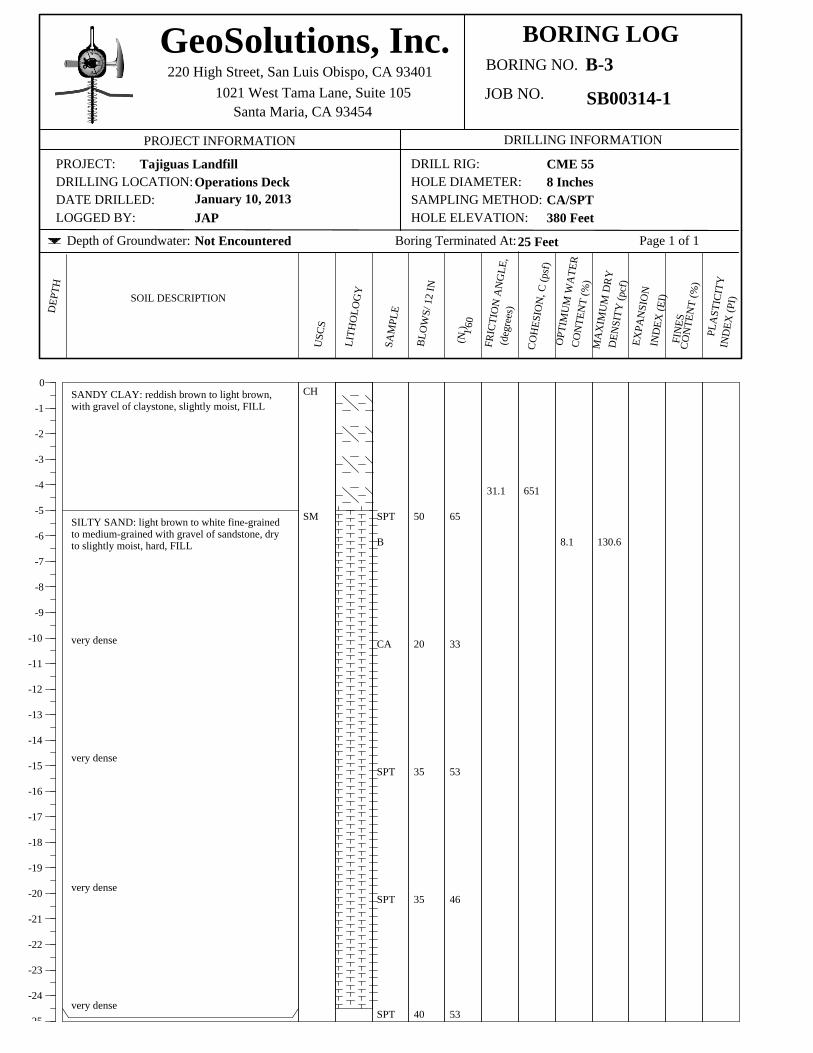
GeoSolutions, Inc.220 High Street, San Luis Obispo, CA 93401
1021 West Tama Lane, Suite 105
BORING LOGBORING NO.
JOB NO.
PROJECT INFORMATION DRILLING INFORMATION
PROJECT:DRILLING LOCATION:DATE DRILLED:LOGGED BY:
DRILL RIG:HOLE DIAMETER:SAMPLING METHOD:HOLE ELEVATION:
DE
PTH
SOIL DESCRIPTION
USC
S
LIT
HO
LO
GY
SAM
PLE
BL
OW
S/ 1
2 IN
OPT
IMU
M W
AT
ER
CO
NT
EN
T (
%)
MA
XIM
UM
DR
YD
EN
SIT
Y (
pcf)
EX
PAN
SIO
NIN
DE
X (
EI)
(N60
0
-1
-2
-3
-4
-5
-6
-7
-8
-9
-10
-11
-12
-13
-14
-15
-16
-17
-18
-19
-20
-21
-22
-23
-24
25
Depth of Groundwater: Boring Terminated At:
FRIC
TIO
N A
NG
LE
,
CO
HE
SIO
N, C
(ps
f)
(deg
rees
)
1)
CO
NT
EN
T (
%)
FIN
ES
PLA
STIC
ITY
IND
EX
(PI
)
Santa Maria, CA 93454
CH
SM
8 Inches
B-3
SB00314-1
Tajiguas LandfillOperations DeckJanuary 10, 2013
JAP
CME 55
380 Feet
25 Feet Page 1 of 1
SANDY CLAY: reddish brown to light brown,with gravel of claystone, slightly moist, FILL
SILTY SAND: light brown to white fine-grainedto medium-grained with gravel of sandstone, dryto slightly moist, hard, FILL
very dense
very dense
very dense
very dense
SPT
CA
SPT
SPT
SPT
B
50
20
35
35
40
8.1 130.6
Not Encountered
CA/SPT
65131.1
65
33
53
46
53

GeoSolutions, Inc.220 High Street, San Luis Obispo, CA 93401
1021 West Tama Lane, Suite 105
BORING LOGBORING NO.
JOB NO.
PROJECT INFORMATION DRILLING INFORMATION
PROJECT:DRILLING LOCATION:DATE DRILLED:LOGGED BY:
DRILL RIG:HOLE DIAMETER:SAMPLING METHOD:HOLE ELEVATION:
DEP
TH
SOIL DESCRIPTION
USC
S
LITH
OLO
GY
SAM
PLE
BLO
WS/
12
IN
OPT
IMU
M W
ATE
RCO
NTE
NT
(%)
MA
XIM
UM
DRY
DEN
SITY
(pcf
)EX
PAN
SIO
NIN
DEX
(EI)
(N60
0
-1
-2
-3
-4
-5
-6
-7
-8
-9
-10
-11
-12
-13
-14
-15
-16
-17
-18
Depth of Groundwater: Boring Terminated At:
FRIC
TIO
N A
NG
LE,
COH
ESIO
N, C
(psf
)
(deg
rees
)
1)
CON
TEN
T (%
)
FIN
ES
PLA
STIC
ITY
IND
EX (P
I)
Santa Maria, CA 93454
SM
SC
CH
8 Inches
B-4
SB00314-1
Tajiguas LandfillOperations DeckJanuary 8, 2013JAP
CME 55
380 Feet
40 Feet Page 1 of 2
SILTY SAND: reddish brown to brown, withgravel of claystone and sandstone, dry to slightlymoist, FILL
very dense
very dense
CLAYEY SAND: light brown, with gravel, dry toslightly moist, very dense, FILL
SANDY CLAY: dark brown, with gravel ofclaystone and sandstone, slightly moist, FILL
very stiff
very stiff
stiff
CA
SPT
SPT
A
52
28
38
10 128.8
Not Encountered
CA/SPT
67
46
58
67 24
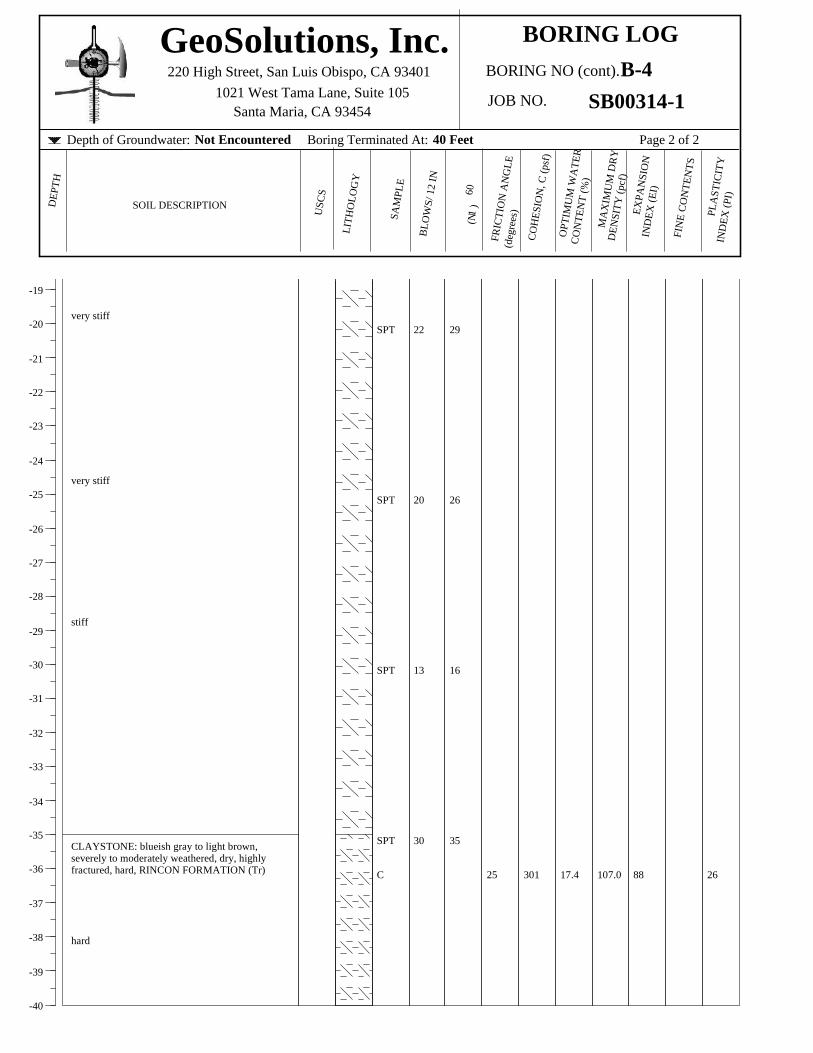
-19
-20
-21
-22
-23
-24
-25
-26
-27
-28
-29
-30
-31
-32
-33
-34
-35
-36
-37
-38
-39
-40
GeoSolutions, Inc. BORING LOGBORING NO (cont).
JOB NO.
DEP
TH
SOIL DESCRIPTION
USC
S
LITH
OLO
GY
SAM
PLE
BLO
WS/
12
IN
(N )
FRIC
TIO
N A
NG
LE
OPT
IMU
M W
ATE
R
(deg
rees
)
DEN
SITY
(pcf
)
CON
TEN
T (%
)
COH
ESIO
N, C
(psf
)
MA
XIM
UM
DRY
IND
EX (E
I)
EXPA
NSI
ON
1 PLA
STIC
ITY
Depth of Groundwater: Boring Terminated At:
IND
EX (P
I)60
FIN
E CO
NTE
NTS
220 High Street, San Luis Obispo, CA 934011021 West Tama Lane, Suite 105
Santa Maria, CA 93454
very stiff
very stiff
stiff
CLAYSTONE: blueish gray to light brown,severely to moderately weathered, dry, highlyfractured, hard, RINCON FORMATION (Tr)
hard
SPT
SPT
C
SPT
SPT
22
20
13
30
17.4 107.0
B-4SB00314-1
Not Encountered 40 Feet Page 2 of 2
30125
29
26
16
35
88 26

GeoSolutions, Inc.1021 Tama Lane Suite 105
Santa Maria, California 93455
CORING LOGBORING NO.
JOB NO.
PROJECT INFORMATION DRILLING INFORMATION
PROJECT:DRILLING LOCATION:DATE DRILLED:LOGGED BY:
DRILL RIG:HOLE DIAMETER:SAMPLING METHOD:HOLE ELEVATION:
DEP
TH
SOIL DESCRIPTION
USC
S
LITH
OLO
GY
SAM
PLE
BLO
WS/
12
IN
0
-1
-2
-3
-4
-5
-6
-7
-8
-9
-10
-11
-12
-13
-14
-15
-16
-17
-18
-19
-20
-21
-22
-23
-24
-25
-26
-27
-28
-29
-30
Depth of Groundwater: Boring Terminated At:
FRIC
TIO
N A
NG
LE,
COH
ESIO
N, C
(psf
)
(deg
rees
)
ROCK
QU
ALI
TY
RQD
PERC
ENT
RECO
VER
ED
8 Inches
B-5SB00314-1
Tajiguas LandfillNorth Slope BenchJanuary 23, 2013JAP
CME 55
451 Feet
65 Feet Page 1 of 2
CLAYSTONE: pale yellow (2.5yr 8/4) to dark gray (2.5y 4/1), highly fractured to friable (at the surface), slightly moist, moderately tointensely weathered (at surface), slightly weathered at depth,moderately hard, RINCON FORMATION (Tr)
- - - - - - - - - - - - - - - - - - - - - - - - - - - - - - - - - - - - - - - - - - - - - - - -start of coring
highly fractured
moderately to slightly fractured
highly cemented, hard
moderately soft
fractures cemented and filled with white calcium carbonate material.
dry very hard, fractures cemented with white carbonite material
refused in hard rock
50/2"
poor
fair
fair
fair
good
excellent
Not Encountered
CA/Coring
45
73
73
55
81
93
90
100
93
100
86
93
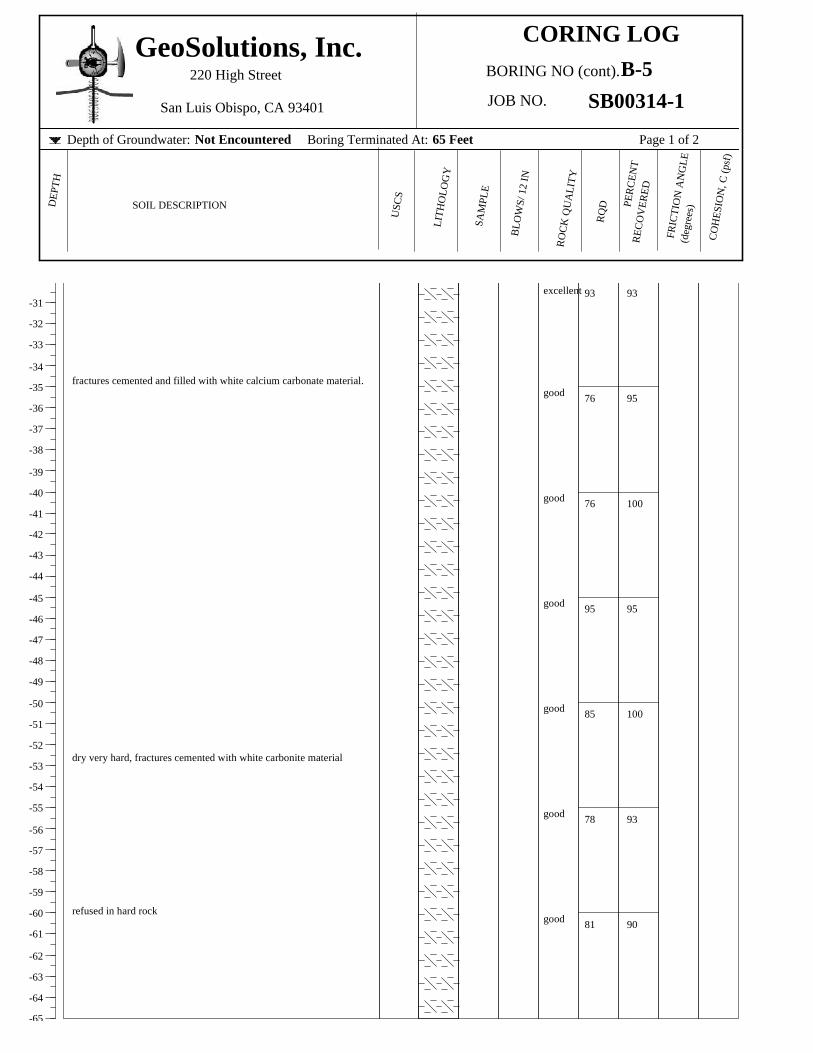
-31
-32
-33
-34
-35
-36
-37
-38
-39
-40
-41
-42
-43
-44
-45
-46
-47
-48
-49
-50
-51
-52
-53
-54
-55
-56
-57
-58
-59
-60
-61
-62
-63
-64
-65
GeoSolutions, Inc.220 High Street
San Luis Obispo, CA 93401
CORING LOGBORING NO (cont).
JOB NO.
DEP
TH
SOIL DESCRIPTION
USC
S
LITH
OLO
GY
SAM
PLE
BLO
WS/
12
IN
FRIC
TIO
N A
NG
LE(d
egre
es)
COH
ESIO
N, C
(psf
)
Depth of Groundwater: Boring Terminated At:
ROCK
QU
ALI
TY
RQD PE
RCEN
TRE
COV
ERED
fractures cemented and filled with white calcium carbonate material.
dry very hard, fractures cemented with white carbonite material
refused in hard rock
excellent
good
good
good
good
good
good
B-5SB00314-1
Not Encountered 65 Feet Page 1 of 2
93
76
76
95
85
78
81
93
95
100
95
100
93
90
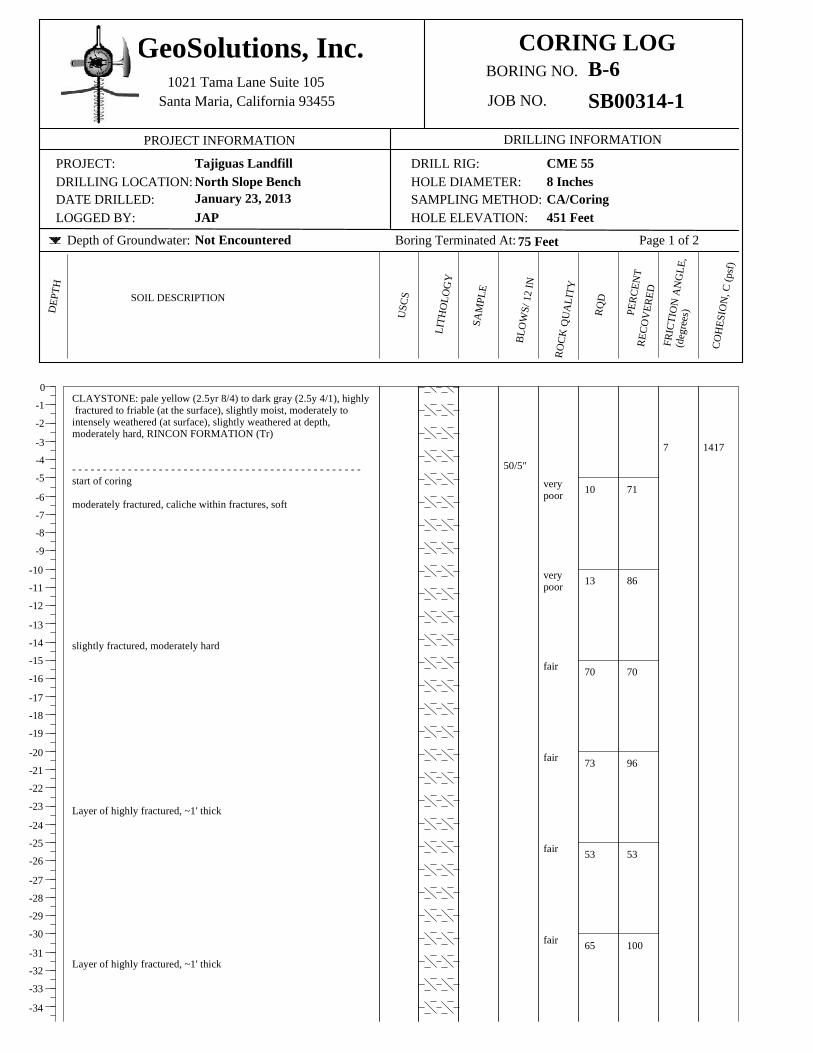
GeoSolutions, Inc.1021 Tama Lane Suite 105
Santa Maria, California 93455
CORING LOGBORING NO.
JOB NO.
PROJECT INFORMATION DRILLING INFORMATION
PROJECT:DRILLING LOCATION:DATE DRILLED:LOGGED BY:
DRILL RIG:HOLE DIAMETER:SAMPLING METHOD:HOLE ELEVATION:
DEP
TH
SOIL DESCRIPTION
USC
S
LITH
OLO
GY
SAM
PLE
BLO
WS/
12
IN
0
-1
-2
-3
-4
-5
-6
-7
-8
-9
-10
-11
-12
-13
-14
-15
-16
-17
-18
-19
-20
-21
-22
-23
-24
-25
-26
-27
-28
-29
-30
-31
-32
-33
-34
Depth of Groundwater: Boring Terminated At:
FRIC
TIO
N A
NG
LE,
COH
ESIO
N, C
(psf
)
(deg
rees
)
ROCK
QU
ALI
TY
RQD
PERC
ENT
RECO
VER
ED
8 Inches
B-6SB00314-1
Tajiguas LandfillNorth Slope BenchJanuary 23, 2013JAP
CME 55
451 Feet
75 Feet Page 1 of 2
CLAYSTONE: pale yellow (2.5yr 8/4) to dark gray (2.5y 4/1), highly fractured to friable (at the surface), slightly moist, moderately tointensely weathered (at surface), slightly weathered at depth,moderately hard, RINCON FORMATION (Tr)
- - - - - - - - - - - - - - - - - - - - - - - - - - - - - - - - - - - - - - - - - - - - - - -start of coring
moderately fractured, caliche within fractures, soft
slightly fractured, moderately hard
Layer of highly fractured, ~1' thick
Layer of highly fractured, ~1' thick
Layer of soft, firable claystone
Layer of soft, firable claystone
Highly fractured
Slightly fractured
Highly fractured
50/5"
verypoor
verypoor
fair
fair
fair
fair
Not Encountered
CA/Coring
14177
10
13
70
73
53
65
71
86
70
96
53
100
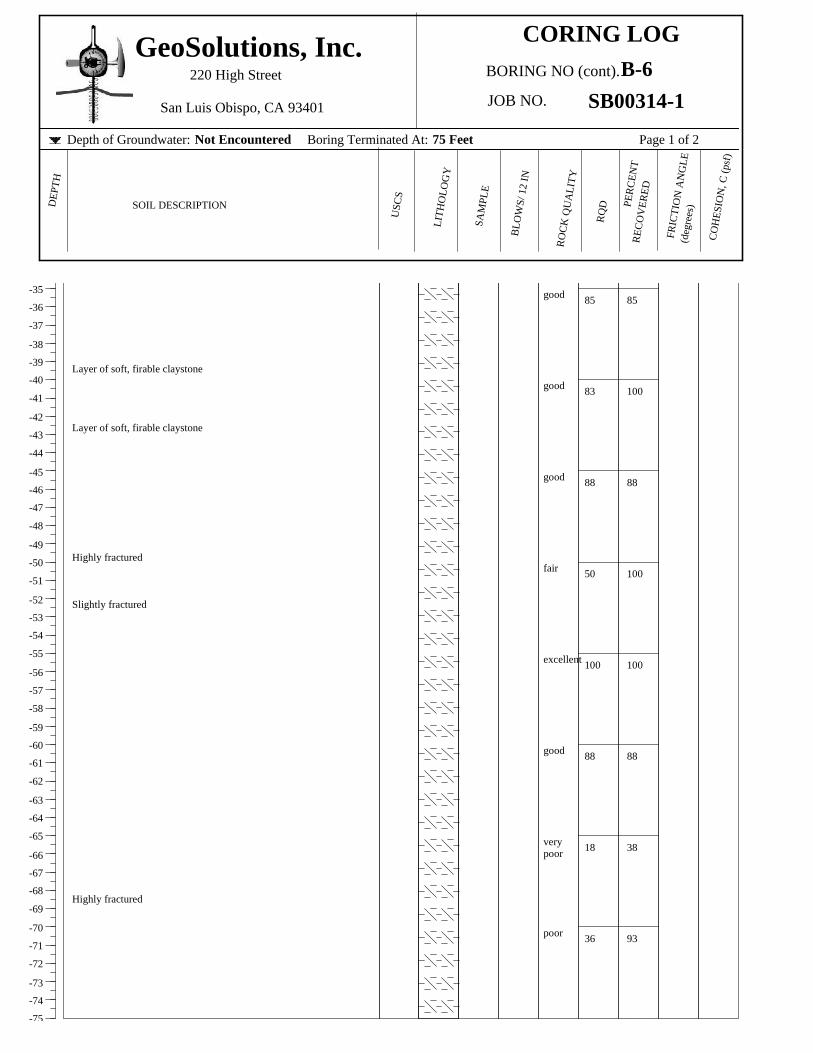
-35
-36
-37
-38
-39
-40
-41
-42
-43
-44
-45
-46
-47
-48
-49
-50
-51
-52
-53
-54
-55
-56
-57
-58
-59
-60
-61
-62
-63
-64
-65
-66
-67
-68
-69
-70
-71
-72
-73
-74
-75
GeoSolutions, Inc.220 High Street
San Luis Obispo, CA 93401
CORING LOGBORING NO (cont).
JOB NO.
DEP
TH
SOIL DESCRIPTION
USC
S
LITH
OLO
GY
SAM
PLE
BLO
WS/
12
IN
FRIC
TIO
N A
NG
LE(d
egre
es)
COH
ESIO
N, C
(psf
)
Depth of Groundwater: Boring Terminated At:
ROCK
QU
ALI
TY
RQD PE
RCEN
TRE
COV
ERED
Layer of soft, firable claystone
Layer of soft, firable claystone
Highly fractured
Slightly fractured
Highly fractured
good
good
good
fair
excellent
good
verypoor
poor
B-6SB00314-1
Not Encountered 75 Feet Page 1 of 2
85
83
88
50
100
88
18
36
85
100
88
100
100
88
38
93
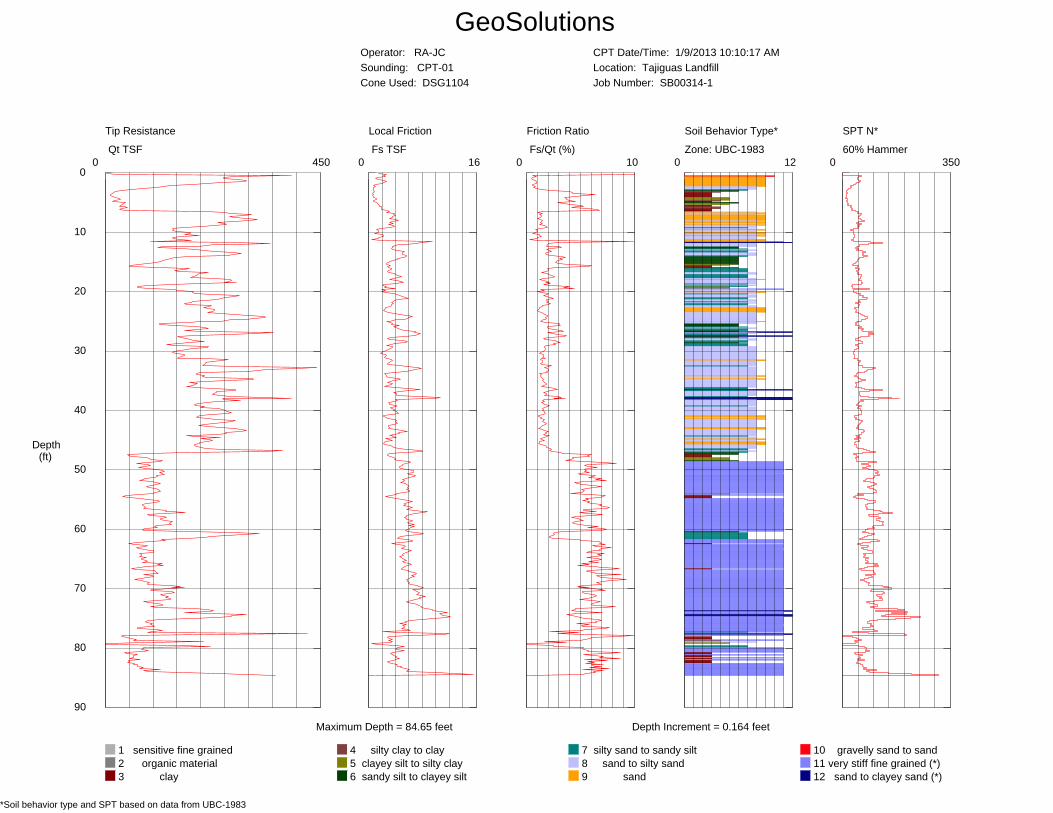
GeoSolutionsOperator: RA-JCSounding: CPT-01Cone Used: DSG1104
CPT Date/Time: 1/9/2013 10:10:17 AMLocation: Tajiguas LandfillJob Number: SB00314-1
Maximum Depth = 84.65 feet Depth Increment = 0.164 feet
*Soil behavior type and SPT based on data from UBC-1983
Tip Resistance
Qt TSF4500
0
10
20
30
40
50
60
70
80
90
Depth(ft)
Local Friction
Fs TSF160
Friction Ratio
Fs/Qt (%) 100
Soil Behavior Type*
Zone: UBC-1983
1 sensitive fine grained 2 organic material 3 clay
4 silty clay to clay 5 clayey silt to silty clay 6 sandy silt to clayey silt
7 silty sand to sandy silt 8 sand to silty sand 9 sand
10 gravelly sand to sand 11 very stiff fine grained (*) 12 sand to clayey sand (*)
120
SPT N*
60% Hammer3500

GeoSolutionsOperator: RA-JCSounding: CPT-02bCone Used: DSG1104
CPT Date/Time: 1/8/2013 1:11:30 PMLocation: Tajiguas LandfillJob Number: SB00314-1
Maximum Depth = 33.14 feet Depth Increment = 0.164 feet
*Soil behavior type and SPT based on data from UBC-1983
Tip Resistance
Qt TSF4500
0
5
10
15
20
25
30
35
Depth(ft)
Local Friction
Fs TSF120
Friction Ratio
Fs/Qt (%) 160
Soil Behavior Type*
Zone: UBC-1983
1 sensitive fine grained 2 organic material 3 clay
4 silty clay to clay 5 clayey silt to silty clay 6 sandy silt to clayey silt
7 silty sand to sandy silt 8 sand to silty sand 9 sand
10 gravelly sand to sand 11 very stiff fine grained (*) 12 sand to clayey sand (*)
120
SPT N*
60% Hammer2500

GeoSolutionsOperator: RA-JCSounding: CPT-03aCone Used: DSG1104
CPT Date/Time: 1/9/2013 12:18:49 PMLocation: Tajiguas LandfillJob Number: SB00314-1
Maximum Depth = 78.58 feet Depth Increment = 0.164 feet
*Soil behavior type and SPT based on data from UBC-1983
Tip Resistance
Qt TSF4500
0
10
20
30
40
50
60
70
80
Depth(ft)
Local Friction
Fs TSF250
Friction Ratio
Fs/Qt (%) 140
Soil Behavior Type*
Zone: UBC-1983
1 sensitive fine grained 2 organic material 3 clay
4 silty clay to clay 5 clayey silt to silty clay 6 sandy silt to clayey silt
7 silty sand to sandy silt 8 sand to silty sand 9 sand
10 gravelly sand to sand 11 very stiff fine grained (*) 12 sand to clayey sand (*)
120
SPT N*
60% Hammer3500
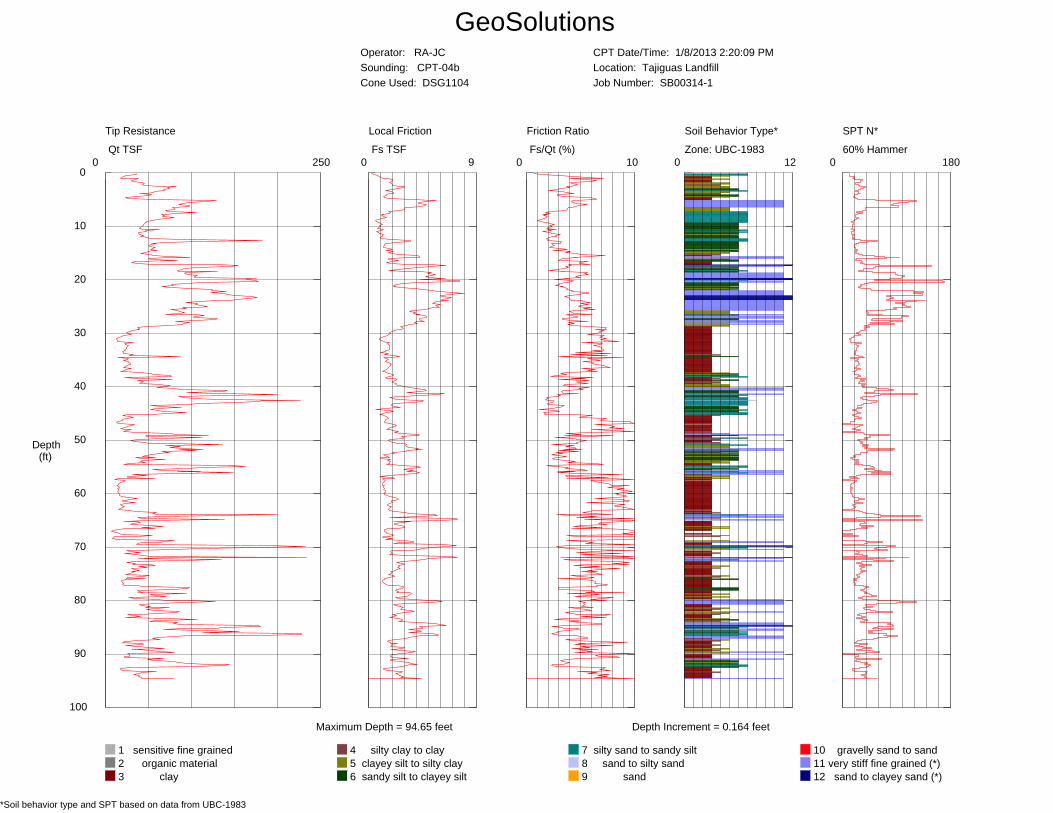
GeoSolutionsOperator: RA-JCSounding: CPT-04bCone Used: DSG1104
CPT Date/Time: 1/8/2013 2:20:09 PMLocation: Tajiguas LandfillJob Number: SB00314-1
Maximum Depth = 94.65 feet Depth Increment = 0.164 feet
*Soil behavior type and SPT based on data from UBC-1983
Tip Resistance
Qt TSF2500
0
10
20
30
40
50
60
70
80
90
100
Depth(ft)
Local Friction
Fs TSF90
Friction Ratio
Fs/Qt (%) 100
Soil Behavior Type*
Zone: UBC-1983
1 sensitive fine grained 2 organic material 3 clay
4 silty clay to clay 5 clayey silt to silty clay 6 sandy silt to clayey silt
7 silty sand to sandy silt 8 sand to silty sand 9 sand
10 gravelly sand to sand 11 very stiff fine grained (*) 12 sand to clayey sand (*)
120
SPT N*
60% Hammer1800

GeoSolutionsOperator: RA-JCSounding: CPT-05cCone Used: DSG1104
CPT Date/Time: 1/9/2013 8:25:03 AMLocation: Tajiguas LandfillJob Number: SB00314-1
Maximum Depth = 106.63 feet Depth Increment = 0.164 feet
*Soil behavior type and SPT based on data from UBC-1983
Tip Resistance
Qt TSF3500
0
20
40
60
80
100
120
Depth(ft)
Local Friction
Fs TSF100
Friction Ratio
Fs/Qt (%) 140
Soil Behavior Type*
Zone: UBC-1983
1 sensitive fine grained 2 organic material 3 clay
4 silty clay to clay 5 clayey silt to silty clay 6 sandy silt to clayey silt
7 silty sand to sandy silt 8 sand to silty sand 9 sand
10 gravelly sand to sand 11 very stiff fine grained (*) 12 sand to clayey sand (*)
120
SPT N*
60% Hammer2500


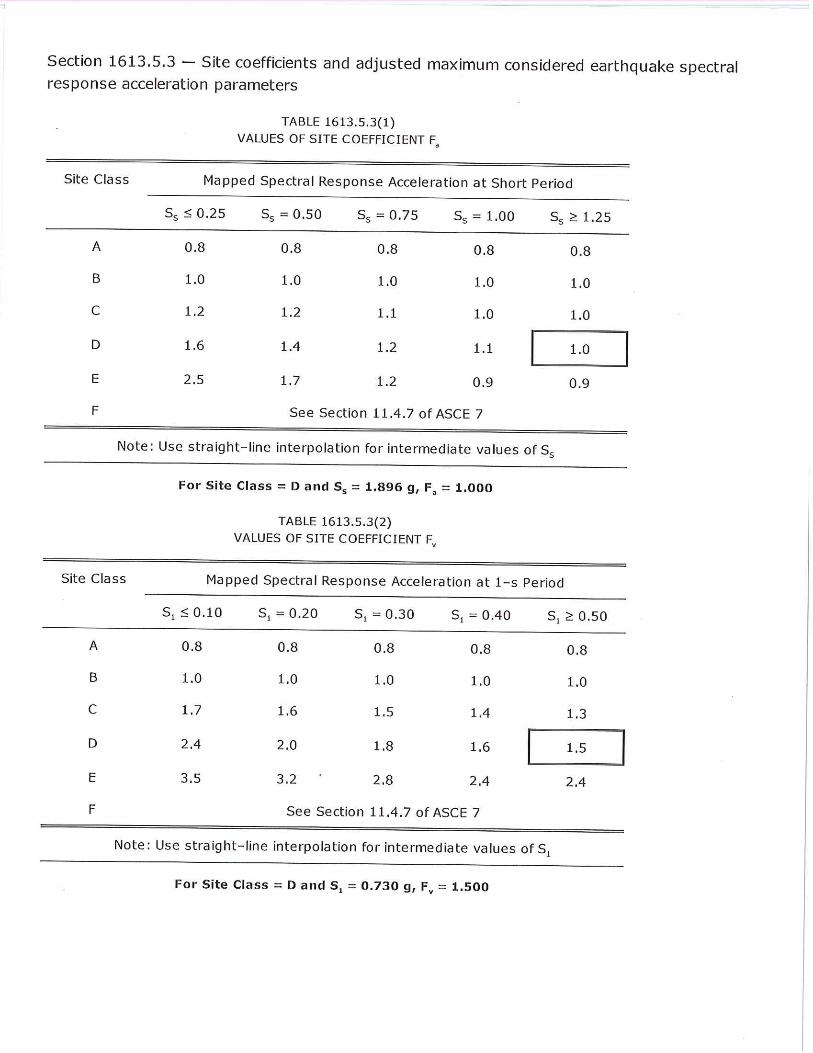

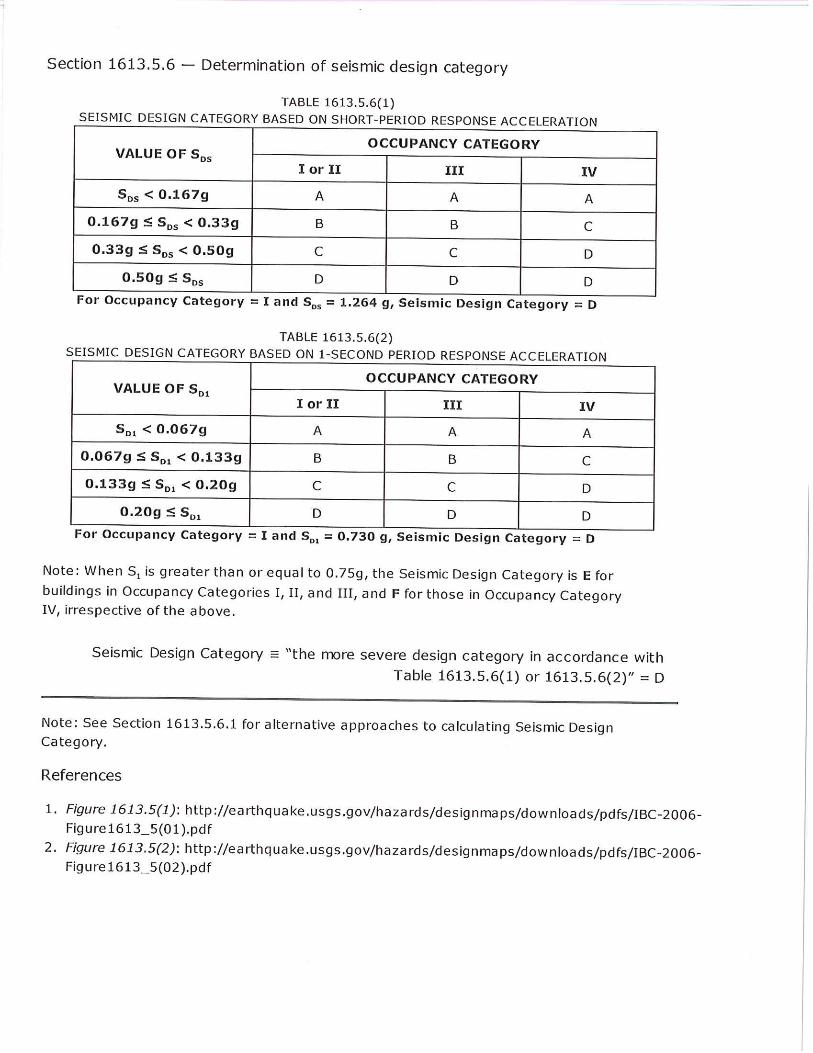
APPENDIX B
Laboratory Testing
Soil Test Reports

LABORATORY TESTING
This appendix includes a discussion of the test procedures and the laboratory test results performed as partof this investigation. The purpose of the laboratory testing is to assess the engineering properties of the soilmaterials at the Site. The laboratory tests are performed using the currently accepted test methods, whenapplicable, of the American Society for Testing and Materials (ASTM).
Undisturbed and disturbed bulk samples used in the laboratory tests are obtained from various locationsduring the course of the field exploration, as discussed in Appendix A of this report. Each sample isidentified by sample letter and depth. The Unified Soils Classification System is used to classify soilsaccording to their engineering properties. The various laboratory tests performed are described below:
Expansion Index of Soils (ASTM D4829-03) is conducted in accordance with the ASTM test method andthe California Building Code Standard, and are performed on representative bulk and undisturbed soilsamples. The purpose of this test is to evaluate expansion potential of the site soils due to fluctuations inmoisture content. The sample specimens are placed in a consolidometer, surcharged under a 144-psfvertical confining pressure, and then inundated with water. The amount of expansion is recorded over a 24-hour period with a dial indicator. The expansion index is calculated by determining the difference betweenfinal and initial height of the specimen divided by the initial height.
Laboratory Compaction Characteristics of Soil Using Modified Effort (ASTM D1557-07) isperformed to determine the relationship between the moisture content and density of soils and soil-aggregate mixtures when compacted in a standard size mold with a 10-lbf hammer from a height of 18inches. The test is performed on a representative bulk sample of bearing soil near the estimated footingdepth. The procedure is repeated on the same soil sample at various moisture contents sufficient toestablish a relationship between the maximum dry unit weight and the optimum water content for the soil.The data, when plotted, represents a curvilinear relationship known as the moisture density relations curve.The values of optimum water content and modified maximum dry unit weight can be determined from theplotted curve.
Direct Shear Tests of Soils Under Consolidated Drained Conditions (ASTM D3080-04) is performedon undisturbed and remolded samples representative of the foundation material. The samples are loadedwith a predetermined normal stress and submerged in water until saturation is achieved. The samples arethen sheared horizontally at a controlled strain rate allowing partial drainage. The shear stress on thesample is recorded at regular strain intervals. This test determines the resistance to deformation, which isshear strength, inter-particle attraction or cohesion c, and resistance to interparticle slip called the angle ofinternal friction .
Particle Size Analysis of Soils (ASTM D422-63R02) is used to determine the particle-size distribution offine and coarse aggregates. In the test method the sample is separated through a series of sieves ofprogressively smaller openings for determination of particle size distribution. The total percentage passingeach sieve is reported and used to determine the distribution of fine and coarse aggregates in the sample.

Project: Tajiguas Landfill Date Tested: January 10, 2013Client: Project #: SB00314-1Sample: A Depth: 2.0 Feet Lab #: 286Location: B-4 Sample Date: January 9, 2013
Sampled By: JAP
Result:
Specification:
Sieve Percent ProjectSize Passing Specifications3"2"
1 1/2"1"
3/4"No. 4No. 8No. 16No. 30No. 50No. 100No. 200
1 SE2 Mold ID n/a Mold Diameter, ins. 4.003 No. of Layers 5 Weight of Rammer, lbs. 10.004 No. of Blows 25
35 Estimated Specific Gravity for 100% Saturation Curve = 2.711 Trial # 1 2 3 4
Plasticity Index: 24 Water Content: 6.6 9.8 13.1Dry Density: 120.2 128.7 121.3Maximum Dry Density, pcf: 128.8
Expansion Index: 67 Optimum Water Content, %: 10.0Expansion Potential: MediumInitial Saturation, %: 50
Sample Depth (ft) Water Content (%) Dry Density (pcf) Relative Density
Report By: Aaron Eichman
Liquid Limit:Plastic Limit:
Moisture-Density ASTM D2937-04, Moisture Content ASTM D2216-05Sample Description
Expansion IndexASTM D4829-08
Plasticity IndexASTM D4318-05
GeoSolutions, Inc. SOILS REPORT
SC
(805) 543-8539
B 1
Soil ClassificationASTM D2487-06, D2488-06
Dark Yellowish Brown Clayey SAND
Sieve AnalysisASTM D422-63R02
Sand Equivalent Cal 217 (06/2011)
Laboratory Maximum DensityASTM D1557-07
119.0
120.0
121.0
122.0
123.0
124.0
125.0
126.0
127.0
128.0
129.0
130.0
0.0 2.0 4.0 6.0 8.0 10.0 12.0 14.0
Dry
Den
sity
, pcf
Water Content, %
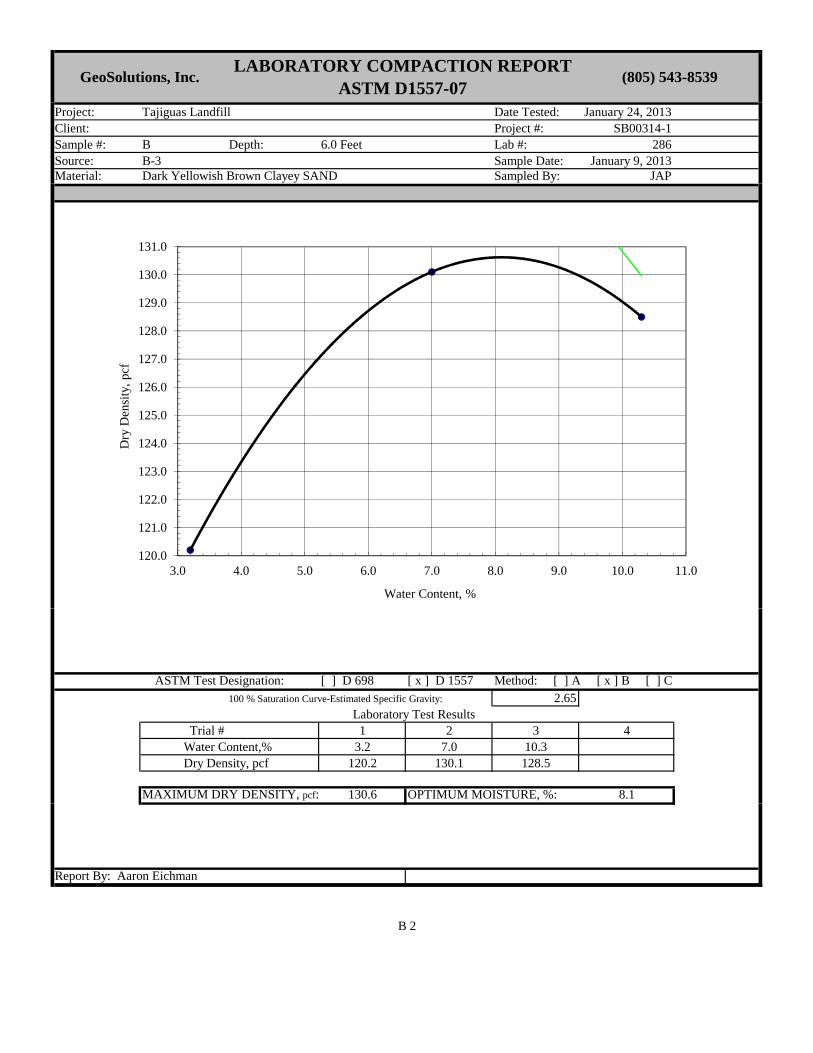
Project: Tajiguas Landfill Date Tested: January 24, 2013Client: Project #: SB00314-1Sample #: B Depth: 6.0 Feet Lab #: 286Source: B-3 Sample Date: January 9, 2013Material: Dark Yellowish Brown Clayey SAND Sampled By: JAP
ASTM Test Designation: [ ] D 698 [ x ] D 1557 Method: [ ] A [ x ] B [ ] C100 % Saturation Curve-Estimated Specific Gravity: 2.65
Laboratory Test ResultsTrial # 1 2 3 4
Water Content,% 3.2 7.0 10.3 Dry Density, pcf 120.2 130.1 128.5
130.6 OPTIMUM MOISTURE, %: 8.1
Report By: Aaron Eichman
GeoSolutions, Inc.LABORATORY COMPACTION REPORT
ASTM D1557-07(805) 543-8539
B 2
MAXIMUM DRY DENSITY, pcf:
120.0
121.0
122.0
123.0
124.0
125.0
126.0
127.0
128.0
129.0
130.0
131.0
3.0 4.0 5.0 6.0 7.0 8.0 9.0 10.0 11.0
Dry
Den
sity
, pcf
Water Content, %
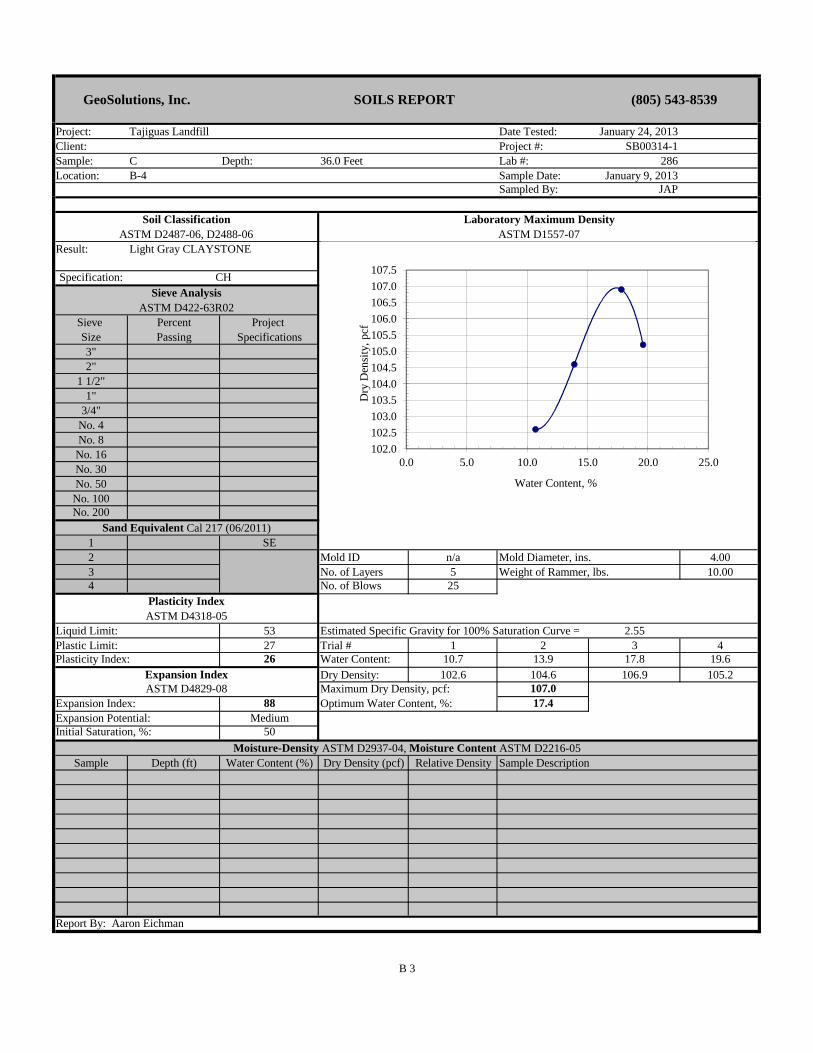
Project: Tajiguas Landfill Date Tested: January 24, 2013Client: Project #: SB00314-1Sample: C Depth: 36.0 Feet Lab #: 286Location: B-4 Sample Date: January 9, 2013
Sampled By: JAP
Result:
Specification:
Sieve Percent ProjectSize Passing Specifications3"2"
1 1/2"1"
3/4"No. 4No. 8No. 16No. 30No. 50No. 100No. 200
1 SE2 Mold ID n/a Mold Diameter, ins. 4.003 No. of Layers 5 Weight of Rammer, lbs. 10.004 No. of Blows 25
53 Estimated Specific Gravity for 100% Saturation Curve = 2.5527 Trial # 1 2 3 4
Plasticity Index: 26 Water Content: 10.7 13.9 17.8 19.6Dry Density: 102.6 104.6 106.9 105.2Maximum Dry Density, pcf: 107.0
Expansion Index: 88 Optimum Water Content, %: 17.4Expansion Potential: MediumInitial Saturation, %: 50
Sample Depth (ft) Water Content (%) Dry Density (pcf) Relative Density
Report By: Aaron Eichman
Liquid Limit:Plastic Limit:
Moisture-Density ASTM D2937-04, Moisture Content ASTM D2216-05Sample Description
Expansion IndexASTM D4829-08
Plasticity IndexASTM D4318-05
GeoSolutions, Inc. SOILS REPORT
CH
(805) 543-8539
B 3
Soil ClassificationASTM D2487-06, D2488-06
Light Gray CLAYSTONE
Sieve AnalysisASTM D422-63R02
Sand Equivalent Cal 217 (06/2011)
Laboratory Maximum DensityASTM D1557-07
102.0
102.5
103.0
103.5
104.0
104.5
105.0
105.5
106.0
106.5
107.0
107.5
0.0 5.0 10.0 15.0 20.0 25.0
Dry
Den
sity
, pcf
Water Content, %
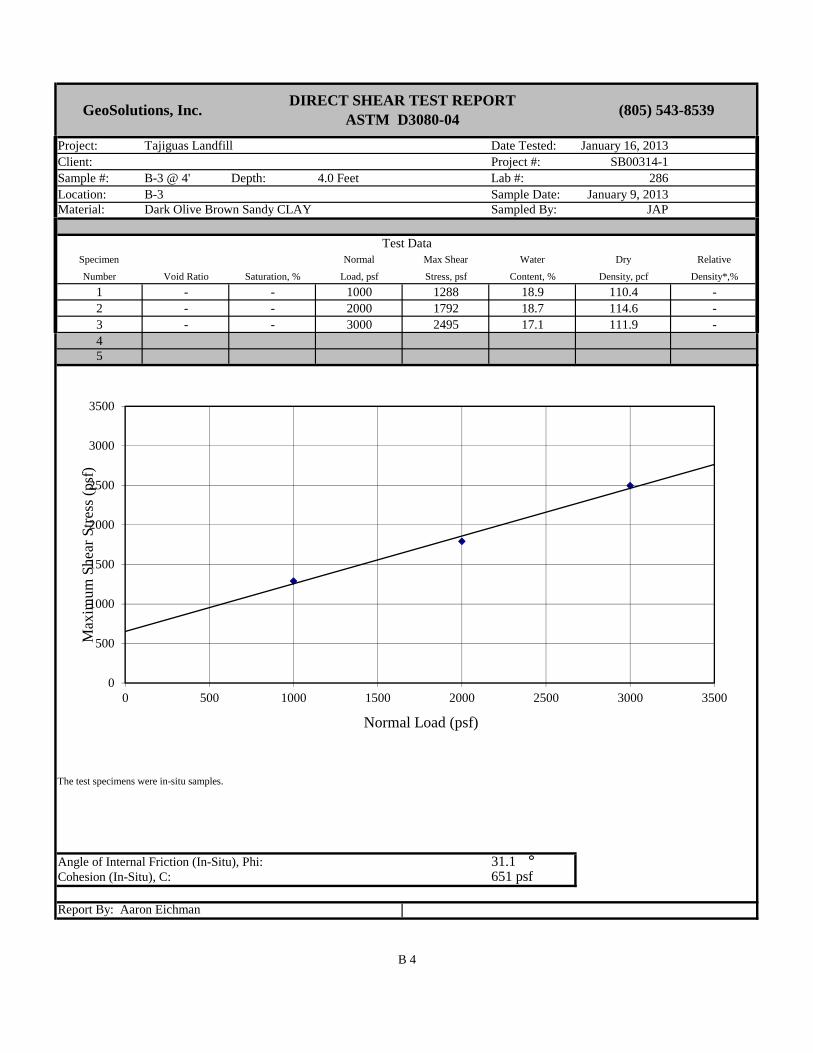
Project: Tajiguas Landfill Date Tested: January 16, 2013Client: Project #: SB00314-1Sample #: B-3 @ 4' Depth: 4.0 Feet Lab #: 286Location: B-3 Sample Date: January 9, 2013Material: Dark Olive Brown Sandy CLAY Sampled By: JAP
Specimen Normal Max Shear Water Dry Relative
Number Void Ratio Saturation, % Load, psf Stress, psf Content, % Density, pcf Density*,%
1 - - 1000 1288 18.9 110.4 -2 - - 2000 1792 18.7 114.6 -3 - - 3000 2495 17.1 111.9 -45
The test specimens were in-situ samples.
31.1651 psf
Report By: Aaron Eichman
GeoSolutions, Inc.DIRECT SHEAR TEST REPORT
ASTM D3080-04(805) 543-8539
B 4
Test Data
Angle of Internal Friction (In-Situ), Phi:Cohesion (In-Situ), C:
0
500
1000
1500
2000
2500
3000
3500
0 500 1000 1500 2000 2500 3000 3500
Max
imum
She
ar S
tres
s (p
sf)
Normal Load (psf)
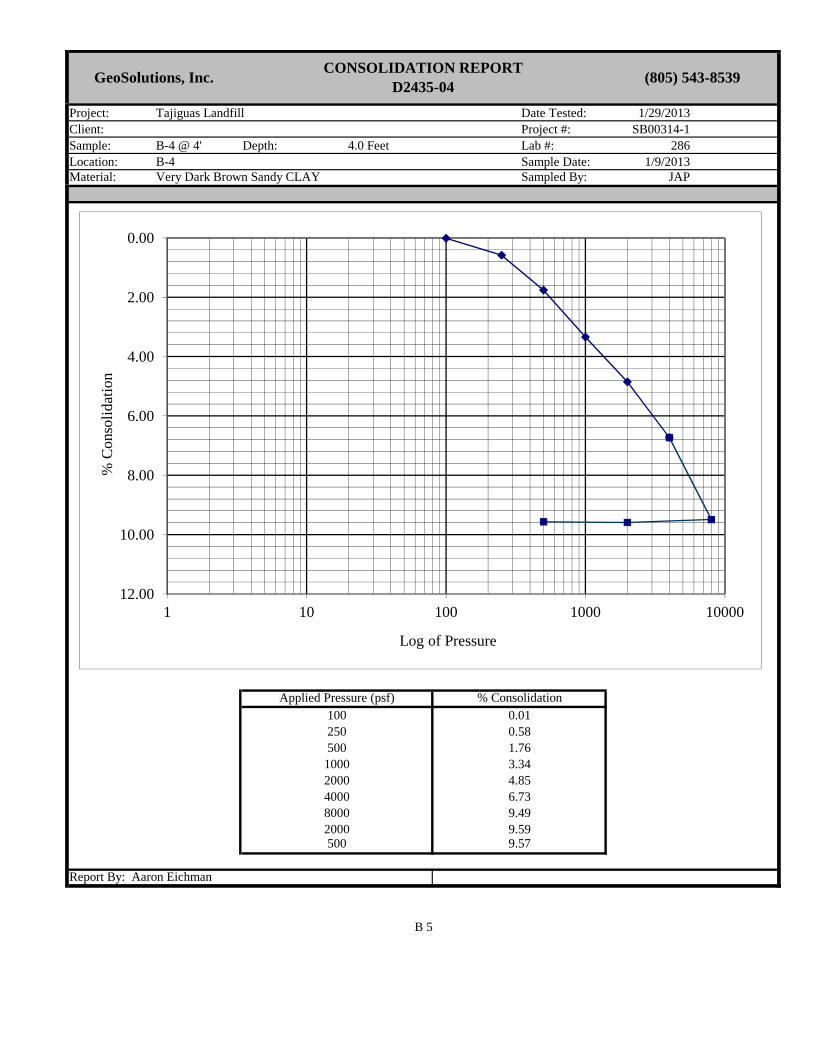
Project: Tajiguas Landfill Date Tested: 1/29/2013Client: Project #: SB00314-1Sample: B-4 @ 4' Depth: 4.0 Feet Lab #: 286Location: B-4 Sample Date: 1/9/2013Material: Very Dark Brown Sandy CLAY Sampled By: JAP
Report By: Aaron Eichman
CONSOLIDATION REPORTD2435-04
250
6.734000
5001000
4.852000
500 9.57
8000 9.492000 9.59
(805) 543-8539
B 5
100 0.01
1.763.34
0.58
GeoSolutions, Inc.
Applied Pressure (psf) % Consolidation
0.00
2.00
4.00
6.00
8.00
10.00
12.001 10 100 1000 10000
% C
onso
lida
tion
Log of Pressure
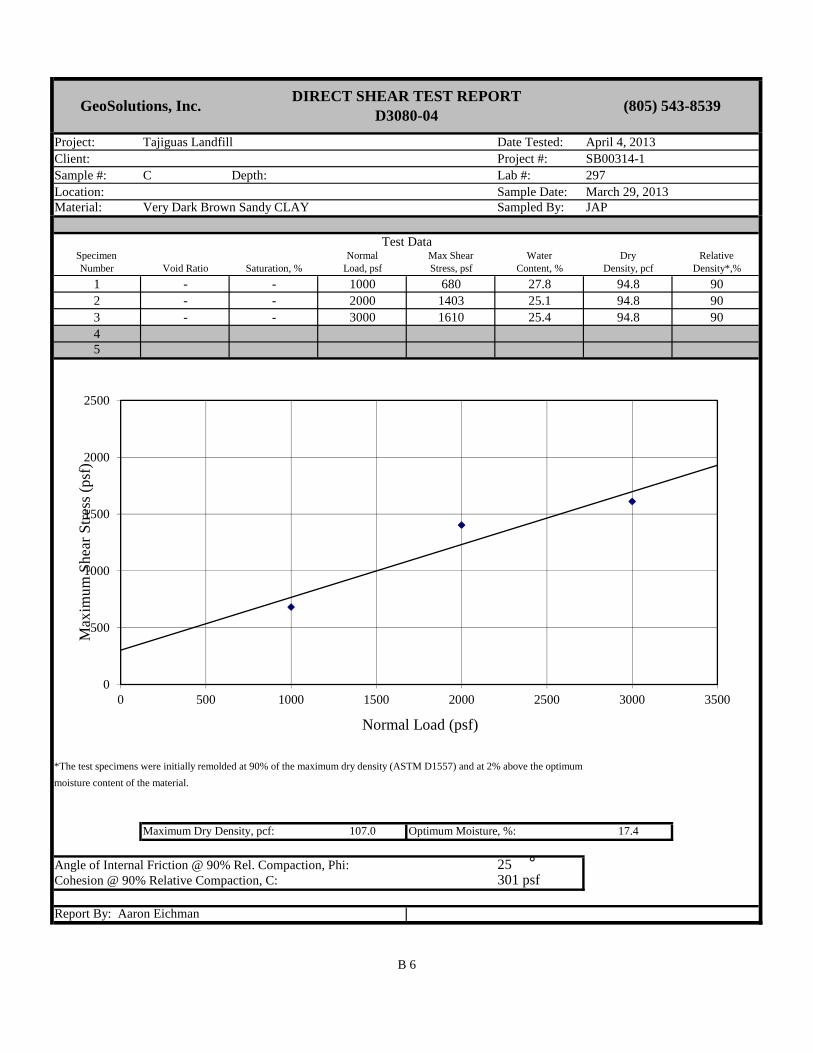
Project: Tajiguas Landfill Date Tested: April 4, 2013Client: Project #: SB00314-1Sample #: C Depth: Lab #: 297Location: Sample Date:Material: Very Dark Brown Sandy CLAY Sampled By: JAP
Specimen Normal Max Shear Water Dry RelativeNumber Void Ratio Saturation, % Load, psf Stress, psf Content, % Density, pcf Density*,%
1 - - 1000 680 27.8 94.8 902 - - 2000 1403 25.1 94.8 903 - - 3000 1610 25.4 94.8 9045
*The test specimens were initially remolded at 90% of the maximum dry density (ASTM D1557) and at 2% above the optimum
moisture content of the material.
107.0 Optimum Moisture, %: 17.4
25301 psf
Report By: Aaron Eichman
GeoSolutions, Inc.DIRECT SHEAR TEST REPORT
D3080-04(805) 543-8539
B 6
Test Data
Angle of Internal Friction @ 90% Rel. Compaction, Phi:Cohesion @ 90% Relative Compaction, C:
Maximum Dry Density, pcf:
March 29, 2013
0
500
1000
1500
2000
2500
0 500 1000 1500 2000 2500 3000 3500
Max
imum
She
ar S
tres
s (p
sf)
Normal Load (psf)

Project: Tajiguas Landfill Date Tested: February 6, 2013Client: Project #: SB00314-1Sample #: B-6 @ 3' Depth: 3.0 Feet Lab #: 286Location: B-6 Sample Date: February 1, 2013Material: Gray CLAYSTONE Sampled By: JAP
Specimen Normal Max Shear Water Dry Relative
Number Void Ratio Saturation, % Load, psf Stress, psf Content, % Density, pcf Density*,%
1 - - 1000 1339 27.8 102.9 -2 - - 2000 1977 26.0 107.3 -3 - - 4000 1822 25.2 106.9 -45
The test specimens were in-situ samples.
71417 psf
Report By: Aaron Eichman
GeoSolutions, Inc.DIRECT SHEAR TEST REPORT
ASTM D3080-04(805) 543-8539
B 7
Test Data
Angle of Internal Friction (In-Situ), Phi:Cohesion (In-Situ), C:
0
500
1000
1500
2000
2500
0 500 1000 1500 2000 2500 3000 3500 4000 4500
Max
imum
She
ar S
tres
s (p
sf)
Normal Load (psf)

APPENDIX C
Settlement Analysis Data – Operations Deck

Tajiguas Landfill - Operations DeckCoeffecient of Secondary Compression - Backcalculated from Existing Settlement DataPoint 1 2 3 4 5 6 7 8 9 10 11Hs 1.99 0.31 0.18 0.14 0.35 1.8 1.41 0.24 1.63 1 2.33H1 95 84 35 35 80 95 105 78 120 120 120t2 (yrs) 5 5 5 5 5 5 5 5 4 4 4t1 0 0 0 0 0 0 0 0 0 0 0Ca 0.03 0.01 0.01 0.01 0.01 0.03 0.02 0.004 0.02 0.01 0.03
Total Settlement by 2036 (end of project)Ca 0.03 0.01 0.01 0.01 0.01 0.03 0.02 0.00 0.02 0.01 0.03H1 95 84 35 35 80 95 105 78 120 120 120t2 276 276 276 276 276 276 276 276 276 276 276t1 4 4 4 4 4 4 4 4 4 4 4Hs-2036 5.24 0.82 0.47 0.37 0.92 4.74 3.71 0.63 4.98 3.05 7.12
Total Settlement by 2017 (start of project)Ca 0.03 0.01 0.01 0.01 0.01 0.03 0.02 0.00 0.02 0.01 0.03H1 95 84 35 35 80 95 105 78 120 120 120t2 48 48 48 48 48 48 48 48 48 48 48t1 4 4 4 4 4 4 4 4 4 4 4Hs-2015 3.07 0.48 0.28 0.22 0.54 2.78 2.18 0.37 2.92 1.79 4.18
Settlement Anticipated During the Life of the Project (2017-2036)Hs-2036 5.24 0.82 0.47 0.37 0.92 4.74 3.71 0.63 4.98 3.05 7.12Hs-2015 3.07 0.48 0.28 0.22 0.54 2.78 2.18 0.37 2.92 1.79 4.18Hs-Project 2.16 0.34 0.20 0.15 0.38 1.96 1.53 0.26 2.06 1.26 2.94
Fill 0.21-0.53' ∆HS = Cα(EL) H1 log t2/t1
Refuse 1.26-2.94' Equation for Settlement under External Loads (Sharma and De, 2007)
Cα(EL)= coefficient of secondary compression due to external loads H1= thickness of refuse at the end of the primary settlement (feet) t2= time of interest (months)
Map provided by the County of Santa Barbara t1= time for primary settlement (months)

APPENDIX D
Preliminary Grading Specifications
Key and Bench with Backdrain

PRELIMINARY GRADING SPECIFICATIONS
A. General
i. These preliminary specifications have been prepared for the subject site; GeoSolutions, Inc. should be consulted prior to the commencement of site work associated with site development to ensure compliance with these specifications.
ii. GeoSolutions, Inc. should be notified at least 72 hours prior to site clearing or grading operations on the property in order to observe the stripping of surface materials and to coordinate the work with the grading contractor in the field.
iii. These grading specifications may be modified and/or superseded by recommendations contained in the text of this report and/or subsequent reports.
iv. If disputes arise out of the interpretation of these grading specifications, the Soils Engineer shall provide the governing interpretation.
B. Obligation of Parties
i. The Soils Engineer should provide observation and testing services and should make evaluations to advise the client on geotechnical matters. The Soils Engineer should report the findings and recommendations to the client or the authorized representative.
ii. The client should be chiefly responsible for all aspects of the project. The client or authorized representative has the responsibility of reviewing the findings and recommendations of the Soils Engineer. During grading the client or the authorized representative should remain on-site or should remain reasonably accessible to all concerned parties in order to make decisions necessary to maintain the flow of the project.
iii. The contractor is responsible for the safety of the project and satisfactory completion of all grading and other operations on construction projects, including, but not limited to, earthwork in accordance with project plans, specifications, and controlling agency requirements.
C. Site Preparation
i. The client, prior to any site preparation or grading, should arrange and attend a meeting which includes the grading contractor, the design Structural Engineer, the Soils Engineer, representatives of the local building department, as well as any other concerned parties. All parties should be given at least 72 hours notice.
ii. All surface and sub-surface deleterious materials should be removed from the proposed building and pavement areas and disposed of off-site or as approved by the Soils Engineer. This includes, but is not limited to, any debris, organic materials, construction spoils, buried utility line, septic systems, building materials, and any other surface and subsurface structures within the proposed building areas. Trees designated for removal on the construction plans should be removed and their primary root systems grubbed under the observations of a representative of GeoSolutions, Inc. Voids left from site clearing should be cleaned and backfilled as recommended for structural fill.
iii. Once the Site has been cleared, the exposed ground surface should be stripped to remove surface vegetation and organic soil. A representative of GeoSolutions, Inc. should determine the required depth of stripping at the time of work being completed. Strippings may either be disposed of off-site or stockpiled for future use in landscape areas, if approved by the landscape architect.
D 1
D. Site Protection
i. Protection of the Site during the period of grading and construction should be the responsibility of the contractor.
ii. The contractor should be responsible for the stability of all temporary excavations.
iii. During periods of rainfall, plastic sheeting should be kept reasonably accessible to prevent unprotected slopes from becoming saturated. Where necessary during periods of rainfall, the contractor should install check-dams, de-silting basins, sand bags, or other devices or methods necessary to control erosion and provide safe conditions.
E. Excavations
i. Materials that are unsuitable should be excavated under the observation and recommendations of the Soils Engineer. Unsuitable materials include, but may not be limited to: 1) dry, loose, soft, wet, organic, or compressible natural soils; 2) fractured, weathered, or soft bedrock; 3) non-engineered fill; 4) other deleterious materials; and 5) materials identified by the Soils Engineer or Engineering Geologist.
ii. Unless otherwise recommended by the Soils Engineer and approved by the local building official, permanent cut slopes should not be steeper than 2:1 (horizontal to vertical). Final slope configurations should conform to section 1804 of the 2010 California Building Code unless specifically modified by the Soil Engineer/Engineering Geologist.
iii. The Soil Engineer/Engineer Geologist should review cut slopes during excavations. The contractor should notify the Soils Engineer/Engineer Geologist prior to beginning slope excavations.
F. Structural Fill
i. Structural fill should not contain rocks larger than 3 inches in greatest dimension, and should have no more than 15 percent larger than 2.5 inches in greatest dimension.
ii. Imported fill should be free of organic and other deleterious material and should have very low expansion potential, with a plasticity index of 12 or less. Before delivery to the Site, a sample of the proposed import should be tested in our laboratory to determine its suitability for use as structural fill.
G. Compacted Fill
i. Structural fill using approved import or native should be placed in horizontal layers, each approximately 8 inches in thickness before compaction. On-site inorganic soil or approved imported fill should be conditioned with water to produce a soil water content near optimum moisture and compacted to a minimum relative density of 90 percent based on ASTM D1557-07.
ii. Fill slopes should not be constructed at gradients greater than 2-to-1 (horizontal to vertical). The contractor should notify the Soils Engineer/Engineer Geologist prior to beginning slope excavations.
iii. If fill areas are constructed on slopes greater than 10-to-1 (horizontal to vertical), we recommend that benches be cut every 4 feet as fill is placed. Each bench shall be a minimum of 10 feet wide with a minimum of 2 percent gradient into the slope.
iv. If fill areas are constructed on slopes greater than 5-to-1, we recommend that the toe of all areas to receive fill be keyed a minimum of 24 inches into underlying dense material. Key depths are to be
D 2
observed and approved by a representative of GeoSolutions, Inc. Sub-drains shall be placed in the keyway and benches as required.
H. Drainage
i. During grading, a representative of GeoSolutions, Inc. should evaluate the need for a sub-drain or back-drain system. Areas of observed seepage should be provided with sub-surface drains to release the hydrostatic pressures. Sub-surface drainage facilities may include gravel blankets, rock filled trenches or Multi-Flow systems or equal. The drain system should discharge in a non-erosive manner into an approved drainage area.
ii. All final grades should be provided with a positive drainage gradient away from foundations. Final grades should provide for rapid removal of surface water runoff. Ponding of water should not be allowed on building pads or adjacent to foundations. Final grading should be the responsibility of the contractor, general Civil Engineer, or architect.
iii. Concentrated surface water runoff within or immediately adjacent to the Site should be conveyed in pipes or in lined channels to discharge areas that are relatively level or that are adequately protected against erosion.
iv. Water from roof downspouts should be conveyed in solid pipes that discharge in controlled drainage localities. Surface drainage gradients should be planned to prevent ponding and promote drainage of surface water away from building foundations, edges of pavements and sidewalks. For soil areas we recommend that a minimum of 2 percent gradient be maintained.
v. Attention should be paid by the contractor to erosion protection of soil surfaces adjacent to the edges of roads, curbs and sidewalks, and in other areas where hard edges of structures may cause concentrated flow of surface water runoff. Erosion resistant matting such as Miramat, or other similar products, may be considered for lining drainage channels.
vi. Sub-drains should be placed in established drainage courses and potential seepage areas. The location of sub-drains should be determined after a review of the grading plan. The sub-drain outlets should extend into suitable facilities or connect to the proposed storm drain system or existing drainage control facilities. The outlet pipe should consist of a non-perforated pipe the same diameter as the perforated pipe.
I. Maintenance
i. Maintenance of slopes is important to their long-term performance. Precautions that can be taken include planting with appropriate drought-resistant vegetation as recommended by a landscape architect, and not over-irrigating, a primary source of surficial failures.
ii. Property owners should be made aware that over-watering of slopes is detrimental to long term stability of slopes.
J. Underground Facilities Construction
i. The attention of contractors, particularly the underground contractors, should be drawn to the State of California Construction Safety Orders for “Excavations, Trenches, Earthwork.” Trenches or excavations greater than 5 feet in depth should be shored or sloped back in accordance with OSHA Regulations prior to entry.
D 3

ii. Bedding is defined as material placed in a trench up to 1 foot above a utility pipe and backfill is all material placed in the trench above the bedding. Unless concrete bedding is required around utility pipes, free-draining sand should be used as bedding. Sand to be used as bedding should be tested in our laboratory to verify its suitability and to measure its compaction characteristics. Sand bedding should be compacted by mechanical means to achieve at least 90 percent relative density based on ASTM D1557-07.
iii. On-site inorganic soils, or approved import, may be used as utility trench backfill. Proper compaction of trench backfill will be necessary under and adjacent to structural fill, building foundations, concrete slabs, and vehicle pavements. In these areas, backfill should be conditioned with water (or allowed to dry), to produce a soil water content of about 2 to 3 percent above the optimum value and placed in horizontal layers, each not exceeding 8 inches in thickness before compaction. Each layer should be compacted to at least 90 percent relative density based on ASTM D1557-07. The top lift of trench backfill under vehicle pavements should be compacted to the requirements given in report under Preparation of Paved Areas for vehicle pavement sub-grades. Trench walls must be kept moist prior to and during backfill placement.
K. Completion of Work
i. After the completion of work, a report should be prepared by the Soils Engineer retained to provide such services in accordance with Section 1804.4 of the 2010 CBC. The report should including locations and elevations of field density tests, summaries of field and laboratory tests, other substantiating data, and comments on any changes made during grading and their effect on the recommendations made in the approved Soils Engineering Report.
ii. Soils Engineers shall submit a statement that, to the best of their knowledge, the work within their area of responsibilities is in accordance with the approved soils engineering report and applicable provisions within Section 1804 of the 2010 CBC.
D 4