gabriel india ltd. · major areas of change to adoption of ind as impacted item impact ... 3,494...
TRANSCRIPT

Gabriel India Ltd.Result Update Presentation – FY18
1

2
This presentation and the accompanying slides (the “Presentation”), has been prepared by Gabriel India Limited (the“Company”), solely for information purposes and do not constitute any offer, recommendation or invitation to purchaseor subscribe for any securities, and shall not form the basis or be relied on in connection with any contract or bindingcommitment whatsoever. No offering of securities of the Company will be made except by means of a statutory offeringdocument containing detailed information about the Company.
This Presentation has been prepared by the Company based on information and data which the Company considersreliable, but the Company makes no representation or warranty, express or implied, whatsoever, and no reliance shall beplaced on, the truth, accuracy, completeness, fairness and reasonableness of the contents of this Presentation. ThisPresentation may not be all inclusive and may not contain all of the information that you may consider material. Any liabilityin respect of the contents of, or any omission from, this Presentation is expressly excluded.
Certain matters discussed in this Presentation may contain statements regarding the Company’s market opportunity andbusiness prospects that are individually and collectively forward-looking statements. Such forward-looking statements arenot guarantees of future performance and are subject to known and unknown risks, uncertainties and assumptions that aredifficult to predict. These risks and uncertainties include, but are not limited to, the performance of the Indian economy andof the economies of various international markets, the performance of the auto ancilliary industry in India and world-wide,competition, the company’s ability to successfully implement its strategy, the Company’s future levels of growth andexpansion, technological implementation, changes and advancements, changes in revenue, income or cash flows, theCompany’s market preferences and its exposure to market risks, as well as other risks. The Company’s actual results, levelsof activity, performance or achievements could differ materially and adversely from results expressed in or implied by thisPresentation. The Company assumes no obligation to update any forward-looking information contained in thisPresentation. Any forward-looking statements and projections made by third parties included in this Presentation are notadopted by the Company and the Company is not responsible for such third party statements and projections.
Safe Harbour

Strong Performance continues in Q4FY18
Key Highlights
Revenue: Revenue led by Higher Volumes across all the segments
PAT: Improved profitability due to control of expenses, but lower PAT due to lower 35(2AB) benefit & no benefits under 80(I)C of IT Act.
4,968
3,882
Q4FY17 Q4FY18
+28%
Revenue
EBITDA
PBT
PAT
Note: Q3FY18 compared with Q3FY17 as per INDAS
3
466
375
Q4FY17 Q4FY18
+24%
374
287
Q4FY17 Q4FY18
+31%
257226
Q4FY17 Q4FY18
+14%
(Rs.Mn)

Revenue
18,33120.6%
EBITDA
1,71317.2%
EBITDA %
PAT
942
PBT
1,372
PAT %
Financial Highlights – FY18
4
9.3%
21.6% 14.0%
5.1%
(Rs. Mn)

63% 58%
26% 31% 32%
55%
2W/3W
Commercial Vehicles
Passenger Vehicles
Revenue Mix
Channel – Mix Segment – Mix
83%
13%13%11%
86% 83%
Replacement
OE
Export
5
63% 58% 55% 56%
26% 31% 32% 31%
11% 11% 13% 13%
FY15 FY16 FY17 FY18
86% 83% 83% 85%
11% 13% 13% 11%
4% 4% 4% 4%
FY15 FY16 FY17 FY18

6
Profit & Loss Highlights
Rs. Mil Q4FY18 % of Q4FY17 % of YoY% FY18 % of Revenue FY17 % of Revenue YoY%
Revenue (net of excise duty) 4,968 100.0% 3,882 100.0% 28.0% 18,331 100.0% 15,206 100.0% 20.6%
Raw Material 3,546 71.4% 2,762 71.2% 13,106 71.5% 10,847 71.3%
Employee Expenses 361 7.3% 295 7.6% 1,377 7.5% 1,112 7.3%
Other Expenses 596 12.0% 450 11.6% 2136 11.7% 1785 11.7%
EBITDA 465 9.4% 375 9.7% 24.2% 1,713 9.3% 1,461 9.6% 17.2%
Other Income 23 0.5% 20 0.5% 71 0.4% 58 0.4%
Interest 7 0.1% 18 0.5% 29 0.2% 39 0.3%
Depreciation 107 2.1% 90 2.3% 383 2.1% 353 2.3%
PBT 374 7.5% 287 7.4% 30.6% 1,372 7.5% 1,128 7.4% 21.6%
Tax 117 2.4% 61 1.6% 429 2.3% 301 2.0%
PAT 257 5.2% 226 5.8% 13.8% 942 5.1% 827 5.4% 14.0%
Other Comprehensive Income 13 7 38 -30
Total Comprehensive Income 270 5.4% 233 6.0% 15.9% 981 5.4% 796 5.2% 23.2%
Cash PAT 364 7.3% 316 8.1% 15.0% 1,325 7.2% 1,180 7.8% 12.3%

Balance Sheet
7
Liquid Investments as on 31st March 2018 at Rs.1028 Mil
ASSETS Mar-18 Mar-17
Non-current assets 3,417 3,601
Property, Plant and Equipment 2,926 2,829
Capital work-in-progress 78 18
Investment Property 23 4
Intangible Assets 38 53
Financial Assets
Investments 0 0
Loans 15 15
Others 163 568
Non-Current Tax Assets (net) 120 71
Other non-current assets 53 44
Current assets 5,592 4,087
Inventories 1,491 1,312
Financial Assets
Investments 623 283
Trade receivables 2,792 2,118
Cash and cash equivalents 180 40
Other bank balances 220 13
Loans 4 0
Others 83 46
Other Current Assets 199 275
TOTAL ASSETS 9,008 7,688
EQUITY AND LIABILITIES Mar-18 Mar-17
EQUITY 5,249 4,502
Equity Share Capital 144 144
Other Equity 5,105 4,358
Non-Current Liabilities 388 316
Financial Liabilities
Borrowings 72 77
Provisions 117 97
Deferred tax liabilities (net) 198 141
Current liabilities 3,372 2,871
Financial Liabilities
Trade Payables 2,650 2,147
Other Financial Liabilities 460 409
Other current liabilities 100 145
Provisions 161 171
TOTAL EQUITY AND LIABILITIES 9,008 7,688

8
Major areas of change to adoption of Ind AS
Impacted Item Impact
Investment in Mutual Funds• Measurement of investment in Mutual Funds at fair value through profit and
loss
Investment in Equity Instruments
• Measurement of investment in Equity Instruments at fair value through profit and loss
Proposed Dividend• Proposed Dividends to be recognized in the year when they are approved by
shareholders in the Annual General Meeting
Employee Benefits • Actuarial gains and losses on defined benefit obligations to be recorded
through OCI• Interest cost on net defined benefit obligation would form part of finance cost
Deferred Tax • Deferred tax impact on above adjustments

9
Impact on profit on account of Ind AS
(Rs. Mil)
Particulars Q4FY17 FY16-17
Profit After Tax reported as per I GAAP 220.79 816.19
Actuarial loss on employee defined benefit plan 1.86 12.24
Provision for estimated sales return (net of tax) - (1.41)
Effect of fair valuation of financial instruments (net of tax) 3.16 (0.36)
Profit After Tax reported as per Ind AS 225.81 826.66
Change in fair value of cash flow hedge(net of tax) 9.20 (18.06)
Actuarial gain / loss on defined benefit plans (net of tax) (1.86) (12.24)
Total Comprehensive Income as per Ind AS 233.15 796.36

10
(Rs.Mil)
EBITDA PAT
Note: Data as per IND AS
Q4
Q2
Q1
Q3
FY15 FY18FY17FY16
9.6% 9.8% 9.4% 9.7% 9.3% 9.6% 9.0% 9.4%
5.4% 5.4% 5.0%5.9%
4.9% 5.6%4.8% 5.2%
Q1FY17 Q2FY17 Q3FY17 Q4FY17 Q1FY18 Q2FY18 Q3FY18 Q4FY18
EBITDA PAT
3,494 3,404 3,684 4,176
3,828 3,739 3,9194,717
3,576 3,528 3,721
4,471
3,457 3,634 3,882
4,968
FY15 FY16 FY17 FY18
14355 1430515206
18331
277 313 353 390
325 338 383
455
291 315
351
402288 328
375
465
FY15 FY16 FY17 FY18
11811294
1461
1713
138 176 201 204
176194
213266
160177
187215
131
205 226
257
FY15 FY16 FY17 FY18
605
752
827
942
Quarterly Performance Trend
Revenue
Key Updates
11
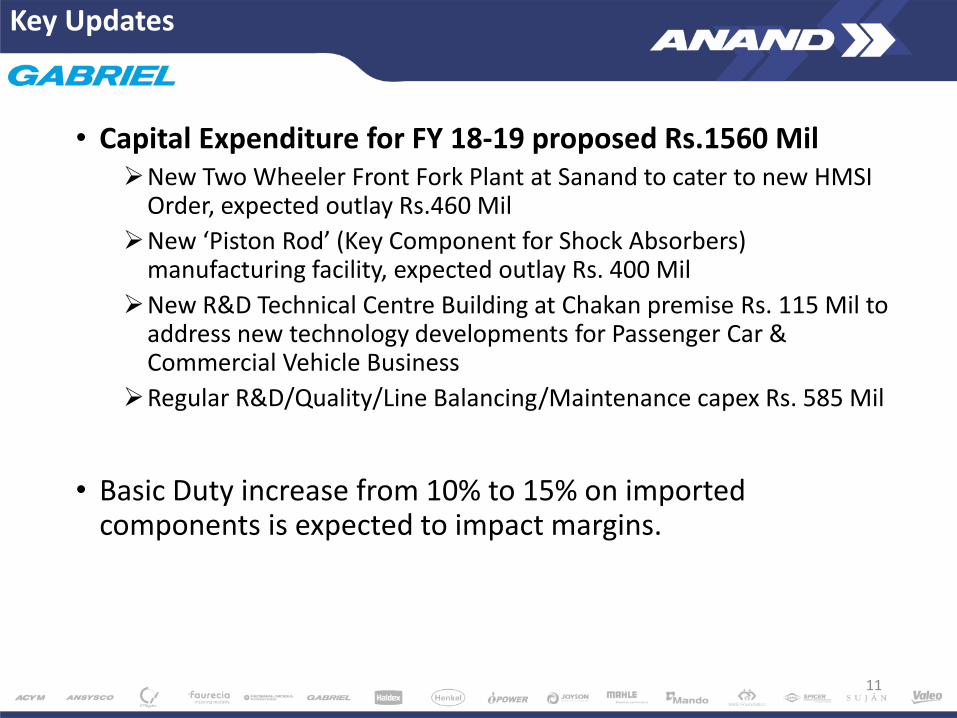
• Capital Expenditure for FY 18-19 proposed Rs.1560 Mil➢New Two Wheeler Front Fork Plant at Sanand to cater to new HMSI
Order, expected outlay Rs.460 Mil
➢New ‘Piston Rod’ (Key Component for Shock Absorbers) manufacturing facility, expected outlay Rs. 400 Mil
➢New R&D Technical Centre Building at Chakan premise Rs. 115 Mil to address new technology developments for Passenger Car & Commercial Vehicle Business
➢Regular R&D/Quality/Line Balancing/Maintenance capex Rs. 585 Mil
• Basic Duty increase from 10% to 15% on imported components is expected to impact margins.
12
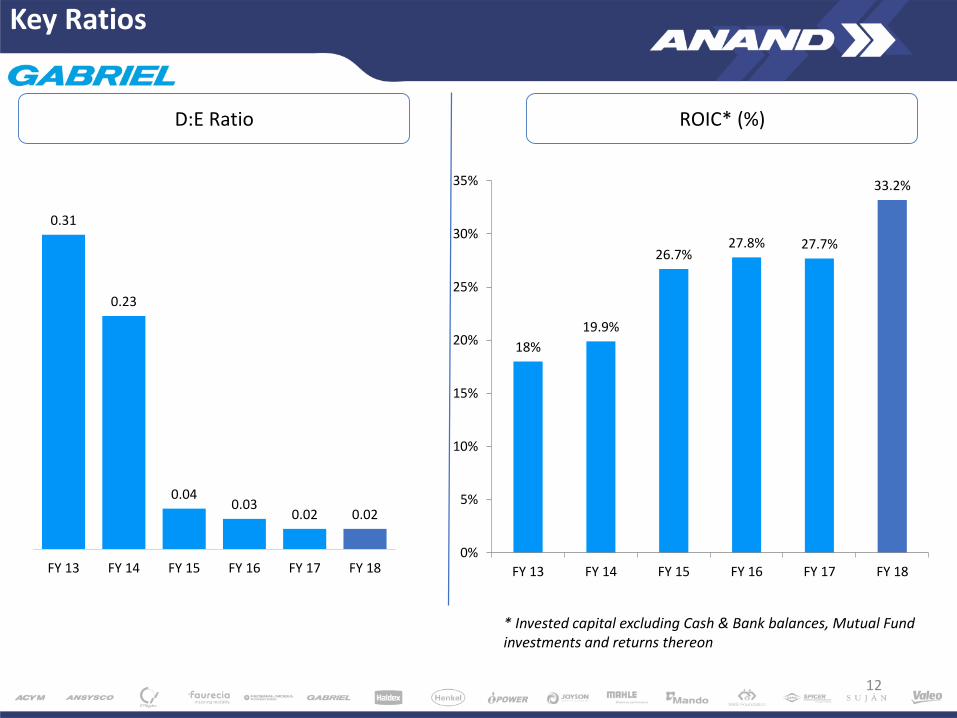
D:E Ratio ROIC* (%)
0.31
0.23
0.040.03
0.02 0.02
FY 13 FY 14 FY 15 FY 16 FY 17 FY 18
18%
19.9%
26.7%27.8% 27.7%
33.2%
0%
5%
10%
15%
20%
25%
30%
35%
FY 13 FY 14 FY 15 FY 16 FY 17 FY 18
* Invested capital excluding Cash & Bank balances, Mutual Fund investments and returns thereon
Key Ratios
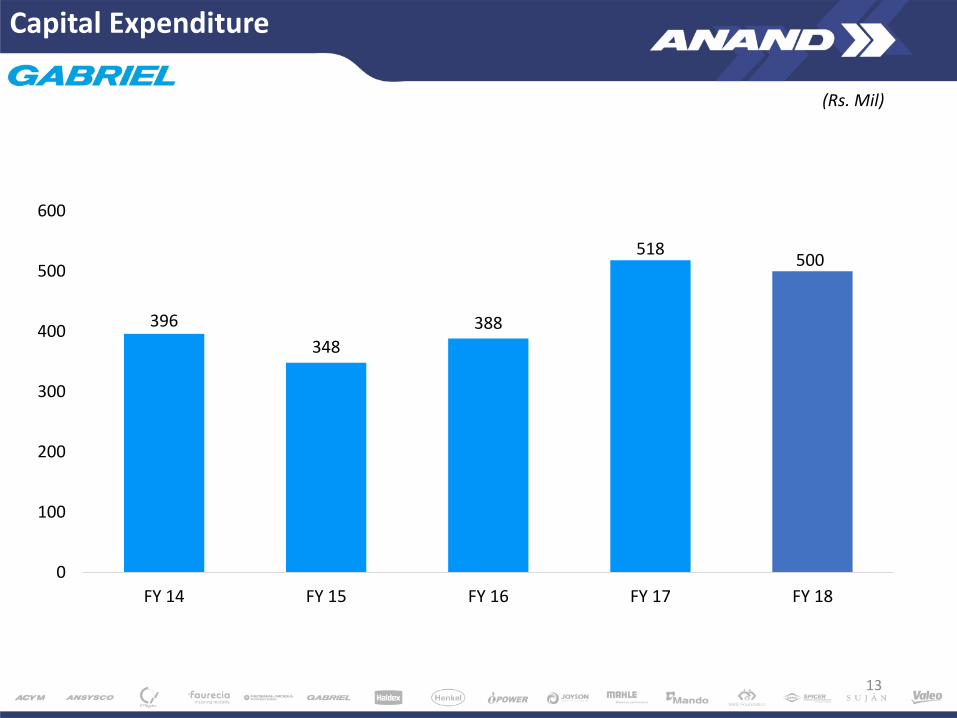
Capital Expenditure
13
396
348
388
518500
0
100
200
300
400
500
600
FY 14 FY 15 FY 16 FY 17 FY 18
(Rs. Mil)

14
33% 31%
• Continuous Dividend
since 1998
• Stable Pay out Ratio
• Declared Final Dividend
of Rs. 0.90 per share,
amounting to 90% of
Face Value
• Total Dividend of Rs. 1.40
per share of Re. 1 each
Dividend Per Share (Rs.)
Pay out Ratio
23%
1.30
1.20
1.05
0.85
1.40
FY17FY15 FY18FY16FY14
23%
Improving Dividend Profile
21%

Working Capital
# Adjusted for vendor bills discounted and non-inclusion of final dividend as proposed dividend in comparison to earlier years. The adjusted net working capital days for FY17 & FY18 will be 22 & 23 days.
28
26
24
25
27
FY14 FY15 FY16 FY17# FY18#
Net working capital days

'Certificate Of Appreciation' in 6th FICCI Quality Systems Excellence Awards For Industry 2018
Suzuki Motorcycles India Pvt Ltd –Price Competitiveness Award
(4th time in a row)
Runner up prize for Safety -Manufacturing Today
AWARDS
16

Business Overview
17
18
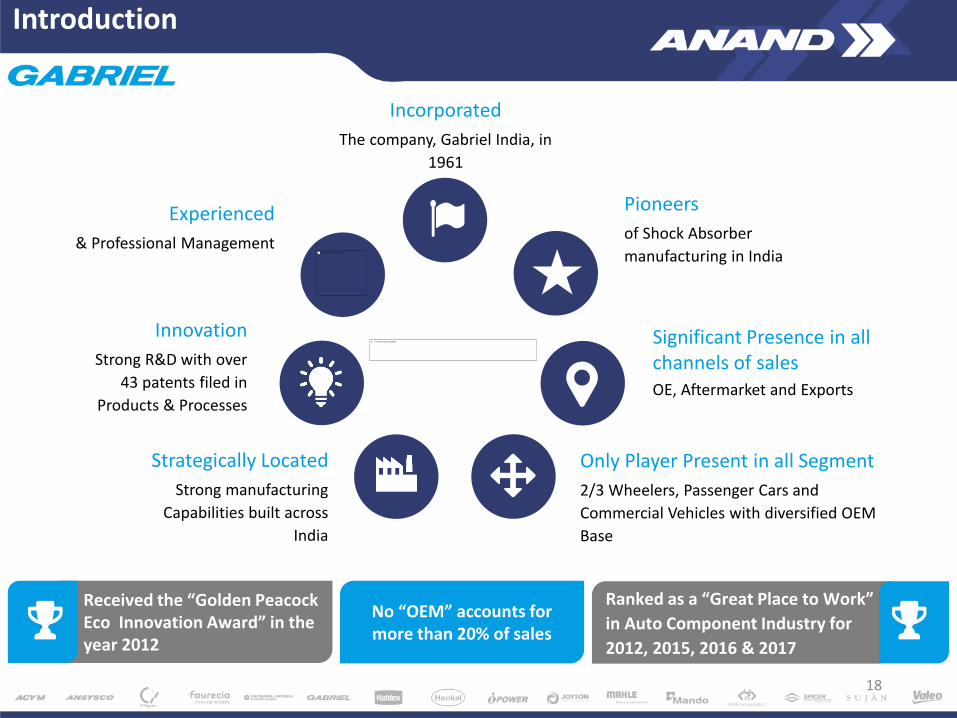
No “OEM” accounts for more than 20% of sales
Incorporated
The company, Gabriel India, in
1961
Pioneers
of Shock Absorber
manufacturing in India
Significant Presence in allchannels of salesOE, Aftermarket and Exports
Strategically Located
Strong manufacturing
Capabilities built across
India
Only Player Present in all Segment
2/3 Wheelers, Passenger Cars and
Commercial Vehicles with diversified OEM
Base
Innovation
Strong R&D with over
43 patents filed in
Products & Processes
Experienced
& Professional Management
Received the “Golden Peacock Eco Innovation Award” in the year 2012
Ranked as a “Great Place to Work”
in Auto Component Industry for
2012, 2015, 2016 & 2017
Introduction

19
2/3
Wh
ee
ler
Hydraulic Shock Absorbers
Gas Shock Absorbers
Passe
nger C
ar
Shock Absorbers
Cabin Dampers
Seat Dampers
Front Forks
CV
& R
ailw
ays
McPherson Struts
Gas Shock AbsorbersCartridges After
Market across all segments
Pioneer of Ride Control Products…
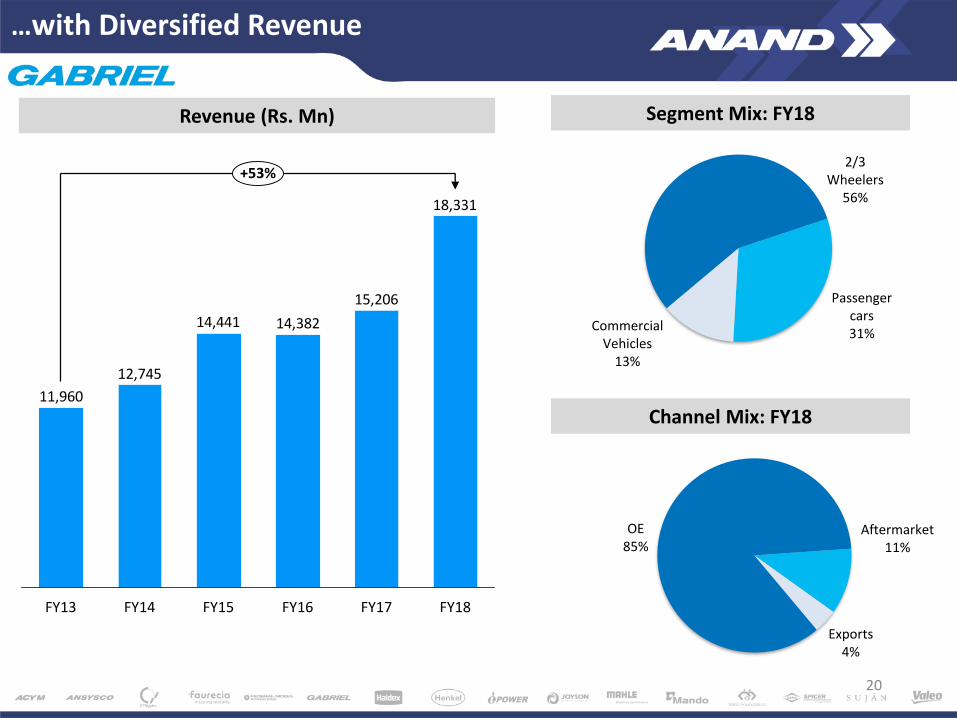
…with Diversified Revenue
20
OE85%
Aftermarket11%
Exports4%
2/3 Wheelers
56%
Passenger cars31%
Commercial Vehicles
13%
Segment Mix: FY18
Channel Mix: FY18
Revenue (Rs. Mn)
15,206
14,38214,441
12,745
11,960
18,331
+53%
FY17FY13 FY14 FY18FY15 FY16

Strategic Manufacturing Footprint
21
*Maps not to scale. All data, information, and maps are provided "as is" without warranty or any representation of accuracy, timeliness or completeness.
21
SML Isuzu
PiaggioBajaj Auto
GIL Presence
GIL Plants
GIL Satellite LocationsParwanoo
Khandsa
DewasSanand
Nashik
Pune
Hosur
Malur
Aurangabad
Ashok Leyland
Honda CarsHonda Motorcycles
ICMLMaruti Suzuki
Suzuki Motorcycles
Yamaha India
Tata Motors
TVS Motors
AMWGM
Tata MotorsHonda Motorcycles
FIATForce Motors
GM
Mahindra
Mahindra Trucks & BusesMAN Trucks
Skoda
VolkswagenVolvo Eicher
Ashok LeylandBharat Benz
Hindustan Motors
Hyundai
Royal Enfield
Tata Motors
Toyota Kirloskar
TVS Motors
Hindustan Motors
Manesar
Kumbalgodu

Strategy Going Ahead
22

Strategic Business Unit Approach…
23
2/3 Wheeler
Passenger Car
CV & Railways
• Quality & Process
Technology
• Capacity Enhancement
• Product Technology
• New Product Devolvement
Aftermarket
• Product Development
• Expanding Reach
• Product Innovation
• Improving Market Share
To derive benefits from Customer & Product Focus,Export Push and After market expansion

… To Drive Growth
24
Sales Growth
• Exports Focus
• Inorganic Growth
• Global Manufacturing Footprint
• Customer FocusEfficiency Improvement
• Debt Reduction
• Break Even Point (BEP) Reduction
• Simplification of Parts
• Automation
Technology & Innovation
• Improvement in quality
• R & D Focus
• Sustainable Manufacturing
• Innovation Culture

For further information, please contact:
Company : Investor Relations Advisors :
Gabriel India Ltd.CIN : L34101PN1961PLC015735Mr. Rajendran [email protected]
www.gabrielindia.com
Strategic Growth Advisors Pvt. Ltd.CIN : U74140MH2010PTC204285Mr. Jigar Kavaiya / Ms. Neha [email protected] / [email protected]
+91-9920602034 / +91-7738073466
www.sgapl.net
25