gal oya water management research projectdl.nsf.ac.lk/ohs/harti/22930.pdf · the arti research...
TRANSCRIPT

GAL OYA WATER MANAGEMENT R E S E A R C H PROJECT
S E A S O N A L R E P O R T 1984/85 M A H A SEASON
Occasional Publication No. 34 September 1986
AGRARIAN RESEARCH AND TRAINING INSTITUTE, 114, Wijerama Mawatha, ColomboZ
SRI LANKA

I O 7°i
GAL OYA WATER MANAGEMENT RESEARCH PROJECT
• SEASONAL REPORT
_;i984/85 MAHA SEASON
TISSA YATAWARA
Occasional Publication No. 34 September 1986
AGRARIAN jRESEARCH AND TRAINING INSTITUTE 114 f Wijerama Mawatha
I Colombo - 7 i SRI LANKA
LIBSAR'Y..--

FOREWORD
Under the Gal Oya Water Management Project,, Implemented by the Ministry of Lands and Land Development ,and the Irrigation Department, with financial assistance from USAID, the Agrarian Research and Training Institute was commissioned to carry out socio-economic research in the project area. This'assignment Included, among other things, " an experiment with a suitable model to secure farmer participation In water management and to monitor changes resulting from the irrigation rehabilitation.
The ARTI research programme had several components. It started with a baseline survey: of the project area. Thenp there was a record keeping exercise of about 300< selected farms which became the major source of data for the research studies. This data was analysed from cultivation season to cultivation season with a view to observe the trends and to make the information available to the Interested parties for their information and further research.
This report for the Maha cultivation season of 1984/85 is the fourth of the series of such presentations. In addition to the data extracted from farm records data on reservoir storage and land authorisation, water issues, rainfall, planning of cultivation, staggered cultivation, resource use characteristics1 and agricultural production, complemented with important aspects relating to irrigation systems operations are also Included In this report.
Mr. U.B.W.D.M.T. Satawara, Research and Training Officer was responsible for the preparation of this report. My thanks are due to him for his valuable contribution.
DIRECTOR

ACKNOWLEDGEMENT
The author wish to acknowledge... the aosi cutanea given by several individuals in the completion of this report.
The data presented in this report are generated through the farm record-keeping survey of the Gal Oya Water Management Broject. I thank M/S- C M . Wijayaratne and R,B. Senaka Arachchi, Research & Training Officers who planned atcl organized the record-keeping survey in 1 9 7 9 / 8 0 maha season which continued through 1984 /85
maha season.
A special word of thanks to. Kr ('T.B. Subasinghe, the Director, ARTI for the encouragement given to me in the preparation of this report.
The valuable comments made on the draft report by Dr. J. Perera^ Head of the Irrigation Water Management & Agrarian Relations Division* Dr. C M . Wijayaratne, and Mr. R.3. Senaka Arachchi Research & Training Officers, ARTI a r e also mentioned with a deep sense of thankfulness.
• '• ••• .--,••,> --.SJ.;-
I also thank M / S ' S . M . K . B . Nandaratne, P . ; Wickramarachehi', M.G.M. Razaak for their assistance given in producing this report.
I am very thankful to Mr. N.L.M. Mucafeer, Statistical Assistant of the ARTI and other Investigators for their assistance in data processing.
I must also thank Mr. S.D. Karunaratne editor, ARTI, for his editorial assistance.
Support in the form of Secretarial Assistance and typing of drafts of the report was provided by Miss P . K . R . Silva and Miss J o Liyanage, Miss L Gunasekera typed the final reporto I thank them also.
-- Tissa Yatawara•—

V
Contents
ForWard
Acknowledgement' j
List of Tables
List of Figures and Maps
Glossary i
Introduction
Organization of the Report
i» Pre-Seasonal Activities
ii. keservoir Storage, Water Issues, and
Field Water Adequacy
iii. Area Cultivated
iv. Staggering of Cultivation Practices
i v. Resource Use|and Cost of Paddy Production
vi. Yields and Returns to Paddy Production
vii. Returns to Labour
Annex - 1
Annex - 2
Annex - 3

VI
L i 3 t of Tables Page
Table 1 . Summary 'tnfjor'natitur x>n: 19134:/83 MahaST2ascjv, .LB 2
2„ Distribution-of sample farmers.' 4
3 . Classification of selected distributary
channels by locations. 6
4 . Schedule of cultivation activities and other
important decisions. 7
5 . Si ze of cultivated..hoLdings- by channel locations. 1 4
6 . Observed period of sowing to harvest classified
by channels. 1 7
7 . Varietal adoption by channel areas. 19
8 . Distribution of seed rate by sample area* 20
9 . Fertilizer use classified ."by simple locations. 22
1 0 . Rate of application of fertilizer by channel -
locations, 23
1 1 . Method of weed control by channel areas * - 24
1 2 . Types of insects and pest problems encountered
by sample locations. 26
1 3 . Labour use in paddy production by channel area". 27
1 4 . Estimated cost of paddy production during
the 1984 /05 Maha season. 28
1 5 . Distribution of paddy output in the Left
Bank system 1984/85 Maha season. 32
1 6 . Yield and average returns to paddy farming
by units. , 34
1 7 . Percentage of input value to gross output. 35
1 8 . Returns to labour by units. 36

VII
!
L i s t of F i g u r e s &. Maps
i F i g u r e 1. R e s e r v o i r c a p a c i t y and water i s s u e s to
L e f t Bank system dur ing."19 r 34/05 Maha,season
2 . D i s t r i b u t i o n of r a i n f a l l i n se lec ted
l o c a t i o n s 1984/85 Maha season,,
3, S tagger ing of paddy c u l t i v a t i o n , ,
. 4 0 Frequency d i s t r i b u t i o n of per acre paddy
y i e l d 1984/85 Maha season .
Map 1 » , Ga l Oya P r o j e c t .
2 . Water a v a i l a b i l i t y index by c h a n n e l s .

VIII
- GLOSSARY -
Drainage area : The area without direct water supply. In the the drainage area, farmers cultivate land using drained irrigation water, which comes through the other farmers paddy fields,,
Kanna Meeting : Gathering of farmers and officials in a particular area prior to each cultivation season,
Liyaddas : Individually bunded plot. Usually there are about 20-50 Liyaddas per -hectare,- .
Maha : Wet season associated with North-East monoooh rains during October to January,
Yala : Dry season associated with minor rains of South-West monsoon during March and April,

Summary and I n t r o d u c t i o n
The 1984 /85 Maha season commenced in October 1984 and continued
t i l l end of March 1985, C u l t i v a t i o n has been dependent mainly on
r a i n f a l l with supplementary i r r i g a t i o n towards the end of the
s eason . I n t h i s season the land prepara t ion was done during the
f i r s t h a l f of October in some p a r t s of the system, whi le in the
other p a r t s i t was done during the l a t t e r h a l f of October, , The
sowing of paddy began in November, with the on se t of N o r t h e a s t
monsoon r a i n s ,
; i W a t e r x s t o r a g e in Senanayake Samudraya for the Maha seasons was as
f o l l o w s : ( a t the beg inn ing of the s e a s o n ) . ! % of the f u l l
Season .. J$ tor age (Acre f e e t ) S t o r a g e C a p a c i t y I
1902 /83 7200 0.9
1983/84 47750 6.2
1984/85 '486000 63.0 I
U n l i k e during prev ious Maha s e a s o n s , the s torage c a p a c i t y of the
Senanayake Samudraya "was s u b s t a n t i a l l y h igh with 406,000 acre f e e t
(637» of the f u l l c a p a c i t y ) , a t the beg inning of 19#4 /85 Maha season .
Th i s could be a t t r i b u t e d to the heavy r a i n f a l l experienced during
the 1983/84 Maha season and a l so -due to b e t t e r water management
p r a c t i c e s adopted by farmers in 1904 Y a l a season . I • . . . .
As d i s c u s s e d at the Kanna M e e t i n g s he ld in v a r i o u s l o c a t i o n s of the
scheme, s teps were taken to1 r e l e a s e the f i r s t i s s u e of water on the
15th January 1 9 0 5 . But due to the unexpected de lay in r a i n f a l l ,
the f i r s t i s s u e of water was a c t u a l l y r e l e a s e d on the i 5 t h
October 19.84. T h i s i s s u e of water was mainly f o r the domest ic
purposes and hence i t was c u t - o f f on 19th O c t o b e r . Aga in on 30th
October water was i s sued to the L e f t Bank f o r land prepara t ion
a c t i v i t i e s . Thi s water i s s u e was c u t - o f f on 11th of November. The
f i n a l 'date of. water i s s u e to the L e f t Bank was on 13th March 1 9 0 5 .
Due to Maha r a i n s use of heavy equipment for r e h a b i l i t a t i o n work ... \
was minimal .

- 2 -
The overall progress of the Physical Rehabilitation Work was 8 2 . 2 3 7 0 1 as against the scheduled 907. at" the.end of the -1984/85
Maha season» Activities were mostly concentrated in areas such as the Left Bank Main Canal, Mandur Distributary Channel, Silikkody Canal and Gonagolla Branch Canal etc.
Table 1 : Summary Information on 1984/85 Maha Season, Left Bank f Gal Oya
Description
S t o r a g e l e v e l at the beg inning
of the season (October 1 s t )
S t o r a g e l e v e l at the end of the
season (March 31s t )
F i r s t date of water i s s u e
F i n a l date of water i s s u e
Mean r a i n f a l l per month
Area i r r i g a t e d (Proposed).
P r i c e of ! 50 kg f e r t i l i z e r
(Farm g a t e )
P r i c e of 1 bushel of paddy
(Consumption)
C o s t of h ired labour day
486,000 acre; f e e t
.552,080 acre f ee t
1 5 t h October 1984*
1 3 t h March 1985
1 5 9 . 3 0 mm
26,408 acres
Rs.' 1 5 2 , 0 0
Rs. 62 .50
Rs. 43.00
* * *
*
it*
isitie
Source
1
• SeeoTable 4
Mean of 5 rainfall stations for the period October ' to March.
Within Agr arian Services Areas of Weeragoda, Uhana Namalthalawa Units 34 /36 and Werenkefcagoda. (Data were not available in'respect of other' areas such as Faragahakele and Palayadiwattai).
: Record of the Department of Agrarian Services, Ampara, ARTI Record Keeping Programme,
- According to the PRC Reports,

, - 3 -
Data collected through the a distributary channel basi
monitoring programme are presented on s and relevant administrative units/
villages are also mentioned for easy reference. The selected distributary channels are classified as head/middle/tail according to their location along the branch channel (map 1 and Table 3 ) , J
Organization of the Report
This report is organized as follows :
i, Pre-Seasonal activities, ii. Reservoir Storage, Water Issues, Distribution and Field
Water Adeqacy, iii. Area Cultivated, iv. Staggering of cultivation practices, v. Resource use.
vi, Yield and Returns to paddy production, vii. Returns to Labour.
The Agrarian Research and Training Institute (ARTI) continued both farm record keeping and farmer organizations activities throughout the season^ total of 358 field-channel organizations and 32
Distributary Channel Organizations were in operation during the season. There were 42 Institutional Organizers ( 1 0 s ) covering an area of approximately 25^000 acres ( 10 ,000 h a . ) e
The Record Keeping and Monitoring Programme too continued with 1 2
casual field investigators collecting data at 10 selected sample areas in the system,, i
The distribution of sample farmers across the scheme is shown in Table 2 .

- 4 -
Tab le 1\ . D i s t r i b u t i o n of Sample Farmers - 1984/85 Maha Season
Unit Name of Channel No, of Farmers Status of Farmers
22/23/24
18/19
10
7/15
33
34/36
Dn
LB LB
7 10
Note
Drainage area of LB 6 & 7
UB 2 Drainage
UB 17 M l
M' 16 Drainage
M 31 Drainage
LB 29 G 3 Drainage
G 16 G 24 Drainage
LB 39 • :
V 2 Drainage
S 7 and S 8 Drainage
V 21 Drainage .
15 15
15
2-20
25 18
12 n O
22
17
15 14 13
20 5
20
17. 14 10
20 20
18 18
LB -UB -G
Head Units Middle/Tail Units
Colony Colony
Other
Colony Other \
Colony Colony
Colony Other
Colony Other
Colony Colony Other ;
Colony Colony Other
Colony Colony Other
Colony Other
Colony Other
Vellaveli Branch Channel Silikkody Branch Channel M - Mandur Branch "
Left Bank Channel Uhana Branch Channel ' Gonagolla Branch Channel
2, 18/19, 22/23/24 10 ,33 ,34 /36 , 7/15, Dl, D2, 38
"Other" refers to following category of farmers : Encroachers, those who do not have direct supply of channel water, Purana Land operators etc.

HAP OF
fi*I LA MICH
&ATU<rttt0A
Pa HA
' <=*f 3b
7BN*. 26
****
^3 ]...
\ . -sj A.S.£. Areas 4
"Figures indicate tha location, of Colony Units
3.1 / .vs wprank°tagoda • Uhana Namal ttia.Lawa Weeragoda
SEA
J HAP 1 : Map of. the C-al OyA Pro jcc-t •

- 6 -
Table 3 : Classification of Selected Distributary Channels
Reservo ir Branch
Channel
Distributary Channel
Administrative Units
Senanayake
Samudr a
LB" Main up to N a v a k i r i LB.7, 10 f 29
Navakiri Tank
Uhana Mandur Gonagolla
LB Main ' Navakiri Vellave11
Silikkody
UB 2 , 17
M 1, 16, 31
G 3 , 16, 24
LB 39
V 2 , 21
S 7, 8
2, 33
18,22/23/24
7/15, 10, 19
33, D2 Block
34 .
36, Bi Block 38
(1) P r e - S e a s o n a l A c t i v i t i e s
The in format ion and d e c i s i o n s made at Kanna Meet ings held
at d i f f e r e n t p l a c e s of the scheme are examined An t h i s
s e c t i o n (See Table 4)
The author i sed areas of c u l t i v a t i o n vary in s i z e in
A g r a r i a n S e r v i c e s a r e a s . However, the proposed dates for
v a r i o u s a g r i c u l t u r a l opera t ions in most p a r t s of the L e f t
Bank system seem to be i d e n t i c a l . .
A c c o r d i n g to the d e c i s i o n s made at Kanna Meet ings the
f i r s t water i s s u e was due on 15th January 1985. But t h i s
d e c i s i o n was changed l a t e r due to the de lay i n the onset of
r a i n s , and thus the date of f i r s t water i s s u e was rescheduled
as 15th October 1984.
As d i s c u s s e d at Kanna Meet ings the period between the f i r s t
and f i n a l i s s u e of water wan 124 days and the farmers were
advised to complete s o w i n g / p l a n t i n g a c t i v i t i e s by November
15th in a l l the a r e a s . F i n a l date of c l e a r i n g channel bunds
had been f i x e d f o r 15th October in a l l the areas thereby
by Location

Table 4 :' Schedule of Proposed Cultivation Activities and Other Important Decisions 1984/65 Maha
Description Agrarian Services Area 1
Weeragoda Uhana Wamalthalawa f
34/36 Werenketcgoda |
1 . Total area authorised(acres) 6357 5095 2350 2200
• ' 9606
2. Paddy Variety (Growth duration in months)
3-3% 3-3% 3-3% •
3-3% 3-3% j 3. Final date of
Sowing 04.11.15 04.11.15 04.11.15 ' 84.11.15 ' :[ 04.i i . i5 4. First Issue of-
Water* 84.10.15 84.1Q.15 04.1Q.15 84.10.15 84.10.15 1 5. Final Issue of
Water 05.02.15 05.02.15 05.02.15 .05.02.15 85.02.15 6. Final date of
payment >of insurance premium 84.11.15 04.11.15 04.11.15 04.11.15 04.11.15
7. Clearing of ; Channels, bunds etc. 84.10.15 04.10.15 84.10.15 04.10.15 84.10.15
o O . Removal of Cattle 04.11.15 84.11.15 04.11.15 04.11.15 84.11.15
At the Kanna Meeting the first date of water issue was originally decided to be on 15th January 1985. But this decision was subsequently due.to the delay in the on set of rain„ Source - Records of The Department of Agrarian Services, Ampara
ARTI Record Keeping Programme.

g i v i n g an i n t e r v a l of between only 30 d a y s , c l e a r i n g bunds e t c ,
and f i n a l date of sowing. A l l farmers were advised to p l a n t
ohort - term paddy v a r i e t i e s (3 -3% months) , and a l s o the farmers
have a l s o been requested to pay t h e i r insurance premium before 15th
of November,
The o f f i c i a l records i n d i c a t e that the date o f x f i r s t water i s s u e
i s some areas i s not compat ible with the rescheduled date of water
i s s u e .
The g e o g r a p h i c a l d i s t r i b u t i o n of the A g r a r i a n S e r v i c e s areas i s
shown in Map 1 ,
I n Werenkatagoda area the f i r s t water i s s u e was r e l e a s e d on 10th
O c t o b e r , Thi s water i s s u e cont inued only f o r 3 days and i t was
rneantto be used for domest ic purposes a l though there was a g r e a t e r
demand f o r water for land .preparat ion purposes . Under these
c i rcumstances farmers were not able to commence land p r e p a r a t i o n
work on the date agreed upon e a r l i e r . They were informed that
the water would not be re l eased u n t i l the complet ion of
r e h a b i l i t a t i o n work on the channels by which water i s conveyed
to t h i s a r e a . Thus the f i r s t i s s u e of water was r e l e a s e d f o r
land p r e p a r a t i o n only on 5th November and; not on 10th O c t o b e r ,
In the Weeragoda a r e a , the proposed date for f i r s t water i s s u e
was 1 5 t h O c t o b e r , However, due to the urgent need for complet ion
of r e h a b i l i t a t i o n work on the channels , t h i a f i r s i t t wate-r,1-ssiie' was
a c t u a l l y r e l e a s e d on the 1s t of November, So consequent to the
de lay i n r a i n f a l l and the i n a b i l i t y to ge t water through the
channels at the beg inn ing of the season , the farmers were unable
to commence c u l t i v a t i o n a c t i v i t i e s as i s done i n a normal wet
season ,
(2)-'R-eservoir S t o r a g e , Distr ibut ion", ofi Water I s s u e s a n d ' F i e l d
Wat.6f Adeq;u-a£y'
(a ) 5.eservoir S t o r a g e
F i g u r e 1 shows the r e s e r v o i r s torage and water i s s u e s to L e f t
Bank, R i g h t Bank and River D i v i s i o n during the s e a s o n .

* 4)
600,000
( a c r e fect)(
400,000
200,000
C a p a c i t y
Senanayake Samudraya
"Ba
1000
.01 I
30 60 90 120
EL
180
1000
0'
1000
1 0 60
n n /l 30
90 1 2 0
Right. Bank
150
60 90 1 2 0
River Division
150
add
180
41 180
. . _ 9 - Q l 2 o . 1 5 0 ' 180 October' November December January February March

- 10 -
At the beg inning of the 1984/85 Maha season the s torage of water
i n Senanayake Samudraya was 486,000 acre f e e t , (637c of the f u l l
c a p a c i t y ) S u b s e q u e n t l y , with the on set of Maha r a i n s in the
catchment area there was an i n c r e a s e in the tank s t o r a g e . Thus at
the end of the season there was a s torage of 552,080 a c r e - f e e t of
water in the Senanayake Samudra,
(b) R a i n f a l l
The f i r s t showers of Maha were experienced in the l a t t e r h a l f of
O c t o b e r , The monthly average r a i n f a l l as recorded in the Ampara,
I n g i n i y a g a l a , Namal Oya, G o n a g o l l a and Uhana meteorological s t a t i o n s s tood at 6.9" (169 mm), 6.5" (158,7 mnO, 6,5" (158 .7 mm),
5,5" (134.7 mm) and 6 .0"'(147.0 mm) r e s p e c t i v e l y (during October
to March) (Figure .2)
Of these f i v e r a i n f a l l s t a t i o n s Uhana has recorded the maximum
monthly t o t a l r a i n f a l l of 14,43" (353.5 mm) during the month of
November, i
( c ) Water D e l i v e r i e s in Channels
During the season , under review there were s e v e r a l water i s s u e s
from Senanayake Samudraya to the LB a r e a . The f i r s t i s s u e of
water was e f f e c t e d f o r a period of 4 days from 16th October to 19th O c t o b e r , and i t was.'only tot .do&Qsfic.purposes, . The-first issue of
water for c u l t i v a t i o n purposes l a s t e d for a" .period • Of '\% jda^s from 30th October to 11th November,
I n the Maha season, i r r i g a t i o n water was d e l i v e r e d through a l l
d i s t r i b u t a r y channels to the e n t i r e L e f t Bank area.
The R i g h t Bank system a l s o had r e c e i v e d s e v e r a l water i s s u e s
dur ing the Maha season .
From the two graphs i l l u s t r a t i n g water d e l i v e r i e s , one can s e e ,
that the r e l i a b i l i t y , frequency and the adequacy of water f lows
are tending to d iminish in the t a i l end areas of the system.
(Annex 3)
(d) F i e l d Water A v a i l a b i l i t y
G e n e r a l l y in the Maha season, water a v a i l a b i l i t y in d i f f e r e n t
p a r t s of the scheme depends l a r g e l y on the r a i n f a l l .

11

S e l e c t e d paddy "Liyaddas" were observed by the i n v e s t i g a t o r s in
o r d e r - t o assess the adequacy of the water supply throughout the
season . The observa t ions were c l a s s i f i e d i n t o f i v e major
• ca tegor ie s i n order to develop an Index c a l l e d Water A v a i l a b i l i t y
Index (WAI) • This index i s c a l c u l a t e d f o r the 50»day per iod
cons idered to be the c r i t i c a l period between the 20th and the
70th day before the h a r v e s t , in r e s p e c t of each sample " L i y a d d a " .
The h igher va lue of the Index i n d i c a t e s b e t t e r water a v a i l a b i l i t y
and the lower va lue corresponds to the reduced water a v a i l a b i l i t y .
The average WAI score for the head and the t a i l of each sample
channel i s shown in map ( 2 ) .
(3) Area C u l t i v a t e d
The e s t i m a t i o n of a c t u a l area c u l t i v a t e d w i t h i n the L e f t Bank
during any g iven season i s ra ther a d i f f i c u l t t a s k . However,
s i n c e the e n t i r e c u l t i v a b l e area under the GOLD was c u l t i v a t e d
the cropping i n t e n s i t y during the season under review was 1007°.
The s i z e of the c u l t i v a t e d land h o l d i n g s under v a r i o u s channel
l o c a t i o n s can be seen in Table 5 .
The s i z e of the c u l t i v a t e d a l lo tment i s b i g g e r in the middle and '
the t a i l - e n d areas such as in U n i t s 7 / 1 5 , 1 0 and 3 8 , whi le i t
i s smal ler in head-end areas as in U n i t s 10/19 and 2 2 / 2 3 / 2 4 . In
the t a i l - e n d u n i t s the s i z e of the c u l t i v a t e d h o l d i n g . v a r i e s
between 2„25 to 3 .6 a c r e s , whereas the in middle areas i t v a r i e s
between 1.1'... „
This can be expressed as f o l l o w s : WAI = ( a x l ) + (bx2) + (cx3) + (dx4) + ( Q X 4 ) No. of days of severe water shortage w i t h i n the c r i t i c a l period----No . of days of moderate water shortage w i t h i n the c r i t i c a l per iod No . of days of s a t u r a t i o n w i t h i n the c r i t i c a l per iod Mo. of days of standing, water w i t h i n the c r i t i c a l period No. of days of f l o o d i n g w i t h i n the c r i t i c a l per iod
.(dXand ( c ) were ass igned the same score s i n c e water suppl i ed to the p l a n t i s e s s e n t i a l l y the same; d i f f e r e n c e s in a e r a t i o n cannot be so r e a d i l y q u a n t i f i e d , due to i r r e g u l a r and u n c e r t a i n water supp ly , in the a r e a . (Refer 1900 year book for S r i Lanka Water Management R e s e a r c h , A R T I , 1902, f or d e t a i l s ) .

13
NAWAK1RI ARU TANK
W A L A G A M A
T A N K
H I M 1 D U R A W A
T A N K
S F . N A N A Y A K A S A M U D R A
MAP 2 : WATER A V A I L A B I L I T Y I N D E X B Y CHANNELS l^SR * -i Y

- 1 4 -
T a b l e 5 : S i 2 e of C u l t i v a t e d Ho ld ings by C h a n n e l s . 1934 /05
Unit Channel No. Farmers Sized of the Cultivated Holdings (Average Acres)
2 LB 7 .15 2.0 LB 10 15 1.7 Drainage 15 2.3
22/23/24 UB 2 20 1.9 Drainage 20 1.3
10/19 M- 1 10 1.5 UB 17 25 1.5
10 M 16 12 2.2 Drainage 8 3.3
7/15 M 31 22 3.6 Drainage 17 2.9
33 LB 29 15 1.7 G 3 14 1.3 Drainage 13 1.2
Do G 16 20 3.4 G 24 5 2.6 Drainage 20 2.2
34/36 LB 39 17 1.0 V 2 14 1.0 Drainage 10 2.2
30 S 7 & S 8 20 2.4
Drainage 20 2.6
D l V 21 18 2.2 D l
Drainage 10 2.5
Left Bank 391
Source : ARTI Record Keeping Programme (391 farmers)

- 1 5 -
and to 3 . 3 / acres, while in the head-end areas the size of the cultivated holdings ranges from 1 . 3 ' : to 2 . 3 : ' acres. A larger land holding si ze in the tail-end area has been recorded in previous seasonal reports. Cultivation of small holdings in tail areas docs not bring sufficient returns to sustain a family. In the meanwhile the small-sized holdings in the head areas are yet viable as irrigation water is assured for them.
Staggering of Cultivation Practices
Staggered cultivation in a given command area eould.: take place ac a result of numerous factors such as the lack of consensus among farmers in undertaking cultivation operations, inadequacy of water, shortages of labour and farm power and the cultivation of different varieties of paddy. Staggering in general, poses problems for water management because it lengthens the irrigation period thereby causing wastage of water. On the other hand, farmers often find staggering of cultivation in a way advantageous to them since it allows greater flexibility in obtaining labour and other inputs. However, this inturn could lead to a higher incidence of pest and disease attacks.
The schedule of dates followed by different farmers for the three major planting operations; land preparations, sowing and harvesting is shown in Annex 1 . Figure 3 illustrates staggering of paddy cultivation in Gal Oya Left Bank area.
Almost all the farmers in the sample areas started their land preparation from late September to early October, with the exception of units 38 and in the tail-end area, where 'the -land preparation has begun in early September.
Sowing of paddy in the area had begun with the first Maha rains during late.^October and early November. The harvesting operations lasted from'February until early March.
The duration from sowing to harvest as calculated from the date of planting of the first farmer to the date of harvesting of the l ast farmer is over 1 2 0 dcys in all the channel areas excepting the

Drainage *
• w |.: -.Drainage n m OWMIMI^
3 7 and S 8
Drainage 3
w«<KiiK.HVSTiTTn>
C 24
Drainag» 3
Kff 11,11 •̂ Hummo*)' K 1 HffnnK.iq'iM'S •
r- 1 »«<"««<)<«- v w B « m < « ) l 1 l l - > H
ub a
Drainage 1 1 '° .«•»«
rrWnnra -X.
HarvestIng
Jon 1 1 i i i IS
«.««» Sowing
Drainand
G 3
Apr 1 j 5. Apr 27.
I " ̂ Lan* Preparation
Figure 3 - Staggering of Paddy Cultivation
* The term "Drainage" denotes the paddy area fed by water drained off from the regular channel network.
•*;* ^ 2 1rS7 ,.sa, LB 7-,a*© - the< distributary -channels in the respective units.
i

- -: 17 -
Table 6 : Observed Period- of Sowing'to Harvest Classified by
Unit Channel/Area i
. Days
2 LB 7 124 LB 10 122 . • Drainage area along LB 6 and LB 7 130
22/23/24 UB 2 ; 139 Drainage area along Andella Oya and UB 2 147
18/19 M 1 ' 124 UB 17 '. 142
10 M 16 133 Drainage area of Andella Oya and G 16 154
- 7/15 M 31 125 Drainage 130
33 : LB 29 1 137 G 3 139 Drainage area of Navakiri River & G 3 128
G 16 137 G 24 125 Drainage Area 134
34/36 " LB 39 148 V 2
142 Drainage area of LB 36 & 39 149
38 S 7 and S 8 138 Drainage area of Silikkody Branch
• Channel and LB Channel 135
Dl V 21 1 133 Drainage Area 112
' Left" 1 4
¥ank ; •• •
13.", ̂ j
_ (391 .farmers)
Channels
drainage areas of: ^ 2 1 ° ^ e shortest duration from sowing to harvest has been recorded as 1 1 2 days in the drainage area of V 2 1
(Table 6 ) , In some areas this period extends up to 140 days due to the staggering of cultivation and harvesting operations,, However, almost all the farmers in the sample areas cultivated paddy varieties of 3-3% months duration as requested at the Kanna MeetingSo
(5) Resource Use In this section the characteristics of resource use such as the adoption of recommended paddy varieties, quantities of seed paddy and the application of fertilizer will be discussed. This will be followed by an analysis of the cost of production of paddy in the sample areas. In addition, the crop management practices such as application of weed, pest and disease control methods and labour use will also be discussed in this section,
(a) Use of Recommended Paddy Varieties Virtually all farmer3.cultivated high yielding, short-term (3 -3%
months) BG varieties of paddy such as ( 9 4 / 1 ) , (276/5)etc. The rate of adoption of varieties by locations,io atrown'in Table«-7« The most popular and widely used variety was BG ( 9 4 / 1 ) , This variety was cultivated by 757, of the total sample farmers, 107, of the sample farmers used a mix of BG varieties, BG (90 /2 ) variety has been used by the lowest number of farmers in the sample areas (7<> of the total number of sample farmers),
(b) Seed Paddy Table 8 shows the average seed rates of paddy used in different channel areas. The average quantity of seed paddy used per acre was 4 , 3 bushels for the entire LB area. However, the seed rate ranges between 2 , 4 to 7 , 2 bushels per acre 0 As can be seen in" Table 8 , the highest seed rate in the tail-end units of the main system indicates a general pattern which has been recorded in all previous seasonal reports, Channel area of M - 3 1 had the largest use of seed paddy per acre with 7 , 2 bushels per acre. The high seed rates in the tai-1 units are basically due to the practice of dry sowing which invariably requires a larger quantity of. eeed paddyo

Table 7 : Varieital Adoption by Channel Area, 1984/85 Maha (% farmers)
Unit Channel • Area 94
-1
94-2
90-2
34-8
276-5
400-1
275-5
379-2
34-1
Mix of
BG Va.
1
1
j Oth
er |
2 LB 7 LB 10 Drainage
75 40 50
05 05 6.6
05
40 '
10 53.4 L0
22/23/24 UB 2 Drainage
100 100
18/19 M 1 UB 17
44.5 20
27.8 5.5 28
11.1 48
11.1 If
04
10 M 16 Drainage
41.6 75
1 8.4 25
50 -
7/15 M 31 Drainage
72.7 82.3
4.5 5.8
4.5 18.3 11.9
33 LB 29 G 3 Drainage
73.3 64.2 84.6
7.2 26.7 14.3 14.3
15.4
D 2 G 16 G 24 Drainage
60 80 95
40
05 20
34/36 LB 39 V 2 Drainage
82.3 LOO 90
11.8
10 ;
5.9
38 S 7 & S 8 Drainage
95 95 05
05 •
Dl V 21 Drainage
88.9 83.3
Ll.l 5.5 11.2
Left Bank 74.9 3.1 0.3 0.3 -'2.3 3.6 0.8 1.3 : 1.5 10.C 1.8
Source ': ARTI Record Keeping Programme (291 farmers)

- 20 -
Table 8 : Distribution of Seed Rate by Sample Area <
(bushels per acre )
Unit Channel.. Seed Rate - Standard Bu/Ac Deviation
2 LB 7 3.7 1.04 LB 10 3.2 0.72 Drainage . 3.1 0.62
22/23/24 UB 2 3.3 0.57 :
Drainage 3.3 0.68
18/19 M 1 3.6 0.66 UB 17 3.4 0.53
10 M l . 3.5 0.64 ; Drainage 3.4 1.20
7/1.5 M 31 . 7.2 0.80 Drainage 7.1 0.74
333 LB 29 2.7 0.70 G 3 2.4 0.39 . Drainage 2.8 0.47
G 16 3.7 0.3S G 24 6.3 0.91 Drainage 5.5 1.17 :
LB 39 2.7 0.70
V 2 2.4 0.39 Drainage 2.7 0.47
r.38 S 7 & S 8 6.7 0.93 Drainage 5.7 1.25 V 21 5.3 0.30 Drainage 4.5 1.04
Left Bank 4.3 1.68
*
Source : ARTI Record Keeping Programme ( 3S1 farmers)

t - 21 -
Moreover, farmers used high seed rates to obtain a dense stand of paddy by which the growth of weeds can be reduced*
(c) Fertilizer Use The proportion of farmers as well as the extent of cultivated land which received the three main types of fertilizers,, namely the Top Dressing Mixtur-e (TDM),'Urea and the Basal Mixture (V^) a r e
given in Table 9,
During the 1904/05 Maha season 91.7% of the extent used Urea. 01.77. of the extent received TDM while an extent of 46.17. has received V-̂ mixture. The rates of fertilizer used by sample farmers were 05.57. for Urea, 00.47. for TDM and 41.77. for Basal Mixture (V-^).
The rate of application of fertilizer by channel locations is , given in Table 10. Of the three types of fertilizer varieties only Vi mixture is applied less, while Urea was applied in excess of the recommended quantity.
Recommended rates of application of fertilizer for Ampara District (for 3-3% months paddy varieties) by the Department of Agriculture are TDM 112,5 lbs. or 50 kg. per acre, Urea 05 lbs. or 75 kg. per acre, and Basal Mixture 160,75 lbs. or 75 kg. per acre.
Sample farmers of UB 2 and G 16 have applied Urea and TDM closely in keeping with the recommended rates.. .
(d) Weed Control ' Two basic methods of weed control viz. chemical and manual weeding were both practiced during the season, under review.
As can be seen in Table 11 more than half the sample farmers (697.
of sample farmers) have used chemical weeding only, while only 17.
of total sample farmers have practised manual method. 267. of total sample farmers have practised both.-chemical find manual weeding methods while 47. of the total sample farmers have never controlled weeds.

- 22 -
Table S : Fertilizer Use Classified by Sample Location
T .D'.M. Urea • V l
Unit Channel % Extent
ol ... . VO- •
Farmers %
Extent t
oi . /o
Farmers •%: • Extent
% Farmers
22/23/24 UB 2 S6.6 81.8 96.6 81 .'8 33.5 3S .4 Drainage 79.5 66.7 90.9 83.3 29.5 22.2
18/19 M 1 70.9 • * 77.0 63.6 55.6 26.4 27.8 UB 17 .89.9 •96, 83.6 84 50.6 52
10 M 16 - 98.2- 100 ,98.2 100 ., 81.3 75 Drainage S6.3 100 77.8 75 . 66.7 62.5
33 G 3 83.1 78.6 35.7 78.6 5.2 7.1 LB 29 84.9 86.7 79.2 86.7 13.2 •; 20 Drainage 87.8 84.6 63.6 53.8 -
D 2 G 16 99.6 100 ' 99.6 100 79.2 30 G 24 76.9 80 100 100 100 100 Drainage 58.2 60 72.5 75 28.9 20
33 S 8 i.., 6 9 • 8 72.2 100 100 56.8 55.6 S 7 100 100 100 100 25 50 Drainage 94.3 95 100 100 * 62.2 60
7/15 M 31 73.5 73.9 96.4 95.6 33.7 34.8 t
Drainage . 49.5 47.1 100 100 48.5 52.9
Left Bank 81.7 . 80.4 91.7 85.5 46.1 41.7
Source : ARTI Record Keeping Programme ( 291 farmers )
(% farmers and % extent )

- 23 -
Unit Channel T.D.M.- Urea V1
2 2 / 2 3 / 2 4 UB. 2. i
102 . 89 1 1 2
Drainage 15.3 84 102
1 8 / 1 9 M 1 1 3 1 93 1 1 3
UB 1 7 1 1 0 70 105
1 0 M 16 1 2 7 104 100
Drainage 103 92 1 2 9
33 G 3 1 1 1 91 55
LB 29 1 1 9 108 , 1 1 2
Drainage j 83 .85 -H G 16 1 1 5 76 126
G 24 99 102 106 i
Drainage 91 102 84
38 S 8 1 0 1 1 2 4 98
S 7 1 1 0 1 1 9 1 1 0
Drainage 99 1 0 1 89
7/15 ; M 3 1 107 183 1 1 0
Drainage 95 186 95
Left Bank 1 1 0 1 1 5 - 107
Calculated on the basis of reporting farmer of 269 f Source - ARTI Record Keeping Programme
( 2 9 1 farmers)
Locations (pounds per Acre)
Table 10 : Rate of Application of Fertilizer, by. Channel *

- 24 -
Table 1 1 : Method of Weed Control by Channel
Unit Channel Area
Method Unit
Channel Area
Manual Chemical Chemi cal + Manual
None
2 2 / 2 3 / 2 4 UB 2 [ 607. 40% • - -Drainage 60% 20% 20% Whole unit - 60%' . 30% 10%
1 8 / 1 9 M 1 _ 61% 3 9% -UB 1 7 56% 447. -Whole unit 587. 42% -
10 M 16 92% 8% -Drainage - 63% 3 7% -Whole unit - 00% 20% -
7 / 1 5 M 3 1 — 4 1 % 55% 4% - Drainage 127, 4 1 % ; 4 7% •=
Whole unit 57. 4 1 % 5 1 % 3%
33 LB 29 80% 20% -G 3 86% 14% -Drainage 46% . 3% 46% Whole unit - ' 7 1 % 14% 14%
D 2 G 16 *• 100 -D 2
G 24 80% 20% -Drainage _ 100 - -Whole unit - 98% . 2% -
34 /36 LB 39 93% - 7% 34 /36 V 2 ** 87% • - 1 3 % Drainage 93% - 7% Whole unit - 91% - 9%
38 S 7 & S 8 _ 25% 75% Drainage *• 10% 90% -Whole unit 18% 827, . —
02 LB 7 100 -LB 10 87% . 7% 7% Drainage * 100 - %m
Whole unit 96% • 2% 2%
V 2 1 17%' 78% 5% . -Drainage 57. 61% 34% -Whole unit -117c 69% 20% -
, : : _ : —— - - - - - < = ~ " ~ " ^ Left Bank 1% 69% 26% 4% j
Source - ARTI Record Keeping Programme (291 farmers)
(% of farmers) ; '

(e) Pest and Disease Control During the season the main types of pests encountered by sample farmers were sucking and leaf eating pests. As can be seen in Table 1 2 , 4 1,7% of the sample farmers have reported incidence of leaf eating pest.attacks while 12,57<> of sample farmers have encountered plant sucking pests. Attacks of both leaf eating and sucking pests were recorded by 4 1 , 4 % of sample farmers, 4,9% of the sample farmers have not encountered any pest problems during the reference season. j
The most wide-spread disease was caused by fungs. Specially the unit areas of 3 3 , 34 /36 were affected severely by fungs,
(f) Labour Use Labour use in the Left Bank area includes family labour, exchange labour^hired labour (daily paid) and contract labour.
The quantities of labour use per acre for paddy farming operations in each of the units (except 2 , 3 4 / 3 6 , D^ units) are shown in Table 1 3 .
The highest amount of hired labour was utilization noticed in the tail-end area of the main system such- as in units 7 / 1 5 , D2 and 3 0 . •
Generally in the project ar,ea, contract labour was not much used. In some units (unit 33 and 30) contract labour was not used at all.
As can be seen in Table 1 3 , the average mandays per acre of Exchange Labour in tail-end areas are very low, while hired labour input is very high in these areas. The amount of hired labour used in head-end areas is very low due to the availability of adequate family labour for cultivation activities of their small land holding
(g) Cost of F a d d y Production Table 14 shows estimated cost of paddy production for selected units during the 1904 /05 Maha season.

- 26 -
Table 1 2 : Types of Insects and Pest Problems encountered • by
2 2 / 2 3 / 2 4 UB... 2 ,,, 43% 1 2 % 43% -Drainage 33% 1 1 % 55% mm
Whole unit 40% 1 2 % 48% -
1 8 / 1 9 M 1 70% 20% 10%
UB 1 7 40% 60% • -Whole unit 20% 65% 10% 5%
10 M 16 - 58% 4 1 %
Drainage - 75% 25% ' -
Whole unit - ' 65% 35% -
33 , LB 29 20% 40% 10% 30%
G 3 16% 66% »
16% :
Drainage 50% 50% -
Whole unit 25% 40% 20% 1 5 %
G 16 10% 90% -
. G 24 60% 40% - . •;
Drainage 6% 46% 46%
VJhole unit 2% 30% . 67%
7 / 1 5 M 3 1 . - 36% 47% 1 5 %
Drainage 1 6 % ' 16% 66%
Whole unit 4% 32% 52% 1 2 %
38 S 7 & S 8 86% 6% 6%
Drainage 10% 30% 60% -
Whole unit 4% 64% 28% 4%
Left Bank 1 2 % 4 1 % 4 1 % 4%
Source - ARTI Record Keeping Programme (391 farmers)
Sample Locations (%> farmers)
Unit Channel S u c k i n g Leaf Sucking Not ; Area bating and Leaf Reported
Eating

- 27 -
Table 1 3 : Labour Use in Paddy Production by Channel 1934 /85 Maha
(mandays per acre)
Unit Channel Family Hired Exchange Contract Basis
2 2 / 2 3 / 2 4 UB 2 2 2 , 6 1 4 . 2 4 .0
Drainage 1 5 . 3 1 3 . 8 4 . 1 1 . 4
Whole unit 20 .4 1 4 . 0 4 .0 0.4
1 8 / 1 9 M l 1 7 . 8 1 0 . 2 2 . 0 1 . 0
UB 1 7 j 1 9 . 9 0 .5 1 . 9 0 . 1
Whole unit 1 9 . 0 4 . 5 1 . 9 0.4
1 0 M 16 20 .5 5 .0 4 . 5 1 . 3
Drainage ' 5 .4 1 2 . 2 0.5 3 .0
Whole unit 1 3 . 1 8.6 2 . 5 2 . 1
7 / 1 5 M 3 1 4 .9 1 5 . 9 - 3 . 5
Drainage 3 . 3 1 7 . 1 3 .4
Whole unit 4 . 5 1 0 . 2 - 3 . 5
33 G 3 2 3 . 3 6.6 8.4
LB 29 2 2 . 2 , 1 5 . 0 2 . 3 -Drainage 30 .3 1 8 . 6 2 . 3 -Whole unit 2 3 . 6 1 3 . 1 - 4 . 4 —
»2 G 16 1 9 . 1 1 1 . 7 0.8 0 . 1
G v 24 1 3 . 2 1 8 . 6 0.6
Drainage 1 3 . 2 1 4 . 9 0 . 2 -Whole unit 1 6 . 6 1 3 . 4 0.6 - 0 . 1
38 S 8 1 3 . 1 1 5 . 4 0,6 -Drainage , 1 1 . 3 1 5 . 7 • 1 . 6 -Whole unit 1 2 . 3 1 5 . 5 1 . 1 mm
Left Bank. 1 4 . 0 1 3 . 1
Source - ARTI Record Keeping Programme ( 391 farmers)

22 /23Z24 18/1 9 10 1/ 13 33 "l 38 Left Bank
Total Zoat/Ac % of Tote] Total Coat/Ac \ oi Tota. Total Coat/Ac 1 t at Total
Total . Coat/Ad I of Total Total Coat/AC 1 of Total Total Coat/Ac % of Total Total Coat/Ac % of Total Coot/Ac & of Total Coat Coat. Coat Coot Cost Coat Coot Coat Coot Cost Coat Coat Cost GtSse Cost
Caah Cost; 81 red Labour Cost 2222ft.50 • l 836 18:5 8688.80 204 7.7 18S78 331 13,6 54241 568 20.5 16881 468 16.7 5658 494 18.6 46563 728 24.3 510.34 18.40 Contract Labour Coat 500.00 13, 0.4 860.00 26 1.0 8140 187 3.7 16085 168 , 6.0 - - - 220 1.9 0.07 - - - 32.49. 1.9 Fertiliser 13908.00 390 uie 10912.00 333 12.6 21424 404 15.7 37280 390 24.0 ' 9790 28*2 41260 360 13.8 22198 347 11.6 381.01 13.0 Afro Cbeslcala 8978.00 224 7i4 £828.00 208 7.9 13553 256 9.9 22849 8.6 6711 192 8.8 33682 Z94 11.1 21165 331 11.0 261.83 9.4 Seed Paddy 2870.00 : 72 2.3 - - - 8063 96 3.7 33930 418 13.0 520 IS 0.5 17783 135 S.8 64201 100 , 3.3 . 187.20 8. 7 Fans Power: Buffaloes 3833 71 2,. 3 2840.00 87 3.3 160 3 0.1 5845 61 2.1 3260 94 3.2 5140 45 1.7 4390 71 2.3 56.69 2.0 Tractor 120O.00 : 30' 1..3 3710.00 113 4.3' 7»J0 145 5-6 20685 310 •ll.J . 4330 125 4.3 12510 109 < 4.1 . 24425 332 12.7 . -132.34 6.9 Otber Coat 3874,00 : 9 3 3.0 710.00 22 0.8 3579 68 2.6 11380 121 4.3 2970 83 2.8 15312 13.4 5.0 1333 21 •0.7 90.15' 3.2 Sub Total 56311 1410 13.8 41288.90 1261 7.9 7S167 3 1418 55.1 217505 2217 81 44462 1279 43.9 182473 1SS3.3 60.2 126636 1978 66.0 1712.70 - 61.7 tion Cash Coat; Finally La&o-ar '•
Coat 32463.12 811 26.8 31306.00 as* 36.3 289S2 546 21.2 16717 173 6.3 30420 875 30.0 69013 603 22.8 29561 462 15.4 548.72 19.8 Sxcuasga Lahoor
Cost 6212.80" 13» 3.1 4538.00 : 110 3.3 83 857 11.1 . 4.3 - - - 3314 .153 3.2 2608 28 1.0 2849 45 . 1.3 63.15 Soe4 Paddy 10337.00 • 238 8.8 8740.00 267 10.3 ' 10448 197 • T.6 28033 294 10.0 6720 103 6.6 • 23463 205 7.7 21888 342 11.4 232.20 a. •• Poro Power: B\if faloea 10388,00 8.6 8832.00 273 10.4 .",040 113 4,3 5688 60 2.1 14280 411 1.4.11 24080 210 7.9 18SS3 170 3.7 184.47 6.6 Tractor 4690.00 117 3.8 - - 9996 189 7,3 - - - - - - TOO 6 0.2 - - 33.41 1.3 Otbar Cost - - -• - - - - - - - - - - - 90 0.8 0.03 - - - 0.21 0.01 Sub Total 84073.88 1800 53.2 44836 1369 32.1 61173 1153 44.9 30438 529 19 56734 1632 36.1 119050 1032.8 39.8 65183 1019 . 34.0 1063.44 38.30 CM TO TOTAL 120387 3010 100 88124,30 2030 100 136340 50 2373 100 267843 2776 100 101196 2911 100 303429 2846 100 191799 2997 100 2776.11 100
/Jl.
TABLE :- 14 ESTIMATED COST OF PADDY PRODUCTION 84/85 MAHA SEASON

Cost of paddy production includes... cash:V.a^.. costs and non-cash^ D ;
costs. Cash costs cover hired and contract basis labour, materials,, farm power, and other costs. Non-cash costs include family and exchange labour, seed paddy, farm power, and other costs
The labour accounts for abour 4 2 7 , of total paddy production cost in Left Bank sample areas. Family labour cost is 1 9 . 8 7 o of the total cost of production. Exchange labour and contract labour were not much used, ( 2 . 3 7 , and 1 097<> of the total cost of paddy production).
The next important factor is fertilizer cost together with other cost of agro-chemicals and represent 2 2 . 4 7 = , of the total paddy production cost.
The percentage of cost of seed paddy is 1 5 . 1 7 , . The cost of animal power (buffaloes) is G . 6 7 o from the total cost while the cost of tractor power amount to 8027> of the total cost. Cost of other materials and services such as transport, sacks etc. contributes about 3 . 2 7 « of the total paddy production cost.
The estimated average total cost, of production per acre in 1 9 8 4 / 8 5 Maha season was Rs. 2 7 7 6 . 1 1 which is slightly less than the average cost of Rs.. 2 0 7 4 recorded in 1 9 8 3 / 8 4 Maha season.
The unit No.' 3 0 has recorded the .highest cost:of Rs.'. ? 2 0 ' . pgr. " acre on hired labour. Then unit 1 0 and 7 / 1 5 have incurred about Rs. 4 0 0 per acre on fertilizer. That was the highest recorded cost on fertilizer per acre in the selected sample areas. Total cost of paddy production amounting to 3 0 1 0 / - per acre unit 2 2 / 2 3 / 2 4 was the highest that has been selected areas. (see Table
It is obvious that farmers have used their own seed paddy in unit 1 8 / 1 9 and that has contributed to 1 0 „ 2 7 > of total cost of paddy production, (see Table 1 4 )
(a) - Cash cost refers to those items which are to be purchased by the operator.
(b) - Hon-cach items are those not purchased, by operators.

- 30 -
(6) Y i e l d 3 and Returns to Paddy Production .
(a) Paddy Yield
The level and distribution of crop yield can be influenced by a large number of factors. These may include, weather condition adequacy and timeliness of water supply, the incidence of pest and disease attacks and the level of inputs applied by the individual farmer.
Figure 4 shows the distribution of paddy yield per acre within the Left Bank area during 1904/85 Maha season. Nearly, 507=. of the sample farmers have obtained more than 60 bushels per acre. A lower yield of less than 20 bushels per acre was obtained by only 1% of the sample farmers.
During this Maha season the average yield is about 60 bushels per acre. This is the highest recorded average yield since 1903 Yala season. As can be seen in Table 15 the paddy yield per acre is ranging from 39 to 09 bushels in selected sample areas.
The highest yield of 09 bushels per acre was recorded in the Drainage area of LB 6 and LB 7. The paddy yield per acre obtained by individual sample farmers however, ranged from 117-13 bushels.
As can be seen from the values of standard deviations, the variability of yield in the Drainage area of UB 2 and along Andella Oya is very higho (
(b) Returns to Paddy Production Two indicators are used to evaluate returns to paddy production. One is net returns per acre which is calculated as the market value of the per acre output minus the costs of production including non-cash payments and excluding non-cash cost. The other indicator is net returns per bushel of paddy which is calculated as the market value of a bushel of paddy (Rs. 65.00)
minus the cost of producing per bushel (including and excluding non-cash cost).
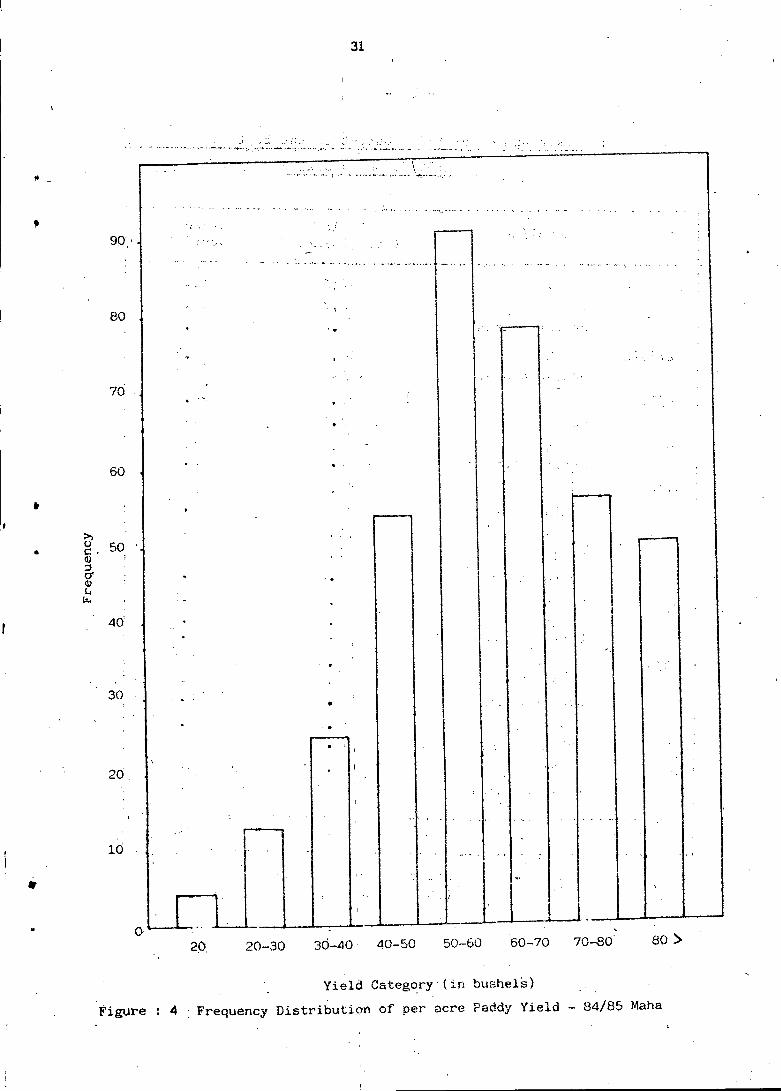
20 20-30 30-40' 40-50 50-60 60-70
Yield Category (in bushels) Figure : 4 Frequency Distribution of per a c r e Paddy Yield

- 32 -
Table 15 1984/85 Maha Season
Unit Channel/Area Yield Standard \ (Bushels/Acre) Devi ation
2 LB 7 76,6 1 3 . 1 LB 10 69 .2 - 1 1 . 0
Drainage Area 88 .8 5 .9
2 2 / 2 3 / 2 4 UB 2 76 .1 10 .5 Drainage Area 64 .6 27.3 .
18 /19 M 1 58 ,2 20 .6
UB 17 61 .6 11 .7
10 M 16! 62 .4 11 .1 - Drainage Area 62 .2 5.3
7/15 M 3 i : 63 .1 24 .4
Drainage Area 57 .4 10 .7
33 _ LB 29 54 .9 15 .9
G 3 , 64 .4 1 6 . 1
Drainage Area 6 4 f 2 17 .0
D 2 1 ! G 16 68 .9 17 .2
G 24 56 .3 0 .1 Drainage Area 54 .6 a . 2
34/36 '; LB 39 . 39 . 8 15 .5
v; 2 55 .3 18 .9
Drainage Area 43 ,3 10 .6 ;
38 ;• S 7 6. S 8 5 3 . 2 10 .6
Drainage Area • 62 .6 7.4
! D 1 ! V 21 ; 38.3 1 2 . 0
Drainage Area 5 4 . 2 11 .8
Left Bank 60 .4 17 .7 :
t
t Source - ARTI Record Keeping Programme ( 3 9 1 farmers)
\
- 33 -
Table 16 shows returns to paddy production in selected.sample areas. The gross returns averaged to Rs„ 3926.70 per acre (ranging from Rs. 3 7 3 7 . 5 0 to Rs. 4550 per acre).
The net returns (including non-cash cost) averaged Rs. 1 1 5 0 per acre, while the net return per bushel, amounts to Rs. 19,0:0. The net returns (including non-cash cost) ranged from 740.50 -
Rs. 1540 per acre for all sample farmers while that ranged from Rs. 1 2 . 3 9 to Rs. 2 3 . 5 0 per bushel. . .
The net returns (excluding non-cash cost) ranged from Rs. 1 7 3 9 . 5 0
to Rs. 3140 .00 per acre with an average of Rs. 2 2 1 3 . 9 5 per acre while the net returns (excluding non-cash cost) per bushel ranged from Rs, 2 7 . 0 0 to Rs. 4>5«,00 with an average of Rs. 36.JO per bushel for all sample locations.
The highest net-return per bushel (including and excluding non-c ash cost) has been recorded in unit 2 2 / 2 3 / 2 4 . The lowest net-return of Rs. 1 2 . 8 9 per bushel has' been recorded in unit 3 0 . (see Table 16 )
Table 1 7 gives the ratios of cost of production to gross-returns by unit. The cost-return ratios vary from 80 .2 percent in unit 38 to about 64 per cent in unit 1 0 . The highest ratios have been recorded for the tail-end units of the system.
(7) R.eturns to Labour As can be seen from Table 18 the total labour requirements varied from 2 2 . 1 to 4 1 . 2 mandays per acre. The average total mandays per acre was 29.66 for all the sample units.
i
The labour cost ranged from Rs. 9 1 1 . 0 0 to Rs. 1 5 3 5 . 0 0 per acre with an average of Rs. 1 1 7 5 . 0 0 per acre. The returns to labour are shown in Table 1 3 . It is seen that the average return for an 8 hour mandays is Rs. 77.80. This figure varied from Rs. 67.70 to Rs. 98.9TJ for all the sample areas.

Table 1 6 : Yield -and Average Returns to Paddy Farming by Units
Unit
COST OF r;R0DUCTI0N COST OF PR( (without n< cost")
EDUCTION on-cash
•
YIELD bu/Ac.
GROSS RETURN (Rs./Ac.)
NET RSUURN " NET RETURN without ngn-cash cost" Unit
R S . / A C e Iv S O /*C1 G o Rs o/Ac. Rs o/Ac o
YIELD bu/Ac.
GROSS RETURN (Rs./Ac.)
Ra./Ac. R 3 . / A c S 0 / i i C 0 Rs 0/Ac 0
22/23/24 3010.00 ' 43.00 1 4 1 0 . 0 0 20.00 70.00 4550.00 1540.00 22.00 3140.00 45.00
1 0 / 1 9 2630.00 44.00 I261 e00 21.00 59.50 3067.50 1237.50 21.00 2606.00 j 44.00
1 0 2573.00 41.50 1410.00 13.00 62.00 4030.00 1457.00j 23.50 2612.00 | 42.00 I
33 2911 c00 - 46.00 2247.00 30.00 61.30 3906.50 1075.50 | 18.00 1739.00 27o0o"|
7 / 1 5 2776 o00 47.50 1279.00 21.00 60.00 3-900.00 1124.'00 | 17.50 2621.00 44.00 1
D 2 2646.00 44.50 1593.00 j 27.00 59.30 3056.50 . 1 2 1 0.50 20.50 2263.00 30.00
38 2997.00 52.00 1978.00 : 34.00 57.50 3737.50 740.50 13.00 1759.00 30.60
Left Bank 2776.00 46.00 1713.00 " 28.00 60.40 3926.70 1150.50 19.00 2214.00 36.70 j
,cNon-cash cost includes family and exchange labour, seed paddy, farm power etc.
Source - ARTI Record Keeping Programme (269 farmers')

- 3 5 -
Table 17 : Percentage of Input Values to Gross Output
Unit Cost of
Production
R s .
Gross Return
Rs.
Percentage of cost of production to Gross Return ^
Rs.
2 2 / 2 3 / 2 4 3010.00. 4 5 5 0 . 0 0 6 6 . 2
18 / 1 9 2630^00 • 3 8 6 7 . 5 1 6 8 . 0
10 2573 .00 4 0 3 0 . 0 0 6 3 . 8
33 ' 2911 .00 3 9 8 6 . 5 0 7 3 . 0
7 /15 2776 .00 3000 .00 7 1 . 2
D 2 2646 ,00 3 8 5 6 . 5 6 8 . 6
38 2997 .00 3 7 3 7 . 5 0 80 .2 ;
Left Bank. 2 7 7 6 1 1 . 0 0 3 9 2 6 . 6 0 • 7 0 . 7
Source A U T I Record Keeping (269 farmers)
Programme

Table 1 8 : Return to Labour by Units, 1984 /85 Maha Season
Unit
Total Cost of Production
Rs./Acre
Cost of Labour
Rs./Acre
Gross Return
RSo/Acc
Net Return
Rs./Ac.
Net Return T
Cost of Labour Rs./Ac.
Total man-days; used
Net return per
8 hour day j
2 2 / 2 3 / 2 4 3010 1 5 3 5 4550.50 1540 .00 3075.00 ' 40.60 75 .70
1 8 / 1 9 2630 1326 3867.50 1 2 3 7.50 2563 .50 26.00 ; 98.60
1 0 2573 1205 4030.00 1 4 5 7 . 0 0 2662.00 26.90 98.90
33 2 9 1 1 1 5 1 4 3986.50 1 0 7 5 . 5 0 2589.50 4 1 . 2 0 62 .85
7 / 1 5 2776 9 1 1 3900.00 1 1 2 4 . 0 0 .2035-00 . 2 2 . 1 0 9 2 . 1 0
D 2 2646 1 1 2 7 3856.50 1 2 1 0 . 5 0 2 3 3 7 . 5 0 ' 30 .70 • 7 6 . 1 5
38 2992 1 2 3 5 1 3 73 7.50 740.50 1 9 7 5 . 5 0 29 .20 67 .70
Left Bank 2776 1 1 7 5 3908.00 1 1 3 2 2307.00 29 .70 77 .80
Source - ARTI. Record Keeping Programme (269 farmers)

- 37 -
Annex 1 Spread of Dates (First and Last) for Various Activities by Channel
Unit Channel Land Preparation Sowing' Harvesting
2 LB 7 LB 10 Drainage
22/23/24 UB 2 Drainage
18/19
10
7/15
33
»2
34/3*.
38
M 1 UB 17
M 16 Drainage
M 31 Drainage
LB 29 G 3 Drainage G 16 G 24 Drainage
LB 39 v2
Drainage
S 7 & S 8 Drainage'
V 21 Drainage
27th Sep. 1st Nov. 1st Oct.
18th Oct. 10th Oct.
18th Oct. 25th Oct.
18th Oct. 12th Oct.
15th Oct. 16th Oct.
to 29th Nov. to 30th Nov. to 13th Dec.
to 4.th Dec. to 4th Dec.
to 2nd Dec. to 16th Dec.
to 29th Nov. to 1st Dec.
to 26th Nov. to 20th Nov.
27th Oct 15th Oct 28th Oct,
1st Oct. 1st Oct. 1st Oct.
15th Oct. 1st Oct. 8th Oct.
4th Sep. 4th Oct.
1st Sep. 15th Sep,
. to 17th Dec.
. to 15th Dec.
. to 8th Dec.
to 10th Dec. to 21st Nov. to 5th Dec.
to 3rd Jan. to 5th Dec. to 31st Dec.
to 19th Nov. to 19th Nov.
to 25th Nov. to 13th Nov.
15th Nov. 18th Nov. 10th Nov.
5th Nov. 30th Oct,
12th Nov. 5th Nov.
10th Nov. 25-th Oct.
12th Nov. 5th Nov,
to 29th Nov. to 30th Nov. to 11th Dec.
to 4th Dec. to 4th Dec.
. to 29th Nov. to 17th Dec.
, to 1st Dec. to 4th Dec.
to 25th Nov. to 20th Nov.
19th Nov, 15th Nov, 27th Nov, 11th Nov. 3rd Nov. 4th Nov.
24th Nov. 6th Nov. 21st Nov,
26th Oct, 1st Nov.
31st Oct. 5th Nov.
. to 18th Dec. , to 20th Dec. , to 9th Dec, to 11th Dec. to 21st Nov. to 5th Dec.
to 4th Jan. to 7th Dec. , to 31st Dec.
, to 19th Nov. to 19th Nov.
to 25th Nov. to 13th Dec.
2nd Feb. to 18th March 1st March to 19th March 27th Feb. to 26th March
20th Feb. to 23rd March 21st Feb. to 26th March
23rd Feb. to 16th March 25th Feb. to 26th March 20th Feb. to 22nd March 22nd Feb. to 27th March
25th Feb. to 16th March 21st Feb. to 14th March
1st March to 5th April 15th March to 3rd April 12th March to 4th April 22nd Feb. to 27th March 20th Feb. to 7th March lith Feb. to 17th March
7-th March to 21st April 7th March to 27th April 14th March to 19th April
8th Feb. to 12th March 22nd Feb. to 15th March
19th Feb. to 12th March 10th Feb. to 16th March
Source - ARTI Record Keeping F>rogranTne (391 farmers)

- 33 -
Annex 2
List/of Main/Branch Channel Water Flow Chart
Unit No. Mea.suring...P.olnt
2 Left Bank Main Channel LB 7 distributary off-take
1 8 / 1 9 Uhana Branch Channel at UB 1 7 distributary off-take

Annex 3 Water Flow Charts 0) ffl
-c 80" CJ c
•rH
c *—'
03 -t-> to
m 4o" c <D
jC CJ M-O -P bO
2o"
Unit 2 - Measu-rement Point No:1
A n
3o O ctofaer
IL 0
60 November
9o December
12o January
15o February 18o March
loo"
1/5 CD J Z O C c
. '
Q) -P
80"
60"
Q) C S 4o" CJ <+-o S 2o" 60 •H X
J !
j
Up.it 18/19 - Measurement Paint No:2
Jin/
3o O ctober
60 November
9o December
12o Jinuary
15o February
18o *»arch