galaxy morphology and clasification van der bergh
TRANSCRIPT
The classification of galaxies according to their shape is a fundamental tool in astronomy. Itis through classification schemes that astronomers build a deeper understanding of howgalaxies form and evolve. This long-awaited book by one of the pioneers of the fieldprovides a concise and up-to-date summary of current ideas about galaxy morphology andclassification.
This is the first book to be dedicated entirely to the shapes and classifications of galaxies.It introduces the most widely used schemes (including those by Hubble, de Vaucouleurs,Morgan, the author and Elmegreen), explains how they have developed and what they cantell us about galaxies. Professor van den Bergh also presents evidence for how galaxiesmight 'transmute' from one type to another. It is also shown how very distant galaxies (forinstance, those seen in the Hubble Deep Field) often defy standard classification schemes.Finally, this book discusses recent work on the use of computers to classify digital images ofgalaxies automatically.
This topical volume provides graduate students and researchers with a unique andindispensable reference on the classification and shape of galaxies.


Galaxy Morphology and Classification
ELLIPTICAL NEBULAE
EO E3
Galaxy Morphology andClassification
SIDNEY VAN DEN BERGHDominion Astrophysical Observatory,Herzberg Institute of AstrophysicsNational Research Council for Canada
CAMBRIDGEUNIVERSITY PRESS
PUBLISHED BY THE PRESS SYNDICATE OF THE UNIVERSITY OF CAMBRIDGE
The Pitt Building, Trumpington Street, Cambridge CB2 1RP, United Kingdom
CAMBRIDGE UNIVERSITY PRESS
The Edinburgh Building, Cambridge CB2 2RU, United Kingdom40 West 20th Street, New York, NY 10011-4211, USA10 Stamford Road, Oakleigh, Melbourne 3166, Australia
© Cambridge University Press 1998
This book is in copyright. Subject to statutory exceptionand to the provisions of relevant collective licensing agreements,no reproduction of any part may take place withoutthe written permission of Cambridge University Press.
First published 1998
Printed in the United Kingdom at the University Press, Cambridge
Typeset in 10/13 pt Monotype Times [VN]
A catalogue record for this book is available from the British Library
Library of Congress Cataloguing in Publication data
Van den Bergh, Sidney, 1929-Galaxy morphology and classification/Sidney van den Bergh.
p. cm.ISBN 0 521 62335 91. Galaxies - Classification. I. TitleQB857.V36 1997523.1'12'012—dc21 97-24033 CIP
ISBN 0 521 62335 9 hardback
Contents
Preface xi
1 Introduction 11.1 The Hubble tuning fork diagram1.2 Galaxy types that do not fit into the Hubble scheme1.3 Modifications of the Hubble scheme1.4 Some historical notes1.5 Summary
2 The Hubble classification system 92.1 The Hubble tuning fork diagram2.2 Spiral arm morphology2.3 Pitch angle of spiral arms2.4 A luminosity dependent tuning fork?2.5 Summary
3 De Vaucouleurs' system 133.1 Description of the system3.2 De Vaucouleur's T system3.3 Summary
4 Elmegreen's classification of spiral arms 174.1 Observations of spiral arm types4.2 Theory of spiral arms4.3 Dwarf spirals4.4 Pitch angles of spiral arms4.5 Summary
5 Van den Bergh's classification of galaxies 235.1 Luminosity effects on morphology5.2 The David Dunlap Observatory (DDO) system5.3 Difference between spirals and irregulars5.4 Anemic galaxies5.5 Classification of central regions of galaxies5.6 Summary
6 Morgan's classification system 336.1 Central concentration of light6.2 Morgan's form families6.3 cD galaxies6.4 Automatic classifications on the Yerkes system6.5 Comparison between the Morgan and Hubble systems6.6 Summary
viii Contents
1 Galactic bars 397.1 Differences between normal and barred spirals7.2 Bars as conduits for gas7.3 Why do some galaxies develop bars?7.4 Summary
8 Elliptical galaxies 478.1 Radial profiles of elliptical galaxies8.2 Boxy and disky ellipticals8.3 Formation of ellipticals8.4 The fundamental plane8.5 Summary
9 The SO class 559.1 Introduction9.2 Definition of the SO class9.3 Luminosity of SO galaxies9.4 Summary
10 Early-type galaxies 5910.1 Cores and power-law profiles10.2 Relation between E, SO and Sa galaxies10.3 Summary
11 Dwarf spheroidal galaxies 6311.1 Introduction11.2 Population content11.3 Location of dwarf spheroidals11.4 Radial distribution of dwarf spheroidals11.5 Summary
12 Low surface brightness galaxies 6912.1 Selection effects12.2 A pair of low surface brightness galaxies12.3 Three types of low surface brightness galaxies12.4 Physical characteristics of low surface brightness galaxies12.5 Was the large Magellenic Cloud (LMC) once a low surface brightness galaxy?12.6 Summary
13 Morphology of active galaxies 7913.1 Ground state and excited galaxies13.2 Seyfert galaxies13.3 Intergalactic H II regions13.4 Luminous infrared galaxies13.5 Summary
14 Evolution of galaxy morphology 8514.1 Galaxies viewed at large look-back times14.2 Galaxy interactions14.3 Lyman-break galaxies14.4 Summary
15 Computer classification of galaxy images 9115.1 Comparison between visual and computer classifications15.2 Artificial neural networks

Contents ix
15.3 Objective classification parameters15.4 Summary
16 Problems, challenges and conclusions 95
References 97Object index 105Subject index 109

Preface
Yogi Berra once said that 'you can observe a lot by just watching'. The truth of thisaphorism struck me when the first prints of the Palomar Sky Survey started to arrive at theUniversitats Sternwarte in Gottingen, where I was a graduate student in 1955. Justlooking at this marvellous atlas immediately showed a number of interesting things thathad not been so obvious on the smaller, and less homogeneous, databases that hadpreviously been available: (1) The most luminous galaxies in clusters are 'pretty' becausethey have long well-defined spiral arms, whereas 'ugly' spirals of lower luminosity tend toexhibit short patchy arms. (2) Intrinsically faint galaxies generally have lower surfacebrightnesses than do luminous ones. (3) Galaxies in rich clusters sometimes exhibitpeculiarities, like fuzzy spiral arms, that are rare among isolated field galaxies.
In the present volume, which is based on a series of lectures given at the University ofVictoria in early 1997,1 have tried to provide an up-to-date summary of current ideas onthe morphology [morphe = shape] and classification of galaxies. I am indebted toRoberto Abraham for suggesting that I write this review. I also thank Ralf Bender, ScottTremaine and Stephen Zepf for discussions on the interpretation of the classification ofelliptical galaxies, and Guy Worthey and Masafumi Noguchi for discussion of theabundance ratio of elements to iron in normal and barred spirals. Thanks are also due tothe Kitt Peak National Observatory and to the Cerro Tololo Inter-American Observ-atory, where I obtained the 4-m plates that are shown as half-tone illustrations in thepresent volume. I am particularly grateful to Janet Currie for typing numerous drafts ofthe manuscript, to David Duncan for drawing many of the figures and to Eric LeBlanc forhelp with bibliographical searches. Finally, I would like to express my deep gratitude toRoberto Abraham, Ralf Bender and John Kormendy for their numerous and valuablecomments on the draft typescript of this book, and to copy editor Maureen Storey formany helpful suggestions.
Victoria, British Columbia, Canada S v.d. B

l Introduction
Galaxies are like people. The better you get to know them the more peculiar they oftenseem to become. Each individual galaxy may be thought of as representing a deviationfrom some underlying ideal type. 'Classical morphology is useful because it succeeds tosome extent in distinguishing galaxies which are physically different' (Kormendy 1982, p.125). It is the task of a galaxy morphologist (1) to recognize the archetype to which agalaxy belongs, and (2) to organize these archetypes of galaxies into a simple scheme thatmight eventually be interpreted in terms of galactic evolution. This review is mainlydevoted to the morphology and classification of normal galaxies, which may be regardedas objects that are in the 'ground state' (Ozernoy 1974). Galaxies in excited states, such asquasars and Seyfert galaxies, will not be discussed in detail. Furthermore no mention willbe made of purely descriptive classification systems such as those of Wolf (1908) and ofVorontsov-Velyaminov & Krasnogorskaja (1962). For a more detailed discussion of suchsystems the reader is referred to Sandage (1975). An Atlas of Peculiar Galaxies, thatappear to fall outside the range of morphological types that are usually encounteredamong galaxies, has been published by Arp (1966). The vast majority of objects picturedin Arp's atlas appear peculiar because they are interacting (or have recently interacted)with their companions. However, some objects in Arp's catalog are dwarfs that are notpeculiar at all (e.g. Atlas Nos. 2, 3, 4 and 5). Such dwarfs were probably included onlybecause late-type dwarf galaxies generally look patchier, and hence more chaotic, thanmore luminous galaxies. Furthermore such dwarfs are rare (and therefore unfamiliar tomany of us) in galaxy samples that have been selected by apparent magnitude.
For an excellent introduction to the beauty and variety of galaxy morphology thereader is referred to The Color Atlas of Galaxies (Wray 1988) which shows how dust, oldred stars, and young blue stars, are distributed in different types of galaxies.
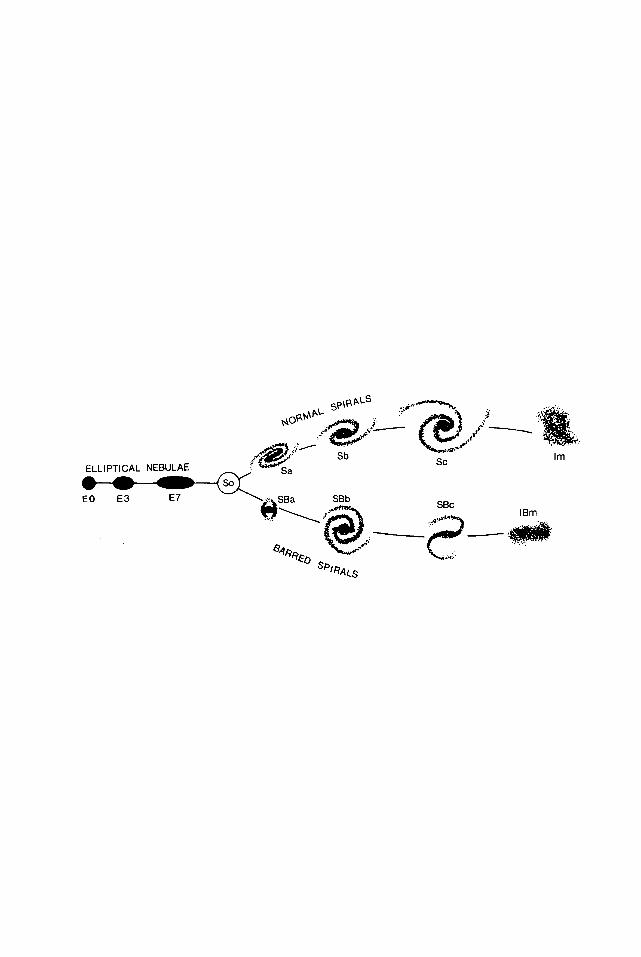
1.1 The Hubble tuning fork diagram
The first galaxy classification system to have gained more-or-less universal acceptancewas due to Hubble (1926) who arranged galaxies in his now famous 'tuning fork' diagram
Sa-Sb-Sc
/E0-E7
\SBa-SBb-Sbc
2 Introduction
Along the normal and barred spiral tines of this diagram the position of a galaxy wasdetermined by nuclear size and spiral arm tilt. The fact that the integrated colors andspectral types of galaxies exhibit a monotonic increase along the sequence E-Sa-Sb-Sc-Ir (Holmberg 1958, de Vaucouleurs 1959b, 1963) strongly suggests that the Hubblesequence is a manifestation of a deep linkage between the evolution and morphology ofgalaxies. In recognition of theoretical speculations that have long been forgotten, galaxiesof types E and Sa are referred to as 'early' and those of types Sc-Ir as 'late'. Over the past70 years the Hubble classification system has proved to be enormously useful. However,one of the few major failings of the Hubble paradigm is that it has not yet been possible toincorporate SO galaxies in an entirely satisfactory fashion. Early proposals to place the SOtype at the intersection between E, Sa and SBa galaxies (Hubble 1936, Sandage 1961,1975) have not proved to be entirely convincing because SO galaxies are typically lessluminous than either E or Sa galaxies. It is, however, quite possible that there exists asub-class of SO galaxies that are truly intermediate between ellipticals and spirals.Furthermore it appears that galaxies may approach the SO morphology from differinginitial states by moving along quite different evolutionary paths (van den Bergh 1990). Onbalance, it now seems more likely that the apparent chasm between elliptical and spiralgalaxies might, at least in part, be bridged by disk-like structures that exist within someellipticals (Kormendy & Bender 1996).
1.2 Galaxy types that do not fit into the Hubble scheme
In 1936 it was believed that the 'tuning fork' scheme described in Hubble's (1936)influential book The Realm of the Nebulae provided a complete framework for themorphological classification of normal galaxies. However, the discovery of the Sculptorand Fornax dwarf spheroidal galaxies by Shapley (1938,1939) provided the first hint thatthe Hubble tuning fork diagram did not give an exhaustive description of the entire realmof galaxy morphology. The relation between the elliptical (E) and dwarf spheroidal (dSph)classes of galaxies has remained a subject of lively controversy (Jerjen & Binggeli 1997).Kormendy (1985) and Wirth & Gallagher (1984) regarded dwarf and giant ellipticals asphysically distinct classes of objects, whereas Bingelli, Sandage & Tarenghi (1984) empha-sized the continuity between the characteristics of giant and dwarf ellipticals. However,Kormendy (1987b) argues that the effects of seeing on ground-based observations ofobjects in the distant Virgo cluster may have blurred the distinction between elliptical anddwarf spheroidal galaxies. Gorgas et al. (1997) have found some evidence which suggeststhat the Mg/Fe ratio in the brightest (dwarf) spheroidal galaxies in the Virgo cluster isnear solar. In this respect these spheroidal galaxies therefore resemble the disks ofgalaxies from SO to Sc which have solar Mg/Fe ratios (Sil'chenko 1993), whereas ellipti-cals have high Mg/Fe values. This difference suggests that either (1) star formation startedwith a bang in E galaxies, but proceeded more slowly in the disks of SO-Sc galaxies, or (2)the mass spectrum with which stars were formed in ellipticals contained a larger fractionof massive objects that produced supernovae of Types Ibc and II on a short time-scale.
The class of cD galaxies identified by Morgan provides another example of a classifica-
Modifications of the Hubble scheme
tion type that does not fit comfortably into the 1936 Hubble scheme. The fact that mostcD galaxies only occur close to the centers of rich clusters of galaxies shows that galaxymorphology, and hence galaxy evolution, may be strongly affected by environment.Another class of objects that does not appear to fit naturally within the Hubble scheme isthe amorphous (Am) galaxies (Sandage & Brucato 1979, Gallagher & Hunter 1987), someof which have also been called Ir II by Holmberg (1958). A complication is that galaxiessuch as NGC 3034 ( = M82) and NGC 3077 probably started out as objects of quitedifferent morphological types that subsequently evolved into Am galaxies by tidalcapture of large amounts of gas. Furthermore the morphological peculiarity of somegalaxies is, no doubt, due to the recent tidal capture of companions. Good examples areNGC 2685 (which Sandage (1961) refers to as 'perhaps the most peculiar galaxy in theShapley-Ames Catalog') and NGC 5128 = Centaurus A. Surprisingly, Hubble did notextend his 'tuning fork' diagram to include irregular galaxies, even though such objectsexhibit the same dichotomy that is observed among spirals. The Small Magellanic Cloudis, for example, a normal irregular whereas the Large Magellanic Cloud is a barredirregular. Also Hubble never gave an objective criterion for distinguishing very late-typespirals from irregulars. Another weakness of the Hubble system is that its classification ofelliptical galaxies along the sequence E0-E7 is a function of both the intrinsic shape ofthese objects and the direction from which they are being viewed. Van den Bergh (1976b)has noted the existence of 'anemic' spiral galaxies, which appear to be spirals that havebeen modified by the cluster environment. Furthermore it is found that galaxies in thecores of rich clusters, such as A957 (Abraham et al. 1994), do not fit comfortably into theHubble scheme, which grew mainly out of experience with classification of galaxies in thefield and in small groups. Finally, observations with the Hubble Space Telescope showthat the fraction of galaxies that fit comfortably into the Hubble system drops precipi-tously with increasing look-back time (Abraham et al. 1996a, van den Bergh et al. 1996).
1.3 Modifications of the Hubble scheme
Most modifications of the Hubble classification system (e.g. de Vaucouleurs 1959a, vanden Bergh 1960a,b,c, Elmegreen & Elmegreen 1982) have added features to the originalHubble scheme. However, Morgan (1958,1959a) devised a classification system that waseven simpler than Hubble's original scheme. He classified galaxies mainly on the basis oftheir central concentration of light. This contrasts with the Hubble system which is basedon both the central concentration of light and on the morphology of their spiral structure.Abraham et al. (1994) have shown that a one-dimensional classification system, such asthat introduced by Morgan, is particularly well suited to classification of digital imagesby computers. Furthermore, Morgan's 'Yerkes' system avoids the conflicts that occa-sionally arise between the classifications based on arm morphology and those relying oncentral concentration of light. An example of an object where such a conflict arises is thegalaxy NGC 4866 which is assigned to type Sa, even though it has a rather small core.Abraham et al. (1994) also find that Morgan's one-parameter classification system can beused to provide an adequate description of the morphologies of galaxies in very rich
4 Introduction
clusters. In such clusters the Hubble system provides little resolution because almost allgalaxies are of types E and SO.
1.4 Some historical notes
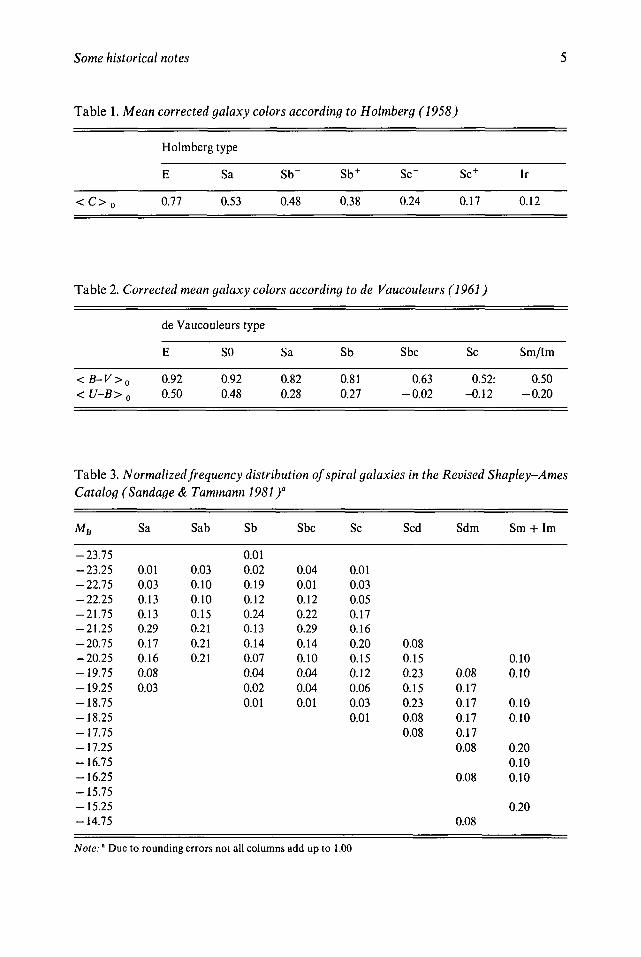
An excellent review of the early history of the classification of spiral galaxies is given inSandage (1975). In its most primitive form the presently used classification system goesback to Hubble (1926), who placed all spirals within the sequence Sa-Sb-Sc. Subsequent-ly Hubble (1936) sub-divided the 'early' end of his classification sequence by splitting classSa into SO and Sa. Later Shapley & Paraskevopoulos (1940) recognized the need tosub-divide the Sc galaxies at the 'late' end of the classification sequence into types Sc andSd. As a result the complete sequence became SO-Sa-Sb-Sc-Sd-Ir. A somewhat differentway to classify spirals was introduced by Holmberg (1958) who sub-divided the spiralsequence into stages Sa-Sb~-Sb+-Sc"-Sc+. Holmberg was able to show that theclassification types of galaxies correlate closely with their mean color indicesC = mpg — mpv. The mean colors of galaxies (corrected for internal absorption, Galacticforeground absorption and redshift) as a function of Holmberg type are given in Table 1.Note that the mean intrinsic colors of the stellar populations change smoothly from redto blue along this classification sequence. This suggests that the mean age of the stellarpopulations also changes monotonically along the Hubble classification sequence. Redearly-type galaxies are dominated by an old stellar population, whereas the light of bluelate-type galaxies is dominated by young stars.
A somewhat different way of sub-dividing the classification of disk galaxies wasproposed by de Vaucouleurs (1959a) who used the sequence Sa-Sb-Sc-Sd-Sm-Im toprovide even higher resolution at the 'late' end of the Hubble classification sequence. Inthis notation the 'm' denotes magellanic, i.e. like the Magellanic Clouds.
Inspection of the data in Table 2 shows a smooth progression between the B-FandU-B colors of galaxies (corrected for Galactic absorption, to pole-on orientation, and to aredshift of 1000 km s~ *) and classification types according to de Vaucouleurs (1961).
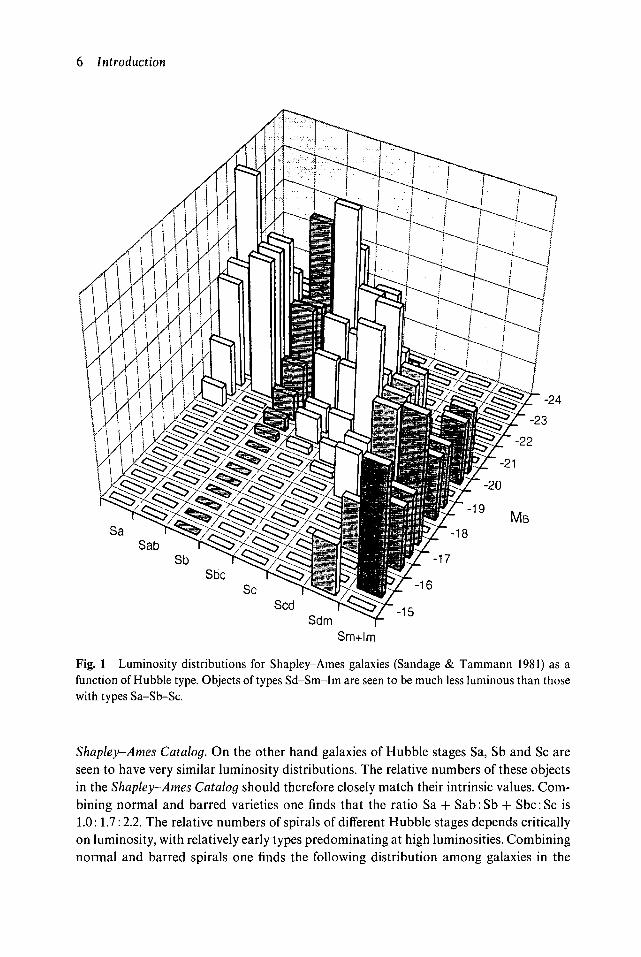
Table 3 and Figure 1 show the distribution of MB versus Hubble type (Sandage &Tammann 1981) for the galaxies in A Revised Shapley-Ames Catalog of Bright Galaxies.Figure 1 clearly shows that the galaxies of latest classification types in Sandage's modifi-cation of the Hubble classification system have systematically lower luminosities than dothose of earlier types. In other words this classification system does not clearly distinguishbetween effects on galaxy morphology that are due to Hubble type, and those that resultfrom luminosity effects. The latest type in the sequence of giant spirals occurs for objectssuch as M101 ( = NGC 5457). Supergiant Ir galaxies have not been found in the nearbyregions of the Universe.
The frequency distribution of galaxy types in the Shapley-Ames Catalog (Sandage &Tammann 1981, p. 91) is a function of both the intrinsic frequency of each type and thedistance to which objects of that particular type are bright enough to be included in thiscatalog. Very late-type objects are intrinsically fainter than galaxies assigned to earlierHubble stages. Such late-type galaxies will therefore be heavily under-represented in the
Some historical notes
Table 1. Mean corrected galaxy colors according to Holmberg (1958)
Holmberg type
E Sa
< C > 0 0.77 0.53
Sb"
0.48
Sb+
0.38
Sc~
0.24
Sc+
0.17
Ir
0.12
Table 2.
<B-V>< U-B>
Corrected mean galaxy colors according to de
de Vaucouleurs type
E
o 0.920 0.50
SO
0.920.48
Sa
0.820.28
Sb
0.810.27
Vaucouleurs
Sbc
0.63-0.02
(1961)
Sc
0.52:-0.12
Sm/Im
0.50-0.20
Table 3. Normalized frequency distribution of spiral galaxies in the Revised Shapley-AmesCatalog (Sandage & Tammann 1981)"
-23.75-23.25-22.75-22.25-21.75-21.25-20.75-20.25-19.75-19.25-18.75-18.25-17.75-17.25-16.75-16.25-15.75-15.25-14.75
Sa
0.010.030.130.130.290.170.160.080.03
Sab
0.030.100.100.150.210.210.21
Sb
0.010.020.190.120.240.130.140.070.040.020.01
Sbc
0.040.010.120.220.290.140.100.040.040.01
Sc
0.010.030.050.170.160.200.150.120.060.030.01
Scd
0.080.150.230.150.230.080.08
Sdm
0.080.170.170.170.170.08
0.08
0.08
Sm + Im
0.100.10
0.100.10
0.200.100.10
0.20
Note:" Due to rounding errors not all columns add up to 1.00
6 Introduction
-19MB
SaSab
-18
SbSbc
Sc -16
ScdSdm
-15
Sm+lm
Fig. 1 Luminosity distributions for Shapley-Ames galaxies (Sandage & Tammann 1981) as afunction of Hubble type. Objects of types Sd-Sm-Im are seen to be much less luminous than thosewith types Sa-Sb-Sc.
Shapley-Ames Catalog. On the other hand galaxies of Hubble stages Sa, Sb and Sc areseen to have very similar luminosity distributions. The relative numbers of these objectsin the Shapley-Ames Catalog should therefore closely match their intrinsic values. Com-bining normal and barred varieties one finds that the ratio Sa + Sab:Sb + Sbc:Sc is1.0:1.7:2.2. The relative numbers of spirals of different Hubble stages depends criticallyon luminosity, with relatively early types predominating at high luminosities. Combiningnormal and barred spirals one finds the following distribution among galaxies in the
Summary
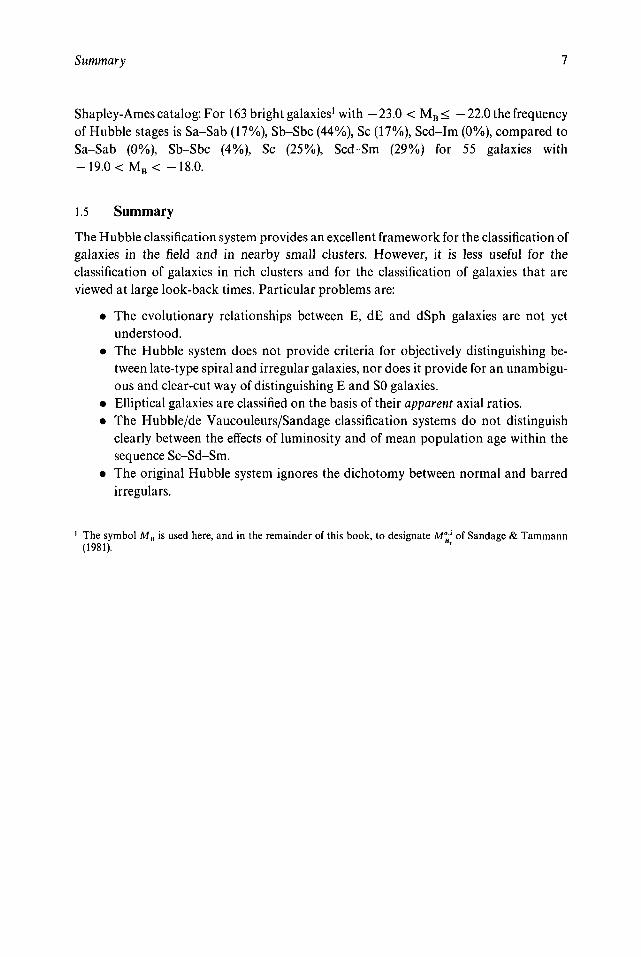
Shapley-Ames catalog: For 163 bright galaxies1 with —23.0 < MB< — 22.0 the frequencyof Hubble stages is Sa-Sab (17%), Sb-Sbc (44%), Sc (17%), Scd-Im (0%), compared toSa-Sab (0%), Sb-Sbc (4%), Sc (25%), Scd-Sm (29%) for 55 galaxies with- 1 9 . 0 < M B < -18.0.
1.5 Summary
The Hubble classification system provides an excellent framework for the classification ofgalaxies in the field and in nearby small clusters. However, it is less useful for theclassification of galaxies in rich clusters and for the classification of galaxies that areviewed at large look-back times. Particular problems are:
• The evolutionary relationships between E, dE and dSph galaxies are not yetunderstood.
• The Hubble system does not provide criteria for objectively distinguishing be-tween late-type spiral and irregular galaxies, nor does it provide for an unambigu-ous and clear-cut way of distinguishing E and SO galaxies.
• Elliptical galaxies are classified on the basis of their apparent axial ratios.• The Hubble/de Vaucouleurs/Sandage classification systems do not distinguish
clearly between the effects of luminosity and of mean population age within thesequence Sc-Sd-Sm.
• The original Hubble system ignores the dichotomy between normal and barredirregulars.
1 The symbol MB is used here, and in the remainder of this book, to designate M° ' of Sandage & Tammann(1981).

2 The Hubble classification system
2.1 The Hubble tuning fork diagram
The Hubble classification system recognizes three form families: ellipticals (E), spirals (S)and irregulars (Ir). The ellipticals are assigned an ellipticity e defined as e = 10(a — b)/a,in which a and b are the major and minor image diameters, respectively. Classificationtypes for ellipticals range from EO, for objects that appear circular in projection, to E7 forthe most highly flattened ellipticals. Spiral galaxies occur in two flavors - normal spirals(S), and barred spirals (SB). Within each of these there are three stages: Early-type galaxiesof stage Sa/SBa have large nuclei and tightly coiled (and usually rather smooth) arms,objects in stage Sb/SBb have a more open spiral structure, and smaller central bulges.Late-type galaxies in stage Sc/SBc have small nuclear bulges and exhibit wide-open andrather patchy spiral arms. Finally, irregular galaxies have a patchy structure and exhibitno spiral arms. The original Hubble (1926) classification scheme was modified by Hubble(1936) who introduced a class of lenticular (SO) galaxies to span the chasm between spiraland elliptical galaxies (see Figure 2). The Hubble classification system is described andrichly illustrated in The Hubble Atlas of Galaxies (Sandage 1961). Classifications for 1246bright galaxies are given in A Revised Shapley-Ames Catalog of Bright Galaxies bySandage & Tammann (1981). The Hubble/Sandage classification system reaches itsultimate form in The Carnegie Atlas of Galaxies (Sandage & Bedke 1994). An atlas ofhighly resolved late-type galaxy images, useful for measurement of the cosmologicaldistance scale, has also been published by Sandage & Bedke (1988). It is important to notethat the Hubble classification scheme for spiral galaxies is based on both their centralconcentration of light and on the morphology of their spiral arms.
2.2 Spiral arm morphology
Shortly after Hubble (1926) published his classification system Reynolds (1927) com-mented that '[Hubble's] classification of spirals seems to me to be altogether too simplefor the great range of types found . . .. No classification would be complete unlessdevelopment of the spiral form itself were taken into consideration'. Attempts to carry outsuch a more detailed classification of spiral arms were subsequently made by van denBergh (1960a,b,c) and by Elmegreen & Elmegreen (1982,1987).
As one progresses to later Hubble types along the sequence Sa-Sb—Sc-Sd the spiralarms become progressively patchier and more dominated by OB associations and H II
10 The Hubble classification system
EO - E 7 ;
EO - E7 ;
E(boxy) - E(disky) ;
^ S a -
-"SBa -
(Hubble
, S 0 "
^ SBO -
(Hubble
, S 0 "
^ SBO -
- Sb
- SBb
1926)
- Sa
- SBa
1936)
- Sa
- SBa
(Ca. 1997)
- Sc
- SBc
- Sb
- SBb
- Sb
- SBb
- Sc
- SBc
- Sc - Im
- SBc - IBm
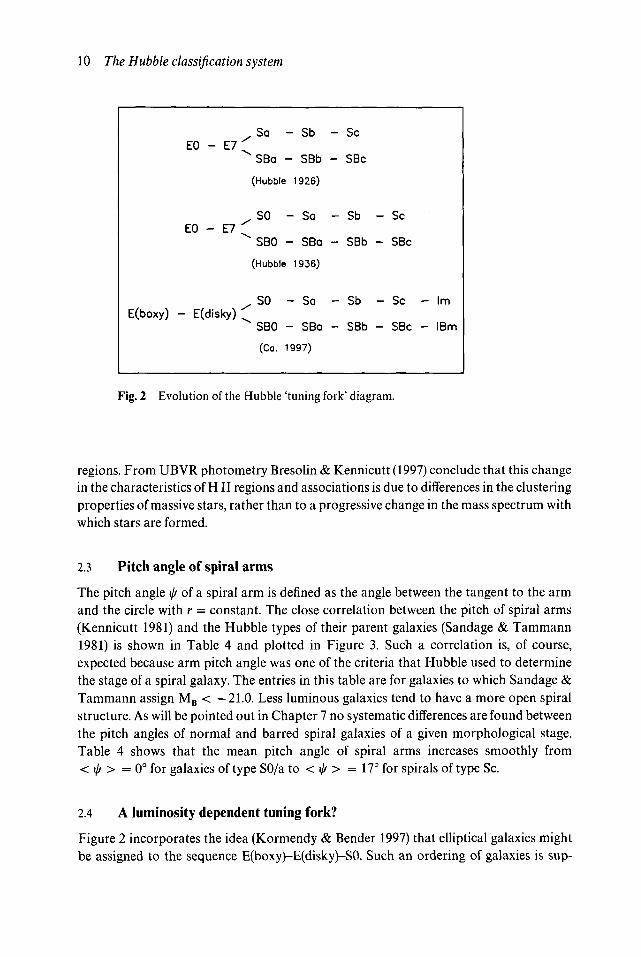
Fig. 2 Evolution of the Hubble 'tuning fork' diagram.
regions. From UBVR photometry Bresolin & Kennicutt (1997) conclude that this changein the characteristics of HII regions and associations is due to differences in the clusteringproperties of massive stars, rather than to a progressive change in the mass spectrum withwhich stars are formed.
2.3 Pitch angle of spiral arms
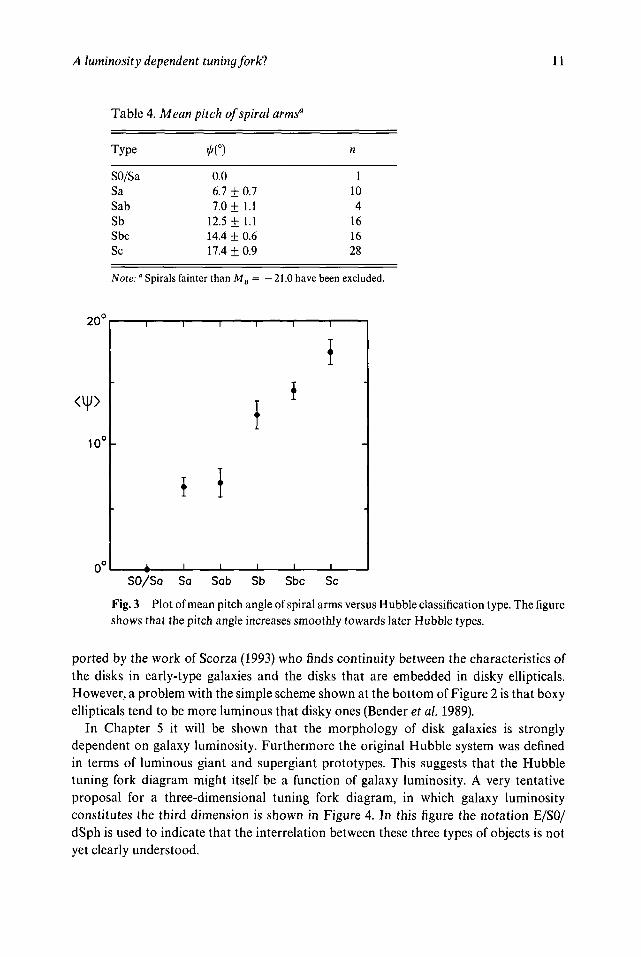
The pitch angle \j/ of a spiral arm is defined as the angle between the tangent to the armand the circle with r = constant. The close correlation between the pitch of spiral arms(Kennicutt 1981) and the Hubble types of their parent galaxies (Sandage & Tammann1981) is shown in Table 4 and plotted in Figure 3. Such a correlation is, of course,expected because arm pitch angle was one of the criteria that Hubble used to determinethe stage of a spiral galaxy. The entries in this table are for galaxies to which Sandage &Tammann assign MB < —21.0. Less luminous galaxies tend to have a more open spiralstructure. As will be pointed out in Chapter 7 no systematic differences are found betweenthe pitch angles of normal and barred spiral galaxies of a given morphological stage.Table 4 shows that the mean pitch angle of spiral arms increases smoothly from< if/ > = 0° for galaxies of type SO/a to < \j/ > = 17° for spirals of type Sc.
2.4 A luminosity dependent tuning fork?
Figure 2 incorporates the idea (Kormendy & Bender 1997) that elliptical galaxies mightbe assigned to the sequence E(boxy)-E(disky)-S0. Such an ordering of galaxies is sup-
A luminosity dependent tuning fork! 11
Table 4. Mean pitch of spiral arms"
20'
Type
SO/SaSaSabSbSbcSc
Note:"
•AO0.06.7 + 0.77.0+ 1.1
12.5 + 1.114.4 + 0.617.4 + 0.9
Spirals fainter than MB =
n
1104
161628
— 21.0 have been excluded.
1CT
I I
I \
-4-SO/Sa Sa Sab Sb Sbc Sc
Fig. 3 Plot of mean pitch angle of spiral arms versus Hubble classification type. The figureshows that the pitch angle increases smoothly towards later Hubble types.
ported by the work of Scorza (1993) who finds continuity between the characteristics ofthe disks in early-type galaxies and the disks that are embedded in disky ellipticals.However, a problem with the simple scheme shown at the bottom of Figure 2 is that boxyellipticals tend to be more luminous that disky ones (Bender et al. 1989).
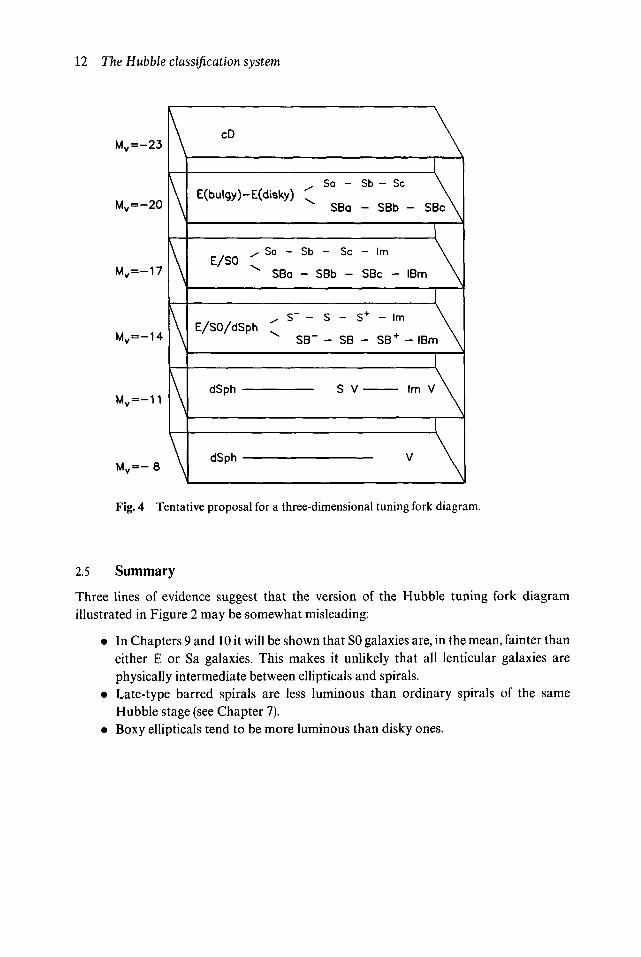
In Chapter 5 it will be shown that the morphology of disk galaxies is stronglydependent on galaxy luminosity. Furthermore the original Hubble system was definedin terms of luminous giant and supergiant prototypes. This suggests that the Hubbletuning fork diagram might itself be a function of galaxy luminosity. A very tentativeproposal for a three-dimensional tuning fork diagram, in which galaxy luminosityconstitutes the third dimension is shown in Figure 4. In this figure the notation E/S0/dSph is used to indicate that the interrelation between these three types of objects is notyet clearly understood.
12 The Hubble classification system
Mv=-23
Mv=-20
Mv=-17
Mv=-14
Mv=-11
M v =-8
\
\
\
\
\
\
cD
E(bulgy)-E(disky)
E/SO - S° "SBa
E/SO/dSph ^
(JQi-th
i-C'nh
Sb
SB"
Sa -
SBa
- Sc
SBb -
S -
" - SB
S V
Sb - Sc
- SBb
- Im
SBc -
S+ - Im
- SB +
\
- SBc\
IBm
- IBrr
Im V
V
\
\
\
\
\
\
Fig. 4 Tentative proposal for a three-dimensional tuning fork diagram.
2.5 Summary
Three lines of evidence suggest that the version of the Hubble tuning fork diagramillustrated in Figure 2 may be somewhat misleading:
• In Chapters 9 and 10 it will be shown that SO galaxies are, in the mean, fainter thaneither E or Sa galaxies. This makes it unlikely that all lenticular galaxies arephysically intermediate between ellipticals and spirals.
• Late-type barred spirals are less luminous than ordinary spirals of the sameHubble stage (see Chapter 7).
• Boxy ellipticals tend to be more luminous than disky ones.
3 De Vaucouleurs' system
3.1 Description of the system
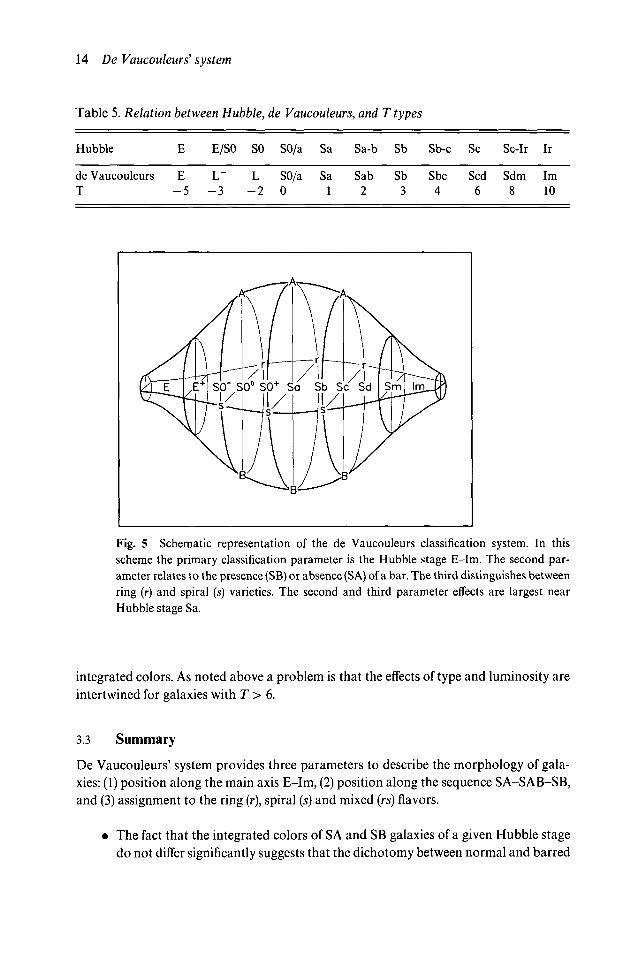
In an attempt to accommodate the entire range of morphological characteristics ofgalaxies de Vaucouleurs (1959a) introduced a three-dimensional classification schemewhich is illustrated in Figure 5. The main axis of this classification system is the sequenceE-SO-Sa-Sb-Sc-Sd-Sm-Im, where the index m refers to magellanic, i.e. resembling theMagellanic clouds. Finer sub-divisions may be provided by distinguishing between E, E + ,S0~, SO, and S0+, in which the minus superscript denotes early (= smooth) and the plussuperscript indicates late ( = patchy). In Figure 5 the second dimension is, as in theHubble tuning fork diagram, provided by differentiating between galaxies with no bars(SA), those with weak bars (SAB) and those with strong bars (SB). Finally a thirddimension is provided by distinguishing between objects that exhibit rings r, intermediatefeatures rs and pure spiral arms s. De Vaucouleurs (1959a) notes that the distinctionbetween his A and B families and between his r and s varieties is most clearly marked atthe transition stage SO/a and vanishes between E and SO, and between Sm and Im. Theposition of a galaxy along the main axis from E to Im in Figure 5 correlates strongly withintegrated color, and hence with the mean age of the stellar population. The A and Bfamilies do not differ systematically in color and hence, presumably, contain populationsof comparable ages. However, as will be noted in Chapter 7, there is a systematicdifference between the luminosity distributions of late-type barred and ordinary spirals.At a given Hubble stage there appear to be no systematic luminosity differences betweengalaxies of the r and s varieties. The r and s varieties occur with comparable frequenciesamong early-type spirals. However, objects of the s variety vastly outnumber those of ther variety in late-type spirals.
A problem with the classification scheme proposed by de Vaucouleurs is (see Table 3and Figure 1) that galaxies simultaneously become fainter and bluer along the sequenceSc-Sd-Sm, i.e. luminosity effects are intertwined with evolutionary effects.
3.2 De Vaucouleurs'T system
The main axis of de Vaucouleur's classification system, which extends from E to Im, maybe represented by his T parameter. This parameter (de Vaucouleurs, de Vaucouleurs &Corwin 1976) is defined in Table 5. The lvalues of galaxies correlate strongly with their
14 De Vaucouleurs' system
Table 5. Relation
Hubble
de VaucouleursT
between Hubble,
E
E- 5
E/SO SO
L" L- 3 - 2
de Vaucouleurs, and
SO/a
SO/a0
Sa
Sa1
Sa-b
Sab2
T types
Sb
Sb3
Sb-c
Sbc4
Sc
Scd6
Sc-Ir
Sdm8
Ir
Im10
Fig. 5 Schematic representation of the de Vaucouleurs classification system. In thisscheme the primary classification parameter is the Hubble stage E-Im. The second par-ameter relates to the presence (SB) or absence (SA) of a bar. The third distinguishes betweenring (r) and spiral (5) varieties. The second and third parameter effects are largest nearHubble stage Sa.
integrated colors. As noted above a problem is that the effects of type and luminosity areintertwined for galaxies with T > 6.
3.3 Summary
De Vaucouleurs' system provides three parameters to describe the morphology of gala-xies: (1) position along the main axis E-Im, (2) position along the sequence SA-SAB-SB,and (3) assignment to the ring (r), spiral (s) and mixed (rs) flavors.
• The fact that the integrated colors of SA and SB galaxies of a given Hubble stagedo not differ significantly suggests that the dichotomy between normal and barred
Summary 15
spirals may not be based on profound physical differences that directly affect theirstellar populations.It appears that the r and s dichotomy represents only an ephemeral change inmorphology, which is possibly due to differences in density wave pattern speed.A problem with de Vaucouleurs' scheme is that galaxies simultaneously becomefainter and bluer along the sequence Sc-Sd-Sm, i.e. luminosity effects and evol-utionary effects are projected onto a single classification parameter.

4 Elmegreen's classification ofspiral arms
4.1 Observations of spiral arm types
From inspection of photographs of spiral galaxies Reynolds (1925) noted that somegalaxies had 'massive' arms, whereas others exhibited 'filamentous' spiral structure.Another early attempt to classify galaxies on the basis of arm morphology was made byDanver (1942). More recently Elmegreen & Elmegreen (1982, 1987) have devised atwelve-stage classification system for spiral arms. These classifications range from Type 1'flocculent' arms, which are ragged, patchy, or chaotic to Type 12 'grand design' arms,which are long, symmetrical, sharply denned, and dominate the appearance of the spiralgalaxy in which they occur. After excluding barred spirals Elmegreen & Elmegreen (1982)find that 32 + 10% of isolated objects exhibit well-developed spiral structure, comparedto 67 + 6% of members of binary pairs or groups. These results show that the formationof 'grand design' spiral structure is strongly favored by tidal interactions. Not unex-pectedly Elmegreen & Elmegreen find a significant correlation between their spiral armclassification types and the luminosity classes of van den Bergh (1960a,b,c). Galaxies withpatchy, fragmentary arms of Type 1 are all of low luminosity, whereas spirals with granddesign spiral arms of Type 12 are, without exception, objects of high luminosity. The factthat spirals with very late Hubble types (Sd, Sdm, Sm) all have chaotic fragmentary armsof Types 1 and 2 is, no doubt, due to the low intrinsic luminosities of many very late-typespirals. These results strongly suggest that Elmegreen & Elmegreen's galactic arm mor-phology differences are produced by effects that depend on both galaxy luminosity andsome other factor. Table 6 shows the frequency distribution of Elmegreen & Elmegreen(1982) spiral arm type classifications versus the Hubble stages from Sandage & Tammann(1981). Over the Hubble type range Sa-Sc the table shows no obvious relationshipbetween arm type and parent galaxy Hubble stage. In particular, a Kolmogorov-Smirnov test shows no significant difference between the frequency of different arm typesamong spirals of Hubble stages Sa and Sc. In other words Hubble stage and arm typeappear to be unrelated (and hence orthogonal) classification parameters over the rangeSa-Sb-Sc. Thornley (1996) has noted that a small number of flocculent spirals exhibit'grand design' spiral arms in K' (2.1 /an) images. Kormendy (1982, p. 142) suspects thatflocculent spirals contain fewer massive young stars than do 'grand design' spiral armsproduced by density waves.
Fourier analysis (Elmegreen, Elmegreen & Montenegro 1992) shows that many gala-xies exhibit an m = 3 component in addition to the m = 2 component that is so dominant
18 Elmegreen's classification of spiral arms
Table 6. Elmegreen's arm classification versus parent galaxy type
Type
1-34-67-910-12
Sa
1413
Sab
1211
Sb
4653
Sbc
11114
Sc
16254
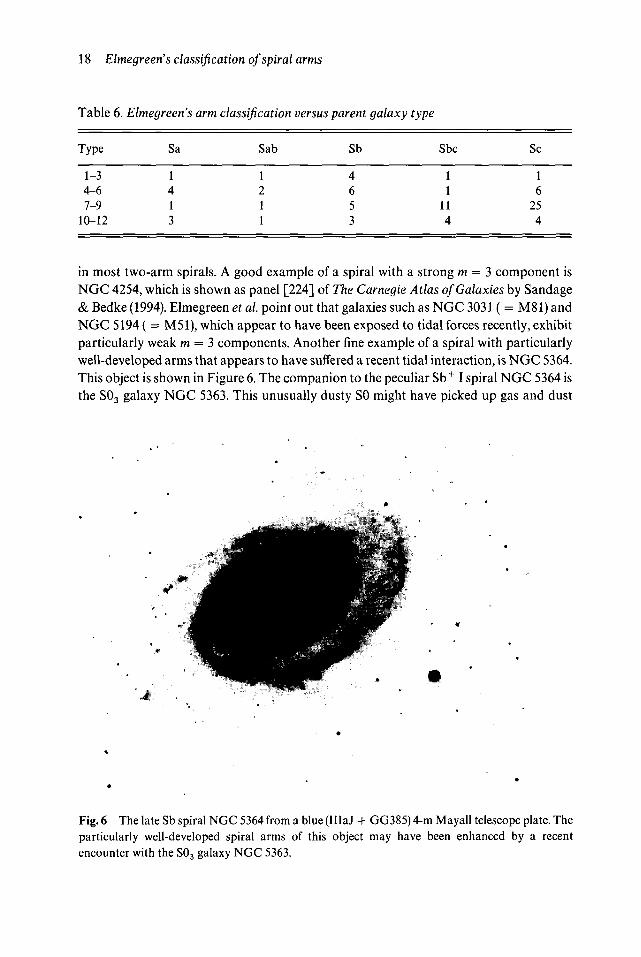
in most two-arm spirals. A good example of a spiral with a strong m = 3 component isNGC 4254, which is shown as panel [224] of The Carnegie Atlas of Galaxies by Sandage& Bedke (1994). Elmegreen et al. point out that galaxies such as NGC 3031 ( = M81) andNGC 5194 ( = M51), which appear to have been exposed to tidal forces recently, exhibitparticularly weak m = 3 components. Another fine example of a spiral with particularlywell-developed arms that appears to have suffered a recent tidal interaction, is NGC 5364.This object is shown in Figure 6. The companion to the peculiar Sb + I spiral NGC 5364 isthe S03 galaxy NGC 5363. This unusually dusty SO might have picked up gas and dust
Fig. 6 The late Sb spiral NGC 5364 from a blue (IllaJ + GG385) 4-m Mayall telescope plate. Theparticularly well-developed spiral arms of this object may have been enhanced by a recentencounter with the S03 galaxy NGC 5363.
Theory of spiral arms 19
during a close tidal encounter with NGC 5364. Holmberg (1958) assigned NGC 5363 tohis Ir II class, which comprises non-magellanic irregular galaxies. A second close physicalcompanion to NGC 5364 is NGC 5360, which according to Krienke & Hodge (1974), isalso an Ir II galaxy. In this respect the NGC 5364 group resembles the M81 group whichalso contains two Ir II galaxies: M82 ( = NGC 3034) and NGC 3077. Krienke & Hodgedivide the Ir II class into 'dusty' and 'explosive' sub-groups. The proto-type of the dustysub-group of Ir II galaxies is NGC 5195, which is the companion of the Whirlpool nebulaM51 ( = NGC 5194). Among the explosive sub-type of Ir II galaxies Krienke & Hodgerecognize three sub-classes: (1) E/SO-like [NGC 3077], (2) spiral-like [M82 = NGC 3034]and (3) tidally interacting [NGC 520].
Reshetnikov & Combes (1996) find that the mean ratio of scale-height z0 to radialscale-length r0 is about twice as large in interacting edge-on galaxies as it is in isolatedobjects. This clearly shows that galaxy interactions can thicken stellar disks. Since the HIgas layer in spiral galaxies is usually thinner than the stellar disk one expects starformation eventually (i.e. over a period of a few Gyr) to reduce the ratio of verticalscale-height to radial scale-length.
4.2 Theory of spiral arms
Lin & Shu (1964) first showed that spiral structure in galactic disks can be explained interms of density waves that rotate with a pattern speed which is slower than the rotationspeed of the underlying galaxy. The formation of such density waves can be triggered bygravitational perturbations, such as those produced by an orbiting companion or acentral bar. Interstellar gas in the disk of a galaxy will be strongly compressed by theslight density variations of the stellar spiral structure. This is so because the gas flowrelative to the spiral arms is supersonic. This compression produces small-scale gravi-tational instabilities that can lead to a high rate of star formation.
Additional theoretical insight into problems of spiral arm formation was provided byRoberts, Roberts & Shu (1975). These authors found that the morphology of spiralstructure can be understood in terms of two fundamental galactic parameters: (1) the totalmass of a galaxy divided by a characteristic dimension, and (2) the degree of massconcentration toward the galactic center. They showed that these two parameters deter-mine both the strength of galactic shocks in the interstellar gas, and the geometry of thespiral wave pattern. In other words one would expect the morphology of isolated galaxiesto be determined by (1) their total mass, and (2) by their central mass concentration. Theseparameters are closely correlated with total luminosity and Yerkes concentration class.On the picture proposed by Roberts et al. (1975) galaxies of Yerkes class k, which have ahigh central concentration of light, are expected to show a tightly coiled spiral patternwith small pitch angles. Conversely one would predict objects of low central concentra-tion, which are assigned to Yerkes class a, to exhibit wide-open spiral structure and largepitch angles. Wakamatsu (1976) has also found that the centrifugal force at the peak of therotation curve, which is proportional to Kmax
2/Rmax, increases with a rising bulge/diskluminosity ratio. Kormendy & Norman (1979) show that global spiral patterns are either
20 Elmegreen's classification of spiral arms
maintained by nearly solid-body rotation throughout the region which exhibit the spiralpattern, or they are driven by a bar or a nearby companion.
Strom (1980) has emphasized that the critical parameter determining the degree ofcompression of gas in a spiral arm is Wn, the velocity of the gas normal to the spiral arm. IfWa »a, in which a is the acoustic speed (which is typically ~8 km s"1), then starformation should proceed vigorously along the arm. For Wa < a the compression is weakand the pattern of star formation is expected to be ill denned. Under such conditions(Gerola & Seiden 1978) flocculent spiral arms might be produced by self-propagating starformation.
4.3 Dwarf spirals
As one proceeds to disk systems of ever lower luminosity the compression in spiral armswill eventually become so low that spiral structure is no longer generated. One thereforeexpects the fraction of all disk systems that are spirals to shrink with decreasing luminos-ity (mass). This expectation is confirmed by the data on Shapley-Ames galaxies in Table 3and Figure 1 which show that most disk galaxies brighter than MB = —17.5 are spirals oftypes Sa-Scd, whereas those fainter than this are mainly of types Sm and Im. From thesurvey of dwarf galaxies on the Palomar Sky Survey (van den Bergh (1966) and Table 7)one finds that this trend continues towards fainter luminosities. In van den Bergh'sluminosity class IV-V spirals and irregulars occur with equal frequency, whereas inluminosity class V irregulars out-number spirals by almost two to one. The claim bySchombert et al. (1995) to have discovered dwarf spirals is spurious, since such galaxieswere first mentioned by Reaves (1956) and constitute about half of the objects listed in thecatalogs of dwarf galaxies by van den Bergh (1959, 1966). Furthermore Baade (1963,p. 225) concluded that NGC 2366, which has MB = —16.7, was 'probably not an irregularbut an Sc'. In any case the six objects discussed by Schombert et al. have—17.0 < Mv < —16.0 which, strictly speaking, makes them sub-giants (luminosity classIV) rather than dwarfs (luminosity class V). The galaxies discussed by Schombert et al.(1995) have moderately dense core regions. In this respect they do not differ from some ofthe S/SB IV galaxies in the field (van den Bergh 1960c) and in the Virgo region (van denBergh, Pierce & Tully 1990).
4.4 Pitch angles of spiral arms
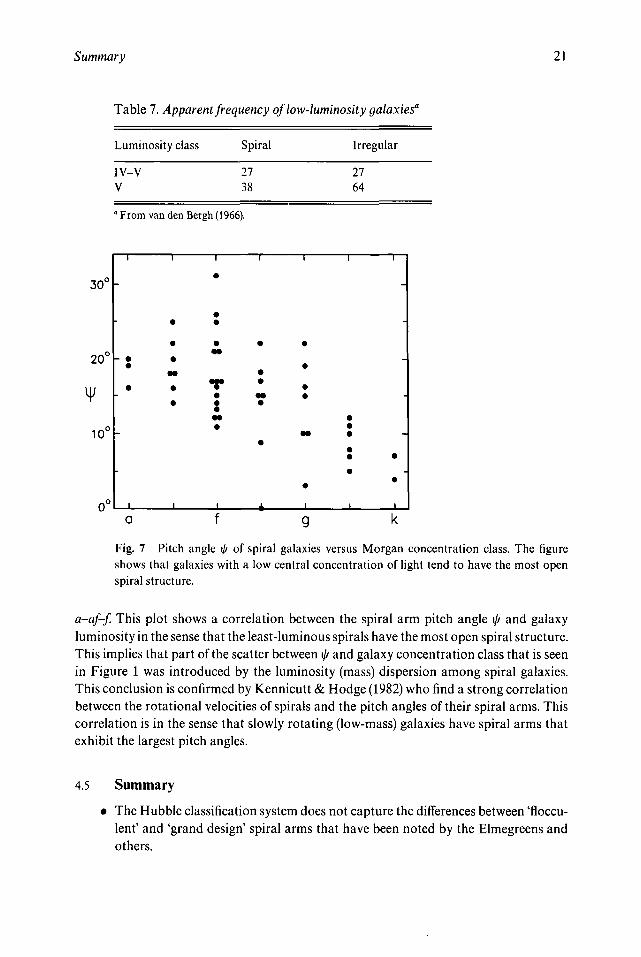
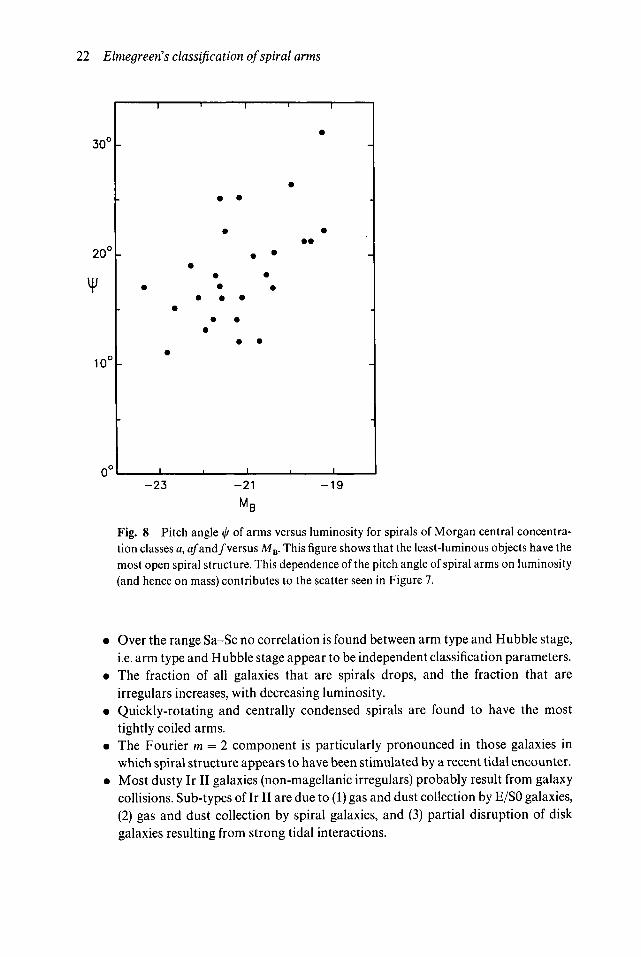
Figure 7 shows a plot of the pitch angle ip (Kennicutt 1981) of spiral galaxies in A RevisedShapley-Ames Catalog of Bright Galaxies (Sandage & Tammann 1981) versus theircentral concentration of light (Morgan 1959a). (Pitch angles published by Danver (1942)were not used because of evidence (Kennicutt 1981) which suggests that he erred inconnecting unrelated arm segments into single arms). Figure 7 shows a loose correlation,in the sense that the most centrally concentrated spirals have the most tightly coiled spiralstructure. Figure 8 shows a plot of pitch angle i// versus absolute magnitude MB (takenfrom Sandage & Tammann 1981) for spirals with Morgan (1959a) concentration classes
Summary 21
Table 7. Apparent frequency of low-luminosity galaxies"
Luminosity class
IV-VV
Spiral
2738
" From van den Bergh (1966).
Irregular
2764
20
10
a f g k
Fig. 7 Pitch angle \\i of spiral galaxies versus Morgan concentration class. The figureshows that galaxies with a low central concentration of light tend to have the most openspiral structure.
a-af-f. This plot shows a correlation between the spiral arm pitch angle i// and galaxyluminosity in the sense that the least-luminous spirals have the most open spiral structure.This implies that part of the scatter between \\i and galaxy concentration class that is seenin Figure 1 was introduced by the luminosity (mass) dispersion among spiral galaxies.This conclusion is confirmed by Kennicutt & Hodge (1982) who find a strong correlationbetween the rotational velocities of spirals and the pitch angles of their spiral arms. Thiscorrelation is in the sense that slowly rotating (low-mass) galaxies have spiral arms thatexhibit the largest pitch angles.
4.5 Summary
• The Hubble classification system does not capture the differences between 'floccu-lent' and 'grand design' spiral arms that have been noted by the Elmegreens andothers.
22 Elmegreen's classification of spiral arms
Fig. 8 Pitch angle i/' of arms versus luminosity for spirals of Morgan central concentra-tion classes a, a/and/versus MB. This figure shows that the least-luminous objects have themost open spiral structure. This dependence of the pitch angle of spiral arms on luminosity(and hence on mass) contributes to the scatter seen in Figure 7.
Over the range Sa-Sc no correlation is found between arm type and Hubble stage,i.e. arm type and Hubble stage appear to be independent classification parameters.The fraction of all galaxies that are spirals drops, and the fraction that areirregulars increases, with decreasing luminosity.Quickly-rotating and centrally condensed spirals are found to have the mosttightly coiled arms.The Fourier m = 2 component is particularly pronounced in those galaxies inwhich spiral structure appears to have been stimulated by a recent tidal encounter.Most dusty Ir II galaxies (non-magellanic irregulars) probably result from galaxycollisions. Sub-types of Ir II are due to (1) gas and dust collection by E/SO galaxies,(2) gas and dust collection by spiral galaxies, and (3) partial disruption of diskgalaxies resulting from strong tidal interactions.
5 Van den Bergh's classification ofgalaxies
5.1 Luminosity effects on morphology
From a study of galaxies in the Virgo cluster Holmberg (1958, p. 69) noted that giantgalaxies have a higher surface brightness than dwarfs. When the prints of the PalomarSky Survey first became available in the late 1950s it was immediately obvious that thislarge, and very uniform, database of galaxy images enabled one to segregate low-luminosity dwarfs from the much more numerous galaxies of average luminosity. Basedon inspection of the prints of the Palomar Sky Survey, van den Bergh (1959, 1966) wasable to compile catalogs of 243 DDO dwarf galaxies north of 5 = —27°. The entries inthese catalogs showed that the distribution of such dwarfs on the sky is broadly similar tothat of nearby giant galaxies. This conclusion was confirmed for Virgo dwarfs by Reaves(1956, 1967). Furthermore, observations in the Local Group clearly show that dwarfscluster around giants. Van den Bergh's data also showed that (1) the fraction of allgalaxies classified as irregular increases dramatically with decreasing luminosity, and (2)the fraction of all spirals that are barred is much lower among giants than it is amongdwarfs. In a subsequent study van den Bergh (1960a,b,c) was able to show that both thesurface brightnesses of spiral galaxies and their morphologies are functions of luminosity.Supergiant spirals were found to have long and well-developed 'grand design' spiralarms, whereas low-luminosity spirals tend to have poorly developed 'scraggily' spiralarms.
5.2 The David Dunlap Observatory (DDO) system
By analogy with the system of stellar luminosity classification (Johnson & Morgan 1953)spiral galaxies were assigned to luminosity classes I (supergiants), II ( bright giants), III(giants), IV (sub-giants) and V (dwarfs). Perhaps because the fraction of all galaxies thatare irregular drops precipitously with increasing luminosity, there are no nearbyexamples of irregular galaxies of luminosity classes I and II. In actual practice, classifica-tions of galaxies are made by comparisons with the standards illustrated in van den Bergh(1960a,b). The DDO luminosity classification system can be regarded as being defined bythe classifications of northern Shapley-Ames galaxies listed in van den Bergh (1960c). Theprimary luminosity standards of the DDO system are listed below. Numbers in squarebrackets refer to the panel on which this object is shown in The Carnegie Atlas of Galaxies(Sandage & Bedke 1994):
24 Van den Bergh's classification of galaxies
Sb"Sb"Sb'S"S"
sv
IIIIII
IVIV-V
NGC 2841 [142]NGC 3675 [139]NGC 4064 [313]NGC 247 [285]NGC 45 [314]DDO 122 [ ]
Sb+ISb+ IISb+ III
NGC 5371NGC 5055NGC 4586
[126][191][76]
ScScSc
IIIIII
NGCNGCNGC
432131842403
[213][237][273]
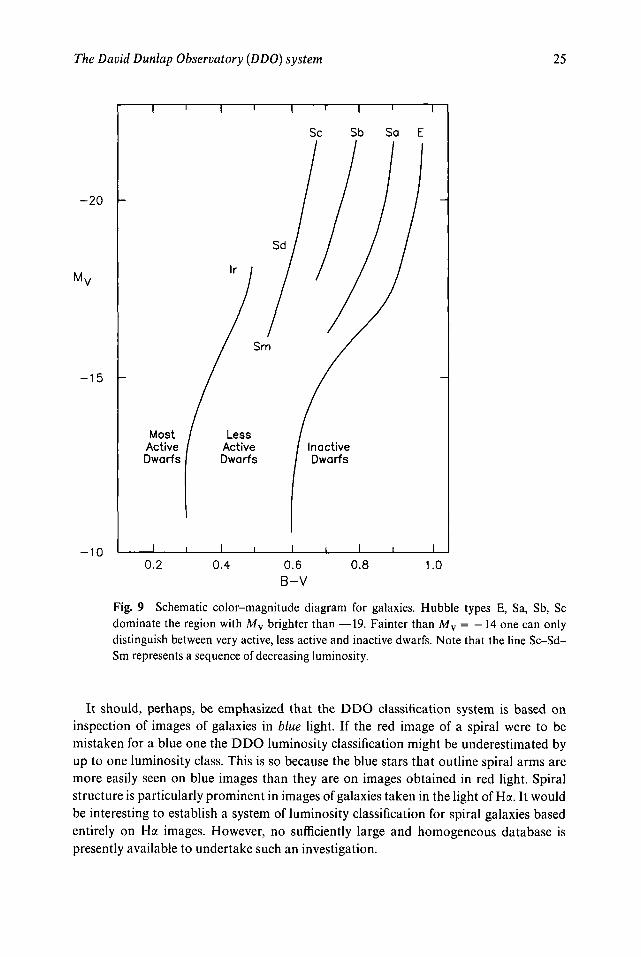
The Hubble stage assignments Sa, Sab, Sb, Sbc and Sc are only applicable to giant,bright giant and supergiant spirals. (Shapley's classification stage Sd was not used in theDDO classification system.) For sub-giants it is only possible to assign types S~ (early), S(intermediate) and S+ (late) in which 'early' denotes spirals with a smooth structure and'late' refers to highly resolved objects. Finally in class V no differentiation between earlyand late sub-types is possible. On the prints of the Palomar Sky Survey it is not evenpossible to distinguish spirals and irregulars among the least luminous objects of lumin-osity class V (van den Bergh 1966). A schematic diagram showing the distribution ofgalaxy classification types in a color-magnitude diagram is shown in Figure 9. This figureshows the following: (1) For the objects with the lowest luminosities (Mv > —14) one canonly distinguish between (a) inactive dwarfs, such as the Ursa Minor dwarf spheroidal(dSph) system, (b) dwarfs exhibiting a low level of star forming activity like the dSph/dlrPhoenix system, and (c) active dwarfs, such as the dlr galaxy DDO 210. Among theinactive dwarfs there are some (Draco) that only contain very old stars, whereas others(Carina) were still forming some stars only a few Gyr ago. (2) At intermediate luminosities(Mv ~ —16) there are objects like (a) M32 (E2) which exhibit no present star formationactivity, (b) NGC 205 (S0/E5 pec) that contain a relatively small fraction of recentlyformed stars, and (c) the Small Magellanic Cloud (Ir IV-V) which is presently in an activephase of star formation in which the integrated light is dominated by young stars. (3) Thevast majority of luminous galaxies with Mv < —19 outside of rich clusters fit comfort-ably into the E, Sa, Sb and Sc classes defined by Hubble (1926,1936). This is so becauseHubble's classification scheme was almost entirely defined by supergiant standards.
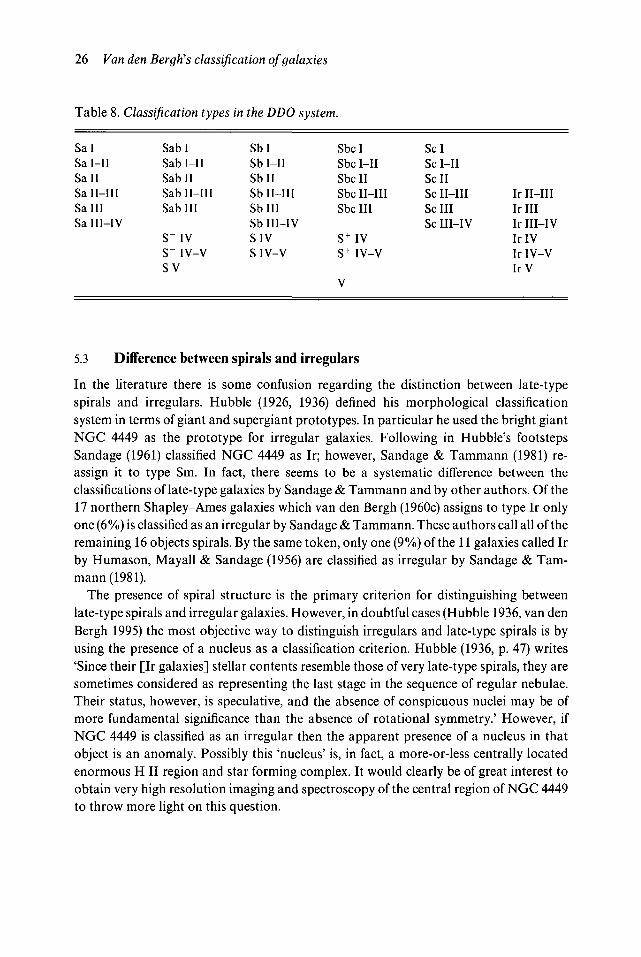
In the DDO system intermediate luminosity classes I—II, II—III, III-IV and IV-V arealso recognized. It should, however, be noted that the intrinsic errors of classification,which are of order 0.4-0.7 mag, are such that the distinction between say II and II—IIImay not always be physically significant. The matrix of DDO types is shown in Table 8. Aluminosity classification system very similar to that given above was adopted by Sandageand Tammann (1981). In the DDO system the presence of a strong bar is indicated by a B,and that of a weak bar by (B). The DDO types S, S(B) and SB correspond to the types SA,SAB and SB, respectively, of de Vaucouleurs (1959a). Patchy arms are denoted by * andsmooth arms by n. Extreme cases of smooth armed objects are called 'anemic' by van denBergh (1976b). For example, a galaxy of DDO type S(B)c* I is a supergiant of stage Scexhibiting a mild bar-like structure and patchy spiral arms. On the other hand a galaxy oftype Sbn III is a pure spiral giant of Hubble stage Sb that exhibits smooth spiral arms.Tidal distortions are indicated by a t. Extreme cases of the *, n and t phenomena aredenoted by **, nn and t\
The David Dunlap Observatory (DDO) system 25
- 2 0
- 1 5
- 1 0
MostActiveDwarfs
LessActiveDwarfs
InactiveDwarfs
0.2 0.4 0.6B-V
0.8 1.0
Fig. 9 Schematic color-magnitude diagram for galaxies. Hubble types E, Sa, Sb, Scdominate the region with Mv brighter than —19. Fainter than Mv = —14 one can onlydistinguish between very active, less active and inactive dwarfs. Note that the line Sc-Sd-Sm represents a sequence of decreasing luminosity.
It should, perhaps, be emphasized that the DDO classification system is based oninspection of images of galaxies in blue light. If the red image of a spiral were to bemistaken for a blue one the DDO luminosity classification might be underestimated byup to one luminosity class. This is so because the blue stars that outline spiral arms aremore easily seen on blue images than they are on images obtained in red light. Spiralstructure is particularly prominent in images of galaxies taken in the light of Ha. It wouldbe interesting to establish a system of luminosity classification for spiral galaxies basedentirely on Ha images. However, no sufficiently large and homogeneous database ispresently available to undertake such an investigation.
26 Van den Bergh's classification of galaxies
Table 8. Classification types in the DDO system.
SalSal-IISailSa II-IIISaHISa III-IV
Sab ISab I-IISab IISab II-IIISab III
S"IVS"IV-VSV
SblSb I-IISbllSb II-IIISbUISb III-IVSIVSIV-V
Sbc ISbc I-IISbc IISbc II-IIISbc III
S+IVS+IV-V
V
SclSc I-IISellSc II-IIIScHISc III-IV
IrII-IIIIr IIIIr III-IVIrlVIr IV-VIrV
5.3 Difference between spirals and irregulars
In the literature there is some confusion regarding the distinction between late-typespirals and irregulars. Hubble (1926, 1936) defined his morphological classificationsystem in terms of giant and supergiant prototypes. In particular he used the bright giantNGC 4449 as the prototype for irregular galaxies. Following in Hubble's footstepsSandage (1961) classified NGC 4449 as Ir; however, Sandage & Tammann (1981) re-assign it to type Sm. In fact, there seems to be a systematic difference between theclassifications of late-type galaxies by Sandage & Tammann and by other authors. Of the17 northern Shapley-Ames galaxies which van den Bergh (1960c) assigns to type Ir onlyone (6%) is classified as an irregular by Sandage & Tammann. These authors call all of theremaining 16 objects spirals. By the same token, only one (9%) of the 11 galaxies called Irby Humason, Mayall & Sandage (1956) are classified as irregular by Sandage & Tam-mann (1981).
The presence of spiral structure is the primary criterion for distinguishing betweenlate-type spirals and irregular galaxies. However, in doubtful cases (Hubble 1936, van denBergh 1995) the most objective way to distinguish irregulars and late-type spirals is byusing the presence of a nucleus as a classification criterion. Hubble (1936, p. 47) writes'Since their [Ir galaxies] stellar contents resemble those of very late-type spirals, they aresometimes considered as representing the last stage in the sequence of regular nebulae.Their status, however, is speculative, and the absence of conspicuous nuclei may be ofmore fundamental significance than the absence of rotational symmetry.' However, ifNGC 4449 is classified as an irregular then the apparent presence of a nucleus in thatobject is an anomaly. Possibly this 'nucleus' is, in fact, a more-or-less centrally locatedenormous H II region and star forming complex. It would clearly be of great interest toobtain very high resolution imaging and spectroscopy of the central region of NGC 4449to throw more light on this question.
Anemic galaxies 27
5.4 Anemic galaxies
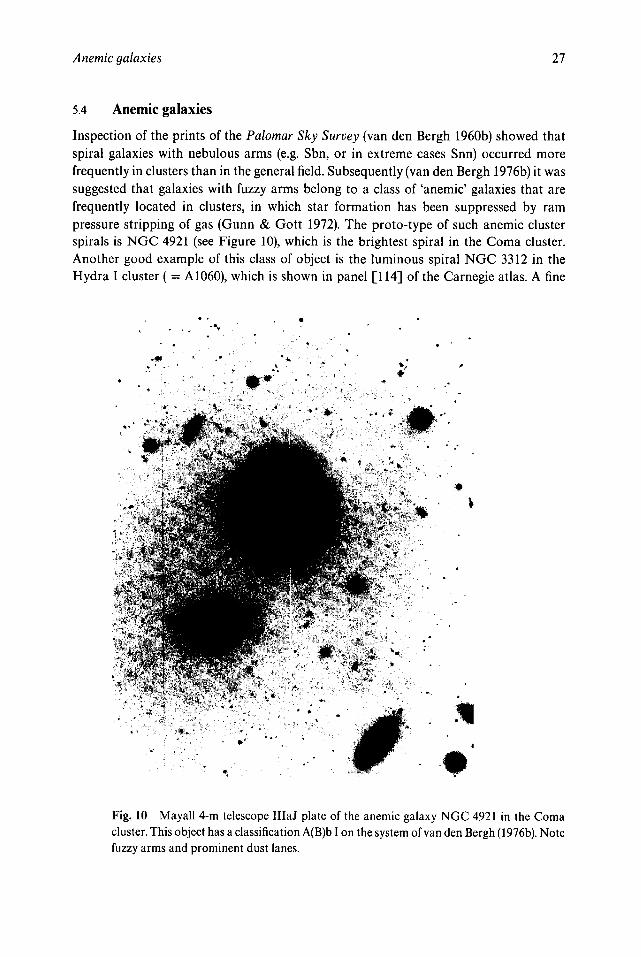
Inspection of the prints of the Palomar Sky Survey (van den Bergh 1960b) showed thatspiral galaxies with nebulous arms (e.g. Sbn, or in extreme cases Snn) occurred morefrequently in clusters than in the general field. Subsequently (van den Bergh 1976b) it wassuggested that galaxies with fuzzy arms belong to a class of 'anemic' galaxies that arefrequently located in clusters, in which star formation has been suppressed by rampressure stripping of gas (Gunn & Gott 1972). The proto-type of such anemic clusterspirals is NGC 4921 (see Figure 10), which is the brightest spiral in the Coma cluster.Another good example of this class of object is the luminous spiral NGC 3312 in theHydra I cluster ( = A1060), which is shown in panel [114] of the Carnegie atlas. A fine
V (• , . * « •••ft,
Fig. 10 Mayall 4-m telescope IllaJ plate of the anemic galaxy NGC 4921 in the Comacluster. This object has a classification A(B)b I on the system of van den Bergh (1976b). Notefuzzy arms and prominent dust lanes.
28 Van den Bergh's classification of galaxies
example of a luminous anemic galaxy is NGC 4569 ( = M90) in the Virgo cluster, which isshown in the Hubble atlas and in panel [109] of the Carnegie atlas. The very prominentabsorbing dust lanes seen in this class of galaxy might be due to the fact that ram pressureon the gas has lifted the dust above the equatorial plane of the stars. It is, however,somewhat puzzling that NGC 4826 ( = M64), which is also illustrated in the Hubble atlasand which is shown in panel [110] of the Carnegie atlas, is a field galaxy, even though itsmorphological peculiarities are similar to those of the cluster spirals NGC 3312, NGC4568 and NGC 4921. Probably the peculiar appearance of the 'black eye' galaxy NGC4826 is due to a recent merger event which manifests itself by the presence of a counter-rotating inner disk (Braun, Walterbos & Kennicutt 1992). The observation (van Gorkom& Kotanyi 1985, Haynes & Giovanelli 1986, Cayette et al. 1994) that spirals in the core ofthe Virgo cluster are severely depleted in hydrogen strongly supports the hypothesis thatram-pressure stripping plays an important role in rich clusters.
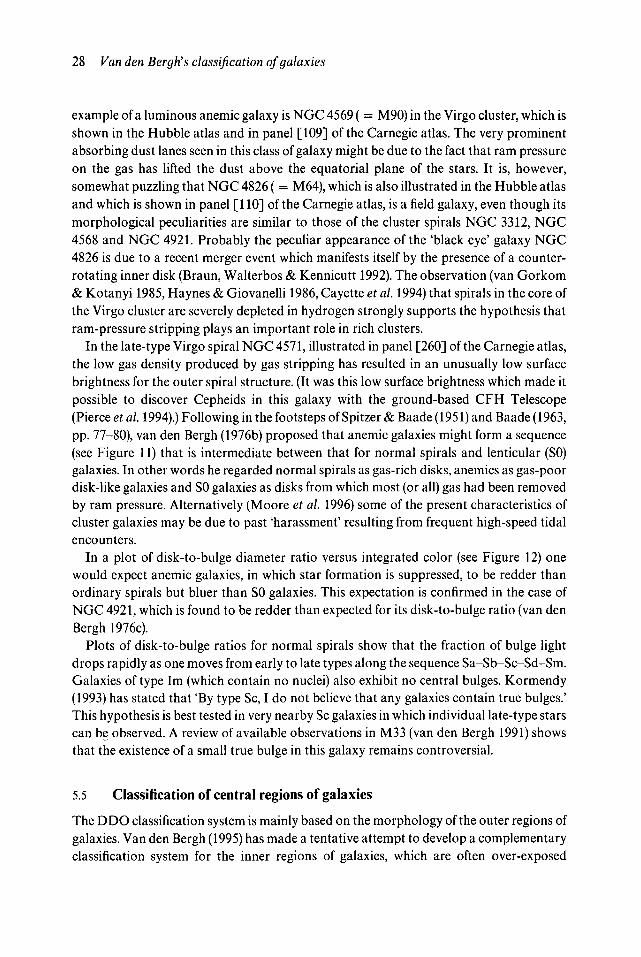
In the late-type Virgo spiral NGC 4571, illustrated in panel [260] of the Carnegie atlas,the low gas density produced by gas stripping has resulted in an unusually low surfacebrightness for the outer spiral structure. (It was this low surface brightness which made itpossible to discover Cepheids in this galaxy with the ground-based CFH Telescope(Pierce et al. 1994).) Following in the footsteps of Spitzer & Baade (1951) and Baade (1963,pp. 77-80), van den Bergh (1976b) proposed that anemic galaxies might form a sequence(see Figure 11) that is intermediate between that for normal spirals and lenticular (SO)galaxies. In other words he regarded normal spirals as gas-rich disks, anemics as gas-poordisk-like galaxies and SO galaxies as disks from which most (or all) gas had been removedby ram pressure. Alternatively (Moore et al. 1996) some of the present characteristics ofcluster galaxies may be due to past 'harassment' resulting from frequent high-speed tidalencounters.
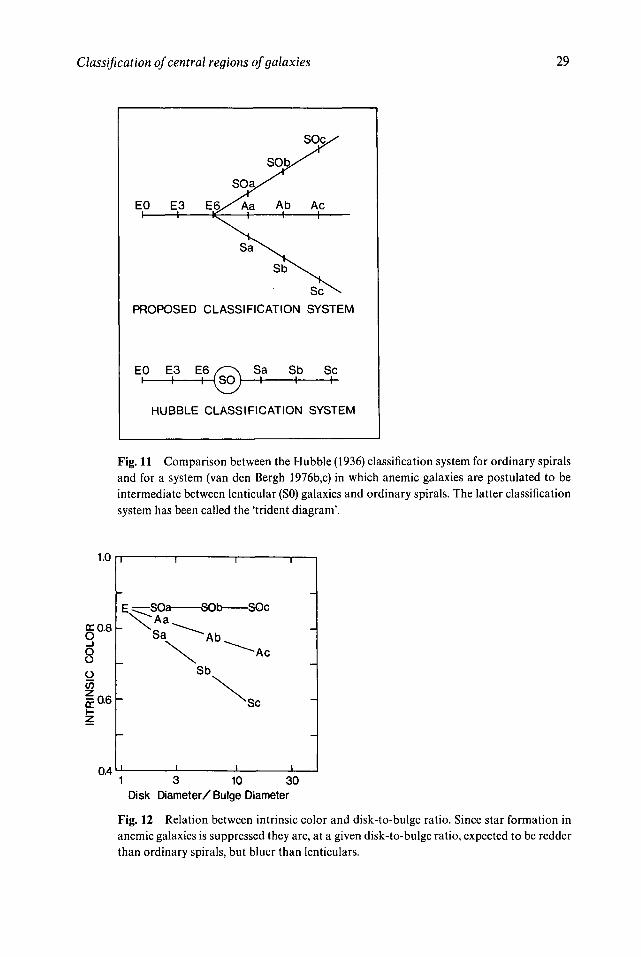
In a plot of disk-to-bulge diameter ratio versus integrated color (see Figure 12) onewould expect anemic galaxies, in which star formation is suppressed, to be redder thanordinary spirals but bluer than SO galaxies. This expectation is confirmed in the case ofNGC 4921, which is found to be redder than expected for its disk-to-bulge ratio (van denBergh 1976c).
Plots of disk-to-bulge ratios for normal spirals show that the fraction of bulge lightdrops rapidly as one moves from early to late types along the sequence Sa-Sb-Sc-Sd-Sm.Galaxies of type Im (which contain no nuclei) also exhibit no central bulges. Kormendy(1993) has stated that 'By type Sc, I do not believe that any galaxies contain true bulges.'This hypothesis is best tested in very nearby Sc galaxies in which individual late-type starscan be observed. A review of available observations in M33 (van den Bergh 1991) showsthat the existence of a small true bulge in this galaxy remains controversial.
5.5 Classification of central regions of galaxies
The DDO classification system is mainly based on the morphology of the outer regions ofgalaxies. Van den Bergh (1995) has made a tentative attempt to develop a complementaryclassification system for the inner regions of galaxies, which are often over-exposed
Classification of central regions of galaxies 29
EO E3I 1—
PROPOSED CLASSIFICATION SYSTEM
EO E3 E6 S~\ SaI 1- H S O V — I -
Sb Sc
HUBBLE CLASSIFICATION SYSTEM
Fig. 11 Comparison between the Hubble (1936) classification system for ordinary spiralsand for a system (van den Bergh 1976b,c) in which anemic galaxies are postulated to beintermediate between lenticular (SO) galaxies and ordinary spirals. The latter classificationsystem has been called the 'trident diagram'.
1 3 10 30Disk Diameter/ Bulge Diameter
Fig. 12 Relation between intrinsic color and disk-to-bulge ratio. Since star formation inanemic galaxies is suppressed they are, at a given disk-to-bulge ratio, expected to be redderthan ordinary spirals, but bluer than lenticulars.
30 Van den BergKs classification of galaxies
on the prints of the Palomar Sky Survey. These classifications are based on inspection ofthe prints of intermediate- and late-type galaxies in Volume II of The Carnegie Atlas ofGalaxies (Sandage & Bedke 1994). Most of these prints were made from plate materialobtained with large reflectors. The following is a brief description of the adopted prelimi-nary classification system for the inner regions of galaxies. (Numbers in square bracketsrefer to the panel number in The Carnegie Atlas of Galaxies)
N N (no nucleus)
Galaxy appears to contain no nucleus. The type example is NGC 2366 [327].
N (nucleus)
Object contains a star-like nucleus. Good examples are NGC 991 [245], NGC 5949[270], NGC 6207 [274], and NGC 6508 [288].
SSN (semi-stellar nucleus)
Good examples of galaxies having semi-stellar nuclei are NGC 300 [261] and NGC 7793[321].
CB (central bulge)
The galaxy is centered on a small bright central bulge or disk. The proto-type of this classis NGC 3726 [181]. Other good examples are NGC 1300 [154], NGC 1433 [158], NGC2712 [165], NGC 3338 [173], NGC 4999 [159], and NGC 7038 [175]. In some cases (e.g.the Seyfert 1 galaxy NGC 4051 [180]), a semi-stellar nucleus is known to be present, but isnot visible in the burned-out bulge of the image published by Sandage & Bedke (1994). Inother cases (e.g. NGC 1097 [201] and NGC 2903 [226]), the bright central region appearsto be produced by a disk of HII regions and young OB stars. In galaxies of types SBb andSBc, the central bulge may have a non-circular outline.
NB (nuclear bar)
In galaxies such as NGC 5112 [248], a nuclear bar-like structure is present in the galacticcenter. Other good examples of this type are NGC 672 [307], NGC 4116 [306], and NGC5669 [299].
Tr (transitional)
These are objects that appear to be intermediate between spirals which have centralbulges and objects with central regions that are resolved into stars and knots. Goodexamples are NGC 1313 [309] and NGC 4647 [278].
Van den Bergh (1995) shows that galaxies of type CB are, without exception, luminousand have Hubble type Sc or earlier. On the other hand galaxies of type NN are allintrinsically faint and have late Hubble types in the range Sc-Im. Among spheroidalgalaxies (van den Bergh 1986) the fraction of objects with nuclei grows dramatically with
Summary 31
increasing luminosity. A similar phenomenon is observed among late-type galaxies whereobjects with nuclei are, on average, much more luminous than those without nuclei.
5.6 Summary
• The degree to which spiral structure is developed is a strong function of galaxyluminosity. Pretty 'grand design' spirals are luminous, whereas low-luminosityspirals exhibit scraggily spiral structure.
• The Hubble stages Sa-Sb-Sc are only well defined for giant and supergiantgalaxies. Among low-luminosity spirals only early and late sub-types can bedistinguished.
• The distinction between very late-type spirals and magellanic irregulars should bebased on whether a galaxy does, or does not, contain a nucleus.
• It would be interesting to classify spiral galaxies on the basis of their Ha images,pirals exhibit scraggily spiral structure.
• The Hubble stages Sa-Sb-Sc are only well defined for giant and supergiantgalaxies. Among low-luminosity spirals only early and late sub-types can bedistinguished.
• The distinction between very late-type spirals and magellanic irregulars should bebased on whether a galaxy does, or does not, contain a nucleus.
• It would be interesting to classify spiral galaxies on the basis of their Ha images.

6 Morgan's classification system
6.1 Central concentration of light
The galaxy classification system proposed by Morgan (1958,1959a), which is sometimesreferred to as the Yerkes system, is a one-dimensional scheme based on central concentra-tion of light. Morgan arranged galaxies in a sequence a-f-g-k, with objects of type ahaving the weakest central concentration of light and those of type k having the strongestcentral concentration. The Yerkes system also recognizes the intermediates types af,fgand gk. Abraham et al. (1996b) have shown that it is possible to measure a centralconcentration index C, determined from measurements of the intensity-weighted second-order moments of a galaxy image, which is closely related to the central concentrationclassification of the Yerkes system.
Galaxies with Morgan type a tend to have early-type (A) spectra, whereas galaxies oftype k mostly exhibit late-type (K) integrated spectra. This linkage between morphologyand spectral type shows that the dominant stellar population in centrally concentratedgalaxies is old, whereas objects with a low central concentration of light tend to have astrong young population component. Probably this correlation between central concen-tration and integrated spectral type is largely due to the fact that regions of high gasdensity will usually collapse at earlier times than is the case for low density regions. This isso because the collapse time-scale T OC (Gp)~1/2. As we shall see in Chapter l l a puzzlingexception is provided by the dwarf spheroidal galaxies, most of which are dominated byan old stellar population, even though they are of low density. Mirabel, Dottori & Lutz(1992) have attempted to overcome this conundrum by postulating that dSph galaxiescondensed from tidal arms that had been torn from interacting dense massive galaxies.However, a difficulty with this suggestion (Kormendy 1990a) is that some Local GroupdSph galaxies are observed to contain a large amount of dark matter (e.g. Hargraves et al.(1996)). Such dark matter is not expected to be stripped from the dark coronae of massivegalaxies during tidal interactions (Barnes & Hernquist 1992). It is therefore concludedthat the majority of dSph galaxies were probably formed individually when the Universewas still young. However, a minority of them may have condensed later from tidal arms.
6.2 Morgan's form families
In addition to the primary central concentration parameter, Morgan's classificationsystem also recognizes the following 'form families': E (elliptical), S (spiral), B (barred
34 Morgan's classification system
spiral), I (irregular), L (low surface brightness), and N (objects with bright nuclei super-posed on a considerably fainter background). Galaxies of type N might be quasars (whichwere not yet known in 1958), objects with active nuclei, or centrally concentratedstarburst galaxies. Finally, Morgan introduced a class D comprising rotationally sym-metrical galaxies without pronounced spiral or elliptical structure. Many of the galaxiesthat Hubble and Sandage place into the SO class, or which de Vaucouleurs calls 'lenticu-lars', are assigned to the D form family by Morgan. Regarding the nature of the SO classBaade (1963, p. 78) writes: 'In the end I think it is quite clear that, if we introduce the classSO, we should define it as the class of galaxies in which from their general form we shouldexpect to find spiral structure, but which, contrary to our expectation, do not show it. Ithink that Hubble finally accepted this view.' In both the Hubble/Sandage and Morgan(1958) systems a problem arises in making the somewhat artificial distinction betweenellipticals and 'systems showing rotational symmetry without pronounced spiral onelliptical structure.' Particularly sharp criticism of Morgan's D classification is presentedby Kormendy (1987a) who points out that this form family is a heterogeneous combina-tion of SOs, tidally distended Es and probably also some very luminous ellipticals thatexhibit shallow outer brightness profiles. Both Morgan's D and Hubble's SO classificationtypes have become repositories for a rather diverse population of early-type galaxies thatare (mostly) not normal ellipticals.
Morgan adds a numerical index, similar to that which Hubble used to describe theflattening of E galaxies, to each classification type. A complete Morgan classificationmight, for example, be kE6 for a highly flattened centrally concentrated elliptical, or a/Slfor an almost face-on spiral with a low central concentration. A slight modification of theoriginal Yerkes classification was given by Morgan (1962) in his Henry Norris Russelllecture.
6.3 cD galaxies
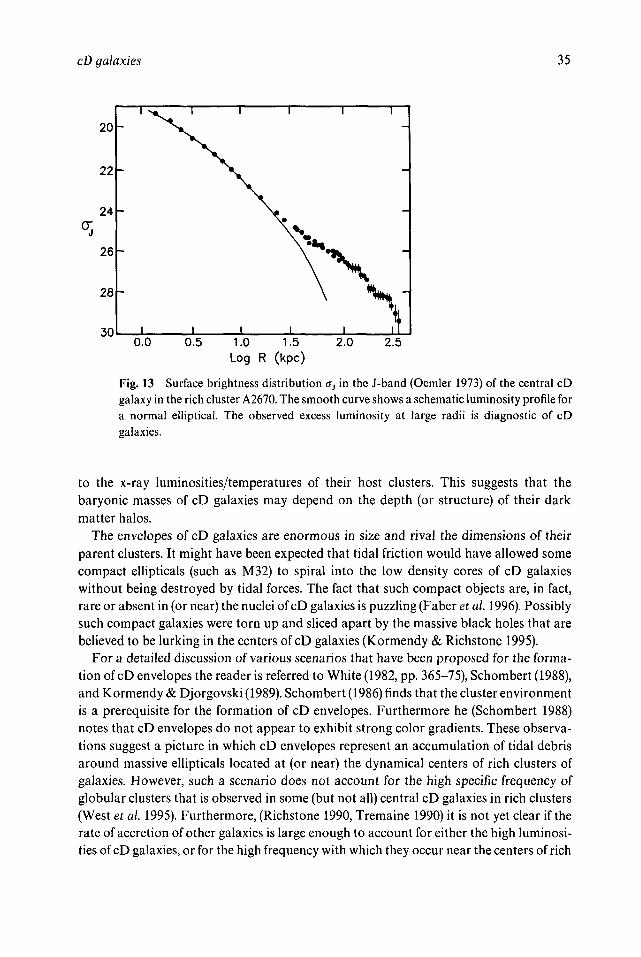
Matthews, Morgan & Schmidt (1964) and Morgan & Lesh (1965) have added a sub-classof particularly luminous D galaxies, which they dubbed cD, to the Yerkes classificationsystem. (The 'c' derives from the notation used by early spectroscopists to denotenarrow-lined supergiant stars.) Such cD galaxies have elliptical-like r1/4-law cores thatare surrounded by an extensive power-law luminous envelope (see Figure 13). With fewpossible exceptions all cD galaxies are located close to the centers of rich clusters.
Inspection of images of clusters of galaxies shows that the surface brightnesses of theluminous central cD galaxies in such clusters are dramatically lower than are those of theless luminous normal cluster ellipticals. In fact Kormendy (1980) finds that cD galaxiesfall at the extreme low surface brightness (and large radius) end of the linear ae versus logre relation for elliptical galaxies, in which re is the effective radius within which iscontained 50% of the galactic light in projection, and at is the surface brightness at re. (It isnoted in passing (cf. Kormendy 1982, p. 193)) that most central bulges of spirals fall belowthe <re versus re relation for ellipticals, i.e. bulges are, at any value of re, fainter thanellipticals.) Hudson & Ebeling (1996) find that the luminosities of cD galaxies are related
cD galaxies 35
1.0 1.5Log R (kpc)
2.0 2.5
Fig. 13 Surface brightness distribution as in the J-band (Oemler 1973) of the central cDgalaxy in the rich cluster A2670. The smooth curve shows a schematic luminosity profile fora normal elliptical. The observed excess luminosity at large radii is diagnostic of cDgalaxies.
to the x-ray luminosities/temperatures of their host clusters. This suggests that thebaryonic masses of cD galaxies may depend on the depth (or structure) of their darkmatter halos.
The envelopes of cD galaxies are enormous in size and rival the dimensions of theirparent clusters. It might have been expected that tidal friction would have allowed somecompact ellipticals (such as M32) to spiral into the low density cores of cD galaxieswithout being destroyed by tidal forces. The fact that such compact objects are, in fact,rare or absent in (or near) the nuclei of cD galaxies is puzzling (Faber et al. 1996). Possiblysuch compact galaxies were torn up and sliced apart by the massive black holes that arebelieved to be lurking in the centers of cD galaxies (Kormendy & Richstone 1995).
For a detailed discussion of various scenarios that have been proposed for the forma-tion of cD envelopes the reader is referred to White (1982, pp. 365-75), Schombert (1988),and Kormendy & Djorgovski (1989). Schombert (1986) finds that the cluster environmentis a prerequisite for the formation of cD envelopes. Furthermore he (Schombert 1988)notes that cD envelopes do not appear to exhibit strong color gradients. These observa-tions suggest a picture in which cD envelopes represent an accumulation of tidal debrisaround massive ellipticals located at (or near) the dynamical centers of rich clusters ofgalaxies. However, such a scenario does not account for the high specific frequency ofglobular clusters that is observed in some (but not all) central cD galaxies in rich clusters(West et al. 1995). Furthermore, (Richstone 1990, Tremaine 1990) it is not yet clear if therate of accretion of other galaxies is large enough to account for either the high luminosi-ties of cD galaxies, or for the high frequency with which they occur near the centers of rich
36 Morgan's classification system
clusters. Merritt (1984) has pointed out that the velocity dispersion in rich clusters is solarge that only galaxies that were already gravitationally bound to the central cD galaxiesat the time of their formation could have merged with them. A quite different scenario forthe formation of cD envelopes has been proposed by Lopez-Cruz et al. (1997) who suggestthat the flat luminosity functions of the faint dwarf (mainly dSph) galaxies in many cDdominated rich clusters is due to the fact that a large fraction of the cluster dwarfs weredisrupted during the early stages of cluster formation. On their picture the stars fromthese disrupted dwarfs were re-distributed throughout the cluster potential well duringviolent relaxation, resulting in the formation of the extended cD envelope. In the Lopez-Cruz et al. scenario the core of the central cD (and its metals!) were formed from densemerging proto-ellipticals, whereas the cD envelope was derived from disrupted dwarfs. Apossible problem with this scenario is that the Coma cluster contains a central cD galaxy,even though it cannot be classified as a cluster with a flat luminosity function. However,Lobo et al. (1997) do find that the luminosity function of the Coma cluster may indeedcontain a deficit of faint galaxies near the luminous objects NGC 4874 and NGC 4889.
6.4 Automatic classifications on the Yerkes system
The two principal advantages of computer-driven classifications, such as those of Ab-raham et al. (1994), are that: (1) the central concentration index C is continuous, whereasgalaxies are placed in discrete bins in the Yerkes system, and (2) a computer-drivenmorphological classification system can be used to mass-produce galaxy classificationsfrom digital images. A more detailed discussion of the relative advantages and disadvan-tages of 'hand-crafted' and mass-produced galaxy classifications will be given in Chapter15.
Two lines of evidence show that the central concentration index C provides a veryrobust way to classify galaxies:
(1) Observations of galaxies in the Hubble Deep Field (e.g. van den Bergh et al.(1996)), which were obtained with the Hubble Space Telescope (HST), suggest thatmany spiral galaxies had not yet been assembled from their ancestral objects atlarge look-back times. As a result, it is often difficult to 'shoehorn' individualyoung galaxies into the Hubble classification scheme. Nevertheless, it is possible(Abraham et al. 1996a,b) to classify these objects using the A (asymmetry) and C(central concentration) parameters. It is not yet clear how the C parameter willevolve with time. However, it does seem likely that a decrease in the frequency ofgalaxy interactions, and dynamical evolution of individual galaxies, will result in asystematic decrease in the numerical value of the average asymmetry parameter Aof galaxies with time.
(2) The Hubble classification scheme was designed to describe galaxies in our im-mediate neighborhood. It therefore provides a natural way to sort the galaxy typesthat occur among field galaxies and in small clusters. However, the Hubbleclassification system does not provide a natural framework for classifying galaxies
Comparison between the Morgan and Hubble systems 37
6.5
in the cores of very rich clusters of galaxies (Abraham et al. 1994). In such richcluster environments the vast majority of galaxies belong to types E, SO and SBO,or to types intermediate between these classifications. However, central concen-tration of light, i.e. Morgan's sequence a-f-g-k, still provides a convenient way toclassify the galaxian populations in such rich clusters of galaxies.
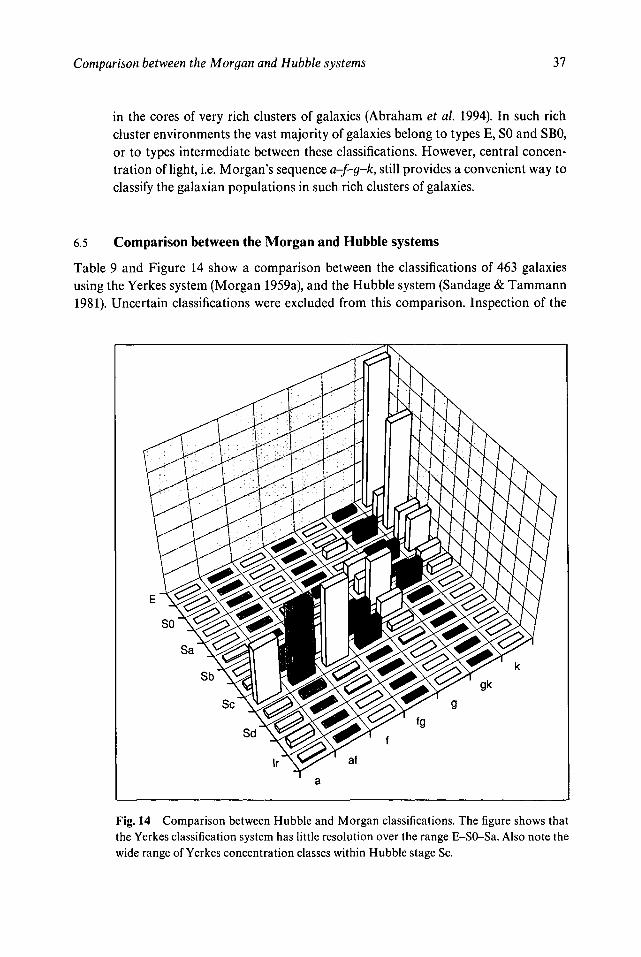
Comparison between the Morgan and Hubble systems
Table 9 and Figure 14 show a comparison between the classifications of 463 galaxiesusing the Yerkes system (Morgan 1959a), and the Hubble system (Sandage & Tammann1981). Uncertain classifications were excluded from this comparison. Inspection of the
Fig. 14 Comparison between Hubble and Morgan classifications. The figure shows thatthe Yerkes classification system has little resolution over the range E-SO-Sa. Also note thewide range of Yerkes concentration classes within Hubble stage Sc.
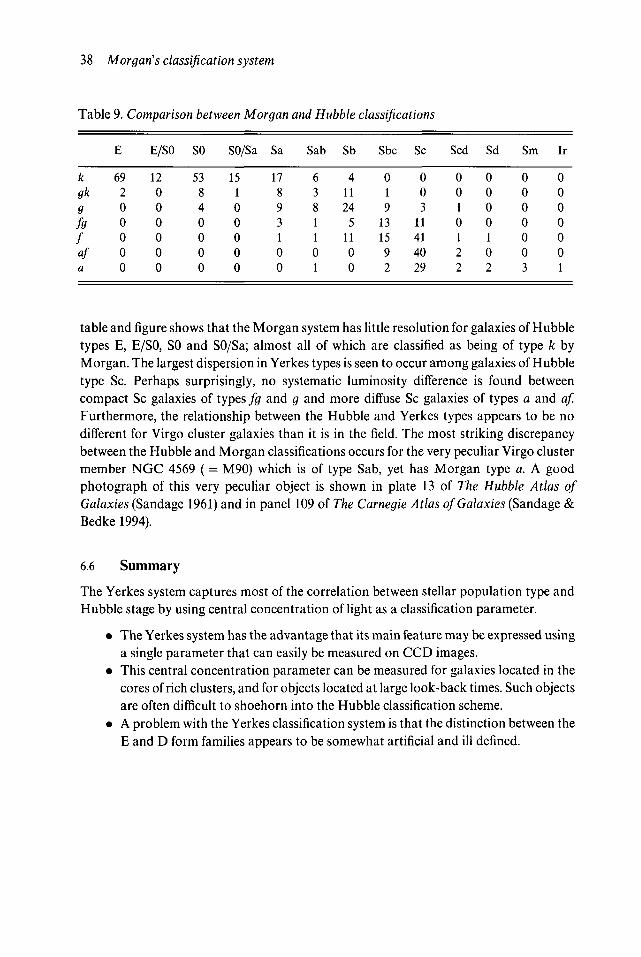
38 Morgan's classification system
Table 9. Comparison between Morgan and Hubble classifications
k(Ik9faf4a
E
69200000
E/SO
12000000
SO
53840000
SO/Sa
15100000
Sa
17893100
Sab
6381101
Sb
4112451100
Sbc
019131592
Sc
00311414029
Scd
0010122
Sd
0000102
Sm
0000003
Ir
0000001
table and figure shows that the Morgan system has little resolution for galaxies of Hubbletypes E, E/SO, SO and SO/Sa; almost all of which are classified as being of type k byMorgan. The largest dispersion in Yerkes types is seen to occur among galaxies of Hubbletype Sc. Perhaps surprisingly, no systematic luminosity difference is found betweencompact Sc galaxies of types fg and g and more diffuse Sc galaxies of types a and af.Furthermore, the relationship between the Hubble and Yerkes types appears to be nodifferent for Virgo cluster galaxies than it is in the field. The most striking discrepancybetween the Hubble and Morgan classifications occurs for the very peculiar Virgo clustermember NGC 4569 ( = M90) which is of type Sab, yet has Morgan type a. A goodphotograph of this very peculiar object is shown in plate 13 of The Hubble Atlas ofGalaxies (Sandage 1961) and in panel 109 of The Carnegie Atlas of Galaxies (Sandage &Bedke 1994).
6.6 Summary
The Yerkes system captures most of the correlation between stellar population type andHubble stage by using central concentration of light as a classification parameter.
• The Yerkes system has the advantage that its main feature may be expressed usinga single parameter that can easily be measured on CCD images.
• This central concentration parameter can be measured for galaxies located in thecores of rich clusters, and for objects located at large look-back times. Such objectsare often difficult to shoehorn into the Hubble classification scheme.
• A problem with the Yerkes classification system is that the distinction between theE and D form families appears to be somewhat artificial and ill defined.
7 Galactic bars
Most spiral galaxies are, to a good approximation, oblate spheroids that can be arrangedon the sequence Sa-Sb-Sc. However, a significant minority exhibit bar-like structuresand may be placed on the SBa-SBb-SBc tine of Hubble's 'tuning fork' diagram. Objects,with less pronounced bars, can be arranged on the intermediate sequence S(B)a-S(B)b-S(B)c between normal and barred spirals. Some disks appear to be globally oval(Kormendy 1982, p. 135). Such oval disks are of interest because, like bars, they representnon-axisymmetric distortions of the gravitational potential. An excellent review on thedynamics of barred galaxies has been given by Sellwood & Wilkinson (1993). Infraredimaging shows that some galaxies contain small IR bars (Frogel, Quillen & Pogge 1996).When such small inner bars are found in galaxies with large outer bars there is nocorrelation between the position angles of the large and small bars.
Bars are important to the dynamical evolution of galaxies (Kormendy 1982, 1993)because they can (a) lose angular momentum to cold disks and dark halos, and (b) gainangular momentum from rapidly rotating bulges. Furthermore, transfer of significantamounts of gas by bars to the nuclear regions of galaxies will increase the central galacticmass concentration, which in turn will make the galactic disk less prone to the develop-ment of bar-like distortions. In other words stellar bars can self-destruct (or transformthemselves into lenses1) by transporting too much gas to the nuclear regions of theirparent galaxies.
7.1 Differences between normal and barred spirals
De Vaucouleurs (1961) finds that the mean integrated colors of normal and barred spiralsof a given Hubble stage are not significantly different. This shows that the differencesbetween normal and barred objects do not reflect deep differences in their stellar popula-tions. Using the pitch angles of galaxies tabulated by Kennicutt (1981), and the Hubbletypes of Sandage & Tammann (1981), it is found (see Figures 15 and 16 and Table 10) thatthere is no significant difference between the spiral arm pitch angle versus Hubble stagerelations for ordinary spirals and for barred spirals. The relatively large dispersion amongthe pitch angles for objects of types Sc and SBc is, at least in part, due to luminosity (mass)differences. It is also noted in passing that there appears to be no significant differencebetween the Hubble stage versus arm pitch angle relations for field spirals and for spiralgalaxies in the Virgo cluster.
1 A lens is an elliptical shelf in the brightness distribution between the bulge and the exponential disk of agalaxy.
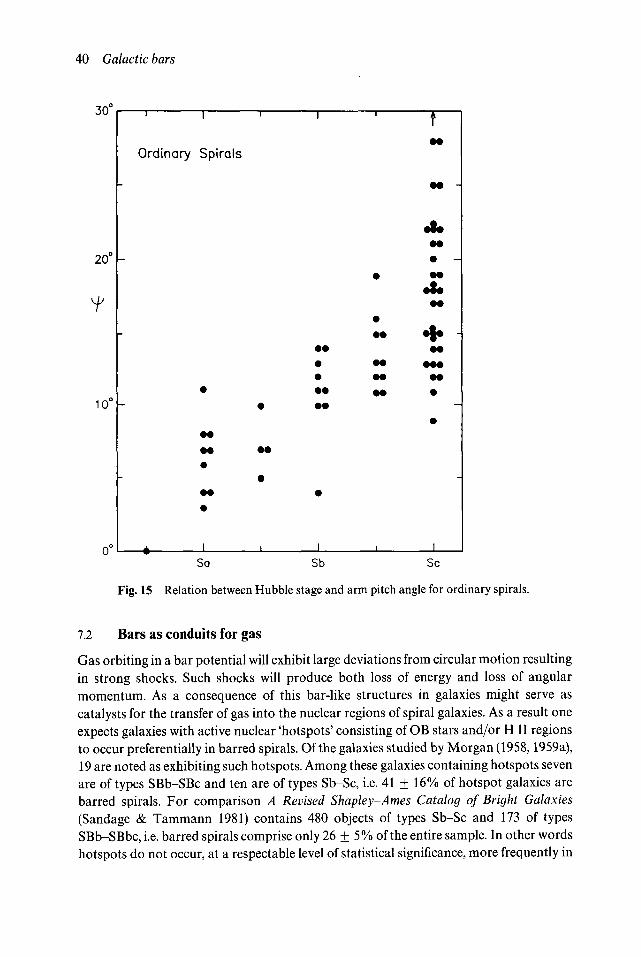
40 Galactic bars
30"
20 -
10" -
1 1 ' 1
Ordinary Spirals
•
* 1 1 1
f
•• •§• -
i i
Sa Sb Sc
Fig. 15 Relation between Hubble stage and arm pitch angle for ordinary spirals.
7.2 Bars as conduits for gas
Gas orbiting in a bar potential will exhibit large deviations from circular motion resultingin strong shocks. Such shocks will produce both loss of energy and loss of angularmomentum. As a consequence of this bar-like structures in galaxies might serve ascatalysts for the transfer of gas into the nuclear regions of spiral galaxies. As a result oneexpects galaxies with active nuclear 'hotspots' consisting of OB stars and/or H II regionsto occur preferentially in barred spirals. Of the galaxies studied by Morgan (1958,1959a),19 are noted as exhibiting such hotspots. Among these galaxies containing hotspots sevenare of types SBb-SBc and ten are of types Sb-Sc, i.e. 41 + 16% of hotspot galaxies arebarred spirals. For comparison A Revised Shapley-Ames Catalog of Bright Galaxies(Sandage & Tammann 1981) contains 480 objects of types Sb-Sc and 173 of typesSBb-SBbc, i.e. barred spirals comprise only 26 + 5% of the entire sample. In other wordshotspots do not occur, at a respectable level of statistical significance, more frequently in
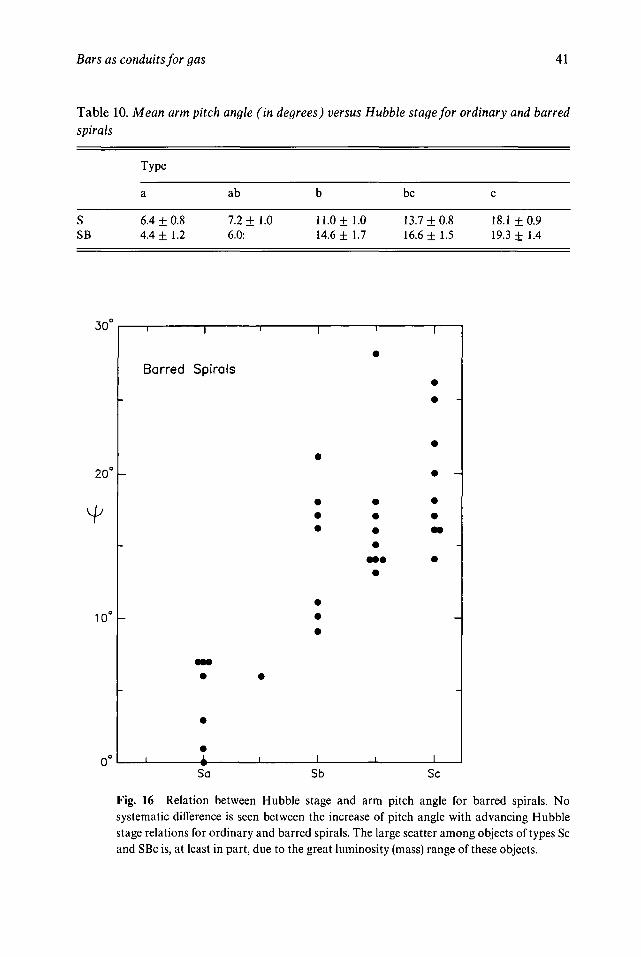
Bars as conduits for gas 41
Table 10. Mean arm pitch angle (in degrees) versus Hubble stage for ordinary and barredspirals
sSB
Type
a
6.4 ±4.4 ±
0.81.2
ab
7.2 +6.0:
1.0
b
11.0 ±14.6 +
1.01.7
be
13.7 ±16.6 ±
0.81.5
c
18.119.3
±0.9±1.4
Sc
Fig. 16 Relation between Hubble stage and arm pitch angle for barred spirals. Nosystematic difference is seen between the increase of pitch angle with advancing Hubblestage relations for ordinary and barred spirals. The large scatter among objects of types Scand SBc is, at least in part, due to the great luminosity (mass) range of these objects.
42 Galactic bars
barred spirals than they do in normal spirals. A similar conclusion had previously beenreached by Heckman (1978). This conclusion is supported by a more recent investigationundertaken by Ho, Filippenko & Sargent (1997). These authors find that the presence of abar seems to have no noticeable impact on the likelihood that a galaxy will host eithernuclear star formation or an active galactic nucleus.
Perhaps surprisingly, McLeod & Rieke (1995) find that Seyfert galaxies do not exhibitbars more frequently than do normal spirals. This suggests that the Seyfert phenomenonis triggered by violent external perturbations of galaxies, or perhaps by oval distortions(Kormendy 1982). Moles, Marquez & Perez (1995) find that active galaxies 'withoutexception either have a close companion or present a distorted morphology.'
Mulchaey & Regan (1997) find that a significant fraction of Seyfert galaxies (even in theinfrared) show no evidence for the presence of a bar. This suggests that either: (1)large-scale kiloparsec bars are not a universal fueling mechanism, or, perhaps lessplausibly, (2) the bars in the non-barred Seyferts were recently destroyed (perhaps by theformation of a central black hole). Mulchaey, Regan & Kundu (1997) find that manygalaxies that appear unbarred in the optical, display evidence for bars in the infrared.
The presence of a bar may affect the radial abundance gradient in a galaxy in two ways(Friedli, Benz & Kennicutt 1994): (1) A bar can stir up the gas in the disk of a galaxy, andwill therefore reduce, or eliminate, a pre-existing gradient. Such an effect might, forexample, account for the lack of any observable abundance gradient in the LargeMagellanic Cloud. (2) If a bar funnels gas towards a galactic nucleus, a starburst might betriggered which will, in its turn, generate supernovae that create heavy elements. As aresult the next generation of stars will exhibit an enhanced radial metallicity gradient. Adetailed study of the correlation between metallicity gradients and the presence, orabsence, of a bar, would clearly be of considerable interest.
7.3 Why do some galaxies develop bars?
The fraction of all galaxies that are barred spirals was taken from Sandage & Tammann(1981) and is given in Table 11. The data in this table appear to show no significant trendwith Hubble type.
The classifications by Sandage & Tammann (1981) were used to determine the fractionof galaxies of various Morgan (1959a) types that are barred spirals. The presence of bars isoften difficult to establish in nearly edge-on systems. Such objects were therefore omittedfrom the statistics. Also excluded were galaxies of types SO and SBO. Theoretically onewould expect galaxies with the strongest central concentration of light (i.e. Morgan'sclasses gk and k) to be most stable against bar-like disk instabilities. The data in Table 12do, indeed, suggest that the percentage of barred objects may be lowest among galaxies ofMorgan types gk and k. However, a Kolmogorov-Smirnov test shows that the distribu-tion of normal and barred objects does not differ, at a statistically significant level, alongthe Morgan classification sequence.
Figure 17 and Table 13 show a comparison between the luminosity distributions ofordinary Sc and barred SBc spirals in the Shapley-Ames Catalog (Sandage & Tammann
Why do some galaxies develop barsl 43
Table 11. Frequency of barred spirals
Hubble type No. galaxies % Barred
SO + SO/aSa + SabSb + SbcScSd-Im
19016528337056
25 + 425 + 434 + 421 + 330 + 8
Table 12. Frequency of bars as a function of Morgan type
Type Normal spiral Barred spiral % Barred
aafffgggkk
47436227502630
21183115212
10
31303336307:
25
1981). The figure demonstrates that late-type barred spirals are, on average, significantlyfainter than ordinary spirals. A Kolmogorov-Smirnov test shows that there is only ~ 0.2%probability that the Sc and SBc spirals in the Shapley-Ames sample were drawn from thesame parent population. Since SBcd galaxies are, on average, less luminous than SBcgalaxies the observed excess of faint SBc galaxies might have been caused by a systematicmis-classification of SBcd galaxies as SBc by Sandage & Tammann (1981). However, thisseems unlikely because the excess of ~ 23 SBc galaxies fainter than MB = — 20 is largerthan the total number of Scd + SBcd galaxies in A Revised Shapley-Ames Catalog]Furthermore there is no evidence that SBcds have, as a result of such mis-classification,been depleted relative to objects of type Scd. From the data in the Shapley-Ames Catalogone finds that N(SBcd)/iV(Scd) = 5/13 = 0.39 ± 0.20, which does not differ significantlyfromN(SBc)/N(Sc) = 73/285 = 0.26 + 0.03. A/owiV(SBcd)/JV(Scd) ratio would have beenexpected if a significant number of SBcd galaxies had been mis-classified as SBc. It istherefore concluded that the observed excess of SBc galaxies fainter than MB = —20.0 isnot due to a systematic mis-classification of SBcd galaxies as objects of type SBc.
How might the striking difference between the luminosity distributions of Sc and SBcgalaxies be accounted for? Possibly massive luminous late-type spirals collapsed morerapidly than faint low-mass ones because the collapse time-scale % oc (G p)~ ^2. Noguchi(1996) suggests that slow infall from a protogalactic halo will keep the gas mass in the disklow resulting in a low star formation rate, and hence a cold disk that can develop a barinstability. On the other hand the halo of a massive protogalaxy might collapse rapidlyleading to a pile-up of disk gas, in which massive clumps arising from gravitational
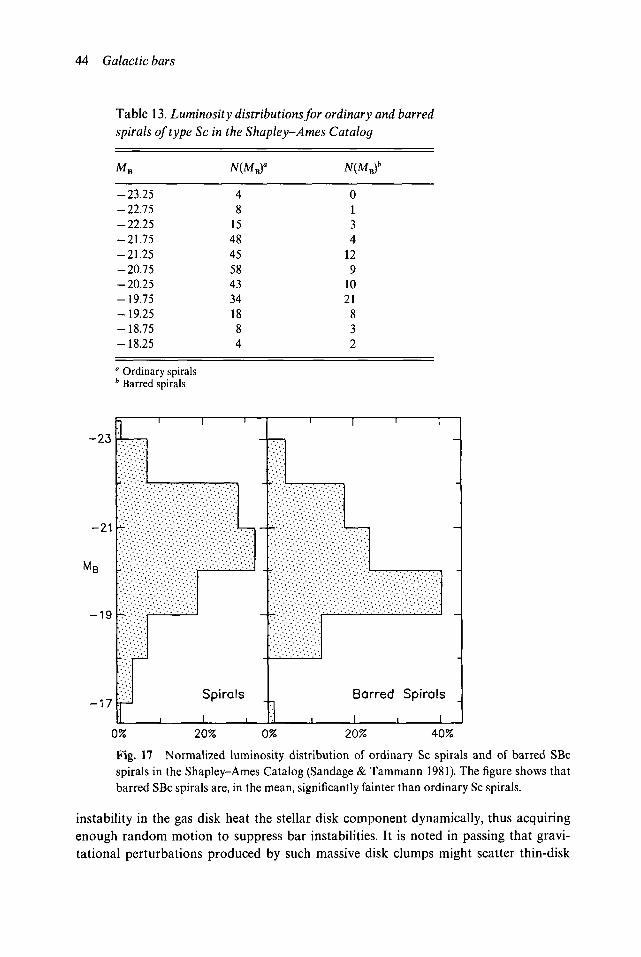
44 Galactic bars
Table 13. Luminosity distributions for ordinary and barredspirals of type Sc in the Shapley-Ames Catalog
JV(MB)»
" Ordinary spiralsb Barred spirals
-23.25-22.75-22.25-21.75-21.25-20.75-20.25-19.75-19.25-18.75-18.25
48
1548455843341884
0134
129
1021832
20% 0% 20% 40%
Fig. 17 Normalized luminosity distribution of ordinary Sc spirals and of barred SBcspirals in the Shapley-Ames Catalog (Sandage & Tammann 1981). The figure shows thatbarred SBc spirals are, in the mean, significantly fainter than ordinary Sc spirals.
instability in the gas disk heat the stellar disk component dynamically, thus acquiringenough random motion to suppress bar instabilities. It is noted in passing that gravi-tational perturbations produced by such massive disk clumps might scatter thin-disk

Summary 45
stars into a thick disk. A possible test of the scenario proposed by Noguchi might beprovided by a spectroscopic comparison between the [O/Fe] values in the disks ofordinary and barred spirals of the same luminosity. On the picture proposed by Noguchi(1996) one would (other things being equal) expect fast-collapsing ordinary spirals to bemainly enriched by fast-evolving supernovae of Type II, resulting in relatively high disk[O/Fe] values. On the other hand slowly collapsing objects that produce barred spiralswould be expected to be enriched in heavy elements by supernovae of both Type II andType la, resulting in a relatively low disk [O/Fe] ratio. Unfortunately presently availabledata (Jablonka, Martin & Arimoto 1996) are not yet suitable for performing such a test.For spirals of types Sa, Sab and Sb no significant difference is found between theluminosity distributions of ordinary and barred objects. This result is consistent with theconjecture by Noguchi that the bars in early-type galaxies, whose disks are likely to havegrown quickly, were formed as a result of tidal interactions with other galaxies.Beauchamp & Hardy (1997) have recently shown that interference filters can providestellar spectral indices, which could be used to measure Mg/Fe in large numbers ofgalaxies. Such measurements could provide huge samples of data to search for possiblesystematic Mg/Fe differences between normal and barred galaxies.
Van den Bergh et al. (1996) found that barred spirals are very rare in the Hubble DeepField. Using simulations these authors are able to show that the HST would have beenable to distinguish remote barred spirals from ordinary spirals in the Hubble Deep Field.The almost complete absence of barred spirals in the Hubble Deep Field may indicatethat the stellar populations in the disks of the first spiral galaxies formed at this remoteepoch had enough random motion to suppress bar instabilities. Such a situation mighthave arisen if early disks were dynamically heated by frequent infall and capture ofmassive ancestral gas clumps. A massive central starburst occurring at a more recentepoch might have formed an inner stellar disk. If this disk is unstable to bar modes itcould thicken into a bulge (Pfenniger & Norman 1990, Merritt & Sellwood 1994).
7.4 Summary
Normal and barred galaxies of the same Hubble stage exhibit very similar colors. Thissuggests that they contain broadly similar stellar populations. However, late-type barredspirals are found to be significantly less luminous than normal galaxies of the sameHubble stage. Possibly (Noguchi 1996) this difference is due to the fact that slow infallfrom a low-mass protogalactic halo will produce a cold disk that can develop a barinstability. On the other hand rapid infall of material from a massive halo might result in ahot disk that is stable against bar-like deformations. If this hypothesis is correct then onemight expect the logarithmic a-element to iron ratio [a/Fe] to be higher in normal spiralsthan it is in barred spirals. It is also tentatively suggested that the low frequency of barredspirals in the Hubble Deep Field might be due to the fast collapse (resulting in hot disks)of the spiral galaxies that are presently being viewed at large look-back times.
There is presently only marginal observational evidence in favor of the view that barsserve as conduits for transporting disk gas into the nuclear regions of spirals.

8 Elliptical galaxies
The visual light of elliptical galaxies is dominated by old metal-rich stars (Morgan 1959b).To a first approximation the isophotes of an E galaxy may be represented by ellipses witha major axis a and a minor axis b. Following Hubble (1936, p. 41) the flattening of anelliptical is defined as (a — b)/a. The observed range of ellipticities extends from e = 0.0 toe = 0.7, corresponding to types E0-E7. The relationship between the projected isophoteshapes of galaxies and their intrinsic shapes (which may be triaxial) has been studied bymany authors, including Hubble (1926), de Vaucouleurs (1959a), Sandage, Freeman &Stokes (1970), Binney (1978), Binney & de Vaucouleurs (1981), Franx, Illingworth & deZeeuw (1991), Tremblay & Merritt (1995), and Ryden (1996).
8.1 Radial profiles of elliptical galaxies
Sersic (1968) was able to show that the surface brightnesses of galaxies may be conveni-ently represented by the relation
/(r) = / o exp[- ( r / r o ) 1 / " ] , (1)
in which / 0 is the central surface brightness, r is the reduced radius defined as r =l/min rmaxV^2> ro ls t n e scale-length, and n is a free variable. For n= 1 this is theexponential radial surface brightness distribution that provides a good description of thebrightness profile for many spiral disks. As n becomes large, the Sersic profile approachesa power law. Broeils & Courteau (1996) have found that the central regions of spirals arealso best fit by exponential profiles. In other words two exponentials may be used toprovide a satisfactory fit to the light profiles of a significant fraction of all spiral galaxies.Broeils & Courteau find that the ratio of bulge/disk scale lengths is typically x 0.1. It isnot yet clear why Nature appears to be so inordinately fond of exponential disks! The casen = 4 corresponds to the V to the quarter' law, which de Vaucouleurs (1948,1953,1959b)found to give a good representation of the surface brightness distribution of manyellipticals that are more luminous than MB = —18. For fainter dE and dSph galaxiesYoung & Currie (1994) find that the radial surface brightness distribution is related toabsolute magnitude by the relation
MB = (3.9 ± 0.3)/n - 18.8 ± 0.3, (2)
in which MB was calculated by assuming Ho = 50 km s~' Mpc~ i . Using more extensivedata Jerjen & Binggeli (1997) find
48 Elliptical galaxies
MB m - 10 log n - 14. (3)
Young & Currie suggest that the n-values of dE galaxies are a strong function of thegravitational potential well constraining their constituent stars. In the MB versus n planedE galaxies lie on a linear relation that branches off from the ellipticals with n = 4 that arebrighter than MB = —18. Equation (2) can be used to determine the relative distances ofclusters of galaxies. Furthermore, using NGC 147, NGC 185, NGC 205 and the Fornaxdwarf as calibrators, it can be employed to estimate the value of the Hubble parameter.However, Jerjen & Binggeli (1997) caution that the intrinsic dispersion in Equation (3)may be too large for this approach to carry much weight. Some of this dispersion may bedue to the fact that elliptical and dwarf spheroidal galaxies might belong to physicallydistinct families (Wirth & Gallager 1984, Kormendy 1985, Gorgas et al. 1997).
A quite different approach has been taken by Saglia et al. (1997) who suggest that (forn < 8) the profiles of elliptical galaxies may be thought of as consisting of an r1/4
component, on which an exponential disk with the appropriate scale-length and disk-to-bulge ratio has been superposed. In other words Saglia et al. propose that the variety ofluminosity profiles exhibited by early-type galaxies may be due to the presence of diskcomponents of various strengths.
The structure of the envelopes of luminous E and cD galaxies has been discussed ingreat detail by Schombert (1986, 1987, 1988). He finds that their structure is wellcorrelated with, and a smooth function of, luminosity. For the brightest cluster galaxiesGraham et al. (1996) find a large scatter in n values. As expected (Caon, Capaccioli &D'Onofrio 1993) brightest cluster galaxies with the largest values of the radial scale-lengthr0 are, on average, also observed to exhibit the highest values of n. A nice plot of therelationship between n and the half-light radii of cD, SO/E and dSph galaxies is shown byCourteau (1996a). His plot shows that the brightest galaxies in rich clusters have both thelargest values of n and the largest effective radii. Courteau, de Jong & Broeils (1996) notethat a significant fraction of early-type (Sa-Sab) galaxies are best represented by an n = 2brightness profile. These authors also find that only a small fraction of the galactic bulgesare best represented by an r1^ profile.
8.2 Boxy and disky ellipticals
The first evidence suggesting that elliptical galaxies might constitute a composite popula-tion was obtained by Davies et al. (1983), who discovered that intrinsically faint ellipticalsrotate more rapidly than luminous ones. The next piece of evidence to support this viewwas obtained independently by Bender (1988) and by Nieto, Capaccioli & Held (1988)who found that some ellipticals appear to contain inner disks. The present view on thisquestion has been summarized as follows by Kormendy & Bender (1996): 'there is adichotomy between (1) normal- and low-luminosity ellipticals that rotate rapidly, that arenearly isotropic and oblate-spheroidals, that are coreless, and that have disky-distortedisophotes, and (2) giant ellipticals that are essentially non-rotating, that are anisotropicand moderately tri-axial, and that have cuspy cores, that are boxy-distorted.' Recent
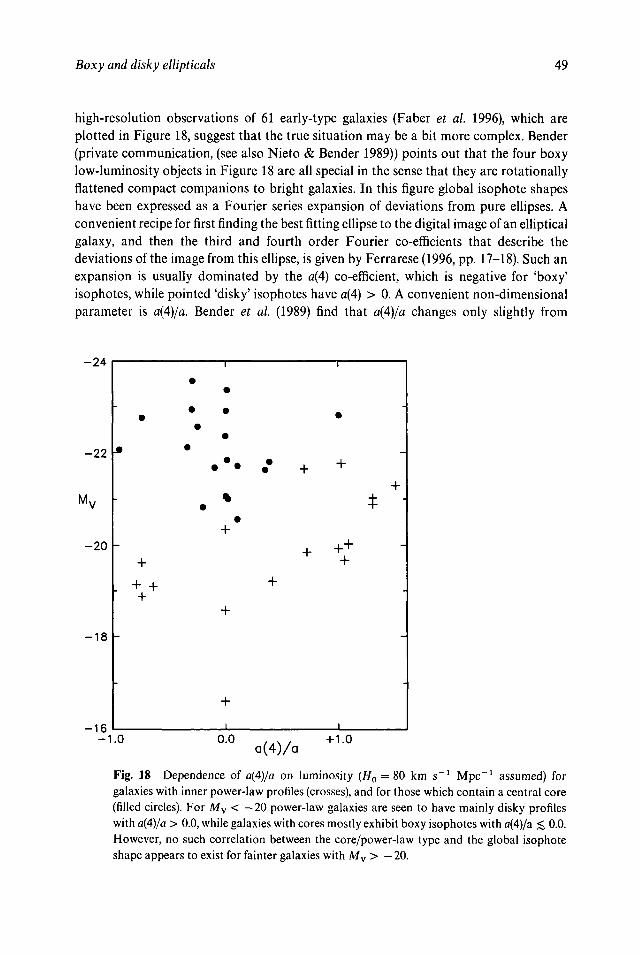
Boxy and disky ellipticals 49
high-resolution observations of 61 early-type galaxies (Faber et al. 1996), which areplotted in Figure 18, suggest that the true situation may be a bit more complex. Bender(private communication, (see also Nieto & Bender 1989)) points out that the four boxylow-luminosity objects in Figure 18 are all special in the sense that they are rotationallyflattened compact companions to bright galaxies. In this figure global isophote shapeshave been expressed as a Fourier series expansion of deviations from pure ellipses. Aconvenient recipe for first finding the best fitting ellipse to the digital image of an ellipticalgalaxy, and then the third and fourth order Fourier co-efficients that describe thedeviations of the image from this ellipse, is given by Ferrarese (1996, pp. 17-18). Such anexpansion is usually dominated by the a(4) co-efficient, which is negative for 'boxy'isophotes, while pointed 'disky' isophotes have a(4) > 0. A convenient non-dimensionalparameter is a(4)/a. Bender et al. (1989) find that a(4)/a changes only slightly from
-24
-1.0a(4)/a
+ 1.0
Fig. 18 Dependence of a(4)/a on luminosity (Ho = 80 km s ' Mpc ' assumed) forgalaxies with inner power-law profiles (crosses), and for those which contain a central core(filled circles). For Mv < — 20 power-law galaxies are seen to have mainly disky profileswith a(4)/a > 0.0, while galaxies with cores mostly exhibit boxy isophotes with fl(4)/a < 0.0.However, no such correlation between the core/power-law type and the global isophoteshape appears to exist for fainter galaxies with M v > — 20.
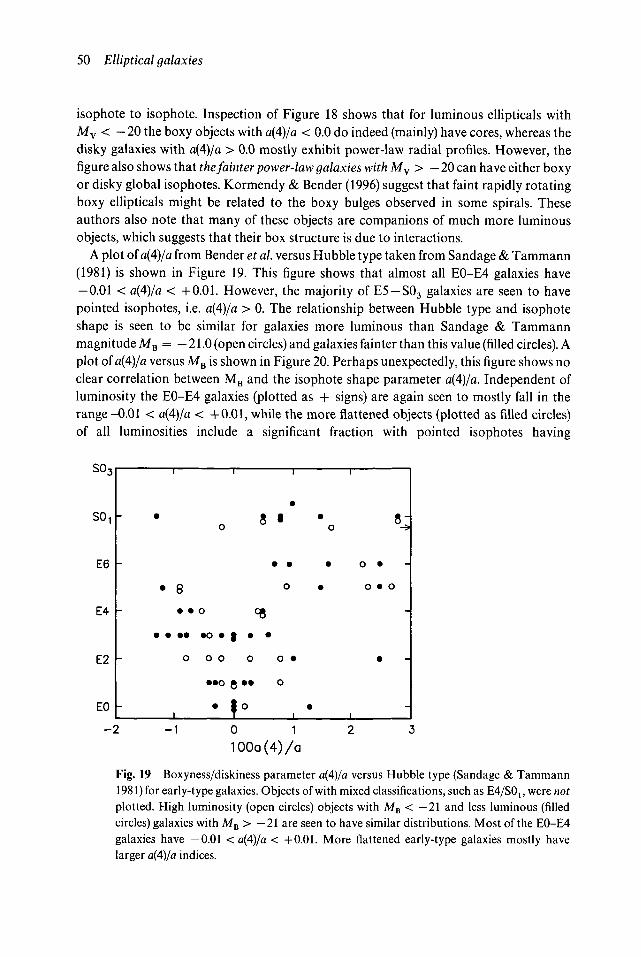
50 Elliptical galaxies
isophote to isophote. Inspection of Figure 18 shows that for luminous ellipticals withMv < - 20 the boxy objects with a(4)/a < 0.0 do indeed (mainly) have cores, whereas thedisky galaxies with a(4)/a > 0.0 mostly exhibit power-law radial profiles. However, thefigure also shows that the fainter power-law galaxies with M v > — 20 can have either boxyor disky global isophotes. Kormendy & Bender (1996) suggest that faint rapidly rotatingboxy ellipticals might be related to the boxy bulges observed in some spirals. Theseauthors also note that many of these objects are companions of much more luminousobjects, which suggests that their box structure is due to interactions.
A plot of a(4)/a from Bender et al. versus Hubble type taken from Sandage & Tammann(1981) is shown in Figure 19. This figure shows that almost all E0-E4 galaxies have—0.01 < a{4)/a < +0.01. However, the majority of E5 —S03 galaxies are seen to havepointed isophotes, i.e. a(4)/a > 0. The relationship between Hubble type and isophoteshape is seen to be similar for galaxies more luminous than Sandage & Tammannmagnitude MB = — 21.0 (open circles) and galaxies fainter than this value (filled circles). Aplot of a(4)/a versus MB is shown in Figure 20. Perhaps unexpectedly, this figure shows noclear correlation between MB and the isophote shape parameter a(4)/a. Independent ofluminosity the E0-E4 galaxies (plotted as + signs) are again seen to mostly fall in therange -0.01 < a(4)/a < +0.01, while the more flattened objects (plotted as filled circles)of all luminosities include a significant fraction with pointed isophotes having
3
so,
E6
E4
E2
EO
i
0
-
• 8
• • o
• • • • *o •
0 O O
• • o
-
1
t
8
•
0
• •
0
8
•
1
• '
0
0 •
o
f
o
• 0 •
• o •
•
1
8 ;
-
o
-
-
-
- 2 - 1 0 1100a (4) /a
Fig. 19 Boxyness/diskiness parameter a(4)/a versus Hubble type (Sandage & Tammann1981) for early-type galaxies. Objects of with mixed classifications, such as E4/S0u were notplotted. High luminosity (open circles) objects with MB < — 21 and less luminous (filledcircles) galaxies with MB > —21 are seen to have similar distributions. Most of the E0-E4galaxies have —0.01 < a(4)/a < +0.01. More flattened early-type galaxies mostly havelarger a(4)/a indices.
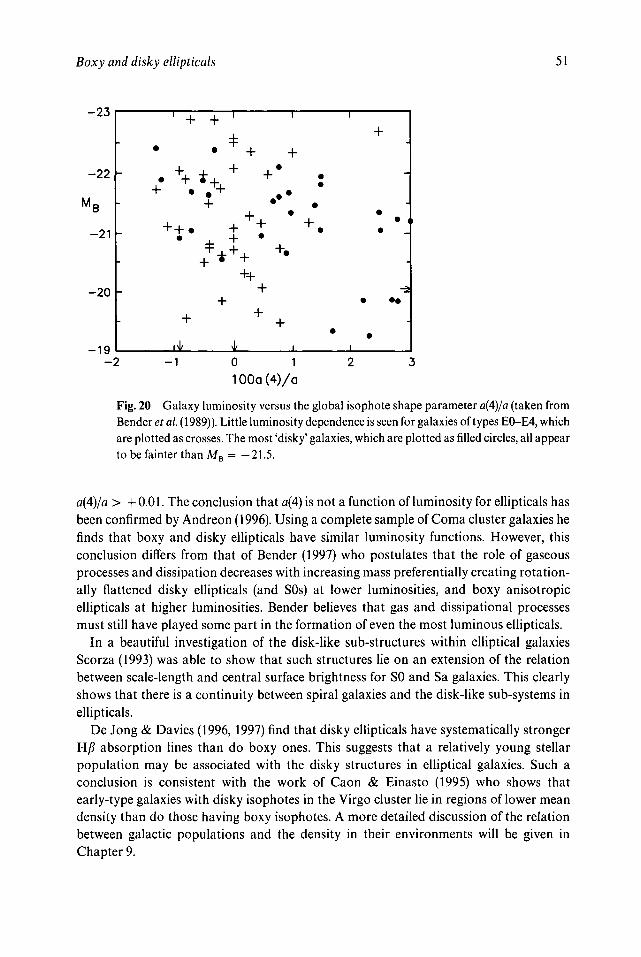
Boxy and disky ellipticals 51
- 23
- 2 2 -
MB
-21
- 2 0 |-
-19- 2
4*
-
1 + +
•
INI/
4
+4
i
• •
+-I-
+
I
•
•
f
• . ;
-2
-1 0 1
100a (4)/a
Fig. 20 Galaxy luminosity versus the global isophote shape parameter a(4)/a (taken fromBender et al. (1989)). Little luminosity dependence is seen for galaxies of types E0-E4, whichare plotted as crosses. The most 'disky' galaxies, which are plotted as filled circles, all appearto be fainter than MB = -21.5.
a(4)/a > +0.01. The conclusion that a(4) is not a function of luminosity for ellipticals hasbeen confirmed by Andreon (1996). Using a complete sample of Coma cluster galaxies hefinds that boxy and disky ellipticals have similar luminosity functions. However, thisconclusion differs from that of Bender (1997) who postulates that the role of gaseousprocesses and dissipation decreases with increasing mass preferentially creating rotation-ally flattened disky ellipticals (and SOs) at lower luminosities, and boxy anisotropicellipticals at higher luminosities. Bender believes that gas and dissipational processesmust still have played some part in the formation of even the most luminous ellipticals.
In a beautiful investigation of the disk-like sub-structures within elliptical galaxiesScorza (1993) was able to show that such structures lie on an extension of the relationbetween scale-length and central surface brightness for SO and Sa galaxies. This clearlyshows that there is a continuity between spiral galaxies and the disk-like sub-systems inellipticals.
De Jong & Davies (1996, 1997) find that disky ellipticals have systematically strongerH/i absorption lines than do boxy ones. This suggests that a relatively young stellarpopulation may be associated with the disky structures in elliptical galaxies. Such aconclusion is consistent with the work of Caon & Einasto (1995) who shows thatearly-type galaxies with disky isophotes in the Virgo cluster lie in regions of lower meandensity than do those having boxy isophotes. A more detailed discussion of the relationbetween galactic populations and the density in their environments will be given inChapter 9.
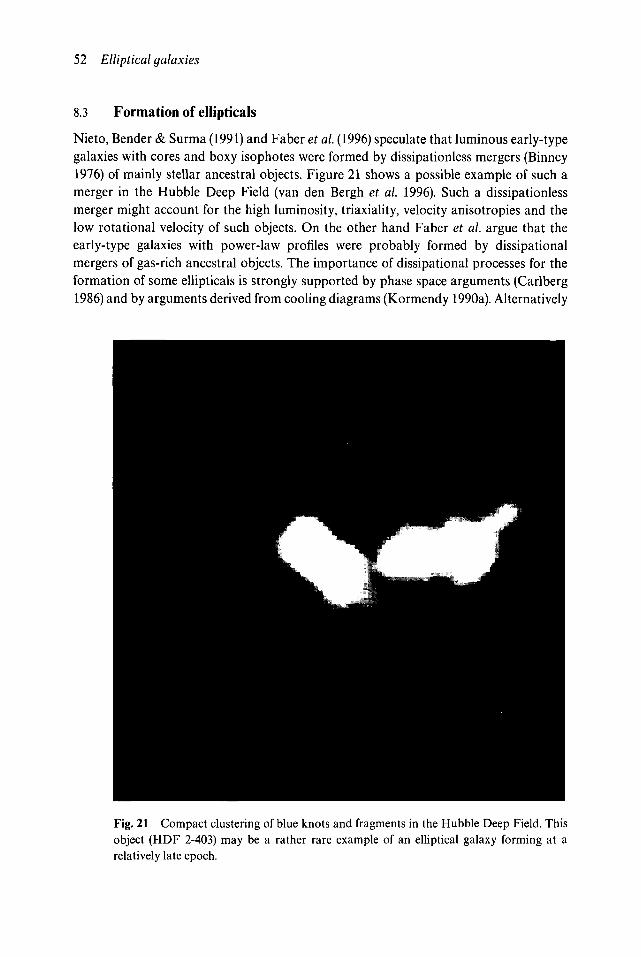
52 Elliptical galaxies
8.3 Formation of ellipticals
Nieto, Bender & Surma (1991) and Faber et al. (1996) speculate that luminous early-typegalaxies with cores and boxy isophotes were formed by dissipationless mergers (Binney1976) of mainly stellar ancestral objects. Figure 21 shows a possible example of such amerger in the Hubble Deep Field (van den Bergh et al. 1996). Such a dissipationlessmerger might account for the high luminosity, triaxiality, velocity anisotropies and thelow rotational velocity of such objects. On the other hand Faber et al. argue that theearly-type galaxies with power-law profiles were probably formed by dissipationalmergers of gas-rich ancestral objects. The importance of dissipational processes for theformation of some ellipticals is strongly supported by phase space arguments (Carlberg1986) and by arguments derived from cooling diagrams (Kormendy 1990a). Alternatively
Fig. 21 Compact clustering of blue knots and fragments in the Hubble Deep Field. Thisobject (HDF 2-403) may be a rather rare example of an elliptical galaxy forming at arelatively late epoch.
The fundamental plane 53
one could, of course, assume that such disky galaxies formed a la Eggen, Lynden-Bell andSandage (1962 = ELS), by rapid dissipational collapse of a single gas-rich protogalaxy.One might also think in terms of an ELS + noise (Sandage 1990) model in which somelate-time capture of smaller ancestral fragments is superposed on a more general collapse.A possible problem with the attractive scenario proposed by Faber et al. is that it does notexplain why faint (Mv > — 20) early-type galaxies can have either disky or boxy globalisophotes. Perhaps tidal distortions (Kormendy 1980) of isophotes are more importantfor such low-mass, faint, early-type galaxies than they are for more massive luminousones. Since global isophotes may be affected by environmental factors (which do notinfluence galaxy cores) it seems likely that the bulge/power-law dichotomy of galaxy coresis more fundamental than the boxy/disky one for the global profiles of early-type galaxies.Possibly boxy low-luminosity objects are tidally truncated boxy bulges (Nieto & Bender1989).
Indirect evidence on the early evolutionary history of elliptical galaxies may beprovided by the color (metallicity) distribution of their globular clusters. Objects thatexperienced a simple monolithic collapse might be expected to have a globular clustersystem that exhibits a single maximum in its color distribution. On the other handearly-type galaxies that underwent a complex evolutionary history are expected (Ashman& Zepf 1992) to exhibit a multi-peaked frequency distribution of globular cluster colors.Forbes (1996) provides V-I color distributions for globular cluster systems associatedwith four of the early-type galaxies for which Faber et al. (1996) provide bulge/power-lawclassifications. Three of these objects (NGC 3608, NGC 4365 and NGC 5813) have coresand single-peaked color distributions. The galaxy (NGC 1700), which exhibits a power-law density distribution, does not contain a sufficiently large number of globular clusterswith color information to establish the nature of their color distribution. Studies of thecolor distributions of globular clusters surrounding some of the other galaxies studied byFaber et al. might throw significant light on the nature of the early evolution of ellipticaland SO galaxies. Kissler-Patig (1997) finds that boxy ellipticals tend to have higher specificglobular cluster frequencies S than do disky ones. However the Virgo galaxies NGC 4472[a(4)/a = - 0 . 3 , S = 6] and NGC 4486 [a(4)/a = 0.0, S = 14] are counterexamples to thistrend.
Faber et al. (1996) make the interesting suggestion that the cores of luminous early-typegalaxies might have formed when massive black holes at the centers of two mergingancestral galaxies spiralled together, while transferring their orbital energy to (and henceheating up) the stars that were originally present. If this hypothesis is correct then theabsence of cores in disky power-law galaxies might be due to the fact that such objects(mainly) formed by collapse of a single proto-galaxy.
8.4 The fundamental plane
Casual inspection of the images of elliptical galaxies might seem to suggest that they areall very similar, i.e. if you have seen one elliptical you have seen them all. However, plotsrelating pairs of parameters describing elliptical galaxies are found to exhibit consider-
54 Elliptical galaxies
able intrinsic scatter (Faber & Jackson 1976, Kormendy 1977, Binggeli, Sandage &Tarenghi 1984). This induced Djorgovski & Davis (1987) and Dressier et al. (1987) topropose independently that early-type galaxies populate a plane in the parameter spacedefined by re, ^e, and a, in which fic is the surface brightness at re, and a is the velocitydispersion. By taking advantage of this relationship it is possible to determine theluminosities of galaxies with greater precision than would be possible from the relationbetween Mv and [ie or between Mv and a.
8.5 Summary
Luminous elliptical galaxies appear to be either boxy objects that contain cores, or diskypower-law structures that do not contain such cores. Possibly boxy ellipticals formed bymergers of (mostly stellar) ancestral objects. On the other hand disky ellipticals may haveformed a la Eggen, Lynden-Bell and Sandage, from a single proto-galaxy, or from themerger of mainly gaseous ancestral objects. If this view is correct then the strength of thedisk-like component in a galaxy depends on the gas fraction that remained in its ancestralobjects at the time of their merger(s). The presence of cores might be due to ejection ofstars resulting from heating by merging massive black holes that originated in the nucleiof ancestral galaxies. The apparent lack of correlation between the bulge/power-lawdichotomy, and the boxy/disky one for the least luminous galaxies, which is seen inFigure 18, might be due to the effects of tidal distortions on the global isophote shapes oflower-luminosity ellipticals. Detailed studies of the frequency distribution of metallicitieswithin globular cluster systems should help to throw light on the early evolutionaryhistory of elliptical galaxies.
9 The SO class
9.1 Introduction
It is surprising that Hubble (1936, p. 55, pp. 79-81) makes only a few passing references tothe fact that early-type (E-SO-Sa) galaxies predominate in rich clusters, whereas the fieldis dominated by galaxies of late type (Sc-Ir). Spitzer & Baade (1951) were the first toemphasize the physical importance of the fact that the frequency of SO galaxies is greatestin rich clusters of galaxies. Van den Bergh (1962) subsequently used the difference betweenthe galactic populations in rich clusters and in the field to show that rich clusters must bestable over periods comparable to the age of the Universe. In particular the difference inthe galactic populations of clusters and field provided a powerful argument against thetentative speculation by Hubble (1936, p. 81) 'that the disintegration of clusters maypopulate the general field.' The possible physical significance of the relation betweengalaxy morphology and environmental density was first discussed in great detail byDressier (1980), who stressed that elliptical galaxies are most frequent in the regions ofhighest density, whereas late-type spirals predominate in low-density regions. A some-what different approach was taken by Whitmore & Gilmore (1991) who found that galaxymorphology was strongly correlated with distance from the cluster center. It is, of course,difficult to disentangle these effects because local density and distance from the clustercenter are closely correlated. Sanroma & Salvador-Sole (1990) found that galaxy mor-phology does not appear to be affected by sub-clumpings within rich clusters. FinallyDressier et al. (1994) have used HST images of a distant rich cluster to show that blue(Butcher-Oemler (1978)) cluster galaxies appear to be normal late-type spirals. Thiscontrasts with the situation at low redshifts, where the flattened disk-like objects in richclusters are mostly of type SO. Such observations suggest that significant numbers ofspirals may have become transformed into lenticulars during the last 5-7 Gyr.
9.2 Definition of the SO class
The SO classification type was introduced by Hubble (1936, p. 44). He wrote that 'nebulaeintermediate between E7 and Sa are occasionally designated as SO.' Furthermore, he(Hubble 1936, p. 45) emphasized that 'The transitional stage, SO, is more or less hypotheti-cal.' Whereas Hubble (1936) regarded SO galaxies as being transitional between ellipticalsand spirals, Spitzer & Baade (1951) suggested that they might, in fact, form a dustlesssequence that parallels the Sa-Sb-Sc tine of the Hubble tuning fork diagram (cf. Figures
56 The SO class
11 and 12). Specifically Spitzer & Baade proposed that SO galaxies were flattened objectsfrom which gas had been removed by collisions between spirals. Regarding the nature ofSO galaxies Morgan (Matthews, Morgan & Schmidt 1964) writes that 'the class SO, asused by Hubble, applies to galaxies having a variety of superficial appearances; that is, amental picture of a unique galaxy form could not be derived from the class SO.' Sandage(1961) states that the existence of SO galaxies was established empirically by data accumu-lated during a photographic survey of nearby galaxies carried out between 1936 and 1950.He divided SO galaxies into three subclasses S01; S02 and S03. The distribution of lightacross SO, galaxies is continuous with no traces of structure or of dust. A weak dust lane isseen projected on the central bulges of S02 galaxies that are viewed almost edge-on. Asharp, narrow, absorption lane is seen to be embedded in the lens component of S03
galaxies. These sub-types of the SO class are illustrated in The Hubble Atlas of Galaxies(Sandage 1961).
9.3 Luminosity of SO galaxies
The different sub-types of the SO class are found to have luminosity distributions that areindistinguishable from each other. Furthermore no dependence of luminosity on (projec-ted) galaxy flattening is found among members of the SO class. The latter result isunexpected because the luminosity distribution of ellipticals peaks ~1.5 mag brighterthan that of SO galaxies (van den Bergh 1990). One might, perhaps, have expected roundSOs to have luminosities similar to ellipticals.
Hubble (1936, p. 42) wrote that 'The transition from E7 to SBa is smooth andcontinuous but that from E7 to Sa may be cataclysmic - all known examples of Sa havefully developed arms.' This question has more recently been studied by Sandage (1961).He speculated that Sa galaxies with spiral arms (Sa(s)) are a continuation of type S02,whereas he hypothesized that Sa galaxies with rings (Sa(r)) branch off from type S03.However, the luminosity distribution of the S02 and Sa(s) galaxies in A Revised Shapley-Ames Catalog of Bright Galaxies (Sandage & Tammann 1981) argues against such acontinuity. For the S02 galaxies in this sample < MB > = —20.56 + 0.27 compared to< MB > = —21.35 + 0.18 for the Sa(s) galaxies. A Kolmogorov-Smirnov test showsonly a ~ 1 % probability that the absolute magnitudes of the Shapley-Ames S02 and Sa(s)galaxies were drawn from the same distribution of parent galaxy luminosities. For theShapley-Ames S03 galaxies < MB > =—20.40 ± 0.22, compared to < MB >= -21.08 ± 0.17 for objects of type Sa(r). In both cases the SO galaxies are seen to befainter than the corresponding subclass of Sa galaxies. The luminosity difference betweenS02 and Sa(s), and that between the S03 and Sa(r), galaxies militates against the hypothesisthat there is a smooth transition between these morphological classes of objects.
From high signal-to-noise spectra Kuijken, Fisher & Merrifield (1996) find that prob-ably only ~ 1% of all SO galaxies exhibit a counterrotating stellar disk, whereas 24 + 8%of the gaseous disks in SO galaxies are counterrotating. This suggests that a significantfraction of the cases in which SO galaxies contain gas is due to capture of H I clouds.
Summary 57
9.4 Summary
Objects of type SO are, on average, fainter than Sa galaxies. Furthermore, no correlation isfound between the luminosity and the (projected) flattening of SO galaxies. Finally, nosignificant differences are found between the luminosity distributions of galaxies havingsub-types SO,, S02 and S03.

io Early-type galaxies
10.1 Cores and power-law profiles
Lauer et al. (1995) have used the Planetary Camera of the HST to image the centralregions of 57 early-type galaxies. They found that the radial surface brightness profiles ofmost of these fall into two distinct classes: (1) galaxies that have cores, and (2) galaxies thatexhibit power-law profiles that continue down to radii near the resolution limit. Of thegalaxies observed by Lauer et al. 15 have cores and 30 exhibit power-law profiles. Amongthe galaxies that have been classified as having either cores or power-law profiles 21 arecontained in A Revised Shapley-Ames Catalog of Bright Galaxies (Sandage & Tammann1981). Since the statistics of objects in this catalog are better understood than those of theentire sample, only the nine galaxies with cores and the 12 having power-law profiles thatare in the Shapley-Ames Catalog will be considered below. The most striking feature ofthese data (which has already been commented on by Lauer et al. and others) is that thegalaxies with cores tend to be more luminous than those with power-law profiles. For theShapley-Ames sub-sample a Kolmogorov-Smirnov test rejects the hypothesis that thegalaxies with bulges were drawn from the same luminosity distribution as those havingpower-law profiles at the 97% confidence level. Furthermore four out of nine (44%) of thegalaxies with cores have types E0-E4, compared to only one out of 12 (8%) of the objectswith power-law profiles. Many years ago van den Bergh (1962) inspected the Palomar SkySurvey to classify the environments of all northern Shapley-Ames galaxies into threetypes: (a) field, (b) (small) groups, and (c) clusters. For the present sample the numbers inthese three groups are 1:0:7, respectively, for objects with cores compared to 4:1:7,respectively, for ones with power-law profiles. In other words the very scanty data that areavailable weakly suggest that early-type galaxies with power-law spectra are morecommon in the field than they are in clusters. One striking feature of the data of Lauer etal. is that galaxies with off-center nuclei are much more common (6 out of 15) amonggalaxies with cores than they are among galaxies with power-law profiles (1 out of 30).Possibly this difference is due to the fact that galaxies with cores formed during violentmergers, whereas disky galaxies may have formed in a more quiescent fashion.
The most plausible explanation for the dispersion that is observed in the correlationbetween classifications of early-type galaxies based on global isophotes, and thosederived from the profiles in the central regions of galaxies is that: (1) tidal interactions canmodify the outer structure of ellipticals (Kormendy 1977); and (2) that projection effectscan affect the global isophote classifications (Gerhard & Binney 1996). Such projection
60 Early-type galaxies
effects should be least important in early-type galaxies that are viewed almost edge-on. Inview of these problems it is probably safest to place more reliance on classifications ofearly-type galaxies that are based on either: (1) radial intensity profiles of the unperturbedinner regions, or (2) classifications that take advantage of the kinematical differencesbetween galaxies with cores and ones that exhibit power-law intensity profiles.
10.2 Relation between E, SO and Sa galaxies
Van den Bergh (1989a, 1990) finds that it is often difficult to distinguish objects that havebeen classified as ellipticals from those assigned to type SO by Sandage & Tam-mann(1981), on the basis of their published surface photometry. However, the data doindicate that exponential disks occur more often in SO galaxies than they do in ellipticals.Furthermore, ellipticals exhibit their maximum flattening at intermediate radii moreoften than do SO galaxies. In the rather small sample of early-type galaxies that have bothcore-type classifications by Lauer et al. (1995) and global photometry in their outerregions one finds that: (1) objects with cores tend to have ellipticities that increase towardslarger radii, and (2) galaxies with central power-law profiles also preferentially havepower-law luminosity distributions in their outer regions.
Figure 22 shows a histogram of the luminosity distributions of galaxies of types E, SO,Sa and Sb in A Revised Shapley-Ames Catalog of Bright Galaxies (Sandage & Tammann1981). This figure shows that objects classified as SO are systematically fainter than thoseof types E and Sa. This clearly shows that SO galaxies cannot be the 'missing link' betweenellipticals and spirals. In view of the difficulty in distinguishing ellipticals from lenticularsit is, of course, quite possible that some of the brighter SO galaxies are, in fact, mis-classified ellipticals. Such mis-classifications may be particularly common among SOsviewed nearly pole-on. By the same token it may well be that some of the fainter Egalaxies are, in fact, mis-classified SOs. Two lines of evidence support this suggestion: (1)faint SOs are, on average, much more highly flattened than luminous SOs (see Figure 2 ofvan den Bergh (1990)), i.e. some faint SOs viewed pole-on might have been mis-classified asellipticals, and (2) Davies et al. (1983) find that most faint ellipticals are spinning morerapidly than luminous ones and are therefore probably supported by rotation. Finally,some SO galaxies with very luminous bulges may have been mis-classified as ellipticalsbecause the light of their faint disks was swamped by the light of a bright spheroid.
Binggeli & Jerjen (1997) make the interesting point that the discontinuity in the surfacebrightness-luminosity relation around MB = — 20, which fostered the notion of a physi-cal dichotomy between normal and dwarf ellipticals, is restricted to the very central partsof galaxies. Outside the central region (r > 300 pc) the radial surface brightness profilevaries continuously between dwarf and giant ellipticals.
10.3 Summary
Available evidence favors a picture in which early-type galaxies, other than dwarfspheroidals, can be assigned to two (possibly overlapping) classes: (1) true ellipticals with
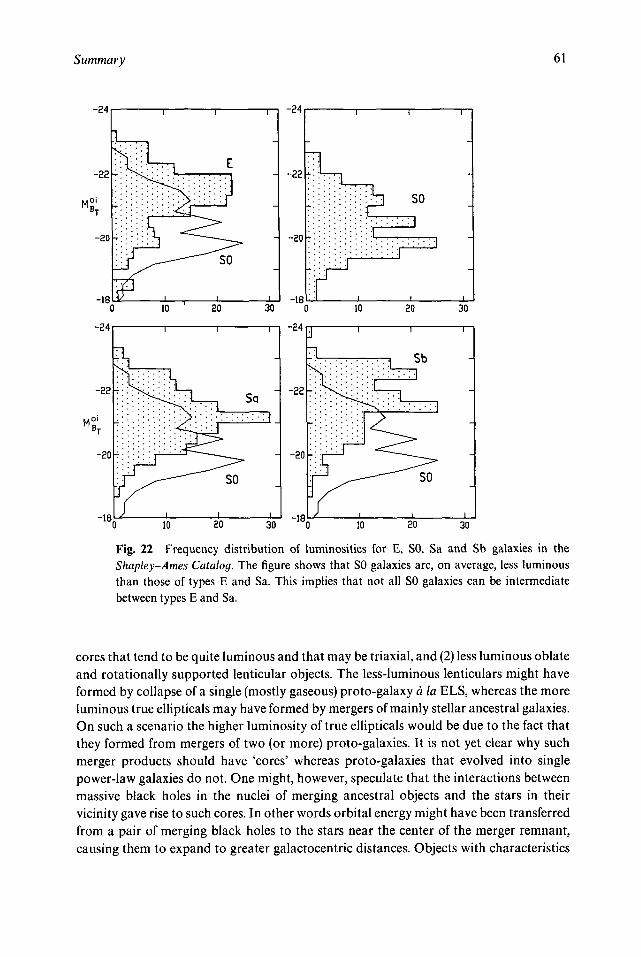
Summary 61
-24
10 20 30 0
10 20 30 10 20 30
Fig. 22 Frequency distribution of luminosities for E, SO, Sa and Sb galaxies in theShapley-Ames Catalog. The figure shows that SO galaxies are, on average, less luminousthan those of types E and Sa. This implies that not all SO galaxies can be intermediatebetween types E and Sa.
cores that tend to be quite luminous and that may be triaxial, and (2) less luminous oblateand rotationally supported lenticular objects. The less-luminous lenticulars might haveformed by collapse of a single (mostly gaseous) proto-galaxy a la ELS, whereas the moreluminous true ellipticals may have formed by mergers of mainly stellar ancestral galaxies.On such a scenario the higher luminosity of true ellipticals would be due to the fact thatthey formed from mergers of two (or more) proto-galaxies. It is not yet clear why suchmerger products should have 'cores' whereas proto-galaxies that evolved into singlepower-law galaxies do not. One might, however, speculate that the interactions betweenmassive black holes in the nuclei of merging ancestral objects and the stars in theirvicinity gave rise to such cores. In other words orbital energy might have been transferredfrom a pair of merging black holes to the stars near the center of the merger remnant,causing them to expand to greater galactocentric distances. Objects with characteristics
62 Early-type galaxies
that are intermediate between those of true ellipticals and lenticular galaxies could havearisen from mergers between ancestral objects that were still partly gaseous.
Interesting hints about the differences in the evolutionary histories of ellipticals andspheroidal galaxies are provided by recent observations of central line-strength indicesfor Mg2, <Fe>, and Hj? by Gorgas et al. (1997). These authors find that, for a given <Fe>,ellipticals have systematically stronger Mg2 than do SO galaxies. This strongly suggeststhat ellipticals collapsed more rapidly than spheroidal galaxies.
li Dwarf spheroidal galaxies
ll.l Introduction
Dwarf spheroidals are the most common type of galaxy in the Universe. The fact that theywere not discovered until 1938 is entirely due to their feeble luminosity and low surfacebrightness. Of the 29 galaxies that are known to be located within 1.0 Mpc, approximate-ly half are dwarf spheroidals (dSph). A listing of these Local Group dSph galaxies is givenin Table 14. For the sake of completeness the dSph/dE galaxies NGC 147 and NGC 185,which are both brighter than M v = —15.0, have been included in the table. Since most ofthe faintest known Local Group members are dwarf spheroidals it is almost certain thatadditional very faint dSph galaxies remain to be discovered in the Local Group. Inparticular it seems probable that more dSph companions to M31 will eventually befound. Only three such objects (And I, And II and And III) are presently known (van denBergh 1972), whereas seven dSph companions (Sgr, UMi, Dra, Scl, Sex, Car, For) areknown to be located within 150 kpc of the Galaxy - even though the Milky Way system isless luminous than the Andromeda nebula. It is, of course, possible that the small numberof M31 dSph satellites is due to the fact that some dwarf companions to M31 weredestroyed by tidal interactions with M32 and NGC 205. For reviews on dwarf spheroidalgalaxies the reader is referred to Da Costa (1992), Gallagher & Wyse (1994) and Ferguson& Binggeli (1994).
11.2 Population content
A compilation of the mean metallicities of dwarf spheroidal galaxies has been given byArmandroff et al. (1993). These data show a loose correlation between the integratedmagnitudes Mv, and the mean metallicities < [Fe/H] > of dSph galaxies, in the sensethat the least luminous objects have the lowest metallicities. This trend is strengthened bythe observations of Mateo et al. (1995) which show that the Sagittarius dSph galaxy(which may originally have been much more luminous than its present valueMv 13::) has < [Fe/H] > 1.1 ± 0.3, which is higher than that of any of theother dSph galaxies fainter than M v = —15.0.
Color-magnitude diagrams of dSph galaxies show that many of these objects have hadquite complex evolutionary histories. Some of them, like the Draco and Ursa Minorsystems, appear to contain an almost pure old stellar population. Others, such as Fornaxand Carina, have a stellar population that is predominantly of intermediate age. In fact
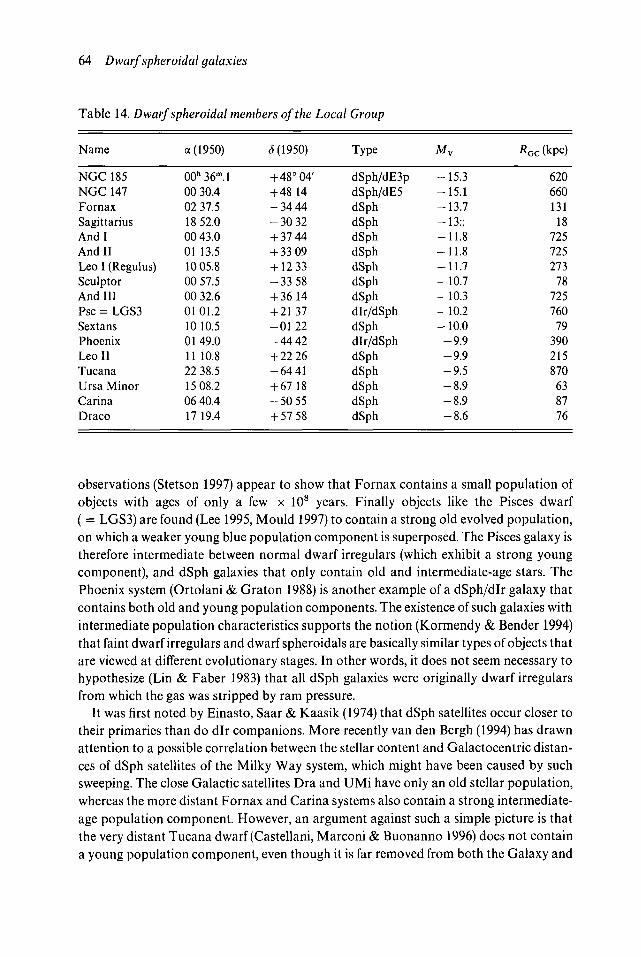
64 Dwarf spheroidal galaxies
Table 14. Dwarf spheroidal members of the Local Group
Name
NGC 185NGC 147FornaxSagittariusAnd IAnd IILeo I (Regulus)SculptorAnd IIIPsc = LGS3SextansPhoenixLeo IITucanaUrsa MinorCarinaDraco
a (1950)
00h36m.l00 30.402 37.518 52.000 43.001 13.510 05.800 57.500 32.60101.210 10.501 49.011 10.822 38.515 08.206 40.417 19.4
6 (1950)
+ 48° 04'+ 48 14- 3 4 44- 3 0 32+ 37 44+ 33 09+ 12 33- 3 3 58+ 3614+ 21 37- 0 1 2 2- 4 4 42+ 22 26- 6 4 41+ 67 18- 5 0 55+ 57 58
Type
dSph/dE3pdSph/dE5dSphdSphdSphdSphdSphdSphdSphdlr/dSphdSphdlr/dSphdSphdSphdSphdSphdSph
My
-15.3-15.1-13.7-13 : :-11.8-11.8-11.7-10.7-10.3-10.2-10.0
-9 .9-9 .9-9 .5-8 .9-8 .9-8 .6
Rac (kpc)
62066013118
725725273
7872576079
390215870638776
observations (Stetson 1997) appear to show that Fornax contains a small population ofobjects with ages of only a few x 108 years. Finally objects like the Pisces dwarf( = LGS3) are found (Lee 1995, Mould 1997) to contain a strong old evolved population,on which a weaker young blue population component is superposed. The Pisces galaxy istherefore intermediate between normal dwarf irregulars (which exhibit a strong youngcomponent), and dSph galaxies that only contain old and intermediate-age stars. ThePhoenix system (Ortolani & Graton 1988) is another example of a dSph/dlr galaxy thatcontains both old and young population components. The existence of such galaxies withintermediate population characteristics supports the notion (Kormendy & Bender 1994)that faint dwarf irregulars and dwarf spheroidals are basically similar types of objects thatare viewed at different evolutionary stages. In other words, it does not seem necessary tohypothesize (Lin & Faber 1983) that all dSph galaxies were originally dwarf irregularsfrom which the gas was stripped by ram pressure.
It was first noted by Einasto, Saar & Kaasik (1974) that dSph satellites occur closer totheir primaries than do dlr companions. More recently van den Bergh (1994) has drawnattention to a possible correlation between the stellar content and Galactocentric distan-ces of dSph satellites of the Milky Way system, which might have been caused by suchsweeping. The close Galactic satellites Dra and UMi have only an old stellar population,whereas the more distant Fornax and Carina systems also contain a strong intermediate-age population component. However, an argument against such a simple picture is thatthe very distant Tucana dwarf (Castellani, Marconi & Buonanno 1996) does not containa young population component, even though it is far removed from both the Galaxy and
Population content 65
M31. Oosterloo, Da Costa & Staverley-Smith (1996) have found a cloud with a mass of~ 1.5 x 10⁶ M Q of H I that might be associated with the Tucana dwarf. They note that'The presence of H I associated with Tucana would mean that the three isolated LocalGroup dwarfs with dominant old stellar populations, namely Tucana, Phoenix andLGS3, are all distinct from the dwarf spheroidal companions of the Galaxy and M31 inthat they possess measurable amounts of H I.' Perhaps these three isolated systems havebeen able to retain some primordial H I, whereas dSph galaxies near M31 and the Galaxymay have been swept free of such gas. However, such a simple scenario does not appear tobe consistent with the observation (Mateo et al. 1995) that the very nearby Sagittariussystem, which would be expected to have been swept clean of gas early in its career,contains a significant ~ 10 Gyr old intermediate-age population. Only the rather ad hochypothesis that the Sgr system has fallen in from a very large distance, appears able tosave the notion that the dwarfs near M31 and the Galaxy were stripped of gas by movingthrough the halos of these giant galaxies. The Pegasus dwarf irregular galaxy (Aparicio &Gallart 1995) is an example of an intrinsically faint dlr galaxy that contains a strong oldred population component. Among more luminous dwarf irregulars the WLM galaxy( = DDO221) is found (Minniti & Zijlstra 1996) to be embedded in a strong old metal-poor halo, and the SO/dSph galaxy NGC 205 (Lee 1996) contains a minority populationof relatively young blue stars near the centroid of a dominant old population. In summary,it appears that available evidence strongly supports the view that dwarf spheroidals can havequite complex star forming histories. In this respect they differ dramatically from globularclusters which, with only a few exceptions, only contain stars of a single age andmetallicity. Another striking difference between globular clusters and dwarf spheroidals isthat most dSph galaxies appear to contain dark matter (e.g. Mateo 1997), whereasglobulars do not. This shows (Kormendy 1990a) that the majority of dSph galaxies in theLocal Group were formed as individual objects, and that they were not produced ascondensations from tidal arms (Mirabel et al. 1992) that had been drawn out duringinteractions between massive galaxies. This is so because significant amounts of darkmatter would not have become entrained in such tidal arms (Barnes & Hernquist 1992).
An additional argument against the hypothesis that most dSph galaxies were formedfrom tidal tails is provided by their low metallicities. Inspection of the prints of ThePalomar Sky Survey shows that long tidal tails are usually produced during stronginteractions between giant spirals. Even in the outermost regions such giant spiralstypically have [Fe/H] > — 1.0, whereas all Local Group dSph galaxies fainter thanM v = - 1 5 have [Fe/H] < -1 .0 .
Burkert & Ruiz-Lapuente (1997) have drawn attention to the fact that the complex starforming history of dSph galaxies is unexpected. Data suggest that star formation in mostdSph galaxies took place on a time-scale of a few Gyr. This result is quite puzzling from atheoretical point of view. This is so because most processes that regulate star formation(such as heating by high-mass supernovae of Type II, and cooling and dynamicalcontraction) have time-scales of only a few x 107 years. Star formation could, of course,have been delayed for a longer time if the gas in dSph galaxies had enough angularmomentum to form a rotationally supported H I disk. However, no evidence has ever
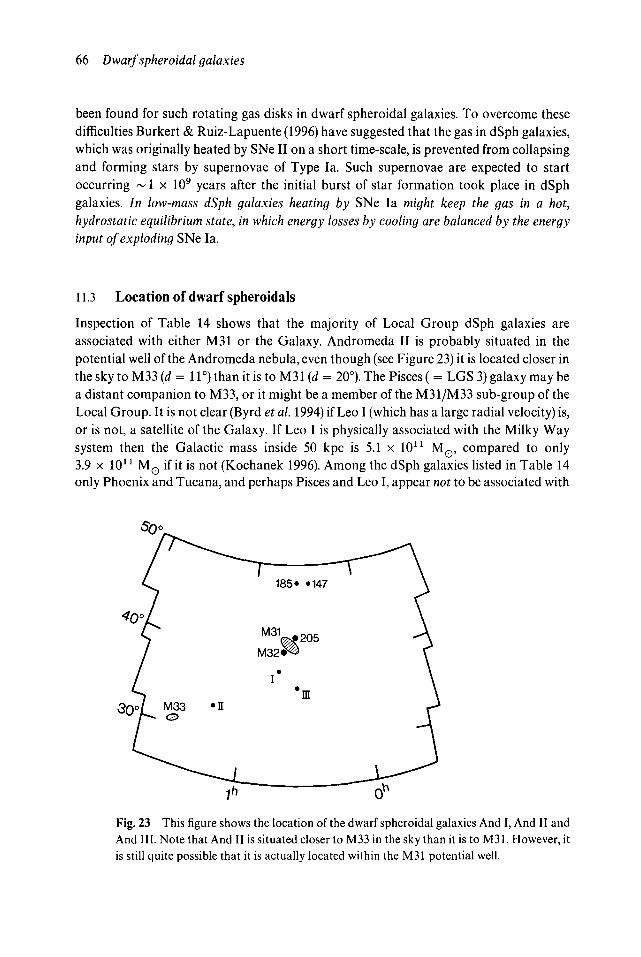
66 Dwarf spheroidal galaxies
been found for such rotating gas disks in dwarf spheroidal galaxies. To overcome thesedifficulties Burkert & Ruiz-Lapuente (1996) have suggested that the gas in dSph galaxies,which was originally heated by SNe II on a short time-scale, is prevented from collapsingand forming stars by supernovae of Type la. Such supernovae are expected to startoccurring ~ 1 x 10⁹ years after the initial burst of star formation took place in dSphgalaxies. In low-mass dSph galaxies heating by SNe la might keep the gas in a hot,hydrostatic equilibrium state, in which energy losses by cooling are balanced by the energyinput of exploding SNe la.
11.3 Location of dwarf spheroidals
Inspection of Table 14 shows that the majority of Local Group dSph galaxies areassociated with either M31 or the Galaxy. Andromeda II is probably situated in thepotential well of the Andromeda nebula, even though (see Figure 23) it is located closer inthe sky to M33 (d = 11°) than it is to M31 {d = 20°). The Pisces ( = LGS 3) galaxy may bea distant companion to M33, or it might be a member of the M31/M33 sub-group of theLocal Group. It is not clear (Byrd et al. 1994) if Leo I (which has a large radial velocity) is,or is not, a satellite of the Galaxy. If Leo I is physically associated with the Milky Waysystem then the Galactic mass inside 50 kpc is 5.1 x 10¹¹ MQ, compared to only3.9 x 101' M o if it is not (Kochanek 1996). Among the dSph galaxies listed in Table 14only Phoenix and Tucana, and perhaps Pisces and Leo I, appear not to be associated with
Fig. 23 This figure shows the location of the dwarf spheroidal galaxies And I, And II andAnd III. Note that And II is situated closer to M33 in the sky than it is to M31. However, itis still quite possible that it is actually located within the M31 potential well.
Summary 67
one of the three most massive Local Group members. This strongly suggests that thecreation of dwarf spheroidal galaxies was intimately tied to the process that leads to theformation of giant spirals. This contrasts strongly with the situation for dlr galaxiesfainter than Mv = - 1 5 in the Local Group. All of these objects (IC 1613, DDO 210,WLM and Pegasus) are isolated.
11.4 Radial distribution of dwarf spheroidals
Among the dSph satellites of the Galaxy listed in Table 14 only one (Sgr) is located atRGC < 60 kpc, while five (Car, Dra, Scl, Sex, UMi) have Galactocentric distances RGC inthe range 60-100 kpc. This suggests that some dSph galaxies that once existed atRGC < 60 kpc, might have been destroyed by Galactic tidal forces, or captured viadynamical friction. Bellazzini, Fusi Pecci & Ferraro (1996) have noted that the dSphgalaxies with the lowest surface brightnesses (which are the least able to resist tidaldestruction) are situated closest to the Galaxy. Possibly this indicates that many lowsurface brightness dSph galaxies remain to be discovered at large distances from theGalaxy. However, this suggestion has been questioned by Kleyna et al. (1997) who usedan adoptive kernal approach to search ~\ of the sky without finding a single new dSphgalaxy brighter than M v =* —9.5.
The absence of any dSph galaxies with high surface brightness at RGC < 100 kpc, whichis noted by Bellazzini et al., is not unexpected because only three such objects are knownin the 26 x larger volume with 100 kpc < RGC < 300 kpc. If the luminosity function ofthe Local Group does, indeed, contain more faint dSph galaxies than presently believed,then the apparent discrepancy between the shallow slope of the faint end of the LocalGroup luminosity function, and the steeper slope of the luminosity functions of richclusters (Driver et al. 1994, Bernstein et al. 1995), might be reduced.
11.5 Summary
Dwarf spheroidals are the most common type of galaxy in the Universe. Some of themmay have formed recently from condensations in tidal arms. However, the majority wereprobably formed > 10 Gyr ago. The fact that many of these objects contain stellarpopulations which have a wide range of ages suggests that some dSph galaxies have had acomplex evolutionary history. This may indicate that late-time heating by SNe la wasable to keep the gas in dSph galaxies in hot hydrostatic equilibrium for periods of 1-10Gyr. The radial distribution of the dSph companions of the Galaxy suggests that: (1) somedwarf spheroidals with RGC < 60 kpc may have been destroyed by tidal forces, and (2) anumber of low-density dSph galaxies with RGC > 100 kpc still remain to be discovered.
The relationship between dSph, dE and SO galaxies remains a subject of lively contro-versy. The most severe problems of galaxy taxonomy occur at M v <• 16 where differentmorphological classes appear to blend together. Is NGC 205 an elliptical or an SO; isNGC 185 a bright dSph, and is M32 a prototypical low-luminosity elliptical or the endproduct of an unusual evolutionary history?

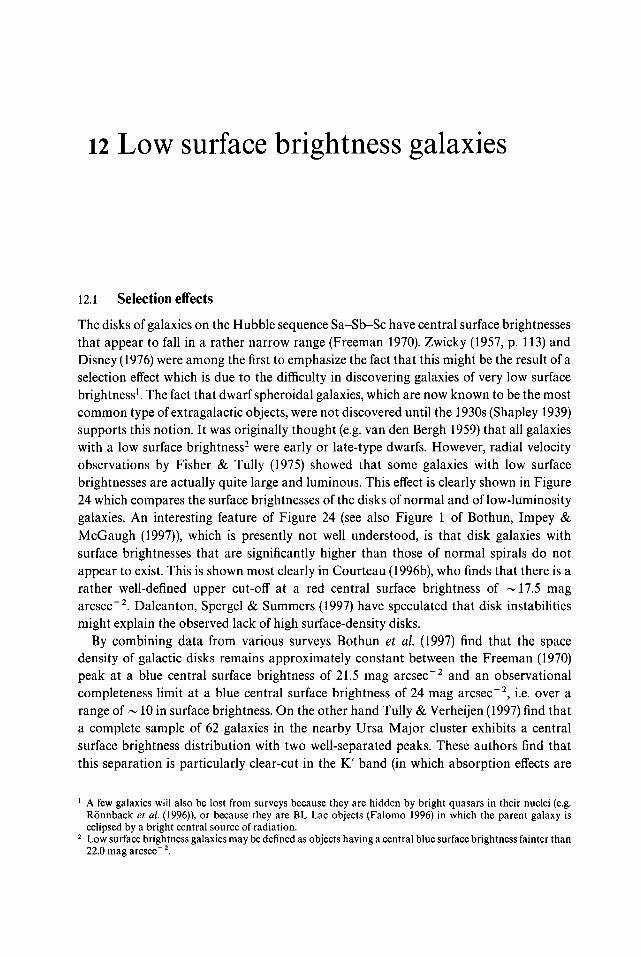
12 Low surface brightness galaxies
12.1 Selection effects
The disks of galaxies on the Hubble sequence Sa-Sb-Sc have central surface brightnessesthat appear to fall in a rather narrow range (Freeman 1970). Zwicky (1957, p. 113) andDisney (1976) were among the first to emphasize the fact that this might be the result of aselection effect which is due to the difficulty in discovering galaxies of very low surfacebrightness1. The fact that dwarf spheroidal galaxies, which are now known to be the mostcommon type of extragalactic objects, were not discovered until the 1930s (Shapley 1939)supports this notion. It was originally thought (e.g. van den Bergh 1959) that all galaxieswith a low surface brightness2 were early or late-type dwarfs. However, radial velocityobservations by Fisher & Tully (1975) showed that some galaxies with low surfacebrightnesses are actually quite large and luminous. This effect is clearly shown in Figure24 which compares the surface brightnesses of the disks of normal and of low-luminositygalaxies. An interesting feature of Figure 24 (see also Figure 1 of Bothun, Impey &McGaugh (1997)), which is presently not well understood, is that disk galaxies withsurface brightnesses that are significantly higher than those of normal spirals do notappear to exist. This is shown most clearly in Courteau (1996b), who finds that there is arather well-defined upper cut-off at a red central surface brightness of ~17.5 magarcsec"2. Dalcanton, Spergel & Summers (1997) have speculated that disk instabilitiesmight explain the observed lack of high surface-density disks.
By combining data from various surveys Bothun et al. (1997) find that the spacedensity of galactic disks remains approximately constant between the Freeman (1970)peak at a blue central surface brightness of 21.5 mag arcsec"2 and an observationalcompleteness limit at a blue central surface brightness of 24 mag arcsec"2, i.e. over arange of ~ 10 in surface brightness. On the other hand Tully & Verheijen (1997) find thata complete sample of 62 galaxies in the nearby Ursa Major cluster exhibits a centralsurface brightness distribution with two well-separated peaks. These authors find thatthis separation is particularly clear-cut in the K' band (in which absorption effects are
1 A few galaxies will also be lost from surveys because they are hidden by bright quasars in their nuclei (e.g.Ronnback et al. (1996)), or because they are BL Lac objects (Falomo 1996) in which the parent galaxy iseclipsed by a bright central source of radiation.
2 Low surface brightness galaxies may be defined as objects having a central blue surface brightness fainter than22.0 mag arcsec"2.
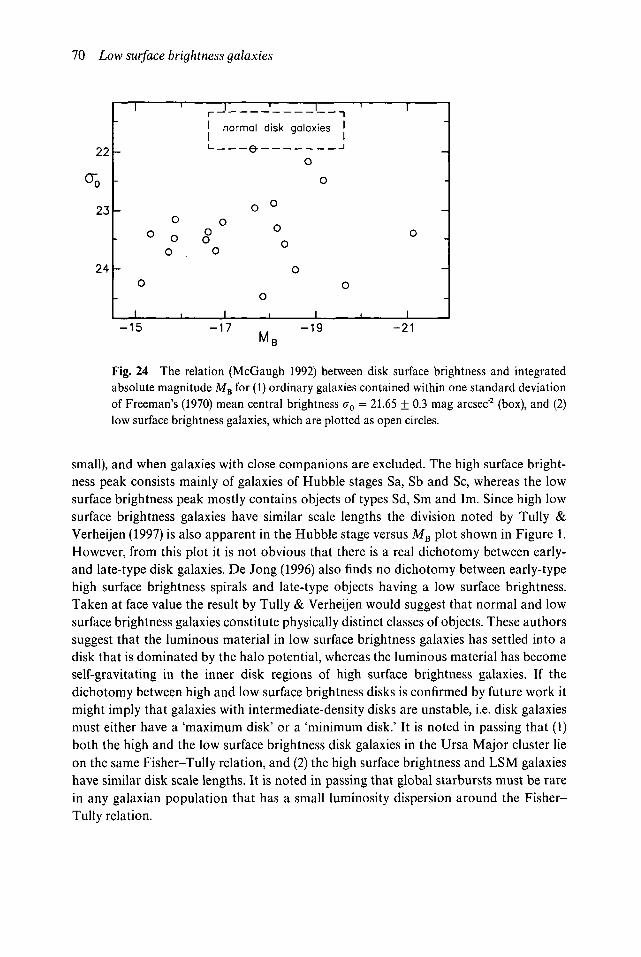
70 Low surface brightness galaxies
22 -
°"o23 -
24 -
-15
-
-
o° o
o
o
1 ,
1r1 normali_
Ooo
0
1
o
1
disk
o
oo
o
1
galaxies
O
O
o
1
"1
11
J
o
1
1
-
-
o
1
-17M,
-19 -21
Fig. 24 The relation (McGaugh 1992) between disk surface brightness and integratedabsolute magnitude MB for (1) ordinary galaxies contained within one standard deviationof Freeman's (1970) mean central brightness a0 = 21.65 + 0.3 mag arcsec'2 (box), and (2)low surface brightness galaxies, which are plotted as open circles.
small), and when galaxies with close companions are excluded. The high surface bright-ness peak consists mainly of galaxies of Hubble stages Sa, Sb and Sc, whereas the lowsurface brightness peak mostly contains objects of types Sd, Sm and Im. Since high lowsurface brightness galaxies have similar scale lengths the division noted by Tully &Verheijen (1997) is also apparent in the Hubble stage versus MB plot shown in Figure 1.However, from this plot it is not obvious that there is a real dichotomy between early-and late-type disk galaxies. De Jong (1996) also finds no dichotomy between early-typehigh surface brightness spirals and late-type objects having a low surface brightness.Taken at face value the result by Tully & Verheijen would suggest that normal and lowsurface brightness galaxies constitute physically distinct classes of objects. These authorssuggest that the luminous material in low surface brightness galaxies has settled into adisk that is dominated by the halo potential, whereas the luminous material has becomeself-gravitating in the inner disk regions of high surface brightness galaxies. If thedichotomy between high and low surface brightness disks is confirmed by future work itmight imply that galaxies with intermediate-density disks are unstable, i.e. disk galaxiesmust either have a 'maximum disk' or a 'minimum disk.' It is noted in passing that (1)both the high and the low surface brightness disk galaxies in the Ursa Major cluster lieon the same Fisher-Tully relation, and (2) the high surface brightness and LSM galaxieshave similar disk scale lengths. It is noted in passing that global starbursts must be rarein any galaxian population that has a small luminosity dispersion around the Fisher-Tully relation.
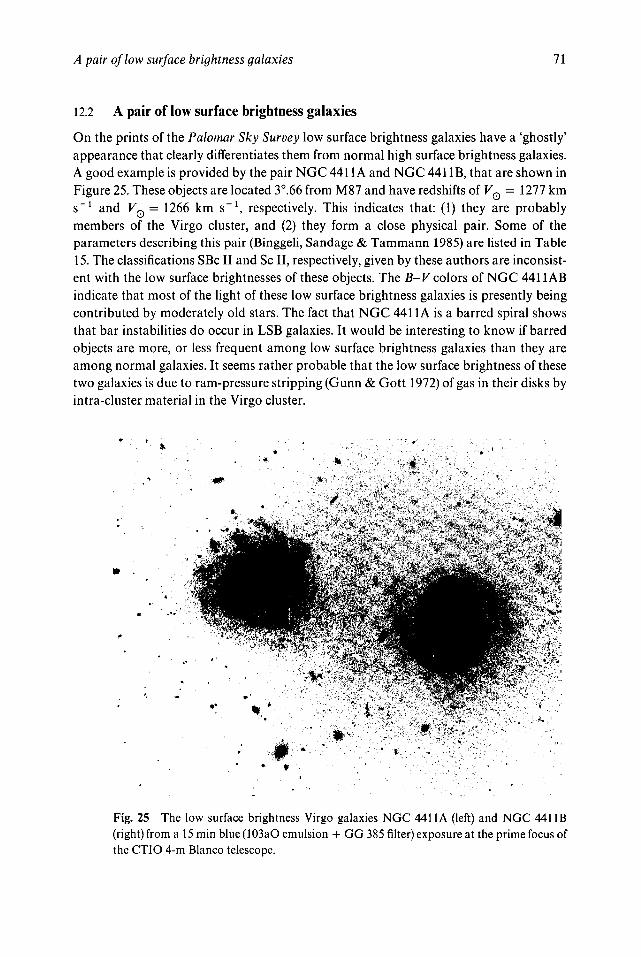
A pair of low surface brightness galaxies 71
12.2 A pair of low surface brightness galaxies
On the prints of the Palomar Sky Survey low surface brightness galaxies have a 'ghostly'appearance that clearly differentiates them from normal high surface brightness galaxies.A good example is provided by the pair NGC 4411A and NGC 441 IB, that are shown inFigure 25. These objects are located 3°.66 from M87 and have redshifts of VQ = 1277 kms"1 and VQ = 1266 km s"1, respectively. This indicates that: (1) they are probablymembers of the Virgo cluster, and (2) they form a close physical pair. Some of theparameters describing this pair (Binggeli, Sandage & Tammann 1985) are listed in Table15. The classifications SBc II and Sc II, respectively, given by these authors are inconsist-ent with the low surface brightnesses of these objects. The B-V colors of NGC 4411ABindicate that most of the light of these low surface brightness galaxies is presently beingcontributed by moderately old stars. The fact that NGC 4411A is a barred spiral showsthat bar instabilities do occur in LSB galaxies. It would be interesting to know if barredobjects are more, or less frequent among low surface brightness galaxies than they areamong normal galaxies. It seems rather probable that the low surface brightness of thesetwo galaxies is due to ram-pressure stripping (Gunn & Gott 1972) of gas in their disks byintra-cluster material in the Virgo cluster.
• I
Fig. 25 The low surface brightness Virgo galaxies NGC 4411A (left) and NGC 44MB(right) from a 15 min blue (103aO emulsion + GG 385 filter) exposure at the prime focus ofthe CT1O 4-m Blanco telescope.
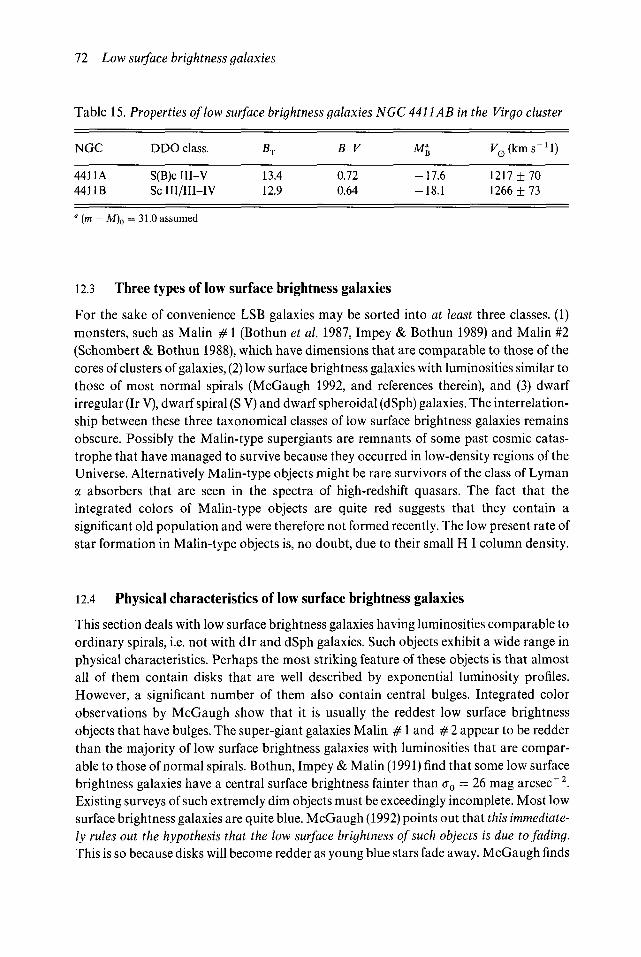
72 Low surface brightness galaxies
Table 15.
NGC
4411A441 IB
Properties of low
DDO class.
S(B)c III-VSc III/III-IV
surface brightness galaxies NGC 4411AB in
BT
13.412.9
B-V
0.720.64
Ml
-17.6-18.1
the Virgo
^G(kn
1217 +1266 +
cluster
7073
1 (m — M)o = 31.0 assumed
12.3 Three types of low surface brightness galaxies
For the sake of convenience LSB galaxies may be sorted into at least three classes. (1)monsters, such as Malin # 1 (Bothun et al. 1987, Impey & Bothun 1989) and Malin #2(Schombert & Bothun 1988), which have dimensions that are comparable to those of thecores of clusters of galaxies, (2) low surface brightness galaxies with luminosities similar tothose of most normal spirals (McGaugh 1992, and references therein), and (3) dwarfirregular (Ir V), dwarf spiral (S V) and dwarf spheroidal (dSph) galaxies. The interrelation-ship between these three taxonomical classes of low surface brightness galaxies remainsobscure. Possibly the Malin-type supergiants are remnants of some past cosmic catas-trophe that have managed to survive because they occurred in low-density regions of theUniverse. Alternatively Malin-type objects might be rare survivors of the class of Lymana absorbers that are seen in the spectra of high-redshift quasars. The fact that theintegrated colors of Malin-type objects are quite red suggests that they contain asignificant old population and were therefore not formed recently. The low present rate ofstar formation in Malin-type objects is, no doubt, due to their small H I column density.
12.4 Physical characteristics of low surface brightness galaxies
This section deals with low surface brightness galaxies having luminosities comparable toordinary spirals, i.e. not with dlr and dSph galaxies. Such objects exhibit a wide range inphysical characteristics. Perhaps the most striking feature of these objects is that almostall of them contain disks that are well described by exponential luminosity profiles.However, a significant number of them also contain central bulges. Integrated colorobservations by McGaugh show that it is usually the reddest low surface brightnessobjects that have bulges. The super-giant galaxies Malin # 1 and # 2 appear to be redderthan the majority of low surface brightness galaxies with luminosities that are compar-able to those of normal spirals. Bothun, Impey & Malin (1991) find that some low surfacebrightness galaxies have a central surface brightness fainter than <r0 = 26 mag arcsec~2.Existing surveys of such extremely dim objects must be exceedingly incomplete. Most lowsurface brightness galaxies are quite blue. McGaugh (1992) points out that this immediate-ly rules out the hypothesis that the low surface brightness of such objects is due to fading.This is so because disks will become redder as young blue stars fade away. McGaugh finds
Physical characteristics 73
median colors B — V = 0.44 and U — B = —0.12 for his sample of low surface brightnessgalaxies. These colors are close to those expected for systems that are forming stars at aconstant rate. However, a survey of low surface brightness galaxies by O'Neil, Bothun &Cornell (1997) suggests that the number of red low surface brightness galaxies may havebeen under-estimated in previous surveys. It might be speculated that some of these faintred objects are the remnants of the mysterious excess population of blue galaxies(Glazebrook et al. 1995) that is seen at large redshifts. On the other hand Guzman et at.(1997) suggest that the remnants of high redshift blue galaxies are brighter spheroidalgalaxies like NGC 205.
The spread in the observed integrated colors of low surface brightness galaxies is large.This shows that such objects have had a wide range of evolutionary histories. Thisconclusion is supported by the observation that the oxygen abundances in low surfacebrightness galaxies range from near-solar values of log (O/H) = — 3.13 + 0.07 (Grevesse& Noels 1993), to log(O/H) = -4 .8 in I Zw 18. (The distribution of O/H values incompact dwarfs is similar to that in low surface brightness galaxies.) The fact that typicallow surface brightness galaxies have O/H abundance ratios that are a few times lowerthan those in the Sun suggests that most of these objects are relatively unevolved.Alternatively the mass spectrum of star formation in low surface brightness galaxiesmight contain fewer massive stars than it does in normal high surface brightness spirals.Most low surface brightness galaxies contain a large gas mass fraction (McGaugh & deBlok 1997). This tends to support the hypothesis that they are relatively unevolvedobjects, i.e. galaxies that have not changed as much over a Hubble time as normal highsurface brightness galaxies. Low surface brightness galaxies that have a high gas content,and which exhibit a high rate of star formation, probably became active quite recently.
De Blok, McGaugh & van der Hulst (1996) have shown that the H I surface densitydistribution of ordinary low surface brightness galaxies differs from that of their cousinsresembling Malin # 1, which have a doughnut-like distribution of neutral hydrogen gas.The rotation curves of low surface-brightness galaxies rise more slowly than those ofordinary disk galaxies. This suggests that not only the light but also the mass aredistributed more diffusely in low surface brightness galaxies than they are in normal disksystems. This result indicates that mass distribution was probably one of the factors thatcaused the systematic differences between the evolutionary histories of normal and lowsurface brightness galaxies.
One expects low-density galaxies, which are thought to have arisen from low-densitypeaks in the initial fluctuation spectrum, to start forming rather late in the evolutionaryhistory of the Universe. This suggests that low surface brightness galaxies should be lessclustered than galaxies of higher surface brightness. This expectation is confirmed by Mo,McGaugh & Bothun (1994) who find that low surface brightness galaxies, althoughembedded in the same large-scale structures as high surface brightness galaxies, are lessstrongly clustered. In fact most low surface brightness galaxies are extremely isolated onscales of less than 2 Mpc. However, there are exceptions such as the low surface brightnesspair NGC 4411AB, which was discussed in Section 12.2, which appears to be situated inthe core of the Virgo cluster. Possibly this is an example of a different type of low surface
74 Low surface brightness galaxies
brightness galaxy, in which the present low surface brightness is due to recent sweeping byintra-cluster gas.
Zwaan et al. (1995) have drawn attention to the surprising fact that low surfacebrightness galaxies obey the same Fisher-Tully relation between their maximum rota-tional velocity and blue luminosity MB as do normal spirals. This suggests that lowsurface brightness galaxies also have a low surface mass density am, so that the product<rm M/L remains constant.
The disk scale-lengths of low surface brightness galaxies are typically 2-3 kpc. Thesevalues are quite similar to those of normal spiral galaxies. (However, at a fixed maximumrotational velocity the dimensions of low surface brightness galaxies are approximatelytwice as large as those of normal disk galaxies.) It is, perhaps, surprising that thereappears to be no correlation between the scale-length of low surface brightness disks andtheir central surface brightness <ro. This is so, even though the central surface brightnessesof the disks of such low surface brightness galaxies are typically a couple of magnitudeslower than those of normal spirals.
Dalcanton, Spergel & Summers (1997) point out that galaxies with low surface bright-ness disks will be extremely good tracers of the properties of dark matter halos. This is sobecause (1) the rotation curve of a galaxy with a low surface density will be closer to thatof a pure halo than that of a galaxy with a massive disk, and (2) the rotation curves of lowsurface brightness disks will tend to reflect any deviations from axisymmetry within theirhalos much more clearly than would be the case for galaxies with massive disks.
Knezek (1993) has studied the properties of a matched set of UGC {Uppsala GeneralCatalogue) galaxies that exhibit high (HSB), intermediate (ISB), and low (LSB) surfacebrightnesses. These data, which are shown in Table 16, suggest that these three classes ofobjects differ in their surface brightnesses, but not in their total, and H I, gas masses.Furthermore Knezek found that high surface brightness galaxies are much more likely tohave close companions than low surface brightness galaxies. This suggests that either (1)interactions between close companions stimulates star formation, or (2) galaxies withclose companions are more likely to have captured gas from companions.
Mihos, McGaugh & de Blok (1997) find that bars are relatively rare in low surfacebrightness galaxies. Despite their seemingly fragile nature low surface brightness galaxiesare quite stable against the growth of bar instabilities. This is so because their low disksurface density and high dark matter content deprives them of the disk self-gravitynecessary to amplify non-axisymmetric dynamical seeds.
12.5 Was the Large Magellenic Cloud (LMC) once a low surface brightnessgalaxy?
Butcher (1977) discovered a break in the slope of the main sequence luminosity functionof stars in the LMC. This break is located about 1 mag above the main sequence turnoffpoint of Population II stars. From this observation Butcher concluded that a major burstof star formation took place in the LMC 3-5 Gyr ago, and that the rate of star formationhad been quite low before this burst occurred. This unexpected conclusion was subse-
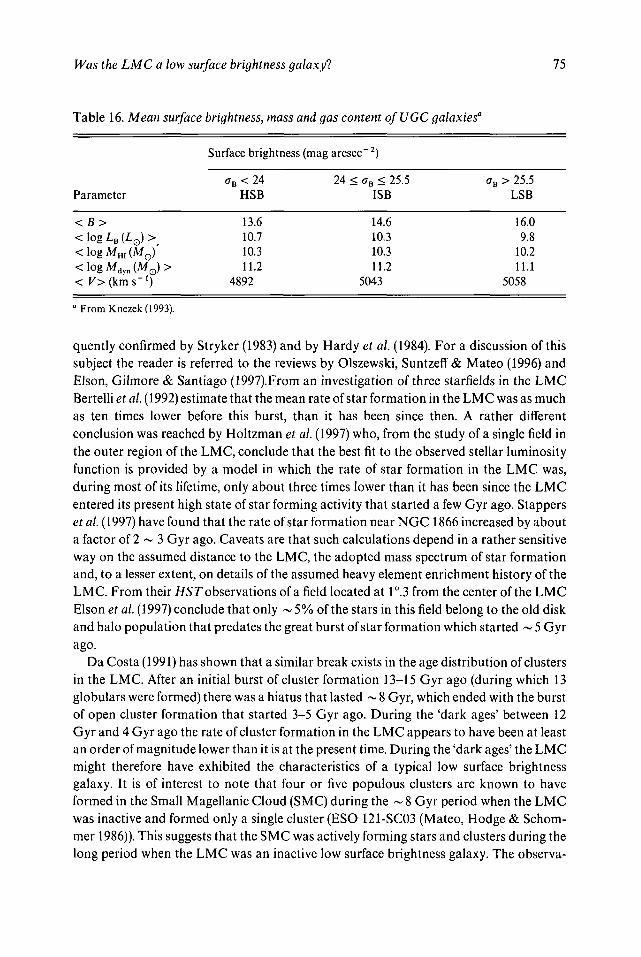
Was the LMC a low surface brightness galaxyl 75
Table 16. Mean surface brightness, mass and gas content ofUGC galaxies"
Parameter
< log LB (Lo) >< log MHI(MO)'<logMd y n(M0)>< K>(kms"1)
0 From Knezek(1993).
Surface brightness (mag arcsec 2)
<rB<24HSB
13.610.710.311.2
4892
24 < (jB < 25.5ISB
14.610.310.311.2
5043
(TB > 25.5LSB
16.09.8
10.211.1
5058
quently confirmed by Stryker (1983) and by Hardy et al. (1984). For a discussion of thissubject the reader is referred to the reviews by Olszewski, Suntzeff & Mateo (1996) andElson, Gilmore & Santiago (1997).From an investigation of three starfields in the LMCBertelli et al. (1992) estimate that the mean rate of star formation in the LMC was as muchas ten times lower before this burst, than it has been since then. A rather differentconclusion was reached by Holtzman et al. (1997) who, from the study of a single field inthe outer region of the LMC, conclude that the best fit to the observed stellar luminosityfunction is provided by a model in which the rate of star formation in the LMC was,during most of its lifetime, only about three times lower than it has been since the LMCentered its present high state of star forming activity that started a few Gyr ago. Stapperset al. (1997) have found that the rate of star formation near NGC 1866 increased by abouta factor of 2 ~ 3 Gyr ago. Caveats are that such calculations depend in a rather sensitiveway on the assumed distance to the LMC, the adopted mass spectrum of star formationand, to a lesser extent, on details of the assumed heavy element enrichment history of theLMC. From their HST observations of a field located at 1°.3 from the center of the LMCElson et al. (1997) conclude that only ~ 5% of the stars in this field belong to the old diskand halo population that predates the great burst of star formation which started ~ 5 Gyrago.
Da Costa (1991) has shown that a similar break exists in the age distribution of clustersin the LMC. After an initial burst of cluster formation 13-15 Gyr ago (during which 13globulars were formed) there was a hiatus that lasted ~ 8 Gyr, which ended with the burstof open cluster formation that started 3-5 Gyr ago. During the 'dark ages' between 12Gyr and 4 Gyr ago the rate of cluster formation in the LMC appears to have been at leastan order of magnitude lower than it is at the present time. During the 'dark ages' the LMCmight therefore have exhibited the characteristics of a typical low surface brightnessgalaxy. It is of interest to note that four or five populous clusters are known to haveformed in the Small Magellanic Cloud (SMC) during the ~8 Gyr period when the LMCwas inactive and formed only a single cluster (ESO 121-SC03 (Mateo, Hodge & Schom-mer 1986)). This suggests that the SMC was actively forming stars and clusters during thelong period when the LMC was an inactive low surface brightness galaxy. The observa-
76 Low surface brightness galaxies
tion that the SMC does not appear to have undergone a burst of star and clusterformation 3-5 Gyr ago suggests that the burst of star formation in the LMC was nottriggered by a close tidal encounter between the LMC and the SMC. The cluster ESO121-SC03 (which is located 10°.l = 8.8 kpc from the center of the LMC) is estimated tohave an age of 6.4 Gyr (Sarajedini, Lee & Lee 1995) and has a metallicity [Fe/H] = —0.9,which is intermediate between that of the open clusters and globular clusters in the LMC.This cluster might perhaps have been captured from the SMC.
The data presented above suggest that the LMC may be a nearby example of objects ofthe type that Babul & Ferguson (1996) have named 'boojums' (blue objects just undergo-ing moderate starbursts).
The observations which have been described above appear to indicate that the LMCtransformed itself from a low surface brightness galaxy into an active magellanic irregular~4 Gyr ago. This suggests that galaxies can sometimes jump from one morphologicalclassification type to another.
Da Costa (1991) has pointed out that there is a clear-cut dichotomy between the LMCglobular clusters with ages of 13-15 Gyr, which have metallicities in the range— 2.1 < [Fe/H] < —1.4, and open clusters with ages <4 Gyr, which have —1.0 < [Fe/H] < 0.0. It is presently not clear how the metallicity of the LMC could have increased byan order of magnitude during the 'dark ages' while the rate of heavy element producingsupernova explosions was, presumably, low. The following hypotheses might be pro-posed to account for this large increase in metallicity during a period when the LMCappears to have been quite inactive:
• The LMC swept up enriched gas from the SMC during a close encounter 3-5 Gyrago. Arguments against this idea are that (1) the LMC open clusters formed duringthe last ~4 Gyr are more metal-rich than the gas and stars in the SMC, and (2) itappears that there was no burst of cluster formation in the SMC ~4 Gyr ago.Such a burst of star formation would have been the signature of such a close tidalencounter between the LMC and SMC.
• The LMC captured a massive metal-rich gas cloud 3-5 Gyr ago. A problem withthis idea is that the orbit of the LMC did not come close enough to the Galaxy (see,e.g., Murai & Fugimoto (1980)) at this time for it to have picked up significantamounts of such metal-rich gas from the Milky Way system. This conclusion isconfirmed by Hipparcos observations (Kroupa & Bastian 1997), which show thatthe LMC is presently close to apogalacticon.
It is therefore concluded that the process that increased the metallicity of the LMC by anorder of magnitude between 13 and 5 Gyr ago remains unknown.
During its first active phase 13-15 Gyr ago the LMC produced 13 globular clusters. Inconjunction with Mv « — 18.5 this yields a present specific globular cluster frequencyS x 0.5. However, during the 'dark ages' the LMC might have been ~ 2 mag fainter thanit is now yielding a value S ~ 3 while the LMC was a low surface brightness galaxy. Itwould be of interest to observe relatively nearby late-type low surface brightness galaxiesto see if they exhibit such a relatively high specific globular cluster frequency.
Summary 11
12.6 Summary
The following types of low surface brightness galaxies are presently known:
(1) Monsters like Malin # 1, which may have been formed during some cosmiccatastrophe.
(2) Low surface brightness galaxies with total luminosities comparable to those ofnormal spirals.
(3) Low surface brightness dwarfs, which range from early-type (dSph) to late-type (IrV).
(4) NGC 4411AB-like objects, from which gas may have been removed by ram-pressure stripping.
Available data suggest that the LMC transformed itself from a low surface brightnessgalaxy to a normal magellanic irregular ~ 4 Gyr ago. This provides a clear counterexample to the claim by Linnaeus (1751) that Natura nonfacit saltum. Such changes inmorphology might be triggered by tidal encounters or by capture of massive intergalacticgas clouds.
The reason why disk galaxies exhibit a sharp upper limit (Bothun et al. 1997) to theircentral surface brightness is presently not understood. It would be interesting to know ifthe frequency of bars is different in normal galaxies and in low surface brightness galaxiesof similar Hubble stage. It is not yet clear if galaxy disks exhibit a continuous distributionof <r0 values (Bothun et al. 1997), or if the distribution of <r0 is bimodal (Tully & Verheijen1997). In the latter case normal and low surface brightness galaxies would representphysically distinct classes of objects.

13 Morphology of active galaxies
13.1 Ground state and excited galaxies
Excited galaxies (see Figure 26), i.e. objects that are not in the 'ground state,' fall into twobroad classes: (1) diffuse galaxies with a high rate of star formation, such as starburstgalaxies, Markarian galaxies, amorphous galaxies, Haro galaxies, intergalactic H IIregions; and (2) objects with active nuclei, such as quasars, BL Lac objects ( = blazars)and Seyfert galaxies. Most quasars and galaxies with active nuclei are located at largedistances. This makes it difficult to study their morphology in detail. The images ofluminous IRAS sources, including Seyfert 1, Seyfert 2, LINER ( = low ionization nuclearemission-line region) and QSO parent galaxies by Hutchings & Neff(1991) suggest thatmany of them have a highly disturbed morphology including (what appear to be) tidaltails. Bahcall et al. (1996) show that the host galaxies of nearby quasars are frequentlydisturbed and interacting objects.
Active nuclei of galaxies can be fuelled by inward transport of gas (Morris & Serabyn1996) via any one of the following processes:
• Gas may lose angular momentum to a stellar bar or oval disk by gravitationaltorques. Gas orbiting in a bar potential will have non-circular orbits resulting incollisions that produce shocks, which in turn result in loss of energy and angularmomentum. The effect of spiral density waves is similar to that of bars, providedthat there is no inner Lindblad resonance.
• Very massive gas clouds will be subject to dynamical friction, which causes themto spiral inwards towards the galactic nucleus.
• Clouds moving through a strong magnetic field may suffer substantial friction andangular momentum loss due to magnetic viscous forces.
• Gas may also lose angular momentum by viscous drag in a differentially rotatinggalactic disk.
• A rapidly rotating gaseous disk might be slowed down if it incorporates materiallost from stars in a slowly rotating stellar bulge.
• The tidal disturbances produced by a massive companion may introduce fresh gasinto the vicinity of a central black hole on the galaxy encounter time-scale of ~ 108
years (Hernquist 1989). The observed correlation between active galactic nucleiand galaxy interactions (MacKentry 1989) attests to the importance of thisprocess.
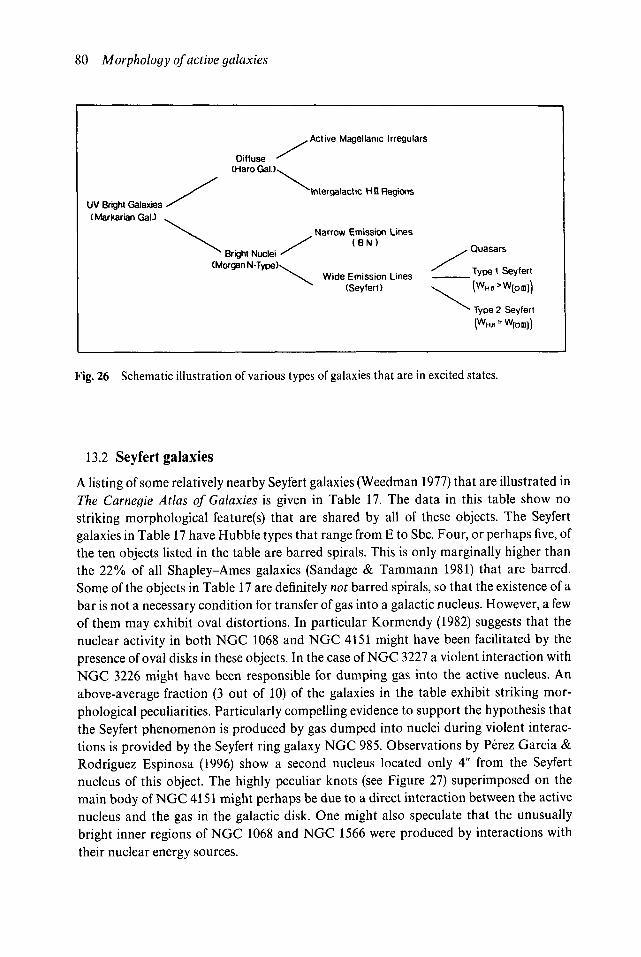
80 Morphology of active galaxies
UV Bright Galaxies y ^(Markarian GalJ ^
\
Diffuse ^(Haro Gal.K
^ Bright Nuclei ^CMorgan N -Type ) \
.Active Magellanic Irregulars
Intergalactic H n Regions
Narrow Emission Lines
y ( BN)
(Seyfert) v ^
s. Quasars
Type 1 Seyfert
(WH0>W[on,])
^ Type 2 Seyfert
Fig. 26 Schematic illustration of various types of galaxies that are in excited states.
13.2 Seyfert galaxies
A listing of some relatively nearby Seyfert galaxies (Weedman 1977) that are illustrated inThe Carnegie Atlas of Galaxies is given in Table 17. The data in this table show nostriking morphological feature(s) that are shared by all of these objects. The Seyfertgalaxies in Table 17 have Hubble types that range from E to Sbc. Four, or perhaps five, ofthe ten objects listed in the table are barred spirals. This is only marginally higher thanthe 22% of all Shapley-Ames galaxies (Sandage & Tammann 1981) that are barred.Some of the objects in Table 17 are definitely not barred spirals, so that the existence of abar is not a necessary condition for transfer of gas into a galactic nucleus. However, a fewof them may exhibit oval distortions. In particular Kormendy (1982) suggests that thenuclear activity in both NGC 1068 and NGC 4151 might have been facilitated by thepresence of oval disks in these objects. In the case of NGC 3227 a violent interaction withNGC 3226 might have been responsible for dumping gas into the active nucleus. Anabove-average fraction (3 out of 10) of the galaxies in the table exhibit striking mor-phological peculiarities. Particularly compelling evidence to support the hypothesis thatthe Seyfert phenomenon is produced by gas dumped into nuclei during violent interac-tions is provided by the Seyfert ring galaxy NGC 985. Observations by Perez Garcia &Rodriguez Espinosa (1996) show a second nucleus located only 4" from the Seyfertnucleus of this object. The highly peculiar knots (see Figure 27) superimposed on themain body of NGC 4151 might perhaps be due to a direct interaction between the activenucleus and the gas in the galactic disk. One might also speculate that the unusuallybright inner regions of NGC 1068 and NGC 1566 were produced by interactions withtheir nuclear energy sources.
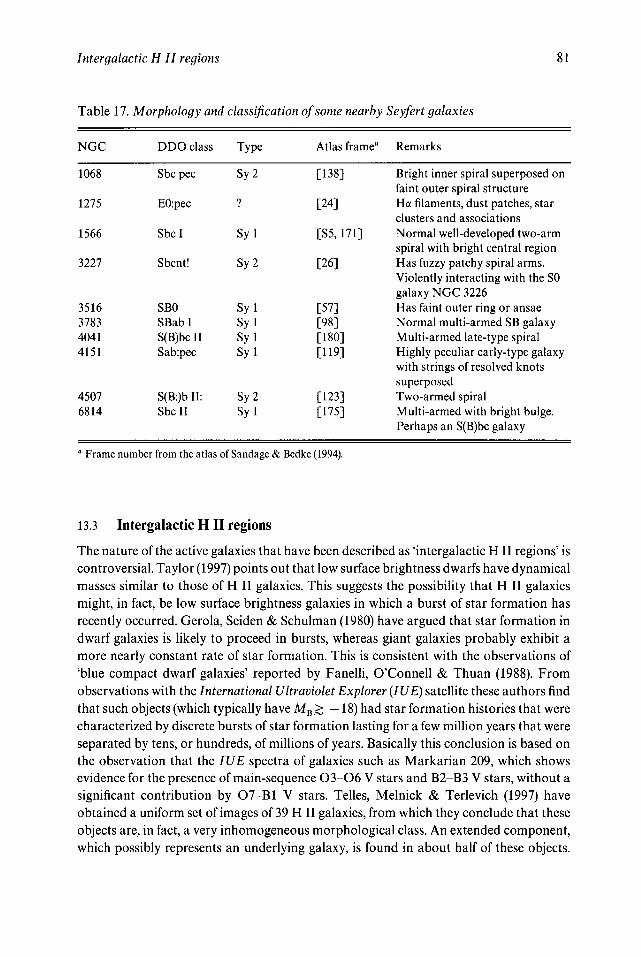
Intergalactic H II regions 81
Table 17. Morphology and classification of some nearby Seyfert galaxies
NGC DDO class Type Atlas frame" Remarks
1068
1275
1566
3227
3516378340414151
45076814
Sbc pec
E0:pec
Sbc I
Sbcnt!
SBOSBabIS(B)bc IISab:pec
S(B:)b II:Sbc II
Sy2
?
Syl
Sy2
SylSylSylSyl
Sy2Syl
[138]
[24]
[S5,171]
[26]
[57][98][180][119]
[123][175]
Bright inner spiral superposed onfaint outer spiral structureHa filaments, dust patches, starclusters and associationsNormal well-developed two-armspiral with bright central regionHas fuzzy patchy spiral arms.Violently interacting with the SOgalaxy NGC 3226Has faint outer ring or ansaeNormal multi-armed SB galaxyMulti-armed late-type spiralHighly peculiar early-type galaxywith strings of resolved knotssuperposedTwo-armed spiralMulti-armed with bright bulge.Perhaps an S(B)bc galaxy
1 Frame number from the atlas of Sandage & Bedke (1994).
13.3 Intergalactic H I I regions
The nature of the active galaxies that have been described as 'intergalactic HII regions' iscontroversial. Taylor (1997) points out that low surface brightness dwarfs have dynamicalmasses similar to those of H II galaxies. This suggests the possibility that H II galaxiesmight, in fact, be low surface brightness galaxies in which a burst of star formation hasrecently occurred. Gerola, Seiden & Schulman (1980) have argued that star formation indwarf galaxies is likely to proceed in bursts, whereas giant galaxies probably exhibit amore nearly constant rate of star formation. This is consistent with the observations of'blue compact dwarf galaxies' reported by Fanelli, O'Connell & Thuan (1988). Fromobservations with the International Ultraviolet Explorer (IUE) satellite these authors findthat such objects (which typically have M B > —18) had star formation histories that werecharacterized by discrete bursts of star formation lasting for a few million years that wereseparated by tens, or hundreds, of millions of years. Basically this conclusion is based onthe observation that the IUE spectra of galaxies such as Markarian 209, which showsevidence for the presence of main-sequence O3-O6 V stars and B2-B3 V stars, without asignificant contribution by O7-B1 V stars. Telles, Melnick & Terlevich (1997) haveobtained a uniform set of images of 39 H II galaxies, from which they conclude that theseobjects are, in fact, a very inhomogeneous morphological class. An extended component,which possibly represents an underlying galaxy, is found in about half of these objects.
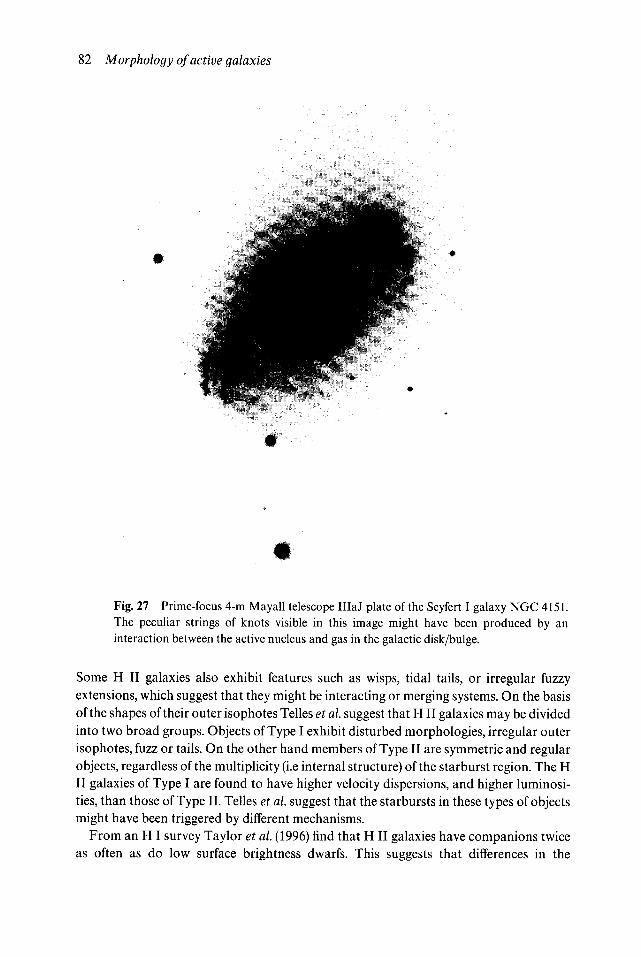
82 Morphology of active galaxies
: • : * ,
Fig. 27 Prime-focus 4-m Mayall telescope HlaJ plate of the Seyfert I galaxy NGC 4151.The peculiar strings of knots visible in this image might have been produced by aninteraction between the active nucleus and gas in the galactic disk/bulge.
Some H II galaxies also exhibit features such as wisps, tidal tails, or irregular fuzzyextensions, which suggest that they might be interacting or merging systems. On the basisof the shapes of their outer isophotes Telles et al. suggest that HII galaxies may be dividedinto two broad groups. Objects of Type I exhibit disturbed morphologies, irregular outerisophotes, fuzz or tails. On the other hand members of Type II are symmetric and regularobjects, regardless of the multiplicity (i.e internal structure) of the starburst region. The HII galaxies of Type I are found to have higher velocity dispersions, and higher luminosi-ties, than those of Type II. Telles et al. suggest that the starbursts in these types of objectsmight have been triggered by different mechanisms.
From an H I survey Taylor et al. (1996) find that H II galaxies have companions twiceas often as do low surface brightness dwarfs. This suggests that differences in the
Summary 83
frequency of nearby HI rich companions (which can be captured) might possibly accountfor some of the striking contrast between the star formation rates in low surface bright-ness galaxies and HII galaxies. Skillman (1996) finds that the radial H I profiles are morecentrally peaked in H II galaxies than they are in typical dwarf irregulars. Haro 2 = Arp233 is an example of a small class of low surface brightness non-star forming ellipticalgalaxies (Loose & Thuan 1986) that contain a single high surface brightness nuclearregion.
13.4 Luminous infrared galaxies
At luminosities > 1011 LQ infrared galaxies become the dominant population of nearbyextragalactic objects (Sanders & Mirabel 1996). In most cases the intense infraredemission in these galaxies is thought to have been triggered by strong interactions of, ormergers between, gas-rich spirals. Observations obtained with the ISO short wavelengthspectrometer (Lutz et al. 1996) show that such objects are mainly powered by recentlyformed massive stars that are embedded in dust clouds. The proto-typical object Arp 220may contain a powerful nuclear starburst that is rapidly clearing out the obscuring dustygas in the inner few kpc of this highly unusual galaxy. Lehnert & Heckman (1996) findthat starbursts appear to have a limiting surface brightness of about 1011 LQ kpc"2 ,corresponding to a maximum star formation rate of ~20 MQ yr~' kpc"2 . This suggeststhat starbursts are, in some way, self-regulating.
13.5 Summary
Active galaxies, which are not in the 'ground state' (Ozernoy 1974), belong to two mainclasses: (1) diffuse objects, such as Haro galaxies and Markarian galaxies, and (2) galaxieswith active nuclei like quasars, Seyferts, blazars and LINERS. Activity in diffuse activegalaxies may have been triggered by strong tidal interactions, collisions between gas-richgalaxies, or capture of large amounts of intergalactic gas. Active galactic nuclei appear toresult from the capture of gas (and stars?) by massive central black holes.

14 Evolution of galaxy morphology
Butcher & Oemler (1978) discovered that distant rich clusters of galaxies contain moreblue spiral galaxies than do similarly rich nearby clusters. This observation provided thefirst direct evidence for the evolution of galaxy morphology, i.e. that distant galaxies are(from an evolutionary point of view) younger than nearby galaxies. The limited resolutionof ground-based telescopes made it difficult to follow this discovery up with more detailedstudies of the evolution of galactic structure and morphology with increasing look-backtime.
14.1 Galaxies viewed at large look-back times
A dramatic improvement of our ability to study distant galaxies is now provided by theHST. Abraham et al. (1996b) find that galaxies in the Medium Deep Survey (Driver,Windhorst & Griffiths 1995), which are typically located at z ~ 0.5, are basically stillquite similar to those in the vicinity of the Milky Way, although the fraction of interactinggalaxies (and objects that do not fit naturally within the Hubble classification scheme) isenhanced. Our deepest view into the past is provided by the HST observations in theHubble Deep Field (Williams et al. 1996). These data are based on observations extendingover 150 orbits in four colors of a field in Ursa Major. They provide images of 290 objectswith 21 < / < 25. Abraham et al. (1996a) find that the fraction of asymmetrical anddistorted galaxies is larger in the Hubble Deep Field than it is in the Medium DeepSurvey. A comparison between galaxy classifications on the DDO system in the Shapley-Ames Catalog (SAC) (van den Bergh 1960c), in the Medium Deep Survey (MDS) (Ab-raham et al. 1996b), and in the Hubble Deep Field (HDF) (van den Bergh et al. 1996) isshown in Table 18. A caveat is that galaxy classifications in the I band may have beensystematically affected by the fact that distant galaxies in the Hubble Deep Field will, onaverage, be viewed at shorter rest frame wavelengths than they are in the less distantMedium Deep Survey. No significant systematic difference is, however, expected betweenthe B observations of nearby galaxies and the / observations of Medium Deep Surveygalaxies at z ~ 0.5.
A detailed study of cosmological bandshifting using pixel-by-pixel K corrections isdiscussed by Abraham, Freedman & Madore (1997). These authors conclude that 'themajority of peculiar/irregular/merging galaxies visible in the Hubble Deep Field are notsimply bandshifted spiral galaxies, although some very late-type spirals will be mis-classified as irregulars at high redshift.' The steep rise in the number count-magnitude
86 Evolution of galaxy morphology
Table 18. Frequency of galaxy
Type SAC
E/SO 24%S/Ir 69Not classified 7
classifications
MDS
20%6317
HDF
30%3139
relation for such peculiar/irregular/merging galaxies continues to at least 25th magnitudein /. The increase in the number counts of such objects is much steeper than would bepredicted by no-evolution models. This contrasts with the situation for E/SO galaxies. Thenumber counts for such early-type galaxies only slightly exceed the predictions obtainedfrom no-evolution models.
The data in Table 18 show little change in the fraction of early-type galaxies as afunction of look-back time. The most straightforward interpretation of this result is thatelliptical galaxies formed at a very early epoch. However, uncertain corrections forevolutionary changes in galaxy luminosity leave this conclusion somewhat insecure.Nevertheless, the fact that the color-magnitude diagrams for elliptical galaxies in richclusters like Coma show very little dispersion in color suggests that most E galaxies insuch clusters had highly synchronous evolutionary histories. A firmer conclusion fromthe data in Table 18 is that the fraction of spiral galaxies decreases rapidly with increasinglook-back time. The almost complete absence of 'grand design' spirals among the faintergalaxies in the Hubble Deep Field is particularly striking. The most likely interpretationof this result is that most spiral galaxies had not yet been assembled from their ancestralclumps at the time of the HDF era. Objects such as HDF 2-86 (Figure 28) and HDF 3-312(Figure 29) (color images of these galaxies are shown in van den Bergh et al. (1996)) areexamples of spiral galaxies that appear to be in the process of being assembled fromancestral fragments. A particularly striking feature of the galaxian population in theHubble Deep Field (van den Bergh et al. 1996) is that barred spirals appear to be almostabsent. Such barred spirals account for 22% of the nearby Shapley-Ames Catalog sample,4% of the more distant Medium Deep Survey sample and only 0.3% of the very distantHubble Distant Field sample. Perhaps young distant disk galaxies in the Hubble DeepField have not yet had time to develop bar-like instabilities. Alternatively such disksmight have been heated by rapid recent infall of ancestral fragments, thus preventingbar-like instabilities. Andreon, Davoust & Heim (1997) note that they find it to be muchmore difficult to see barred galaxies in HST post-refurbishment images of the clusterAbell 851 at z = 0.407 than it is to see such bars in the nearby Coma cluster. Theytherefore suggest that the almost complete lack of barred spirals in the Hubble Deep Fieldis due to the difficulty of recognizing bars at such large distances. However, it should beemphasized that the compact bars in the SB0 galaxies in rich clusters are much moredifficult to recognize at large distances than are the larger bars that occur in thewide-open spirals that dominate in field galaxy samples. A small percentage of the
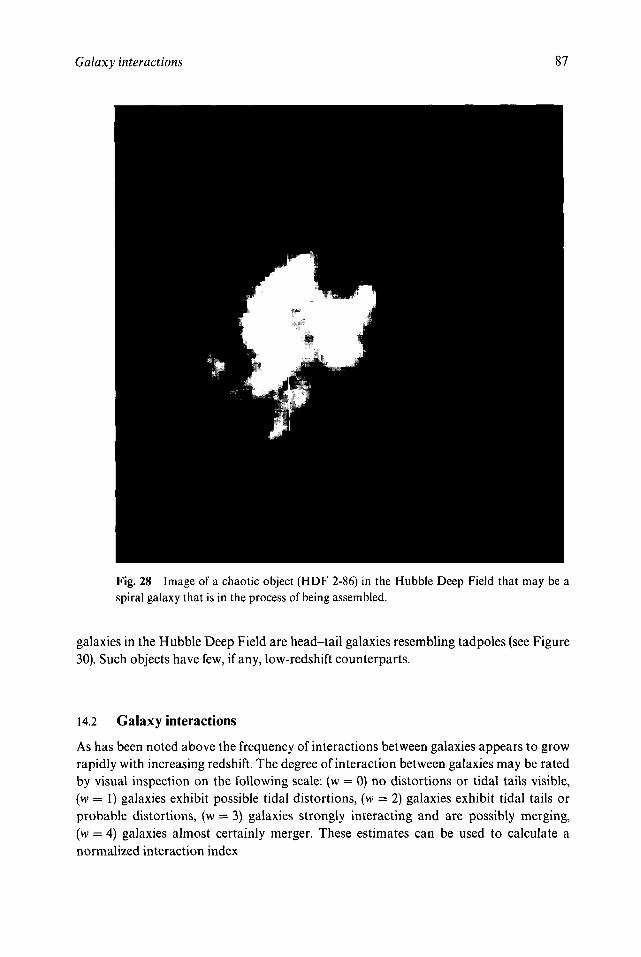
Galaxy interactions 87
Fig. 28 Image of a chaotic object (HDF 2-86) in the Hubble Deep Field that may be aspiral galaxy that is in the process of being assembled.
galaxies in the Hubble Deep Field are head-tail galaxies resembling tadpoles (see Figure30). Such objects have few, if any, low-redshift counterparts.
14.2 Galaxy interactions
As has been noted above the frequency of interactions between galaxies appears to growrapidly with increasing redshift. The degree of interaction between galaxies may be ratedby visual inspection on the following scale: (w = 0) no distortions or tidal tails visible,(w = 1) galaxies exhibit possible tidal distortions, (w = 2) galaxies exhibit tidal tails orprobable distortions, (w = 3) galaxies strongly interacting and are possibly merging,(w = 4) galaxies almost certainly merger. These estimates can be used to calculate anormalized interaction index
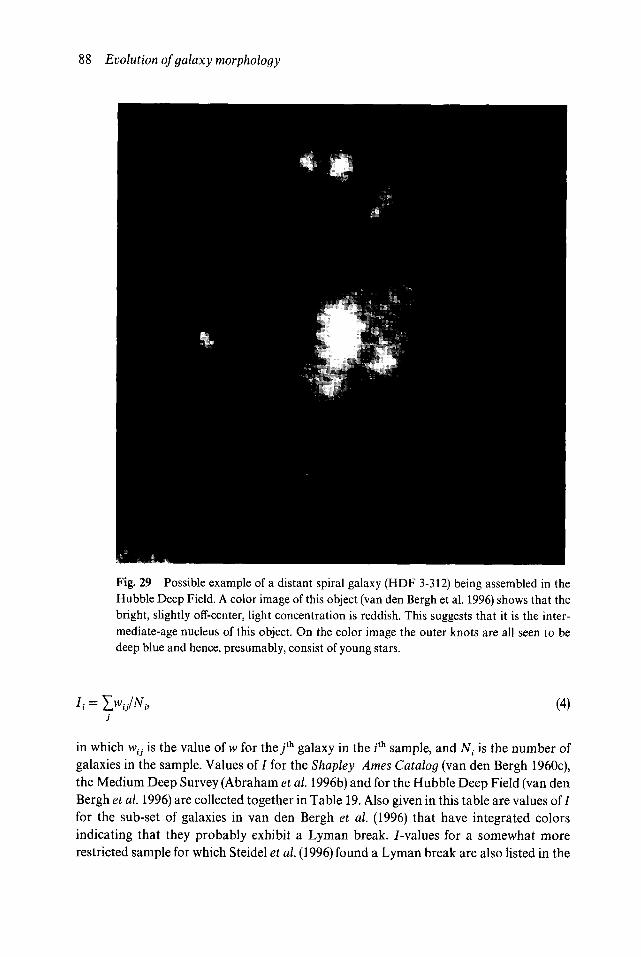
88 Evolution of galaxy morphology
Fig. 29 Possible example of a distant spiral galaxy (HDF 3-312) being assembled in theHubble Deep Field. A color image of this object (van den Bergh et al. 1996) shows that thebright, slightly off-center, light concentration is reddish. This suggests that it is the inter-mediate-age nucleus of this object. On the color image the outer knots are all seen to bedeep blue and hence, presumably, consist of young stars.
(4)
in which wtj is the value of w for the/ h galaxy in the ith sample, and Nt is the number ofgalaxies in the sample. Values of / for the Shapley-Ames Catalog (van den Bergh 1960c),the Medium Deep Survey (Abraham et al. 1996b) and for the Hubble Deep Field (van denBergh et al. 1996) are collected together in Table 19. Also given in this table are values of/for the sub-set of galaxies in van den Bergh et al. (1996) that have integrated colorsindicating that they probably exhibit a Lyman break, /-values for a somewhat morerestricted sample for which Steidel et al. (1996) found a Lyman break are also listed in the
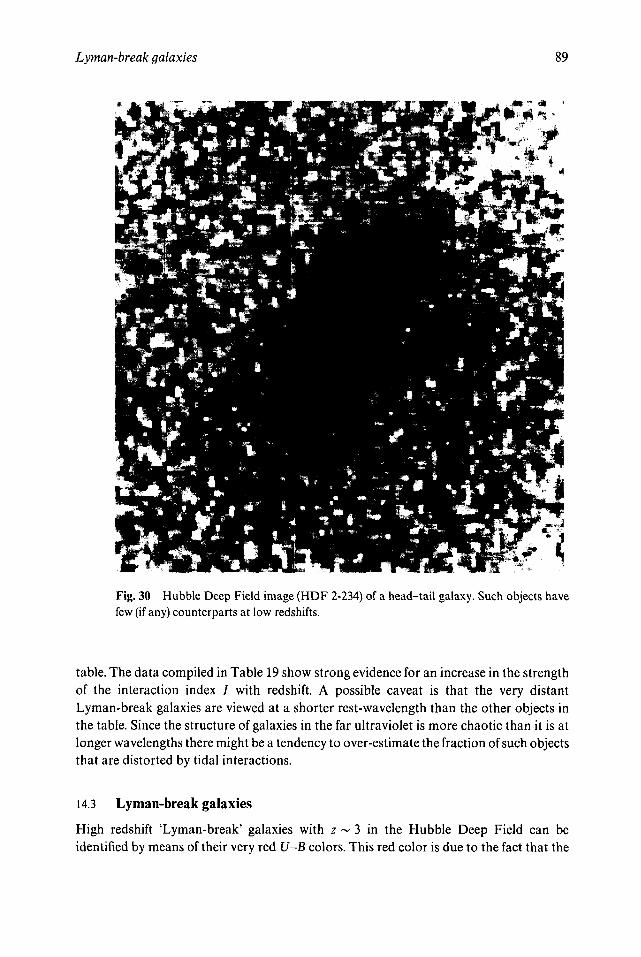
Lyman-break galaxies 89
Fig. 30 Hubble Deep Field image (HDF 2-234) of a head-tail galaxy. Such objects havefew (if any) counterparts at low redshifts.
table. The data compiled in Table 19 show strong evidence for an increase in the strengthof the interaction index / with redshift. A possible caveat is that the very distantLyman-break galaxies are viewed at a shorter rest-wavelength than the other objects inthe table. Since the structure of galaxies in the far ultraviolet is more chaotic than it is atlonger wavelengths there might be a tendency to over-estimate the fraction of such objectsthat are distorted by tidal interactions.
14.3 Lyman-break galaxies
High redshift 'Lyman-break' galaxies with z ~ 3 in the Hubble Deep Field can beidentified by means of their very red U-B colors. This red color is due to the fact that the
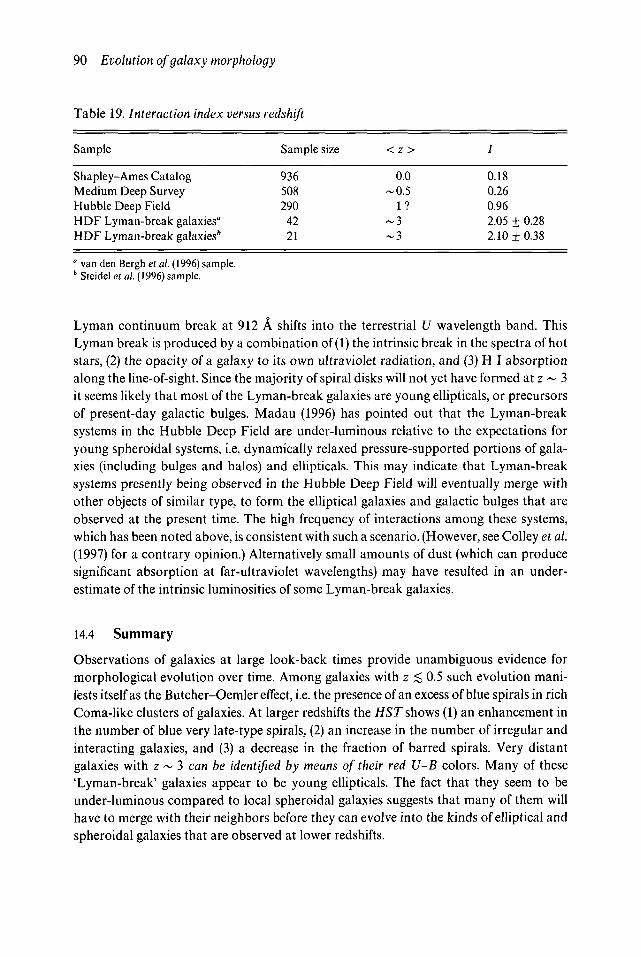
90 Evolution of galaxy morphology
Table 19. Interaction index versus redshift
Sample Sample size < z >
Shapley-Ames CatalogMedium Deep SurveyHubble Deep FieldHDF Lyman-break galaxies"HDF Lyman-break galaxies*
9365082904221
0.0-0.5
1?-5
0.180.260.962.05 ± 0.282.10 ± 0.38
° van den Bergh el al. (1996) sample.' Steidel etai. (1996) sample.
Lyman continuum break at 912 A shifts into the terrestrial U wavelength band. ThisLyman break is produced by a combination of (1) the intrinsic break in the spectra of hotstars, (2) the opacity of a galaxy to its own ultraviolet radiation, and (3) H I absorptionalong the line-of-sight. Since the majority of spiral disks will not yet have formed at z ~ 3it seems likely that most of the Lyman-break galaxies are young ellipticals, or precursorsof present-day galactic bulges. Madau (1996) has pointed out that the Lyman-breaksystems in the Hubble Deep Field are under-luminous relative to the expectations foryoung spheroidal systems, i.e. dynamically relaxed pressure-supported portions of gala-xies (including bulges and halos) and ellipticals. This may indicate that Lyman-breaksystems presently being observed in the Hubble Deep Field will eventually merge withother objects of similar type, to form the elliptical galaxies and galactic bulges that areobserved at the present time. The high frequency of interactions among these systems,which has been noted above, is consistent with such a scenario. (However, see Colley et al.(1997) for a contrary opinion.) Alternatively small amounts of dust (which can producesignificant absorption at far-ultraviolet wavelengths) may have resulted in an under-estimate of the intrinsic luminosities of some Lyman-break galaxies.
14.4 Summary
Observations of galaxies at large look-back times provide unambiguous evidence formorphological evolution over time. Among galaxies with z < 0.5 such evolution mani-fests itself as the Butcher-Oemler effect, i.e. the presence of an excess of blue spirals in richComa-like clusters of galaxies. At larger redshifts the HST shows (1) an enhancement inthe number of blue very late-type spirals, (2) an increase in the number of irregular andinteracting galaxies, and (3) a decrease in the fraction of barred spirals. Very distantgalaxies with z ~ 3 can be identified by means of their red U-B colors. Many of these'Lyman-break' galaxies appear to be young ellipticals. The fact that they seem to beunder-luminous compared to local spheroidal galaxies suggests that many of them willhave to merge with their neighbors before they can evolve into the kinds of elliptical andspheroidal galaxies that are observed at lower redshifts.
15 Computer classification of galaxyimages
The image of a galaxy can be characterized in an entirely objective and non-controversialway by (1) its total integrated magnitude (usually the Holmberg (1958) magnitude basedon the total luminosity inside isophotes of 26.5 and 26.0 mag arcsec"2 in the photo-graphic and photo visual regions, respectively), (2) its integrated colors, U-B, B-V, V-Retc., (3) its isophotal radius r, in which r = (a x b)05, and where a and b are thesemi-major and semi-minor axes to some specific isophote, (4) its effective radius re,defined as the radius within which half of the total galaxy light is emitted in projection,and (5) for many (but not all) galaxies the disk and bulge scale-lengths. More detailedcharacterizations, such as those provided by the Hubble, de Vaucouleurs and DDO type,are much more difficult (or perhaps impossible) to carry out in an entirely objectivefashion.
Inspection of the images of the SRC Southern Sky Survey on IllaJ emulsion (van denBergh 1989b) show that it is just barely possible to recognize grand design spiral galaxiesat redshifts of up to about 1 x 10⁴ km s"*. The images of such objects have diameters of~0.5 mm (corresponding to 34') and contain ~ 1 x 10³ picture elements. Experienceshows that the images of galaxies with redshifts of 1000-2000 km s"1, which typicallycontain 1 x 10⁴—1 x 10⁵ picture elements, can be classified with confidence on platesobtained with the SRC Schmidt telescope. The accuracy of galaxy classifications alsodepends on the dynamic range of images. It is, for example, not possible to distinguish Eand SO galaxies with confidence on the prints (which have a small dynamic range) of thePalomar Sky Survey. On the other hand van den Bergh et al. (1990) find that interactiveinspection of CCD images (which have a large dynamic range) of Virgo galaxies oftenpermits more accurate galaxy classification than is possible on photographic plates. Thereason for this is that one can study both the faint outer structure and the bright innerregions of such galaxies in detail. It is also noted that it is easier to classify spiral galaxieson blue images than on images obtained in red light. The reason for this is that thecontrast between disk and spiral arms is greater in blue light than it is in red.
15.1 Comparison between visual and computer classifications
The agreement between the 'eyeball' classifications of different 'expert' morphologists hasbeen studied by Nairn et al. (1995) and Lahav et al. (1995). In these papers classifications
92 Computer classification of galaxy images
by each of the experts were transformed to the T system of de Vaucouleurs et al. (1976), inwhich T = 1 for Sa galaxies, T = 3 for Sb galaxies and T = 5 for Sc galaxies. Nairn et al.found an rms difference of 1.8 T units' between the classifications by different experts.This disappointingly large scatter is primarily due to the rather low dynamic range of theimages, which were scanned from glass copies of the original pates of the CambridgeAPM survey. Other contributing factors were the non-linear transformations of someclassification systems (such as the DDO system) to the de Vaucouleurs T system, the smallsize of some of the APM images, and inclusion of edge-on galaxies (which are oftendifficult or impossible to classify) in the sample. Not surprisingly, Nairn et al. find thatclassifiers who belong to the same 'school' (i.e. classify exactly on the same system) agreewith each other better than others, who each classify galaxies on their own system.
15.2 Artificial neural networks
The advent of enormous databases, such as the Sloan Digital Sky Survey, will provideimages of millions of galaxies. Complete analysis of such data samples will only bepossible using computer-based techniques. Lahav et al. (1996) have made some prelimi-nary attempts to apply artificial neural networks to this problem. Such neural networksmay be thought of as non-linear minimizing machines that operate in a multi-dimen-sional space. Lahav et al. find an rms dispersion of ~ 2 T units between classification byhumans and by artificial neural networks; i.e. a difference that is only marginally largerthan that between human experts. The main advantage of artificial neural networkclassifications is that they can be defined objectively by use of a specific 'training set,' andthat such classifications require orders of magnitude less time than do those by humanexperts. Obvious disadvantages of such mass-produced galaxy classifications are thatartificial neural networks might be mis-led if: (1) two galaxies (or a galaxy and a star) areoptically superposed; (2) galaxies are tidally interacting; (3) galaxies are viewed almostedge-on; (4) a galaxy has a peculiarity such as a 'jet', or dust patches; and (5) an artifact issuperposed on the galaxy image.
is.3 Objective classification parameters
Quantities that are particularly suitable for the classification of digital images by com-puters have been discussed by Doi, Fukugita, & Okamura (1993) and by Abraham et al.(1994,1996b). Abraham et al. parametrize a galaxy image by using the parameters C andA, in which C measures the central concentration of light and A describes the asymmetryof the image. The asymmetry parameter is determined by rotating an individual galaxyimage about its center and then self subtracting it from the original image. The centralconcentration parameter C is measured from the second order moments of a galaxyimage. Measurements of A and C have been reported for galaxies in the HST MediumDeep Survey (Abraham et al. 1996b) and in the Hubble Deep Field (Abraham et al.1996a). These data show the following: (1) E/SO, spiral and Ir/merging galaxies areseparated rather cleanly in the log A versus log C plane (see Figure 31); (2) with increasing
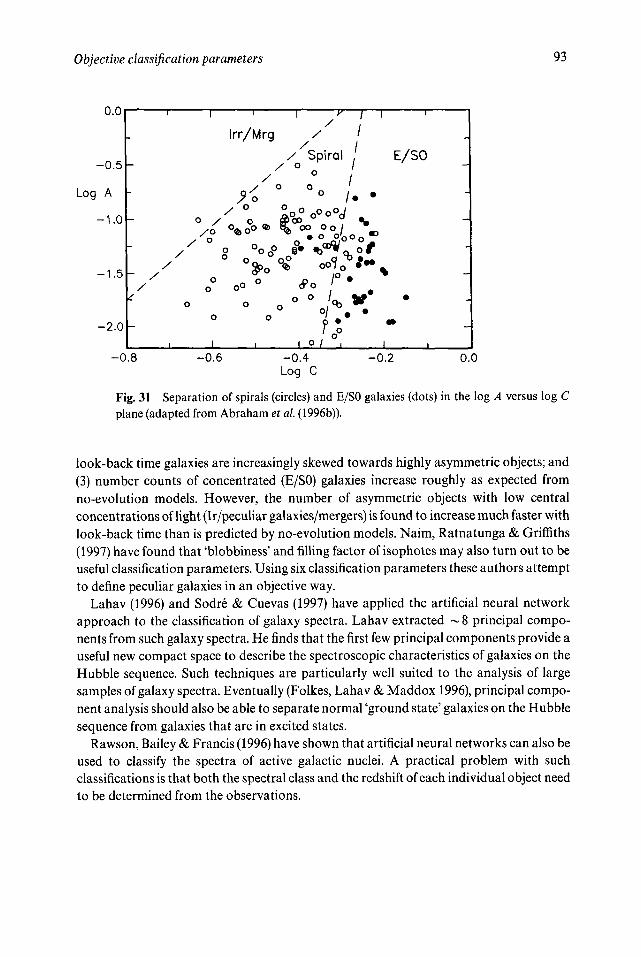
Objective classification parameters 93
0.0
-0.5
Log A
-1.0
-1.5 -
-2.0 -
-0.8
1 1 '
Irr/Mrg
/ O<3
X O
/ ° <•o / o i_/o ^ o
X ° ° Qb ° °(~ .y o o/ o o°
o o oo o
1 1 1
1
//
/ Spiral
° 0
OV ft
cPo
?I
1 O /
°°0
^ c
" ' c
/°
o
/
/I
11
/ • •
•
^ #
%
I
E/SO
-
-
-
•
•»1
-0.6 -0.4Log C
-0.2 0.0
Fig. 31 Separation of spirals (circles) and E/SO galaxies (dots) in the log A versus log Cplane (adapted from Abraham et al. (1996b)).
look-back time galaxies are increasingly skewed towards highly asymmetric objects; and(3) number counts of concentrated (E/SO) galaxies increase roughly as expected fromno-evolution models. However, the number of asymmetric objects with low centralconcentrations of light (Ir/peculiar galaxies/mergers) is found to increase much faster withlook-back time than is predicted by no-evolution models. Nairn, Ratnatunga & Griffiths(1997) have found that 'blobbiness' and filling factor of isophotes may also turn out to beuseful classification parameters. Using six classification parameters these authors attemptto define peculiar galaxies in an objective way.
Lahav (1996) and Sodre & Cuevas (1997) have applied the artificial neural networkapproach to the classification of galaxy spectra. Lahav extracted ~ 8 principal compo-nents from such galaxy spectra. He finds that the first few principal components provide auseful new compact space to describe the spectroscopic characteristics of galaxies on theHubble sequence. Such techniques are particularly well suited to the analysis of largesamples of galaxy spectra. Eventually (Folkes, Lahav & Maddox 1996), principal compo-nent analysis should also be able to separate normal 'ground state' galaxies on the Hubblesequence from galaxies that are in excited states.
Rawson, Bailey & Francis (1996) have shown that artificial neural networks can also beused to classify the spectra of active galactic nuclei. A practical problem with suchclassifications is that both the spectral class and the redshift of each individual object needto be determined from the observations.
94 Computer classification of galaxy images
15.4 Summary
The experiments in computer assisted classification of galaxies, which have been de-scribed above, show that such techniques hold great promise for the study of large galaxysamples. However, visual classification of galaxy images by expert craftsmen will prob-ably continue to play an important role in the study of particularly critical small samples,and for quality control of the automated classification of images in large databases.
16 Problems, challenges andconclusions
Morgan (1958) has said that 'The value of a system of classification depends on itsusefulness.' Using this criterion the Hubble classification system has proved to be ofoutstanding value because it has provided deep insights into the relationships betweengalaxy morphology, galactic evolution and stellar populations. However, some classifica-tion parameters, such as the r and s varieties in the de Vaucouleurs system, have not yetbeen tied as firmly to physically significant differences between galaxies (cf. Kormendy(1982)). Furthermore, it is not yet clear if the dichotomy between ordinary and barredspirals allows one to draw any useful conclusions about the past evolutionary history of aparticular galaxy.
The Hubble system was designed to provide a framework for the classification ofgalaxies in nearby regions of the Universe. It is therefore not surprising that it does notprovide a useful reference frame for the classification of very distant galaxies (which areviewed at large look-back times), or for galaxies in unusual environments such as thecores of rich clusters. Furthermore, the existence of some classes of objects, such as (1)amorphous/Ir II galaxies, (2) anemic galaxies and (3) cD galaxies, which cannot be'shoehorned' into the Hubble system, suggests that such galaxies have had an unusualevolutionary history. It has also become clear that the Hubble system, which is defined interms of supergiant prototypes, does not provide a very useful framework for theclassification of low-luminosity galaxies. Among such low luminosity objects a classifica-tion system based on the mean age of stellar populations appears to be more useful. Inother words one might arrange such objects in a sequence from old dSph (Ursa Minor),through younger dSph (Carina), to inactive dSph/Ir (Phoenix), to dlr (DDO 210).Another problem with the Hubble system, and its extension by de Vaucouleurs, is that theeffects of galaxy luminosity and of population type are interwoven over the rangeSc-Sd-Sm. Furthermore, the Hubble system presently does not provide an objective wayof distinguishing between very late-type spiral and irregular galaxies. Other majorproblems that still remain unresolved are: (1) how dSph galaxies are related to dE galaxiesand dSOs (see Jerjen & Binggeli (1997) for a recent review); (2) how normal giant E galaxiesand SO galaxies are related; (3) what the relationship between boxy and disky E galaxies is,and how these relate to early-type spirals; (4) how cD galaxies form; and (5) what therelationship(s) between ordinary spirals and low surface-brightness disk galaxies is (orare).
96 Problems, challenges and conclusions
A number of exciting challenges remain for future workers on galaxy classification andmorphology:
• HII regions are the best tracers of spiral structure. It would therefore be of interestto try to classify arm structure from a large and homogeneous collection of Haimages of galaxies.
• The large mass-to-light ratios observed in many Local Group dwarf spheroidalgalaxies suggests that these objects did not form by condensation of dense knots intidal filaments. However, it would be interesting to search for dwarf spheroidalsthat do have low M/L-values to see if a significant fraction of the dSph galaxies inthe Universe might have formed from tidal tails.
• What are the differences between the evolutionary histories of normal and barredspirals, and why are SBc galaxies, in the mean, fainter than objects of type Sc?Spectroscopic determinations of [a/Fe] might be used to see if there is a systematicdifference between the collapse time-scales for these two types of objects.
• Is the apparent break down in the correlation between boxy/disky globalisophotes and core/power-law radial profiles for galaxies fainter thanMv = —20.5 entirely due to the effects of past tidal interactions?
• What is the origin of the chasm between objects of types E/SO and early-typespirals?
• Are gigantic Malin-type low surface brightness galaxies physically distinct fromsmaller low surface brightness galaxies?
• What can the morphology of young galaxies seen at large look-back times and thecolor distributions of globular clusters tell us about the early history of galaxyformation?
Future progress in the understanding of galaxy morphology and evolution will, no doubt,depend on both the acquisition of new data, and perhaps more importantly, on re-interpretation of what we already know. In the words of Yogi Berra: 'What gets us intotrouble is not what we don't know, but what we know for sure that just ain't so.'
References
Abraham, R.G., Freedman, W. & Madore, B. 1997, in HST and the High RedshiftUniverse, Proceedings of the 31th Herstmonceux Conference, Eds. N. Tanvir, A.Aragon-Salamanca & J. Wall, (Singapore: World Scientific Publ. Co.) p. 57
Abraham, R.G., Valdes, F , Yee, H.K.C., & van den Bergh, S. 1994, ApJ, 432, 75Abraham, R.G., Tanvir, N.R., Santiago, B.X., Ellis, R.S., Glazebrook, K. & van den
Bergh, S. 1996a, MNRAS, 279, L49Abraham, R.G., van den Bergh, S., Ellis, R., Glazebrook, K., Santiago, B.X., Griffiths, R.E.
& Surma, P. 1996b, ApJS, 107,1Andreon, S. 1996, A&A, 314,763Andreon, S, Davoust, E. & Heim, T. 1997, A&A, 323, 337Aparicio, A. & Gallart, C. 1995, AJ, 110,2105Armandroff, T.E., Da Costa, G.S., Caldwell, N. & Seitzer, P. 1993, AJ, 106, 986Arp, H. 1966, ApJS, 14,1Ashman, K.M. & Zepf, S.E. 1992, ApJ, 384, 50Baade, W. 1963, Evolution of Stars and Galaxies (Cambridge: Harvard University Press)Babul, A. & Ferguson, H.C. 1996, ApJ, 458,100Bahcall, J.N., Kirhakos, S., Saxe, D.H. & Schneider, D.P. 1997, ApJ, 479, 642Barnes, J.E. & Hernquist, L. 1992, Nature, 360, 715Beauchamp, D. & Hardy, E. 1997, AJ, 113,1666Bellazzini, M., Fusi Peci, F. & Ferraro, F.R. 1996, MNRAS, 278, 952Bender, R. 1988, A&A, 193, L7Bender, R. 1997, in The Nature of Elliptical Galaxies, Eds. M. Arnaboldi & G.S. Da Costa
(Canberra: Mt Stromlo Observatory) p. 11Bender, R., Surma, P., Dobereiner, S., Mollenhoff, C. & Madjewski, R. 1989, A&A, 217,35Bernstein, G.M, Nichol, R.C., Tyson, J.A., Ulmer, M.P. & Whittman, D. 1995, AJ, 110,
1507Bertelli, G., Mateo, M., Chiosi, C. & Bressan, A. 1992, ApJ, 388,400Binggeli, B. & Jerjen, H. 1997, A&A, in pressBinggeli, B , Sandage, A. & Tammann, G.A. 1985, AJ, 90,1681Binggeli, B., Sandage, A. & Tarenghi, M. 1984, AJ, 89, 64Binney, J. 1976, MNRAS, 177,19Binney, J. 1978, MNRAS, 183, 501Binney, J. & de Vaucouleurs, G. 1981, MNRAS, 194, 679
98 References
Bothun, G.D, Impey, CD. & Malin, D.F. 1991, ApJ, 376, 404Bothun, G., Impey, C. & McGaugh, S. 1997, PASP, 109, 745Bothun, G.D., Impey, CD., Malin, D.F. & Mould, J.R. 1987, A3, 94, 23Braun, R., Walterbos, R.A.M. & Kennicutt, R.C 1992, Nature, 360, 442Bresolin, F. & Kennicutt, R.C 1997, A3,113, 975Broeils, A.H. & Courteau, S. 1996 in Dark and Visible Matter in Galaxies - ASP
Conference Series No. 117, Eds. M. Persic & P. Salucci (San Francisco: ASP) p. 74Burkert, A. & Ruiz-Lapuente, P. 1997, Ap3,480, 297Butcher, H.R. 1977, ApJ, 216, 372Butcher, H. & Oemler, A. 1978, ApJ, 219,18Byrd, G., Valtonen, M., McCall, M. & Innanen, K. 1994, A3,107,2055Caon, N. & Einasto, M. 1995, MNRAS, 273, 913Caon, N., Capaccioli, M. & D'Onofrio, M. 1993, MNRAS, 265, 1013Carlberg, R.G. 1986, Ap3,310, 593Castellani, M., Marconi, G. & Buonanno, R. 1996, A&A, 310,715Cayatte, V., van Gorkom, J.H., Balkowski, C. & Kotanyi, C. 1990, A3,100, 604Cayatte, V., Kotanyi, C, Balkowski, C. & van Gorkom, J.H. 1994, A3,107,1003Colley, W.N., Gnedin, O.Y., Ostriker, J.P. & Rhoads, J.E. 1997, Ap3, 488, 579Courteau, S. 1996a, preprint astro-ph/9611092Courteau, S. 1996b, Ap3S, 103, 363Courteau, S., de Jong, R.S. & Broeils, A.H. 1996, ApJ, 457, L73Da Costa, G.S. 1991, in The Magellanic Clouds - IAU Symposium No. 148, Eds. R.
Haynes & D. Milne (Dordrecht: Kluwer) p. 183Da Costa, G.S. 1992, in The Stellar Populations of Galaxies -IAU Symposium No. 149,
Eds. B. Barbury & A. Renzini (Dordrecht: Reidel) p. 191Dalcanton, J.J, Spergel, D.N. & Summers, F.J. 1997, Ap3, 482, 659Danver, C.-G. 1942, Lund Ann. No. 10Davies, R.L, Efstathiou, G, Fall, M.S., Illingworth, G. & Schechter, P.L. 1983, Ap3,266,
41de Blok, W.J.G., McGaugh, S.S. & van der Hulst, M.J. 1996, MNRAS, 283, 18de Jong, R.S. 1996, A&A, 313,45de Jong, R.S. & Davies, R.L. 1996, in New Light on Galaxy Evolution, Eds. R. Bender &
R.L. Davies (Dordrecht: Kluwer) p. 359de Jong, R.S. & Davies, R.L. 1997, MNRAS, 285, LIde Vaucouleurs, G. 1948, Ann. d"Ap. 11, 247de Vaucouleurs, G. 1953, MNRAS, 113,134de Vaucouleurs, G. 1959a, Handb. der Physik, 53, 275de Vaucouleurs, G. 1959b, Handb. der Physik, 53, 311de Vaucouleurs, G. 1961, Ap3S, 5, 233de Vaucouleurs, G. 1963, Ap3S, 8, 31de Vaucouleurs, G., de Vaucouleurs, A. & Corwin, H.G. 1976, Second Reference Cata-
logue of Bright Galaxies (Austin: University of Texas Press)Disney, M.J. 1976, Nature, 263, 573
References 99
Djorgovski, S. & Davis, M. 1987, ApJ, 313, 59Doi, M., Fukugita, M. & Okamura, S. 1993, MNRAS, 264, 832Dressier, A. 1980, ApJ, 236, 351Dressier, A., Lynden-Bell, D., Burstein, D., Davies, R.L., Faber, S.M., Terlevich, R.J. &
Wegner, G. 1987, ApJ, 313, 42Dressier, A., Oemler, A, Butcher, H.R. & Gunn, J.E. 1994, ApJ, 430,107Driver, S.P., Windhorst, R.A. & Griffiths, R.E. 1995, ApJ, 453, 48Driver, S.P., Phillips, S., Davies, J.I., Morgan, I. & Disney, M.J. 1994, MNRAS, 268,
393Eggen, O.J., Lynden-Bell, D. & Sandage, A.R. 1962, ApJ, 136, 748Einasto, J., Saar, E. & Kaasik, A. 1974, Nature, 252, 111Elmegreen, D.M. & Elmegreen, B.G. 1982, MNRAS, 201,1021Elmegreen, D.M. & Elmegreen, B.G. 1987, ApJ, 314, 3Elmegreen, B.G, Elmegreen, D.M. & Montenegro, L. 1992, ApJS, 79, 37Elson, R.A.W, Gilmore, G.F. & Santiago, B.X. 1997, MNRAS, 289,157Faber, S.M. & Jackson, R.E. 1976, ApJ, 204, 668Faber, S.M. et al. 1996, preprint astro-ph/9610055Falomo, R. 1996, MNRAS, 283, 241
Fanelli, M.N, O'Connell, R.W. & Thuan, T.X. 1988, ApJ, 334, 665Ferguson, H.C. & Binggeli, B. 1994, A&.AR, 6, 67Ferrarese, L. 1996, Doctoral dissertation, The Johns Hopkins UniversityFisher, J.R. & Tully, R.B. 1975, A&A, 44,151Forbes, D.A. 1996, in The Nature of Elliptical Galaxies, Eds. M. Arnaboldi, G.S. Da Costa
& P. Saha (Canberra: Mt Stromlo Observatory) p. 493Folkes, S.R, Lahav, O. & Maddox, S.J. 1996, MNRAS, 283, 651Franx, M, Illingworth, G. & de Zeeuw, T. 1991, ApJ, 383,112Freeman, K.C. 1970, ApJ, 160, 811Friedli, D , Benz, W. & Kennicutt, R. 1994, ApJ, 430, L105Frogel, J.A, Quillen, A.C. & Pogge, R.W. 1996, in New Extragalactic Perspectives in
the New South Africa, Eds. D.L. Block & J.M. Greenberg (Dordrecht: Kluwer)p. 65
Gallagher, J.S. & Hunter, D.A. 1987, AJ, 94, 43Gallagher, J.S. & Wyse, R.F.G. 1994, PASP, 106, 1225Gerhard, O. & Binney, J. 1996, MNRAS, 279, 933Gerola, H. & Seiden, P.E. 1978, ApJ, 223,129Gerola, H , Seiden, P.E. & Schulman, L.S. 1980, ApJ, 242, 517Glazebrook, K, Ellis, R.S., Colless, M.M, Broadhurst, T.J, Allington-Smith, J.R. &
Tanvir, N.R. 1995, MNRAS, 273,157Gorgas, J , Pedraz, S, Guzman, R, Cardiel, N. & Gonzalez, J.J. 1997, ApJ, 481, L19Graham, A, Lauer, T.R., Colless, M. & Postman, M. 1996, ApJ, 465, 534Grevesse, N. & Noels, A. 1993 in Origin of the Elements, Eds. N. Prantzos, E. Vangioni-
Flam & M. Casse (Cambridge: Cambridge University Press) p. 15Gunn, J.E. & Gott, J.R. 1972, ApJ, 176,1
100 References
Guzman, R, Phillips, A.C, Gallego, J, Koo, D.C. & Lowenthal, J.D. 1997 preprintastro-ph/9703093
Hardy, E., Buonanno, R., Corsi, C.E., Janes, K.A. & Schommer, R.A. 1984, ApJ, 278, 592Hargraves, J.C., Gilmore, G., Irwin, MJ. & Carter D. 1996, MNRAS, 282, 305Haynes, M.P. & Giovanelli, R. 1986, ApJ, 306,466Heckman, T.M. 1978, PASP, 90, 241Hernquist, L. 1989, Nature, 340, 687Ho, L.C, Filippenko, A.V. & Sargent, W.L.W. 1997, ApJ, 487, 591Holmberg, E. 1958, Lund Medd. Ser. II, No. 136Holtzman, J.A. et al. 1997, AJ, 113, 656Hubble, E. 1926, ApJ, 64, 321Hubble, E. 1936, The Realm of the Nebulae, (New Haven: Yale University Press)Hudson, MJ. & Ebeling, H. 1996, preprint, astro-ph/9611083Humason, M.L., Mayall, N.U. & Sandage, A.R. 1956, AJ, 61, 97Hutchings, J.B. & Neff, S.G. 1991, AJ, 101,435Impey, C. & Bothun, G. 1989, ApJ, 341, 89Jablonka, P., Martin, P. & Arimoto, N. 1996, AJ, 112,1415Jerjen, H. & Binggeli, B. 1997, in The Nature of Elliptical Galaxies, Eds. M. Arnaboldi,
G.S. Da Costa & P. Saha, (Canberra: Mt Stromlo Observatory) p. 239Johnson, H.L. & Morgan, W.W. 1953, ApJ, 117, 313Kennicutt, R.C. 1981, AJ, 86,1847Kennicutt, R.C. & Hodge, P.W. 1982, ApJ, 253,101Kissler-Patig, M. 1997, Dissertation, Univ. BonnKleyna, J.T, Geller, M.J., Kenyon, S.J. & Kurtz, MJ. 1997, AJ, 113, 624Knezek, P. 1993, PhD Thesis, Univ. MassachusettsKochanek, C.S. 1996, ApJ, 457, 228Kormendy, J. 1977, ApJ, 218, 333Kormendy, J. 1978, in Nearly Normal Galaxies, Ed. S.M. Faber (Berlin: Springer) p. 163Kormendy, J. 1980, in ESO Workshop on Two Dimensional Photometry, Eds. P. Crane &
K. Kjar (Geneva: ESO) p. 191Kormendy, J. 1982, in Morphology and Dynamics of Galaxies, Eds. L. Martinet & M.
Mayor (Sauverny: Geneva Observatory) p. 113Kormendy, J. 1985, ApJ, 295, 73Kormendy, J. 1987a, in Structure & Dynamics of Elliptical Galaxies -IAU Symposium No.
127, Ed. T. de Zeeuw (Dordrecht: Reidel) p. 97Kormendy, J. 1987b, in Nearly Normal Galaxies, Ed. S.M. Faber (Berlin: Springer) p. 163Kormendy, J. 1990a, in Evolution of the Universe of Galaxies - ASP Conference Series No.
10, Ed. R.G. Kron (San Francisco: ASP) p. 33Kormendy, J. 1990b, in Dynamics and Interactions of Galaxies, Ed. R. Wielen (Berlin:
Springer) p. 499Kormendy, J. 1993, in Galactic Bulges-1AU Symposium No. 153, Eds. H. de Jonge & HJ.
Habing (Dordrecht: Kluwer) p. 209Kormendy, J. & Bender, R. 1994, in ESO/OH P Workshop on Dwarf Galaxies, Ed. G.
References 101
Meylan & P. Prugniel (Garching: ESO) p. 161Kormendy, J. & Bender, R. 1996, ApJ, 464, LI 19Kormendy, J. & Djorgovski, S. 1989, ARAA, 27, 235Kormendy, J. & Norman, C.A. 1979, ApJ, 233, 539Kormendy, J. & Richstone, D. 1995, ARA&A, 33, 581Krienke, O.K. & Hodge, P.W. 1974, AJ, 79,1242Kroupa, P. & Bastian, U. 1997, New Astronomy, 2, 77Kuijken, K., Fisher, D. & Merrifield, M.R. 1996, MNRAS, 283, 543Lahav, O. 1996, preprint astro-ph/9612096Lahav, O. et al. 1995, Science, 267, 859
Lahav, O., Niam, A., Sodre, L. & Storrie-Lombardi, M.C. 1996, MNRAS, 283, 207Lauer, T.R., Ajhar, E.A., Byun, Y.-L, Dressier, A., Faber, S.M., Grillmair, C, Kormendy,
J., Richstone, D. & Tremaine, S. 1995, AJ, 110, 2622Lee,M.G. 1995, AJ, 110,1129Lee, M.G. 1996, AJ, 112,1438Lehnert, M.D. & Heckman, T.M. 1996, ApJ, 412, 546Lin, C.C. & Shu, F.H. 1964, ApJ, 140, 646Lin, D.C.N. & Faber, S.M. 1983, ApJ, 266, L21Linnaeus, C. 1751, Philosophia Botanica No. 77Lobo, C, Biviano, A, Durret, F., Gerbal, D., Le Fevre, O., Mazure, A. & Slezak, E. 1997,
A&A, 317, 392Loose, H.H. & Thuan, T.X. 1986, ApJ, 309, 59Lopez-Cruz, O., Yee, H.K.C, Brown, J.P., Jones, C. & Forman, W. 1997, ApJ, 475, L97Lutz, D. et al. 1996, A&A, 315, L137MacKentry, J.W. 1989, ApJ, 343,125Madau, P. 1996, preprint astro-ph/9612157Mateo, M. 1997, in The Nature of Elliptical Galaxies, eds. M. Arnaboldi, G.S. Da Costa &
P. Saha (Canberra: Mt Stromlo Observatory), p. 259Mateo, M., Hodge, P. & Schommer, R.A. 1986, ApJ, 311,113Mateo, M., Udalski, A., Kaluzny, J., Kubiak, M. & Krzemiski, W. 1995, AJ, 109, 588Matthews, T.A., Morgan, W.W. & Schmidt, M. 1964, ApJ, 140, 35McGaugh, S.S. 1992, PhD Thesis, Univ. MichiganMcGaugh, S.S. & de Blok, W.J.G. 1997, ApJ, 481, 689McLeod, K.K. & Rieke, G.H. 1995, ApJ, 441, 96Merritt, D. 1984, ApJ, 276, 26Merritt, D. & Sellwood, J.A. 1994, ApJ, 425, 551Mihos, J.C., McGaugh, S.S. & de Blok, W.J.G. 1997, ApJ, 477, L79Minniti, D. & Zijlstra, A.A. 1996, ApJ, 467, LI 3Mirabel, I.F., Dottori, H. & Lutz, D. 1992, A&A, 256, L19Mo, H.J., McGaugh, S.S. & Bothun, G.D. 1994, MNRAS, 267,129Moles, M., Marquez, I. & Perez, E. 1995, ApJ, 438,604
Moore, B., Katz, N., Lake, G., Dressier, A. & Oemler, A. 1996, Nature, 379, 613Morgan, W.W. 1958, PASP, 70, 364
102 References
Morgan, W.W. 1959a, PASP, 71, 394Morgan, W.W. 1959b, AJ, 64, 432Morgan, W.W. 1962, ApJ, 135,1Morgan, W.W. & Lesh, J.R. 1965, ApJ, 142,1364Morris, M. & Serabyn, E. 1996, ARA&A, 34, 645Mould, J. 1997, PASP, 109,125Mulchaey, J.S. & Regan, M.W. 1997, ApJ, 482, L135Mulchaey, J.S., Regan, M.W. & Kundu, A. 1997, ApJ, 110, 299Murai, T. & Fugimoto, M. 1980, PASJ, 32, 581Nairn, A. et al. 1995, MNRAS, 11 A, 1107Nairn, A., Ratnatunga, K.U. & Griffiths, R.E. 1997, ApJ, 476, 510Nieto, J.-L. & Bender, R. 1989, A&A, 215, 266Nieto, J.-L., Bender, R. & Surma, P. 1991, A&A, 244, L37Nieto, J.-L., Capaccioli, M. & Held, E.V. 1988, A&A, 195, LINoguchi, M. 1996, ApJ, 469, 605Oemler,A. 1973, 4pJ, 180,11Olszewski, E.W., Suntzeff, N.B. & Mateo, M. 1996, ARA&A, 34, 511O'Neil, K., Bothun, G. & Cornell, M. 1997, AJ, 113,1212Oosterloo, T, Da Costa, G.S. & Staverley-Smith, L. 1996, AJ, 112,1969Ortolani, S. & Graton, R.G. 1988, PASP, 100, 1405Ozernoy, L.M. 1974, Proc. of the First European Astron. Meeting (Berlin: Springer) Vol. 3,
p. 65Perez Garcia, A.M. & Rodriguez Espinosa, J.M. 1996, AJ, 112,1863Pfenniger, D. & Norman, C. 1990, ApJ, 363, 391Pierce, M.J., Welch, D.L., McClure, R.D., van den Bergh, S., Racine, R. & Stetson, P.B.
1994, Nature, 371, 385Rawson, D.M., Bailey, J. & Francis, P.J. 1996, Pub. Astron. Soc. Australia, 13, 207Reaves, G. 1956, AJ, 61, 69Reaves, G. 1962, PASP, 74, 392Reshetnikov, V. & Combes, F. 1996, in Galaxy Scaling Relations: Origins, Evolution and
Applications - Third ESO- VLT Workshop (ESO: Garching) in pressReynolds, J.H. 1925, MNRAS, 85,1014Reynolds, J.H. 1927, Observatory, 50, 185Richstone, D. 1990, in Clusters of Galaxies, eds. W.R. Oegerle, M.J. Fitchett & L. Danly
(Cambridge: Cambridge University Press) p. 231Roberts, W.W, Roberts, M.S. & Shu, F.H. 1975, ApJ, 196, 381Ronnback, J, van Groningen, E, Wanders, I, & Orndahl, E. 1996, MNRAS, 283, 282Ryden, B.S. 1996, ApJ, 461,146Saglia, R.P., Bertschinger, E, Baggley, G., Burstein, D, Colless, M, Davies, R.L.,
McMahan, R.K. & Wegner, G. 1997, ApJS, 109, 79Sandage, A. 1961, The Hubble Atlas of Galaxies (Washington, DC: Carnegie Institution of
Washington)Sandage, A. 1975, in Galaxies and the Universe, eds. A. Sandage, M. Sandage & J. Kristien
References 103
(Chicago: Univ. Chicago Press) p. 1Sandage, A. 1990, JRASC, 84, 70Sandage, A. & Bedke, J. 1988, Atlas of Galaxies, (Washington: NASA SP-496) Sandage, A.
& Bedke, J. 1994 The Carnegie Atlas of Galaxies, (Washington, D.C.: CarnegieInstitution of Washington)
Sandage, A. & Brucato, R. 1979, AJ, 84,472Sandage, A. & Tammann, G.A. 1981, A Revised Shapley-Ames Catalog of Bright Galaxies
(Washington, DC: Carnegie Institution of Washington)Sandage, A, Freeman, K.C. & Stokes, N.R. 1970, ApJ, 160, 831Sanders, D.B. & Mirabel, I.F. 1996, ARA&A, 34, 749Sanroma, M. & Salvador-Sole, E. 1990, ApJ, 360, 16Sarajedini, A., Lee, Y.-W. & Lee, D.-H. 1995, ApJ, 450, 712Schombert, J.M. 1986, ApJS, 60, 603Schombert, J.M. 1987, ApJS, 64, 643Schombert, J.M. 1988, ApJ, 328,475Schombert, J.M. & Bothun, G.D. 1988, AJ, 95, 1389Schombert, J.M., Pildis, R.A., Eder, J.A. & Oemler, A. 1995, AJ, 110,2067Scorza, C. 1993, in Structure, Dynamics and Chemical Evolution of Elliptical Galaxies, Eds.
I.J. Danziger, W.W. Zeilinger & K. Kjar (Garching: ESO) p. 115Sellwood, J.A. & Wilkinson, A. 1993, Rep. Prog. Phys., 56, 173Sersic, J.L. 1968, Atlas de Galaxies Australis (Cordoba: Observatorio Astronomico)Shapley, H. 1938, Nature, 142, 715Shapley, H. 1939, Proc. Nat. Acad. Sci. 25, No. 11, 565 ( = Harvard Reprint No. 183)Shapley, H. & Paraskevopoulos, J.S. 1940, Proc. Nat. Acad. Sci. USA, 26, 31 ( = Harvard
Reprint No. 184)Sil'chenko, O.K. 1993, Astron. Lett. {USSR), 19, 283Skillman, E.D. 1996, in The Minnesota Lectures on Extragalactic Neutral Hydrogen -
ASP Conference Series, Vol. 106, Ed. E.D. Skillman (San Francisco: ASP) p. 208Sodre, L. & Cuevas, H. 1997, MNRAS, 287,137Spitzer, L. & Baade, W. 1951, ApJ, 113,431Stappers, B.W. et al. 1997, PASP, 109, 292Steidel, C.C., Giavalisco, M., Dickinson, M. & Adelberger, K.L. 1996, AJ, 112, 352Stetson, P.B. 1997, Baltic Astronomy 6, 3Strom, S.E. 1980, ApJ, 237, 686Stryker, L.L. 1983, ApJ, 266, 82Taylor, C.L. 1997, ApJ, 480, 524Taylor, C.L., Thomas, D.L, Brinks, E. & Skillman, E.D. 1996, ApJS, 107,143Telles, E., Melnick, J. & Terlevich, R. 1997, MNRAS, 286,183Thornley, M.D. 1996, ApJ, 469, L45Tremaine, S. 1990, in Dynamics and Interactions of Galaxies, Ed. R. Wielen (Berlin:
Springer) p. 394Tremblay, B. & Merritt, D. 1995, AJ, 110,1039Tully, R.B. & Verheijen, M.A.W. 1997, ApJ, 484,145
104 References
van den Bergh, S. 1959, Publ. David Dunlop Obs., 2,147van den Bergh, S. 1960a, ApJ, 131, 215van den Bergh, S. 1960b, ApJ, 131, 558van den Bergh, S. 1960c, Publ. David Dunlap. Obs., 2,159van den Bergh, S. 1962, Zs.f. Astrophysik, 55, 21van den Bergh, S. 1966, AJ, 71, 922van den Bergh, S. 1972, ApJ, 171, L31van den Bergh, S. 1976a, Sky & Telescope, 52,410van den Bergh, S. 1976b, ApJ, 206, 883van den Bergh, S. 1976c, in The Galaxy and the Local Group - RGO Bull. No. 182, Eds. R.J.
Dickens & J.E. Perry (Herstmonceux: Royal Greenwich Observatory) p. 95van den Bergh, S. 1986, AJ, 91, 271van den Bergh, S. 1989a, PASP, 101,1072van den Bergh, S. 1989b, AJ, 97,1556van den Bergh, S. 1990, ApJ, 348, 57van den Bergh, S. 1991, PASP, 103, 609van den Bergh, S. 1994, ApJ, 428, 617van den Bergh, S. 1995, AJ, 110, 613
van den Bergh, S., Pierce, M.J. & Tully, R.B. 1990, ApJ, 359,4van den Bergh, S, Abraham, R.G., Ellis, R.S., Tanvir, N.R., Santiago, B.X. & Glazebrook,
K.G. 1996, AJ, 112, 359van der Hulst, J.M, Skillman, E.D., Kennicutt, R.C. & Bothun, G.D. 1987, A&A, 111, 63van Gorkom, J. & Kotanyi, C. 1985, in The Virgo Cluster, Eds. O.-G. Richter & B.
Binggeli (Garching: ESO) p. 61Vorontsov-Velyaminov, B.A. & Krasnogorskaja, A.A. 1962, Morphological Catalog of
Galaxies, (Moscow: Moscow Univ. Press)Wakamatsu, K. 1976, PASJ, 28, 397Weedman, D.W. 1977, ARA&A, 15, 69West, M.J, Cote, P , Jones, C, Forman, W. & Marzke, R.O. 1995, ApJ, 453, L77White, S.D.M. 1982, in Morphology and Dynamics of Galaxies, Eds. L. Martinet & M.
Mayor (Sauverny: Geneva Observatory) p. 289Whitmore, B.C. & Gilmore, D.M. 1991, ApJ, 367, 64Williams, R.E. et al. 1996, AJ, 112,1335Wirth, A. & Gallagher, J.S. 1984, ApJ, 282, 85Wolf, M. 1908, Publ. Astrophys. Inst. Konigstuhl-Heidelberg, Vol. 3, No. 5Wray, J.D. 1988, The Color Atlas of Galaxies (Cambridge: Cambridge University Press)Young, C.K. & Currie, M.J. 1994, MNRAS, 268, L l lZwaan, M.A., van der Hulst, M.J, de Blok, W.J.G. & McGaugh, S.S. 1995, MNRAS, 273,
L35Zwicky, F. 1957, Morphological Astronomy (Berlin: Springer)
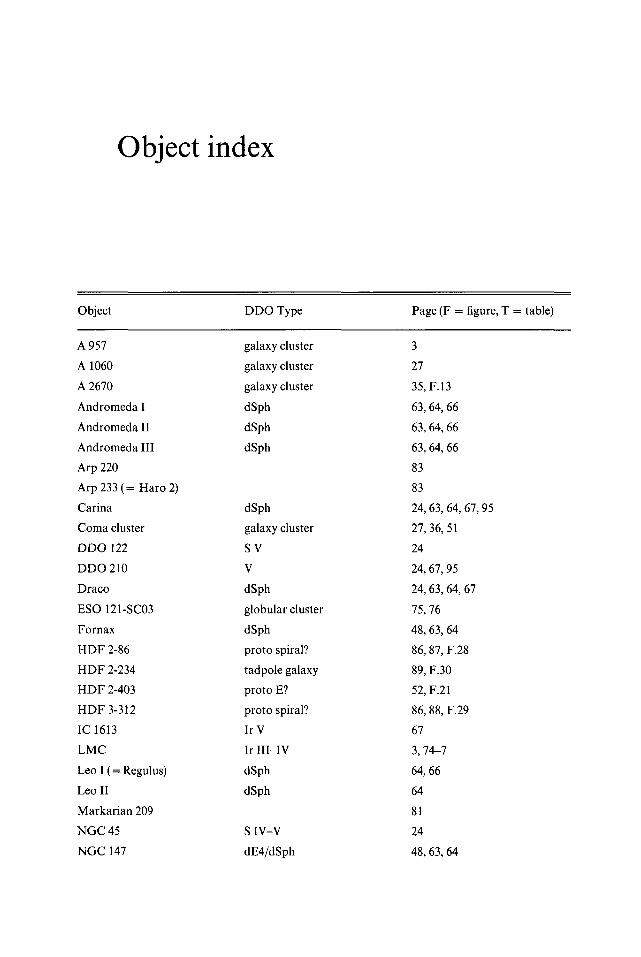
Object index
Object
A 957
A 1060
A 2670
Andromeda I
Andromeda II
Andromeda III
Arp 220
Arp233(= Haro2)
Carina
Coma cluster
DDO 122
DDO 210
Draco
ESO 121-SC03
Fornax
HDF 2-86
HDF 2-234
HDF 2-403
HDF 3-312
IC1613
LMC
Leo I (= Regulus)
Leo II
Markarian 209
NGC45
NGC 147
DDO Type
galaxy cluster
galaxy cluster
galaxy cluster
dSph
dSph
dSph
dSph
galaxy cluster
SV
V
dSph
globular cluster
dSph
proto spiral?
tadpole galaxy
proto E?
proto spiral?
IrV
Ir III-IV
dSph
dSph
SIV-V
dE4/dSph
Page (F = figure, T = table)
3
27
35.F.13
63,64, 66
63, 64, 66
63, 64, 66
83
83
24,63, 64, 67,95
27,36,51
24
24,67, 95
24,63, 64, 67
75,76
48,63, 64
86, 87, F.28
89, F.30
52, F.21
86, 88, F.29
67
3,74-7
64,66
64
81
24
48,63, 64
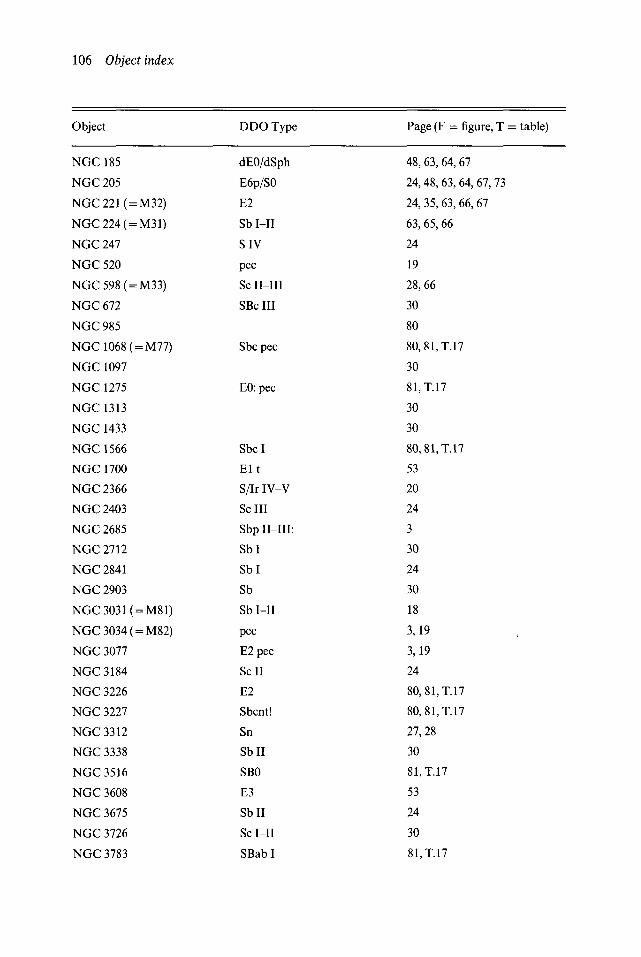
106 Object index
Object DDO Type Page (F = figure, T = table)
NGC 185NGC 205
NGC221( = M32)
NGC224( = M31)
NGC 247
NGC 520
NGC598( = M33)
NGC 672
NGC 985
NGC 1068 ( = M77)
NGC 1097
NGC 1275
NGC 1313
NGC 1433
NGC 1566
NGC 1700
NGC 2366
NGC 2403
NGC 2685
NGC 2712
NGC 2841
NGC 2903
NGC 3031 ( = M81)
NGC 3034 ( = M82)
NGC 3077
NGC 3184
NGC 3226
NGC 3227
NGC 3312
NGC 3338
NGC 3516
NGC 3608
NGC 3675
NGC 3726
NGC 3783
dEO/dSphE6p/S0
E2
Sb I-II
SIV
pec
Sc II-IH
SBc III
Sbc pec
EO: pec
Sbc I
E l t
S/Ir IV-V
ScIII
Sbp II-IH:
Sb l
Sbl
Sb
Sb I-II
pec
E2pec
Sell
E2
Sbcnt!
Sn
Sbll
SBO
E3
Sbll
Sc I-II
SBabI
48,63,64,67
24,48, 63, 64, 67, 73
24, 35, 63, 66, 67
63, 65,66
24
19
28,66
30
80
80,81,T.17
30
81.T.17
30
30
8O,81,T.17
53
20
24
3
30
24
30
18
3,19
3,19
24
80,81,T.17
80,81,T.17
27,28
30
81.T.17
53
24
30
81.T.17
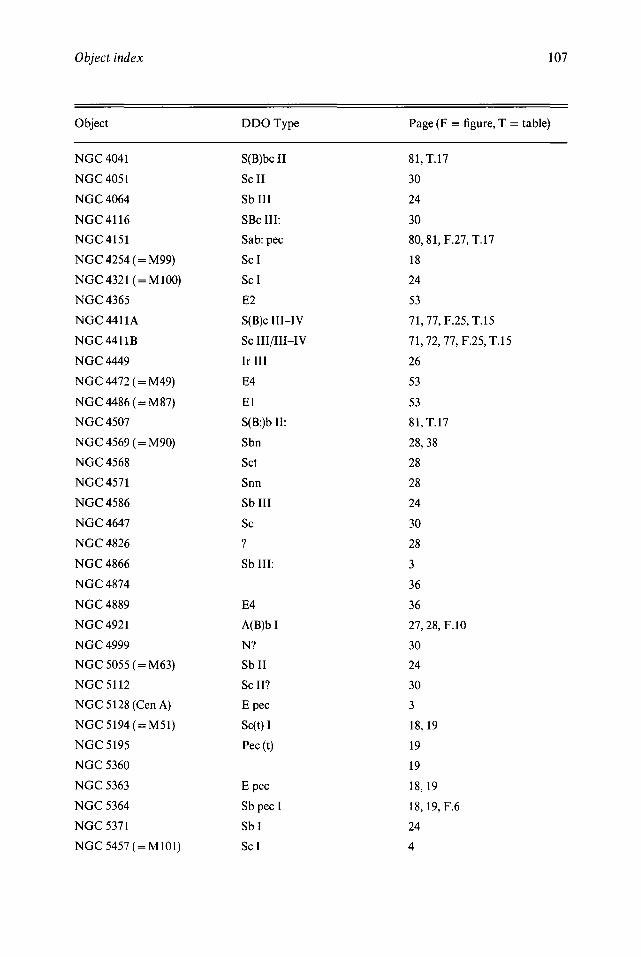
Object index 107
Object DDO Type Page (F = figure, T = table)
NGC 4041NGC4051
NGC 4064
NGC 4116
NGC 4151
NGC 4254 ( = M99)
NGC 4321 ( = M100)
NGC 4365
NGC 4411A
NGC 441 IB
NGC 4449
NGC 4472 ( = M49)
NGC 4486 ( = M87)
NGC 4507
NGC 4569 ( = M90)
NGC 4568
NGC 4571
NGC 4586
NGC 4647
NGC 4826
NGC 4866
NGC 4874
NGC 4889
NGC 4921
NGC 4999
NGC 5055 ( = M63)
NGC 5112
NGC5128(CenA)
NGC5194( = M51)
NGC 5195
NGC 5360
NGC 5363
NGC 5364
NGC 5371
NGC 5457 ( = M101)
S(B)bc IISell
SbUI
SBc III:
Sab: pec
Scl
Scl
E2
S(B)c III-IV
Sc III/III-IV
Ir III
E4
El
S(B:)b II:
Sbn
Set
Snn
SbHI
Sc
?
Sb III:
E4
A(B)b I
N?
Sbll
Sell?
E pec
Sc(t)I
Pec(t)
E pec
Sb pec I
Sbl
Scl
81,T.17
30
24
30
80,81, F.27,T.17
18
24
53
71,77,F.25,T.15
71,72,77,F.25,T.15
26
53
53
81.T.17
28,38
28
28
24
30
28
3
36
36
27,28, F.10
30
24
30
3
18,19
19
19
18,19
18,19, F.6
24
4
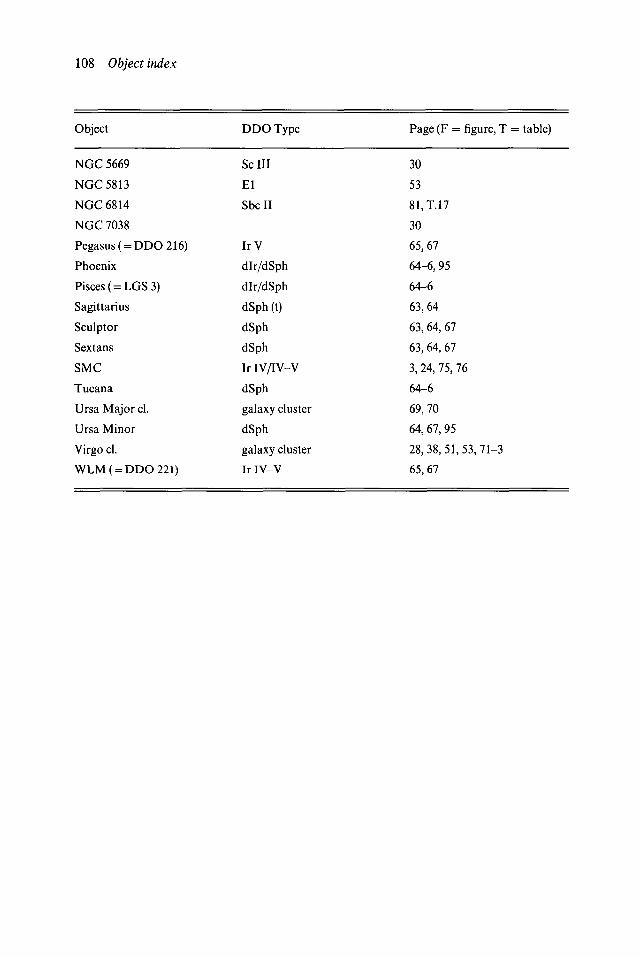
108 Object index
Object
NGC 5669
NGC5813
NGC 6814
NGC 7038
Pegasus ( = DDO 216)
Phoenix
Pisces ( = LGS 3)
Sagittarius
Sculptor
Sextans
SMC
Tucana
Ursa Major cl.
Ursa Minor
Virgo cl.
WLM( = DDO221)
DDO Type
ScIH
El
SbcII
IrV
dlr/dSph
dlr/dSph
dSph (t)
dSph
dSph
Ir IV/IV-V
dSph
galaxy cluster
dSph
galaxy cluster
Ir IV-V
Page (F = figure, T = table)
30
53
81,T.17
30
65,67
64-6,95
64-6
63,64
63, 64, 67
63, 64, 67
3,24, 75, 76
64-6
69,70
64, 67,95
28, 38, 51, 53, 71-3
65,67
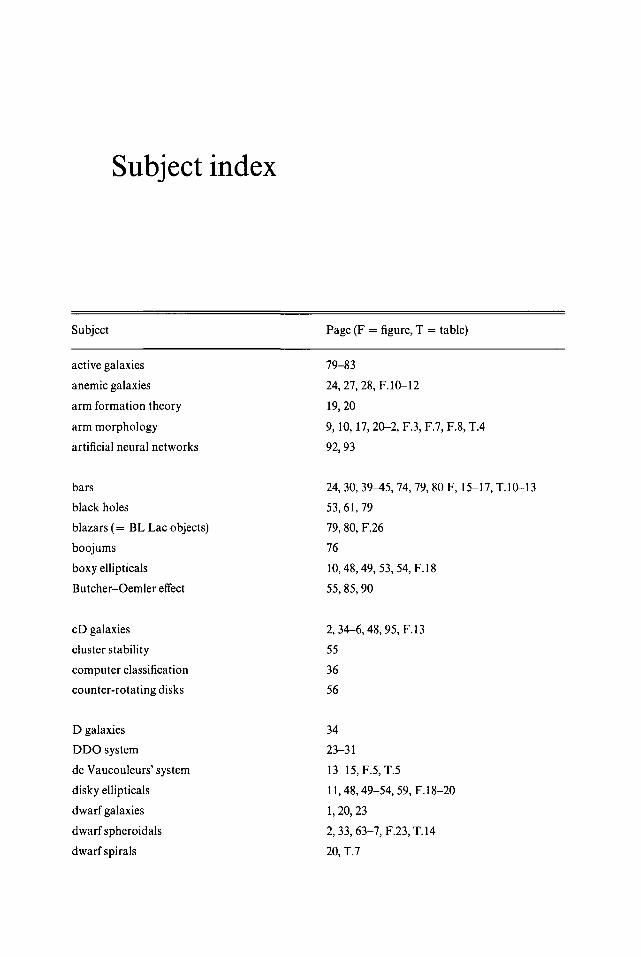
Subject index
Subject Page (F = figure, T = table)
active galaxies
anemic galaxies
arm formation theory
arm morphology
artificial neural networks
79-83
24,27,28, F. 10-12
19,20
9,10,17,20-2, F.3, F.7, F.8, T.4
92,93
bars
black holes
blazars (= BL Lac objects)
boojums
boxy ellipticals
Butcher-Oemler effect
24, 30, 39^15, 74, 79, 80 F, 15-17, T.10-13
53,61,79
79, 80, F.26
76
10,48,49, 53, 54, F.18
55,85,90
cD galaxies
cluster stability
computer classification
counter-rotating disks
2, 34-6,48,95, F.I3
55
36
56
D galaxies
DDO system
de Vaucouleurs' system
disky ellipticals
dwarf galaxies
dwarf spheroidals
dwarf spirals
34
23-31
13-15, F.5.T.5
ll,48,49-54,59,F.18-20
1,20,23
2,33,63-7, F.23.T. 14
20, T.7
110 Subject index
Subject
early-type galaxies
elliptical galaxies
Elmegreen's system
environmental effects
excited state galaxies
frequency distribution of types
fundamental plane
galaxy colors
globular clusters
ground state galaxies
Haro galaxies
Hubble classification system
Hubble Deep Field (HDF)
infrared galaxies
intergalactic H II regions
late-type galaxies
lenses
LINERS
Local Group
low surface brightness galaxies
luminosity distributions
Lyman break galaxies
Malin galaxies
Markarian galaxies
Medium Deep Survey (MDS)
mergers
off-center nuclei
Page (F = figure, T = table)
2
47-54, F.18-21
17-22
3
1, 79, 80, F.26
4.7.T.3
53
5,T.1,T.2
53, 75, 76
1, 79, 80, T.26
79, 80, F.26
10-12
45, 52, 53, 85-90, 92, F.21, T.18
83
81-3
2
39
79
63-7
69-77, F.24,F.25,T.15,T.16
6
89,90, T. 19
72, 73, 77,96
79, 80, F.26
85, 86, 92, T.18
52,61,82,87,90
59
Subject index 111
Subject Page (F = figure, T = table)
pattern speed 19
quasars 1, 79, 80, F.26
ram pressure stripping 27,28, 64, 71, 77
Reynolds' arm classifications 9
rings 13, F.5
Seyfert galaxies 1, 30,42, 79-82, F.26, F.27, T.17
SO galaxies 2, 34, 55-7, 60, 61,67, 95, 96, F.22
T types 13,14
tadpole galaxies 87, 89, F.30
trident diagram 29, F. 11
tuning fork diagram 1,10, 12, F.2, F.4
Van den Bergh's classifications 23-31, F.9, F.10, F.l l , F.12
Yerkes (Morgan) system 19, 33-8, F.14, T.9