galfar engineering & contracting (gecs.om)...
TRANSCRIPT

Call us on +973 17549499 or email us at [email protected]
Galfar Engineering & Contracting (GECS.OM)
CMP OMR 0.620 Target OMR 0.711 Potential Upside 14.6%
MSCI GCC Index 412.04 Muscat Securities Market 5,690.43
Key Stock Data Sector Construction Reuters Code GECS.OM Bloomberg Code GECS OM Equity Net Out. Shares (mn) 300.00 Market Cap (OMR bn) 0.186 Market Cap (USD bn) 0.484 Avg. 12m Vol. (mn) 1.256 Volatility (30 day) 33.925 Volatility (180 day) 71.131
Stock Performance (%) 52 week high / low (OMR) 2.365 / 0.391
1M 3M 12M Absolute (%) -0.5 44.5 -63.8 Relative (%) -5.8 18.3 -25.9
Shareholding Pattern (%) Salim Saeed Hamad Al Fannah Al Araimi 18.00 Dr Parambathekandi Mohammed Ali 10.00 Corporate 32.00 Public 40.00
GECS and Muscat Securities Market Movement
Executive Summary Established in 1972, Galfar Engineering & Contracting (Galfar) is mainly engaged in project management, engineering, procurement and construction in areas including Oil & Gas, Civil, Electro-Mechanical, Roads & Bridges and Environmental projects. With a turnover close to USD 1 billion, it is amongst the leading contractors in the Middle East. During 1Q09, the company’s order book stood at OMR 751 million. Healthy rise in contract income in 1Q09 Galfar reported a 16.7% YoY rise in its contract income to OMR 98.73 million in 1Q09. Meanwhile, its contract costs for the quarter increased 22.2% to OMR 85.78 million mainly due to higher sub-contracting costs. As a result, profit from contracts declined 10.0% to OMR 12.95 million in 1Q09, while margins dipped 389 bps to 13.1% during the quarter. The company’s hire revenues also decreased 16.1% to OMR 0.59 million from OMR 0.70 million in 1Q08. Further, while general & administrative (G&A) expenses rose 19.0% to OMR 2.16 million, depreciation charges increased 22.9% at OMR 5.07 million during the quarter. Rising expenses led to a 32.5% decline in operating profit to OMR 5.93 million in 1Q09. Weak operating performance along with higher net finance costs resulted in a 35.3% decline in net profit to OMR 4.65 million. The company’s adjusted EPS also declined from OMR 0.10 in 1Q08 to OMR 0.06 during the quarter. Outlook and valuation The construction sector in Oman in expected to remain upbeat on the back of massive infrastructure spending. According to MEED, projects worth USD 96.30 billion are either planned or underway in Oman. In addition to this, the construction sector has received the bulk of the additional appropriations to an extent of OMR 1.05 billion in the government’s budget for 2009. Galfar with a rich experience of more than three decades and being one of the most preferred partners of Petroleum Development Oman (PDO) is better positioned to reap benefits from these upcoming infrastructure projects. The company has a healthy order book of OMR 751 million and its impetus on securing EPC contracts is expected to aid it in maintaining a sustainable revenue flow. Besides, Galfar has already ventured into growth markets like India and is focusing on expanding its presence in the UAE, Libya and beyond. These initiatives are certainly going to keep the long-term growth drivers of the company intact. On the basis of these significant fundamental positives, Galfar presents an attractive investment opportunity. To determine the fair value of the company, we have used the DCF valuation method. Currently, Galfar’s stock is trading at a P/E multiple of 8.58x and 7.26x on 2009E and 2010E earnings, and at a P/B multiple of 1.86x and 1.63x on 2009E and 2010E BVPS, respectively. Meanwhile, the stock has outperformed the index by rising 60.7% since the beginning of this year as against a gain of 4.6% by the Muscat Securities Market. Considering the above factors, we arrive at a price target of OMR 0.711, which exhibits a potential upside of 14.6% from its closing price of OMR 0.620 (as on June 18, 2009). Accordingly, we initiate our coverage on Galfar Engineering & Contracting with an OVERWEIGHT recommendation. OMR Millions 2007A 2008A 2009E 2010E 2011E Contract income 267.46 362.98 407.80 443.37 484.83 EBITDA 40.48 45.99 47.93 54.99 63.27 EBITDA Margin (%) 15.1 12.7 11.8 12.4 13.0 Net Profit 22.16 22.91 21.68 25.62 30.54 Net Profit Margin (%) 8.3 6.3 5.3 5.8 6.3 Adjusted EPS (OMR) 0.07 0.08 0.07 0.09 0.10 Total Assets 257.52 371.15 395.92 427.34 465.06 RoAE 44.1 29.8 23.7 24.0 25.0
OVERWEIGHT
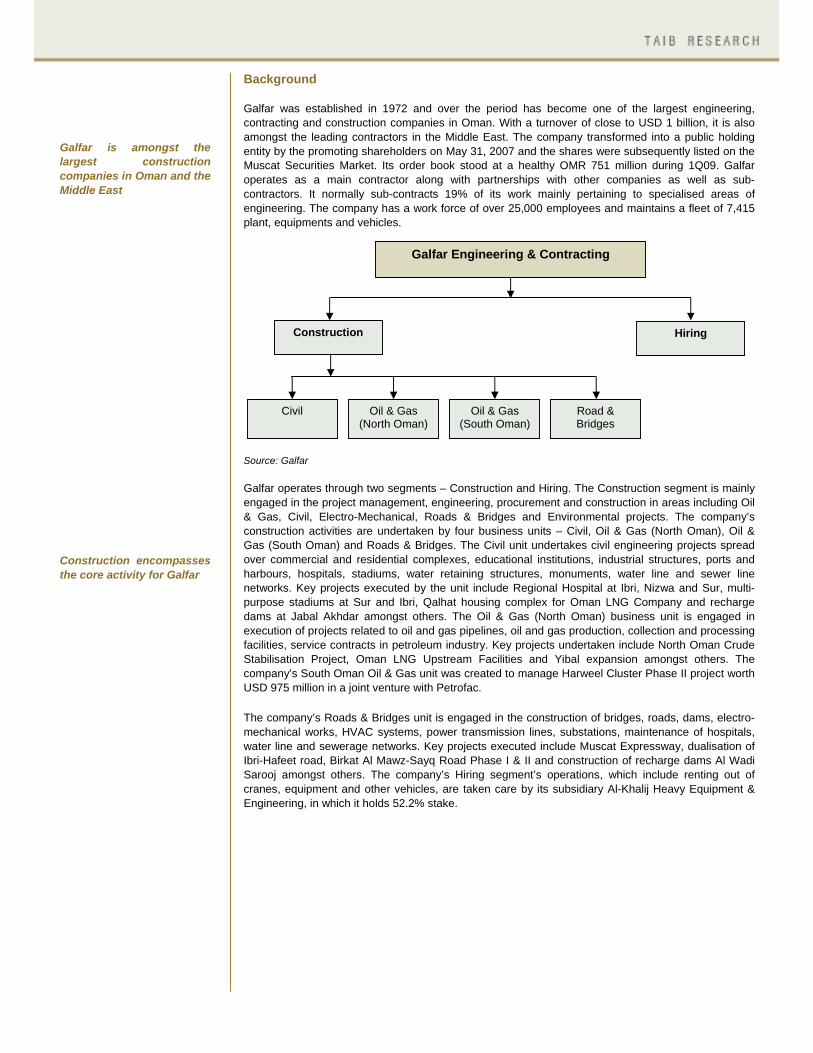
Background Galfar was established in 1972 and over the period has become one of the largest engineering, contracting and construction companies in Oman. With a turnover of close to USD 1 billion, it is also amongst the leading contractors in the Middle East. The company transformed into a public holding entity by the promoting shareholders on May 31, 2007 and the shares were subsequently listed on the Muscat Securities Market. Its order book stood at a healthy OMR 751 million during 1Q09. Galfar operates as a main contractor along with partnerships with other companies as well as sub-contractors. It normally sub-contracts 19% of its work mainly pertaining to specialised areas of engineering. The company has a work force of over 25,000 employees and maintains a fleet of 7,415 plant, equipments and vehicles.
Galfar is amongst the largest construction companies in Oman and the Middle East Construction encompasses the core activity for Galfar
Source: Galfar Galfar operates through two segments – Construction and Hiring. The Construction segment is mainly engaged in the project management, engineering, procurement and construction in areas including Oil & Gas, Civil, Electro-Mechanical, Roads & Bridges and Environmental projects. The company’s construction activities are undertaken by four business units – Civil, Oil & Gas (North Oman), Oil & Gas (South Oman) and Roads & Bridges. The Civil unit undertakes civil engineering projects spread over commercial and residential complexes, educational institutions, industrial structures, ports and harbours, hospitals, stadiums, water retaining structures, monuments, water line and sewer line networks. Key projects executed by the unit include Regional Hospital at Ibri, Nizwa and Sur, multi-purpose stadiums at Sur and Ibri, Qalhat housing complex for Oman LNG Company and recharge dams at Jabal Akhdar amongst others. The Oil & Gas (North Oman) business unit is engaged in execution of projects related to oil and gas pipelines, oil and gas production, collection and processing facilities, service contracts in petroleum industry. Key projects undertaken include North Oman Crude Stabilisation Project, Oman LNG Upstream Facilities and Yibal expansion amongst others. The company’s South Oman Oil & Gas unit was created to manage Harweel Cluster Phase II project worth USD 975 million in a joint venture with Petrofac. The company’s Roads & Bridges unit is engaged in the construction of bridges, roads, dams, electro-mechanical works, HVAC systems, power transmission lines, substations, maintenance of hospitals, water line and sewerage networks. Key projects executed include Muscat Expressway, dualisation of Ibri-Hafeet road, Birkat Al Mawz-Sayq Road Phase I & II and construction of recharge dams Al Wadi Sarooj amongst others. The company’s Hiring segment’s operations, which include renting out of cranes, equipment and other vehicles, are taken care by its subsidiary Al-Khalij Heavy Equipment & Engineering, in which it holds 52.2% stake.
Galfar Engineering & Contracting
Construction Hiring
Civil Oil & Gas (North Oman)
Oil & Gas (South Oman)
Road & Bridges

Business Model Board of Directors • Chaired by- HH Dr Salim
Said Hamad Al Fannah Al Araimi
• Dr. Parambathekandi Mohammed Ali – Vice Chairman
• Dr. Hamad Bin Hashim Mohammed Al Dahab
• HH Yahya Bin Abdullah Al Fannah Al Araimi
• Dr. Adil Abdulaziz Al Kindy
• Dr. Hatim Bin Bakheit Bin Saeed Al Shanfari
• Mr. Ali Bin Mohammed Bin Ali Al Mahrouqi
• Mr. Majid Bin Salim Said Al Fannah Al Araimi
• Budoor Mohamed Rashid Al Fannah Al Araimi
Source: Galfar Global growth to slowdown to a negative 1.3% in 2009 GCC region has projects worth USD 2.21 trillion either planned or underway
Subsidiary of Galfar Engineering & Contracting Galfar has only one subsidiary - Al Khalij Heavy Equipment & Engineering in which it holds 52.17% stake. Industry Scenario The world economies are witnessing an economic slowdown triggered by the US subprime crisis. The International Monetary Fund (IMF) projects that the world economy is likely to witness a negative growth of 1.3% in 2009, its lowest since World War II after witnessing high growth of 5.2% in 2007 and 3.2% in 2008. However, on a positive note, the trend is likely to reverse with the growth rebounding to 1.9% in 2010. The Middle East region’s GDP, which registered healthy real growth rate of 5.7% and 6.4% during 2006 and 2007, is anticipated to slow from 5.9% in 2008 to 2.5% in 2009. The dependence of the GCC economies on oil revenues has become an impediment in the current global financial turmoil leading to weak demand across sectors. According to IMF, average GDP growth in the GCC countries increased to an estimated 6.4% in 2008, but is likely to drop to 1.3% in 2009. This is based on multi-factors including sharp drop in oil prices, shrinking revenues for oil exporters, contraction of global demand and trade-related activity, liquidity crunch and lower tourism and remittances volumes. However, the regional growth is expected to rebound to a positive 4.2% in 2010 on improving market dynamics. The construction sector in the GCC has been riding high mainly due to the initiatives by various central governments to diversify their economies from an oil dependent to a non-oil one. Rapid population growth and billions of dollars of government and private investments in the infrastructure sector in the GCC has led to a spiralling growth in the construction industry. According to Middle East Business Intelligence (MEED), projects worth USD 2.21 trillion are either planned or underway in the region, which in turns promises attractive growth prospects for the construction industry.
Galfar’s activities range from construction of oil & gas facilities to infrastructures
Galfar
Galfar is primarily engaged in project management, engineering, procurement and construction activities
Through its subsidiary, Galfar is also involved in the hiring out of cranes, equipment and other vehicles
Impetus on strengthening its order book is likely to enable it to maintain a healthy revenue stream

Oman’s economy to expand at 1.9% in 2009; however higher growth of 3.9% expected for 2010 Construction sector witnessed a healthy growth of 44.2% in 2008
Value of projects (in USD Billion as of May 2009)
-
200
400
600
800
1,000
Bahrain Kuw ait Oman Qatar Saudi Arabia UAE
Source: MEED
Omani economy maintained an impressive CAGR of 24.7% in its nominal GDP to OMR 23.05 billion over 2005-08 mainly driven by increasing oil prices. The contribution of the petroleum activities to the country’s GDP increased from 49.4% in 2005 to 51.2% in 2008. However, in an effort to diversify its economy from an oil-dependent to a non-oil one, Oman has been focusing on the non-petroleum activities. The contribution of non-petroleum activities to the country’s GDP has been steadily growing over the past few years and has increased from 52.8% in 2005 to 56.4% in 2007. The contribution declined to 48.6% in 2008 only due to exceptionally high oil prices leading to significantly high oil revenues. The per capita GDP has also increased at a CAGR of 20.7% to OMR 8,323.94 over 2003-08 signifying healthy economic scenario. But at the same time, rising real estate and oil prices kept the inflation at a high level of 12.4% in 2008 compared to 5.9% and 3.5% recorded in 2007 and 2006, respectively. However, off-late the global economic downturn has negatively impacted the demand and prices of oil and gas. Weak oil and gas prices have led to lower expectation of oil revenues, thereby curtailing the expansionary plans of the government. As a result of the economic downturn, Economic Intelligence Unit (EIU) forecasts the Omani GDP to grow at a slower pace of 1.9% compared to 13.0% in 2008, however, is expected to rebound in 2010, expanding at a rate of 3.9%.
GDP (OMR Million) and YoY growth
-
5,000
10,000
15,000
20,000
25,000
2004 2005 2006 2007 20080.0%
10.0%
20.0%
30.0%
40.0%
50.0%
GDP YoY grow th
GDP per capita (OMR)
-
1,800
3,600
5,400
7,200
9,000
2004 2005 2006 2007 2008
GDP per capita
Source: Ministry of National Economy Source: Ministry of National Economy The construction sector in Oman has been growing rapidly over the last few years led by heavy government spending directed at large-scale development and diversification projects. In 2008, the sector contributed 4.8% to the GDP, reflecting an increase of 44.2% over 2007 to OMR 1.10 billion. The Omani government’s impetus on reducing the dependence of its economy from oil through expansion in the infrastructure, industry, transportation, tourism and other sectors has kept the contractors and builders busy. In addition, the private sector has also been playing a part through building the necessary hotel and leisure facilities to keep pace with a growing tourism sector. However, a sustained slump in oil prices threatens to decrease the public project spending, thus cooling down some construction activity. At the same time, on a positive note, oil prices have started to retreat beginning 2009 from the low levels witnessed towards the latter part of 2008.

Real estate sector has witnessed a downturn; however, basic drivers to keep up the growth Rising raw material prices and payment default negatively impacted the industry in 2008 Budget allocation of OMR 1.92 billion towards investment expenditure to keep up the momentum
Construction Sector (OMR Million)
0
240
480
720
960
1200
2004 2005 2006 2007 20080.0%
10.0%
20.0%
30.0%
40.0%
50.0%
Construction sector YoY grow th
Construction sector contribution to GDP
3.0%
3.6%
4.2%
4.8%
5.4%
2004 2005 2006 2007 2008
Source: Ministry of National Economy Source: Ministry of National Economy Oman’s real estate market has experienced a meteoric rise over 2007 and 2008 across segments, with property values surging more than 200% on similar lines to the other Gulf markets. The real estate sector has witnessed a 17.2% YoY growth to OMR 779.90 million in 2008. However, the Omani market experienced a correction following the global financial fallout stemming from the US sub-prime crisis. After years of growth across the sector, prices have stabilised and followed the negative trend towards the end of 2008. However, Oman’s young and growing local population – expected to almost double over the next two decades to 5 million by 2025 - with 43% of Omanis under the age of 14 years present future growth potential for the sector. The Oman residential market will need to expand to accommodate the growing population.
Real Estate Sector (OMR Million)
0
180
360
540
720
900
2004 2005 2006 2007 20080.0%
4.0%
8.0%
12.0%
16.0%
20.0%
Real Estate YoY grow th
Restaurants & Hotels and Transport & Communication (OMR Million)
0
280
560
840
1120
1400
2004 2005 2006 2007 2008
Restaurants & Hotels Transport & Communication
Source: Ministry of National Economy Source: Ministry of National Economy The construction sector was hurt by increasing raw material prices including cement, bitumen, steel and copper in 2008. However, on a positive note, the prices of these raw materials have followed a recourse starting 2009, reducing margin pressure on the contractors. But this has a flip side to it as falling prices of building materials has encouraged developers to re-negotiate their contracts reducing the costs and slashing value from contractor’s backlog. This has made the contractors susceptible to business losses. Furthermore, on worsening economic conditions, default in payment from many investors has resulted in decrease in cash flow for the developers. In such a scenario, the construction companies are bearing the brunt as the developers pass the bills to contractors and subcontractors. As many mega projects are being announced periodically in government and private sector, the construction industry can still expect to remain at the crest. The 2009 budget for Oman has been prepared assuming an oil price of USD 45 per barrel, and the government has allocated OMR 1.92 billion towards investment expenditure. The construction sector has received the bulk of the additional appropriations to an extent of OMR 1.05 billion which includes the construction, dualisation and rehabilitation of roads & bridges in the region. In addition to this, OMR 1.10 billion has been allocated to Petroleum Development Oman (PDO) and for gas exploration. Further, government infrastructure projects involving capital outlays in excess of OMR 1.50 billion is expected to help Oman's economy weather the global downturn.

Large number of projects planned to boost the infrastructure sector Contractors to benefit from large development projects planned along with declining raw material costs
According to MEED, projects worth USD 96.30 billion are either planned or underway in Oman. Notable projects by the Omani government aimed at boosting infrastructure include USD 1.4 billion Muscat Airport development, the USD 20 billion residential-cum-resort namely Blue City, the Batinah Coastal Road and a major housing and rehabilitation scheme linked to the coastal road project. The most important government project to be awarded this year includes the modernisation of Muscat International Airport. A consortium of Galfar and Larsen & Toubro have reportedly emerged as the lowest bidder for the construction of a new runway, as well as several taxiways and aprons, utility buildings and the complete landside redevelopment of access roads to the terminal. The Batinah coastal project, with an outlay in excess of OMR 300 million is expected to provide enhanced business opportunities for Omani firms. The Ministry of Transport & Communications is also planning the implementation of the 241-kilometre-long dual carriageway, which will run parallel to the Gulf of Oman coast from Naseem Garden to Khatmat Malaha on the country’s border with the UAE. At the same time, several thousand modern homes will have to be built alongside new access roads, utilities and other amenities as part of smart, new residential neighbourhoods that will be created to house those displaced by the venture, signifying several hundred million riyals up for grabs, when the rehabilitation programme is undertaken. In addition to the big infrastructure projects, a host of smaller, but capex intensive projects, such as regional airports, water distribution schemes, wastewater networks, flood protection dams, port-related improvements and power and desalination plants are also expected to contribute to the nation’s development. The government is planning to develop a string of regional airports with at least four airport projects at Sohar, Duqm, Ras al Hadd and Adam expected to get under way this year. The total outlay towards these projects is expected to be in the range of OMR 400-500 million. The government’s water supply schemes mainly in the Al Jabal al Akhdar, Al Musannah and Adam involving capital allocations in excess of OMR 150 million are also expected to be up for grab this year presenting increased revenue earning opportunities for the contractors. Further, the Omani government is also focusing on developing its ports. Contracts worth USD 200 million for the construction of a deepwater bulk jetty to support a huge pelletising plant and iron ore distribution centre being developed by Brazilian mining giant Vale at a cost of USD 1.36 billion is also likely to be awarded this year. Meanwhile, the development of port and dry dock complex in Duqm on the Wusta coast is also progressing with Oman Dry-Dock Company, owner and operator of the ship repair yard at Duqm planning to award several large contracts linked to superstructure development this year so that facility is ready before its launch in December 2010. Oilfield contractors and service providers are also gearing for a number of contracts due to be awarded this year as several projects planned in North and South Oman, including the Kauther and Harweel developments. Furthermore, the Omani government is aggressively promoting tourism and is also developing tourism destination in Ras al Hadd, Sifah, Yiti and Taqah. Going forward, given the flurry of infrastructural development projects either in the planning stage or underway in Oman, companies engaged in the construction sector are expected to witness a growth phase. Large number of contracts up for grab is expected to positively impact the order book of contractors, thereby enabling them to attain a healthy revenue stream. Moreover, the Omani crude has averaged USD 53 per bbl since the start of the year to mid June 2009, much higher than the USD 45 per bbl at which the government has prepared its budget. This is expected to reduce the budget deficit of the government, promising more developmental projects, moving ahead. In addition, with raw material prices declining, the operating margins for the contractors are also expected to improve.

Financial Performance – FY 2008 Revenues Galfar witnessed a healthy 35.7% rise in its contract income to OMR 362.98 million compared to OMR 267.46 million in 2007 benefiting from the upbeat infrastructure development and energy sectors. Increased government spending on infrastructure and energy sector especially during the first half of 2008 enabled the company to achieve an impressive top-line growth. The company had a healthy order book of OMR 720 million at the end of 2008. The company’s hiring revenues also increased 11.6% to OMR 1.39 million.
Contract income (OMR Million)
-
80.00
160.00
240.00
320.00
400.00
2004 2005 2006 2007 2008
Order Book (OMR Million)
0
160
320
480
640
800
2006 2007 2008
Source: Galfar Source: Galfar Expenses In 2008, Galfar’s contract costs went up 40.6% to OMR 309.32 million as against OMR 220.05 million a year ago mainly driven by an unprecedented increase in key raw material cost including cement, bitumen, steel and copper. In addition, equipment hiring costs also escalated contributing to higher costs. Also as a percentage of contract income, contract costs increased 294 bps to 85.2% from 82.3% in 2007. Hire operating costs were also up by 11.3% to OMR 1.46 million compared to OMR 1.31 million in the previous year. During the year, the company also faced intense pressure from rising recruitment and manpower costs, which resulted in a 10.7% rise in G&A expenses to OMR 7.60 million. Depreciation charges also shot up 34.0% to OMR 18.17 million compared to OMR 13.56 million in 2007 due to increase in property, plant and equipment along with a higher depreciation rate. Profitability Galfar reported a 13.2% increase in profit on contracts to OMR 53.65 million compared to OMR 47.41 million in 2007 attributable to higher contract income partially offset by increasing contract costs. However, as the expenses increased at a higher rate than income, profit margin on contracts declined 294 bps to 14.8% compared to 17.7% in 2007. Furthermore, the company’s operating profit increased 3.3% to OMR 27.81 million in 2008 compared to OMR 26.92 million in the last year. As a result of rising operating expenses, operating margin declined 240 bps to 7.7% in 2008 from 10.1% in the previous year. Also, the company incurred higher finance costs that increased 34.6% to OMR 3.98 million from OMR 2.96 million in 2007 due to expanding loan portfolio, partially offset by a 38.7% YoY rise in other income to OMR 2.36 million during the year. Consequently, Galfar’s net profit increased 3.4% to OMR 22.91 million in 2008 compared to OMR 22.16 million in the last year. The company’s adjusted EPS increased to OMR 0.08 from OMR 0.07 in 2007.
Contract income increased an impressive 36% in 2008 Rising raw material costs lead to increase in operating expenses Profitability improved on top-line performance

0
80
160
240
320
400
2006 2007 2008 1Q08 1Q09
Revenues (OMR Millions)
0
5
10
15
20
25
2006 2007 2008 1Q08 1Q09
Net Profit (OMR Millions)
EBIT Margin
0%
4%
8%
12%
16%
20%
2006 2007 2008 1Q08 1Q09
EBIT Margin EBITDA Margin
Net Profit Margin
0%
2%
5%
7%
10%
12%
2006 2007 2008 1Q08 1Q09
0%
10%
20%
30%
40%
50%
2007 2008 1Q08 1Q09
Return on Average Equity (RoAE)
0%
2%
5%
7%
10%
12%
2007 2008 1Q08 1Q09
Return on Average Assets (RoAA)
-
80
160
240
320
400
2006 2007 2008 1Q08 1Q09
Total Assets (OMR Millions)
-
20
40
60
80
100
2006 2007 2008 1Q08 1Q09
Shareholders' Equity (OMR Millions)
Chart Gallery

Size of the Company The salient features of the balance sheet are:
Galfar’s total assets increased 28.2% to OMR 366.37 million from OMR 285.70 million in 1Q08 led by a rise in current and non-current assets. Accordingly, the company’s annualised assets turnover ratio decreased to 1.07 in 1Q09 from 1.25 in the comparable period of the last year.
Galfar’s current assets increased 27.8% to OMR 213.42 million from OMR 167.0 million in 1Q08;
however, its share in total assets declined marginally from 58.5% to 58.3% in 1Q09. The YoY rise in current assets can mainly be attributed to a 26.4% increase in trade and other receivables to OMR 153.85 million in 1Q09. However, its share in the total assets declined to 42.0% from 42.6% in 1Q08. In addition to this, a two-fold increase in inventories to OMR 49.91 million from OMR 24.80 million in 1Q08 contributed to the rise in current assets. The share of inventories in the total assets also increased from 8.7% to 13.6% in 1Q09. However, a 40.5% decline in deposits with banks to OMR 8.59 million and a 82.1% fall in cash and bank balances did somewhat offset the rise in current assets.
The company’s non-current assets improved 28.9% to OMR 152.94 million in 1Q09 compared to
OMR 118.70 million in the comparable period last year, its share in the total assets base increased marginally to 41.7% from 41.5% in 1Q08. The growth in non-current assets was mainly due to a 27.0% rise in property, plant and equipment to OMR 135.02 million and a 46.0% increase in retentions receivable to OMR 17.50 million during the quarter.
In 1Q09, the company’s total liabilities increased 29.8% to OMR 282.69 million compared to OMR
217.77 million in the comparable period of the last year led by rise in current as well as non-current liabilities. Current liabilities rose 23.7% to OMR 210.61 million as against OMR 170.19 million led by increases in bank borrowings, trade and other payables and current portion of term loans. However, the share of current liabilities in the total balance sheet declined to 57.5% from 59.6% in 1Q08. Non-current liabilities also increased 51.5% to OMR 72.08 million mainly led by over two-fold rise in term loans to OMR 36.44 million and 83.8% higher advances on contracts to OMR 18.55 million during 1Q09.
Galfar’s shareholders’ equity improved 23.2% to OMR 82.97 million from OMR 67.35 million in
1Q08, however its share in the total balance sheet declined from 23.6% to 22.6% in 1Q09. The YoY rise was mainly due to a 55.1% increase in retained earnings to OMR 25.47 million compared to OMR 16.42 million in the same period last year on higher profit. Also, a 23.3% YoY increase in statutory reserve to OMR 8.33 million contributed to the rise in shareholders’ equity.
Financial Performance Analysis – 1Q09 Galfar reported a 16.7% rise in its contract income to OMR 98.73 million compared to OMR 84.62 million in 1Q08 mainly due to execution of its EPC contacts. On a brighter note, the company won contracts worth OMR 31 million during the initial period of 2009, which reflects its continuous endeavours to expand its clientele. Despite this, the company continues to face the pressure of rising costs. Its contract costs for the quarter increased 22.2% to OMR 85.78 million from OMR 70.22 million in 1Q08 mainly due to rising sub-contacting costs. Also, relative to contract income, contract costs increased 389 bps to 86.9% from 83.0% in 1Q08. As a result, profit from contracts declined 10.0% to OMR 12.95 million from OMR 14.39 million in 1Q08, while margins dipped 389 bps to 13.1% during the quarter. The company’s hire revenues also decreased 16.1% to OMR 0.59 million from OMR 0.70 million in 1Q08. While G&A expenses rose 19.0% to OMR 2.16 million, depreciation charges were up by 22.9% at OMR 5.07 million for the quarter. Rising expenses led to a 32.5% decline in operating profits to OMR 5.93 million from OMR 8.80 million in 1Q08. The company’s operating profit margin dipped 438 bps YoY to 6.0% in 1Q09. The company’s net finance costs were also higher by 16.0% at OMR 1.04 million as against OMR 0.89 million during 1Q08. Consequently, Galfar’s net profit decreased 35.3% to OMR 4.65 million from OMR 7.18 million in 1Q08. The company’s adjusted EPS also declined from OMR 0.10 in 1Q08 to OMR 0.06 during the quarter. While adjusted RoAE declined to 22.4% in 1Q09 from 41.7% in the comparable period of the last year, adjusted RoAA was down from 10.6% in 1Q08 to 5.0% during the quarter.
Rising expenses eat away margins in 1Q09

Working Capital Snapshot (in OMR ’000) 2007A 2008A 1Q08A 1Q09A Current Assets 144,821 224,672 167,002 213,423 Inventories 21,762 46,295 24,798 49,908 Inventory Conversion Period (Days) 30 40 30 51 Trade and other receivables 105,416 164,075 121,716 153,849 Average Collection Period (Days) 117 135 122 147 Deposits with banks 13,811 12,417 14,442 8,586 Cash and bank balances 3,833 1,884 6,046 1,080 Current Liabilities 142,565 212,951 170,191 210,605 Bank borrowings 14,288 38,874 10,902 33,540 Short term loans 4,200 17,672 15,371 10,502 Term loans – current portion 16,683 18,597 15,184 16,629 Dividends payable 0 0 10,000 5,000 Trade and other payables 105,873 136,930 117,168 144,858 Average Payment Period (Days) 159 143 145 150 Provision for taxation 1,521 878 1,566 76 Net Core Working Capital 21,304 73,440 29,346 58,899 Average Core Working Capital Cycle (Days) -13 32 8 48 Net Current Assets 2,256 11,721 -3,189 2,818 Average Working Capital Cycle (Days) -10 7 -1 7 Source: Galfar Engineering

Peer Comparison In order to do a peer comparison, we have taken comparable companies involved in construction activities within GCC that includes Combined Group Contracting (CGC), Arabtec Holding (Arabtec) and Galfar.
Financial Performance of Comparable Companies CGC Arabtec Galfar 2008 1Q09 2008 1Q09 2008 1Q09 Ratios: Total Assets Turnover Ratio (x) 1.34 0.96 1.36 1.00 1.15 1.07 Operating Profit Margin (OPM) (%) 7.3% 9.9% 11.0% 11.1% 7.7% 6.0% EBITDA Margin (%) 7.5% 10.1% 11.0% 11.1% 12.7% 11.1% Net Profit Margin (NPM) (%) 5.7% 9.2% 9.9% 8.6% 6.3% 4.7% Debt Equity Ratio 1.24 1.08 0.70 0.77 1.29 1.17 RoAA (%) 7.6% 8.4% 13.4% 6.9% 7.3% 5.0% RoAE (%) 33.2% 37.1% 61.0% 32.7% 29.8% 22.4%
Market Indicators: Adj. EPS (USD) 0.385 0.470 0.218 0.147 0.198 0.161 P/E (x) 10.81 8.87 3.62 5.38 8.12 10.00
Adj. BVPS (USD) 1.24 1.29 0.43 0.47 0.72 0.72 P/BV (x) 3.36 3.23 1.83 1.69 2.23 2.24 Current Market Capitalisation (USD Millions) 332.88 332.88 944.65 944.65 484.40 484.40 (USD Millions) Sales 539.20 101.82 2,646.80 507.89 942.68 256.41 % YoY change 18.4 -39.6 127.5 -0.8 35.7 16.7 Operating Profit 39.37 10.08 292.16 56.35 72.24 15.41 % YoY change 22.1 -17.4 79.8 -15.7 3.3 -32.5 EBITDA 40.18 10.26 292.16 56.35 119.43 28.59 % YoY change 22.4 -17.3 49.5 -30.1 13.6 -14.8 Net Profit 30.78 9.38 260.84 43.90 59.51 12.07 % YoY change -3.0 -0.5 79.0 -30.3 3.4 -35.3 Total Assets 455.32 440.85 2,575.46 2,543.14 963.90 951.48 % YoY change 30.2 -1.0 95.5 68.1 44.1 28.2 Shareholders' Equity 99.02 103.19 515.44 558.10 216.41 215.48 % YoY change 14.3 3.7 51.5 73.5 18.3 23.2
Sources: Zawya, Galfar’s financial statements

Focus on winning new contracts to positively impact Galfar’s future revenue stream
New Projects and Strategies Galfar’s long-term growth strategy entails expanding its presence in the construction and infrastructure sectors in Oman through reliance on high value-added Engineering, Procurement, Construction (EPC) as well as design and build contracts. The company had a healthy order book of OMR 751 million at the end of 1Q09 and remains focused on increasing its order book through new contract wins. The company won an EPC contract worth OMR 13.78 million from Oman Gas Company in June 2009. The project is expected to be completed in twelve months and would involve working for a compressor station in Oman’s Nimr region. In addition to this, Galfar undertook the civil works of the giant iron ore pelletising plant of Vale do Rio Doce at the Port of Sohar for OMR 18.50 million. The company has also bid for the new airport terminal in Oman through a consortium, which includes India’s Larsen & Toubro. According to MEED, the consortium is expected to be the lowest bidder for the USD 1.40 billion project. In addition to these, the company’s major projects in hand include the Hasik-Shuwaimiyah road in Dhofar Governorate, the Expressway Project in Muscat Governorate and the Duqm Dry Dock along with power transmission, primary substation and other electromechanical and HVAC contracts. The company also has a number of oil and gas projects in its portfolio. Furthermore, Galfar is planning to expand its presence to markets such as the United Arab Emirates, Libya and beyond. Moreover, Galfar has already marked its presence in the Indian market through an intercity dualisation contract under its belt. Going forward, increased government spending towards enhancing the Omani infrastructure sector presents tremendous growth opportunities for the company to capitalise upon. SWOT Analysis
THREATS
Increasing competition from local as well as international players participating in bid for work in Oman Liquidity crunch could force companies to dispose their projects and properties and new upcoming projects may get delayed
OPPORTUNITIES
Impressive domestic investment programme aimed at improving the infrastructure sector to act as long-term growth driver Growth opportunities present in other parts of Middle East can be capitalised upon
WEAKNESS
Rising operating costs remain a key challenge
STRENGTHS
Rich experience of operating for over three decades in the construction industry Most preferred partner and is the major contractor for Petroleum Development Oman Healthy order book and strong expansion initiatives

Risks and Concerns:
The current economic downturn has led to a liquidity crunch across economies in GCC with lower oil prices proving detrimental to the budget surpluses enjoyed by them. The dearth of liquidity has forced the central governments to curtail/postpone their ambitious infrastructure expansion plans. The subtle economic growth has indeed negatively impacted the demand across the real estate and construction sectors. Contractors and developers, which once enjoyed a boom phase have now been pushed to the corner with major infrastructure projects being shelved or postponed. Going forward, if the economic growth continues to remain weak, contractors and real estate developers might face restrained revenue growth.
The raw material prices which peaked last year have started to retreat from the beginning of
this year. This has led to developers renegotiating contracts with the contractors, thereby negatively impacting their revenue expectations.
Liquidity crisis has even made late payments a common phenomenon leading to delayed
revenue realisation for companies. Valuation Methodology: We have used DCF valuation method to arrive at the fair value of Galfar, as discussed below: Assumptions:
(i) Risk free Rate (Rf) of 3.30%, equivalent to one year average yield on 10 year US T-bill. (ii) Unlevered Beta of 1.60 (iii) A terminal growth rate of 2%
Based on the inputs and the Capital Asset Pricing Model (CAPM), we have arrived at a Cost of Equity of 15.17% and a WACC of 11.19%.
Cost of Equity: 15.17% WACC: 11.19%

DCF Calculations DCF Valuation (FCFF Model)
(in OMR ’000) 2009E* 2010E 2011E 2012E 2013E Operating Profit (EBIT) 21,262 31,238 36,622 43,609 52,112 Zakat on EBIT 2,572 3,778 4,430 5,275 6,303 Effective Tax Rate 12.10% 12.10% 12.10% 12.10% 12.10% NOPAT 18,690 27,459 32,192 38,334 45,808 Add: Depreciation and Amortisation 15,661 23,747 26,646 29,826 33,506 Less: Capex 24,469 34,937 33,618 36,871 42,672 Less: Change in Net Working Capital -2,362 2,833 7,494 4,868 5,624 Operating Free Cash Flows to Firm (OFCFF) 12,244 13,437 17,727 26,421 31,018 Non-Operating Income 1,529 2,198 2,577 3,069 3,667 Tax on Non-Operating Income 185 266 312 371 444 Add: Non-Operating Cash Flows (After Tax Non-Operating Income) 1,344 1,932 2,266 2,698 3,224 Free Cash Flow to Firm (FCFF) 13,588 15,369 19,993 29,119 34,242 WACC (Ko) (%) 11.19% 11.19% 11.19% 11.19% 11.19% Present Value / Discount Factor 0.9236 0.8306 0.7471 0.6719 0.6043 Long-Term Growth Rate (g) (%) 2.00% Terminal Multiple [(1 + g) / (WACC - g)] 11.10 Nominal Terminal Value [(FCFF * (1 + g)) / (WACC - g)] 380,219 Present Value of Free Cash Flows 12,549 12,766 14,936 19,565 20,693 * excludes 1Q09A
Calculation of Equity Value and Fair Value Per Share NPV of Free Cash Flows (during Explicit Forecast Period) 80,510 Terminal Value: Residual Cash Flow (FCFF of 2013E) 34,242 WACC 11.19% Long-Term Growth Rate (g) 2.00% Divided by Capitalisation Rate (WACC - g) 9.19% Equals Nominal Terminal Value 380,219 Implied Multiple of 2013E EBITDA 4.44 Times PV/ Discount Factor 0.60 Present Value of Terminal/Residual Value 229,772 Enterprise Value 310,282 Implied Multiple of 2013E EBITDA 3.62 Less: Long-term Debts 97,108 Less: Market Value of Preferred Shares 0 Add: Surplus Cash and Investments 0 Equity Value 213,174 No. of Outstanding Shares (’000) 300,000 Fair Value Per Share (OMR) 0.711
* figures in OMR ’000 unless specified Sensitivity Analysis We have prepared a sensitivity analysis table, showing the probable nominal terminal value, discounted terminal value and enterprise value, given different growth rate assumptions and the WACC. The shaded area represents the most probable outcomes.
Sensitivity Analysis of Nominal Terminal Value (OMR ’000) Discount
Factor Long-Term Growth Rate
1.00% 1.50% 2.00% 2.50% 3.00% 9.19% 422,484 452,196 486,043 524,952 570,151
10.19% 376,492 400,135 426,667 456,652 490,808 11.19% 339,530 358,824 380,219 404,078 430,851 12.19% 309,176 325,245 342,891 362,360 383,947 13.19% 283,805 297,413 297,413 328,450 346,253

Sensitivity Analysis of Discounted Terminal Value (OMR ’000) Discount
Factor Long-Term Growth Rate
1.00% 1.50% 2.00% 2.50% 3.00% 9.19% 278,304 297,876 320,172 345,803 375,577 10.19% 237,496 252,411 269,148 288,062 309,609 11.19% 205,183 216,843 229,772 244,190 260,370 12.19% 179,060 188,367 198,586 209,862 222,364 13.19% 157,582 165,138 173,369 182,371 192,256
Sensitivity Analysis of Enterprise Value (OMR ’000)
Discount Factor
Long-Term Growth Rate 1.00% 1.50% 2.00% 2.50% 3.00%
9.19% 363,404 382,976 405,272 430,902 460,676 10.19% 320,252 335,167 351,903 370,818 392,364 11.19% 285,693 297,353 310,282 324,700 340,879 12.19% 257,417 266,723 276,943 288,218 300,720 13.19% 233,872 241,428 249,660 258,661 268,547
Investment Opinion Oman’s economy maintained an impressive CAGR of 24.7% in its nominal GDP to OMR 23.05 billion over 2005-08 mainly driven by rising oil prices. Benefiting from the robust economic growth and the government’s impetus on diversifying the economy from an oil dependent one, the construction sector of Oman witnessed a healthy growth, with the sector expanding 44.2% in 2008. However, off late, the global economic downturn, which negatively impacted the oil demand leading to a dip in oil prices, has curtailed the boom phase witnessed by these oil dependent economies. Lower oil revenues have indeed reduced the huge budget surpluses enjoyed by the GCC economies, thereby limiting their expansionary initiatives. In line with this, Oman with its dependence on oil revenues is expected to grow at a slower pace of 1.9% in 2009. On the other hand, with the oil prices showing signs of improvement, the economic growth is expected to rebound to 3.9% in 2010. The construction sector is expected to continue its positive growth momentum, benefiting from the massive infrastructure projects planned in Oman. The Omani government has also made a healthy allocation to an extent of OMR 1.05 billion in its 2009 budget, which includes the construction, dualisation and rehabilitation of roads & bridges in the region. Moreover, with the Omani crude averaging at around USD 53 per bbl, much higher than the budget price of USD 45 per bbl, the development activities are expected to gain more momentum. Some of the important infrastructure projects include Muscat Airport, residential-cum-resort Blue City, the Batinah Coastal Road and port facilities in Duqm. Along with this, a number of development projects in the oil and gas sector are being planned in the North and South regions of Oman. These mega infrastructure projects are expected to present more opportunities to the contractors in the region to strengthen their order book. At the same time, the cost of raw materials have also been receding from the highs witnessed in 2008, thereby turning delayed and new projects, a more feasible proposition to start. Galfar has a rich experience of more than three decades in the construction industry and is amongst the largest construction companies in Oman and Middle East. The company operates across diversified sectors including oil & gas to roads & bridges. The company has a definite advantage in being one of the most preferred partners for PDO. At the same time, the company’s healthy order book of OMR 751 million is expected to drive its future earnings atleast over the next two years. Going forward, with key fundamental positives, the company looks well-positioned to capitalise on the infrastructure development activities already on or expected to unfold in Oman. On a positive note, the company is already in contention for the award of the Oman International Airport project, which could significantly boost its future earnings growth. Furthermore, Galfar is planning to expand its presence in markets such as the UAE, Libya and beyond and has already ventured in the Indian market. At the same time, we also expect the company to benefit from declining raw material costs through improved margins and higher profitability. Based on the fundamental positives, we hold an optimistic outlook on the stock. Currently, Galfar’s stock is trading at a P/E multiple of 8.58x and 7.26x on 2009E and 2010E earnings, and at a P/B multiple of 1.86x and 1.63x on 2009E and 2010E BVPS, respectively. Meanwhile, the stock has outperformed the index by rising 60.7% since the beginning of this year as against a gain of 4.6% by the Muscat Securities Market. Considering the above factors, we arrive at a price target of OMR 0.711, which exhibits a potential upside of 14.6% from its closing price of OMR 0.620 (as on June 18, 2009). Accordingly, we initiate our coverage on Galfar Engineering & Contracting with an OVERWEIGHT recommendation.
Fair Value: OMR 0.711 Investment Opinion: OVERWEIGHT

Financial Statements
Consolidated Balance Sheet (in OMR ’000) 2007A 2008A 1Q08A 1Q09A 2009E 2010E 2011E ASSETS Current Assets Inventories 21,762 46,295 24,798 49,908 52,871 55,331 59,759 Trade and other receivables 105,416 164,075 121,716 153,849 169,812 185,838 207,200 Deposits with banks 13,811 12,417 14,442 8,586 9,120 9,417 10,696 Cash and bank balances 3,833 1,884 6,046 1,080 1,225 1,661 1,742 Total Current Assets 144,821 224,672 167,002 213,423 233,028 252,247 279,396 Non-Current Assets Property, plant and equipment 100,607 130,061 106,293 135,022 143,829 155,019 161,991 Goodwill 275 275 275 275 275 275 275 Available-for-sale investments 145 145 145 145 145 145 145 Retentions receivable 11,668 15,993 11,984 17,500 18,644 19,658 23,253 Total Non-Current Assets 112,695 146,474 118,697 152,942 162,893 175,097 185,664 Total Assets 257,516 371,146 285,699 366,365 395,921 427,344 465,060 LIABILITIES AND EQUITY Liabilities Current Liabilities Bank borrowings 14,288 38,874 10,902 33,540 33,276 35,917 36,762 Short term loans 4,200 17,672 15,371 10,502 9,766 10,113 10,541 Term loans – current portion 16,683 18,597 15,184 16,629 16,629 9,172 9,172 Dividends payable 0 0 10,000 5,000 0 0 0 Trade and other payables 105,873 136,930 117,168 144,858 151,604 167,257 185,553 Provision for taxation 1,521 878 1,566 76 782 1,065 1,250 Total Current Liabilities 142,565 212,951 170,191 210,605 212,058 223,525 243,278 Non-Current Liabilities Term loans 19,956 32,411 17,821 36,437 36,688 38,522 40,907 Provision for employees’ end of service indemnity 3,905 5,182 4,082 5,293 5,767 6,419 7,145 Deferred tax liability 4,314 6,527 5,186 7,090 8,627 10,816 13,424 Creditors for purchase of property, plant and equipment 10,419 5,834 10,396 4,714 5,094 5,499 5,984 Advances on contracts 5,409 24,184 10,089 18,546 26,904 27,913 23,142 Total Non-Current Liabilities 44,003 74,138 47,574 72,080 56,177 61,256 67,460 Total Liabilities 186,569 287,089 217,765 282,685 268,234 284,780 310,738 Equity Share capital 25,000 25,000 25,000 25,000 30,000 30,000 30,000 Share premium 19,170 19,170 19,169 19,170 19,170 19,170 19,170 Statutory reserve 6,224 8,333 6,758 8,333 10,000 10,000 10,000 Retained earnings 20,023 30,826 16,418 25,465 40,844 54,649 71,106 Stock dividend 0 0 0 5,000 0 0 0 Equity attributable to equity holders of the company 70,416 83,329 67,346 82,968 100,014 113,819 130,276 Minority interest 531 727 589 712 769 831 904 Total Liabilities and Equity 257,516 371,146 285,699 366,365 395,921 427,344 465,060

Consolidated Income Statement (in OMR ’000) 2007A 2008A 1Q08A 1Q09A 2009E 2010E 2011E Contract income 267,464 362,976 84,616 98,731 407,799 443,369 484,825 Contract costs -220,052 -309,322 -70,222 -85,780 -351,859 -379,668 -412,017 Profit on contracts 47,412 53,654 14,394 12,950 55,940 63,701 72,808 Hire revenue 1,246 1,391 701 588 1,562 1,699 1,857 Hire operating costs -1,309 -1,456 -360 -375 -996 -1,092 -1,203 General and administrative expenses -6,868 -7,603 -1,811 -2,155 -8,575 -9,323 -10,194 Depreciation -13,560 -18,171 -4,128 -5,074 -20,735 -23,747 -26,646 Profit from operations 26,922 27,814 8,796 5,934 27,196 31,238 36,622 Net financing costs -2,956 -3,978 -893 -1,036 -4,231 -4,039 -4,156 Other income 1,704 2,363 255 385 1,914 2,198 2,577 Profit for the year before tax 25,670 26,199 8,158 5,283 24,879 29,397 35,043 Income tax expense -3,339 -3,090 -916 -639 -3,009 -3,556 -4,239 Profit for the year 22,331 23,109 7,242 4,644 21,870 25,841 30,804 Attributable to equity holders of the parent 22,156 22,913 7,183 4,649 21,684 25,621 30,542 Minority interest 175 196 59 -5 186 220 262 Adjusted EPS 0.074 0.076 0.096* 0.062* 0.072 0.085 0.102
*Annualised

Consolidated Cash Flow Statement (in OMR ’000) 2007A 2008A 2009E 2010E 2011E
Cash Flows from Operating Activities Profit for the year before tax 25,670 26,199 24,879 29,397 35,043 Adjustments for: Depreciation of property, plant and equipment 13,560 18,171 20,735 23,747 26,646 Gain on disposal of property, plant and equipment -114 -399 0 0 0Net transfer to employees’ end of service indemnity 813 1,277 586 652 726 Provision for impaired debt -2 0 0 0 0Net finance costs 2,956 3,978 4,231 4,039 4,156 Operating profit before changes in working capital 42,882 49,226 50,431 57,835 66,571 Changes in working capital: Trade receivables -34,700 -51,002 -5,737 -16,026 -21,361 Inventories -7,711 -24,534 -6,576 -2,460 -4,428 Trade and other payables 17,199 31,057 14,675 15,653 18,296 Net cash generated from operations 17,671 -1,450 52,792 55,002 59,078 Change in retentions receivable-long term -3,991 -4,325 -2,651 -1,014 -3,595 Change in advances on contracts-long term 1,948 18,775 2,720 1,009 -4,771 Changes in creditors for property plant and equipment 559 -4,585 -740 404 485 Change in margin deposits -2,647 100 0 0 0Income tax paid -1,486 -2,981 -1,004 -1,085 -1,445 Net cash from operating activities 12,055 5,535 51,116 54,317 49,752 Cash Flows from Investing Activities Net Payments for purchase of property, plant and equipment -38,892 -47,227 -34,503 -34,937 -33,618 Change in term deposits -1,730 1,294 3,297 -296 -1,280 Interest received 356 118 100 113 139 Net cash used in investing activities -40,266 -45,815 -31,106 -35,120 -34,759 Cash Flows from Financing Activities Share capital raised 24,170 0 5,000 0 0 Change in bank borrowings 5,199 24,586 -5,598 2,641 845 Change in term loans 11,300 14,370 2,308 -5,623 2,385 Change in short term loans 2,250 13,472 -8,050 189 239 Interest paid -3,312 -4,096 -4,331 -4,152 -4,295 Dividend paid -6,046 -10,000 -10,000 -11,816 -14,085 Net cash used in financing activities 33,561 38,332 -20,671 -18,761 -14,912 Net change in cash and cash equivalents 5,350 -1,949 -660 436 81 Cash and cash equivalents at the beginning of the period 3,581 3,833 1,884 1,225 1,661 Cash and cash equivalents at the end of the period 8,931 1,884 1,225 1,661 1,742
Common – Size Statements
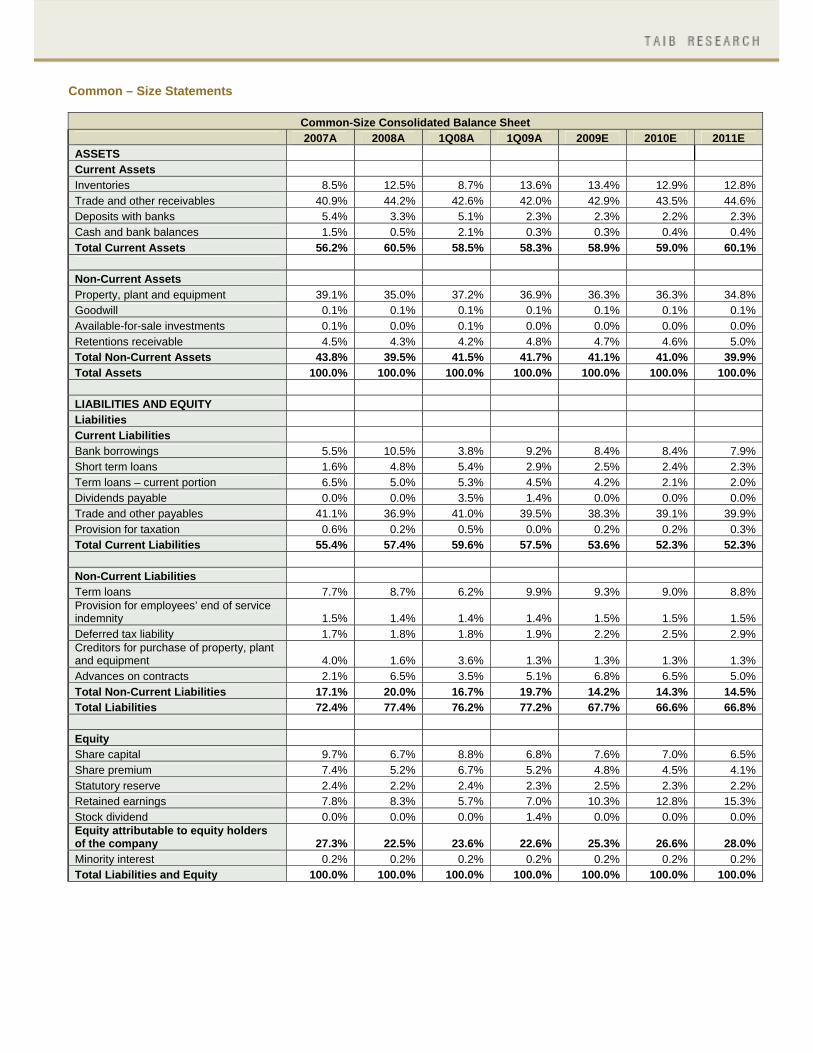
Common-Size Consolidated Balance Sheet 2007A 2008A 1Q08A 1Q09A 2009E 2010E 2011E ASSETS Current Assets Inventories 8.5% 12.5% 8.7% 13.6% 13.4% 12.9% 12.8% Trade and other receivables 40.9% 44.2% 42.6% 42.0% 42.9% 43.5% 44.6% Deposits with banks 5.4% 3.3% 5.1% 2.3% 2.3% 2.2% 2.3% Cash and bank balances 1.5% 0.5% 2.1% 0.3% 0.3% 0.4% 0.4% Total Current Assets 56.2% 60.5% 58.5% 58.3% 58.9% 59.0% 60.1% Non-Current Assets Property, plant and equipment 39.1% 35.0% 37.2% 36.9% 36.3% 36.3% 34.8% Goodwill 0.1% 0.1% 0.1% 0.1% 0.1% 0.1% 0.1% Available-for-sale investments 0.1% 0.0% 0.1% 0.0% 0.0% 0.0% 0.0% Retentions receivable 4.5% 4.3% 4.2% 4.8% 4.7% 4.6% 5.0% Total Non-Current Assets 43.8% 39.5% 41.5% 41.7% 41.1% 41.0% 39.9% Total Assets 100.0% 100.0% 100.0% 100.0% 100.0% 100.0% 100.0% LIABILITIES AND EQUITY Liabilities Current Liabilities Bank borrowings 5.5% 10.5% 3.8% 9.2% 8.4% 8.4% 7.9% Short term loans 1.6% 4.8% 5.4% 2.9% 2.5% 2.4% 2.3% Term loans – current portion 6.5% 5.0% 5.3% 4.5% 4.2% 2.1% 2.0% Dividends payable 0.0% 0.0% 3.5% 1.4% 0.0% 0.0% 0.0% Trade and other payables 41.1% 36.9% 41.0% 39.5% 38.3% 39.1% 39.9% Provision for taxation 0.6% 0.2% 0.5% 0.0% 0.2% 0.2% 0.3% Total Current Liabilities 55.4% 57.4% 59.6% 57.5% 53.6% 52.3% 52.3% Non-Current Liabilities Term loans 7.7% 8.7% 6.2% 9.9% 9.3% 9.0% 8.8% Provision for employees’ end of service indemnity 1.5% 1.4% 1.4% 1.4% 1.5% 1.5% 1.5% Deferred tax liability 1.7% 1.8% 1.8% 1.9% 2.2% 2.5% 2.9% Creditors for purchase of property, plant and equipment 4.0% 1.6% 3.6% 1.3% 1.3% 1.3% 1.3% Advances on contracts 2.1% 6.5% 3.5% 5.1% 6.8% 6.5% 5.0% Total Non-Current Liabilities 17.1% 20.0% 16.7% 19.7% 14.2% 14.3% 14.5% Total Liabilities 72.4% 77.4% 76.2% 77.2% 67.7% 66.6% 66.8% Equity Share capital 9.7% 6.7% 8.8% 6.8% 7.6% 7.0% 6.5% Share premium 7.4% 5.2% 6.7% 5.2% 4.8% 4.5% 4.1% Statutory reserve 2.4% 2.2% 2.4% 2.3% 2.5% 2.3% 2.2% Retained earnings 7.8% 8.3% 5.7% 7.0% 10.3% 12.8% 15.3% Stock dividend 0.0% 0.0% 0.0% 1.4% 0.0% 0.0% 0.0% Equity attributable to equity holders of the company 27.3% 22.5% 23.6% 22.6% 25.3% 26.6% 28.0% Minority interest 0.2% 0.2% 0.2% 0.2% 0.2% 0.2% 0.2% Total Liabilities and Equity 100.0% 100.0% 100.0% 100.0% 100.0% 100.0% 100.0%
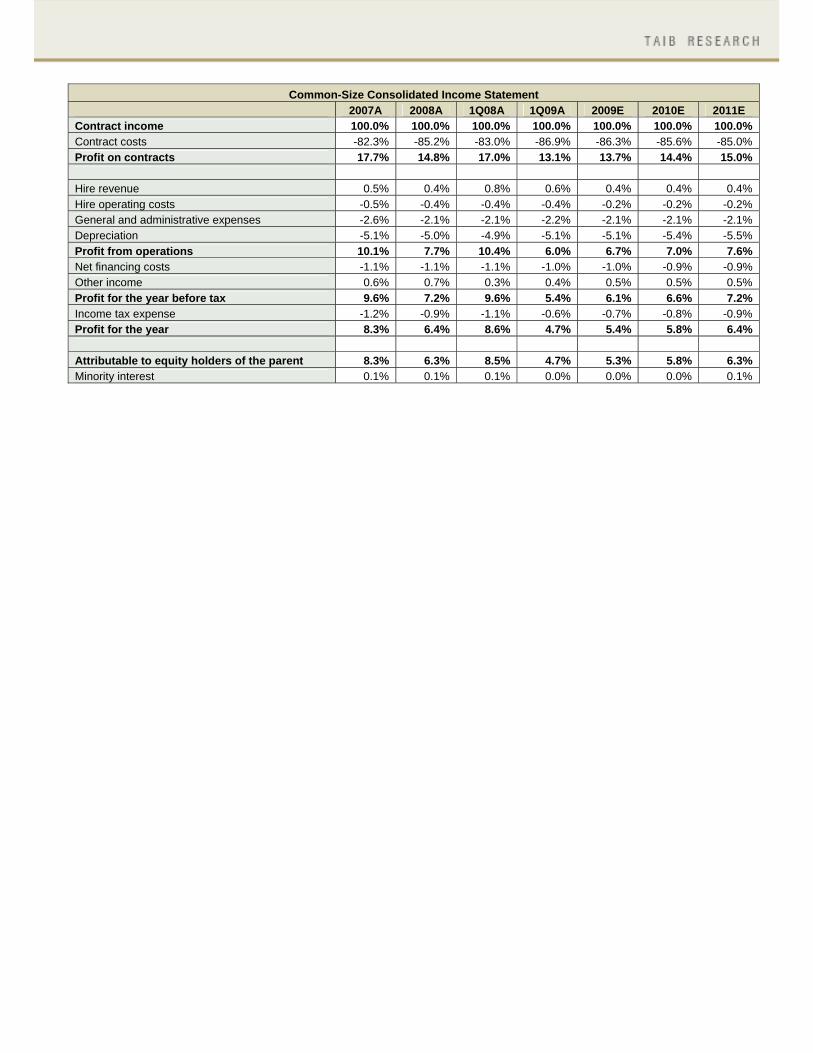
Common-Size Consolidated Income Statement 2007A 2008A 1Q08A 1Q09A 2009E 2010E 2011E Contract income 100.0% 100.0% 100.0% 100.0% 100.0% 100.0% 100.0% Contract costs -82.3% -85.2% -83.0% -86.9% -86.3% -85.6% -85.0% Profit on contracts 17.7% 14.8% 17.0% 13.1% 13.7% 14.4% 15.0% Hire revenue 0.5% 0.4% 0.8% 0.6% 0.4% 0.4% 0.4% Hire operating costs -0.5% -0.4% -0.4% -0.4% -0.2% -0.2% -0.2% General and administrative expenses -2.6% -2.1% -2.1% -2.2% -2.1% -2.1% -2.1% Depreciation -5.1% -5.0% -4.9% -5.1% -5.1% -5.4% -5.5% Profit from operations 10.1% 7.7% 10.4% 6.0% 6.7% 7.0% 7.6% Net financing costs -1.1% -1.1% -1.1% -1.0% -1.0% -0.9% -0.9% Other income 0.6% 0.7% 0.3% 0.4% 0.5% 0.5% 0.5% Profit for the year before tax 9.6% 7.2% 9.6% 5.4% 6.1% 6.6% 7.2% Income tax expense -1.2% -0.9% -1.1% -0.6% -0.7% -0.8% -0.9% Profit for the year 8.3% 6.4% 8.6% 4.7% 5.4% 5.8% 6.4% Attributable to equity holders of the parent 8.3% 6.3% 8.5% 4.7% 5.3% 5.8% 6.3% Minority interest 0.1% 0.1% 0.1% 0.0% 0.0% 0.0% 0.1%

Financial Ratios
2007A 2008A 1Q08A 1Q09A 2009E 2010E 2011E Liquidity Ratios: Current Ratio (x) 1.02 1.06 0.98 1.01 1.10 1.13 1.15 Quick Ratio (x) 0.86 0.84 0.84 0.78 0.85 0.88 0.90 Inventory Conversion Period (Days) 29.70 40.15 30.25 51.17 51.44 52.01 50.98 Average Collection Period (Days) 116.70 135.50 122.47 146.92 149.42 146.39 147.95 Length of Operating Cycle (Days) 146.40 175.65 152.72 198.09 200.86 198.40 198.93 Average Payment Period (Days) 159.26 143.25 144.92 149.88 149.65 153.27 156.27 Length of Cash Cycle (Days) -12.86 32.40 7.81 48.21 51.20 45.13 42.65
Activity Ratios: Debtors Turnover Ratio (x) 3.13 2.69 2.98* 2.48* 2.44 2.49 2.47 Creditors' Turnover Ratio (x) 2.29 2.55 2.52* 2.44* 2.44 2.38 2.34
Total Assets Turnover Ratio (x) 1.24 1.15 1.25* 1.07* 1.06 1.08 1.09 Equity Turnover Ratio (x) 5.32 4.72 4.91* 4.75* 4.45 4.15 3.97
Profitability Ratios: Gross Profit Margin (GPM) (%)** 17.7 14.8 17.0 13.1 13.7 14.4 15.0 EBITDA Margin (%) 15.1 12.7 15.3 11.1 11.8 12.4 13.0 Operating Profit Margin (OPM) (%) 10.1 7.7 10.4 6.0 6.7 7.0 7.6 Net Profit Margin (NPM) (%) 8.3 6.3 8.5 4.7 5.3 5.8 6.3 Return on Average Equity (RoAE) (%) 44.1 29.8 41.7* 22.4* 23.7 24.0 25.0 Return on Average Assets (RoAA) (%) 10.3 7.3 10.6* 5.0* 5.7 6.2 6.8 Leverage Ratios: Debt to Equity (D/E) Ratio (x) 0.78 1.29 0.88 1.17 0.96 0.82 0.75 Shareholders' Equity to Total Assets Ratio (x) 0.27 0.22 0.24 0.23 0.25 0.27 0.28 Total Liabilities to Total Assets Ratio (x) 0.72 0.77 0.76 0.77 0.68 0.67 0.67 Current Liabilities to Equity Ratio (x) 2.02 2.56 2.53 2.54 2.12 1.96 1.87 Growth Rates: % YoY Growth in Revenue 62.6 35.7 51.4 16.7 12.3 8.7 9.4 % YoY Growth in Operating Profit 39.2 3.3 43.2 -32.5 -2.2 14.9 17.2 % YoY Growth in EBITDA 44.6 13.6 44.5 -14.8 4.2 14.7 15.1 % YoY Growth in Net Profit 33.7 3.4 48.5 -35.3 -5.4 18.2 19.2 % YoY Growth in Total Assets 48.5 44.1 56.0 28.2 6.7 7.9 8.8 % YoY Growth in Shareholders' Equity 133.7 18.3 99.1 23.2 20.0 13.8 14.5 Ratios used for Valuation: Adj. EPS (OMR) 0.074 0.076 0.096* 0.062* 0.072 0.085 0.102
Adj. BVPS (OMR) 0.23 0.28 0.22 0.28 0.33 0.38 0.43 P/E Ratio (x) 8.39 8.12 6.47 10.00 8.58 7.26 6.09 P/BV Ratio (x) 2.64 2.23 2.76 2.24 1.86 1.63 1.43
Current Market Price (OMR)*** 0.62 0.62 0.62 0.62 0.62 0.62 0.62 * Annualised ** Gross Profit is represented by Profit from contracts *** CMP as on June 18, 2009

DISCLAIMER: All reasonable care has been taken to ensure that the information contained herein is not misleading or untrue at the time of publication, but we make no representation as to its accuracy or completeness. All information is for the private use of the person to whom it is provided without any liability whatsoever on the part of TAIB Securities WLL, any associated company or the employees thereof. Nothing contained herein should be construed as an offer to buy or sell or a solicitation of an offer to buy or sell. The value of any investment may fall as well as rise. Past performance is no guide to the future. The rate of exchange between currencies may cause the value of the investment to increase or diminish. Consequently, investors may not get back the full value of their original investment
Call us on +973 17549499 or email us at [email protected]