galileo ultraviolet spectrometer observations of...
TRANSCRIPT

JOURNAL OF GEOPHYSICAL RESEARCH, VOL. 103, NO. E9, PAGES 20,149-20,158, AUGUST 30, 1998
Galileo ultraviolet spectrometer observations o
auroral spectrum from 1600-3200 A of Jupiter's
Wayne R. Pryor, 1 Joseph M. Ajello, 2 W. Kent Tobiska, 3 Donald E. Shemansky, 4 Geoffrey K. James, 2 Charles W. Hord, 1 Smart K. Stephens, 3 Robert A. West, 2 A. Ian F. Stewart, 1 William E. McClintock, 1 Karen E. Simmons, 1 Amanda R. Hendrix, 1 and Deborah A. Miller 1
Abstract. In 1996 and 1997 the Galileo Ultraviolet Spectrometer (UVS) obtained the first meas- urements of Jupiter's nightside midultraviolet (MUV) polar auroral spectrum from 1620 to 3231/• at 13/• resolution. The reduceA polar spectra, after removal of off-axis scattered radiation from the sunlit dayside of Jupiter, contain a spectrum that matches laboratory spectra of the H2 continuum in the a-b dissociative emission transition. This is the first direct identification of the H2 a-b tran- sition in astronomy. The a-b emission is excited by electron impact exch .ange reactions with H2 that peak in cross section near 15 eV. The emission threshold is at 1216 A, and the continuum peaks in intensity in the 2000-2500 3. range. Jupiter's observed wavelength-integrated MUV H 2 a- b emissions (1620-3231/•) have a photon flux -8 times smaller than simultaneously observed wavelength-integrated far-ultraviolet (FUV) H2 band emissions (1230-1650 3.). Because the FUV H2 emissions have an emission cross section that peaks at higher energies near 50 eV, this FUV/MUV brightness ratio is diagnostic of the secondary electron energy distribution and is con- sistent with a "warm" distribution of electrons.
1. Introduction
Jupiter's aurora has been extensively studied with sounding rockets, spacecraft, and ground-based telescopes in the X ray, extreme ultraviolet (EUV), FUV, and infrared (see the review by Ajello et al. 1998, [this issue]). Part of the energy deposited by particle precipitation is reemitted in photons produced in transitions in H, H 2, CH 4, C2H 2, C2H 6, H3 +, and other gases. Emissions in the 500-1200 3, EUV and 1200-1700 3, FUV
spectral regions are due to electron and ion impact excitation of H 2 and H. Recent Galileo ultraviolet spectrometer (UVS) FUV Jupiter auroral spectra are remarkably similar to nearly simultaneous low-resolution Jupiter FUV auroral spectra ob- tained by J. Clarke with the Goddard high resolution spectro- graph on the Hubble Space Telescope (HST) [Ajello et al., this issue). Galileo EUV and FUV auroral spectra are different from an optically thin laboratory spectrum of electrons bombarding H 2 because of self-absorption effects in H 2 gas, absorption in CH 4 (methane) and C2H 2 (acetylene), and absorption from larger hydrocarbons and from aerosols [Ajello et al., this is- sue]. Away from the auroral regions, the poles are quite dark in
Laboratory for Atmospheric and Space Physics, University of Colo- rado, Boulder.
Jet Propulsion Laboratory, Pasadena, Califomia. FDC/Jet Propulsion Laboratory, Pasadena, Catifomia. Department of Aerospace Engineering, University of Southem
Califomia, Los Angeles.
Copyright 1998 by the American Geophysical Union.
Paper number 98JE00787. 0148-0227/98/98JE-00787 $09.00
the HST Wide Field Planetary Camera 2 (WFPC-2) FUV images that have some sensitivity to the MUV [Clarke et al., 1996]. The hydrocarbons and aerosols that darken the FUV polar im- ages and modify the auroral spectra are probably produced from methane by the polar auroras. The auroras contain more energy for methane dissociation than is available in sunlight for methane Lyman ot photolysis in the polar regions [Hord et al., 1979; Pryor and Hord, 1991].
The MUV auroral spectrum from 1700-3200 /• was previ- ously unexplored because reflected sunlight from Jupiter's at- mosphere overwhelms the auroral emissions as seen from the vicinity of Earth. This is not true in the EUV and FUV because the solar flux is several orders of magnitude weaker than in the MUV and because the H 2 emissions are brightest in the EUV and FUV. Galileo's unique ability to observe Jupiter's darkside has now produced the first MUV auroral spectra. This paper de- scribes two types of MUV darkside spectra.
1. Darkside spectra of Jupiter obtained near 90 ø phase angle that contain off-axis scattered radiation from Jupiter's dayside, but could be obtained with a long integration period to obtain reasonable signal-to-noise.
2. Darkside spectra of Jupiter's southern aurora obtained from within the shadow of Jupiter that contain less off-axis scattered radiation from the dayside, but have low signal-to- noise.
As we will show, the 90 ø phase angle MUV polar auroral spectra from the nightside have a distinct wavelength- dependent emission that is not due to off-axis scattered radia- tion from the dayside. The MUV auroral spectrum is consistent with laboratory measurements of the H 2 a-b continuum radia- tion obtained by James et al. [this issue] in electron impact experiments. Simultaneous FUV/MUV spectra obtained within Jupiter's shadow clearly show bright FUV aurora but proved in- conclusive in the MUV due to short integration times and a low signal-to-noise ratio.
20,149
20,150 PRYOR ET AL.' GALILEO UVS JUPITER AURORAL SPECTRUM 1600-3200 A
2. Instrumentation
The Galileo UVS instrument [Hord et al., 1992] consists of a Cassegrain telescope and a Fastie-Ebert spectrometer. The spectrometer uses a scanning grating drive to obtain spectra with three different photomultiplier tubes. FUV spectra are measured with a "G" tube with a CsI photocathode in second order from 1133 to 1921 /• at 6.7 /•resolution. MUV spectra are measured from 1620 to 3231 /• with 13.6 /• resolution in first order using an "F" tube with a CsTe photocathode. Near- ultraviolet (NUV)spectra from 2820 to 4320 /• are measured with 13.6/• resolution in first order using an "N" tube with a KCsSb photocathode. The G and N slits have the same field of view, measuring 0.1 by 1.0 ø on the sky. The F slit used for the MUV spectra described here is shorter in one dimension, meas- uring 0.1 by 0.4 ø. The centers of all three slits are boresighted, that is, they all look in the same direction. It requires 4 1/3 s to obtain an F-channel or G-channel spectrum, including a 1/3 s dead time for large grating motions and a 4 s interval in which smaller grating steps occur 528 times 7.57 ms apart. Actual data integration lasts 6 ms on each 7.57 ms step. Each F channel step is spectrally displaced by 3.1 /•, and samples light from a range of wavelengths 13.6 /• wide full-width at half maximum (FWHM). The F-channel recorded counts for each step are always log-compressed into 8-bit numbers by the UVS electronics. We have adopted the in-flight stellar calibra- tion of the F-channel described by Hendrix [1996].
The data collection system can be configured into two modes. The recorded mode was used for observations obtained
with Galileo inside Jupiter's shadow. In recor• mode each 8- bit element of data is stored separately for eventual transmis- sion to Earth, allowing accurate reconstruction of the uncom- pressed tube counts at low count rates. Recorded mode is re- source-intensive, requiring about 1 kbit of data to be down- linked for each second of recording.
A second mode, called real-time science (RTS), was devel- oped in-flight when it became apparent that Galileo would be limited to low data rates by the failure of the high gain antenna deployment. RTS uses on-board summation of the instrumental data to greatly reduce the amount of downlink telemetry. For the F-channel data the general approach was to sum the log- compressed data at each wavelength in the spacecraft central computer, transmit it to the ground, and then divide by the number of integrations, decompress the data, and multiply by the number of integrations. This algorithm is satisfactory if the source observed in one integration is of constant bright- ness.
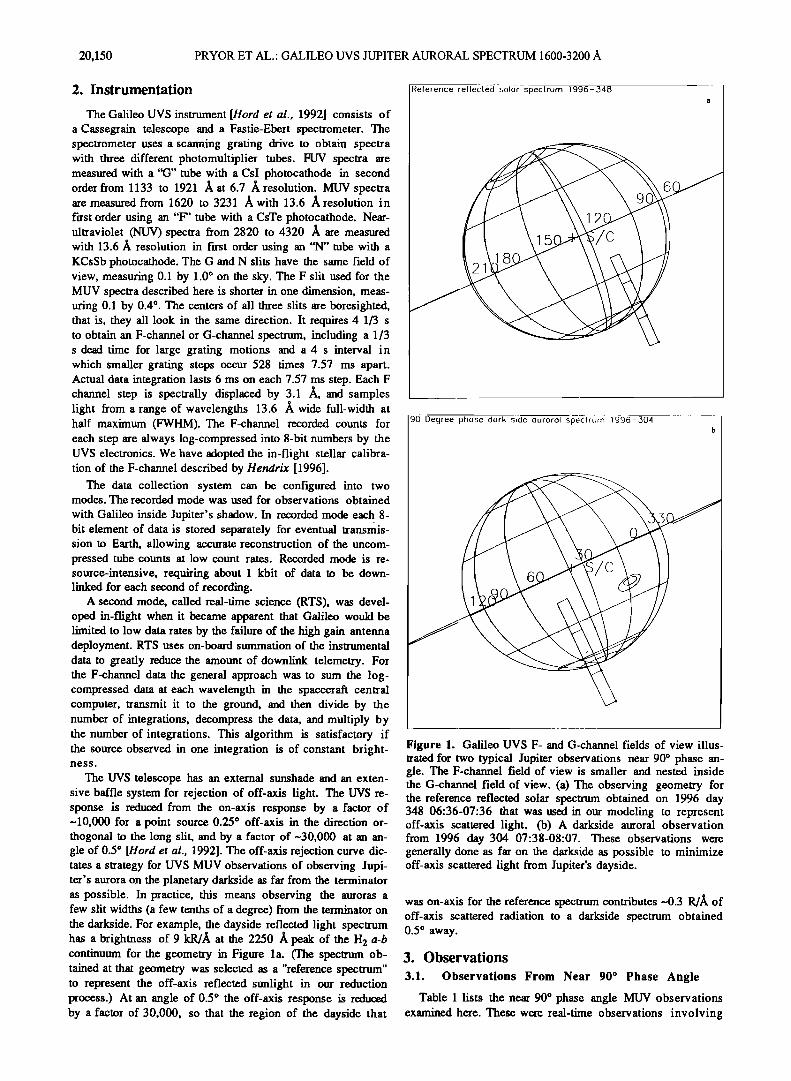
The U'VS telescope has an external sunshade and an exten- sive baffle system for rejection of off-axis light. The U'VS re- sponse is reduced from the on-axis response by a factor of -10,000 for a point source 0.25 ø off-axis in the direction or- thogonal to the long slit, and by a factor of-30,000 at an an- gle of 0.5 ø [Hard et al., 1992]. The off-axis rejection curve dic- tates a strategy for UVS MUV observations of observing Jupi- ter's aurora on the planetary darkside as far from the terminator as possible. In practice, this means observing the auroras a few slit widths (a few tenths of a degree) from the terminator on the darkside. For example, the dayside reflected light spectrum has a brightness of 9 kR/]• at the 2250 ]• peak of the H 2 a-b continuum for the geometry in Figure la. (The spectrum ob- tained at that geometry was selected as a "reference spectrum" to represent the off-axis reflected sunlight in our reduction process.) At an angle of 0.5 ø the off-axis response is reduced by a factor of 30,000, so that the region of the dayside that
Reference reflected .•,•)lur spectrum 1996-548
6
90 De9ree phase dark side auroral spectrum 1596-304
Figure 1. Galileo UVS F- and G-channel fields of view illus- trated for two typical Jupiter observations near 90 ø phase an- gle. The F-channel field of view is smaller and nested inside the G-channel field of view. (a) The observing geometry for the reference reflected solar spectrum obtained on 1996 day 348 06:36-07:36 that was used in our modeling to represent off-axis scattered light. (b) A darkside auroral observation from 1996 day 304 07:38-08:07. These observations were generally done as far on the darkside as possible to minimize off-axis scattered light from Jupiter's dayside.
was on-axis for the reference spectrum contributes -0.3 R//• of off:axis scattered radiation to a darkside spectrum obtained 0.5 ø away.
3. Observations
3.1. Observations From Near 90 ø Phase Angle
Table 1 lists the near 90 ø phase angle MUV observations examined here. These were real-time observations involving

PRYOR ET AL.: GALILEO UVS JUPITER AURORAL SPECTRUM 1600-3200 A 20,151
Table 1. Channel F/G Scan Observations From Near 90 ø Phase An[le SCE Observation
Day Start Time Day End Time (UTC) (UTC)
1996
173 00 h 07 m 14' 173 00 h 36 m 33' j0cd._glaura02 176 04 • 14 m 25' 176 04 • 16 m 27' g01a_aurmap01 248 00 h 44 m 23 ' 248 00 h 50 m 27' g02a_aurmap01 304 01 • 13 m 49' 304 02 h 13 m 28' g02c_c3aura01
02 • 14 m 29' 03 • 14 m 08' g02c_c3aura01 03• 15m09 ' 04• 14 m 48' g02c_c3aura01 04h 15 m 49' 05 • 15 m 28' g02c_c3aura01 05 • 16 m 29' 06 h 16 m 08' g02c_c3aura01 06 h 17m09 ' 07 h 37 m 01' g02c_c3aura01 07 h 38 m 02' 08 h 07 m 21 ' g02c_c3aura02 08 h 08 m 22' 08 h 37 "• 41' g02c_c3aura02 08 h 38 m 42' 09 h 08 m 01 ' g02c_c3aura02 09 h 09m02 ' 09 h 38 m 21' gO2c_c3aura02
308 03 h 06 m 21 ' 308 03 h 17 m 28' c03a_aurmap01 347 19 • 25 m 12' 347 20 h 24 m 52' c03c_e4aura02
20 • 25 m 52' 20 h 55 m 12' c03c e4aura02
20 • 56 m 12' 21 h 25 m 32' c03c_e4aura02 21 • 26 m 32' 21 h 55 m 52' c03c e4aura02
21 • 56 m 52' 22 h 26 m 12' c03c_e4aura02 22 • 27 m 12' 23 • 26 m 52' c03c_e4aura02
347 23 h 27 m 52' 348 00 h 27 m 32' c03c_e4aura02 348 02 h 31 m 54' 03 h 31 m 33' c03c e4aura03
03 • 32m34 , 04h 32 m 13' C03C e4aura03
04 • 33 m 14' 05 h 32 m 53' c03c_e4aura03 05 h 33 m 54' 06 h 33 m 33' c03c e4aura03
06 • 36 m 35' 07 h 36 m 14' c03c_e4aura03 351 11 h 33 m 19' 351 11 h 35 m 20' e04a_aurmap01
1997
049 11 • 43m07 ' 049 12 h 43 m 47' e06a e6aura02
12 • 45 m 48' 13 h 45 m 27' e06a_e6aura03 13 • 46 m 28' 14 • 46 m 07' e06a e6aura03
050 00 h 57 m 51 ' 050 01 h 18 m 04' e06a_aurmap01 01 h 19 m 05 ' 01 h 48 m 24' e06a_aurmap01
092 14 • 13 m 10' 092 14 h 42 m 29' g07a._g7aura02 1 b 15 h 17 m 52' 15 h 47 m 12' g07a_fixtmd01 1 16 • 49 m 46' 17 h 20 m 13' g07a_aurmap01 0 17 h 21 m 14' 17 h 50 m 33' g07a_aurrnap01 1
17 h 51 m 34' 18 h 20 m 53' g07a_aurmap01 2 18 h 21 m 54' 18 h 42 m 07' g07a_aurrnap01 3
129 05•05m36 ' 129 06h 35m 36 ' g08a._g8aura04 1 177 07 • 06 m 28' 177 07 • 26 m 41 ' c09a_aurmap03 0
07 • 27 m 42' 07 • 52 m 58' c09a_aurmap03 1
179 08 h 38 m 07' 179 09 h 07 m 26' c09a_aurmap04 1
Record Target
2 s_term
3 s_day 2 s_day 0 off planet 1 a eq_night 2 a eq_night 3 eq_night 4 eq_night 5 b s_night 0 s_night 1 s_night 2 s_term 3 s term
2 s_day 0 b n_night 1 b n_night 2 b n_night 3 b n_night 4 b n_night 5 n_night 6 n term
1 off planet 2 b s_night 3 b s_night 4 s_night 5 e s_day 2 s_day
2 n_night 0 n_night 1 n term
0 s_night 1 s_night
s_night s_night s_mght n_night n_night n_night s_day n_day s_day s_night s_night s_term
n_day n_day
09 h 08 m 27' 09 • 37 m 46' c09a_aurmap04 2 n_day Here n_day, northern dayside, s_term, southern terminator, eq_night, equatorial darkside. All lati-
tudes are planetocentric. a Included in the darkside equatorial sununed spectrum of Figure 7. b Included in the darkside polar summed spectrum of Figures 5, 6, and 8. c The selected reference reflected sunlight spectrum, from the south polar dayside.
System IT[ Latitude Longitude
-53.8 200.4
-55.3 53.0
-55.5 323.9
-1.7 264.0
-0.2 285.2
-1.4 308.7
-2.2 334.5
-55.9 19.2
-57.0 45.8
-54.4 55.8
-54.4 64.7
-55.3 76.8
-52.6 82.7
1.4 120.9
65.2 203.1
62.6 186.5
62.5 193.5
62.2 199.2
61.2 204.7
61.4 221.3
-54.8 70.2
-54.8 84.4
-54.8 103.0
-55.4 91.1
-53.9 359.1
57.6
61.7
60.4
-56.6
-56.5
-55.0
35O.5
37.5
25.8
100.8
124.6
94.3
-55.6 74.7
58.4 195.9
56.2 181.8
-67.1 149.6
56.2 160.1
-64.4 64.4
-67.8 357.7
-61.7 3.9
-64.8 333.7
59.2 205.7
58.6 157.9
61.0 179.1
altemate 4 1/3 s MUV (F-channel) and 4 1/3 s FUV (G-channel) spectral scans, called F/G scans. Some observations were dark- side observations of the auroras that contain off-axis contami-
nation from Jupiter's dayside. Some of the observations con- rained Jupiter's dayside and produced reflected sunlight spectra. These observations were all obtained during the period on each orbit when the spacecraft was drifting past Jupiter at about 90 ø phase angle. Observations from higher phase angles usually require spacecraft turns to see Jupiter and are rare because they
consume spacecraft fuel. Observations at lower phase angles provided too small a view of Jupiter's dark crescent to separate the MUV aurora from the off-axis scattered light from the day- side. Lower phase angle auroral observations focused on the G channel (FUV), where the weaker sunlight does not overwhelm the aurora. The latitudes and longitudes listed are for the center of the slit. If the center of the slit fell off the body, no latitude and longitude are given. In a few cases, two pointings occurred within a single data record, both of which are given in Table 1.

A data record is one readout (flush) of the spacecraft RTS data buffer containing (in our MUV RTS data sets) a single F and a single G summed spectrum.
The geometry of the auroral ovals is not symmetric between north and south; the northern oval contains the most equator- ward segment of the auroral arcs, near longitude 180 ø. Thus the maximum angular distance of the northern oval from the north pole viewed from Galileo is larger than the maximum angular distance of the southern oval from the south pole. This implies that the most favorable MUV observations may come from the north, when 180 ø is near the dark limb, providing the largest angle between the terminator and the auroral emissions in or- der to minimize off-axis light. Figure lb illustrates the observ- ing geometry for a typical darkside observation near 90 ø phase angle.
3.2. Observations From Within Jupiter's Shadow On 1996 day 314 during the "Callisto 3" (C3) orbit, the
Galileo spacecraft was turned to observe Jupiter's darkside from within Jupiter's shadow. UVS-recorded observations were ob- tained for 66 m 44 s during this turn, although only half of this was returned due to downlink limitations. The UVS observing strategy selected for the south polar observations involved al- ternating 4 1/3 s spectral scans of the F (MUV) and G (FUV) tubes, of which 12 m 8 s were returned. Figure 2 shows the ob- serving geometry for the south polar observations. The F- channel slit observed darkside emissions from 100-130 ø Sys- tem III longitude. The FUV and MUV total counts per spectrum as a function of time are shown in Figure 3. The FUV count rates peak when the slit was near the central meridian on the darkside, due to auroral emissions. The MUV count rates peak at the beginning of the observation, when the slit was pointed at the planetary limb. Figure 4 shows the summed FUV and MUV spectra for this period. The FUV spectrum shows the usual H 2 band emission pattern seen in UVS lab spectra of elec- tron impact on H 2 [Hord et al., 1992] and UVS Jupiter spectra [Ajello et al., this issue]. The MUV spectrum agrees well with a least squares fit spectrum formed from a solar spectrum [Van Hoosier et al., 1988] multiplied by the instrument calibration. We conclude that the MUV spectrum seen here is due to for- ward-scattered sunlight. A similar fit is obtained if a dayside Jupiter spectrum from UVS is used instead of a solar spectrum. Because the G slit is longer than the F slit, it is possible that the observed FUV emissions originated outside the field of view of the F slit. This low signal-to-noise data set is consis- tent with the absence of an MUV aurora and shows that any MUV aurora is considerably weaker than the FUV aurora.
Better MUV auroral observations were obtained at 90 ø phase that allow us to quantify the FUV/MUV brightness ratio. North polar observations during the C3 turn obtained by alternating the N (NUV) and G channels did not detect auroral emissions in either channel, confirming that the northern auroral oval was not in the field of view due to a late trajectory update. Addi- tional NUV darkside observations from within Jupiter's shadow were obtained on orbit C10.
Figure 2. Viewing geometry for the F- and G-channel fields- of-view during the C3 turn south polar observations of Jupiter on 1996 day 314 05:48-06:01. Galileo was in Jupiter's shadow. The Io torus auroral oval and the more polar reference auroral oval (thought to be the source of the emissions) are shown (J. Clarke, personal communication, 1996). The ge- ometry is shown at (a) the start (05:48), (b) the midpoint (05:54), and (c) near the end (06:00) of the observation.
C3 Dork %•de 1996-314,•/05'48
.3 Dc]rk Side 1996- 3147•-0•' .54 b
C.5 [•(]rk S,de 1996 ,314•/•-•00

PRYOR ET AL.: GALILEO UVS JUPITER AURORAL SPECTRUM 1600-3200 A 20,153
200
150
100
50
0
+
+t ,•
48 50
4OO
350 • •
300 •
250
2OO
48 50
C3 Turn G-Channel Counts
+
• • • •+ + • • + + • +• + •
+
52 54 56 58 60 62
Minutes after 1996 Day 314 5:00
C3 Turn F-Channel Counts
•+
• •,+
52 54 56
• + +
58 60 62
Minutes after 1996 Day 314 5:00
Figure 3. Total counts in each 4 1/3 s spectrum obtained in the C3 turn south polar observations indicated for (top) the FUV G channel and (bottom) the MUV F channel. Instrument background has not been subtracted.
3.3. Laboratory Spectra
Since Jupiter's atmosphere is mostly H 2 gas, we compare the Jupiter MUV auroral spectrum to the MUV spectrum emitted by electrons bombarding H 2 gas. Ajello et al. [1988, 1989] constructed an electron gun with magnetic collimation. The electron beam is crossed with a low-pressure gas beam, excit- ing various molecular and atomic emissions. James et al. [this issue] used this instrument with H 2 as the target gas and ob- tained calibrated emission spectra in the wavelength range 1750-5300 /• using electron energies of 14, 19, and 100 eV. James et al. identified the emissions from 1600 to 3200 /• as
the H 2 a-b continuum band system that radiates at wavelengths longer than 1216 /• [Ajello and Shemansky, 1993]. The H 2 triplet a 3Zg+ state is excited from singlet ground state X •Zg+ by the only efficient mechanism for populating the triplet structure, electron exchange collisions with low-energy free
electrons. The a 3Zg+ state may be excited directly from the ground state, or by excitation of higher triplet states (also by electron exchange) that subsequently cascade to the a 3Zg+ state. The threshold energy for excitation of the a 3Zg+ is 11.82 eV. Below 20 eV electron impact energy, electron ex- change is the most likely process for excitation of the a state in (1). The excited a 3y•g+ state radiates in an electric dipole transition to the repulsive b 3Zu+ state, producing H 2 a-b con- tinuum emission longward of 1216/• and two fast H(ls) atoms each with a few eV of kinetic energy. The combined (direct + cascade) emission cross section to the b 3Zu+ is rather narrow (7 eV FWHM). The emission cross section has a maximum value of 5.0 x 10 -17 cm 2 (1.73+_0.85 x 10 -17 cm 2 due to direct excitation and 3.3x10 '•7 cm 2 due to cascade) at an electron im- pact energy of 15.5 eV [Ajello and Shemansky, 1993], in the range of values characteristic of secondary auroral electrons [Opal et al., 1971]. At higher energies above 50 eV the cross section falls as 1/E 3. Primary auroral particles have typical en- ergies of tens or hundreds of keV. At these energies, the prima- ries have negligible cross section for excitation from the X
1Zg+ to a 3Zg+ state. The direct excitation and emission process can be summarized as follows [Ajello and Shemansky, 1993]:
H2 (X lZg+) + e -> H2 (a 3Zg+) + e (1)
H 2 (a 3Zg+) _> H2 (b 3Zu+ ) + hv (2)
H2(b 3Zg+)-> 2 H(ls) (3)
Two-photon continuum emission [Osterbrock, 1974] from metastable H(2s)atoms (lifetime against decay=0.12 s) pro- duced by dissociative excitation of H 2 is not considered here because of rapid quenching by atomic and molecular hydrogen ions, by electrons, and by neutrals in the auroral deposition region. In this two-photo,n system, the probability of a 2s H atom becoming a ls H atom by emitting a photon is symmet- ric around the emission peak at 2431 /•. Bound-free and free- free emission continua in H are also present in hot H, [Osterbrock, 1974] but are probably relatively weak emissions on Jupiter because of the low H/I-I 2 ratio expected at auroral al- titudes and temperatures.
4. Comparison of 90 ø Phase Data and Model We now describe the process of separating the nightside
auroral spectrum from the somewhat brighter off-axis scattered radiation from Jupiter's dayside. Inspection of the data set sug- gests that darkside spectra are generally similar to the dayside reflected light spectra, but the darkest darkside polar spectra have a somewhat different spectral appearance, suggesting the presence of an auroral component. To improve the signal-to- noise ratio, we summed darkside polar observations that had relatively small radiation background and off-axis scattered ra- diation signatures. Figure 5 shows the stun of the north and south polar darkside MUV spectra obtained near 90 ø phase to date, with the selection criterion that the count rate in channel
420 at 2910/!,, near the peak of the Jupiter dayside spectrum, was below 50 counts/s. Nine records of data met this criteria
40
-', 20
10
600
5OO
400
sag
200
lOO
C5 Turn G-Channel Spectrum
1200 1400 1600 1800 Wavelength (Angstrams)
C3 Turn F-Channel Spectrum
1800 2000 2200 2400 2600 2800 ,5000 ,5200
Wavelength (Angstrams)
Figure 4. Summed spectra for the C3 turn south polar ob- servations shown (top) for the FUV G channel and (bottom) for the MUV F channel. The G-channel spectrum, shown as counts per wavelength step, shows H Lyman at (1216 /!,) and H 2 band emissions. The F-channel spectrum is very similar to a solar spectrum that has been multiplied by the instrument in-flight calibration [Hendrix, 1996]. A substantial instrumental back- ground is also present. To obtain reasonable F-channel signal- to-noise, counts from 10 neighboring wavelength steps have been co-added.

20,154 PRYOR ET AL.: GALILEO UVS JUPITER AURORAL SPECTRUM 1600-3200 A
55OO
5OOO
500
4OOO
3500
_.. 19 eV e- on H 2 and Jupiter Day Side .-,
__ 14 eV e- on H 2 and Jupiter Day Side •. I' ,
ß
.. Jupiter Day Side / [ -1 ':.. __ Polor Night Side • - •"i -J "' !1 u
2000 2500 3000
Wovelength (Angstroms)
Figure 5. Summed F-channel (MUV) darkside north and south polar spectrum from 90 ø phase. Three multiple linear re- gression fits are also shown: (1)a fair fit using just a back- ground-subtracted Jupiter polar dayside spectrttm to represent the off-axis light contribution; (2)a better fit using the off- axis contribution and a 14 eV e- on H 2 laboratory spectrum; and (3) a similar fit using the off-axis contribution and a 19 eV e- on H 2 laboratory spectrum. To obtain reasonable F-channel signal-to-noise, counts from 10 neighboring wavelength steps have been co-added.
and are so marked in Table 1. This summed spectrum has a spectral wavelength dependence with relatively more emission at wavelengths below 2800 ]k than does the dayside spectrum. We examined multiple linear regression [Berington, 1969] models of this spectrum involving various regression compo- nents that included a wavelength-independent background, a reference dayside spectrum, and laboratory electron impact spectra. First, we fit the summed spectrum with only a refer- ence dayside spectrum, where the solar reflected light is domi- nant and has high signal-to-noise. This regression in the software package Interactive Data Language (IDL) produces a "reduced and weighted" Z 2 of 1.13, but is a fairly poor fit, with this model larger than the data at the shortest wavelengths and smaller than the data in the wavelengths near 2300 J• where H 2 emission is expected to be visible. If the fitting function is a good approximation to the parent function, then the value of the reduced Z 2 should be approximately 1. Next, we tried a re- gression involving both the reference dayside spectrum and a calibrated 14 eV laboratory spectrum (multiplied by the UVS response curve). This model produces a visually appealing fit throughout the spectrum with a reduced Z 2 of 1.02. A regres- sion with both the reference dayside spectrum and a 19 eV laboratory spectrum (multiplied by the UVS response curve) produces a somewhat worse fit, with a reduced Z 2 of 1.06. The 14 eV and 19 eV laboratory spectra are sufficiently similar that the regression program by itself could not meaningfully assess their relative contributions. Figure 6 shows the summed dark- side spectrum after subtraction of (1) the solar component when the 14 eV specmnn was the other component in the re- gression and (2) the solar component when the 19 eV spectrum was the other component. The nonsolar component of the darkside spectrum strongly resembles the 14 and 19 eV labora- tory spectra, with a somewhat better match for the 14 eV spec- trum.
Examination of a summed darkside equatorial MUV spectrum (Figure 7)reveals no obvious pattern other than the off-axis dayside spectrum. The same reference reflected solar spectrum fits this spectrttm with a reduced Z 2 of 1.17. In this case, add- ing the 14 eV or 19 eV components to the regression did not change the quality of fit Z 2 significantly: 'the new fits also have Z 2 of 1.17. We interpret the lack of a 14 eV or 19 eV component in the equatorial spectrum as further evidence that the high-latitude deviation in the MUV spectrum from the off- axis dayside spectrum is a phenomenon caused by the polar auroras. We also experimented with using other dayside spectra as the reference solar spectrum. While there were subtle differ- ences between dayside spectra, the choice of spectrum did not affect the conclusion that an MUV aurora is present at high latitudes.
The significance of the MUV polar auroral detection can be discussed in several ways. The presence of a large off-axis re- flected solar contribution in the spectrum raises the issue of potential systematic errors. The presence of a polar H 2 a-b component in the data and its absence at the equator is plausi- ble in terms of our FUV auroral experience. Another possible concern is variations in the reflected light spectrum. We ad- dressed these issues by varying the reference solar spectrum and continued to find the H 2 a-b component in the data. An ad- ditional question is the behavior of the insmnnent off-axis. We recently studied the UVS engineering model spectral re- sponse as a function of angle by placing Hg and D 2 lamps at the focus of a collimator to produce a plane wave at the UVS instrument. Spectra obtained with the UVS aligned with this beam (on-axis) and at an off-axis angle of 0.6 ø were remarka- bly similar in relative spectral intensity. Features did not shift in wavelength. The off-axis spectrum is much dimmer than the
MUV Auroro
400 I-- ' - '- ....... ...•00 • I _ Oork Side - Scoled Ooy S,de
õ lOO o
o 0
-100
-200
2000 2500 3000
Wovelength (Angstroms)
M UV Au ro ro 400 .... - ' - '
300 • T.-.-• _ pork Side - Scoled Ooy Side
õ lOO o
o 0
-100
-200
2000 2500 3000
Wovelength (Angstroms)
Figure 6. Jupiter darkside polar MUV spectrum from Figure 5 after subtraction of the solar contribution, leaving just the auroral component. In the upper panel, the solar part of regres- sion (2) just described has been subtracted and is compared to the 14 eV e-on H2 laboratory spectrum [James et al., this is- sue] and in the lower panel, the solar part of regression (3) just described has been subtracted and is compared to the 19 eV e- on H 2 laboratory spectrum [James et al., this issue]. The fit in the upper panel is slightly superior. Again, counts from 10 neighboring wavelength steps have been co-added. The statistical uncertainty in the 10 grating step wide bin is shown.

PRYOR ET AL.: GALILEO UVS JUPITER AURORAL SPECTRUM 1600-3200 A 20,155
6000
5500
5000
4500
4000
_.. 19 eV e- on H 2 ond Jupiter Day Side
__ 14 eV e- on H 2 and Jupiter Doy Side
.. Jupiter Doy Side
__ Equotorlol Night Side '--'-•"1• ••"'"'L""""•R• • ..... ......
2000 2500 5000
Wovelength (Angstroms)
Figure 7. Summed F-channel (MUV) darkside equatorial spectrum from 90 ø phase. Three multiple linear regression fits are also shown: (1) a fair fit using just a Jupiter dayside spec- trum to represent the off-axis light contribution, (2) an identi- cal fit using the off-axis contribution and a 14 eV e- on H 2 laboratory spectrum, (3) an identical fit using the off-axis con- tribution and a 19 eV e- on H 2 laboratory spectrum. To obtain reasonable F-channel signal-to-noise, counts from 40 neigh- boring wavelength steps have been co-added.
on-axis spectrum [Hord et al., 1992]. The lab work and the po- lar/equatorial comparison provide confidence in our data set.
The statistical significance of the detection can be discussed in two ways. First, how many standard deviations is the detec- tion? The summed polar F-channel spectrum contains 230,772 counts, including solar reflected sunlight, instrumental back- ground, and any signal. There are 5836 excess counts in the summed polar spectrum attributed to the H 2 a-b continuum. This leads to an estimated 12-13 detection. A second approach to assessing the significance of the detection involves the F- test [Bevington, 1969]. This technique addresses the follow- ing question: given a data set that can be fit by two compo- nents (here, the instrumental background and the reflected so- lar spectrum) or by three components (adding in the H 2 a-b •2oo continuum), how significant is the third component? Define the goodness-of-fit criterion Z 2 for a data set with N data points •ooo (N=528 here), Yi, and model points, ymi, and statistical stan-
dard deviations 0.• 800
Z2 = • 1...•_[y i _ Ymi ]2 • i=l 0'/2 • 600 400
and the degrees of freedom v=N-n-1, for a fit to a function with n coefficients plus one constant term. Then the F-test for the validity of an additional term is defined as
Z2(n-1)-Z2(n) FZ X 2 (n) I(N - n- 1)
cates that values of F• > 10.8 have a less than 0.001 chance of occurring by chance when the number of degrees of freedom is large. We conclude that the additional term, the 14 eV H 2 a-b laboratory spectrum, is significant.
For the comparison of the two-term fit to the three-term fit (with a 14 eV • a-b spectrum) for the summed MUV polar spectrum, we find F• 59.9. Berington [1969, Table C-5] indi-
5. MUV and FUV Brightnesses
The near 90 ø phase angle data were used to find the relative brighiness of the FUV and MUV auroras. Figure 8 shows the summed FUV polar spectrum obtained simultaneously with the summed MUV polar spectrmn of Figure 5, This FUV polar spec- trum is similar to a 100 eV e-on H 2 FUV spectrum obtained with the UVS in the laboratory [Ajello et al. 1988]. Below about 1400 /•, the spectra differ due to methane absorption from gas located above the auroral emissions and due to differ- ences in the electron energy distribution [Ajello et al., this is- sue]. Deliberately excluding Lyman or, we find the total number of G-channel (FUV) counts between 1230 and 1650 ]• (after background subtraction) is 40,839. The total number of F- channel (MUV) counts (after subtracting a wavelength- independent background and the off-axis dayside scattered ra- diation contribution) is 5836. To estimate the relative emis- sion rates requires some assumptions, because the G-channel slit is longer than the F-channel slit. If the two fields of view are filled, the wavelength-integrated signal in the G-channel (here restricted to 1230-1650 •) is 5.8 kiloRayleighs (kR), and in the F-channel (1616.5-3227.9 ]•)is 1.8 kR. In reality, the auroral arc is probably quite narrow (-200 km) in width and fills a small fraction of each slit. The actual G-channel/F-
channel brighiness ratio in the arc is better approximated by (5.8/1.8)(1.0ø/0.4ø)=8.1, where 1.0 ø and 0.4 ø are estimates for the effective slit lengths of the G and F channels, respectively. This correction is invalid if part of the emission occurs in por- tions of the G-channel slit that extend beyond the region of overlap with the F-channel slit. In the calibrated 14 eV e-on H 2 laboratory spectrum the brighiness ratio between G- channel (1230-1700 /•)and F-channel (1616.5-3227.9 wavelengths is 1.3, at 19 eV the ratio is 2.25, and at 100 eV
!i: i' .. Lob 100 eV e- on H 2 i.. •
200 -
1200 1300 1400 1500 1600 1700
Wovelength (Angstroms)
Figure 8. The Jupiter darkside FUV summed auroral spec- trum obtained simultaneously with the dimmer MUV auroral spectrum in Figure 6, compared to the UVS laboratory spec- trum of 100 eV e- on H 2. Short-wavelength differences are at- tributed to CH 4 absorption in Jupiter's atmosphere and to elec- tron energy effects. Note the absence of reflected solar contri- butions to the FUV spectrum.

20,156 PRYOR ET AL.: GALILEO UVS JUPITER AURORAL SPECTRUM 1600-3200 A
the ratio is 9.9. The ratio at 100 eV is lower than that expected from the (a-b) model of Ajello and Shemansky [1993]. The un- expectedly strong H 2 (a-b)spectrum at 100 eV can be ex- plained by (1) a large number of low energy secondary elec- trons trapped in the collimating magnetic field that efficiently excite the continuum or/and (2) a very strong cascade channel from the many upper-lying triplet states that contains a large singlet-triplet mixing. The arc-width estimate of 200 km comes from imaging of the spatially resolved arc by the Galileo solid state imager (SSI)in visible and near-infrared wavelengths (A. Ingersoll et al., Imaging Jupiter's aurora at visible wavelengths, submitted to Journal of Geophysical Re- search, 1998). The F-channel region from 1616.5 to 3227.9 ]i comprises -75% of the photons emitted in the whole H 2 (a-b) system (1216-oo ]i) if the spectrum is due to 14 eV electrons striking H 2.
The measured ratio of FUV/MUV brightness can be com- pared to theoretical expectations. The secondary electron en- ergy distribution measured in the laboratory increases at lower energies and can be represented as a sum of 4 Maxwellians [Opal et al., 1971; Ajello et al., this issue]. In Ajello et al.'s [this issue] representation f(E), the flux of secondary electxons of energy E in units electrons eV 4 s 'l, can be represented as
4
fiE)= Y.C n *(E/En)*exp(-E/En)
with coefficients C, for Maxwellians of temperature T, and en- ergy E,=kT, where k is Boltzmann's constant. The coefficients are C•=2.21, C2=0.406, C3=2.84x10 -2, and C4=9.84x10 -4. The corresponding temperatures in K are T•=3.25xl 04, T2=l.13x105, T3=4.58x10⁵, and T4=2.09x10⁶. This equation fits data on secondary electrons in H• with energies of 4-1000 eV and should not be used for lower energies. The secondary electron spectrum shape is generally independent of primary particle energy, provided one considers ejected electrons with energies considerably less than half the primary energy [Opal et al., 1971]. Computing the expected brightness ratio is a matter of convolving the relevant absolute emission cross sec- tions with the expected secondary electron spectrum. Direct electron excitation of the B and C states of H 2 responsible for the FUV B-X Lyman and C-X Werner band emission systems has a peak cross section for electrons with energies near 50 eV [Liu et al., 1998]. The a state, responsible for the H 2 a-b con- tinuum, with its narrowly peaked electron excitation cross sec- tion of 15.5 eV [Ajello and Shernansky, 1993], samples somewhat lower energy electrons. The convolution procedure involving model a-b cross sections leads to an expected FUV (1230-1650 ]i)/•UV (1616.5-3227.9 ]i)photon flux ratio of 2.5. The measured ratio of 8.1 is close enough to support the claimed detection. Discrepancies may reflect the different slit lengths, cross section uncertainties, secondary electron distri-
bution differences, and the effect of hydrocarbon absorption on the FUV auroral output. We also calculate the photon flux ratio FUV Lyman (1500-1650 ]i)/•UV (1616.5-3227.9 ]i) be- cause the FUV above 1500/• has less hydrocarbon absorption [Ajello et al., this issue]. In this case, we find the theoretical ratio of 1.1 and the data ratio of 3.9. The detected MUV emis-
sion is less than expected. A 27-eV Maxwellian electron dis- tribution improves the FUV spectral shape for some auroras [Ajello et al., this issue]. Convolving this proposed hotter 27- eV distribution with the cross sections gives an FUV (1230- 1650 ]i)/MUV (1616.5-3227.9 ]i) photon flux ratio of 7.5, very close to the measured ratio of 8.1. The 27 eV photon flux ratio FUV Lyman (1500-1650 ]i)/MUV (1616.5-3227.9 ]i)is 3.2, very close to the data ratio of 3.9. Table 2 summarizes these ratios for the Opal et al. [1971] distribution, and 27 eV, 50 eV, and 100 eV Maxwellian distributions, showing the band ratios have a large sensitivity to the electron tempera- ture. The Opal distxibution is referred to as "cold", and the 100 eV monoenergetic or Maxwellian is "hot". We conclude that the FUV/MUV ratios are consistent with the presence of a "warm" auroral electron distribution, with a temperature near 27 eV. Because the slit lengths are different and the cross sec- tions still have uncertainties near a factor of 2, this result is not yet decisive, but is suggestive of the presence of warm electrons.
6. Discussion
To the best of our knowledge, Galileo UVS has provided the first special observation of the H 2 a-b continuum emission in any astrophysical object. The H 2 a-b band system may be an important process for (1) heating outer planet atmospheres, molecular clouds in the interstellar medium, and stellar atmos-
pheres of cool stars and (2) measuring the secondary electron energies. Fast atomic hydrogen H(ls) atoms made in the a-b transition with characteristic energies of 3 eV (23,000 K) will heat Jupiter's atmosphere through collisions. Diagnosing the secondary electron spectrum is also of importance because the secondaries are responsible for most of the emissions [Rego et al., 1994]. It is not too surprising that the MUV auroral spec- trum resembles that of H2 excitation by elect•ons with 14 eV impact energy. H 2 is the most abundant gas in the Jupiter at- mosphere. The manifold of triplet states of H 2 has large excita- tion cross sections for the a, b, c, d, e states in the threshold
region near 15 eV [Ajello and Shemansky, 1993; Khakoo and Trajmar, 1986]. The triplet states (c, d, e .... ) with higher exci- tation energy than the a state relax by dipole allowed radiative transitions to the a state, followed by an allowed transition to the b state. MUV spectral data are sensitive to electron ener- gies near 15.5 eV, the peak in the a-b emission cross section. Simultaneously modeling the FUV and MUV brightnesses has provided an important test of the secondary electron distribu- tion, with the surprising result that a warm elect•on distribu-
Table 2. Model emission ratios from different electron dis-
tributions compared to UVS data ratio. Photon Flux Ratio
FUV (1230-1650 30/ o FUV (1500-1650/[)/ MUV (1616.5-3227.9A) MUV (1616.5-3227.9/•)
Galileo UVS polar data 8.1 3.9 2C•al distribution 2.8 1.3
eV distribution 7.5 3.4 50 eV distribution 16.9 7.5 100 eV distribution 43.7 19.5

PRYOR ET AL.: GALILEO UVS JUPITER AURORAL SPECTRUM 1600-3200 A 20,157
tion with energies near 27 eV is consistent with the brightness ratio.
The Galileo UVS Jupiter MUV spectra agree with the labora- tory data on electron impact on H 2 quite well. However, in the FUV, substantial hydrocarbon absorptions modify the auroral spectrum substantially [Ajello et al., this issue]. Reflection from below may also be important. Yung et al. [1982] esti- mated that a -20% enhancement of the FUV Lyman bands oc- curs due to reflection of downward flux by Rayleigh scattering of H 2. We now consider possible corrections for MUV absorp- tions and reflections. The reflected sunlight spectrum of Jupi- ter in the MUV was measured by the International Ultraviolet Explorer (IUE) [Wagener et al., 1985] and by Galileo UVS [Hord et al., 1995]. At Galileo UVS resolution, the reflected sunlight spectrum is modified by the presence of aerosols, but no characteristic absorptions can be resolved. At IUE resolu- tion, NH 3 bands are seen [Wagener et al., 1985]. However, ammonia absorption occurs below the NH 3 cloud layer at the several hundred millibar level; this is well below the auroral
emissions at pressures near the microbar level. Hydrocarbon and aerosol absorptions remain possible in the auroral spec- trum, but based on the Galileo reflected sunlight spectrum we expect to see nearly grey continuum absorption. Wagener et al. [1985] modeled the IUE equatorial MUV continuum absorp- tion from 2400 to 3200 /• with two haze layers: a 1.5 optical depth haze homogeneously distributed from 150 to 600 mil- libar with a constant single-scattering albedo of 0.42; and a high (50 millibar), thin (0.25 optical depth) haze of single- scattering albedo 0.97. Wagener and Caldwell [1988] next ex- amined the latitude dependence of the continuum absorption in IUE spectra and found the upper haze occurs higher in the polar atmosphere, somewhere in the 0-50 millibar region. These haze layers may be below the aurora but will affect any auroral light reflected from below. IUE spectra from 2000 to 2600 /1• were slightly red at high latitudes but slightly blue at the equa- tor. These reflection spectra are sufficiently grey that correct- ing for the effects of absorption on the small reflected compo- nent does not significantly alter the MUV spectrum.
UVS auroral spectra of Jupiter in the still-unexplored NUV (3500-4300/1•) on orbits C3 and C10 were made with Galileo in Jupiter's shadow. We are currently studying these data, along with NUV auroral data obtained at 90 ø phase on orbit E6. Fulxtre measurements are planned in the Galileo Europa Mis- sion. Initial work shows the off-axis scattered radiation prob- lem is more severe in the NUV because of the large solar flux. NUV spectra of electrons striking • gas are desirable because they have structure from allowed singlet state transitions to the B and C states, have a strong energy dependence from opti- cally forbidden excitation to the GK, H, and EF states, and may be even more diagnostic of the secondary electron distribution [James et al., this issue]. The Voyager camera imaged Jupiter's darkside aurora and found an intensity of -20 kR of emission, but the emission wavelengths were not determined [Cook et al., 1981]. More recently, the Galileo SSI [Belton et al., 1992] has been imaging Jupiter's nightside aurora with a charged coupled device (CCD) and a variety of narrowband interference filters and finds emissions in all filters, including the NUV, the visible, and the near infrared (A. Ingersoll, private com- munication, 1997). A Jupiter polar orbiter mission could make good use of a spectrometer with EUV, FUV, MUV, NUV, and visible capability for simultaneously identifying the darkside emissions in optically allowed and forbidden excitation proc- esses.
Acknowledgments. The UVS team would like to thank the Galileo flight team for making possib16 these unique ob- servations. This research was supported by the NASA/JPL Galileo Project. We acknowledge helpful discussions with Randy Gladstone, Andy Ingersoll, and John Clarke.
References
Ajello, J. M., and D. E. Shemansky, Electron excitation of the H2(a 3•g+ _> b 3Eu+ ) continuum in the vacuum ultraviolet, Astrophys. J., 407, 820-825, 1993.
Ajello, J. M., et al., Simple ultraviolet calibration source with reference spectra and its use with the Galileo orbiter ultra- violet spectrometer, Appl. Opt., 27, 890-914, 1988.
Ajello, J. M., G. K. James, B. O. Franklin, and D. E. Sheman- sky, Medium-resolution studies of extreme ultraviolet emis- sion from N2 by electron impact: Vibrational perturbations and cross sections of the C 4' l•u+ and b' l•u+ states, Phys. Rev. A, 40, 3524-3556, 1989.
Ajello, J. M., et al., Galileo orbiter ultraviolet observations of Jupiter aurora, J. Geophys. Res., this issue.
Belton, M. J. S., et al., The Galileo Solid State Imaging Ex- periment, Space Sci. Rev., 60, 413-455, 1992.
Bevington, P. R., Data Reduction and Error Analysis for the Physical Sciences, McGraw-Hill, New York, 1969.
Clarke, J. T., et al., Far-ultraviolet imaging of Jupiter's aurora and the Io "footprint", Science, 274,404-409, 1996.
Cook, A. F. II, A. V. Jones, and D. E. Shemansky, Visible aurora in Jupiter's atmosphere?, J. Geophys. Res., 86, 8793-8796, 1981.
Hendrix, A. R., The Galileo Ultraviolet Spectrometer: In-flight calibration and ultraviolet albedos of the moon, Gaspra, Ida, and Europa, Ph.D. thesis, Univ. of Colo., Boulder, 1996.
Hord, C. W., R. A. West, K. E. Simmons, D. L. Coffeen, M. Sato, A. L. Lane, and J. T. Bergstralh, Photometric observa- tions of Jupiter at 2400 angstroms, Science, 206, 956-959, 1979.
Hord, C. W., et al., Galileo Ultraviolet Spectrometer Experi- ment, Space Sci. Rev., 253, 1992.
Hord, C. W., et al., Direct observations of Comet Shoemaker-
Levy 9 fragment G impact by Galileo UVS, Geophys. Res. Lett., 22, 1565-1568, 1995.
James, G. K., J. M. Ajello, and W. R. Pryor, The MUV-visible spectrum of H 2 excited by electron impact, J. Geophys. Res., this issue.
Khakoo, M. A., and S. Trajmar, Electron-impact excitation of the a 3Zg+, B 1I;u+, c 3YI u, and C 1yI u states of H 2, Phys. Rev., 34, 146-156, 1986.
Liu, X., D. E. Shemansky, S. M. Ahmed, M. Ciocca, G. K. James, and J. M. Ajello, Electron impact cross sections of the Lyman and Werner band systems of hydrogen, Astro- phys. J., in press, 1998.
Opal, C. B., W. K. Peterson, and E. C. Beaty, Measurements of secondary-electron spectra produced by electron impact ionization of a number of simple gases, J. Chern. Phys., 55, 4100-4106, 1971.
Osterbrock, D. E., Astrophysics of Gaseous Nebulae, W. H. Freeman, New York, 1974.
Pryor, W. R., and C. W. Hord, A study of photopolarimeter system UV absorption data on Jupiter, Saturn, Uranus, and Neptune- Implications for auroral haze formation, Icarus, 91, 161-172, 1991.

20,158 PRYOR ET AL.: GALILEO UVS JUPITER AURORAL SPECTRUM 1600-3200 A
Rego, D., R. Prange, and J.-C. Gerard, Auroral Lyman-ot and H 2 bands from the giant planets, 1, Excitation by proton precipitation in the Jovian atmosphere, J. Geophys. Res., 99, 17,075-17,094, 1994.
Van Hoosier, M. E., J. F. Bartoe, G. E. Brueckner, and D. K. Prinz, Absolute solar irradiance 120 nm-400 nm, Astro-
phys. Lett., 27, 163-168, 1988. Wagenet, R., and J. Caldwell, Strong north/south asymmetry
in the Jovian stratosphere, Icarus, 74, 141-152, 1988. Wagenet, R., J. Caldwell, T. Owen, S.-J. Kim, T. Encrenaz, and
M. Combes, The Jovian stratosphere in the ultraviolet, Icarus, 63, 222-236, 1985.
Yung, Y. L., G. R. Gladstone, K. M. Chang, J. M. Ajello, and S. K. Srivastava, H 2 fluorescence spectrum from 1200 to
1700 J[ by electron impact: Laboratory study and applica- tion to Jovian aurora, Astrophys. J., 254, L65, 1982.
J.M. Ajello, G.K. James, and R.A. West, Jet Propulsion Laboratory, MS 183-601, 4800 Oak Grove Drive, Pasadena, CA 91109.
A.R. Hendrix, C.W. Hord, W.E. McClintock, D.A. Miller, W.R. Pryor, K.E. Simmons, and A.I.F. Stewart, Laboratory for Atmospheric and Space Physics, 1234 Innovation Drive, University of Colorado, Boulder, CO 80303-0590. (e-marl: wayne.pryo•lasp.colorado.edu)
D.E. Shemansky, Department of Aerospace Engineering, University of Southem Califomia, Los Angeles, CA 90089.
S.K. Stephens and W.K. Tobiska, FDC/Jet Propulsion Laboratory, MS 264-580, 4800 Oak Grove Drive, Pasadena, CA 91109.
(Received October 1, 1998; revised March 4, 1998; accepted March 6, 1998.)