gambling with our future? - fraser institute · higher percentage of social non-problem gamblers...
TRANSCRIPT

The Fraser Institute
Vancouver, British Columbia, Canada
2002
Fraser Institute Digital Publication
Gambling with Our Future?
The Costs and Benefits
of Legalized Gambling
Patrick Basham and Karen White

Gambling with Our Future? 2
Fraser Institute Digital PublicationFebruary 2002
Contents
Executive summary / 3
Introduction / 14
How prevalent is problem gambling? / 28
Social benefits and costs of gambling / 55
Economic benefits and costs of gambling / 68
Gambling on Indian reservations / 99
Regulation of internet gambling / 107
The case for privatizing gambling / 114
Individual freedom versus government paternalism / 122
Glossary / 126
References / 130
About the authors / 148
About this publication / 149
About The Fraser Institute / 150

Gambling with Our Future? 3
Fraser Institute Digital PublicationFebruary 2002
Executive summary
Heightened public awareness of, and participation in, gambling has sparked consid-erable debate about its economic viability and its overall effect on society. The fun-damental policy question addressed in this report is whether or not the benefits oflegalized gambling outweigh the costs? In addition to a socioeconomic analysis, thisreport discusses what the appropriate role of government should be in regard togambling. Currently, municipal, provincial, state, and federal governments in NorthAmerica perform a number of roles, including prohibitor, provider (sometimes mo-nopolistically), regulator, and educator. Finally, this report concludes by addressingthe important, yet commonly unspoken, issue of individual freedom, that is, theright to choose whether or not to gamble and on what terms, in the face of govern-ment’s increasingly paternalistic attitude.
In this report, we explicitly take a wide view, literally and figuratively, of the ramifi-cations of legalized gambling. We investigate legalized gambling in four countries:Canada, the United States, Australia, and the United Kingdom. The principal find-ings are the following.
Problem gambling is not very prevalent
Within the adult Canadian population, “life time” pathological gambling is esti-mated at 1.6 percent and problem gambling at 3.85 percent. Past-year prevalencewas estimated at 0.2 percent and 0.6 percent, respectively. In Canada, there is ahigher percentage of social non-problem gamblers than social non-problem drinkersand there is a far greater percentage of the population with a drinking problem thanwith a gambling problem.
In Australia, approximately 0.5 percent of the adult population has a severe gam-bling problem, while another 0.6 percent is described as “at risk” for gambling prob-lems. The recent American presidential commission report into the effects oflegalized gambling put to rest many of the myths propagated about gambling. Forexample, it is estimated that approximately 2.5 million adults (0.8 percent) are patho-logical gamblers and 3 million adults (1.3 percent) are problem gamblers.

Gambling with Our Future? 4
Fraser Institute Digital PublicationFebruary 2002
The number of compulsive gamblers in the United Kingdom is estimated at approx-imately one percent of the adult population. This is consistent with the estimatedprevalence of pathological gamblers in Canada, the United States, and Australia.
The social benefits of gambling
are underappreciated
Gambling may be considered a recreational outlet, similar to other entertainmentand leisure products and services. Those who participate in gambling activities doso voluntarily and, in return, receive intrinsic benefits from their consumption. Ifconsumers are gambling for entertainment purposes, they are purchasing gamblingjust as they would purchase cinema or symphony tickets. This may be considered arelatively harmless form of entertainment that provides a recreational outlet forparticipants.
Gambling may be exciting and socially engaging. For those who enjoy taking risks,the propensity for risk associated with gambling may be both stimulating and chal-lenging. For others, gambling is stimulating due to the challenge of estimating po-tential wins and losses, especially with sports betting and horse racing. Overall,people gamble for a variety of reasons, whether for a break from their daily lives, thethrill of the chase, or the challenge of beating the odds. Every individual gambles fordifferent reasons and will derive pleasure from the activity according to his or herown individual utility yardstick.
While most people tend to be risk-averse, there are those who are risk-preferringover certain income ranges, that is, they are willing to take a risk—to gamble—to in-crease their wealth. In other words, for those who choose to gamble, the small sumrisked for the expected return of a large sum of money is justified by the opportunityof financial gain that a person would not have otherwise had the opportunity to ob-tain. Unfortunately, most gambling critics discount the enjoyment derived fromgames of chance and, instead, consider the anticipated monetary returns from gam-bling to be the most important outcome.
Within the gambling arena, there are opportunities for gamblers to gain esteemboth in their own eyes and in the eyes of others, although they may be losingmoney. Through gambling, participants gain an opportunity to test their skill ingames of chance, and derive intrinsic pleasure from the thrill of the activity itself.One of gambling’s main attractions appears to be the entertainment value of theactivity involved.

Gambling with Our Future? 5
Fraser Institute Digital PublicationFebruary 2002
The social costs of gambling are overstated
Despite the relatively small number of cases of pathological gambling, there are so-cial costs attributable to those people who are unable to control their gambling be-haviours. The social costs of gambling may be defined more precisely within specificcultural contexts. In countries such as Australia, for example, a more tolerant atti-tude toward gambling may be reflected in a lower estimate of the social costs of gam-bling. In Canada, meanwhile, there has been comparatively little empirical researchconducted into the social costs of gambling and, as a result, most of the evidencefrom Canada is anecdotal in nature. In the United States, increased public awarenessabout the effects of gambling has resulted in a number of studies that attempt toquantify its social cost. Despite these efforts, research from the United States alsotends to be disproportionately qualitative in nature.
A social cost commonly attributed to gambling is that problem gamblers tend tohave higher levels of debt and declare bankruptcy at higher rates than non-problemgamblers and non-gamblers. However, claims by gambling opponents that bank-ruptcy is a by-product of gaming activities are unfounded. A rise in the number ofbankruptcy filings and increased gambling rates prompted the US Congress to in-vestigate the link between gambling and bankruptcy. The Treasury Department,charged with reporting on the issue, found a statistically insignificant relationshipbetween gambling and bankruptcy.
Australia tends to be at the forefront of gambling developments and gambling re-search. A 1995 study estimated the social costs of gambling (and pathological gam-bling in particular) to be considerably lower than the estimated social benefitsproduced by gambling.
The economic benefits of gambling
outweigh the economic costs
The most recent and comprehensive analysis of the economic costs and benefits oflegalized gambling in Canada found that the net economic benefit was equivalent to$3.044 billion in 1995, up from $526 million in 1990. Government revenue derivedfrom government-run lotteries, casinos, and VLTs increased from less than $100 mil-lion in 1970 to $1.3 billion by 1985, and reached a total of $6.8 billion in 1997. Between1992 and 1997 (table 35), total gambling revenues for provincial governments grewfrom $1.7 billion to $3.8 billion. Overall, the portion of revenue derived from gamingactivities also increased during this period.

Gambling with Our Future? 6
Fraser Institute Digital PublicationFebruary 2002
It is estimated that the Australian gambling industry generates an annual producers’surplus of approximately AUS$5 billion and contributes approximately $5.5 billionannual to the nation’s GDP. A recent American study demonstrates that gamblingimproves the overall socioeconomic health of the community in which the gamblingoccurs. The study concluded that the “casino effect” does not significantly increaseeither crime or bankruptcy. Casino proximity does, however, significantly increaseper capita casino spending, income, and employment. Additionally, the studyshowed a decrease in the percentage of the labour force unemployed, the number oftaxpayer dollars spent on welfare payments, and government transfer payments asa result of casino proximity. Furthermore, local economies with legalized gamblingexperienced growth in the construction trades, the hotel and hospitality industries,and the recreation and amusement sector.
A common misconception about gambling is the perceived association betweengambling facilities and the incidence of crime. In Canada, both the actual number offelonies committed in this area and the rate of such crime have historically been verylow but, in the early 1990s, the rate sank further, to record low levels. The sharp de-cline is related, at least in part, to the wider availability of legal gambling venuesthroughout the country.
One detailed analysis of the relationship between casinos and crime focused on tenAmerican jurisdictions that have commercial casinos. According to these research-ers, crime rates in Atlantic City have been in decline since 1982, despite a steady in-crease in gaming revenues. Meanwhile, despite a tremendous influx of tourists anda large population, Las Vegas has a lower crime rate and is safer than virtually everymajor American tourist venue. The evidence indicates that government regulation,in addition to facilitating the takeover of much of the industry by reputable privatecorporations, has eliminated organized crime from the direct ownership and opera-tion of the casinos.
There is no evidence that casinos in Australia bring about more per-capita streetcrime nor even that crime rates increase in the immediate vicinity of casinos. It isfound that the trend toward legalizing a greater variety of gambling activities andopening up the supply of gambling services to greater competition has probablyserved to nullify the crime and gambling link.
The British gambling industry is relatively crime-free and bettors, although offered nu-merous opportunities to break the law, generally do not. British gaming has enjoyed areputation for honesty since 1968, when the Gaming Board was granted autonomouscontrol over the gambling industry. One of the reasons that crime has been considereda direct consequence of gambling is that betting and gaming used to involve breaking

Gambling with Our Future? 7
Fraser Institute Digital PublicationFebruary 2002
the law. Today, just as no serious commentator would suggest that casino gaming inthe United States is directly associated with crime, there is great confidence that thecriminal element is minimized in the British gaming marketplace.
Gambling’s critics claim that those who experience problems with their gambling re-sort to criminal activities to finance their addiction. It is estimated that the arrests ofproblem and pathological gamblers (on an annualized, present-value basis) costgovernment US$960 and US$1,250, respectively. The estimated “lifetime” costs areapproximately US$10,500 for pathological and US$5,100 for problem gamblers. An-nual health-care expenditures increased by approximately US$750 per person forpathological gamblers. The estimated average cost of mental-health services pergambler (problem and pathological) is US$350 per year.
The cost of problem gambling is relatively small: about US$5 billion a year in legalfees for divorce, court, and jail costs for arrests, lost wages, and bankruptcy. Thatcompares with costs of US$72 billion for smoking, US$166 billion for alcohol abuse,and US$71 billion for motor-vehicle crashes.
Gambling benefits Indian Reservations
Most of the available research on Indian gambling is from the United States. Conse-quently, this section focuses exclusively on the American Indian gambling experi-ence. According to the National Research Council, “The recent institutionalization ofgambling appears to have benefited economically depressed communities in which itis offered” throughout the United States. One of the most striking examples has beenthe tremendous improvement in various social indicators on Indian reservations.
Before the establishment of legal Indian gambling, many tribes experienced desper-ate conditions. Poverty and unemployment rates of Indian American tribes were thehighest of any ethnic or racial group in the United States and per-capita income, ed-ucation levels, rates of home ownership, and other social indicators were among thelowest. The growth of Indian gambling has stimulated the reservations’ once stag-nant economies, improving the social well-being of many Indian tribes.
Revenues derived from gambling operations have allowed many tribes to make un-precedented improvements in economic and social health. Gambling revenues areused to support many tribal government services, including tribal courts, law en-forcement, fire protection, water, sewer, solid waste, roads, environmental health,land-use planning, and other social welfare programs. Indian gambling facilitiesprovide approximately 100,000 jobs for tribal members in areas where unemploy-ment rates often previously exceeded 50 percent of the adult population.

Gambling with Our Future? 8
Fraser Institute Digital PublicationFebruary 2002
Internet gambling should be regulated
rather than prohibited
Unlike its southern neighbour, Canada has taken a more passive approach to regu-lating the Internet gaming market. Currently, American opponents of gaming areaggressively seeking to prohibit Internet gambling. In Canada, legislators appear tobe waiting for the international gaming structure to be established before determin-ing the appropriate level of regulation. In terms of a prospective regulatory rolemodel, Australia has been both progressive and forward-looking in determining amore efficient market structure for Internet gambling. Australian regulators viewthe Internet gaming industry as merely another form of e-commerce that does notrequire prohibition.
Internet gambling sites offer a variety of gaming opportunities, including casino-style gaming such as blackjack, roulette, poker, and other traditional table games.Also available on the Internet are on-line casinos, lotteries, bongoes, and sports bet-ting. What distinguishes Internet gambling from more traditional forms of gamblingis the physical separation between the service provider and the consumer. It is esti-mated that there are 200 million people worldwide who now have access to the In-ternet. As such, the Internet offers these potential consumers convenient andinexpensive access to their favorite gaming sites, introducing competition into an in-dustry once dominated by highly restrictive licensing practices.
Opponents of on-line gambling share a concern that, because the Internet may beused anonymously, there is the potential for abuse of Internet gambling both bythose unable to control their gambling and by underage gamblers. Critics believethat the privacy provided gamblers by the Internet will exacerbate problem gam-bling and provide underage gamblers with the opportunity to use their parents’credit cards, or even their own, to set up Internet gambling accounts.
However, there are regulatory mechanisms that may be employed to ensure thatconsumers are protected and the gambling-related criminal element is minimized.For example, to prevent money laundering, the government should restrict theamount (or frequency) of cash deposits into players’ accounts, thereby limiting theopportunity for money laundering. Although there is concern about the legitimacyof all Internet gambling sites, most operate as legitimate businesses and, like anyreputable business, rely on a strong customer base to remain profitable. The neces-sity of maintaining a strong customer base will motivate service providers to offerlegitimate gambling sites.

Gambling with Our Future? 9
Fraser Institute Digital PublicationFebruary 2002
There is concern that the autonomy provided by the Internet may also encourageabuse of this form of gaming. Once again, sensible regulation may be the solution.For example, Australia has a number of jurisdictions where Internet gambling is le-gal. It would be difficult to open an account under the alias of another person's nameas it would require developing a false identity, along with supporting documentssuch as a passport and drivers license. Furthermore, restrictions on players’ identifi-cation and place of residence make it costly for someone to open an account under afalse name.
Prohibiting on-line gaming would be extremely difficult. Attempts to prohibit Inter-net gambling in industrialized countries have resulted in many Internet gamingsites being established in small nations with little or no government regulation.There are a number of arguably insurmountable challenges faced by governmentsthat endeavor to criminalize on-line gambling. There is a great degree of surveil-lance required to detect on-line illegality, and there are difficulties in locating, inves-tigating, and prosecuting on-line offenders. In addition, the technological andhuman capital required to locate offenders is substantial, as are the costs of prose-cution and incarceration.
Along with the inefficient use of resources caused by prohibition, there is the threatof unintentionally increasing the criminal element. Current estimates of market po-tential for this burgeoning industry show there is a demand for Internet gambling.The fact is that, if the marketplace demands Internet gambling, Internet gamblingwill be supplied with or without government consent. This is especially true givenservice providers' unrestrained access to overseas Internet sites in jurisdictions with-out Internet gambling restrictions. Furthermore, the inevitable failure of prohibitionis attributable to two factors: first, Internet technology renders prohibition futile—asan international network, the Internet provides an instant detour around domesticprohibition; and, second, consumer demand for Internet gambling and the govern-ment’s demand for tax revenues will create enormous pressure for legalization.
One of the primary benefits of allowing Internet gaming is that competition will beintroduced into a marketplace that is highly regulated and dominated by licensedproviders that monopolize the gaming market. Increased competition results in amore efficient allocation of resources as gaming providers attempt to maintain andattract new customers. This form of gaming also encourages private-sector busi-nesses to develop network capacity and commerce. Not only will this increased com-petition result in a wider range of gaming activities but consumers will have cheaperand easier access to these gaming activities.

Gambling with Our Future? 10
Fraser Institute Digital PublicationFebruary 2002
Gambling should be privatized
Currently, governments perform a number of distinct roles in the gambling industry.First, as a prohibitor, government may enforce gambling prohibition by vigorous po-licing or by enacting laws that make it illegal to gamble. Second, as a passive ob-server, government permits the operation of private social gambling withoutregulation or oversight. Finally, as a quasi-entrepreneur, government owns and op-erates gambling operations as public enterprises.
If gambling is legal, the industry should be in the hands of the private sector. In mostareas of economic activity, privatization leads to greater efficiency and the wideravailability of products and services. This is because private companies have strongincentives to provide better services at reasonable prices. If a private company is un-profitable or closes, the losses are shouldered entirely by the investors. Publiclyowned companies, on the other hand, have fewer incentives to provide reasonablypriced products because government-owned business ventures operate at taxpayerexpense. In other words, the government does not bear the risk of being unprofitableand closing; rather, the risk is shared between the government and taxpayers.
Our opposition to government-owned gambling operations centers around a lack ofconfidence in the ability of the government to remain objective when considering thepublic interest whilst serving as both the regulator and the principal beneficiary ofgambling activities. Government claims of objectivity in regulating the gambling in-dustry are questionable as the public’s demand for increased social spending pres-sures governments to spend more money without increasing personal income taxes.
In many jurisdictions, the government has granted itself a monopoly over the gam-bling marketplace. These government monopolies detract from the overall qualityof the gambling industry by limiting competition and maintaining artificially highprices (e.g., lower payout ratios). By limiting entrants to the marketplace, the mo-tivation to ensure a more efficient allocation of resources in order to attract newcustomers is essentially eliminated. Moreover, enterprises with diminished com-petition have attenuated incentives to offer an inexpensive range of diverse, qual-ity products.
In Canada, the government is both the regulator and beneficiary of gambling activ-ities. In today’s Canadian gambling marketplace, it is not uncommon to observegovernments that are directly involved in the promotion and organization of gam-ing activities. For example, lotteries in Canada are exclusively owned and operatedby government. Government control over the gambling industry is enforced by thelicensing of gaming venues, heavy taxation on gamblers, and a restriction on the

Gambling with Our Future? 11
Fraser Institute Digital PublicationFebruary 2002
number of gaming venues and the type of gaming opportunities provided to thepublic. Although the structure of the gambling industry varies among the prov-inces, gambling regulation is often designated to provincial gaming commissionsand similar regulatory bodies.
Lotteries are the most widespread form of gambling in Canada and the United Statesand are the only form of gambling that is a virtual government monopoly. In boththe United States and Canada, lotteries have become one of the most profitable gov-ernment-owned enterprises. There is an obvious irony surrounding the govern-ment’s awarding itself a complete monopoly over lotteries and becoming an activepromoter of lotteries, while simultaneously imposing a heavy “sin” tax on lottery-ticket purchases. By granting itself a monopoly over lotteries, the government oper-ates without competition. The absence of competition allows the government to ac-quire large monopoly rents, effectively generated by what may be considered anunreasonable consumption tax on lottery participants.
Private British gaming has been considered well regulated and fair since the estab-lishment of The Gaming Board for Great Britain in 1968. Although private or publiccompanies may run British casinos, there are no government-run casinos in Britain.The National Lottery is privately operated under a government-granted monopoly.Betting on sports, horse racing, and other forms of pari-mutuel racing is operated byprivate enterprises under strict government regulation.
In Australia, most of the gambling industry operates under some form of govern-ment-granted monopoly. Because the availability of gaming venues is limited bymonopoly rights, however, consumers have less access to gambling than would beavailable in a competitive market. In addition, government restrictions on the avail-ability of gaming machines reduce the benefit to consumers by limiting consumers’choice of venue.
The success of the gambling industry depends on a high standard of integrity andregulation. In our view, the government best achieves this goal by relinquishing itsmonopolistic control of the gambling industry, introducing competition among pri-vate enterprises, while maintaining operational controls through independent gov-ernment regulatory organizations. Abolishing the government monopoly andallowing businesses to enter and exit the marketplace freely will allow market forcesto determine the structure and size of the gambling marketplace, as opposed to thegovernment. Competition will ensure that consumer demand is met, that greatermarket efficiency results, and that the industry moves toward a more efficient levelof operation. Even if the government were to relinquish its monopoly, governmentscould still profit from the taxation of private gambling operations.

Gambling with Our Future? 12
Fraser Institute Digital PublicationFebruary 2002
A privatized company has more incentive to provide a variety of games and to in-crease the percentage of winners from lotteries to maintain a strong customer base.The success of the privatization of the sports-betting industry has been demon-strated in the United Kingdom. In the United States, on the other hand, sports wa-gering is illegal in all but two states. Sports wagering reached US$2.3 billion inNevada’s legalized sports books in fiscal 1998. However, estimates of the scope ofillegal sports gambling in the United States range from US$80 billion to US$380 bil-lion annually.
Privatizing the gambling industry and introducing competition will increase marketefficiency while satisfying consumer demand. Consumers will benefit from the elim-ination of government monopolies through increased competition and gamblingservice providers offering a greater diversity of quality products. Furthermore, byestablishing itself exclusively as a regulatory regime, the government will alleviatepublic concern regarding the controversial role of government as regulator and ben-eficiary of gambling operations.
Consumer freedom of choice is preferable
to government paternalism
This report concludes by addressing the most fundamental yet most frequently over-looked aspect of the gambling debate. Simply stated, should one have the right tochoose whether or not to gamble? The extent to which a person has the ability to be-have and to spend money as he or she pleases is an important determination of atruly free society. Even if a minority of people choose to engage in gambling activi-ties, the individual right to freedom of choice should be respected. We do not believethat the government should be in the business of either encouraging or discouraginggambling. If individuals choose to gamble, that is their choice. Furthermore, if indi-viduals and private organizations identify a demand for gambling and desire to pro-vide opportunities for gambling, that also should be their choice.
Consumers are the best judges of their own welfare. The evidence from four leadingindustrialized democracies is clear: most people who gamble do so willingly and ra-tionally and as a form of entertainment. Therefore, the small number of people whoare unable to control their gambling does not merit heavy-handed government in-tervention. Although there are socially harmful activities that require governmentintervention, gambling should not be considered one of those activities. Further-more, those who become addicted to gambling rarely threaten the overall harmonyof the community.

Gambling with Our Future? 13
Fraser Institute Digital PublicationFebruary 2002
Psychological risks are prevalent in a small number of individuals whose vulnera-bility to a variety of society’s stimulants is best handled through the treatment of bio-chemical imbalances, correction of faulty reasoning, and reinforcement ofinadequate means of coping with adversity rather than by banning every conceiv-able activity enjoyed by large numbers of low-risk people that might promote riskybehaviour in a few.
The implications for policy-makers are clear. Gambling prohibition is both unneces-sary and unworkable. As problem and pathological gamblers will seek out opportu-nities to gamble even when it is difficult to do so, banning gambling is not theanswer. The political and popular momentum behind legalized gambling reflects anongoing, and welcome, devolution in decision making over the past 20 years. Inpractice, this has meant a devolution of choices to the individual citizen that used tobe the exclusive domain of an elite group of social engineers. The fact that engagingin gambling activities harms certain individuals does not imply that no one shouldbe allowed to gamble. Gambling is about choice: people from all walks of life wantto enjoy their freedom and that includes the right to do what they want with theirown money. We trust that gambling prohibitionists will take note that, in addition tointruding upon gamblers’ liberties, prohibition makes a mockery of individual re-sponsibility. This is hardly the best way to sustain the nation’s moral health.

Gambling with Our Future? 14
Fraser Institute Digital PublicationFebruary 2002
Introduction
For as long as humans have gambled, there has been apprehension about excessiverisk-taking and intemperate gambling.
The National Research Council
Neither gambling nor opposition to gambling is a new phenomenon. From their re-spective philosophical vantage points, leftist critics have long viewed gambling asan economic albatross around the neck of the working classes while social conserva-tives continue to regard gambling as a moral disease whose painful symptomsspread poisonously throughout civil society.
1
In the mid-nineteenth century, asprominent a social commentator as Charles Dickens devoted a magazine article to acritique of gambling (Dickens 1852). A decade-and-a-half later, the great Russianwriter Fyodor Dostoyevsky penned the autobiographical novel,
The Gambler
(1866),which
grippingly described the psychology of problem gambling. In the modern era,the tone of the vast majority of media and cinematic examinations is little changedsince the release of the movie
The Gambler
, a 1974 portrayal of habitual gambling’sdisastrous effect upon the life of an otherwise sensible college professor. Such con-cern reflects gambling’s historical role as a popular leisure activity. Indeed, gamblingwas widespread in Ancient Rome (France 1902); it was enjoyed 3,000 years ago inEgypt and more than 5,000 years ago in China. However, what is new is our compar-ative ability to assess empirically the arguments both of those who claim that thecosts of gambling outweigh the benefits and of those who conclude that the cost-ben-efit imbalance runs in the opposite direction.
At the commencement of this research, our assumption was that legalized gamblingengenders both costs and benefits to the individual and to society. Therefore, the fun-damental policy question addressed in this report is whether or not the benefits oflegalized gambling outweigh the costs? Complicating such a cost-benefit analysis,however, is the fact that both the social and economic effects of gambling are inher-ently difficult to measure. This is especially true for many of the intangible social
[1] The views of Republican presidential candidate Gary Bauer (www.frc.org/radio/c97110.html) epitomize the position of social conservatives both in Canada and the United States.

Gambling with Our Future? 15
Fraser Institute Digital PublicationFebruary 2002
costs (e.g., the emotional pain experienced by family members of pathological gam-blers) and benefits (e.g., the entertainment value derived from gambling). In prepar-ing this report, our research encompassed a comprehensive review of the relevantsocial-science literature in order to identify and analyze those empirical studies thatshed the most light upon the nature and consequences of legalized gambling. Allow-ing for the difficulties in quantifying the intangible costs and benefits of gambling,this report provides as detailed a socioeconomic overview of the impact of gamblingas is empirically feasible.
Heightened public awareness of, and participation in, gambling has sparked consid-erable debate between opponents and proponents of gambling about both its eco-nomic viability and its overall effect on society. There are several factors that explainthe phenomenal growth of the gambling industry over recent decades. For example,productivity gains and increased disposable income have provided consumers withmore time for leisure and recreational activities. In addition, changing sociodemo-graphic characteristics (such as more dual-income households, more families withfewer children to support, members of the “Baby Boom” generation reaching theirpeak earning potential, and a more tolerant social attitude toward gambling) haveacted as stimulants to consumer spending on gambling activities.
To examine the social impact of gambling, we address several specific questions.For example, what are the impacts of gambling on the individual gambler and onthe family and the community in which the individual gambler lives? These im-pacts include marital problems, bankruptcies, as well as entertainment value. Re-garding economic costs and benefits, the approach is to quantify those costs andbenefits at the individual, regional, and national level. This involves assigningvalue to economic costs and benefits such as government revenue, employment, in-dustry multipliers, crime, and a number of other possible, ancillary effects of thegambling industry.
In addition to a socioeconomic analysis, this report discusses what the appropriaterole of government should be in regard to gambling. Currently, North American mu-nicipal, provincial, state, and federal governments perform a number of roles, in-cluding prohibitor, provider (sometimes monopolistically), regulator, and educator.Finally, this report concludes by addressing the important, yet commonly unspoken,issue of individual freedom— the right to choose whether or not to gamble, and onwhat terms—in the face of the increasingly paternalistic attitude of government.
Most analyses and commentaries on the subject of gambling are intentionally paro-chial in nature; that is, they focus exclusively on gambling’s impact upon a specificcommunity, region, or country. This is especially true both of the industry-sponsored

Gambling with Our Future? 16
Fraser Institute Digital PublicationFebruary 2002
studies that most loudly trumpet gambling’s benefits and of the most scathing jour-nalistic examinations (for a recent Canadian example of the latter, see Hutchinson1999). In this report, we explicitly take a much wider view, literally and figuratively,of the ramifications of legalized gambling. We investigate legalized gambling in fourcountries: Canada, the United States, Australia, and the United Kingdom.
Why did we examine three countries in addition to Canada? We chose the UnitedStates because so much of the most rigorous research material (especially regardinggambling on Indian reservations) pertains exclusively to that country’s experiencewith legalized gambling; and we chose the United Kingdom and Australia becausetheir respective experiences with legalized gambling are far deeper (e.g., Queen Eliza-beth I chartered the first English lottery in 1569) and more widespread than experiencein either Canada or the United States. In other words, both the United Kingdom andAustralia have travelled much farther down this policy road than has English-speak-ing North America (particularly much of Canada) and, therefore, it may be possible forus to assess more clearly the long-term costs and benefits of legalized gambling bycasting an analytical eye over developments in these two analogous societies.
Legalized gambling and
the gambling industry
For the purpose of this report, gambling is defined as, “The lawful placement of awager or bet on the outcome of a future uncertain event” (National Gambling ImpactStudy Commission [NGISC] 1999a]. Gambling has a number of characteristics otherthan risk-taking that distinguish it from activities such as investing in the stock mar-ket, which is not a comparable zero-sum game (see Johnson and Pazderka 1995).First, as a group, gamblers necessarily lose money as a result of this activity becausethe total “prize” consists of the accumulated stakes of gamblers, less the taxes paidto government and the profits garnered, and costs borne, by operators; second, gam-bling is typically presented as a form of entertainment; and, third, the gambling in-dustry involves those activities that people perceive as gambling or governmentstreat as gambling for regulatory and taxation purposes.
The most common forms of gambling include casino gaming (such as gaming ma-chines and table games), betting and wagering on racing and sporting events, lotter-ies, and similar forms of gambling such as keno and bingo. A term often usedinterchangeably with gambling is “gaming.” Gaming refers to all legal forms of gam-bling
other than racing
(e.g., lotteries, video lottery terminals [VLTs], casino gaming,pools and minor pools).
Gambling with Our Future? 17
Fraser Institute Digital PublicationFebruary 2002
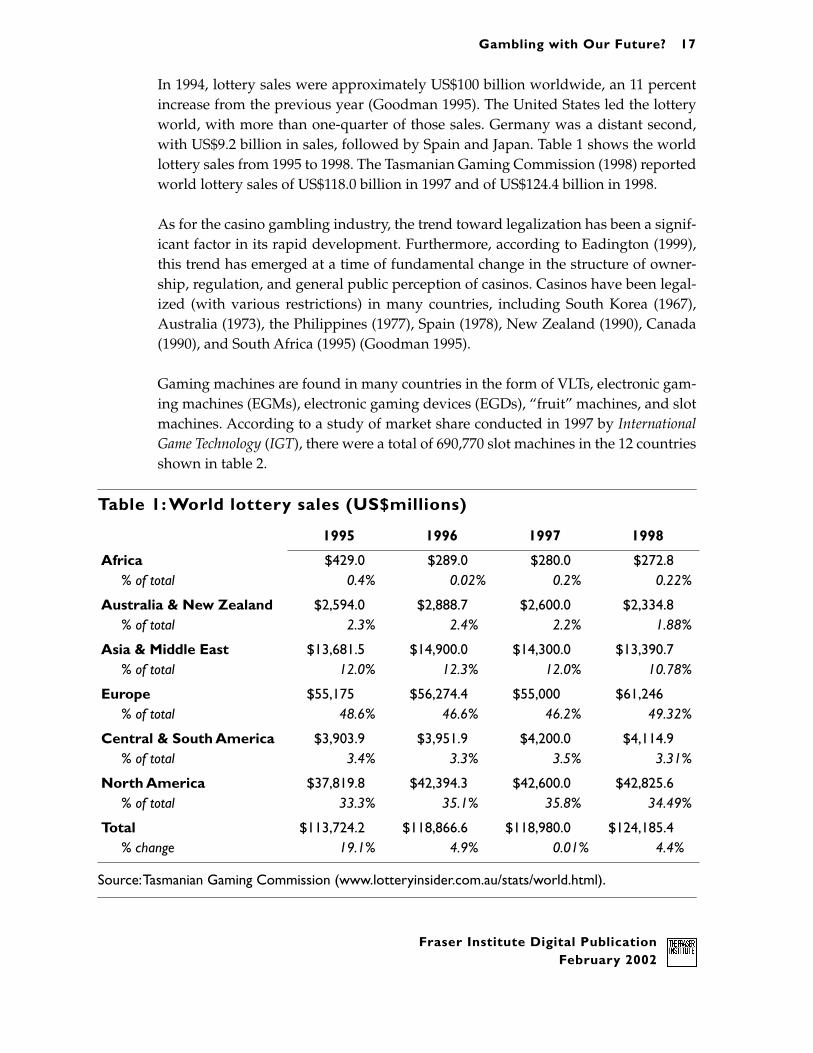
In 1994, lottery sales were approximately US$100 billion worldwide, an 11 percentincrease from the previous year (Goodman 1995). The United States led the lotteryworld, with more than one-quarter of those sales. Germany was a distant second,with US$9.2 billion in sales, followed by Spain and Japan. Table 1 shows the worldlottery sales from 1995 to 1998. The Tasmanian Gaming Commission (1998) reportedworld lottery sales of US$118.0 billion in 1997 and of US$124.4 billion in 1998.
As for the casino gambling industry, the trend toward legalization has been a signif-icant factor in its rapid development. Furthermore, according to Eadington (1999),this trend has emerged at a time of fundamental change in the structure of owner-ship, regulation, and general public perception of casinos. Casinos have been legal-ized (with various restrictions) in many countries, including South Korea (1967),Australia (1973), the Philippines (1977), Spain (1978), New Zealand (1990), Canada(1990), and South Africa (1995) (Goodman 1995).
Gaming machines are found in many countries in the form of VLTs, electronic gam-ing machines (EGMs), electronic gaming devices (EGDs), “fruit” machines, and slotmachines. According to a study of market share conducted in 1997 by
InternationalGame Technology
(
IGT
), there were a total of 690,770 slot machines in the 12 countriesshown in table 2.
Table 1: World lottery sales (US$millions)
Source: Tasmanian Gaming Commission (www.lotteryinsider.com.au/stats/world.html).
1995 1996 1997 1998
Africa
% of total
$429.0
0.4%
$289.0
0.02%
$280.0
0.2%
$272.8
0.22%
Australia & New Zealand
% of total
$2,594.0
2.3%
$2,888.7
2.4%
$2,600.0
2.2%
$2,334.8
1.88%
Asia & Middle East
% of total
$13,681.5
12.0%
$14,900.0
12.3%
$14,300.0
12.0%
$13,390.7
10.78%
Europe
% of total
$55,175
48.6%
$56,274.4
46.6%
$55,000
46.2%
$61,246
49.32%
Central & South America
% of total
$3,903.9
3.4%
$3,951.9
3.3%
$4,200.0
3.5%
$4,114.9
3.31%
North America
% of total
$37,819.8
33.3%
$42,394.3
35.1%
$42,600.0
35.8%
$42,825.6
34.49%
Total
% change
$113,724.2
19.1%
$118,866.6
4.9%
$118,980.0
0.01%
$124,185.4
4.4%

Gambling with Our Future? 18
Fraser Institute Digital PublicationFebruary 2002
Canada
Legal gambling has existed in Canada for over 25 years. “Before . . . 1969, Canadawas an illegal gambling society” (Vaillancourt and Roy 2000). In 1969, the CriminalCode was revised to permit the federal and provincial governments to regulate andparticipate in a range of lottery schemes; charities were also allowed to conduct andprofit from a similar, but narrower, range of activities (Marshall 1996). In Canada, ca-sino market organization varies among the provinces. In Quebec and Manitoba, ca-sinos are owned and operated by the provincial government. In other provinces,such as Ontario, casinos are owned and operated through joint ventures betweengovernment and private businesses.
State-run lotteries began during the late 1970s, when the federal government estab-lished “Lotto Canada” and the “Sports Pool Corporation.” However, provincial op-position to direct competition from federally run lotteries resulted in the federalgovernment relinquishing its involvement in lotteries as of January 1, 1980. In return,the provinces agreed to contribute to the federal government an annual payment of
Table 2: Number of slot machines by country (1997)
Source:
International Game Technology
Market Share Study.
Number of Slot Machines
United States
405,494
Canada
17,092
Caribbean
12,100
Central America
3,281
South America
23,097
Australia
130,227
New Zealand
12,174
Rest of Oceania
2,009
Asia
7,062
Europe
66,032
North Africa
830
Rest of Africa
11,372
Total
690,770

Gambling with Our Future? 19
Fraser Institute Digital PublicationFebruary 2002
$24 million (in 1979 dollars), adjusted for inflation, in perpetuity. In 1998, thisamount was $52.4 million. Table 3 shows payments from the provinces to the federalgovernment during 1997/1998.
Both provincial and territorial governments now offer a variety of lottery products,including traditional tickets (e.g., Lotto 6/49), instant-win tickets, and tickets basedon the outcome of sporting events. According to the provincial and regional lotterycorporations, gross sales of lottery tickets in 1998 fiscal year surpassed $2.6 billion(Marshall 2000).
Video lottery terminals (VLTs) were introduced into the Atlantic provinces in theearly 1990s, and quickly spread to other provinces. VLTs are now found in all prov-inces except British Columbia and Ontario, and have become a major source of gov-ernment revenue. VLTs are considered especially addictive and are often describedas the “crack cocaine of gambling” because particularly little skill or knowledge isrequired to play. Casinos have been established in Quebec, Ontario, Nova Scotia,Manitoba, and Saskatchewan. Charity casinos are permitted in British Columbia, Al-berta, and Ontario. Of the other forms of gambling, lotteries, bingo, and pari-mutuelgaming are available in all Canadian provinces. An estimated $20 billion to $27 bil-lion is wagered annually on all forms of legal gambling. Of that amount, $8.1 billionwas spent (after winnings were paid out) on government-run gambling in 1999, rep-resenting a nine-percent increase from 1998 and a 300-percent increase since 1992(Marshall 2000).
Table 3: Provincial gambling-related payments to the government of Canada
Source: Lottery Annual Reports 1997/1998.
Payments to the Government of Canada
British Columbia
$ 6,714,000
Alberta
$ 5,022,000
Saskatchewan
$ 1,788,248
Manitoba
$ 1,946,873
Ontario
$36,558,000
Quebec
$12,999,000
Atlantic Provinces
$3,601,000

Gambling with Our Future? 20
Fraser Institute Digital PublicationFebruary 2002
As shown in table 4, there are a number of restrictions placed on the availability andlocation of VLTs. In provinces where VLTs are permitted, premises that are licensedor restricted to those a over certain age are the only locations providing public accessto gaming machines. This ensures that minors do not have access to VLTs. Interest-ingly, until a few years ago, VLTs were available in corner stores and local shopsthroughout Nova Scotia and New Brunswick. VLTs are further restricted in the prov-inces of Alberta, Saskatchewan, Manitoba, and Prince Edward Island, which havecapped the number of these machines that may be introduced.
Horse racing is regulated and managed by the Canadian PariMutuel Agency. Unlikeother forms of gaming in Canada, provincial revenues from racing taxation are notearmarked for spending on charitable causes. Instead, profits are returned to the in-dustry for breeding programs and the overall improvement of the industry.
Casinos moved to the forefront of the gambling industry in the early 1990s. Prior tothe establishment of government-owned monopoly casinos in Winnipeg, Halifax,Montreal, Windsor, Hull, and Regina, casinos were limited to “charity casinos,”which were solely permitted to raise revenue for “good causes.” These were predom-inately located in Canada’s western provinces (Alberta, Manitoba, and British
Table 4: Availability and access to VLTs in Canadian provinces (as of March 31, 1998)
Sources: Provincial Lottery Commissions.
Number Per Adult Restrictions
British Columbia N/A N/A N/A
Alberta 5,900 1/355 numbers capped, licensed premises
Saskatchewan 3,340 1/223 numbers capped, licensed premises
Manitoba 4,800 1/177 numbers capped, age-restricted premises
Ontario N/A N/A N/A
Quebec 15,266 1/376 licensed premises
New Brunswick 3,719 1/158 licensed (as of 2000)
Nova Scotia 3,533 1/206 age-restricted premises
Prince Edward Island 339 1/302 numbers capped, licensed premises
Newfoundland 2,373 1/181 age-restricted premises

Gambling with Our Future? 21
Fraser Institute Digital PublicationFebruary 2002
Columbia). In addition, so-called “destination casinos” have been established in Nia-gara Falls, Ontario, Charlevoix, Quebec, and Sydney, Nova Scotia (Eadington 1999).
In 1998, 77 percent of Canadian households reported spending money on at least oneform of gambling (Marshall 2000). These households spent an average of $460. Of allforms of gambling, Canadians most favour government-run lotteries. In 1996,households were asked to report their spending among four types of gambling ac-tivity: government lotteries were the most popular (68 percent), ahead of non-gov-ernment lotteries and raffles (34 percent), casinos and slot machines (20 percent), andbingos (10 percent) (Marshall 2000). By 1999, legal gambling supported the operationof 21,000 slot machines, 38,000 VLTs, 20,000 annual bingo events, 50 casinos, and 44horse-racing tracks in Canada (Azmier 2000).
United StatesGambling is as American as the state lotteries that helped fund the Revolution andmany public works projects in the young Republic.
George F. Will, Runnin’, Gunnin’ and Gambling, The Washington Post
Both the size and the growth of the American gambling industry are unsurprisinggiven that, “Gambling in America has deep cultural roots” (National ResearchCouncil 1999: 1). After all, colonial America featured both government and privatelotteries (Ezell 1960). The Reconstruction era after the American Civil War usheredin a second era of gambling, when lottery revenues (i.e., voluntary taxation) wereused to rebuild the Southern states (Ezell 1960). The second era of American gam-bling ended in 1890, when a Louisiana state-lottery scandal prompted federal legis-lation prohibiting both state lotteries and most other forms of gambling (Ezell 1960).The third era of American gambling did not begin until the 1930s, first in Nevada(1931), and involved pari-mutuel race-track betting in 21 states but did not include astate lottery until New Hampshire initiated one in 1964 (Rose 1986, 1995).
In 1976, Americans legally bet US$17.3 billion. By 1997, Americans were betting overUS$630 billion (Will 2000). In terms of spending, gambling is more popular in Amer-ica than baseball, going to the movies, and Disneyland combined (O’Brien 1998). In1973, lotteries were found in just seven states and had total sales of only US$2 billion;in 1997, lotteries earned US$34 billion in sales. According to a recent survey, 32 per-cent of American households gambled at a casino in 1996. Those who did averaged4.8 visits, for a total of 176 million visits (Calvert 1999a: 2). Overall, more than 80 per-cent of American adults now report having gambled sometime during their lifetime.
There are 47 American states that allow one or more forms of legalized gambling; theonly exceptions are Hawaii, Tennessee, and Utah. Pari-mutuel racetracks are the

Gambling with Our Future? 22
Fraser Institute Digital PublicationFebruary 2002
most prevalent form of gambling and are now legal in over 40 states. Lotteries havebeen established in 37 states, as well as the District of Columbia. As of 1999, 21 statesallowed either casinos or casino-style games to operate. Nevada and New Jersey le-galized casino gaming in 1931 and 1976, respectively. Jurisdictions that have legal-ized casino gaming since 1989 include Colorado, Illinois, Iowa, Louisiana, Iowa,Louisiana, Mississippi, Missouri, and South Dakota.
In most states, gaming was legalized as a result of successful referendum campaigns.Although all levels of government are responsible for gambling regulation, casinoregulation is determined by individual states. Therefore, casino gambling regulationvaries among the individual states. For example, Nevada determines the structureof the industry based on market forces. Conversely, New Jersey has not permittedthe expansion of casino gambling and operates its casinos under strict regulation.
Today, there are 49 greyhound tracks operating in 15 states. Greyhound racing is re-sponsible for approximately 14 percent of the total revenues from pari-mutuel bet-ting. In 1996, the gross amount wagered in the greyhound industry totaled US$2.3billion. The industry accounts for approximately 30,000 jobs directly related to theoperation of the racetracks and other agriculture operations (NGISC 1999a: 2-11). At-tendance at greyhound racing (table 5) has increased significantly since its inceptionin the 1950s but, as of 1990, attracted a smaller number of attendees than horse racingand other sporting events.
Table 5: Attendance at selected sports in the United States, 1940 to 1990 (000s).
Notes: Horse racing in 1940 and in 1945 excludes harness racing and quarter horses; these are in-cluded in subsequent years.
Sources: US Department of Commerce, Bureau of Census (1960). Historical Statistics from ColonialTimes to 1957. Washington, DC: 255. US Department of Commerce, Bureau of Census (1977). SocialIndicators 1976. Washington, DC. US Department of Commerce, Bureau of Census (1992). StatisticalAbstract of the US. Washington, DC: 239.
1940 1945 1950 1960 1970 1980 1990
Horse racing 8,500 18,900 29,291 46,879 67,704 74,690 63,803
Greyhounds — — 6,083 7,924 12,660 20,874 28,660
Baseball — — 17,463 19,911 28,747 43,746 55,509
Football (NFL) — — 2,115 4,153 9,991 14,092 17,666

Gambling with Our Future? 23
Fraser Institute Digital PublicationFebruary 2002
The horse-racing industry is the largest sector within pari-mutuel gaming. Wageringon horse racing is legal in 43 states, generating annual gross revenues of approxi-mately $3.25 billion. Although there are over 150 operational racetracks, most wager-ing takes place via satellite broadcasting, allowing wagering on races occurringelsewhere or at Off-Track Betting sites (OTBs). An estimated $550 million was wa-gered in 1998.
Modern riverboat casinos began operating in Iowa in 1991; by 1998, there were over40 riverboat casinos operating in Illinois, Indiana, Missouri, and Iowa, and approxi-mately 50 riverboat and dockside casinos in Louisiana and Mississippi. In 1997, rev-enues from riverboats totaled $6.1 billion (NGISC 1999a).
Currently, electronic gaming devices (EGDs) are found in seven states. Many stateslimit the number of gaming machines permitted within a gaming venue. In Nevada,for example, venues with non-casino gambling licenses may operate a maximum of15 machines (Productivity Commission 1999a). Other states limit the amounts ofmoney and prizes paid to players. Taxation requirements also vary between thestates. For example, in South Dakota, the state government receives 49.5 percent ofgaming-machine profits while in Oregon the state government owns the machinesoutright and receives 66 percent of gaming-machine profits. Table 6 shows the num-ber of gaming machines available throughout the United States.
Table 6: Availability of electronic gaming devices (EGDs) in the United States
Source: NGISC 1999a: 2–4.
Reported number of machines Year
Louisiana 15,000 1999
Montana 17,397 1998/1999
Nevada 17,922 1999
New Mexico 6,300 1999
Oregon 8,848 1999
Southern California 34,000 1999
South Dakota 8,000 1988
Gambling with Our Future? 24
Fraser Institute Digital PublicationFebruary 2002
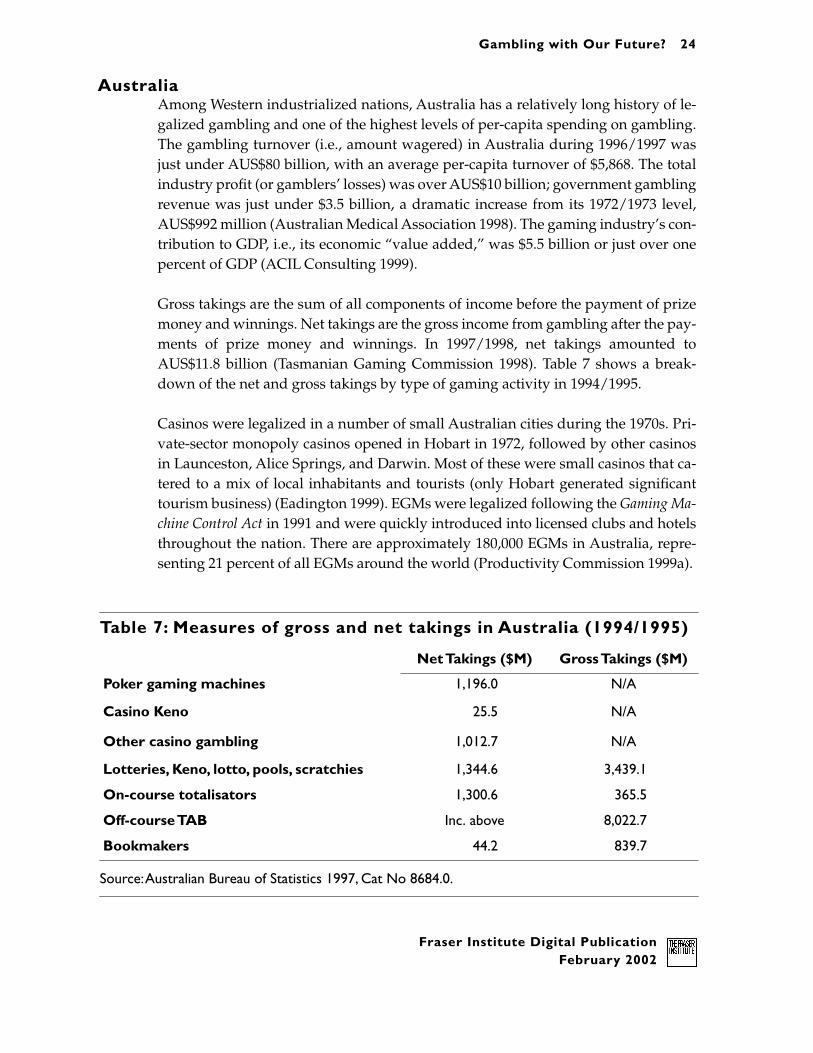
AustraliaAmong Western industrialized nations, Australia has a relatively long history of le-galized gambling and one of the highest levels of per-capita spending on gambling.The gambling turnover (i.e., amount wagered) in Australia during 1996/1997 wasjust under AUS$80 billion, with an average per-capita turnover of $5,868. The totalindustry profit (or gamblers’ losses) was over AUS$10 billion; government gamblingrevenue was just under $3.5 billion, a dramatic increase from its 1972/1973 level,AUS$992 million (Australian Medical Association 1998). The gaming industry’s con-tribution to GDP, i.e., its economic “value added,” was $5.5 billion or just over onepercent of GDP (ACIL Consulting 1999).
Gross takings are the sum of all components of income before the payment of prizemoney and winnings. Net takings are the gross income from gambling after the pay-ments of prize money and winnings. In 1997/1998, net takings amounted toAUS$11.8 billion (Tasmanian Gaming Commission 1998). Table 7 shows a break-down of the net and gross takings by type of gaming activity in 1994/1995.
Casinos were legalized in a number of small Australian cities during the 1970s. Pri-vate-sector monopoly casinos opened in Hobart in 1972, followed by other casinosin Launceston, Alice Springs, and Darwin. Most of these were small casinos that ca-tered to a mix of local inhabitants and tourists (only Hobart generated significanttourism business) (Eadington 1999). EGMs were legalized following the Gaming Ma-chine Control Act in 1991 and were quickly introduced into licensed clubs and hotelsthroughout the nation. There are approximately 180,000 EGMs in Australia, repre-senting 21 percent of all EGMs around the world (Productivity Commission 1999a).
Table 7: Measures of gross and net takings in Australia (1994/1995)
Source: Australian Bureau of Statistics 1997, Cat No 8684.0.
Net Takings ($M) Gross Takings ($M)
Poker gaming machines 1,196.0 N/A
Casino Keno 25.5 N/A
Other casino gambling 1,012.7 N/A
Lotteries, Keno, lotto, pools, scratchies 1,344.6 3,439.1
On-course totalisators 1,300.6 365.5
Off-course TAB Inc. above 8,022.7
Bookmakers 44.2 839.7

Gambling with Our Future? 25
Fraser Institute Digital PublicationFebruary 2002
Similar to other jurisdictions, Australia has imposed a number of restrictions on theoperation of gaming machines. For example, the state government of Queensland li-censes gaming venues, limiting the number of machines available on-site to a maxi-mum of 300. In addition, operators are required to return to players 92 percent of themoney wagered in machines.
Australian consumers prefer lotteries (51 percent), instant lotteries (47 percent), andgaming machines (30 percent). Table 8 shows the frequency of gambling by specificforms in the state of New South Wales, where lotteries, slot machines, and off-coursebetting have been available for at least 10 years.
United KingdomAccording to Copps (1999), gambling in Britain is a £7 billion-a-year industry thatgenerates approximately £400 million a year in tax revenue for government. Further-more, the nine-percent fee levied by bookmakers provides an additional £54 millionthat is returned to the horse-racing industry.
The United Kingdom’s Lotteries and Amusements Act of 1976 stipulates that no morethan 50 percent of proceeds from lotteries may be used for prizes, and that no morethan 25 percent of proceeds may be taken for expenses, ensuring that at least 25 per-cent of lottery proceeds go to “good causes.” British political culture contains anaversion to raising government revenues from gambling activities. Consequently,British gaming laws are not intended to provide new tax revenues. Rather, the pri-mary purpose of the legislation is to control the types and amount of gambling in theattempt to reduce any harmful social side-effects (Beare and Hampton 1984).
Table 8: Frequency of gambling (lottery, slot machines, horse racing) of adults in New South Wales (%)
Source: Adapted from Caldwell et al. 1998.
Played lottery Played slots Bet on horse racing
Once per month 8.5 9.8 4.0
2 to 3 times per month 7.9 10.5 2.3
4 times per month 19.2 3.3 0.9
More than 4 times per month 3.4 3.7 1.7
Total 39.2 27.7 9.2

Gambling with Our Future? 26
Fraser Institute Digital PublicationFebruary 2002
The National Lottery Commission is responsible for the regulation of the NationalLottery. Camelot, a consortium of four private companies, was awarded a monopolylicense to operate the National Lottery between 1994 and 2001. According to the Pro-ductivity Commission (1999a), 50 percent of revenues are awarded in prizes, 28 per-cent are contributed to good causes (i.e., arts, sports, charities, heritage, celebratingthe millennium, health, education, and the environment), 13 percent are paid in tax,five percent go to retailers of lottery tickets, three percent cover Camelot’s operatingexpenses, and one percent constitutes Camelot’s profit. Table 9 shows the lotterysales and number of lotteries available in England, Wales, and Scotland.
Two areas in which the British gaming industry varies greatly from the Canadian,American, and Australian gaming industries is in its regulation of casinos and fruitmachines (known as VLTs in Canada, EGDs in the United States and EGMs in Aus-tralia). Unlike other jurisdictions, slot machines are legally available to children inthe United Kingdom. With the exception of premises where a voluntary code re-stricting access to those under16 years of age is effectively enforced, fruit machinesare played by children in amusement arcades, cafés, fish-and-chip shops, and (albeitillegally) pubs. Fruit machines in the United Kingdom are pre-set to pay out a spec-ified percentage (usually between 70 and 80 percent) of the money they take so that,in the long run, the machine cannot lose (Fisher 1993).
Government regulation ensures that British casinos cater to so-called “unstimulateddemand.” In other words, if one wishes to gamble in a casino, one must be a member
Table 9: Lotteries in Britain (England, Wales and Scotland), 1977 to 19911
Notes: [1] Includes only lotteries registered with the Gaming Board; [2] Peak year for local authorities’lottery numbers and turnover; [3] Peak year for charitable lotteries.
Local Authorities Charitable Societies
Numbers Sales (m.) Numbers Sales (m.)
1977/1978 1,202 9.29 1,297 9.59
1978/19792 4,812 31.95 8,319 59.76
1979/19803 3,000 18.52 9,174 65.41
1982 1,186 7.59 4,730 44.92
1985 5,98 4.42 1,574 20.61
1990/1991 1,48 2.02 8,55 25.46

Gambling with Our Future? 27
Fraser Institute Digital PublicationFebruary 2002
of the casino or a member’s guest. To become a member, one has to find a casino club,which may prove difficult given that casino clubs are not permitted to advertise oreven to publish their telephone numbers in the Yellow Pages™. To join a casino club,one must apply in person and allow 48 hours to elapse before playing. Other restric-tions are that one not be able to use a credit card or drink alcohol at the gaming table,while the casino is not allowed to provide live entertainment for its customers.
In comparison to the North American and Australian casino industries, the Britishcasino industry is quite small (Eadington 1999). In 1997/1998, there were 115 casinosoperating in the United Kingdom (approximately the same number found in the1970s). Gross gaming winnings were about £490 million (US$800 million), of which65 percent came from London-based casinos (Gaming Board 1998, cited in Eadington1999). According to Christiansen (1998), gross casino gaming revenues made upseven percent of legal gaming revenues; this compares to 50 percent generated byAmerican casinos (Eadington 1999).
In 1995/1996, gaming machines represented approximately 38 percent of the Britishgaming market, with 210,000 fruit machines and 45,000 jackpot machines. As theyare in the countries previously discussed, gaming machines are strictly regulated,with limits on numbers, stakes, and prizes. In accordance with The Betting and Gam-ing and Lotteries Act, 1963, the Horserace Betting Levy Board collects a levy frombookmakers on the turn-over from off-course betting on horse racing and from theTotalisator (Productivity Commission 1999a). The revenue generated by these fundsis used to improve horse breeds, advance veterinary education, and further the over-all improvement of the horse-racing industry. Table 10 shows the betting levy raisedfrom bookmakers and the Totalisator by the Horse Racing Betting Levy Board.
Table 10: Betting levy raised by the Horserace Betting Levy Board from 1962 to 1991 (in millions of pounds, current prices)
Source: Horseracing Betting Levy Board, Annual Reports.
Bookmakers Totalisator
1962/1963 0.9 0.9
1966/1967 2.3 0.7
1971/1972 5.0 0.0
1975/1976 8.1 0.2
1981/1982 16.9 1.0
1985/1986 20.0 1.0
1990/1991 35.9 1.1

Gambling with Our Future? 28
Fraser Institute Digital PublicationFebruary 2002
How prevalent is problem gambling?
As supporters and opponents of gambling contend for public support, the polarityof views surrounding the issue of gambling will influence public opinion about thebenefits or negative impacts attributable to gambling. As such, societal attitudes alsomay be influenced by the manner in which problem gambling is defined and pre-sented to the public. Hence, an overestimation of the prevalence of problem andpathological gambling would hinder policy makers attempting to address the issueof problem gambling, while the inflation or underestimation of the number of casesof problem and pathological gamblers makes it difficult to estimate the overall costsof gambling to society as a whole.
The most widely used and recognized method of measuring the prevalence of prob-lem and pathological gambling is the South Oaks Gambling Screen (SOGS). SOGSidentifies three distinct groups of gamblers:
(1) non-problem gamblers—those who gamble and do not experience adverseeffects;
(2) potential problem gamblers—those who gamble heavily, are not fully ad-dicted to gambling, but have experienced problems with gambling; and
(3) probable pathological gamblers—those who are addicted to gambling andare unable to stop gambling despite harmful effects to their personal life,job, or family.
The measurement problem
SOGS was developed as a “convenient screen (for) clinical populations of alcoholicsand drug abusers, as well as general populations, for pathological gambling” (Le-sieur and Blume 1987). It has been used in population-based research in the UnitedStates, Canada, Asia, and Europe, making it one of the most commonly used mea-surement tools for assessing the existence of problem gamblers. The advantage of us-ing SOGS as a standardized measurement tool is that the prevalence of problemgambling may be compared across different regions and countries.

Gambling with Our Future? 29
Fraser Institute Digital PublicationFebruary 2002
SOGS identifies respondents without gambling problems, and those who are poten-tial problem gamblers, or probable pathological gamblers both over their lifetimesand over the previous year. As determined by SOGS, lifetime problem gamblers arethose who score three or four points on the lifetime SOGS survey and lifetime prob-able pathological gamblers are those who score five or more points. Current problemgamblers are those who score three or four points on the past-year SOGS items andcurrent probable pathological gamblers are those respondents who score five ormore points on the past-year SOGS items.
The essential features of pathological gambling, as described by the American Psy-chiatric Association, are a continuous or periodic loss of control over gambling, aprogression in gambling frequency and amounts wagered with gambling and in ob-taining monies with which to gamble, and a continuation of gambling involvementdespite adverse consequences (Volberg 1997). Furthermore, behaviours exhibited bypathological gamblers may include the following:
♦ an occupation with gambling ♦ spending large quantities of money to achieve elevated levels of excitement ♦ repeated unsuccessful efforts to control, cut down, or stop gambling ♦ using gambling to escape from personal problems♦ chasing losses (i.e., continuing to gamble in hopes of recouping past losses)♦ lying to conceal involvement in gambling♦ participating in illegal acts to finance gambling♦ jeopardizing job, education, or career opportunities to gamble ♦ depending on others for financial resources to alleviate desperate financial
situations caused by gambling.In examining SOGS as a measurement tool, Sterling Research Associates declared:
Our concern is that statistics are only estimates of the true value in the pop-ulation, and the statistic for any given prevalence study tends to be small.When combined with the margin of error, the resulting confidence intervalmay not be overly meaningful for policy treatment decisions. Additionally,the small numbers of people picked up in these studies may give rise to ex-ceptional fallacies. That is, inferences made about the entire population—in this case, people who have problems with their gambling—may not holdtrue because of the small number of cases they are based on. (Sterling Re-search Associates 1998a: 27)
In other words, the small sample sizes used in SOGS to diagnose the prevalence ofproblem and pathological gambling may not be an accurate measure of the preva-lence of problem gamblers within the entire population.

Gambling with Our Future? 30
Fraser Institute Digital PublicationFebruary 2002
AustraliaAccording to the Australian Medical Association (1998), approximately 0.5 percentof the adult Australian population has a severe gambling problem, while another 0.6percent are described as “at risk” for gambling problems. Alternatively, Dickerson,Allcock, Blaszczynski, Maddern, Nicholls, and Williams (1998) found that, based onthe SOGS criteria, 0.45 percent of the adult population are “problem gamblers” and0.85 percent of the adult population are “at risk” of developing gambling-relatedproblems.
The criteria by which SOGS identifies problem and pathological gamblers has alsobeen criticized. In countries such as Australia, where gambling has been an acceptedform of recreation for many years, criteria such as the preoccupation with, or expo-sure to, gambling are not sufficient to diagnose problem and pathological gamblers.According to Dickerson and Baron (1998), SOGS, when used in a survey of the gen-eral population, is likely to overestimate the number of cases of problem gamblingby a factor of five.
Culturally, Australians are more tolerant of gambling and, therefore, less likely toview gambling as an immoral activity than are many other societies. However, de-spite gambling’s widespread acceptance throughout Australia, there are groups,such as the Inter-Church Gambling Task Force, that argue that, if one accepts that onepercent of the population has a problem with gambling, and each problem gamblerpotentially affects seven other people, one is dealing with a significant problem innumerical terms. It is, therefore, important to note that the one percent estimate isbased partly on some heavily qualified SOGS-based studies and partly on anecdotalevidence (ACIL Consulting 1999). Chambers and Schrans (1998) assert that many ofthe items used in SOGS could be measuring an individual’s sensitivity to society’sreaction to gambling rather than the act of gambling itself.
CanadaOne of the debates surrounding the determination of the prevalence of problem andpathological gambling is how these numbers are presented to policy makers andthe public at large. For those who seek to prohibit, or to enforce strict regulation of,gambling, demonstrating that a large number of people are adversely affected bygambling justifies its condemnation. Conversely, those who support the freedom togamble argue that because gambling affects so few people negatively, those whohave a problem with gambling require treatment while the activity itself should beleft intact for recreational gamblers. As Canadian researchers Chambers andSchrans wrote:

Gambling with Our Future? 31
Fraser Institute Digital PublicationFebruary 2002
Stating that two percent of the population has “problems with their gam-bling” is a blade with two edges. Advocates can use information to increaseinterest in the issue, as well as generate sources of funding for research andtreatment. Conversely, others could argue the problem is too small to beconcerned about, especially given the magnitude of other social problemsaffecting society. (Chambers and Schrans 1998)
A study conducted by Dr. Howard Shaffer of Harvard Medical School identifiedthree levels of gamblers in Canada and the United States:
(1) the proportion of the population that does not experience problem gam-bling—this includes both “non-problem” gamblers and non-gamblers;
(2) gamblers with sub-clinical levels of problem gambling, e.g., those consid-ered “at-risk,” “in transition,” or “potential pathological”;
(3) the most severe category of disordered gambling, often referred to aspathological gambling.
Tables 11 through 13 identify the prevalence of level-1, level-2, and level-3 lifetimeand past-year disordered gamblers in Canada in 1997. Within the adult population,lifetime level 3 (or probable pathological) was estimated at 1.6 percent, and level 2(or problem gambler) was 3.85 percent. In 1998, past-year prevalence was estimatedat 0.3 percent for level 3 and 0.6 percent for level 2.
There have been a number of studies conducted by individual provinces to estimatethe prevalence of gambling problems within their respective borders. Baseline Mar-ket Research Ltd. (1996a) used SOGS to determine that, in 1993, the lifetime preva-lence of problem gamblers in the adult population of Nova Scotia was 4.8 percent.In 1996, using the same screen, 5.5 percent were classified as lifetime problem gam-blers. Other study findings showed that approximately four percent of NovaScotians have never participated in any gaming activity in their lifetime, eight per-cent have not participated in any gaming in the past year (including four percentthat have never gambled), and 44 percent of the overall population participates inat least one gambling activity on a regular weekly basis. Ferris, Stirpe, and Ialomite-anu (1996) used SOGS to conclude that 80 percent of Ontarians have no gamblingproblems, about 17 percent have between one and two problems, about two percenthave between three and four problems and may be considered “problem” or “po-tential pathological” gamblers, and that two percent meet the criteria for likelypathological gamblers.
A study by the Alberta Alcohol and Drug Abuse Commission (1999a) of 1,803 adultAlbertans showed that 87.6 percent gamble responsibly, seven percent do not gam-ble at all, four percent experience problems with gambling, and 1.4 percent would be

Gambling with Our Future? 32
Fraser Institute Digital PublicationFebruary 2002
Table 11: Prevalence of lifetime level-3 gambling in Canada
Note: The estimated percentage is the mean of the 95 percent confidence interval.
Source: Shaffer, Hall, and Vander Bilt 1997: iii–iv.
Table 12: Prevalence of lifetime level-2 gambling
Note: The estimated percentage is the mean of the 95 percent confidence interval.
Source: Shaffer, Hall, and Vander Bilt 1997: iii–iv.
Table 13: Estimated number of past-year disordered gamblers in Canada (%)
Note: The estimated percentage is the mean of the 95 percent confidence interval.
Source: Shaffer, Hall, and Vander Bilt 1997: 51; www.statcan.ca/english/Pgdb/People/Popula-tion/demo10a.htm .
Adults in general population 1.6%
Youth in the general population 3.88%
College students 4.67%
Adults in treatment 14.23%
Adults in the general population 3.85%
Youth in the general population 9.45%
College students 9.28%
Adults in treatment 15.01%
Adolescents Adults Both
Level 3 0.2% 0.3% 0.5%
Level 2 0.6% 0.6% 1.2%
Combined 0.8% 0.9% 1.7%

Gambling with Our Future? 33
Fraser Institute Digital PublicationFebruary 2002
considered probable pathological gamblers. Of a sample of 972 adolescent Albertans(12 to 17 years old), 33 percent were non-gamblers, 44 percent were non-problemgamblers, 15 percent were considered to be “at risk,” and eight percent were consid-ered problem gamblers.
Another area of interest is the relationship between problem gambling and addic-tions to other activities such as drinking alcohol and taking drugs. Studies havefound that up to half of those in treatment for problem gambling may also have asubstance-abuse problem. Thus, some individuals may require treatment for sub-stance abuse and problem gambling either singularly or concurrently. Table 14shows the prevalence of problem drinkers and problem gamblers in the adult popu-lation of Alberta. It shows that there is a higher percentage of social non-problemgamblers than social non-problem drinkers and that there is a greater percentage ofthe population with a drinking problem than with a gambling problem (15 percentto five percent).
United StatesAmerican scholars and policy analysts have conducted extensive research into theoverall effects of the gambling industry. In 1975, for example, the Commission on theReview of the National Policy toward Gambling concluded that less than one per-cent of adult Americans were “probable compulsive” gamblers. The most recent in-vestigation into the effects of legalized gambling is provided by the NationalGambling impact Study Commission (NGISC). Established in August 1996, afteranti-gambling forces in the United States Congress persuaded President Clinton tofund a two-year, multi-million dollar study, the NGISC consisted of a diverse groupof nine individuals. Although there were no policy experts appointed, the commis-sioners included six who were overtly opposed to legalized gambling, primarily onmoral grounds (Sullum 1999). Although the commission’s official purpose was to
Table 14: Prevalence of problem drinkers and problem gamblers in Alberta
Source: Alberta Alcohol and Drug Abuse Commission 1999c: 1.
Current Drinking among Albertans Current Gambling among Albertans
Non-Drinkers 21% Non-Gamblers 7%
Social Non-Problem Drinkers 64% Social Non-Problem Gamblers 88%
Some Problems 10% Some Problems 4%
Severe Problems 5% Severe Problems 1%

Gambling with Our Future? 34
Fraser Institute Digital PublicationFebruary 2002
“conduct a comprehensive legal and factual study of the social and economic impli-cations in the United States,” (NGISC 1999b) in practice the socially conservative sixviewed the commission as an opportunity to air gambling’s dirty laundry, that is, theenormous social costs that allegedly accrue from allowing adults to do what theywant with their own money. For example, several commissioners began the studywith a view of the lottery industry as a major evil.
Unexpectedly and unintentionally, the presidential commission report put to restmany of the myths propagated about gambling. Overall, if one wades through all1,300 pages (NGISC 1999a, 1999b) one finds that a series of predictable, unalarmingfindings are lost amidst a sea of hyperbolic verbiage.
Table 15 compares five NGISC-funded studies that estimate the rate of problem gam-blers per 100,000 people in the American population. Among the different studies,lifetime pathological gambling has a minimum value of 0.8 (NORC 1999a) and amaximum value of 1.6 (Harvard Meta-Analysis).
Based on criteria developed by the American Psychiatric Association, the NationalOpinion Research Center (NORC) estimated that approximately 2.5 million adults(0.8 percent) are pathological gamblers and 3 million adults (1.3 percent) are problemgamblers. Furthermore, NORC identified approximately 15 million adults “at risk”for problem gambling, 148 million adults who would be considered low-risk gam-blers and 29 million—or one in seven—who have never gambled. The National Re-search Centre (NRC) of the National Academy of Sciences found results similar tothose of the NORC study. The NRC estimated the lifetime rate of pathological gam-bling at 1.5 percent of the adult population, or approximately three million people.In addition, in any given year 0.9 percent of all American adults (approximately 1.8million people) meet the necessary criteria to be categorized as “past year patholog-ical gamblers.” The NRC estimated that another 3.9 percent of adults (7.8 millionpeople) meet the “lifetime” criteria for problem gambling, and that two percent (fourmillion) people meet “past year” criteria (NGISC 1999b).
When testifying before the NGISC, Shaffer observed that the percentage of peoplewith gambling problems has risen in the last 20 years. He then made a second, cru-cial point about legalized gambling:
Observers tend to think that disordered gambling is growing in direct pro-portion to the expansion of legalized gambling opportunities. This may notbe an accurate perception. Gambling certainly has expanded much morerapidly than the rate of disordered gambling (Berenson 1998a: 4).

Gambling with Our Future? 35
Fraser Institute Digital PublicationFebruary 2002
Table 15: Comparison of problem pathological gambling prevalence rates per 100,000 of general adult population in the United States
Notes: level 3 = disordered gambling that satisfies diagnostic criteria; level 2 = pattern of gamblingthat is associated with adverse consequences but does not meet criteria for diagnosis as a pathologicalgamblers; at risk = 1 or 2 criteria and lost more than $100 in a single day; problem gambler = 3 or4 DSM-IV criteria and lost more than $100 in a single day; pathological gambler = 5 or more criteriaand lost more than $100 in a single day; RDD = household telephone survey; RDD/Patrons com-bined = household telephone survey and interviews with patrons of gaming venues. The study by theNational Research Council used the same codes as the Harvard Meta-Analysis.
Sources: University of Michigan Survey Research Centre for Commission of the Review of NationalPolicy toward Gambling (1976); Shaffer , Hall, and Vander Bilt 1997, Estimating the Prevalence of Disor-dered Gambling Behavior in the US and Canada: A Meta-analysis; National Research Council (1999), Patho-logical Gambling: A Critical Review; National Opinion Research Centre (1999), Gambling Impact andBehavior Study.
University of Michigan (1976)
Harvard Meta-analysis (1997)
National Research Council (1999)
Rate Category Rate Category Rate Category
Life
tim
e 0.77 Probable Compulsive 1.60 Level 3 1.5 Level 3
2.33 Potential Compulsive 3.85 Level 2 3.9 Level 2
Pas
t ye
ar — — 1.14 Level 3 0.9 Level 3
— — 2.80 Level 2 2.0 Level 2
NORC RDD/Patrons Combined
NORC RDD (1999)
Rate Category Rate Category
Life
tim
e 1.2 Pathological 0.8 Pathological
9.2 At risk & Problem 9.2 At risk & Problem
Pas
t ye
ar 0.6 Pathological 0.1 Pathological
3.6 At risk & Problem 2.7 At risk & Problem

Gambling with Our Future? 36
Fraser Institute Digital PublicationFebruary 2002
Shaffer also noted: “Pathological gambling is not considered a unique disorder, butrather a cluster of symptoms associated with other disorders” (Shaffer, Hall, andVander Bilt 1997: 60). Tables 16 and 17 compare the rate of pathological and problemgambling and other disorders. It is interesting to note that the lifetime level of alco-hol addiction is seven times that of pathological gambling.
Table 16: Comparing lifetime and past-year prevalence rates of adult psychiatric disorders
Source: Shaffer, Hall, and Vander Bilt 1997: 60.
Table 17: Comparison of pathological and problem gambling with alcohol and drug dependence and abuse in the American population (percent)
Source: NGISC. Sources for specific data shown in table: [1] Committee analysis of Shaffer,Hall, and Vander Bilt 1997; [2] Kessler et al. (1994), National Comorbidity Survey (NCS).
Lifetime (%) Past-year (%)
Gambling Level 3 1.6 1.1
Anti-Social Personality 2.6 1.2
Obsessive Compulsive 2.6 1.7
Drug Abuse/Dependence 6.2 2.5
Major Depressive Episode 6.4 3.7
Generalised Anxiety 8.5 3.8
Alcohol Abuse/Dependence 13.8 6.3
Past-year (%) Lifetime (%)
Pathological Gambling1 0.9 1.5
Alcohol Dependence2 7.2 14.1
Drug Dependence2 2.8 7.5
Pathological and Problem Gambling1 2.9 5.4
Alcohol Dependence and Abuse2 9.7 23.5
Drug Dependence and Abuse2 3.6 11.9

Gambling with Our Future? 37
Fraser Institute Digital PublicationFebruary 2002
United KingdomDickerson estimates the number of compulsive gamblers in the United Kingdom atapproximately one percent of the adult population (or 300,000 Britons at the time ofthe estimate) (Munting 1996). This is consistent with the estimated prevalence ofpathological gamblers in Canada, the United States, and Australia, as detailed above.
Socio-demographic overview of gambling
consumption patterns
CanadaIn 1999, 72 percent of Canadians participated in regulated gambling like lotteries, ca-sinos and bingo or unregulated gambling like sports pools and bets with friends(Azmier 2000). From an economic perspective, consumer spending is limited by dis-posable income. This assumption is explained by a basic tautology: total income isequal to consumption plus taxes plus savings. In order to increase consumption ofany good or service, one must reduce consumption of some other good or service,increase income, borrow, reduce savings, or some combination of these. This is truefor the consumption of any good or service, including gambling.
In 1995/1996, Canada’s adult population stood at 22.4 million and the Canadiangambling industry had gross gambling revenues of $17.1 billion (table 18). There-fore, at this time Canadian adults wagered $760 per capita.
An analysis by Statistics Canada determined that, in 1998, 77 percent of Canadianhouseholds reported expenditure on at least one gambling activity. High-incomehouseholds spent more on gambling than lower-income households, although theamount represented less of their total income. For example, in 1998, 63 percent of low-income households spent an average of $315 on gambling, or 2.3 percent of their av-erage pre-tax income (table 19). Meanwhile, 84 percent of high-income householdsspent 0.6 percent of their income on gambling, an average of $590 (Marshall 2000).
Another measure of participation in the gaming industry is a comparison of familyexpenditures on gaming and other purchases. Overall, the average Canadian house-hold expenditure on all purchases in 1997 was $35,290. Canadian households spent,on average, $247 or 0.7 percent of total spending on games of chance. This is less thanthe average expended on other recreational activities or on alcohol and tobacco. Theaverage Canadian household expenditure on recreation was $2,780 or 7.9 percent ofhousehold spending and $1,139 or 3.2 percent of household spending on alcohol andtobacco. (table 20)

Gambling with Our Future? 38
Fraser Institute Digital PublicationFebruary 2002
Table 18: Total wagering and wagering per capita in Canada
Note: Gross revenues do not include pay-outs and prizes.
Sources: 1996 Canada Census; and International Gaming and Wagering Business, July 1997.
Table 19: Gambling participation and household income in Canada (1998)
Source: Marshall 2000.
Total Gross Revenue (CDN$)
Per capita, age 18+ (CDN$)
British Columbia 1.7 billion 589
Alberta 2.7 billion 1,344
Saskatchewan 870 million 1,183
Manitoba 950 million 1,124
Ontario 5.9 billion 699
Quebec 3.4 billion 604
New Brunswick 530 million 913
Prince Edward Island 100 million 991
Nova Scotia 600 million 838
Newfoundland 410 million 947
Total 17.1 billion 760
Level of household incomeGambling
ParticipationPercent of
total income
Under $20,000 63% 2.3%
$20,000 to 39,999 79% 1.4%
$40,000 to 59,999 81% 1.0%
$60,000 to 79,999 84% 1.0%
$80,000 and over 84% 0.6%

Gambling with Our Future? 39
Fraser Institute Digital PublicationFebruary 2002
Table 20: Average Household Expenditure (1997)
Note: *Income taxes, insurance payments, and contributions have been excluded from total consumption.
Source: Statistics Canada.
YK BC AB SK MB ON QC NB NS PE NF CAN
Food 6,878 5,821 5,769 4,881 5,310 5,897 5,649 5,198 5,112 5,149 5,595 5,703
Shelter 11,713 11,168 9,830 7,342 8,217 11,691 7,950 7,308 8,124 7,627 6,554 9,869
Household Operation 3,268 2,419 2,539 2,121 2,106 2,502 1,882 2,249 2,363 2,252 2,047 2,284
Household Furnishings 1,735 1,418 1,572 1,245 1,263 1,469 1,090 1,197 1,244 1,169 1,106 1,335
Clothing 2,349 2,151 2,445 1,922 1,977 2,353 2,017 1,845 1,873 1,937 2,023 2,182
Transportation 7,323 6,570 7,130 6,652 5,923 6,821 5,009 5,907 5,501 6,182 5,097 6,204
Health Care 1,121 1,334 1,707 1,253 1,132 1,030 1,052 1,155 1,081 1,136 969 1,153
Personal Care 689 637 689 580 591 694 675 589 580 587 558 664
Recreation 3,934 3,298 3,568 2,649 2,671 2,909 2,264 2,316 2,215 2,215 2,090 2,780
Reading Materials 429 269 308 230 256 294 257 235 271 264 186 275
Education 380 622 743 535 545 792 487 516 787 670 785 659
Tobacco & Alcohol 1,854 1,234 1,370 1,239 1,166 1,058 1,124 1,047 1,069 1,097 1,191 1,139
Games of Chance (Net Amount) 244 187 255 265 290 239 278 233 251 212 242 247
Miscellaneous 896 1,041 896 801 718 888 574 598 660 553 511 795
Total Current Consumption* 42,813 38,171 38,820 31,715 32,165 38,637 30,309 30,394 31,130 31,052 28,955 35,290

Gambling with Our Future? 40
Fraser Institute Digital PublicationFebruary 2002
Opponents argue that gambling is economically regressive; that is, that gambling rev-enues are disproportionately derived from the income of the poor and the unedu-cated. Upon closer inspection, however, the evidence is mixed. According to StatisticsCanada’s 1998 Household Expenditure Survey, the proportion of the lowest incomegroup in Canada that has participated in at least one gaming activity (67 percent) ismuch lower than the proportion of the highest income group (87 percent) (tables 21a& 21b). Furthermore, although lower-income groups spend a higher proportion oftheir income on gaming activities, higher-income groups spend more in total. There-fore, the premise that the poor support the gaming industry is somewhat misleadingand not entirely representative of actual consumer spending on gaming activities.
Another area of interest to researchers is the link between the availability of gamingopportunities and consumer expenditure. A study by Room, Tuner, and Ialomiteanu(1999) examined the effect of the introduction of the Niagara Falls casino on con-sumer spending. Overall, Niagara residents spent less on average ($36) on casinogambling than Ontario residents as a whole ($47). A significant number of respon-dents reported spending reasonable amounts (i.e., spending within their financialmeans). Of the respondents, 93 percent reported spending less than $100 per monthand 94 percent reported spending less than five percent of their income on gambling.Although proximity to gaming facilities may increase participation rates, the avail-ability of gaming facilities does not necessarily result in increased consumption ofgaming activities.
Who gambles in Canada?Baseline Market Research (1996a) examined the purchasing of lottery productsamong different demographic groups within the Nova Scotian population. Theyfound a statistically significant relationship between age and the purchase of scratchtickets: the likelihood of scratch-ticket purchases decreased as the age of the sampleincreased. In other words, the oldest age group (65+) was the least likely to purchasescratch tickets on a weekly basis.
Overall, male and female purchasing patterns do not vary significantly: approxi-mately 18 percent of men and women in Nova Scotia do not buy lottery tickets, ninepercent have purchased them at some point but not in the last year, 41 percent havepurchased them in the past year, and 32 percent purchase them on a weekly basis.Within this sample of Maritime gamblers, wagers ranged from $1 to $50,000. Overall,49 percent of respondents indicated their largest wager was $10 or less; 73 percentreported the largest wager was $25 or less.
This study found that problem gamblers in Nova Scotia include a disproportionatenumber of men. The more elderly the respondent, the less likely he or she is to be

Gambling with Our Future? 41
Fraser Institute Digital PublicationFebruary 2002
Table 21a: Percentage with gaming expenditures
Source: Marshall 1998.
At least one activity
Governmentlotteries
Other lotteries
and raffles
Casinos and slot
machines
Bingo
Percentage of households with gaming expenditures
All households 82 74 39 17 12
By income groups ($)
Less than 20,000 67 59 18 8 13
20,000 to 39,999 81 73 32 15 14
40,000 to 59,999 87 78 46 19 12
60,000 to 79,999 88 81 53 19 13
80,000 & over 87 78 54 24 9
One person households
71 62 25 13 9
Percentage of men and women with gaming expenditures
Men 75 65 26 14 4
Women 69 60 25 11 12
Percentage of persons with gaming expenditures, by educational level
Less than high school 68 58 18 10 13
High school graduate 76 69 29 12 8
Post secondary 79 68 37 15 —
University 62 50 29 16 —

Gambling with Our Future? 42
Fraser Institute Digital PublicationFebruary 2002
Table 21b: Average expenditures on gaming activities
Source: Marshall 1998.
At least one activity
Government lotteries
Other lotteries
and raffles
Casinos and slot
machines
Bingo
Average expenditure per spending household ($)
All households 423 239 70 359 677
By income group ($)
Less than 20,000 296 159 39 456 479
20,000 to 39,999 370 216 57 247 623
40,000 to 59,999 444 264 63 315 758
60,000 to 79,999 484 266 72 467 641
80,000 & over 536 285 101 391 1,045
One person households
334 193 61 451 526
Average expenditure by men and women
Men 416 264 79 710 464
Women 270 138 47 217 540
Average expenditure by educational level
Less than high school 410 208 55 648 643
High school grad 319 216 65 375 332
Post secondary 257 156 63 275 —
University 245 126 59 398 —

Gambling with Our Future? 43
Fraser Institute Digital PublicationFebruary 2002
classified as a problem gambler. Problem gamblers were more likely to have a high-school education or less, and were less likely to be married, compared to the overallsample of gamblers. Forty-six percent within the overall sample of gamblers, but 58percent of those classed as problem gamblers, had incomes under $30,000.
Baseline Market Research (1996b) also conducted a province-wide telephone surveyfor the New Brunswick Department of Finance. The study identified the typicalproblem gambler in New Brunswick as a single, unemployed, francophone male un-der the age of 44 with, on average, no more than a high-school education. He prob-ably began his gaming activities around the age of 22 through card games and wasinvolved in more than one wagering activity weekly.
In Ontario, a study by the Addiction Research Foundation (Ferris, Stirpe, and Ialo-miteanu 1996] found that respondents in two of the youngest age groups (particularlythose aged 18 to 29 years) had a higher propensity to gamble, were more likely to havegambled in the last month, were more likely to be involved in multiple gambling ac-tivities, and preferred to gamble on sports or VLTs. Younger gamblers also tended tobe in the highest categories for frequency and spending as they gambled at leastweekly and spent at least $100 per month on gambling. Other findings showed thatmen were more likely to gamble than women and to have gambled in several differ-ent activities, and tended to spend more and gamble more regularly than women.
The National Council on Welfare (1996) described a typical Canadian problem gam-bler as an unmarried man under the age of 30. However, beyond these two definingcharacteristics, there is no clear profile of a problem gambler. A number of provincialstudies have found that there are groups within the population that have a higherrisk of becoming problem gamblers but the risk is never guaranteed as many prob-lem gamblers do not fit these characteristics.
United StatesIn 1998, Americans spent approximately US$7 billion on movie tickets, US$26 billionon books, and US$450 billion on groceries. American gamblers wagered more thanUS$630 billion legally on state lotteries, casinos, slot machines, video poker andkeno, and other forms of gaming. They lost US$50 billion in the process (Will 1999).According to Arthur Anderson (1996), spending on recreation increased fromUS$43.1 billion in 1970 to US$339.9 billion in 1993. Of the increased spending on rec-reation, only a small portion is attributable to incremental spending on casino gam-ing. For example, between 1990 and 1993 the increase in spending on recreation wasapproximately US$54.2 billion while the increase in gaming revenues was approxi-mately US$3.2 billion during the same period. Table 22 compares personal consump-tion expenditures in the United States in 1970 and 1993:

Gambling with Our Future? 44
Fraser Institute Digital PublicationFebruary 2002
Who gambles in the United States?NORC (1999) identified the prevalence of at-risk, problem and pathological gam-blers within specific demographic groups. Although the sample sizes are small, thestudy provides an approximation of the proportion of each subgroup at risk orhaving problems with gambling. For example, lifetime pathological gamblers aremore likely to be Black males aged 50 to 64 years with less than high-school educa-tion. They are more likely to be divorced, separated, or never married, employedfull-time, and living within 50 miles of a casino. Players in the lifetime-at-risk cate-gory tend to be Hispanic males aged 18 to 29 years with less than high-school edu-cation. They tend to have incomes above $50,000 a year and are more likely to bedivorced, separated, or never married (table 23).
On average, Americans with relatively high income and educational levels, like theirCanadian counter-parts, spend more on, for example, lottery tickets than peoplewith relatively low income and educational levels. However, poorer people spendproportionally more of their earnings on lottery tickets (Douglas 1995: 346).
Table 22: Personal consumption expenditures in the United States, 1970 and 1993 (1987US$millions)
Sources: Statistical Abstract of the United States, 1995: 458, table 709; Statistical Abstract of theUnited States,1993: 442, table 699.
1970 1993
$ % $ %
Miscellaneous 127.2 7 213.2 6
Food 431.0 24 553.6 16
Clothing 107.8 6 241.5 7
Housing 508.5 28 947.7 27
Medical care 208.7 12 523.0 15
Other services 119.5 7 271.1 8
Transportation 219.5 12 410.5 12
Recreation 91.3 5 304.1 9
Total 1,813.5 3,458.7

Gambling with Our Future? 45
Fraser Institute Digital PublicationFebruary 2002
Table 23: Prevalence of lifetime and past-year gambling problems by demographic group (percent)
Demographic groupAt-Risk (n=267) Problem (n=56) Pathological (n=67)
Lifetime Past-year Lifetime Past-year Lifetime Past-year
Sex
Male 9.6 3.9 2.0 0.9 1.7 0.8
Female 6.0 2.0 1.1 0.6 0.8 0.3
Race
White 6.8 2.7 1.4 0.6 1.0 0.5
Black 9.2 4.2 2.7 1.7 3.2 1.5
Hispanic 12.7 3.7 0.9 0.7 0.5 0.1
Other 8.8 1.8 1.2 0.5 0.9 0.4
Age
18–29 10.1 3.9 2.1 1.0 1.3 0.3
30–39 6.9 2.1 1.5 0.8 0.6 0.6
40–49 8.9 3.3 1.9 0.7 1.4 0.8
50–64 6.1 3.6 1.2 0.3 2.2 0.9
65+ 6.1 1.7 0.7 0.6 0.4 0.2
Education
Less than HS 10.0 2.4 1.7 1.2 2.1 1.0
HS Graduates 8.0 3.5 2.2 1.1 1.9 1.1
Some College 7.9 3.5 1.5 0.8 1.1 0.3
College Graduate 6.4 2.0 0.8 0.2 0.5 0.1
Income
Less Than $24,000 7.3 2.6 1.6 0.7 1.7 0.9
$24,000–$49,000 6.9 3.2 1.8 0.9 1.4 0.6
$50,000–$99,900 8.0 2.5 1.3 0.7 0.9 0.2
$100,000+ 13.4 4.9 1.4 0.4 0.7 0.2
Marital status
Married 5.9 1.9 1.0 0.8 1.0 0.3
Divorced/Separated 9.9 4.7 1.7 0.9 3.0 1.7

Gambling with Our Future? 46
Fraser Institute Digital PublicationFebruary 2002
Table 23 continued
Source: NORC 1999a: 26.
Demographic groupAt-Risk (n=267) Problem (n=56) Pathological (n=67)
Lifetime Past-year Lifetime Past-year Lifetime Past-year
Never Married 11.4 4.3 2.6 0.8 1.2 0.7
Cohabiting 6.8 3.2 1.2 0.2 0.8 0.0
Widowed 7.3 1.7 0.5 0.0 0.0 0.0
Minor children
None 7.7 3.1 1.6 0.7 1.0 0.5
One or More 7.8 2.7 1.3 0.9 1.6 0.6
Employment
Full-time 8.5 3.0 1.5 0.7 1.5 0.6
Part-time 5.3 2.1 0.3 0.0 0.8 0.6
Not Employed 7.3 3.2 2.1 1.0 1.0 0.4
Region
Northeast 8.8 2.9 0.8 0.0 0.4 0.0
South 5.9 2.2 1.1 0.6 1.2 0.4
Midwest 6.0 2.7 1.6 0.7 1.5 1.0
West 12.1 4.3 2.3 1.4 1.4 0.6
Lottery state
No 4.6 2.9 1.4 0.7 1.5 0.2
Yes 8.3 2.9 1.5 0.7 1.2 0.6
Distance to casino
0–50 miles 7.4 4.1 2.3 1.1 2.1 1.3
51–250 miles 8.5 2.6 1.2 0.6 0.9 0.3
251+ miles 5.5 2.6 1.2 0.3 1.3 0.4
Professional gambler
No 7.6 2.9 1.5 0.7 1.1 0.5
Yes 19.2 11.4 2.9 7.2 19.8 10.4

Gambling with Our Future? 47
Fraser Institute Digital PublicationFebruary 2002
In 1998, NORC (1999b) interviewed 534 American youths. The survey resultsshowed that adolescents tend to gamble less often than adults: approximately one-third of youths aged 16 to 17 years have never gambled, compared to less than one-seventh of adults. The most striking difference between adult and adolescent gam-bling is that a majority of adolescent gambling is composed of private betting ongames of skill, particularly card games. The data also show that youths aged 16 to 17years wager smaller amounts of money compared to adults. For example, approxi-mately 22 percent of adults, but only about two percent of youths, have lost morethan $100 on a single day of gambling.
The survey by NORC (1999b) found that there is not a statistically significant differ-ence between men and women gamblers, although men are more likely to be patho-logical, problem, and at-risk gamblers than are women. Despite equal proportions ofmen and women having gambled in their lifetimes, the percentage of women whohave gambled has increased over recent years by almost 20 percent, whereas the per-centage for men has increased by only 10 percent. Table 24 shows the proportion ofgamblers by sex who have gambled in their lifetime and in the past year.
AustraliaAccording to Dickerson and Baron (1998), Australians spend over AUS$10 billioneach year on gambling, about three percent of household disposable income. Thiscompares to annual household expenditures of approximately AUS$6 billion on gas,electricity, and fuel, AUS$9 billion on household appliances, and AUS$13 billion onalcoholic beverages. This AUS$10 billion represents annual net losses, that is, theamount wagered less any winnings. Given that players have a tendency to re-wagertheir winnings over time, the actual turnover of the gaming industry is estimated be-tween AUS$70 billion and AUS$80 billion per year. Interestingly, per-capita spend-ing on gaming among adults in Australia is, on average, AUS$700, which is less thanper-capita spending on gaming in Canada.
In contrast to spending by North American consumers, Australians appear to spendmore per capita on gambling than on other recreational activities. This is not surprising
Table 24: Gambling during lifetime and past-year, by sex (1998)
Source: NORC 1999b: 8.
Lifetime (percent) Past year (percent)
Men 88 67
Women 83 60

Gambling with Our Future? 48
Fraser Institute Digital PublicationFebruary 2002
considering that Australians appear to have a more tolerant disposition toward gam-bling as a recreational pastime. According to the figures presented by the AustralianRetailers Association (1998), between 1989 and 1996, per-capita expenditures on gam-bling increased by AUS$251. This compares to a per-capita increase of AUS$93 forother recreational activities during the same period (table 25).
When broken down into income quintiles, the proportion of average householdspending on recreation that is devoted to gambling is relatively low (table 26). For ex-ample, households within the lowest income quintile spend 23 percent of their aver-age weekly expenditures on entertainment and other recreational services, comparedto 16 percent of expenditures on gam[bling. Another interesting outcome in the datapresented in table 26 is that lower-income households allocate a higher percentage oftheir weekly recreation spending to gambling than do higher-income households.
A report by ACIL Consulting (1999) found that lower-income households spend ahigher proportion of their income on lottery games per week than households in thehighest income quintile while higher-income households spend more of theirweekly gambling expenditures on EGMs and casino gaming. Although householdsin the lowest income quintile allocated the highest proportion of their total weeklyexpenditure to gambling in 1993/1994, in dollar terms this group spent the least.Conversely, in 1992, the highest-income earners spent the smallest proportion oftheir total weekly expenditure on gambling but the most in dollar terms.
Table 27 reveals an interesting trend in the percentage share of household spendingcompared to household income. Household expenditures on retail and other ser-vices show a marginal increase between 1989 and 1996. Gambling expenditures havealso increased during this same period. What is interesting about the data is that sav-ings as a percentage share of household income has declined between 1989 and 1996from 6.7 percent to 2.5 percent. This decrease in savings is partially attributable to anincrease in consumer spending on gambling.
In this vein, the Productivity Commission (1999) cited a report on the Australianstate of Victoria by NIEIR (1997), which concluded:
Up to 1995-96 . . . new gambling expenditure largely represents new expen-ditures in the Victorian economy that would not otherwise have beenmade. This is in contrast to earlier methodologies applied by NIEIR in gam-bling studies which argued that expenditures of Victorian residents on newgambling activities that would largely represent displacement of otherforms of expenditures. (NIEIR 1997a: 79; cited in Productivity Commission1999: 5.19)

Gambling with Our Future? 49
Fraser Institute Digital PublicationFebruary 2002
Table 25: Australian retail sales and gambling expenditure
Notes: [1] Retail services = total turnover excluding hospitality and services. [2] Retail consumption= retail components of private consumption expenditure. [3] Retail services = hospitality and serviceindustries from the Retail Trade Survey.
Source: Australian Retailers Association 1998. Sources for data: Australian Demographic Statistics(ABS Cat. 3101.0); Retail Sales & Consumption (ABS private communication); State Accounts ANA(ABS Cat. 5220.0).
1989/1990 1992/1993 1995/1996
Retail Sales1 ($m) 73,616 83,850 99,574
Retail Consumption2 ($m) 88,393 101,223 123,535
Retail Services3 16,270 16,761 21,171
Retail Industry share of retail consumption (%) 83.3 82.6 80.6
Per capita measures ($ per capita)
Retail sales 4,347 4,757 5,481
Gambling expenditures 266 337 517
Food retailing 1,967 2,241 2,670
Department retailing 580 606 637
Clothing 436 449 453
Household goods 626 643 721
Recreational 291 307 384
Other retail 447 510 615
Income Measures (% of HDI)
Retail sales 31.7 31.7 32.0
Retail food 14.3 14.9 15.6
Retail non-food 17.3 16.8 16.4
Retail services 7.0 6.4 6.8
Gambling expenditure 1.9 2.2 3.0

Gambling with Our Future? 50
Fraser Institute Digital PublicationFebruary 2002
Who gambles in Australia?Dickerson, Allcock, Blaszczynski, Maddern, Nicholls, and Williams (1998) examineda number of gender-based characteristics of gamblers in New South Wales. Thestudy found: 27 percent of male respondents and 26 percent of female respondentsdid not gamble at all; 38 percent gambled weekly; 15 percent gambled monthly; and20 percent gambled infrequently. In terms of expenditure on gambling, on average
Table 26: Average weekly expenditure on recreational goods and services categories as a proportion of total expenditure on recreation by household income quintiles (divisions of 20% of population), 1993/1994
Source: ABS, 1996, Cat No 6535.0.
Table 27: Share of household expenditure compared to household income (percent)
Source: National Institute of Applied Economic and Industry Research, 1997.
Lowest quintile
2nd quintile
3rd quintile
4th quintile
Highest quintile
Television, other AV equipment 19% 22% 25% 26% 24%
Books, newspapers, magazines, etc. 16% 15% 13% 13% 13%
Other recreational equipment 15% 13% 18% 15% 19%
Gambling 16% 14% 10% 8% 6%
Animal charges, expenses 11% 11% 11% 10% 9%
Entertainment, recreational services 23% 25% 23% 29% 29%
1989/1990
1990/1991
1991/1992
1992/1993
1993/1994
1994/1995
1995/1996
Retail 38.0 37.8 38.2 38.4 38.8 39.7 39.7
Services 53.4 54.6 55.1 55.8 55.7 55.8 54.8
Gambling 1.9 2.1 2.1 2.2 2.5 2.9 3.0
Savings 6.7 5.6 4.6 3.6 2.9 1.6 2.5

Gambling with Our Future? 51
Fraser Institute Digital PublicationFebruary 2002
men spend twice as much as women. The Australian Medical Association (1998)found that men and women gamble for different reasons and have preferences fordifferent forms of gambling. Although both men and women appreciate the socialatmosphere provided by gambling, men tend to enjoy the “thrill” of gambling whilewomen derive pleasure from the opportunity to relieve boredom and loneliness in asafe, social environment.
One assertion made by opponents of gambling is that most problem gamblers aresingle, under-educated, and unemployed. Contrary to this belief, data from Tasma-nia reveal that 65 percent of problem gamblers are employed. In Australia, at least,the occupational group with the highest representation is clerical (TasmanianGaming Commission 1998b). As for marital status, the data show that of all theproblem gamblers receiving treatment in Tasmania over a 16 month period, 57 per-cent were either married or in common-law relationships, and only 24 percent hadnever been married.
United Kingdom Although both consumer expenditure and expenditure on gambling have increased,between 1969 and 1990 the proportion of consumer expenditure devoted to gam-bling decreased after 1974/1975 (table 28). These figures do not include the amountof money allocated to charitable gaming; rather, they provide an estimate of whatconsumers are willing to spend for gaming activities. In 1992, combined annual ex-penditure on raffles, lotteries, soccer betting pools, and street and door-to-door col-lections totaled between £1.6 billion and £1.9 billion (Munting 1996).
The introduction of a national lottery in the early 1990s has not sparked a markedincrease in consumer expenditure on gambling. Before its introduction to the Britishgaming market, 70 percent of Britons already gambled, spending £7 per capita perweek. Soccer betting pools represent the most popular form of gambling: in 1991they boasted 16 million customers and contributed £554 million in revenue to thecoffers of the British government. The real concern about the national lottery lieswith rent-seeking soccer pools operators who fear that they could lose up to 30 per-cent of their business to lottery ticket purchases.
Casinos are another form of gambling found in the British marketplace. In a casino,the “drop” is the amount of money that patrons exchange for gambling chips and,thus, an approximation of the expenditure on casino gaming. Table 29 shows the“drop” in casinos from 1972 to 1990/1991. Although who can play and the availabil-ity of casinos is highly restricted, it appears that the British still enjoy casino gam-bling: spending in British casinos increased from £225 million in 1972 to £1,936million in 1991.

Gambling with Our Future? 52
Fraser Institute Digital PublicationFebruary 2002
Who gambles in the United Kingdom?It is estimated that approximately 30 million people regularly play the twice-weeklyNational Lottery, which represents approximately 68 percent of the adult popula-tion. Overall, surveys show that adult participation in the gambling industry has in-creased from 50 percent in 1974 to 70 percent in 1989, although the substantialincrease may be attributed to a broader definition of gambling used in the later sur-vey. Table 30 presents an estimate of the percentages of Britons who participate in thegaming industry by type of gaming activity and specific demographic groups. Thedata show that, overall, men prefer betting, sports pools, and gaming machines andwomen appear to prefer bingo to other forms of gambling. Lotteries are popularwith both men and women. When broken down into socioeconomic groups, skilledworkers seem to favour all forms of gambling and have an overall higher participa-tion rate than any other social class. Interestingly, the social classes with the lowestoverall participation rate are professionals, the unemployed, and pensioners.
Table 28: Estimates of gambling expenditure in the United Kingdom as a percent of total consumer expenditure, 1969 to 1990 (£m)
Notes: From 1969 on, includes fixed odds on football but excludes casino gaming. From 1969 on, Cus-toms and Excise data including bookmaking and football pools but, from 1989 on, on-course bettingexcluded as no longer subject to taxation. From 1972/1973 on, estimates for gaming and bingo figuresare included (from Gaming Board’s data) and, for 1972/1973 only, estimated gaming on machines. From1977/1978 on, lotteries were included. Hence, none of this data is comprehensive of all gambling ac-tivity (save, possibly, for 1972/1973) and comparisons over time are limited.
Sources: Churches Council on Gambling, Annual Reports; HM Customs Excise, Annual Reports, GamingBoard of Great Britain, Annual Report; Central Statistical Office, Economic Trends, annual supplement(1992): 35, 128; C.H. Feinstein (1972), National Income and Expenditure in the UK, 1855–1965 (Cam-bridge University Press).
Total gambling Consumer expenditure Percent
1969/1970 1,290.8 32,114 4.1
1972/1973 2,350.0 40,750 5.8
1974/1975 2,699.7 66,125 4.1
1979/1980 5,060.7 139,608 3.6
1984/1985 6,548.7 217,618 3.0
1989/1990 8,970.9 349,421 2.6

Gambling with Our Future? 53
Fraser Institute Digital PublicationFebruary 2002
Table 29: Gambling expenditure in British casinos, 1972 to 1990/1991 (£m on all games)
Note*: The “drop” is the amount of money exchanged for gambling chips in a casino andrepresents expenditure.
Source: The Gaming Board of Great Britain, Annual Reports.
Drop* Win by casino (%)
1972 225 —
1973/1974 297 —
1974/1975 351 —
1975/1976 477 —
1986/1987 1,622 20
1987/1988 1,722 19
1988/1989 1,720 18
1989/1990 1,881 18
1990/1991 1,936 18

Gambling with Our Future? 54
Fraser Institute Digital PublicationFebruary 2002
Table 30: Participation in gambling markets in the United Kingdom, 1974 to 1989 (%)
Notes: Data are based on surveys in 1974 and 1989, for AWP machines and lotteries, surveys in 1984 and 1989; betting is that with bookmakers andtote; pools are football pools; AWP means amusement-with-prize machines; lotteries include raffles, tombola, etc.; casino gaming and gaming machinesare not included as they were patronized by a small range of social groups.
Source: Mintel (1990), Gambling, passim, Leisure Intelligence 3, 6 (London: Mintel).
Sample All Gambling Betting Pools Bingo AWP* Lotteries
1974 1989 1974 1989 1974 1989 1974 1989 1974 1989 1984 1989 1984 1989
All 100 100 50 70 13 14 36 36 15 17 22 16 55 30
Male 48 57 52 66 68 68 62 31 35 65 63 47 49
Female 52 43 48 32 32 31 38 69 65 35 36 53 52
Age
15 to 19 11 7 11 8 12 4 4 18 19 20 30 11 10
20 to 24 9 9 10 15 12 7 7 14 20 7 10
25 to 34 17 20 17 20 21 21 16 19 11 20 21 20 21
35 to 44 16 18 18 18 19 19 20 14 18 15 15 16 20
45 to 54 14 21 14 12 12 22 18 23 13 13 5 14 15
55 to 64 14 14 15 12 11 11 17 10 20 6 3 17 13
Social group
Professional/Managerial 14 11 17 7 14 9 9 5 3 13 12 17 17
White-collar 23 23 21 21 20 24 21 18 16 21 21 23 24
Skilled Blue-collar 30 36 33 29 34 37 34 36 35 40 37 33 32
Unskilled Blue-collar 19 24 20 33 18 22 22 29 20 19 20 18 17
Unemployed/ pensioner 15 7 14 8 16 6 14 12 26 9 8 10 10

Gambling with Our Future? 55
Fraser Institute Digital PublicationFebruary 2002
Social benefits and costs of gambling
Social benefits
It is difficult to quantify the social benefits derived from gambling. How does one as-sign a dollar value to the utility or benefit that one receives from entertainment, so-cializing, or a break from one’s daily work routine? 2 Given the difficulty inquantifying these benefits, research in the area of social costs and benefits tends to bequalitative rather than quantitative in nature, frequently relying on anecdotal ratherthan empirical evidence.
In our view, gambling may be considered a recreational outlet, similar to entertain-ment and leisure products and services. Those who participate in gambling activitiesdo so voluntarily and, in return, receive intrinsic benefits from their consumption.Furthermore, if consumers are gambling for entertainment purposes, they are pur-chasing gambling just as they would purchase tickets for the cinema or a symphony.For example, the Golden Casket lottery in Australia provides a low-cost source of en-tertainment to a number of people in the Australian state of Queensland. In fact, overany 12-month period, close to 89 percent of the adult population will purchase a lot-tery product of some description (Golden Casket Lottery Corporation Ltd. 1999).This may be considered a relatively harmless form of entertainment that provides arecreational outlet for participants.
Australia’s Mental Health Foundation (1998) suggests that gambling may be excit-ing and socially engaging. For those who enjoy taking risks, the propensity for riskassociated with gambling may be both stimulating and challenging. Within thischarged environment, individuals become part of a world away from the burdenand drudgery of their daily routine. Adults find themselves at play, interacting andsocializing in a safe environment amongst their peers. For others, gambling is stim-ulating due to the challenge of estimating potential wins and losses, especially withsports betting and horse racing. Overall, people gamble for a variety of reasons,
[2] The most credible recent attempt to quantify the social benefits of gambling puts the fig-ure at $2 billion annually (see Vaillancourt and Roy 2000).

Gambling with Our Future? 56
Fraser Institute Digital PublicationFebruary 2002
whether for a break from their daily lives, the thrill of the chase, or the challenge ofbeating the odds. Each individual gambles for a different reason and derives plea-sure from the activity according to his or her own individual measure of utility.
The Friedman-Savage utility model recognizes the important point that, while mostpeople tend to be risk-averse, there are those who are risk-preferring over certain in-come ranges; that is, they are willing to take a risk—to gamble—to increase theirwealth. Two studies have assessed aspects of the Friedman-Savage model in the con-text of gambling. Pryor (1976) analyzed gambling from a cross-cultural perspectiveand found a “positive correlation between socioeconomic inequality and the presenceof gambling” (Rosecrance 1998: 64). In 1981, Gregory Brunk analyzed data collected bythe 1976 Survey Research Study and concluded that dissatisfaction with current in-come was significantly related to the purchase of lottery tickets but not to other formsof gambling. For the three types of gambling analyzed (poker, sports, and bingo), themore satisfied individuals were with their income, the more they tended to gamble.According to Friedman and Savage, for willing gamblers, as they advance to a highersocioeconomic group, the marginal utility of income increases as winnings from gam-bling increase. In other words, for those who choose to gamble, the small sum riskedfor the expected return of a large sum of money is justified by the opportunity of finan-cial gain that a person would not have otherwise had the opportunity to obtain.
Unfortunately, most gambling critics discount the enjoyment derived from games ofchance and, instead, consider the anticipated monetary returns from gambling to bethe most important outcome. However, G. Calvert recently provided the reminder:“Utility functions are the bread and butter of ‘subjective expected utility’ theory,which quite simply assumes that people make decisions according to the expectedvalue of their utility function” (1999a). Hence, as Calvert notes:
Our understanding of trade itself turns on the observations that people veryoften value things differently. Both parties to an exchange expect to increasetheir utility, or feel better off; thus trade is a positive-sum game. Indeed,were it otherwise, voluntary exchange would never take place. (1999a)
Alfred Marshall, one of history’s great economists, popularized the concept of “con-sumer surplus.” Consumer surplus refers to the difference between what consumersare willing to pay for a product and the price they are required to pay. The size of thebenefit derived from the purchase equals the difference between the consumer’s valueof the product and the amount actually paid for it. Consumer surplus exists becausepeople are willing to pay more for a product than they are required to pay. In the gam-bling market, consumer surplus measures the willingness of consumers to purchasegambling products in excess of cost, reflecting a benefit to the consumer involved.

Gambling with Our Future? 57
Fraser Institute Digital PublicationFebruary 2002
If consumers are willing to purchase products and producers choose to provide it,presumably they do so because there is a net benefit to both consumers and produc-ers. In Australia, the Productivity Commission (1999) estimates that the consumersurplus for gambling is AUS$8 billion to 11 billion per year (1997/1998). However,when adjusting the benefit to allow for the social costs accruing from problem gam-bling, this amount is reduced to approximately AUS$5 billion to 6 billion per year.
An exploratory study by Sterling Research (1998a) employed a series of focusgroups to examine Nova Scotia’s gaming industry. Among the focus group partici-pants, entertainment was the most prevalent reason for gambling, followed by so-cializing. Those who frequented bingo halls and casinos believed that mingling wasan important reason for participating in this form of gaming. The following wereconsidered benefits to the family unit: diversions from daily pressures, family en-tertainment, and the maintenance of family relationships. Participants suggestedthat their work also benefits from gaming, because employees who participate ingaming find relief from their work routine, experience stress reduction, and an in-crease in group solidarity.
Casino gaming is particularly attractive to many individuals because it is conductedin a self-contained environment, different from other social outlets. As Thompson(1994) suggests, casinos provide self-contained, crowded, party-like environmentsclearly separate from ordinary day-to-day activities where people can meet, social-ize, and play. In general, the ambiance is more formal and business-like than tavernsor lounges, and a dress code may apply (MPM Gaming Research 1998). Casino gam-bling also tends to attract occasional players who visit casinos periodically for enter-tainment and excitement. For others, casino gaming relieves tensions brought on bythe stress from everyday life, as regular attendees view the social world of the casinoas a familiar place where they can feel at home. Rosecrance argues that such a per-spective follows the sociological model of Tomatsu Shibutani, who described the se-curity of social worlds in a manner that may be applicable to casino gaming: “Eachis an arena in which there is some structure which permits reasonable anticipation ofthe behavior of others, hence an arena in which one may act with a sense of securityand confidence” (Rosecrance 1998: 82).
Within the gaming arena, there are opportunities for gamblers to gain both self-esteem and public esteem, although they may be losing money. Through gambling,participants gain an opportunity to test their skill in games of chance and to deriveintrinsic pleasure from the thrill of the activity itself. One of gambling’s mainattractions appears to be the entertainment value of the activity involved. As ErvingGoffman explained:

Gambling with Our Future? 58
Fraser Institute Digital PublicationFebruary 2002
The ritual involves squaring off, in which a challenge is presented and rulesare set; determination, the actual play producing an outcome; disclosure, thebrief but suspenseful period of time between completion of play and par-ticipants’ realization of the result; and finally the settlement, in which theplayers acknowledge the result. (Goffman 1967; cited in Smith 1996: 107).
For many years, gambling has benefited society in the form of charitable gaming.Overall, it appears that a society is more tolerant and accepting of gaming when it isfor the benefit of a popular social cause. Why is participation in charitable gaming sopopular? According to Douglas (1995), charitable gaming provides consumers witha “win-win” situation. Not only do participants have an opportunity to partake in agaming activity, they also gain the potential to win a sum of money or prize whilebeing assured that they are supporting a worthwhile cause.
Social costs
Legalized gambling is a growing problem in many communities . . . Places thathave tried it have found that it breeds crime, corrupts public officials, destroys fam-ilies and increases gambling addiction.
Gary Bauer3
Despite the relatively small number of cases of pathological gambling, there are so-cial costs attributable to those people who are unable to control their gambling be-haviour. The social costs of gambling may be defined more precisely within specificcultural contexts. In countries such as Australia, for example, a more tolerant atti-tude toward gambling may be reflected in a lower estimate of the social costs of gam-bling. In Canada, meanwhile, there has been comparatively little empirical researchconducted into the social costs of gambling and, as a result, most of the evidencefrom Canada is anecdotal in nature. In the United States, increased public awarenessabout the effects of gambling has resulted in a number of studies that attempt toquantify its social cost. Despite these efforts, research from the United States alsotends to be disproportionately qualitative in nature.
[3] www.frc.org/radio/c97110.html. Gary Bauer, one of America’s most prominent socialconservatives, is a former domestic policy advisor to President Ronald Reagan, a formerpresidential candidate (2000), and, currently, Executive Director of the Family ResearchCouncil, Washington, DC.

Gambling with Our Future? 59
Fraser Institute Digital PublicationFebruary 2002
CanadaThe exploratory study by Sterling Research (1998b) of Nova Scotia’s gaming indus-try observed participants who felt that any activity that interferes with a person’spersonal and professional responsibilities has a negative impact on the family. Theseresponsibilities may include spending time with family, attending work, payingbills, and giving attention to children.
In Ontario, the inquiry into gambling as a social problem by the Addiction ResearchFoundation included a survey of 1,031 adults who answered questions about the se-verity of several behaviours that may be considered social problems. These behav-iours are smoking, heavy drinking, drug addiction, heavy gambling, and swearingin public. The respondents rated each social problem according to the followingscale: (1) not at all serious; (2) somewhat serious; (3) serious; and (4) very serious.Drug addiction was ranked as the most serious problem by 16 percent of respon-dents, heavy drinking by 12 percent, smoking by 9 percent, gambling by only 3 per-cent, and swearing in public by just one percent (Ferris, Stirpe, and Ialomiteanu1996). Overall, it appears that Ontario residents find that drug addiction, heavydrinking, and smoking are more harmful to society than gambling.
When deciding whether to introduce a casino into the gaming market, the Vancou-ver Board of Trade (1994) heard testimony from representatives of the UnitedChurch of Canada, the Anglican Church, and the Baptist Church, none of whomwanted expanded gaming. In their opinion, on behalf of their respective Christianfaiths, both commercial and State-sanctioned gaming activities are deemed morallyrepugnant. Why? Gambling allegedly erodes the moral and social fiber of a commu-nity or society. It was alleged that, in practice, people who gamble regularly becomemotivated by greed, promoting a negative value that suggests one can get “some-thing for nothing” at one’s neighbour’s expense.
United StatesAmong American opponents of gambling, some argue that it has an especially nega-tive impact on the working class because it undermines the capitalist work ethic. Totheorists of this opinion, gambling is in conflict with the central characteristics of cap-italism: rationality; disciplined work habits; prudence; thrift; industry; methodical ad-herence to routine; and well-earned gains. A lust for sudden wealth disconnected fromthe process of making society more productive is viewed as perverse. Governmentsupport of gambling, whether through legalization or direct operation of the state,thereby encourages the pursuit of wealth without work (Dombrink and Thompson).
Nevertheless, gambling in America, as in Canada, is a voluntary and relativelyharmless activity. Most people who participate in this popular American pastime do
Gambling with Our Future? 60
Fraser Institute Digital PublicationFebruary 2002
so willingly and without experiencing adverse effects. Although there are peoplewho experience problems with gambling, they represent a very small proportion—approximately one percent—of the population.
In more specific terms, last year NORC (1999) investigated the changes of various so-cial indicators in communities proximate to newly opened casinos. NORC foundthat per-capita rates of bankruptcy, leading health indicators, and levels of violentcrime did not change significantly as a result of proximity to a casino. Meanwhile, un-employment rates, welfare outlays, and unemployment insurance expenditures de-clined by 15 percent. Overall, per-capita income remained the same.
The relationship between gambling and suicide is much debated. Critics argue thatgambling environments allow excessive individual freedom that promotes individ-ual isolation and self-destructive behaviour. Supporters of gambling argue that gam-bling environments are heavily regulated, and provide social integration throughentertainment and recreation.
An article by David P. Phillips published in the journal Suicide and Life ThreateningBehavior claimed that gambling may be accompanied by an increase in suicides. Re-search by McClearly and Chew (1998) directly addressed Phillips’ contention. Con-trary to Phillips, McClearly and Chew report: “Our investigation shows that whenstandard methodology is employed, and when the masking effects of extraneous fac-tors (such as population growth, age structure, and visitor volume) are removed, sui-cide levels in US casino resort areas are about average compared to non-gamingareas” (1998: 2). The authors concluded: “In the five counties where gambling waslegalized during 1978–95, including Atlantic City, before/after differences are notstatistically significant, and, moreover, are no larger than the differences from controlcounties. Resident-suicide rates neither rise nor fall when gambling is legalized”(1998: 19). Of all deaths recorded in the United States for 1995, 1.4 percent of alldeaths are attributable to suicides (table 31). A recent study by Blaszczynski and Far-rell (1998) provides further insight into the alleged association between gamblingand suicide. Overall, Blaszczynski and Farrell did not find any conclusive evidencethat gambling was “the major or sole contributing risk or predicting factor to sui-cide” (see table 32).
Another social cost commonly attributed to gambling is that problem gamblers tendto have higher levels of debt, and declare bankruptcy at higher rates, than non-prob-lem gamblers and non-gamblers. NORC (1999) found that pathological gamblersowe US$1.20 for every dollar of annual income, while low-risk gamblers owe onlyUS$0.80, and non-gamblers only US$0.60, per dollar of annual income. Not only dopathological gamblers incur a higher level of debt than low-risk gamblers, they also

Gambling with Our Future? 61
Fraser Institute Digital PublicationFebruary 2002
Table 31: Cause of death by visitor status: residence versus occurrence
Source: McClearly and Chew 1998: 45.
Table 32: Gambling-related suicide
Source: Blaszczynski and Farrell 1998.
Cause of DeathPercent of all deaths
Same county
Same state
Different state
Percent visitor
Heart disease 31.9 616,478 96,964 25,126 3.4
Cancers 22.4 436,691 66,988 14,976 2.9
Artery disease 9.2 173,137 34,045 6,906 3.2
Pulmonary disease 4.4 86,098 142,292 2,613 2.5
Motor Vehicle 1.9 25,905 13,088 4,647 14.6
Suicide 1.4 27,089 3,098 1,142 3.6
Distribution by sex 39 men, 5 women
Ratio of men to women among suicides in:
Sample 8 to 1
General Australian Population 4 to 1
General American Population 3 to 1
Mean age 40.8 years
Most common methods:
CO poisoning 47.7%
Hanging 18.1%
Firearms 11.4%
Percent of suicides from lower socioeconomic strata 60.5%
Elevated blood level at time of death 15.9%
Had previously attempted suicide 31.8%
Explicit references to gambling in suicide notes 15.9%

Gambling with Our Future? 62
Fraser Institute Digital PublicationFebruary 2002
tend to have declared bankruptcy at significantly elevated rates: 19.2 percent versus5.5 percent for low-risk gamblers and 4.2 percent for non-gamblers. Research onthose under treatment for problems with gambling has found that gambling-attributed current debt (as opposed to lifetime borrowing) is $39,000 in Wisconsinand $114,000 in Illinois (Thompson, Gazel, and Rickman 1996; cited in NORC 1999).Furthermore, NORC estimates that, on average, net lifetime losses from bankruptcyare about US$3,300 for pathological gamblers and US$1,600 for problem gamblers.
One of the questions raised by the Committee on the Social and Economic Impact ofPathological Gambling (1999) was whether additional debt incurred because ofproblem gambling represents a net cost to society or whether it is merely an eco-nomic transfer, that is, a temporary redistribution of money from one group in soci-ety (lenders) to another (borrowers), which in due time will be undone by repaymentof the debt? Consider, for example, that there are many people who incur debt tomortgage homes or purchase vehicles and that such debt is not considered a net costto society.
Furthermore, Cohn and Wolfe (1999) argue that, although personal bankruptcy ratesin the United States increased by 41 percent between 1994 to 1996, claims by oppo-nents to gambling that bankruptcy is a by-product of gaming activities are un-founded. A number of factors contradict the suggested causal link between thegrowth of casino gaming, for example, and the increase in bankruptcies. Namely, themajority of states with the highest bankruptcy rates are those without casino gaming:of the 10 states with the largest growth in bankruptcy filings, only Mississippi hascasino gaming; of the 24 American counties with the highest bankruptcy filing rates,none have casino gaming; and South Carolina, a state with one of the lowest bank-ruptcy rates, has a video poker industry with more than 24,000 machines and a 1996“handle” (see Glossary, page 127) of $1.03 billion. Furthermore, in a 1996 survey byUSA Today of 522 bankruptcy filers throughout the United States, 63 percent citedcredit-card bills and 50 percent cited the loss of employment or a pay cut as a mainreason for bankruptcy; only two percent cited gaming as a major factor.
Personal bankruptcy filings have tripled in the United States since 1984 and haverisen by about 40 percent in the last two years alone (National Centre for Policy Anal-ysis 1999). The United States Treasury Department attributes the rise in personalbankruptcies to increased debt level relative to income, greater use of credit cards, alower social stigma attached to filing for bankruptcy, and increases in the number ofdivorces. A rise in the number of bankruptcy filings and increased gambling ratesprompted the US Congress to investigate the link between gambling and bank-ruptcy. The Treasury Department, charged with reporting on the issue, found a sta-tistically insignificant relationship between gambling and bankruptcy. Overall, the

Gambling with Our Future? 63
Fraser Institute Digital PublicationFebruary 2002
study found that frequent high-risk gambling raises the probability of bankruptcyby six percentage points from that of the base group, occasional gamblers; high-riskgambling appears to be associated with a greater likelihood of declaring bankruptcybut the low prevalence of this type of gambling suggests that it has a relatively minorimpact on overall bankruptcy rates; and between 1993 and 1997 gross wageringjumped 53 percent while personal bankruptcies grew at an average annual rate ofonly 11 percent from 1985 through 1998 (Wall Street Journal 1999).
The NGISC (1999a) heard testimony about how compulsive gambling induces aheightened level of stress and tension in marriages and families, resulting in familialdisharmony. Bland, Newman, Orn, and Stebelsky (1993) estimated that 23 percent ofthe spouses and 17 percent of the children of pathological gamblers were physicallyand verbally abused. These statistics vary somewhat across studies. Lorenz andShuttlesworth estimated that 50 percent of spouses and 10 percent of children expe-rienced physical abuse from a pathological gambler (Lorenz and Shuttlesworth1999). It is important to note, however, that these statistics may be exaggerated asthey are taken exclusively from samples of those people who have sought treatmentfor severe gambling disorders.
Finally, NORC estimates that the average pathological gambler accumulatesUS$4,300 more than expected in legal fees because of a disproportionately high di-vorce rate. This amount is determined by comparing the measured divorce rate of53.5 percent versus an expected divorce rate of 33.4 percent for problem gamblers.Low-risk gamblers and non-gamblers have lifetime divorce rates of 30 percent and18 percent, respectively. Problem gamblers have losses over a lifetime of US$1,950more than expected in divorce legal fees and a divorce rate of 39.5 percent versus anexpected rate of 31 percent for otherwise similar persons without gambling prob-lems (NORC 1999: 49).
AustraliaAustralia tends to be at the forefront of gambling developments and gambling re-search. For example, a study by Dickerson et al. (1998) estimated the social costs ofgambling (pathological gambling, in particular). The cost of gambling-induced em-ployment changes, unemployment, and lost productivity is estimated at AUS$27.8million annually. Legal costs are estimated at $5.6 million annually; prison costs areassessed at approximately $9 million; and annual police costs are estimated to be $2.6million. The total cost attributed to pathological and problem gambling is estimatedat $48.1 million per year, or $9.70 per capita among the adult population of NewSouth Wales. However, this estimate of the social costs of gambling may be comparedwith the estimated AUS$2.9 billion in social benefits produced by gambling (Commit-tee on the Social and Economic Impact of Pathological Gambling 1999).

Gambling with Our Future? 64
Fraser Institute Digital PublicationFebruary 2002
Individuals are inherently social, existing within complex relationships. This com-panionable nature means that problem gamblers may borrow heavily or even stealfrom friends and family; while pathological gamblers will actually jeopardize theharmony of relationships with those close to them. In a clinical population of Aus-tralian problem gamblers, a study by AGIR (1996b) found that 50 percent experi-enced significant marital dysfunction, 36 percent owed money to their familymembers, 37 percent owed money to major finance companies, and 28 percent owedgambling-related money on their credit cards (not mutually exclusive events).Table 33 shows the proportion of families in which members are having trouble withtheir gambling in each Australian state.
Another area of interest to researchers is the effect of gambling on productivity.AGIR (1996b) reviewed clinical cases of problem gambling, and found that 68 per-cent of problem gamblers reported that gambling interfered with their productivityat work while 28 percent reported resigning or terminating employment due to gam-bling. It is estimated that an average loss of one hour of work per week by a problemgambler results in a productivity loss of AUS$20 million per annum. Finally, Brownand Coventry (1997) conducted a study that found that problem gamblers were un-able to pay for health services or adequate food. The financial instability due to gam-bling is cited as the most important reason why these problem gamblers are unableto afford necessities such as health care, food, and clothing.
In a similar research vein, Australia’s Productivity Commission (1999) examinedthe effects of gambling on a variety of social and economic factors. The report
Table 33: Interstate comparisons of families with members experiencing difficulties with excessive gambling
Note: NSW = New South Wales; TAS = Tasmania; WA = Western Australia. Gaming machines not avail-able in venues other than the casino for TAS 1994 = 1995 and WA 1994.
Source: Dickerson, Allcock, Blaszczynski, Maddern, Nicholls, and Williams 1998: 41.
NSW 1995(n=30)
NSW 1997(n=1209)
TAS 1994 (n=1220)
TAS 1996 (n=1211)
WA(n=1253)
A member of family experiencing difficulties with excessive gambling
14.5% 11.7% 6.1% 8.0% 6.9%
Difficulties during the last six months
3.8% 3.3% 1.1% 2.3% 2.2%

Gambling with Our Future? 65
Fraser Institute Digital PublicationFebruary 2002
determined the effects of gambling on street crime, money laundering, and orga-nized crime. The overall conclusions are summarized below.
♦ While some petty crime (and spotting for loan sharks) certainly does occurinside casinos and other gaming venues, the Commission did not identifyany evidence to conclude that the crime rate inside casinos is any higherthan that for other venues that draw similar numbers of people. Nor, didthe Commission find evidence that what petty crime occurs represents acost to society that is not already adequately dealt with through existingdeterrents and sanctions.
♦ The Commission found no evidence that casinos in Australia bring aboutmore per-capita street crime nor even that crime rates increase in the imme-diate vicinity of casinos.
♦ Money laundering in the gambling industry in Australia is unlikely to be amajor cost to society—at least not a cost attributable directly to the exist-ence of the industry itself.
♦ In the absence of substantive evidence to the contrary, the Commission’sassessment was that, at the very least, legal gambling operations do notadd markedly to problems of control and influence by organized crime.
The claim that gambling induces crime is based on two premises. The first premiseis that gambling facilities increase the number of thefts and assaults in the commu-nity, and the second premise is that gambling attracts organized crime. The associa-tion between gambling and crime often has been used to justify the need forprohibition or strict regulation of the gambling industry. The association betweengambling and crime is more commonly assumed to exist in relation to more tradi-tional forms of gambling, such as horse racing. Furthermore, the trend toward legal-izing a greater variety of gambling activities and opening up the supply of gamblingservices to greater competition has probably served to nullify the link between crimeand gambling.
Given the complex structure of the regulatory controls governing the gambling in-dustry, tens of millions of dollars are spent each year to employ the hundreds of gov-ernment bureaucrats responsible for ensuring compliance with state regulation.Each Australian state regulates the gambling industry through its particular gamingauthority and each state determines the license fees and rates of taxation. Casino li-censes, for example, provide the respective licensee with regional exclusivity for aspecific period. All suppliers of inputs to their business above a certain dollar limitmust be government-approved and all employees are required to obtain police clear-ance and be registered casino employees (ACIL Consulting 1999). Meanwhile, lotter-ies are operated by both state governments and by private firms, which are requiredto obtain an operating license.

Gambling with Our Future? 66
Fraser Institute Digital PublicationFebruary 2002
In the state of Queensland, the detection and prosecution of gaming and betting of-fences is the responsibility of regional policing units. Although there are no specialistgaming or racing units, the State Crime Operations Command (SCOC) periodicallyinvestigates gambling offences related to book-keeping as well as similar offences.According to the Queensland Government (1998), since the introduction of licensedcasinos and other forms of legal gambling, the incidences of unlawful gaming andof racing and betting offences have fallen drastically (table 34).
The Victorian Casino and Gaming Authority investigated the effects of gambling-re-lated crime. Overall, the 1997 research project found that there was no convincing ev-idence of an increase in crime in the state of Victoria since EGMs were introduced in1992. The report concluded:
In general, the introduction of EGMs appears to have caused little increasein crime and there are no statistics available on gambling related crime. Po-lice have reported that crime at gaming venues was not a problem and thatat some venues crime levels have fallen. This is in contrast to other findingswhere it was stated that problem gamblers who attended designated prob-lem gambling programs reported that they had committed illegal acts to fi-nance their gambling (ACIL Consulting 1999: 113).
Numerous investigations have delved into the extent to which problem and patho-logical gamblers resort to criminal activities to satisfy their gambling addiction. Aspart of their Queensland study, the AGIR (1996a) examined data from so-called“BreakEven” counselling centers for gamblers and found that 68.8 percent of maleclients and 57.1 percent of female clients had legal problems attributable to theirgambling behaviour. Surveys from the Arthur Gorrie Centre found that 31.1 percenthad gambling-related personal or financial difficulties, 23 percent had spent more
Table 34: Unlawful gaming offences and racing and betting offences
Source: Queensland Government 1998: 36.
Unlawful Gaming Offences Racing and Betting Offences
1993/1994 10 12
1994/1995 12 4
1995/1996 26 1
1996/1997 9 3

Gambling with Our Future? 67
Fraser Institute Digital PublicationFebruary 2002
money than they could afford on gaming machines, 5.4 percent had stolen money toplay machines, 5.4 percent had been in trouble with the police due to machine-play-ing, and 6.8 percent declared that playing poker machines had resulted in their in-carceration (Australian Medical Association 1998). The AGIR (1996b) study in NewSouth Wales showed that among the clinical population, 60 percent had gambling-related offences, 25 percent of these individuals were charged, and half of those re-ceived custodial sentences of one to two years. Overall, AGIR estimated annualprison, court, and policing costs related to gambling at approximately AUS$17 mil-lion for New South Wales (Australian Medical Association 1998).
In addition to the social costs of gambling, there are costs associated with the treat-ment of problem gamblers and pathological gamblers. In New South Wales, the costduring 1996/1997 of public and other services for the treatment of problem gamblersand their families was estimated at AUS$3.2 million (ACIL Consulting 1999).Records from the Victoria state government show that, until January 1997, AUS$33million was spent through that state’s Community Support Fund for problem gam-blers (ACIL Consulting 1999). Furthermore, Queensland Government (1998) re-ported that funds in excess of AUS$1 million were allocated to the operation of six“BreakEven” services. In Tasmania, a counselling service began operation in 1997following the introduction of gaming machines in hotels and clubs. An estimatedAUS$500,000 was made available for the treatment of problem gamblers (TasmanianGaming Commission 1998a).

Gambling with Our Future? 68
Fraser Institute Digital PublicationFebruary 2002
Economic benefits and costs of gambling
Industry representatives have often identified employment and economic activityas the principal benefit to the economy. Most analysis of the [gambling] industryis typically based on input-output relationships at the national or regional level.Implicit to most of these studies is the assumption that the expenditure on gam-bling represents new expenditure, and thus the analysis invariably indicateslarge net gains in terms of activity and employment for the economy. In practice,however, the economy operates in a more complex and interconnected way.Money spent on gambling will be diverted from consumption elsewhere but thisis not to say that there is no gain for the economy available from the growth ofthe gambling industry.
The Productivity CommissionAustralia’s Gambling Industries: Draft Report
In determining the overall economic impact of the gambling industry, differentiatingbetween which effects are net economic gains and which are merely economic trans-fers is a complex task. Money spent on gambling at, say, a casino that derives fromtourists who live in other cities, regions, or countries represents a net benefit both tothe casino and to the community in which the gambling occurs since it is new moneyentering the local economy. Money spent on gambling by local residents, however,is not necessarily a net economic benefit but merely an economic transfer within thecommunity. In other words, without the presence of a casino, the money spent ongambling would have been spent on other entertainment or recreational activitiesavailable within the community.
When gambling expenditures replace or redirect spending from other industries it isconsidered a “substitution effect.” Any new business that is brought into a commu-nity will contribute to the local economy but some of the new business representsdisplacement from other economic activities (Persky 1995), that is, a consumer whomight have spent $100 on a restaurant dinner may instead spend that $100 gambling(Room, Turner, and Ialomiteanu 1999). Therefore, gambling revenue may not be con-

Gambling with Our Future? 69
Fraser Institute Digital PublicationFebruary 2002
sidered entirely “new” money as some proportion of gambling revenues received bygovernment may represent lost sales taxes from consumption of other goods andservices or loss of investment capital in other industries (Beare and Hampton 1984).
Despite possible transfers from new industries, economic growth occurs within acommunity or region by expenditures from new business. The introduction of casi-nos and other gambling facilities often encourages large investments into communi-ties for new capital projects, and additional spending for continual improvementsand refurbishment on the initial investment. For example, according to ArthurAnderson Inc. (1996), in 1995, estimated total annual expenditure on construction,purchases of property, furniture and equipment, including improvements and refur-bishments, for the American casino gaming industry was US$4.3 billion. Overall,therefore, in assessing the net economic impact of new entrants to the marketplace,it is necessary to determine if spending on new business(es) is actually new to thecommunity or if it is merely income redirected from existing local business(es).
So-called input-output models may be used to assess the economic impact of an indus-try within a specific region by providing a basis for measuring the effects of changesin spending or employment from one industry on other industries. These models rec-ognize, for example, that the outputs of one industry are the inputs of other industriesand that employee wages from a given industry are spent on goods in other industries.Other measures of the economic benefits from the introduction of gambling facilitiesto a specific region are increased employment opportunities, licensing fees, and pur-chases of the capital and raw materials to build and maintain the premises.
Although the aforementioned determinants of economic impacts are the best mea-sures for determining the net economic benefit of gambling, such data are, unfortu-nately, not generally available. However, an examination of the governmentrevenues derived from licensure and taxation, the allocation of gambling revenuesto socially beneficial causes, and the increases in employment and tourism as a resultof gambling provide an alternative estimate of the benefit received by the commu-nity or region in which gambling occurs.
When measuring the economic costs of gambling, opponents of gambling argue thatcasinos and other such facilities stimulate corruption and criminal activities. Quan-tifying the cost of crime involves estimating expenses for arrests, prosecution, andimprisonment. In addition, the costs of gambling include expenses involved in theregulation of the industry and the treatment of problem gamblers. Overall, the actualnet economic benefit from gambling is determined by the extent to which newmoney generated from gambling activities exceeds the costs incurred to generatethat new money.
Gambling with Our Future? 70
Fraser Institute Digital PublicationFebruary 2002
According to the Nobel Laureate economist Paul Samuelson:
(Gambling) involves simple transfers of money or goods between individ-uals, creating no new money or goods. Although it creates no output, gam-bling does nevertheless absorb time and resources. When pursued beyondthe limits of recreation, where the main purpose after all is to kill time, gam-bling subtracts from national income.
Other economists have taken exception to Samuelson’s characterization of gam-bling. They point out that his criticisms could be applied to attendance at the cinemaor visits to Disneyland. The latter are products that do not add to the ability of theeconomy to produce more but still have value because they provide utility (i.e., sat-isfaction) to consumers (Dunstan 1997).
Canada
Economic benefitsThe most recent and comprehensive analysis of the economic costs and benefits oflegalized gambling in Canada found that the net economic benefit was equivalent to$3.044 billion in 1995, up from $526 million in 1990 (Vaillancourt and Roy 2000).
Government revenue derived from state-run lotteries, casinos, and VLTs increasedfrom less than $100 million in 1970 to $1.3 billion by 1985, and reached a total of $8.1billion in 1999. According to MPM Gaming Research (1998), in 1985 gambling reve-nue made up just 1.7 percent of provincial government revenue; by 1995, this portionhad increased to 3.8 percent. In Manitoba, gambling earns $220 million annually forthe provincial treasury and represents the latter’s third-largest source of revenue (in-come tax revenue in 1998 was $1.4 billion and retail sales tax revenue was $745 mil-lion). Manitoba’s provincial government obtains 3.9 percent of its revenue fromgaming, second only to Alberta among the provinces. Between 1992 and 1997(table 35), total gambling revenues for provincial governments grew from $1.7 billionto $3.8 billion. Overall, the portion of revenue derived from gaming activities also in-creased during this period. The largest increase occurred in Alberta: in 1992 the por-tion of government revenue from gaming was 1.1 percent; in 1997, it was 4.2 percent.
As discussed in an earlier section, much of the controversy surrounding VLTs stemsfrom their availability in untraditional gambling venues, such as corner stores andgas stations. Researcher John Jozsa (1999) testified to the Nova Scotia Standing Com-mittee on Community Services that “[t]he cost of VLT gambling is not cheaper ormore effective in any way for the gambler than any other forms of gambling. This is

Gambling with Our Future? 71
Fraser Institute Digital PublicationFebruary 2002
one of the reasons government and the retailers can have such a relatively high takefrom the VLT” (Jozsa 1999: 5). Other reasons that governments receive a relativelyhigh return from VLTs are their low operating cost and their low price elasticity, thatis, the unresponsiveness of VLT players to price changes (see table 36).
EmploymentThe gambling industry has become a major employer in most provinces and territo-ries. Between 1992 and 1999, employment in the gaming industry increased from11,900 to 39,200, an increase of 330 percent. In comparison, 1.8 million jobs were cre-ated in non-gambling industries, representing only a 14 percent increase. There alsotends to be an above-average representation of women and youths employed in thegambling industry. In 1999, 56 percent of those employed in the gambling industrywere women (employment in other industries was 46 percent female) and 60 percentof employees were under 35 years of age (39 percent in other industries).
Table 35: Provincial gambling expenditure per capita and govern-ment revenue in Canada, 1992 and 1997
Sources: Marshall 1998; Statistics Canada, National Accounts.
Expenditure per capita
($CDN; ages 18+
Total (CDN$ millions)
Government share of total revenue (%)
1992 1997 1992 1997 1992 1997
Newfoundland 151 243 43 75 2.3 3.6
Prince Edward Island 236 340 8 13 1.8 2.4
Nova Scotia 200 296 69 102 2.6 3.4
New Brunswick 224 328 48 68 1.9 2.1
Quebec 134 348 473 1,054 1.6 3.0
Ontario 109 300 530 1,242 1.3 2.6
Manitoba 126 310 105 211 2.4 4.1
Saskatchewan 76 275 40 141 1.0 2.7
Alberta 99 328 125 643 1.1 4.2
British Columbia 157 153 239 262 1.6 1.2
Yukon & Northwest Territories 72 75 — 1 — 0.3

Gambling with Our Future? 72
Fraser Institute Digital PublicationFebruary 2002
Full-time employment in the gambling industry increased from 59 percent in 1992 to82 percent in 1999, identical to the full-time rate in other industries (Marshall 2000).Wages and remuneration for employees of the gambling industry tend to be lowerthan in other Canadian industries. Men in full-time gambling-related jobs earned, onaverage, $16.19 per hour while women earned $14.66. Male and female workers inother industries earned $18.58 and $15.32 per hour, respectively (Marshall 2000).This is because a majority of gaming employees are younger and less educated thanworkers in other industries. Table 37 presents statistics for the gaming industry com-piled by Statistics Canada.
Tax RevenueAccording to the National Council on Welfare (1996), the provincial tax burden in Al-berta was $214 less per person in 1995 because of gambling proceeds. That is, with-out the presence of gambling, the Alberta government would have had to raise taxesby $214 per person to maintain the same level of government service to Albertans.One of the main criticisms of gaming taxes is that they are a regressive form of taxa-tion because, as a proportion of their incomes, low-income gamblers contribute more
Table 36: Provincial government revenue from gambling in Canada, 1998
Sources: Canada West Foundation 1998; Provincial Lottery Corporation (1997/1998), Annual Report.
All gambling (percent of
total revenue)
VLTs and slots (percent of
total revenue)
Net VLT revenue
Newfoundland 2.4 1.2 N/A
Prince Edward Island 2.1 1.0 $121,357,000
Nova Scotia 3.1 1.6 $518,236,100
New Brunswick 2.0 1.2 $143,336,000
Quebec 2.8 0.8 N/A
Ontario 2.8 0.0 $315,353,000
Manitoba 3.9 2.0 $ 57,696,000
Saskatchewan 2.9 1.5 $ 80,711,000
Alberta 4.0 2.7 $ 8,798,000
British Columbia 1.4 0.0 $ 44,330,000

Gambling with Our Future? 73
Fraser Institute Digital PublicationFebruary 2002
to tax revenues than middle-income and high-income gamblers. A gaming tax isconsidered progressive if a larger proportion of revenue comes from gamblers inhigher-income brackets. As detailed in an earlier section, although it is accurate tosay that lower-income players spend a higher proportion of their disposable incomeon gaming, they do so willingly. Furthermore, gamblers with higher incomes actu-ally spend considerably more money in nominal terms on gaming than do gamblerswith lower incomes.
Table 37: Employment characteristics in gambling and other industries in Canada (1999)
Sources: Labor Force Survey; Survey of Consumer Finances.
Gambling Other industries
Sex
Men 44% 54%
Women 56% 46%
Age
15–34 60% 39%
35 and over 40% 61%
Education
High school or less 55% 48%
Post-secondary 45% 52%
Occupation
Artistic, Literary, Recreational 38% 2%
Clerical 27% 15%
All other occupations 35% 83%
Work status
Full-time 82% 82%
Part-time 18% 18%
Average hourly earnings
Men (full-time) $16.19 $18.58
Women (full-time) $14.66 $15.32

Gambling with Our Future? 74
Fraser Institute Digital PublicationFebruary 2002
Within each province, local gaming authorities and related organizations provideemployment for a variety of people. For example, in 1998 the Saskatchewan IndianGaming Association employed approximately 850 people; 70 percent of those em-ployed were aboriginal. The Saskatchewan Liquor and Gaming Authority (1998) em-ployed 721 people in 1998, of which 317 were employed full-time and 404 wereemployed part-time.
TourismAs explained earlier, new wealth from casino gaming stems from monies wageredby patrons from outside the respective casino’s region, namely tourists. Thus, mosteconomists would agree that spending on casino gaming by local residents providesthe smallest benefit (if any) to the local economy. It is the new money injected intothe economy by people visiting a region that provides a net benefit. Furthermore,Canadian casinos located near the border between Canada and the United States,such as the Casino Windsor, have a competitive advantage over their American coun-terparts because winnings are not taxed in Canada as they are in the United States.
As such, the economic benefits derived from “destination casinos” will differ fromthose derived from casinos that serve primarily local customers. Destination casinosare expected to attract increased commerce, revenue, and employment, offset mini-mally by minor inconveniences and environmental problems such as crowding, traf-fic congestion, and parking problems (Room, Turner, and Ialomiteanu 1999). A studyby Ernst & Young (1994) found that in Windsor, Ontario, 41 percent of the Americantourists would not have visited the area without the casino (Henriksson 1996). Al-though destination casinos appear to have positive short-term benefits, there areconcerns that increased competition will detract from the overall profitability ofthese casinos. Detroit, Michigan, for example, has made plans to establish three ca-sinos in order to deter residents from crossing the border to gamble in Windsor.
Casinos that mainly serve tourists create economic growth for their respective com-munities. Casino Windsor opened in July 1998, employing over 5,000 people. Thecombined casino complex and hotel was expected to create over 15,000 direct and in-direct jobs (Ontario Casino Corporation 1998). In 1998, Casino Windsor generatedgross revenues of $515.1 million and had an average of 13,000 visitors a day. In Que-bec, the operation of casinos contributes to sustaining approximately 7,440 jobs,along with annual economic production of $257 million. In addition to dividends ofapproximately $224 million from casino profits, the Quebec government also collectstax revenues of about $41 million annually as a result of casino-related activities(Loto-Quebec 1998a). Ontario’s Casino Niagara, located in Niagara Falls, Ontario, isestimated to generate $1.3 billion dollars of new economic activity annually throughcasino-related activities and increased tourism.

Gambling with Our Future? 75
Fraser Institute Digital PublicationFebruary 2002
Although the Manitoba Lotteries Corporation, which is responsible for all gamblingin that province, is unable to identify the specific percentage of total gambling reve-nue that stems from tourism, in 1998 it estimated that Winnipeg was visited by ap-proximately 600 tour-bus groups carrying, in total, about 27,000 gamblers. Estimatedlocal spending from tourism, combined with its associated economic benefits such asjob creation and spending on goods and services totaled $17 million (Waytiuk 1999).
Cultural and non-profit organizationsEvery year, the Manitoba Lottery Corporation provides community support througha wide range of community events and programs. For example, it expects to increaseannual funding to over $1.5 million for the Addictions Foundation of Manitoba. InAlberta, the Alberta Lottery Corporation also provides community support throughthe Alberta Lottery Fund, which funds over 4,000 community initiatives each year.In 1997/1998, the donations totalled over $596 million (Alberta Gaming and LiquorAuthority 1998).
Many gambling operations provide funding to cultural and non-profit organiza-tions. Since 1995, Loto-Quebec has invested over $1.7 million in the visual arts. Non-profit organizations throughout Quebec also benefit from the gaming industry. Afterthree months of operation, the amount received by non-profit organizations fromnetwork bingo was over $2.1 million. Furthermore, Loto-Quebec has already do-nated $2 million to scientific research and development and has decided to fund theCentre Québeçois d’excellence pour la prevention et le traitement du jeu. In Ontario,the provincial government-run casinos contribute $100 million annually to sociallybeneficial causes (Youngman Berdahl 1999).
In British Columbia, on October 31, 1997 the provincial government enacted theGaming Proceeds Distribution Regulation, which updated its gaming revenue policiesto provide a new revenue distribution model for charities, government, and gamingoperators. Charities are now designated to receive one-third of the net revenue fromcharity casinos and bingo operations after payments of operator commissions andprizes. The government receives the remaining two thirds of net revenue.
A report prepared by Youngman Berdahl (1999) for the Canada West Foundationstressed the importance of gaming grants to non-profit organizations in Alberta,Saskatchewan, and Ontario. Overall, of the 400 survey respondents, 28 percent ofnon-profit organizations rated gaming grants as their top funding source and 50 per-cent of the sample rated gaming grants in their top three funding sources. Eighty-four percent of the sample either agreed or strongly agreed with the statement:“Without lottery or gaming grants and charitable gaming, many non-profits wouldnot have the funds necessary to run their programs.”

Gambling with Our Future? 76
Fraser Institute Digital PublicationFebruary 2002
Economic costs
CrimeA common misconception is that there is an association between gambling facilitiesand the incidence of crime. Although gaming-related offences peaked in the early-to-mid-1970s, they have since fallen sharply. Jackson and Griffiths (1991) attributethe mild fluctuations around the downward trend to shifting social attitudes towardgambling and declining attention by law enforcement. In Canada, both the actualnumber of felonies committed in this area and the rate of such crime have histori-cally been very low but, in the early 1990s, the rate sank further to record low levels.On average, in the period between 1991 and 1995, only two of every 100,000 Canadi-ans committed offences related to gaming. The sharp decline is related, at least inpart, to the wider availability of legal gambling venues throughout the country.Table 38 presents the number of Canadian gambling-related offences in 1997.
Room, Turner, and Ialomiteanu (1999) compared public perceptions of the effect ofthe opening of Casino Niagara in 1996 and the actual events. Overall, prior to theopening of the casino, 77 percent of respondents expected the number of seriouscrimes to increase but following the establishment of the casino, only 44 perceivedthis as having happened. Furthermore, the perceptions that young people would getinto trouble with the law, family break-ups would increase, and people would moveaway were all exaggerated. With the exception of increases in traffic congestion, andminimal environmental impacts (e.g., increased littering, higher noise levels, andmore numerous drunken disturbances) the presumed negative impacts associatedwith the introduction of the casino were, in reality, minimal.
The Alberta Gaming and Liquor Commission (1998) reported 149 gambling-relatedincidents in 1996/1997. Most incidents involved violations of VLT retailer agree-ments, that is, cheating at play at casinos and illegal gaming activities. Also, therewere 154 new gaming investigation files opened by the Commission’s Special Oper-ations Division, with the result that 40 charges were laid under the Gaming and LiquorAct. In comparison, the Commission reported 647 liquor-related incidents in 1997/1998 and 433 incidents in 1996/1997.
The government of Nova Scotia conducted extensive research to examine the viabil-ity of banning VLT gaming. The Standing Committee on Community Services(1999a) heard testimony from the Royal Canadian Mounted Police (RCMP), whichclaimed that the legalization of VLTs in Nova Scotia was partly motivated by a con-cern with illegal VLTs. The RCMP believes that the legalization of VLTs and enforce-ment of the applicable laws has almost completely wiped out the province’s onceabundant illegal machines. Further testimony reported that the removal of VLT

Gambling with Our Future? 77
Fraser Institute Digital PublicationFebruary 2002
Table 38: Incidents reported to police in Canada, by most serious offence (1997)
Notes: [1] To produce the “actual number” of incidents, unfounded incidents are subtracted from the number of reported incidents. [2] Rates arecalculated per 100,000 population. The population estimates for 1997 are updated post-censual estimates as of July 1, and are provided by StatisticsCanada Demography Division, Population Estimates Section (Canadian population = 30,285,800). Due to rounding, figures may not add exactly tototals. [3] “Clearance rate” is the number of incidents cleared by charge and cleared otherwise in the reporting period, divided by the actual numberof incidents in the reporting period. Since a criminal incident may be solved several months or years after it was first reported in the UCR survey, itis possible for the number of incidents cleared to be greater than the total number of actual incidents. [4] The category, persons charged, includes thenumber of people charged or recommended for charges by police according to the most serious offence.
Source: Statistics Canada, Catalogue no. 85-205-XPE.
Offence
Actual Number1
Rate2 Offences Cleared Adults Charged4 Youths Charged4
By charge Otherwise Clearance Rate3
Male Female Male Female
Betting House
45 — 44 — 97.8 131 11 — —
Gaming House
83 — 66 11 92.8 188 30 1 1
Other 293 1 123 57 61.4 117 62 3 —
Total 421 1 233 68 71.5 436 103 4 1

Gambling with Our Future? 78
Fraser Institute Digital PublicationFebruary 2002
machines would have limited effects on the economy because expenditures on gam-bling would likely be directed to other gambling activities. One of the concerns re-ported to the Standing Committee was that, if there was a significant increase inillegal gambling activities, government revenues would be affected, as the govern-ment cannot collect taxes on illegal gaming. Therefore, if the province banned VLTs,it would incur an estimated loss of $57.1 million of the current $80.4 million it re-ceives from VLT revenue. Furthermore, if VLTs were banned in Nova Scotia, with theexception of First Nations Reserves, it is estimated that the household income ofNova Scotians would decline by about $3.7 million, 145 full-time equivalent jobswould be terminated, and government revenue would decline by approximately $57million (Standing Committee on Community Services 1999).
A connection between gambling and crime is also seen in the expense incurred forthe additional resources required to regulate and monitor gambling offences. Al-though this data is not available, it is noteworthy that many casinos provide the fi-nancial resources necessary to cover the costs of additional police officers requiredto monitor gambling communities. For example, the Windsor and Niagara casinosfund 25 police officers to patrol their respective neighborhoods and Casino Rama pro-vides funding for 11 police officers to patrol the Chippewas of Rama (Mnjikaning)First Nations lands (Ontario Casino Corporation 1998).
AddictionCosts are also incurred in the treatment of problem gamblers. For example, the Ad-dictions Foundation of Manitoba receives between 1,700 and 1,800 telephone callsevery year from people who are experiencing gambling-related problems (Waytiuk1999). In New Brunswick, a gambling hotline referral service receives approximately450 calls annually from problem gamblers seeking assistance. In addition, treatmentprofessionals trained to diagnose and treat problem gamblers are located in each ofthe province’s seven addiction units, although there are no staff positions dedicatedto gambling services (Volberg 1996).
United States
Economic benefitsIn the United States, as elsewhere, there are direct and indirect taxes imposed ongambling activities. Indirect tax revenues consist of two types. The first type of indi-rect tax paid on gambling activities is the tax paid by individuals who acquire newincome as a result of casino operations. The second type of indirect tax revenue is thetax paid by casino patrons on hotel rooms, meals, and other local expenditures. Fed-eral taxes represent less than 18 percent of the total tax burden for gamblers with theremainder being paid at the state and the local level.

Gambling with Our Future? 79
Fraser Institute Digital PublicationFebruary 2002
In 1997, the largest American casino markets were:
♦ Nevada: 429 full-scale casinos, 1,978 slots-only locations, one Indian casino,and gross casino revenues of US$7.9 billion;
♦ New Jersey: 14 casinos and gross casino revenues of US$3.9 billion; and ♦ Mississippi: 29 state-regulated casinos, one Indian casino, and gross casino
revenues of US$2 billion (NGISC 1999b).
In 1995, the casino gaming industry reported between US$22 billion and US$25 bil-lion in total revenues, US$16.3 billion of which was derived specifically from casinogaming. The federal, state, and local governments received $2.9 billion in taxes fromgambling activities. Direct employment in the casino-gaming industry was esti-mated at 284,000 with wages of approximately $7.3 billion. These estimates excludeactivities from casinos operated by Native Americans, casinos on cruise ships andcertain non-casino slot machines, which had estimated casino revenues of more thanUS$6 billion (Arthur Anderson 1996).
As noted earlier, a recent American study demonstrates that gambling improves theoverall socioeconomic health of the community in which the gambling occurs. TheNORC (1999) study used a sophisticated statistical model to determine the socioeco-nomic impacts of a casino’s proximity on various social and economic indicators suchas employment and crime. The study concluded that the “casino effect” does not sig-nificantly increase either crime or bankruptcy. Proximity to a casino does, however,significantly increase per-capita casino spending, income, and employment. Addi-tionally, the study showed that the proximity of a casino brought a decrease in thepercentage of the labour force unemployed, the number of tax dollars spent on wel-fare payments, and government transfer payments. Furthermore, local economieswith legalized gambling experienced growth in the construction trades, the hotel andhospitality industries, and the recreation and amusement sector (NORC 1999).
Employment in the American gambling industry is comparable to other industries interms of wages and benefits. Annual salaries averaged US$26,000 in the largest casi-nos, US$20,500 in smaller commercial casinos, and $18,000 in tribal casinos. (NGISC1999b). Arthur Anderson (1996), found that, in 1995, the average national wage, in-cluding tips and benefits, paid to casino gaming employees was approximatelyUS$26,000. This compares to US$20,000 in the amusement and recreation industry,US$16,000 in the hotel and motel industry, and US$22,000 in the motion picture indus-try. The overall national average wage (including tips and benefits) for all industrieswas approximately US$26,000. In 1996, more than half a million people were em-ployed by the legal gambling industry and earned more than US$15 billion in wages.Table 39 shows the number of employees by state, including the total wages for 1995.

Gambling with Our Future? 80
Fraser Institute Digital PublicationFebruary 2002
Riverboat casinos were introduced to Iowa in 1991 and quickly spread throughoutthe United States. By 1998, there were over 40 riverboat casinos operating in Illinois,Indiana, Missouri, and Iowa, and nearly 50 riverboat and dock-side casinos in Lou-isiana and Mississippi. In 1997, revenues from riverboats totaled US$6.1 billion. Thesame year, riverboats paid over $1 billion in gambling privilege taxes (NGISC1999b). Since being introduced to the American gambling market, riverboat casinoshave contributed hundreds of millions of dollars in investment capital to Mississippialone. Although the short-term effects of legalized gaming appear to be promising,according to the UNLV International Gaming Institute (1996), the ultimate impact ofthe newly legalized gaming jurisdictions will depend on the future conditions of thecompetitive marketplace, including the ability to attract tourism, comparative taxstructures, and the types of gambling permitted in the respective jurisdictions.
In 1999, the estimated employment in the United States in the pari-mutuel gamingindustry was 119,000. Of this number, track and off-track betting operations consti-tuted 36,300 jobs, the maintenance of competing horses, 52,000, and horse breeding,30,800. James Hickey of the American Horse Council suggests that, overall, theannual impact of the pari-mutuel industry on the American economy is US$34billion, supporting 473,000 jobs (NGISC 1999b).
Table 39: Employees and wages in the casino gaming industry in some American states, 1995
Sources: State Commissions; Casino Association of New Jersey; Harrah’s Survey of Casino En-tertainment, 1996, Arthur Anderson LLP.
Employees Wages (US$000s)
Colorado 6,500 131,000
Illinois 12,000 306,000
Indiana 1,000 25,000
Iowa 3,800 97,000
Louisiana 13,600 312,000
Mississippi 27,100 564,000
Missouri 8,200 215,000
Nevada 170,000 4,280,000
New Jersey 40,800 1,374,000
South Dakota 1,100 27,000
Total 284,100 7,331,000

Gambling with Our Future? 81
Fraser Institute Digital PublicationFebruary 2002
In 1997, Coopers & Lybrand L.L.P. conducted a nationwide survey of gaming indus-try employees on behalf of the American Gaming Association (AGA). As of July1997, total employment in the industry was approximately 330,000. The survey wasadministered to 178,000 employees, approximately 54 percent of the total number ofworkers in the industry. Employment in the gaming industry had grown by approx-imately 46,000 jobs (16 percent) since December 1995. By comparison, total non-ag-ricultural job growth in the United States was approximately 2.2 percent in 1995, and3.5 percent in the service sector (Coopers & Lybrand 1997). Gaming-industry em-ployees also donated more than US$58 million to charitable organizations in the pastyear and contributed 884,000 hours of volunteer time (Coopers & Lybrand 1997).
Ryan and Speyrer (1999) present the results of a survey issued to 13,000 Louisianabusinesses in 1998. In Lake Charles, 72.3 percent of respondents indicated that gam-bling had positively affected their community; in Shreveport-Bossier City, the pro-portion was 71.5 percent; in New Orleans, Baton Rouge, and the rest of Louisiana thepositive responses were 44.7 percent, 47.8 percent, and 51.3 percent, respectively.This study concluded that the overall measurable cost/benefit ratio for the forms ofgambling studied in the report for the state of Louisiana was positive. This conclu-sion was based on the assumption that the costs of gambling include the regulatorycosts to the state government and the measurable external or social costs created bythe gambling industry. The net benefit created by gambling in Louisiana totaledUS$1.1 billion while the net cost totaled US$531.5 million; hence, the benefit/cost ra-tio is slightly higher than two. Overall, therefore, based on the measurable economiccosts and benefits (table 40), it appears that the benefits of the Louisiana gamblingindustry significantly outweigh its attendant costs (Ryan and Speyrer 1999).
Table 40: 1998 Louisiana gambling cost/benefit analysis (US$ millions)
Source: Ryan and Speyrer 1999: iv.
Benefits
New Earnings $660.36
New Direct Taxes $447.12
Total Benefits $1107.48
Costs
Regulatory Costs $50.02
Measurable Social Costs $481.45
Total Costs $531.47
Benefit/Cost Ratio 2.08
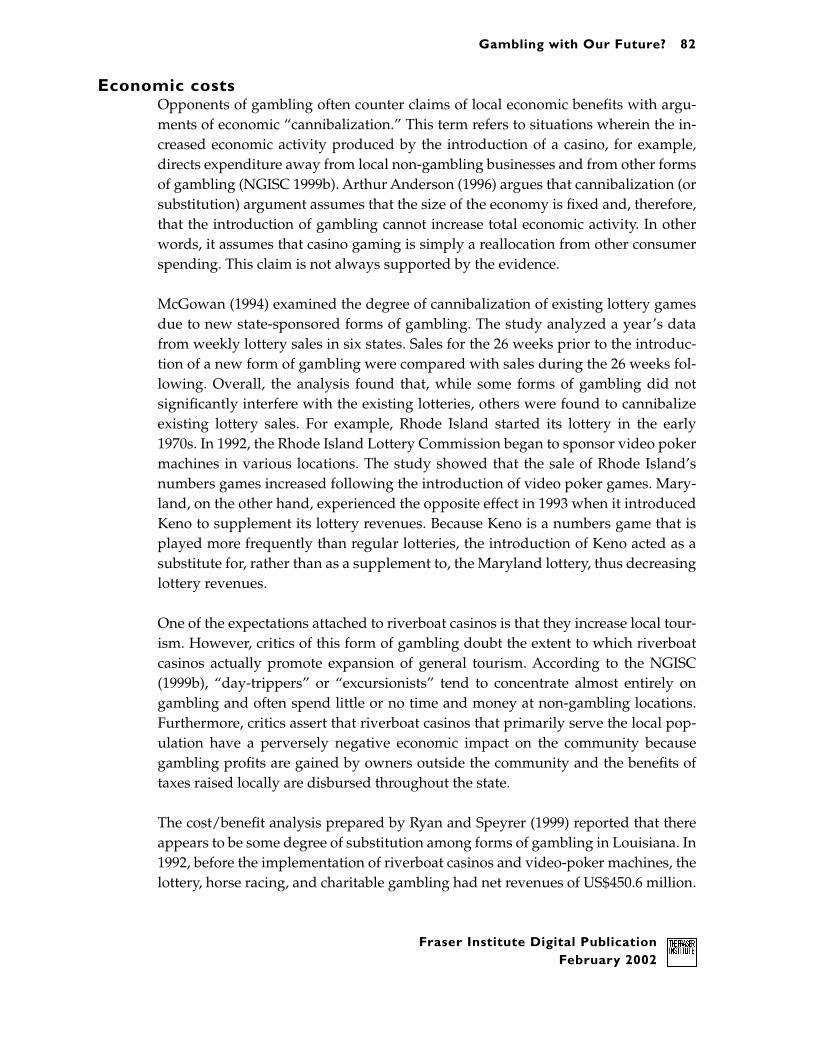
Gambling with Our Future? 82
Fraser Institute Digital PublicationFebruary 2002
Economic costsOpponents of gambling often counter claims of local economic benefits with argu-ments of economic “cannibalization.” This term refers to situations wherein the in-creased economic activity produced by the introduction of a casino, for example,directs expenditure away from local non-gambling businesses and from other formsof gambling (NGISC 1999b). Arthur Anderson (1996) argues that cannibalization (orsubstitution) argument assumes that the size of the economy is fixed and, therefore,that the introduction of gambling cannot increase total economic activity. In otherwords, it assumes that casino gaming is simply a reallocation from other consumerspending. This claim is not always supported by the evidence.
McGowan (1994) examined the degree of cannibalization of existing lottery gamesdue to new state-sponsored forms of gambling. The study analyzed a year’s datafrom weekly lottery sales in six states. Sales for the 26 weeks prior to the introduc-tion of a new form of gambling were compared with sales during the 26 weeks fol-lowing. Overall, the analysis found that, while some forms of gambling did notsignificantly interfere with the existing lotteries, others were found to cannibalizeexisting lottery sales. For example, Rhode Island started its lottery in the early1970s. In 1992, the Rhode Island Lottery Commission began to sponsor video pokermachines in various locations. The study showed that the sale of Rhode Island’snumbers games increased following the introduction of video poker games. Mary-land, on the other hand, experienced the opposite effect in 1993 when it introducedKeno to supplement its lottery revenues. Because Keno is a numbers game that isplayed more frequently than regular lotteries, the introduction of Keno acted as asubstitute for, rather than as a supplement to, the Maryland lottery, thus decreasinglottery revenues.
One of the expectations attached to riverboat casinos is that they increase local tour-ism. However, critics of this form of gambling doubt the extent to which riverboatcasinos actually promote expansion of general tourism. According to the NGISC(1999b), “day-trippers” or “excursionists” tend to concentrate almost entirely ongambling and often spend little or no time and money at non-gambling locations.Furthermore, critics assert that riverboat casinos that primarily serve the local pop-ulation have a perversely negative economic impact on the community becausegambling profits are gained by owners outside the community and the benefits oftaxes raised locally are disbursed throughout the state.
The cost/benefit analysis prepared by Ryan and Speyrer (1999) reported that thereappears to be some degree of substitution among forms of gambling in Louisiana. In1992, before the implementation of riverboat casinos and video-poker machines, thelottery, horse racing, and charitable gambling had net revenues of US$450.6 million.

Gambling with Our Future? 83
Fraser Institute Digital PublicationFebruary 2002
In 1996, after riverboat casinos and video-poker machines were fully implemented,the lottery, horse racing, and charitable gaming had net revenues of only $269.3 mil-lion, a 40 percent decline in revenues.
CrimeThere are two prevailing arguments regarding the relationship between gamblingand crime. According to the NGISC (1999b), opponents to gambling argue that theintroduction of legalized gambling increases crime in a community while propo-nents claim that legalized gambling reduces crime because it eliminates incentivesfor illegal gambling. The Federal Bureau of Investigation (FBI) publishes an annualreport, Crime in the United States, which includes statistical information about levelsof crime in America. According to this 1997 publication, there are a number of factorsthat affect the volume and type of crime occurring from place to place. These include:
♦ population density♦ variations in the age distribution of the population, particularly the per-
centage of youths♦ stability of population: residents’ mobility, commuting patterns, and de-
gree of transiency♦ modes of transportation and highway system♦ economic conditions, including median income, poverty level, and job
availability♦ cultural factors and educational, recreational, and religious characteristics♦ family conditions, including divorce and family cohesiveness♦ climate♦ effective strength of law enforcement agencies♦ administrative and investigative emphases of law enforcement♦ other components of the criminal justice system♦ citizens’ attitudes toward crime.
Table 41 presents an excerpt from the 1996 edition of Crime in the United States. Thetable shows the total number of arrests, broken down by the type of charge and byrace. A comparison between the number of arrests for alcohol- and drug-related of-fences and gambling-related offences shows that the incidence of crime attributableto gambling is substantially lower than the rate related to drugs and alcohol.
Margolis, Altheimer, and Gray (1997) prepared a detailed analysis of the relationshipbetween casinos and crime. The study focused on 10 American jurisdictions thathave commercial casinos. According to these researchers, the New York State TaskForce on Casino Gambling Report found that the crime trends in Atlantic City havebeen misinterpreted by many observers, who failed to account for an increase in the

Gambling with Our Future? 84
Fraser Institute Digital PublicationFebruary 2002
Table 41: Persons arrested in the United States, by charge and race, 1996
Source: US Federal Bureau of Investigation, Crime in the United States, annual report. Data shows arrests, not charges, reported by 10,027 agenciescovering a total 1996 population of 196 million as estimated by the FBI.
Offence charged
Total arrests (1,000) Percent distribution
Total White Black American Indian / Alaskan Native
Asian / Pacific
Islander
White Black American Indian / Alaskan Native
Asian / Pacific
Islander
Drug Abuse Violations 1,160.7 701.9 445.8 5.7 7.3 60.5 38.4 0.5 0.6
Driving under the Influence
1,050.2 911.5 107.1 17.9 13.7 86.8 10.2 1.7 1.3
Liquor Laws 499.0 403.8 79.2 12.6 3.4 80.9 15.9 2.5 0.7
Drunkenness 525.4 426.3 84.6 12.5 2.0 81.1 16.1 2.4 0.4
Gambling 17.2 7.9 8.7 0.1 0.6 45.6 50.4 0.4 3.6

Gambling with Our Future? 85
Fraser Institute Digital PublicationFebruary 2002
number of out-of-town visitors frequenting its casinos. Although Atlantic City has apermanent resident population of 37,000, its average daily population swells to threetimes that number. Between 1977 and 1980, reported violent crime increased 130 per-cent and non-violent crime increased 176 percent. Although the number of crimes in-creased, the risk of individual victimization appeared to have fallen slightlyaccording to visitor-adjusted per person crime rates. Most of the additional offencesinvolved thefts that took place on the casino floor or in adjacent hotel complexes,rather than in the surrounding community. Overall, crime rates in Atlantic City havebeen in decline since 1982, despite a steady increase in gaming revenues.
Las Vegas, Nevada is considered the casino capital of the world. Every year, Las Ve-gas receives approximately 30 million tourists, conventioneers, and business people,who frequent its casinos. The Las Vegas Metropolitan Statistical Area (MSA) popu-lation increased from 462,000 in 1980 to 1.2 million in 1996. Despite a tremendous in-flux of tourists and a large population, however, according to the FBI, Las Vegas hasa lower crime rate and is safer than virtually every major American tourist venue.
Margolis, Altheimer and Gray (1997) also examined the incidences of crime in relationto the riverboat casinos introduced to Iowa in 1991. Overall, it was observed that thecity of Davenport’s crime rate declined in the first three years following the introduc-tion of the casino, then increased in 1995 in tandem with crime levels prevalent in therest of the state. The reported total number of offences in the towns of Iowa in whichriverboat casinos operate indicates that crime rates either remained constant or roseincrementally with the prevailing statewide sociodemographic trends.
Miller and Schwartz (1998) report that one of the most common fallacies in the studyof casinos and street crime is the assumption made by many critics of legalized gam-bling that casinos are something separate and different from other entertainment at-tractions. The authors cite a study by Chesney-Lind and Lind (1986) that found thatone of the reasons why there is more crime in tourists areas is that tourists them-selves are targets for crime. The authors suggest that tourists who leave cameras onbeach towels while swimming are more likely to be theft victims; tourists who areout carousing and drinking heavily late at night in dangerous neighborhoods aremore likely to be robbed or raped; and tourists who leave expensive valuables inanonymous and loosely guarded hotel and motel rooms are more likely to be the vic-tims of burglary (Miller and Schwartz 1998).
The NGISC (1999b) also reported that all of the evidence presented to the Commis-sion indicated that state regulation, in addition to facilitating the takeover of muchof the industry by reputable private corporations, has eliminated organized crimefrom the direct ownership and operation of the casinos. Evidence provided a scholar

Gambling with Our Future? 86
Fraser Institute Digital PublicationFebruary 2002
studying criminal justice at Virginia Commonwealth University found that the ar-rest trends for embezzlement, forgery, and fraud in nine of the largest casino marketsshow no consistent pattern, although more jurisdictions report decreases than in-creases in arrests (NGISC 1999b).
Opponents of gambling claim that those who experience problems with their gam-bling resort to criminal activities to finance their addiction. According to the Na-tional Research Council: “As access to money becomes more limited, gamblers oftenresort to crime in order to pay off debts, appease bookies, maintain appearances, andgarner more money to gamble” (NGISC 1999a: 7–13). Tables 42 and 43 show theweighted occurrences of crimes by type of gambler and an estimate of the costs in-curred for these offences. NORC (1999) estimates that the arrests of problem andpathological gamblers (on an annualized, present-value basis) cost governmentUS$960 and US$1,250, respectively. The estimated “lifetime” costs are approximatelyUS$10,500 for pathological and US$5,100 for problem gamblers.
The NORC study estimates that these costs amount to approximately US$3,000 an-nually per pathological gambler (table 44). Other costs of gambling include unem-ployment benefits and monies that employers spend to recruit and train newworkers, increased welfare use, and bankruptcy filings. According to NORC, prob-lem and pathological gamblers account for approximately 15 percent of total gam-bling revenues in the United States or US$7.6 billion per year.
Several NGISC panelists were troubled by the report’s finding that the cost of prob-lem gambling is relatively small—about US$5 billion a year in legal fees for divorce,court and jail costs for arrests, lost wages, and bankruptcy—in comparison withcosts of US$72 billion for smoking, US$166 billion for alcohol abuse, and US$71 bil-lion for motor vehicle crashes (Arnold 1999).
Another measure of the net economic effect of gambling is its effect on property val-ues. An increase in property values may indicate a positive effect from gambling;conversely, a decrease in property value suggests a negative effect that may be attrib-utable to gambling. The NGISC (1999b) reports that, although the introduction ofgambling increased the rate of growth of property values, the greatest effect was re-alized by commercial property values. Residential property values were not raisedat all and. in fact, may have been slightly lowered by casino gambling.
The aforementioned NORC (1999a) study reported estimates of the annual costs fortreatment of pathological gamblers. In the NORC survey, 33.8 percent of pathologi-cal gamblers reported they were in poor or fair health, while approximately 14 per-cent of low-risk gamblers reported they were in poor or fair health. NORC estimated

Gambling with Our Future? 87
Fraser Institute Digital PublicationFebruary 2002
Table 42: Weighted occurrences of criminal-justice consequences by type of gambler
Source: NORC 1999a: 48.
Table 43: Criminal justice losses by type of gambler
Source: NORC 1999a: 48.
Table 44: Financial costs by type of gambler
Source: NORC 1999a: 46
Non-Gambler
Low Risk At Risk Problem Gambler
Pathological Gambler
Arrested 4.5 11.2 20.7 36.3 32.3
Number of times arrested
1.7 2.1 2.9 1.6 3.3
Incarcerated 0.4 3.7 7.8 10.4 21.4
Type of cost Who pays? Time period of estimate
Problem gambler
Pathological gambler
Arrests Government Lifetime $960 $1,250
Corrections Government Lifetime $670 $1,700
Type of costWho pays? Time period
of estimateProblem gambler
Pathological gambler
Unemployment benefits
Government Past year $65 $85
Welfare benefits Government Past year $90 $60
Filed bankruptcy
Creditors Lifetime $1,600 $3,300

Gambling with Our Future? 88
Fraser Institute Digital PublicationFebruary 2002
annual health-care expenditures increased by approximately US$750 per person forpathological gamblers. Furthermore, approximately 13 percent of pathological andproblem gamblers reported use of medical services during the past year comparedto just under seven percent of low-risk gamblers and non-gamblers. The estimatedaverage cost of mental-health services per gambler (problem and pathological) is$350 per year.
The National Council on Problem Gambling (NCPG) is the national coordinatingbody for 34 state affiliates and other treatment organizations and self-help groups.According to NCPG’s “National Survey of Problem Gambling Programs,” in 1998the combined resource allocation by states was approximately US$20 million annu-ally to 45 different organizations. The AGA-funded National Center for ResponsibleGaming (NCRG) also supports the treatment of problem and pathological gamblers.In 1997, for example, NCRG awarded 10 grants totalling US$1.3 million for investi-gations into the effects of disordered gambling behaviour.
Australia
Economic benefitsAustralian lotteries are heavily taxed and a major source of revenue for state gov-ernments. A majority of the government revenue raised by lottery taxes is ear-marked for various socially beneficial causes. For example, in Queensland the1997/1998 taxes and levies on gambling totaled over AUS$528 million. Of thisamount, contributions were made to the following funds: Casino Community Ben-efit Funds ($4.7 million), Gaming Machine Community Benefit Fund ($17.3 mil-lion), Charities & Rehabilitation Benefit Fund ($26.4 million), and the Sporting &Recreation Fund ($43.7 million). The total amount contributed was $92.1 million(ACIL Consulting 1999).
Overall, NSW Lotteries (1998) estimates that the direct contribution from lotteries tothe Australian economy is over AUS $1 billion or approximately 0.3 percent of GDP.In New South Wales, the direct employment in lottery operations is estimated at ap-proximately 2,000 and an estimated 5,000 jobs were created as a result of the indirectbenefits of the activities of NSW Lotteries. Since it was established over 67 years ago,NSW Lotteries has paid out more than $7 billion to thousands of winners and con-tributed nearly $3.5 billion (representing approximately a third of every dollar re-ceived) to the Consolidated Fund for the benefit of the New South Wales population.In 1997, more than $300 million was raised through lottery revenue, which paid formany essential services that otherwise would be funded through another revenuesource or not at all (NSW Lotteries 1998).

Gambling with Our Future? 89
Fraser Institute Digital PublicationFebruary 2002
“Consumer surplus,” as previously discussed, measures the difference between theamount a consumer is prepared to pay for a good or service rather than go without itand the amount actually paid. “Producer surplus” is defined as: “The net economicbenefit to the providers of gambling services, which together with the revenue fromgambling taxes is approximately measured by the industry’s ‘value-added’ or contri-bution to national GDP” (ACIL Consulting 1999: xv). It is estimated that the Australiangambling industry generates an annual producer surplus of approximately AUS$5 bil-lion and contributes approximately $5.5 billion annually to the nation’s GDP.
Licensing is another method by which governments are able to collect revenue fromgambling activities. Government control over the issuance of gambling licenses al-lows the government to control the number of competitors in the market and main-tain high entry costs. Although there is no taxation on minor gambling, revenue iscreated through fees for permits for the major art unions and for major bingo centers.According to the Queensland Government (1998), the total license fee collected forminor gaming in 1997/1998 was AUS$2.9 million.
Unsurprisingly, employment in the gambling industry increases in the communityor region where gambling occurs. The Australian Bureau of Statistics (ABS) compilesannual statistics on Australia’s gambling industries. In 1994/1995, there were 48,618Australians employed in pubs, bars, and taverns with gambling facilities and 53,181employed in clubs with gambling facilities. Table 45 compares employment levelsfor pubs, taverns, bars, and clubs with and without gambling facilities. Table 46shows employment levels during 1994/1995 in pubs, taverns, and other facilitiesthat offer gambling opportunities, commissions from gambling, operating profit be-fore and after tax, and gross industry profit.
Clearly, there are many Australians employed in the gambling industry. Accordingto a study by the National Institute of Applied Economic and Social Research (NI-AESR) (1997), new gambling operations (i.e., EGMs and casinos) increased employ-ment in Victoria by 34,000 persons (ACIL Consulting 1999). In 1994/1995,approximately 135,000 individuals were employed in gambling and related indus-tries. Of this amount, it is estimated that 32,000 were employed in businesses wherethe predominant activity was the provision of gambling services. Nearly 103,000 in-dividuals were estimated to be employed in clubs, pubs, taverns, and bars with gam-bling facilities (ACIL Consulting 1999).
New money introduced to a country or region by tourists is one of the principal tan-gible benefits of providing the opportunity for people to gamble. The Australian Ca-sino Association estimates that one million overseas tourists visit Australian casinoseach year (ACIL Consulting 1999). According to ACIL Consulting (1999), following

Gambling with Our Future? 90
Fraser Institute Digital PublicationFebruary 2002
Table 45: Employment levels in Australia in businesses with and without gambling facilities, 1994/1995
Source: ABS, 1996, Cat No 8687.0
Table 46: Employment levels in Australia in businesses offering gambling, 1994/1995
Source: ABS, 1996, Cat No 8687.0
Pubs, taverns and bars Clubs
With Without With Without
Number of businesses 2,327 1,997 2,114 1,140
Number of employees 48,618 22,820 53,181 9,355
Average number of employees per business
21 11 25 8
Gambling Industry Other venues offering gambling
Lotteries Casino Other Pubs,taverns
and bars
Clubs
Number of businesses 178 14 1,849 2,327 2,114
Number of employees 2,006 15,837 14,219 48,618 53,181
Sales of G&S 4,099 1,643 9,699 3,385 —
Takings or commissions from gambling
3,997 1,383 9,627 576 —
Takings or commissions from gambling (percent)
97.5% 84.2% 99.3% 17.0% —
Operating profit before tax
793 107 391 183 —
Operating profit margin (percent)
19.4% 6.5% 4.0% 3.9% —
Industry gross profit 867 650 594 1,257 —

Gambling with Our Future? 91
Fraser Institute Digital PublicationFebruary 2002
the introduction of the Jupiter casino in late 1985, hotel occupancy rates on Austra-lia’s Gold Coast increased from 55 percent in 1985 to over 70 percent in 1988.
Australian gambling taxes are complex, varying by state and by gambling product.Some forms of gambling face flat taxes while others are governed by progressive taxstructures, which may vary according to the size of the gambling facility (e.g., casi-nos pay higher taxes on EGMs than smaller operators). Older forms of gambling,such as horse racing, have a turnover tax. New forms of gambling tend to be taxedon expenditures (or on the percentage of the money lost by players).
The government also generates gambling revenues through the issuance of gam-bling licenses. These licenses create barriers to entering the gambling market by re-stricting the number of licenses available and by effectively requiring highpurchasing rates for operators who wish to obtain a license. Table 47 shows the typeof tax assessed on each of the major forms of gambling in Australia.
In Australia, gambling taxes are generally considered an acceptable method of reve-nue collection because gambling is popular among most taxpayers and voters andgambling taxation is under the control of the respective state governments ratherthan the national government. Governments earn approximately AUS$3.5 billionper annum from taxes levied on gambling. Most of these taxes are levied by state andterritorial governments, which receive 11 percent of their taxation revenues fromgambling taxes. The gambling industry is subject to higher rates of taxation thanmost other Australian industries and rates vary considerably for different forms ofgambling (Australia’s Gambling Industries 1999). In 1997/1998, revenue from taxeson gambling accounted for 10 percent of total state, territory and local governmentrevenue (table 48).
In 1997, the state of Queensland introduced a tax scale based on the “metered win”(i.e., profit) retained by individual gaming venues. The progressive tax rate was in-tended to increase the competitiveness of small and medium sized clubs. The agree-ment was implemented in 1997/1998, lowering the levels of taxation for gamingmachines located in hotels.
Economic costsIn Australia, both gambling and non-gambling industries have experienced the ef-fects of substitution due to the introduction of new forms of gambling and the intro-duction of casinos and EGMs has resulted in reduced expenditures on race gambling.In testimony to the Productivity Commission, the Australian Retailers Association(ARA) reported that over the last two decades, retailing has lost considerable marketshare. In 1973/1974, retailing attracted 43 percent of total consumption expenditure;

Gambling with Our Future? 92
Fraser Institute Digital PublicationFebruary 2002
Table 47: Major forms of taxation on various types of gambling
Jurisdictions applying taxes: (1) South Australia, Northern Territory, Queensland, New SouthWales, Victoria, Tasmania, Australian Capital Territory. (2) Western Australia, South Australia, NorthernTerritory, Queensland, Tasmania, Australian Capital Territory. (3) Northern Territory. (4) South Aus-tralia, New South Wales. (5) Western Australia, South Australia, Queensland, New South Wales, Vic-toria. (6) Western Australia, South Australia, Northern Territory, Queensland, Tasmania, AustralianCapital Territory.(7) All. (8) South Australia, Northern Territory, New South Wales, Victoria, Tasmania,Australian Capital Territory. (9) Victoria. (10) Western Australia, South Australia, Queensland, NewSouth Wales, Victoria, Tasmania, Australian Capital Territory. (11) New South Wales, Victoria. (12)South Australia, Northern Territory. (13) Victoria. (14) All. (15) All. (16) Western Australia, South Aus-tralia, Queensland, New South Wales, Victoria, Tasmania, Australian Capital Territory. (17) All. (18)Queensland, New South Wales, Victoria. (19) All. (20) Western Australia, South Australia, NorthernTerritory, Victoria, Tasmania, Australian Capital Territory.
Source: Productivity Commission 1999: M.2
Gambling activity
Type of tax
On turn-over
On players’ losses
On net profits
License fees
Bookmakers (racing) ♣1 ♠ 14
Bookmakers (sports betting) ♣2 ♠ 15
Casinos ♦ 7 ♠ 16
Drawing-card machines ♣3
Keno ♣4
Lotteries ♠ 17
Lottery subscriptions ♣5
Minor gambling (bingo, raffles, etc.) ♠ ΝΑ
Off-course Totalisator investment ♥ 12
Poker machines ♥ 13 ♠ 18
Poker machines in hotels, clubs, casinos ♦ 8
Racing ♠ 19
Sports betting ♠ 20
Sports betting (sports book) ♦ 9
TAB sports betting ♦ 10
Totalisator wagering on racing ♣6 ♦ 11

Gambling with Our Future? 93
Fraser Institute Digital PublicationFebruary 2002
Table 48: Gambling taxation revenue (AUS$ millions), by state, 1997/1998
Source: ABS, 1998 Cat No 5506.0.
New South Wales
Victoria Queensland South Australia
Western Australia
Tasmania Northern Territory
Australian Capital
Territory
Total
Lotteries and Lotto 290 286 166 77 79 19 11 11 939
Gaming machines 672 704 197 158 — — — 28 1,759
Casino 110 175 87 19 55 35 12 4 497
Race betting 265 127 92 58 36 9 8 5 600
Other 1 4 — — — — — — 6
Total 1,338 1,296 543 313 171 65 31 48 3,805

Gambling with Our Future? 94
Fraser Institute Digital PublicationFebruary 2002
by 1993/1994, this amount had decreased to 36 percent (Australian Bureau of Statis-tics, National Accounts and Retail Trade Statistics, 1974/1975 and 1993/1994). Themain source of expenditure negatively affecting the retail industry is entertainment,including gaming. For example, between 1973/1974 and 1993/1994 the entertain-ment and recreation industries increased their share of expenditure by nearly 40 per-cent, or (using 1993/1994 prices) an additional AUS$20 billion in sales. This comparesto additional expenditures over that time in the retailing industry of AUS$11 billion.
United Kingdom
Economic benefitsThe National Lottery was established by the former Conservative Government toraise money for socially beneficial causes. In total, there are six “Good Causes,”namely the arts, sports, charities, heritage, celebrating the millennium, and the newhealth, education, and environment cause. Out of every pound sterling spent on theNational Lottery, approximately 28 pence are contributed to the Good Causes. It isprojected that by the end of 2000 the National Lottery will have created over 100,000jobs (table 49) (UK National Lottery 1999).
Table 49: Projected job creation from the National Lottery in the United Kingdom, by sector, in 1999 and 2000
Source: UK National Lottery.
1999 2000
Construction and related professions 27,892 30,305
Managing and staffing new complexes 15,246 24,115
Jobs resulting from revenue projects 43,000 4,300
Retailing 18,860 18,860
Camelot’s suppliers 580 580
Camelot 660 660
NLDF bodies 380 380
Total 67,918 79,200
Spin-offs and multiplier effects in year 2000 — 30,000
Total by year 2000 109,200

Gambling with Our Future? 95
Fraser Institute Digital PublicationFebruary 2002
Munting (1996) addresses the importance of gambling taxes to government revenue.With the abandonment of lotteries early in the nineteenth century, government inter-est in gambling revenue was minimal. It was the reintroduction of gambling taxesafter World War II that rejuvenated the appeal of gambling revenue to the govern-ment. Since gambling taxes were reintroduced in 1948, they have provided a signif-icant proportion of total government revenue. A shift from direct to indirect taxes, atrend prevalent after 1979, resulted in an increase in the proportion of all govern-ment income derived from taxes on expenditure, though there was no effect on totaltax revenues. Another trend evident with government taxation is that expenditureon gambling grows at a slower rate than on other products, resulting in adjustmentsto gambling taxes to maintain previous revenue levels (Munting 1996).
Smith (1998) reported that in 1996/1997, two percent of national tax revenue was de-rived from gambling. Furthermore, of the £72 billion wagered each year, govern-ment receives over £3 billion. Munting (1996) presents government revenue data forthe period from 1966 to 1991 derived from the different forms of gambling availablein Britain and from the overall gambling industry in the United Kingdom. The datashow that the percentage of gambling revenue collected by government between1966 and 1991 has increased for all forms of gambling with the exception of bettingin soccer pools. Overall, government revenue from the taxation of gambling in-creased from £3.7 million (0.1 percent of total revenue) in 1966 to over £1 billion (6.0percent of total revenue) in 1991.
According to the UK National Lottery (1999), the effective tax rate for the lottery(duty, plus Good Causes on stake, less winnings) is 80 percent. Thus, the true tax ratefor the lottery is much higher than the “headline” quoted duty rate of 12 percent.Taxes on the lottery are also higher than for any other sector within the gaming in-dustry. Overall, the revenue distribution of British lotteries is approximately 15 per-cent to administration, 30 percent to charities, 30 percent to prizes, and 25 percent togovernment coffers (The Economist 1992, cited in McGowan 1994).
Licensing also provides government with an alternative method of collecting reve-nues from gambling operations. Munting (1996) presents the number of bookmakerpermits and betting-shop licenses granted between 1961 and 1990. Although thenumber of bookmaker permits peaked in 1968, the number of licenses issued hasbeen in decline since that time. Betting-shop licenses, on the other hand, have in-creased markedly between 1961 and 1985, with a slight decline between 1985 and1990 (table 52).

Gambling with Our Future? 96
Fraser Institute Digital PublicationFebruary 2002
Table 50: Sources of tax revenue from gambling in the United Kingdom
Notes: Actual total in 1966/1967 includes an additional £436,000 bookmakers license fees, subsequently discontinued; true total in 1970/1971 includes£400,000 betting premises license duty, subsequently discontinued.
Sources: Annual Reports for HM Customs and Excise; CSO Annual Abstract of Statistics.
1966/1967 1970/1971 1981/1982 1990/1991
£millions Percent £millions Percent £millions Percent £millions Percent
Betting duty 12.8 25.8 71.1 54.8 255.0 49.8 479.1 47.6
Pool Betting 32.2 64.8 45.3 34.8 176.0 34.4 303.9 30.2
Gaming License 1.5 3.0 1.7 1.3 11.6 2.3 57.4 5.7
Bingo 0.5 1.0 3.9 3.0 43.6 8.5 67.4 6.7
Gaming Machines 2.7 5.4 7.9 6.1 26.2 5.1 98.6 9.8
Total 49.7 100 129.9 100 512.4 100 1006.4 100

Gambling with Our Future? 97
Fraser Institute Digital PublicationFebruary 2002
Table 51: Government revenues from all taxes in the United King-dom, 1947 to 1991, compared to revenue from taxes on betting and gaming (£millions at current prices)
Note: A pool-betting duty on football pools and dog-track totalisators was introduced in 1948. In 1964,fixed-odds football betting was made subject to this duty. From October 1966, a general betting duty wasintroduced on all betting with bookmakers and totalisators. The dog-track pool betting duty was super-seded thereby though remained for football pools. Gambling duties were introduced at the same time asannual license charges for premises and gaming machines. These duties are aggregated in the table.
Sources: Annual Reports for HM Customs and Excise; CSO Annual abstract of statistics.
Table 52: Number of bookmakers’ permits and betting-shop licenses issued, 1961 to 1990
Source: UK Government, betting office license statistics.
Revenue from all taxes
Revenue from taxes on betting & gaming
Revenue Percent of total
1947/1948 4,011.3 3.7 0.1
1948/1949 4,108.0 23.4 0.6
1955/1956 5,160.4 28.2 0.6
1963/1964 6,890.2 33.3 0.5
1967/1968 11,227.3 67.9 0.6
1974/1975 23,570.1 238.4 1.0
1981/1982 76,755.0 512.4 0.7
1984/1985 98,246.7 660.9 0.7
1990/1991 102,366.1 1,000.4 0.6
Permits Shops
1961 9,944 8,802
1968 11,069 15,782
1971 9,414 14,462
1978 7,960 12,812
1981 7,576 11,993
1985 7,065 10,633
1990 5,406 10,081

Gambling with Our Future? 98
Fraser Institute Digital PublicationFebruary 2002
Economic costsIn 1951, a Royal Commission considered evidence from a number of sources aboutgambling and criminal activity and concluded that:
Gambling is of no significance as a direct cause of serious crime, and littleimportance, at any rate at the present time, as a direct cause of minor of-fences of dishonesty. We do not doubt that there is not uncommonly con-nections to be found between dishonesty and excessive gambling inpersons of generally dissolute character, but we should not regard this asevidence that gambling, in itself, is a cause of crime. (Cornish 1978: 68)
More recent evidence reveals a general consensus that the British gambling industryis relatively crime-free and that bettors, although offered numerous opportunities tobreak the law, generally do not. According to Rosecrance (1998), British gaming hasenjoyed a reputation for honesty since 1968, when the Gaming Board was grantedautonomous control over the gambling industry. Munting (1996) makes the criticalobservation that one of the reasons that crime has been considered a direct conse-quence of gambling is that betting and gaming used to involve breaking the law. Fur-thermore, gambling losses were believed to cause people to commit crimes andgambling believed to attract criminal elements. Today, just as no serious commenta-tor would suggest that casino gaming in the United States is sui generis associatedwith crime, there is great confidence that the criminal element is minimized in theBritish gaming marketplace, where the Gaming Board has enjoyed draconian controlfor more than 30 years.

Gambling with Our Future? 99
Fraser Institute Digital PublicationFebruary 2002
Gambling on Indian reservations
Indian casinos have channelled a staggering amount of money to some of Amer-ica’s most wretched places.
The Economist (July 15, 2000)
Most of the available research about gambling on Indian reservations has been car-ried out in the United States. Consequently, this section will focus exclusively ongambling on Indian reservations in the United States. Due to provisions in theAmerican Constitution and subsequent laws and treaties with particular tribes,those tribes are effectively recognized as separate nations and are provided with anunique form of sovereignty. According to these provisions, state laws do not applyto Indians living on reservations. The main responsibility of the federal governmentis to protect tribes’ self-governing status and tribal property rights. Although Indianreserves are considered sovereign entities, tribal governments will occasionallyadopt local building, health, or safety codes as law. State and local governmentsusually provide the infrastructure, such as roads and bridges, near reservations thatoperate tribal gambling facilities.
According to the Bureau of Indian Affairs (BIA), 554 federally recognized tribes with1.65 million members, exist within the United States. This represents less than onepercent of the American population. Of these tribes, 146 offer Class III gambling un-der the terms of 196 tribal-state compacts.4 In 1988, approximately 70 Indian casinoand bingo halls operated in 16 states; by 1998, approximately 298 facilities were op-erating in 31 states (NGISC 1999b).
Heightened interest in large-scale Indian gambling came to the forefront in 1987,when the Indian gaming industry began to experience rapid growth. As an emerging
[4] Class I consists of traditional tribal games and social games for prizes, which are subjectsolely to tribal regulation. Class II consists of bingo, instant bingo, lotto, punch cards, andsimilar games and card games legal anywhere on the state and not played against the house.Class III consists of all other games (other than those in class I and class II), including elec-tronic facsimiles of games of chance, card games played against the house, casino games,pari-mutuel racing, and jai alai (NGISC 1999b: 6–8).

Gambling with Our Future? 100
Fraser Institute Digital PublicationFebruary 2002
industry, Indian gambling was perceived to require a regulatory framework to en-sure its success. Consequently, in 1988 the US Congress passed the Indian GamblingRegulatory Act (IGRA), which provided the necessary statutory framework to over-see Indian gaming facilities. Also in 1988, the National Indian Gaming Commission(NIGC) was established by the IGRA as an independent agency within the federalDepartment of the Interior. According to Cornell, Kalt, Krepps, and Taylor (1998),over the following two years the NIGC conducted 500 visits to Indian gaming oper-ations in 25 states, resulting in 55 enforcement actions against violators of IGRA andNIGC regulations. In 1997, the NIGC collected more than US$1 million in fines andoperating fees of approximately $1.5 million. Indian gaming revenues in 1997 con-sisted of 39 percent of revenue from fees, 35 percent from cost reimbursements, and26 percent from appropriations. Indian gaming revenues increased from approxi-mately US$212 million in 1988 to more than $6.7 billion in 1997 (NGISC 1999b). TheNIGC has successfully brought more than 95 percent of tribal gambling facilities intocompliance with federal law. Although the NIGC’s original purpose was to focus onthe regulation of Class II gambling, the rapid growth of Class III gambling ultimatelyresulted in greater emphasis on Class III gaming as well.
According to the National Research Council, “The recent institutionalization of gam-bling appears to have benefited economically depressed communities in which it isoffered” throughout the United States (NRC: 1). One of the most striking exampleshas been the tremendous improvement in various social indicators on Indian reser-vations. Before the establishment of legal Indian gambling, many tribes lived in des-perate conditions. Poverty and unemployment rates of Indian American tribes werethe highest of any ethnic or racial group in the United States and per-capita income,education levels, rates of home ownership, and other social indicators were amongthe lowest (table 53). The growth of Indian gambling has stimulated the reservations’once stagnant economies, improving the social well-being of many Indian tribes.
Revenues derived from gambling operations have allowed many tribes to make un-precedented improvements in economic and social health. Gambling revenues areused to support many tribal government services, including tribal courts, law en-forcement, fire protection, water, sewer, solid waste, roads, environmental health,land-use planning, and other social welfare programs. Indian gambling facilitiesprovide approximately 100,000 jobs for tribal members in areas where unemploy-ment rates often previously exceeded 50 percent of the adult population (NGISC1999b). Although critics of gaming argue that employment in the gaming industryconsists of relatively low-paying jobs and, therefore, should be discounted, the factremains that the employment rates on reservations have increased as a result of le-galized gambling. Furthermore, as shown in table 54, the Sault Ste. Marie Tribe ofChippewa Indians, for example, had a higher proportion of gaming workers earningabove US$20,000 annually than it did non-gaming workers.

Gambling with Our Future? 101
Fraser Institute Digital PublicationFebruary 2002
Table 53: Indicators of social health in the United States for Native Americans on reservations compared to all races (1989)
[1] Unless otherwise indicated, figures given are for the Native American population (including Amer-ican Indian, Eskimo and Aleut) on reservation and trust lands. [2] Figures are for total population onreservation and trust lands.
Source: Cornell, Kalt, Krepps, and Taylor 1998: 25.
Indicator1Average for Native
Americans on Reservations and Trust Lands
Average for United States
Income and Employment
Median Household Income $12,459 $30,056
Per Capita Income $4,478 $14,420
Unemployment Rate 25.6% 6.3%
Poverty Rate 50.7% 13.1%
Child Poverty Rate 55.3% 17.9%
Household Receiving Public Assistance Income 18.7%2 7.5%
Income and Employment
High School Graduates 53.8% 75.2%
College Graduates 3.9% 20.3%
Children and Families
Families with Female Head 31.6% 20.4%
Single Parent Families 50.3% 24.0%
Housing
Owner-Occupied Homes 69.7% 64.2%
Homes Lacking Complete Plumbing 17.0%2 1.2%
Homes Lacking Complete Kitchen 15.2%2 1.2%
Homes with Telephone 71.6%2 94.8%

Gambling with Our Future? 102
Fraser Institute Digital PublicationFebruary 2002
Before establishing a casino, the St. Regis reservation (population 18,000) was inneed of 20 miles of water lines, sewer lines, employment opportunities, and a highschool. In an interview with The New York Times on March 1999, Chief Hilda E.Smoke, who once was adamantly opposed to casinos on her ancestral land, ex-plained that casinos were a way for the tribe to get out of poverty. The US$30 millioncasino is expected to bring in annual revenues of US$100 million, with a net profit ofmore than US$40 million.
Cornell, Kalt, Krepps, and Taylor (1998) present allocations from gaming revenue in-tended by a number of Indian tribes (see table 55). In 1997, the Ho-Chunk nation al-located 25.6 percent of its gaming revenues to tribal economic development,including a proportion designated for loans to tribal entrepreneurs. The Rock Siouxtribe assigned 59 percent of gaming revenues to health and human services and es-tablished several businesses, including a hotel, an RV Park, a recreation area, and ayacht marina. All of these businesses were made possible due to the influx of visitorsto tribal gaming facilities. As shown below, the revenue generated from gamblinghas ostensibly been used, for the most part, to improve overall conditions on Indianreserves throughout the country.
Table 54: Distribution of salaries among Chippewa Indians (Sault Ste. Marie tribe) employed in the gaming and in other industries, 1997
Source: Information provided by the tribe.
Annual Salaries Gaming Non-Gaming
> US$15,000 44% 18%
> US$20,000 17% 5%
> US$25,000 6% 2%
> US$30,000 3% 1%
> US$35,000 2% < 1%
> US$40,000 2% < 1%
> US$45,000 1% < 1%
> US$50,000 1% < 1%

Gambling with Our Future? 103
Fraser Institute Digital PublicationFebruary 2002
Table 55: Expenditures from gaming revenue and federal and state transfers as percent of tribal budget, 1997
Allocation plan
Category Percent of Revenues
Transfers
Ho-Chunk1
Yes General welfare of tribal members 52.26%
Tribal economic development 25.55%
Tribal government operation 16.27% 4%
Local government services 5.72%
Charitable donations 0.20%
Mohegan3
Yes Tribal government operations3 45.57%
Regulatory compliance and safety 23.87%
Tribal economic development 13.68%
Capital expenditures 6.55% > 2%
Education 3.71%
Health and human services 3.61%
Cultural 3.01%
Oneida1
Yes General welfare of tribal members 58.97%
Tribal government operations and programs 27.72%
Tribal economic development 8.72% 7.9%
Per-capita payments to elderly members5 2.81%
Local government operation (supplemental) 1.37%
Charitable donations 0.42%

Gambling with Our Future? 104
Fraser Institute Digital PublicationFebruary 2002
Notes: [1] Includes per-capita payments for fiscal year 1998. The budgeted amount for per-capita pay-ments is $48,600 or 46.53%. [2] Data for the period from January 1, 1971 to April 1, 1998. [3] Thetribe’s Gaming Revenue Allocation Plan was approved by the Federal Government in late 1997 and re-sulted in modest semi-annual payments to the memberships. Two payments of $1,500 have been madeso far. [4] Since the introduction of Class III, the Mohegan Tribe has adopted a policy of not seeking oraccepting any Federal assistance or grant funding with the exception of its contracts with the HIS andBIA. Furthermore, the tribe is considering reducing the amount of government assistance from theseprograms to a token sum of one dollar. In early 1997, the tribal actually returned $3 million receivedfrom HUD so that less advantaged tribes would benefit. [5] In fiscal year 1998, the per-capita paymentto elderly members of the tribal will be $2,000 each. [6] This figure shows the percentage of total tribal“funds,” including gross gaming and non-gaming revenues, that comes from government grants. Thus,the percentage of government transfer payments out of net tribal funds is higher than this figure. [7]Data is for 1998 tribal budget. [8] Revenue breakdown is summarized from individual line item pay-ments, excluding loan repayments. Data is for 1994–1997.
Source: Information provided by the tribes.
Sault St. Marie Chippewa
NoGaming revenues are primarily used for tribal eco-nomic development, funding tribal government op-erations, and creating tribal self-efficiency funds.
N/A 44%
Standing Rock Sioux
No Tribal government operations
Health and human services 59.00%
Economic development 23.00%
Education 7%8 66%
Cultural 6.00%
(Tribe does not make per-capita payments) 5.00%
Allocation plan
Category Percent of Revenues
Transfers

Gambling with Our Future? 105
Fraser Institute Digital PublicationFebruary 2002
As discussed in an earlier section, opponents of gaming often argue for its prohibi-tion by citing an increase in the incidence of crime due to the introduction of gam-bling. Table 56 shows the number of crimes committed per 100,000 people before andafter the introduction of Indian gaming in counties where gaming was introduced inthe 1990s.
Analysis of the data reveals no correlation between the introduction of gaming facil-ities and higher incidence of crime. Some tribes experienced minimal increases in theincidence of crime, while others experienced a decrease in the number of crimescommitted after the introduction of gaming facilities. In other words, the random-ness of changes in incidences of crime indicate that there is little, if any, relationshipbetween the introduction of gambling opportunities and crime rates.
The taxation of Indian gambling has generated a great deal of debate about the In-dian gambling industry. Because Indian tribes are self-governing entities, they arenot subject to federal income tax. If Indian tribes own casinos, for example, net rev-enues go directly into the hands of tribal governments. The IGRA requires that rev-enues acquired by Indian gambling facilities be used for tribal governmentalservices and the economic development of the tribe. If gaming revenues are used forthese purposes, they are not subject to federal taxes. Furthermore, state income taxesdo not apply to Indians who live on reservations and earn their income from tribalenterprises. State income tax does apply to non-Indians working at Indian casinos,Indians who live off the reservations, and to Indians who live on reservations butearn their income from non-tribal operations. However, many tribes have agreed onvoluntary payments to neighbouring communities to compensate the latter for theprovision of services, such as fire protection, ambulance, and other similar services.

Gambling with Our Future? 106
Fraser Institute Digital PublicationFebruary 2002
Table 56: Visitor-adjusted1 crime rates in counties containing tribal casinos before and after the in-troduction of gaming
Notes: [1] Visitor adjustment is performed by adding the estimated number of daily casino visitors to the resident population of the county whencalculating crime per 100,000. For the Sault Ste. Marie Chippewa tribe, Ho-Chunk nation, and Standing Rock Sioux tribe, daily casino visitors areestimated using actual 1997 casino visitation data. For other tribes, daily casino visitors are estimated based on the population within a 50-to- 100-mile radius of the casino and the known propensity for individuals within that distance from the casino to patronize the casino. [2] Index crimes arethe sum of known offences and arrests for murder, manslaughter, forcible rape, robbery, aggravated assault, burglary, larceny, and motor vehicle theft.[3] Incomplete statistics reported for 1995.[4] The Sault Ste. Marie Tribe has operated a casino in Chippewa County since 1985. Prior to 1991/1992,when the casino went through a major expansion, the casino was very small.
Source: FBI; Information provided by the tribes.
Tribe CountyFirst full year of operation
Index crimes2 reported per 100,000 population in gaming
1990 1991 1992 1993 1994 1995 1996
Ho-Chunk Jackson, WI 1993 3,376 3,875 3,834 3,615 3,748 3,177 3,910
Sauk, WI 1993 2,968 2,863 3,087 2,848 3,310 N/A3 3,869
Wood, WI 1993 3,180 3,273 3,044 3,489 3,104 2,858 3,214
Mashantucket Pequot New London, CT 1992 4,943 5,194 3,650 3,734 3,268 3,495 3,178
Oneida Brown, WI 1992 4,008 4,110 3,731 3,705 3,715 3,846 3,716
Sault Ste. Marie Chippewa Chippewa, MI 19924 3,419 3,025 3,437 2,949 2,811 2,176 2,602
Mackinac, MI 1991 7,467 5,591 4,655 4,828 5,650 5,640 4,242
Standing Rock Sioux Sioux, MD and Corson, SD
1994 N/A N/A 2,291 675 2,415 392 174

Gambling with Our Future? 107
Fraser Institute Digital PublicationFebruary 2002
Regulation of Internet gambling
Advances in computer and telecommunications technology have increased theavailability of gambling. New technology holds the potential to change the subjec-tive experience of gambling and to increase how often, how much, and how longpeople gamble.
The National Research Council
Internet gambling sites offer a variety of gaming opportunities including casino-style gaming such as blackjack, roulette, poker, and other traditional table games.Also available on the Internet are on-line casinos, lotteries, bingos, and sports bet-ting. What distinguishes Internet gambling from more traditional forms of gamblingis the physical separation between the service provider and the consumer. It is esti-mated that there are 200 million people worldwide who now have access to the In-ternet (Sama 1999). As such, the Internet offers these potential consumers convenientand inexpensive access to their favorite gaming sites, introducing competition intoan industry once dominated by highly restrictive licensing practices.
Size of the Internet gambling market
A number of analysts have attempted to estimate the size of the Internet gamblingindustry. As of May 1998, the NGISC (1999b) identified approximately 90 on-line ca-sinos, 39 lotteries, eight bingo games, and 53 sport books. One year later, the NGISCestimated that over 250 on-line casinos, 64 lotteries, 20 bingo games, and 139 sportbooks were available via the Internet. Sebastian Sinclair, a research consultant withChristiansen/Cummings Associates, estimated the number of gamblers participat-ing in Internet gambling at 6.9 million in 1997 and 14.5 million in 1998. Sinclair alsoestimated revenues from Internet gambling of US$651 million in 1998, and forecastan increase to US$2.3 billion by 2001.
The Australian research firm, ACIL Consulting, on the other hand, offers a more con-servative estimate of the size of the Internet gambling industry. It claims that thereare approximately 35 to 40 sites currently available worldwide that offer mainly

Gambling with Our Future? 108
Fraser Institute Digital PublicationFebruary 2002
casino-style games. Most of them are located in the Caribbean and appear to be gov-ernment-licensed. Although ACIL Consulting concluded that estimating the exactdollar value is highly problematic, there is a general consensus that the on-line gam-bling industry will experience significant growth (ACIL Consulting 1999).
Regulation or prohibition?
Internet games and the high level of privacy they offer may exacerbate problem andpathological gambling. Access to the Internet is easy and inexpensive and can beconducted in the privacy of one’s own home. Shielded from public scrutiny, patho-logical gamblers can traverse dozens of Web sites and gamble 24 hours a day.
The National Gambling Impact Study Commission
Most opponents of on-line gambling share concerns similar to those expressed bythe NGISC commissioners (whose report recommended a ban on Internet gam-bling). These critics believe that, because the Internet may be used anonymously,there is the potential for abuse of Internet gambling both by those unable to controltheir gambling and by underage gamblers: that the privacy provided gamblers bythe Internet will exacerbate problem gambling and provide underage gamblers withthe opportunity to use their parents’ credit cards, or even their own, to set up Inter-net gambling accounts.
McMillen and Grabosky (1998) compiled a list of problems pertaining to Internetgambling sites. These include:
♦ gambling sites may not be legitimate
♦ service providers may simply take gamblers’ money and shut down or failto pay any winnings
♦ gamblers have little recourse against illegitimate or unfair gambling sitesbecause there is no protection stemming from government licensing andregulation
♦ gamblers’ credit-card details are necessary to play on internet gamblingsites
♦ on-line facilities may be used for money laundering.
Another concern about Internet gambling is that the lack of accountability in the in-dustry may increase the potential for criminal activities including money launder-ing, unpaid winnings, and computer hackers manipulating software programs totheir own benefit.

Gambling with Our Future? 109
Fraser Institute Digital PublicationFebruary 2002
However, there are regulatory mechanisms that may be employed to ensure thatconsumers are protected and the activities of the criminal element minimized. Forexample, to prevent money laundering, the state should restrict the amount (or fre-quency) of cash deposits into players’ accounts. Although there is concern about thelegitimacy of all Internet gambling sites, most operate as legitimate businesses and,like any reputable business, rely on a strong customer base to remain profitable. Thenecessity of maintaining a strong customer base will motivate service providers tooffer legitimate gambling sites.
There is concern that the autonomy provided by the Internet may also encourageabuse of this form of gaming. Once again, sensible regulation may be the solution.Australia has a number of jurisdictions where Internet gambling is legal. Accordingto ACIL Consulting (1999), it would be difficult to open an account under the aliasof another person’s name as it would require developing a false identity, along withsupporting documents such as a passport or drivers license.
Opponents to gaming also propose the prohibition of Internet gambling on thegrounds that it is easily accessible by underage players. There are a number of rea-sons why this claim is unfounded. First, when opening an Internet gambling ac-count, players are required to enter a password in order to play. Even if a childacquires the account password, money has to be deposited into the account beforegambling can occur. Second, there is concern that children may use their parents’ ortheir own credit cards to gamble. It is important to remind ourselves that restrictingaccess to a parent’s credit card is not the responsibility of the gambling (or any other)industry but rather the responsibility of parents themselves. Additionally, if an indi-vidual is considered responsible enough to have a credit card, should not the choiceto gamble remain with the individual? Even if underage players are able to acquirea credit card, they are still required, by most sites, to provide other sources of iden-tification. Finally, technology (e.g., blocking and filtering devices) is available to par-ents and schools to restrict access to Internet gaming sites.
The emerging Internet gambling industry has demonstrated the potential for tre-mendous growth. Although estimates of the market potential of web-based gam-bling vary, there is a consensus that the market is expanding and will experienceexponential growth (ACIL Consulting 1999). This further suggests that prohibitingon-line gaming would be extremely difficult. Attempts to prohibit Internet gamblingin industrialized countries have resulted in many Internet gaming sites being estab-lished in small nations with little or no government regulation.5
[5] For a topical British illustration of the competitive market’s ability to circumvent domes-tic taxation demands placed upon Internet gambling, see Evans 2000.

Gambling with Our Future? 110
Fraser Institute Digital PublicationFebruary 2002
There are a number of arguably insurmountable challenges faced by governmentsthat endeavour, as recommended by the NGISC, to criminalize on-line gambling.According to McMillen and Grabosky (1998), there is a great degree of surveillancerequired to detect on-line illegality and there are difficulties in locating, investigat-ing, and prosecuting on-line offenders. In addition, the technological and humancapital required to locate offenders is substantial, as are the costs of prosecution andincarceration. Along with the inefficient use of resources caused by prohibition, thereis the threat of unintentionally increasing the criminal element. Current estimates ofmarket potential for this burgeoning industry show there is a demand for Internetgambling. The fact is that, if the marketplace demands Internet gambling, Internetgambling will be supplied with or without government consent. This is especiallytrue given service providers’ unrestrained access to overseas Internet sites in juris-dictions without Internet gambling restrictions. Furthermore, Bell (1999) argues thatthe inevitable failure of prohibition is attributable to two factors: first, Internet tech-nology renders prohibition futile since, as an international network, the Internet pro-vides an instant detour around domestic prohibition; and, second, consumerdemand for Internet gambling and the state’s demand for tax revenues will createenormous pressure for legalization.
Jurisdictions that have chosen to ban Internet gambling ultimately will spend a sub-stantial proportion of scarce resources in the regulation and policing of Internet gam-ing. As explained by McMillen and Grabosky, “Here we begin to see a situationwhere if one jurisdiction outlaws Internet gambling, it could be forced to bear all thecosts of enforcement, while the gambling revenues continue to flow into other juris-dictions” (1998).
Unlike the United States, Canada has embraced a more passive approach to regulat-ing the Internet gaming market. Currently, American opponents to gaming are ag-gressively seeking to prohibit Internet gambling. Canadian legislators appear to bewaiting for the international gaming structure to be established before determiningthe appropriate level of regulation. At present, Canadian gaming legislation pro-vides provincial governments with exclusive jurisdiction over the management oflottery schemes operated on or through a computer, video device, or slot machine.Although the legislation does not restrict the medium through which provincial gov-ernments may offer machine gaming, it has been suggested that current legislationpermits a province to offer Internet lottery schemes (Sama 1999). Thus far, the prov-inces have opted not to conduct lottery schemes via the Internet.
The American debate surrounding Internet gambling has been heightened due to theintroduction of the Internet Gambling Prohibition Act of 1999, which seeks to updatethe Wire Communications Act in an attempt to prohibit on-line Internet gambling. At

Gambling with Our Future? 111
Fraser Institute Digital PublicationFebruary 2002
the national level, these efforts have been spearheaded by Republican Senator JonKyl of Arizona and Democratic Representative Robert Goodlatte of Virginia. Al-though the US Senate endorsed Kyl’s anti-Internet gaming Bill in 1999, the legisla-tion failed to receive sufficient support in the House of Representatives when it wasintroduced on July 17, 2000. If the Kyl Bill had become law, the penalty for businessesoffering gambling over the Internet would have been a US$20,000 fine and companyexecutives could face imprisonment for up to four years. Individual bettors wouldhave been penalized according to whatever state laws applied within the jurisdictionwhere the offence took place.
In analyzing the merits of this legislation, Lisa S. Dean, vice president for technologypolicy for the Free Congress Foundation, offers the following insight:
When the sponsors of this legislation talk about banning Internet gam-bling, what they are really talking about is state lotteries because it (the leg-islation) essentially states that all Internet gambling should be prohibited—except gambling on horse racing, dog racing and similar activity. Why suchbroad carve-outs? If the sponsors say they want to ban gambling on the In-ternet, why not ban some of the most popular forms of gambling, namelyhorse racing, on the Internet? . . . This bill allows for some Internet gam-bling, but outlaws other forms which boiled down, is nothing more thanthe federal government picking winners and losers in the marketplace.Where does the federal government get the moral or legal authority6 to saythat a bet on the Kentucky Derby is acceptable, but a bet on the Super Bowlis not? (Dean 2000)
There is also controversy over the applicability of the phrase “wire communications”to the Internet, which potentially influences the regulation of other, future technolo-gies. According to the NGISC (1999b), the debate whether the intent of the originalanti-Internet gambling bill was to include all wire communications devices may bemoot because future technologies may enable individuals to bypass cables and tele-phone wires when establishing connections to the Internet. However, although thereare many Internet gambling sites already established overseas by American opera-tors, the state governments of Louisiana, Texas, Illinois, and Nevada have intro-duced or passed legislation specifically prohibiting Internet gambling.
Australia has been both progressive and forward-looking in determining a moreefficient market structure for Internet gambling. Australian regulators view the
[6] Under the American Constitution, gambling legislation is primarily the responsibility ofindividual states.

Gambling with Our Future? 112
Fraser Institute Digital PublicationFebruary 2002
Internet gaming industry as merely another form of electronic commerce that doesnot require prohibition. Australia legislators have attempted to develop a regulatoryframework to allow licensed operators to offer Internet gambling sites through theDraft Regulatory Control Model for New Forms of Interactive Gambling (the “DraftModel Code,” or DMC). The DMC does not propose federal government action toblock the entry of overseas gambling sites provided over the Internet by foreign sat-ellites (ACIL Consulting 1999).
In 1998, Queensland’s state government introduced the Interactive Gambling (PlayerProtection) Act. The Act enables players to limit the amount of an individual bet, bothat one time and cumulatively over the Internet. For example, these limits could beapplied to the wagering on a particular game or by determining a maximum amountthat may be wagered by a player over a period of time. Another benefit of the legis-lation is that if a person is concerned that their own or another’s gambling habitsmay threaten the well-being of the player or the player’s family, an application maybe made to the state government to have them banned from participating in any li-censed interactive gaming activity.
Although there appears to be a more tolerant attitude toward Internet gambling inAustralia, there are two issues raised by the acceptance of Internet gambling: taxa-tion, and encryption and security. ACIL Consulting (1999) notes that most countries,including the United States, generally accept the taxation model of the EuropeanUnion (EU): consumption taxes apply to electronic commerce as they do to otherforms of commercial activity. An alternative is the introduction of new taxes, such asa “bit” or “click” tax. A bit tax is similar to a turnover tax: every time a transaction ismade over the Internet, a tax is collected. This is not a feasible alternative because thefrequency of wagering makes the tax potentially greater than the income derivedfrom gambling activities.
Both the speed and anonymity of electronic transactions make it difficult for State taxauthorities to monitor who is earning income from Internet gambling. This is furtherimpeded by encryption and security devices used by service providers to protectthemselves and their consumers. Consequently, it may be in the best interest of leg-islators to focus on the service provider rather than the customer. Australia, for ex-ample, is not inclined towards taxing personal winnings from gambling but appliesheavy taxes to gambling income earned by service providers. Although this appearsto be a more efficient means of collecting taxes from Internet-based providers, thereis also the issue of overseas providers who are not required to report income to theAustralian government. Furthermore, the introduction of Internet gaming makes thetraditional method of regulation and high taxation an inefficient and ineffectivemeans to collect gambling taxes.

Gambling with Our Future? 113
Fraser Institute Digital PublicationFebruary 2002
According to Bell (1999), 25 countries have licensed or passed legislation permittingInternet gambling services. Attempts by government to prevent customers from ac-cessing gaming sites are easily circumvented by the structure of the Internet. Forexample, Internet gambling operators are able to change the addresses of their re-spective Web sites quickly and inexpensively while continuing to use their identifi-able domain name and customers can be easily notified about address changes viae-mail.
One of the primary benefits of allowing Internet gaming is that competition will beintroduced into a marketplace that is highly regulated and dominated by licensedproviders that monopolize the gaming market. Increased competition results in amore efficient allocation of resources as gaming providers attempt to maintain andattract new customers. This form of gaming also encourages businesses in the pri-vate sector to develop their network capacity and commerce. Not only will this in-creased competition result in a wider range of gaming activities but consumers willhave cheaper and easier access to these gaming activities.
Overall, the prohibition of Internet gaming services does not resolve concerns aboutthe negative impacts of web-based gambling: “Banning Internet gambling puts inplace market structures that encourage criminal behaviour: the very things that pro-hibition is supposedly designed to counteract” (ACIL Consulting 1999). Banning In-ternet gaming in the domestic market will ultimately result in the establishment ofInternet gaming sites overseas. Banning on-line gaming results in the inefficient al-location of limited government resources because, as other jurisdictions identify thedemand for Internet gaming, they will supply this service to consumers. Conse-quently, the resources spent on regulating Internet gaming will dissipate without ef-fecting the desired change. Bearing in mind the complex technical structure of theInternet, therefore, the prohibition of Internet gaming would have to take place at aglobal level to ensure the effective regulation of the industry.
Gambling with Our Future? 114
Fraser Institute Digital PublicationFebruary 2002
The case for privatizing gambling
A regulatory equilibrium exists where politicians act in a way that maximizes po-litical returns. Because politicians are elected, they will follow whatever course ofaction will most likely ensure re-election.
Sam Peltzman
If gambling is legal, the industry should be in the hands of the private sector be-cause, in most areas of economic activity, privatization leads to greater efficiencyand the wider availability of products and services. This is the case because privatecompanies have strong incentives to provide better services at reasonable prices(Bourcheding et al.). If a private company is unprofitable or closes, the losses areshouldered entirely by the investors. Publicly owned companies, on the otherhand, have fewer incentives to provide reasonably priced products because suchbusiness ventures operate at the expense of the taxpayer. In other words, the gov-ernment does not bear the risk of being unprofitable and closing; rather, the risk isborne by taxpayers.
A strong argument may be made for the privatization of gambling operations pub-licly owned at present. Our opposition to State-owned gambling operations centresaround a lack of confidence in the ability of the State to remain objective when con-sidering the public interest, since it serves as both the regulator and the principlebeneficiary of gambling activities. The government’s claims to objectivity in regulat-ing the gambling industry are questionable as the public’s demand for increased so-cial spending pressures governments to spend more money without increasingpersonal income taxes.
In many countries, the State has granted itself a monopoly over the gambling mar-ketplace. These government monopolies detract from the overall quality of the gam-bling industry by limiting competition and maintaining artificially high prices (e.g.,lower pay-out ratios). By limiting entrants to the marketplace, the motivation to en-sure a more efficient allocation of resources in order to attract new customers is es-sentially eliminated. Moreover, enterprises with diminished competition haveattenuated incentives to offer an inexpensive range of diverse, quality products.

Gambling with Our Future? 115
Fraser Institute Digital PublicationFebruary 2002
Government-owned casinos constitute the ultimate test of the government’s abilityto quell its own self-interest in the name of the public good. Two opposing views pre-vail concerning whether casinos should be publicly or privately owned. The Com-mission on the Review of the National Policy toward Gambling in the United Statesfound practical difficulties in the government’s taking direct responsibility for casinooperations, namely that the government would be responsible for actively promot-ing the entertainment business. Furthermore, casinos are not always successful and,thus, the government may find itself at risk of financial loss.
Proponents of government ownership, however, view private operators as a threatto the integrity of casinos and believe that public ownership eliminates the threat ofgreed overcoming regulatory policies that prevent excessive gambling. Further-more, proponents of government ownership claim government-run casinos aremore feasible because 100 percent of net profits go to public coffers, criminals aremore easily excluded, and the public will have greater confidence in the integrity ofthe casino’s ownership (UNLV International Gaming Institute 1996).
In Canada, the government is both the regulator and beneficiary of gambling activi-ties. Many critics of gambling are concerned about government’s increased depen-dence on gaming revenues and its perceived lack of attention to the negative impactsof gaming. Under the Canadian Constitution, the federal parliament has jurisdictionover the criminal law and imposes restrictions on gaming activities. Therefore, pro-vincial legislation or regulation regarding gaming must be practised within the lim-its of the Criminal Code. If a conflict occurs between provincial legislation andcriminal law, provincial legislation is deemed null and void. In other words, theprovinces’ ability to regulate, operate, or license gaming is limited and may only beexercised within the provisions established in the Code (Sama 1999).
In today’s Canadian gambling marketplace, it is not uncommon to observe govern-ments that are directly involved in the promotion and organization of gaming activ-ities. For example, lotteries in Canada are owned and operated exclusively bygovernment. Government control over the gambling industry is enforced by the li-censing of gaming venues, heavy taxation on gamblers, and a restriction on the num-ber of gaming venues and the type of gaming opportunities provided to the public.Although the structure of the gambling industry varies from province to province,gambling regulation is often delegated to provincial gaming commissions and simi-lar regulatory bodies.
In the American context, the NGISC (1999a) stated:
Because the government determines the level and type of competition to bepermitted—granting, amending, and revoking monopolies, and restricting

Gambling with Our Future? 116
Fraser Institute Digital PublicationFebruary 2002
or enhancing competition almost at will—they are also the key determinantsof the various industries’ potential profits and losses (NGISC 1999a: 1–4).
Currently, governments perform a number of distinct roles in the gambling industry.First, as a prohibitor, government may enforce gambling prohibition by vigorous po-licing or by enacting laws that make it illegal to gamble. Second, as a passive ob-server, government permits the operation of private social gambling withoutregulation or oversight. Finally, as a quasi-entrepreneur, government owns and op-erates gambling operations as public enterprises.
American casinos, for example, are organized in a number of ways: owned and oper-ated by government; owned by government and operated by the private sector; ca-sino gaming on ships; casinos on Indian reserves; and “destination” casinos that offermany amenities including hotels and entertainment. According to Hughes (1996), therise of the casino in the 1980s and 1990s has embodied a new form of state interven-tionism: state-sanctioned, privately-owned, monopoly enterprises that are highlycentralized, highly taxed, highly promoted, and intimately connected with a govern-ment’s objectives for the development of tourism and entertainment in its jurisdic-tion. American state governments, like Canada, Australia, and the United Kingdom,maintain autonomous control of the gambling industry by granting themselves theauthority to operate lotteries, limiting the number of gaming machines permitted ingambling venues, and by imposing high levels of taxation on gambling products.
There are four major controls imposed on gaming by government:
(1) licensing, that is, the process by which government grants persons the rightor privilege to offer games to the public;
(2) operational controls, that is, the rules that government adopts to govern theconduct of the gaming operators and the games they offer;
(3) the setting of taxes imposed on the industry; and (4) a system of accounting and audits that ensures that operators properly
account for all revenues.
Other areas that government regulation may address are price controls, disputeswith patrons, and design, location, and aesthetics of buildings (UNLV InternationalGaming Institute 1996).
Private British gaming has been considered well-regulated and fair since the estab-lishment of The Gaming Board for Great Britain in 1968. Although both private orpublic companies may run British casinos, there are no State-run casinos in Britain.The National Lottery is privately operated under a government-granted monopoly.

Gambling with Our Future? 117
Fraser Institute Digital PublicationFebruary 2002
Betting on sports, horse racing, and other forms of pari-mutuel racing is operated byprivate enterprises under strict government regulation. Finally, “amusement-with-prizes” (AWP) machines are licensed by local government and are found in pubs,amusement arcades, and cafes (Munting 1996).
In Australia, most of the gambling industry operates under some form of govern-ment-granted monopoly. For casinos, telephone account betting (TAB), and lotteries,gambling facilities conduct business under government supervision in the form ofstrict regulation, licensing, and heavy taxation. In return, most gambling providersare granted the exclusive right to conduct gambling operations within a region for aspecified period of time. Furthermore, government limits the supply of gamblingservices, such as gaming machines, by restricting the forms of gaming permitted ina gambling venue and placing a cap on the number of available machines.
However, when the availability of gaming venues is limited by monopoly rights,consumers have less access to gambling than would be available in a competitivemarket. In addition, government restrictions on the availability of gaming machinesreduce the benefit to consumers by limiting consumers’ choice of venue. For exam-ple, the Casino Windsor monopolizes the local gaming marketplace, as the Ontarioprovincial government announced that only one casino would be permitted to oper-ate in the area. Moran (1998) presents an example in Victoria (Australia) where thenumber of machines permitted (27,500) represents a shortage in comparison to thenumber of machines demanded by consumers (estimated at over 30,000).
There is growing public concern over the conflict between the government’s role asboth the regulator and the beneficiary of gambling activities. As government-ownedgambling operations strive to remain profitable, it becomes difficult to ascertain howthe government can serve as both an adequate and objective regulating agency anda beneficiary of gambling:
Whatever the insufficiencies of the revenue base currently available to thestate governments, the pursuit of gambling-derived revenue (over andabove uniform taxation on income or expenditure) is not compatible withgovernment declarations of neutrality in relation to moral arguments aboutgambling. (Hughes 1996: 4)
Clear evidence of the conflict between public interest and government self-interestappeared in British Columbia after the RCMP launched an investigation into a con-ditional casino license granted by then-Premier Glen Clark. It is alleged that Clarkused his political influence to grant an acquaintance a casino license. In June 1999,the British Columbia provincial government announced its intention to create an

Gambling with Our Future? 118
Fraser Institute Digital PublicationFebruary 2002
independent, arm’s-length agency to regulate the gambling industry. The new reg-ulatory structure promised revenue sharing for municipalities and guaranteed in-come for charities. The intent of the new regulatory agency was to remove politicsfrom the industry.
Lotteries are the most widespread form of gambling in Canada and the United Statesand the only form of gambling that is a virtual government monopoly. In both coun-tries, lotteries have become one of the most profitable government-owned enter-prises. According to Abt (1996), American state governments take 6 cents from everydollar bet at racetracks and 7.5 cents from every dollar lost at casinos while they keepbetween 40 and 45 cents of every dollar spent on lottery tickets. There is an obviousirony surrounding the government awarding itself a complete monopoly over lotter-ies and becoming an active promoter of lotteries while simultaneously imposing aheavy “sin” tax on the purchase of lottery tickets.
The tax on gambling is often referred to as a “sin” tax because government imposescomparatively high levels of taxation as a means to discourage the proliferation ofgambling activities. ACIL Consulting (1999) discuss the issue of the inequality ofgambling taxation from the perspective of horizontal equity (equal treatment ofequals) versus vertical equity (progression rather than regression in the tax burdenacross similar products). In terms of vertical equity, it may be argued that consumersof gambling products are treated unfairly compared to other forms of entertainmentdue to the high rates of gambling taxes. Furthermore, the current structure of gam-bling taxes in most countries results in horizontal inequity between the differentforms of gambling and similar products in the marketplace.
Lamentably, governments have not established the right of individuals to gamble atthe venue or game of their choice. As a result, there are high levels of taxation ongambling activities—a “sin” tax much higher than tax rates for other consumergoods or luxury activities. As discussed earlier, government dependence on gam-bling profits drives up the price of gambling by higher odds against winning orlower pay-offs. Abt (1996) explains that, despite the high level of taxation, by con-trolling the legalization and licensing of certain games and operators, governmentcontributes to a monopoly situation that is extremely profitable. Therefore, theState’s legalization policy grows out of its revenue needs rather than any moralframework or constitutional foundation.
The goal of taxation should be to raise the required level of revenue with the leastoverall “deadweight loss,”7 or economic distortion. Furthermore, the tax systemshould not influence private purchasing decisions by favoring or discriminatingagainst particular activities. In Australia, the effective consumption tax ranges be-

Gambling with Our Future? 119
Fraser Institute Digital PublicationFebruary 2002
tween one to two percent for community services and food, 30 percent for gambling,89 percent for beer, 130 percent for petrol, and 210 percent for tobacco. Consideringthe willingness of consumers to purchase gambling products regardless of price,there appears to be little justification for differential tax treatment of gambling prod-ucts.
Overall, the high level of taxation imposed on gambling activities has become one ofthe most contentious issues surrounding the gambling industry. ACIL Consultingcommented: “It is really quite perverse to be taxing the vast majority of gamblers andthe venues in which they responsibly gamble, to support a very small number ofthose deemed to be ‘problem gamblers’ ” (1999: xv). In Australia, taxation on thegambling industry averages between 60 percent to 70 percent in effective terms. Thehigh level of taxation distorts consumer spending patterns as well as the provisionof gambling services by discouraging consumers from spending their income on ser-vices they value more highly and limiting the ability of providers of gambling ser-vices to satisfy consumer needs (ACIL Consulting 1999). Overall, these existing taxarrangements for gambling appear to be both inequitable and excessive.
In Australia, for example, EGMs are taxed differently by respective state and re-gional governments. Generally, EGMs in hotels are faced with a higher tax rate thanthose in clubs, as hotels with EGMs are required to contribute to some kind of com-munity support fund (ACIL Consulting 1999). The disparity between the taxes lev-ied on gambling activities is especially apparent with state lotteries. Overall, in termsof both nominal and effective tax rates, lotteries are the most highly taxed gamblingactivity in Australia (this is also true of the United States, the United Kingdom, andCanada). Consumers of lotteries experience the highest tax burdens while the tax oncasinos, as a proportion of expenditure, is the lowest of all forms of gambling activ-ities. Furthermore, of all the gambling activities available in Australia, Canada, theUnited States, and the United Kingdom, lotteries provide players with the lowestodds of winning.
Government’s dependence on revenue from lottery taxes has been publicly criticizedbecause lotteries are considered both an excessive and a regressive form of taxation.The NGISC (1999) reported that of the 38 state lotteries, revenue from 10 of the statelotteries goes into general funds. Of the remaining states, 16 earmark all or part of lot-tery revenues for education, making education the most common use of Americanlottery funds. According to Beare and Hampton: “The State not only rules out com-petition but also is free to set arbitrarily the gaming tax, unrestrained by betting
[7] Deadweight loss is the loss to society from an economic outcome differing from the socialoptimum.

Gambling with Our Future? 120
Fraser Institute Digital PublicationFebruary 2002
trends, number of winners or similar considerations” (1984: 24). By granting itself amonopoly over lotteries, the government operates without competition. The absenceof competition allows the State to acquire large monopoly rents, effectively generatedby what may be considered an unreasonable consumption tax on lottery participants.
Further, when there is a monopoly controlled by government:
the taxes that casinos pay to the state can be much higher in most circum-stances. Thus, the casino will usually set odds more favorable to the housethan it would in a competitive market. This pricing is a function of howmany games the casino can offer before the cost of adding one additionalgame exceeds the revenues that can be derived from that game. The differ-ence between when this point is reached in monopoly and competitivemarkets is that in a perfect competitive market the marginal revenue curveintersects the marginal cost curve at a lower output and a higher price. Theeffect is that the monopoly casino provides fewer games at higher odds, orinstitutes other costs to maximize profits (UNLV International Gaming In-stitute 1996: 96).
The success of the gambling industry depends on a high standard of integrity andregulation. In our view, the government best supports this goal by relinquishing itsmonopolistic control of the gambling industry, introducing competition among pri-vate enterprises while maintaining operational controls through independent gov-ernment regulatory organizations. Without the government monopoly, businessescan enter and exit the marketplace freely and it will be market forces that determinethe structure and size of the gambling marketplace rather than the government. Withcompetition, consumer demand will be met, greater market efficiency will result,and the industry will move toward a more efficient level of operation. Furthermore,operating as a regulator and not as a beneficiary of gambling activities, governmenteliminates public concern about its conflicting role in the gambling industry. As Cal-vert (1999b) explains, even if the State were to relinquish its monopoly, governmentscould still profit from the taxation of private gambling operations. Moreover, dereg-ulating the industry would alleviate public suspicion over the role of government asboth regulator and beneficiary of gambling-derived revenues.
Privatizing lotteries and other gaming opportunities would increase gambling salesbecause private operators could advertise more aggressively. Advertising efforts couldfocus on niche marketing strategies, allowing service providers to target advertisingand product development according to consumer preferences within specific demo-graphic groups. Within the United States, for example, expenses would be reduced asprivatized operations could employ more part-time employees rather than unionized

Gambling with Our Future? 121
Fraser Institute Digital PublicationFebruary 2002
state employees. In addition, a privatized company has more incentive to provide avariety of games and to increase the percentage of winners from lotteries to maintaina strong customer base. Furthermore, if free competition among lottery firms were al-lowed, market forces would prevent firms from making “excessive” profits.
The success of the privatization of the sports-betting industry has been demon-strated in the United Kingdom. In 1960, off-course betting shops were legalized and,by 1963, 14,388 shops, most privately owned, had been opened. Betting-shop li-censes reached a peak in 1968 at 15,782, declining thereafter to 13,254 in 1977, and11,327 in 1983 (PP Gambling Statistics 1980, cited in Munting 1996). Sports-betting isone of the most popular forms of gambling in the United Kingdom. In the UnitedStates, on the other hand, sports wagering is illegal in all but two states. One of thosestates, Nevada, has 142 legal sports books that allow wagering on professional andamateur sports. Sports wagering reached US$2.3 billion in Nevada’s legalized sportsbooks in fiscal 1998. However, estimates of the scope of illegal sports gambling in theUnited States range anywhere from US$80 billion to US$380 billion annually(NGISC 1999b).
In summary, privatizing the gambling industry and introducing competition will in-crease market efficiency while satisfying consumer demand. Consumers will benefitfrom the elimination of government monopolies through increased competition andgambling service providers offering a greater diversity of quality products. Further-more, by establishing itself exclusively as a regulatory regime, the government willalleviate public concern regarding the controversial role of government as regulatorand beneficiary of gambling operations.

Gambling with Our Future? 122
Fraser Institute Digital PublicationFebruary 2002
Individual freedom versus government paternalism
The overriding risk [of prohibition]—to both individuals and society—is thatharsh government measures intended to control or suppress gambling will simplyusher in a new era of public corruption, compromising the integrity of governmentofficials, judges and the police. And for all of that, such measures would do next tonothing to deter truly compulsive gamblers from gambling.
Guy Calvert (1999b)
The most fundamental, yet most frequently overlooked, aspect of the gambling de-bate is: should one have the right to choose whether or not to gamble? The freedomto engage in gambling activities is not commonly associated with individual liberties(Moran 1998). Nevertheless, the extent to which a person has the ability to behaveand spend money as he or she pleases is an important determination of a truly freesociety. In our opinion, even if a minority of people choose to engage in gamblingactivities, the individual right to freedom of choice should be respected. Those op-posed to government-imposed restrictions on gambling believe that the State shouldnot be in the business of either encouraging or discouraging gambling. If individualschoose to gamble, that is their choice. Furthermore, if individuals and private orga-nizations identify a demand for gambling and desire to provide opportunities forgambling, that also should be their choice.
McGowan (1994) asserts that the controversy faced by public policy-makers involvesa conflict between those who believe that the goal of public policy should be the pub-lic good versus those who advocate the supremacy of the rights of the individual. Oneof the major prohibitionist arguments surrounding gambling and individual freedomis that individuals are not always rational and, in some situations, cannot be trustedto deal with the consequences of their own actions. Therefore, they are not account-able for their actions when things go wrong. Hence, it is argued that it is in the publicinterest for the government to make decisions on behalf of those individuals who areconsidered to be irrational or at risk of becoming irrational. In our view, it is incum-bent upon advocates of a free and civil society to resist this kind of government pa-

Gambling with Our Future? 123
Fraser Institute Digital PublicationFebruary 2002
ternalism—unless, however, our society no longer deems it appropriate to argue, asthe nineteenth century economist and philosopher John Stuart Mill declared, “Overhimself, and over his own body and mind, the individual is sovereign.”
A polarity of views is held by public officials regarding how the government shouldaddress the issue of problem gambling or if there is even a legitimate reason for de-nying or overriding “consumer sovereignty,” the notion that consumers are the bestjudges of their own welfare. The evidence from four leading industrialized democra-cies is clear: most people who gamble do so willingly and rationally, and as a form ofentertainment. In our view, therefore, the small number of people who are unable tocontrol their gambling does not merit heavy-handed government intervention. Al-though there are socially harmful activities that require government intervention,gambling should not be considered one of those activities. Furthermore, those who be-come addicted to gambling rarely threaten the overall harmony of the community. AsMoran succinctly stated, “It would be unreasonable to curtail the enjoyment that thevast majority obtain from the activity [gambling] because of a tiny minority” (1998: 2).
The fundamental issue is the extent to which the government has the right to limitindividual freedom of choice. Although people enjoy gambling for many reasons,the most common characteristic shared by gamblers is the propensity for takingrisks. Canadian philosopher Paul Russell asserts that risk-taking is an essential com-ponent of a capitalist society. According to Russell, “If you tried to take the risk outof life, the unpredictability, it would make it very boring for everybody ” (quoted inTodd 2000). Gambling provides players with opportunities to play games of chancefor money, taking risks that they would not otherwise have the opportunity to takein their everyday lives:
Gambling is a combination of risk and ritual. Both components are main-stays of human society, for the very good reason they are part of our makeup. It is no wonder, therefore, that gambling is universal. A coercive effortto eliminate or reduce gambling must compete against that most formida-ble opponent, human nature (Calvert 1999: 3).
However, many conceive that gambling is an irrational behaviour that participantshave little power to control. A person may be considered irrational if he willingly en-gages in, and later regrets, activities that are harmful to him. Indeed, there are peoplewho exhibit compulsive and self-destructive behaviour or have “addictive” person-alities for a variety of products and activities such as cigarettes or gambling. Simplystated, individuals who have addictive personalities are more likely to become ad-dicted while those who do not have addictive personalities may engage in similar ac-tivities and never become addicted. As McClearly and Chew amply demonstrate,

Gambling with Our Future? 124
Fraser Institute Digital PublicationFebruary 2002
psychological risks are prevalent in a small number of individuals whose vulnerabil-ity to a variety of society’s stimulants is best handled through treatment for biochem-ical imbalances, faulty reasoning, or inadequate means of coping with adversityrather than by banning every activity enjoyed by large numbers of low-risk peoplethat might promote risky behaviour in a few (McClearly and Chew 1998: 13).
Miller and Schwartz (1998) argue that gambling is considered more acceptable in asociety where discretionary income is relatively high; however, it is argued that peo-ple with little discretionary income or limited opportunities for increases in wealthrequire greater protection from gambling. We find it interesting that gambling con-ducted by affluent members of society is considered by many to be an affordable andreasonable form of entertainment. On the other hand, there is the widespread per-ception that gambling by the working-class members of society should be limited be-cause it may distract them from their responsibilities to family and work. We suggestthat the presumption that people who gamble and have a lower disposable incomeshould be protected from themselves stands in opposition to the fundamental prin-ciples of a democratic and egalitarian society.
Contrast, for a moment, social attitudes toward gambling with that of alcohol. AsRonald A. Reno points out, “Abuse of alcohol, alone, is associated with all mannerof disorderly behaviour. In 1996, alcohol was involved in 40.9 percent of road fatali-ties” and was a factor in 75 percent of cases of spousal violence (Reno). “Yet,” writesCalvert, “we recognize that alcoholism is best addressed on a voluntary basis ratherthan through prohibition. Likewise, the best recourse for compulsive gamblerswould appear to be counseling and abstinence, not government intervention to pro-hibit or otherwise limit gambling” (Calvert 1999b: 5).
The implications for policy-makers are clear. Prohibition of gambling is both unnec-essary and unworkable: “Unsolicited attempts to exterminate gambling are unlikelyto reduce the risks that gamblers are determined to assume anyway” (Calvert 1999b:9). As problem and pathological gamblers will seek out opportunities to gambleeven when it is difficult to do so, banning gambling is not the answer: “Such effortsmay only succeed in increasing risk for others. To see how, it may help to consideranalogous, and much studied, case history—the 1920–33 federal prohibition of alco-hol” (Calvert 1999b: 9) and, we might add, the ongoing, and clearly unwinnable,“War on Drugs.”
The political and popular momentum behind legalized gambling reflects an ongo-ing, and welcome, devolution in decision-making over the past 20 years. In practice,this has meant a devolution of choices to the individual citizen that used to be theexclusive domain of an elite group of social engineers. The fact that certain

Gambling with Our Future? 125
Fraser Institute Digital PublicationFebruary 2002
individuals are harmed by engaging in gambling activities does not imply that noone should be allowed to gamble. As Dale Eisler insightfully commented: “The so-lution . . . is not limiting the freedom of others because of the problems of a few. Thesolution is helping those who suffer from compulsive gaming to recognize theirproblem and learn how to deal with it” (Eisler 1998). Gambling is about choice: peo-ple from all walks of life want to enjoy their freedom and that includes the right todo what they want with their own money. We trust that gambling prohibitionistswill take note that, as Calvert reminds us, in addition to intruding on gamblers’ lib-erties, prohibition makes a mockery of individual responsibility, which is hardly thebest way to sustain the nation’s moral health.

Gambling with Our Future? 126
Fraser Institute Digital PublicationFebruary 2002
Glossary
Bet An amount placed on the outcome of an uncertain future event, particularlypertaining to gaming. The amount spent on a particular form of gambling.
Bingo A game of chance played for prizes, including monetary prizes, with cardsbearing numbers or other designations that the card-holder covers when those num-bers or designations are announced. A winner is determined when the first playercovers a previously specified arrangement of numbers or designations on the cards.
British Casino Association BCA is the trade association of the casino industry inGreat Britain. All 16 licensed casinos are voluntary members of the Association. TheAssociation itself does not participate in the actual operation of casinos, all of whichare run by private or public companies; there are no state-run casinos in Britain.
Casino A gambling facility that normally includes all or some of the following:slot machines, video games, card games, and other games such as keno, craps, andbingo.
Casino and Gaming Authority An association responsible for the regulation ofthe industry in Australia. It does not determine gambling policy (e.g., whether or notthere is to be a moratorium on EGMs or the introduction of Club Keno), which is en-tirely the province of government. Legislative amendments would be required if theAuthority were to become involved in any policy-making procedures.
Chasing The urgent need to keep gambling, often to win larger bets, or the takingof greater risks to make up for a loss or a series of losses.
Compulsive Gambling The inability to resist the urge to gamble, often leading todamage of one’s personal life, family, or job.
Daily numbers games Game in which players choose their own three- or four-digit number. Often there are a variety of bets that can accompany these numbers,each with a different probability and payout.

Gambling with Our Future? 127
Fraser Institute Digital PublicationFebruary 2002
Double A bet that predicts the outcome of two different races. To win, both partsof the bet have to be successful. If the first part of the bet is successful, then the win-nings and stake are placed on the second horse. The bet is thus a multiplier bet,which can result in big winnings for a relatively small stake.
Drop The amount of money exchanged for gambling chips in a casino, represent-ing the gambler’s expenditure.
Gambling The lawful placement of a wager or bet on the outcome of an uncertainfuture event.
Gambling profit The net income from provincial and territorial government–runlotteries, casinos, and VLTs, after deducting prizes and winnings, operating ex-penses including wages and salaries, payments to federal governments, and otheroverhead costs.
Gaming All legal forms of gambling other than racing; e.g., lotteries, VLTs, casinogaming, pools, and minor pools.
Gross Revenue The difference between the gross wager and the amount paid to win-ners is the gross revenue to the establishment, which equals the amount lost by players.
Gross Wagering The total amount of money bet by the players (for racetracks, thegross wager is referred to as the “handle”).
Gross Takings the sum of all components of income before the payment of prizemoney and winnings is netted out. Net takings are gross income minus the pay-ments of prize money and winnings.
Handle The total amount wagered by the player, including money won onprevious games.
Instant Games A paper ticket with spaces that can be scratched off, revealingnumbers or words that indicate whether the ticket is a winner or a loser.
Interprovincial Lottery Corporation (ICL) A government body comprising theOntario Lottery Corporation, the Western Canada Lottery Corporation, the BritishColumbia Lottery Corporation, the Atlantic Lottery Corporation, and Loto-Quebec.
Jai Alai The smallest segment of pari-mutuel gaming, it involves players hurling ahard ball against a wall and catching it with curved baskets in a venue called a “fronton.”

Gambling with Our Future? 128
Fraser Institute Digital PublicationFebruary 2002
Keno A game of chance where players pick numbers on a grid similar to lotto.
Lottery A game of chance in which tokens, keys, or other objects are sold. Of theseitems, only one is the winner. The winner is usually selected randomly by a draw.
Lotto Allows bettors to choose their own numbers by picking from a large set ofpossibilities. Drawings of winning numbers take place at regular intervals.
National Lottery Commission The NLC (United Kingdom) is a non-departmen-tal public body, which began on the 1 April 1999 to regulate the National Lottery, atask formerly carried out by the Office of the National Lottery (OFLOT).
Odds The multipliers or prices that are offered by book-makers for the purposes ofbetting on races.
Off-track Betting Pari-mutuel wagering conducted at a location other than theracecourse where the race is actually being held.
Pari-mutuel Systems A form of gambling where the gambling establishmentpools the bets of players and does not risk any of its own money. The winnings aretaken from the pool of bets. The value of winnings is determined by the pattern ofbets placed by the players.
Pathological Gambling Addiction to gambling as defined in the DSM-IV, markedby the inability to stop gambling despite harmful effects to a person’s personal life,job, or family. It is considered a treatable addiction.
Problem Gambling Heavy gambling done by those who are not fully addicted to,but have experienced problems with, gambling.
Pull-Tabs A game of chance in which the player pulls tabs on a card to match sym-bols to find out if he wins or loses.
Punter Common British parlance for a person who bets with a bookmaker at race-tracks or in betting shops.
Round Robin A bet on the outcome of three races, consisting of three single betsand bets resembling doubles and trebles. The overall stakes for a £1 round robin is£10 (plus tax). The Round Robin is a popular bet with betting-shop punters, as it pro-vides the potential of a big win for a relatively small stake.

Gambling with Our Future? 129
Fraser Institute Digital PublicationFebruary 2002
Racing Usually defined in the gambling industry as horse and greyhound racesand other specified contests covered by TABs.
Treble A bet that predicts the outcome of three different races. To win, all three pre-dictions have to be successful. If the first part of the bet succeeds, then the winningsand stake are placed on the second horse. If this is successful, then the enhancedstake and the winnings are placed on the third horse. The bet is thus a multiplier betthat can result in very big winnings for a relatively small stake.
Tote The official pool-betting organization for the United Kingdom, which admin-isters pools at racetracks around the country and has computer terminals for bettingpurposes in an increasing number of betting shops.
Turnover Used to describe the amount wagered and bet on every game.
Video Keno Requires bettors to choose a few numbers out of a larger group ofnumbers, with drawings held quite often, sometimes several times an hour. The pay-off is a function of how many numbers the bettor chose, which corresponds to theprobability of winning in each case.
VLTs Video Lottery Terminals require a terminal that can be programmed to carrya variety of games, such as video poker. These games offer bettors a chance to play agame and receive immediate payouts for winning bets. These are also known asElectronic Gaming Machines or EGMs in Australia, Electronic Gaming Devices orEGDs in the United States, and Fruit Machines or amusement-with-prizes (AWP)machines in the United Kingdom.
Wager A bet or an amount placed on the outcome of an uncertain future event per-taining to sport, mainly racing. The amount initially put on a particular gamble.

Gambling with Our Future? 130
Fraser Institute Digital PublicationFebruary 2002
References
Abt, V. (1996) Gambling Cultures. In J. McMillen (ed.), The Role of the State in the Expansion and Growth of Commercial Gambling in the USA (London and New York: Routledge): 179–98.
ACIL Consulting (1999) Australia’s Gambling Industries (March). A Submission to the Productivity Commission’s Inquiry into Australia’s Gambling Industry. Digital document: www.indcom.gov.au/inquiry/gambling/subs/sublist.html.
Adams, T. (1999) The Dream Ticket. TheGuardian (May 23). Digital document: www.guardianunlimited.co.uk/Archive/Article/0,4273,3867760,00.html.
Alberta Alcohol and Drug Abuse Commission (1999a) Gambling and Problem Gambling in Alberta January 1994. Edmonton: Alberta Alcohol and Drug Abuse Commission. Digital document: www.gov.ab.ca/aadac/services/specialized/gambling/pgs_problem_gambling_in_ab.htm.
Alberta Alcohol and Drug Abuse Commission (1999b) Unplugged From the Machine: VLT Problem Gambling Treatment Client November 1997. Edmonton: Alberta Alcohol and Drug Abuse Commission. Digital docment: www.gov.ab.ca/aadac/services/specialized/gambling/pgs_unplugged_machine.htm
Alberta Alcohol and Drug Abuse Commission (1999c) Comparing Problem and Substance Use and Problem Gambling 1994. Edmonton: Alberta Alcohol and Drug Abuse Commission. Digital document: www.gov.ab.ca/aadac/addictions/profiles/comparing_problem_substance.htm.
Alberta Alcohol and Drug Abuse Commission (1999d) AADAC Launches Campaign to Help Prevent Alcohol, Drug and Gambling Problems in Youth. Edmonton: Alberta Alcohol and Drug Abuse Commission. Digital document: www.gov.ab.ca/aadac/resilience.htm.

Gambling with Our Future? 131
Fraser Institute Digital PublicationFebruary 2002
Alberta Alcohol and Drug Abuse Commission (1999e) Adolescent Gambling and Problem Gambling in Alberta May 1996. Edmonton: Alberta Alcohol and Drug Abuse Commission. Digital document: www.gov.ab.ca/aadac/services/specialized/gambling/pgs_adolescent_gambling.htm.
Alberta Gaming and Liquor Commission (1998) Annual Report for the Year Ended March 31, 1998.
Alcohol & Drug Abuse Weekly (1995) Experts Say Government Ignore Gambling Addiction. Alcohol & Drug Abuse Weekly 7, 33 (August 21): 7.
American Academy of Political and Social Science (1998) Casino De Juegos Del Mundo: A Survey of World Gambling. The Annals of The American Academy of Political and Social Science (March).
American Psychiatric Association (1980) Diagnostic and Statistical Manual on Metal Disorders, Third Edition. Washington, DC: American Psychiatric Association.
Angus Reid Group (1996) Social Gaming and Problem Gambling in British Columbia. (Available from the British Columbia Lottery Corporation, Kamloops, BC).
Arnold, L. (1999) America, A Bettor Nation. ABCNEWS from The Associated Press (March 19). Digital document: abcnews.go.com/sections/living/DailyNews/gambling990319.html.
Arthur Anderson Inc. (1996) Economic Impacts of Casino Gaming in the United States, Volume 1: Macro Study (December). Prepared for the American Gaming Association.
Arthur Anderson Inc. (1997) Economic Impacts of Casino Gaming in the United States, Volume 2: Micro Study (May). Prepared for the American Gaming Association.
Associated Press (1998) Gambling Regulation, Not Ban. ABCNEWS (February 4). Digital document: more.abcnews.go.com/sections/business/net_gambling0204/index.html
Atlantic Lottery Corporation Inc. (1998) Annual Report 1997–1998.
Australian Bureau of Statistics (1998a) Australian Casino Takings Up, but Profits Down. Digital document: www.lotteryinsider.com.au/gambling/a.htm.

Gambling with Our Future? 132
Fraser Institute Digital PublicationFebruary 2002
Australian Bureau of Statistics (1998b) Productivity Commission Inquiry into Australia’s Gambling Industries: Submission by the Australian Bureau of Statistics. Digital document: www.indcom.gov.au/inquiry/gambling/subs/sublist.html.
Australia’s Gambling Industries (1999) Issues Paper: September 1998. Report to Productivity Commission.
Australian Medical Association (1998) Problem Gambling and Public Health. Productivity Commission Inquiry into Australia’s Gambling Industries: AMA Submission. Digital document: www.indcom.gov.au/inquiry/gambling/subs/sublist.html.
Australian Retailers Association (1998) Submission to Productivity Commission Industries Inquiry (November). Digital document: www.indcom.gov.au/inquiry/gambling/subs/sublist.html.
Australian Transaction Reports and Analysis Centre [AUSTRAC] (1998)Productivity Commission’s Inquiry into Australia’s Gambling Industries. Digital document: www.indcom.gov.au/inquiry/gambling/subs/sublist.html.
Azmier, Jason J. (2000) Canadian Gambling Behaviour and Attitudes: Summary Report. Toronto: The Canada West Foundation.
Azmier, Jason J., and G. Smith (1998) The State of Gambling in Canada: An Interprovincial Roadmap of Gambling and Its Impact. Calgary: Canada West Foundation.
Azmier, Jason J., V. Jepson, and M. Pickup (1998) Rolling the Dice: Alberta’s Experience with Direct Democracy and Video Lottery Terminals. Calgary: Canada West Foundation.
Baseline Market Research Ltd. (1996a) Final Report: 1996 Prevalence Study on Problem Gambling in Nova Scotia. (August): Prepared for Nova Scotia Department of Health.
Baseline Market Research Ltd. (1996b) Final Report: Prevalence Study, Problem Gambling, Wave 2. Prepared for the New Brunswick Department of Finance. Digital document: www.gov.nb.ca/finance/vlt/appendee.htm.
Beatty, J. (1999) BC Agency Set to Take Over Gambling. The Vancouver Sun. (June 17): 1–A2.

Gambling with Our Future? 133
Fraser Institute Digital PublicationFebruary 2002
Beatty, J., and L. Culbert (1999) Ministers Back Off Gambling. The Vancouver Sun. (June 16): 1–A2.
Barisic, S. (1999) Gamblers Cost Society. ABCNEWS. (February 9). Digital document: more.abcnews.go.com/sections/us/DailyNews/gambling990209.html.
Beare, M.E., and H. Hampton (1984) Legalized Gambling: An Overview. Ministry of the Solicitor General of Canada.
Bell, T.W. (1999) Internet Gambling: Popular, Inexorable, and (Eventually) Legal. Policy Analysis 336 (March 8): 1–16.
Berenson, A., (1998a) Gambling Inquest Gets Spun. ABCNEWS from TheStreet.com. Digital document: more.abcnews.go.com/sections/business/gambling_hearing_0127/index.html.
Berenson, A., (1998b) Preaching Gambling’s Gospel. ABCNEWS from TheStreet.com. Digital document: more.abcnews.go.com/sections/business/gambling 1219/index.html.
Bland, R.C., S.C. Newman, H. Orn, and G. Stebelsky (1993) Epideminlogy of Pathological Gambling in Edmonton. Canadian Journal of Psychology 38: 108–12.
Blaszczynski, A., and E. Farrell (1998) A Case Series of 44 Completed Gambling-Related Suicides. Journal of Gambling Studies, 14,2: 93–109.
Blaszczynski, A.P., and N. McConaghy (1994) Anti Personality Disorder and Pathological Gambling. Journal of Gambling Studies 10, 3: 275–85.
Bloomberg News (1999) Senate Committee to Ban Net Gambling. Special to CNET News.com (June 17). Digital document: www.news.com/News/Item/0,4,37982, 00.html?st.ne.fd.tohhed.ni.
Blume, S.B. (1995) Pathological Gambling. British Medical Journal 311, 7004 (August 26): 522.
Brenner G.A., M. Lipeb, and J.M. Servet (1996) Gambling Cultures. In J. McMillen (ed.), Gambling in Cameroon and Senegal: A Response to Crisis? (London and New York: Routledge): 167–78.
British Columbia Lottery Corporation (1998) Annual Report 1996–1997.

Gambling with Our Future? 134
Fraser Institute Digital PublicationFebruary 2002
Brunker, M. (1999) Net Gamblers Sue Credit Card Firms. MSNBC News (June 17). Digital document: www.msnbc.com/news/280356.asp.
Bybee, S., and K. Mayer (n.d.) Gaming and the Economy. International Gaming and Wagering Business IGWB.
Calvert, G. (1999a) Don’t Give Up the Right to Gamble. CATO: Today’s Commentary (June 18). Digital document: www.cato.org/dailys/06-18-99.html.
Calvert, G. (1999b) Gambling America: Balancing the Risks of Gambling and Its Regulation. Policy Analysis 349 (June 18): 1–25.
Campbell, Colin S., and John Lowman, Eds. (1988) Gambling in Canada: Golden Goose Trojan Horse? A Report from the First National Symposium on Lotteries and Gambling (May 1988). Burnaby, BC: School of Criminology, Simon Fraser University.
Canada West Foundation (1998) The State of Gambling in Canada: An Interprovincial Roadmap of Gambling and Its Impact (October).
Chambers, K., and T. Schrans (1998) Prevalence Studies—Moving Beyond The Numbers: A Critical Summary of the Debate Surrounding the Conceptualization and Measurement of Problem Gambling in Canada. For the Nova Scotia Alcohol and Gaming Authority.
Cienski, J, (1999) High Stakes on the Reserve. National Post (July 6).
City of Vancouver (1994) City of Vancouver Review: A Discussion Paper. Prepared for Vancouver City Council.Digital document: city.vancouver.bc.ca/commsvcs/planning/casino.html.
Clapson, M., (1991) A Bit of Flutter. History Today 41, 10 (October): 38.
Club Managers Association Australia and Leagues Club Association of New South Whales (1998) A Joint Submission to the Inquiry into Australia’s Gambling Industries Conducted by the Productivity Commission. Digital document: www.indcom.gov.au/inquiry/gambling/subs/sublist.html.
Cohn & Wolfe (1999) The 1999 Industry Report: A Profile of America’s Casino Gaming Industry (May). Prepared for the American Gaming Association.

Gambling with Our Future? 135
Fraser Institute Digital PublicationFebruary 2002
Colorado Division of Gaming (1997) Gaming in Colorado: Division of Gaming & Gaming Commission 11997 Annual Report & Abstract. Digital document: www.state.co.us/gov_dir/revenue_dir/gaming_dir.
Committee on the Social and Economic Impact of Pathological Gambling (1999) Pathological Gambling: A Critical Review. Washington, DC: National Academy Press. Digital document: books.nap.edu/books/0309065712/html/R1.html.
Communications New Brunswick (1997) Response to Video Lottery Program Review. CNB Online. Digital document: www.gov.nb.ca/newshcs/7e0154hc.htm.
Coopers & Lybrand (1997) Gaming Industry Employee Impact Survey. Prepared for the American Gaming Association.
Copps, A. (1999) Tax-Free Betting Looks Like a Winner. Digital document: www.sunday-times.co.uk/news/pages/tim/99/08/25/timintint01019.html?2034594.
Cornell, S., J. Kalt, M. Krepps, and J. Taylor (1998) American Indian Gaming and Policy and its Socio-Economic Effects. A Report to the National Gambling Impact Study Commission (July 31). Cambridge, MA: The Economics Resource Group, Inc.
Cornish, D.B. (1978) Gambling: A Review of the Literature and its Implications for Policy and Research. London, England: Her Majesty’s Stationary Office.
Dean, Lisa S. (2000) Bet on Internet Gambling. The Washington Times ( July 11).
Dickens, Charles (1852) The Betting Shop. In his Household Words.
Dickerson, M. (1984) Compulsive Gamblers. New York: Longman.
Dickerson, M., C. Allcock, A. Blaszczynski, R. Maddern, B. Nicholls, and J. Will-iams (1998) A Repeat of the 1995 Study 2: An Examination of the Socio-Economic Effects of Gambling on Individuals, Families, and the Community, Including Research into the Costs of Problem Gambling in New South Wales. The Australian Institute for Gambling Research (AIGR): University of Western Sydney, Macarthur.
Dickerson, M., and E. Baron (1998) Contemporary Issues and Future Directions in Research into Pathological Gambling, or Flags in the Desert. Department of Psychology and the Australian Institute for Gambling Research University of Western Sydney, Macarthur.

Gambling with Our Future? 136
Fraser Institute Digital PublicationFebruary 2002
Division of Addictions at Harvard Medical School (1999a) Gambling and Suicide: A Study of 44 Cases. The Wager 4, 28 (July 13).
Division of Addictions at Harvard Medical School (1999b) Going for Broke: Bankruptcy Reform. The Wager 4, 25 (June 22).
Division of Addictions at Harvard Medical School (1999c) Judgement Day for Casino Advertising. The Wager 4, 24 (June 15).
Division of Addictions at Harvard Medical School (1999d) Probable Cause: Inside the Gambling Mind. The Wager 4, 26 (June 29).
Division of Gaming & Gaming Commission (1997) Gaming in Colorado. 1997 Annual Report & Abstract. Digital document: www.state.co.us/gov_dir/revenue_dir/gaming_dir.
Dixey, R. (1996) Gambling Cultures. In J. McMillen (ed.), Bingo in Britain: An Analysis of Gender and Class (London and New York: Routledge).
Dixon, D. (1996) Gambling Cultures. In J. McMillen (ed.), Illegal Betting in Britain and Australia: Contrasts in Control Strategies and Cultures (London and New York: Routledge).
Dombrink, J. (1996) Gambling Cultures. In J. McMillen (ed.), Gambling and the Legalization of Voice: Social Movements, Public Health and Public Policy in the United States (London and New York: Routledge):
Dombrink, J., and W.N. Thompson (n.d.) The Last Resort: Success and Failure in Campaigns for Casinos. Reno and Las Vegas: University of Nevada Press.
Dostoyevsky, Fyodor (1866) The Gambler. In C. Garnett (Ed.), The Gambler and Other Stories (New York: Macmillan).
Douglas, A. (1995) British Charitable Gambling 1956–1994: Towards a National Lottery. London & Atlantic Highlands, NJ: Athlone.
Dunstan, R., (1997) Gambling in California. California Research Bureau: California State Library (January). Digital document: www.library.gov/CRB/97/03/crb97003.html

Gambling with Our Future? 137
Fraser Institute Digital PublicationFebruary 2002
Eadington, W.R. (1998) Contributions of Casino-Style Gambling to Local Economies. The Annals of the American Academy of Political and Social Science (March).
Eadington, W.R. (1999) Trends 2000: Trends in Casinos and Tourism for the 21st Century. Reno: University of Nevada. Digital document: www.unr.edu/colleges/coba/game/frame.htm.
The Economist (1995) Rulette. The Economist 36, 7926 (August 5): 53.
The Economist (1998) The National Lottery. The Economist 346, 8054 (February 7): 60.
The Economist (1999) Gambling on the Future. The Economist (June 26): 27–28.
The Economist (2000) Gambling’s Critics: Look Out, Vegas. The Economist (July 15): 31.
Eisler, D. (1998) Gambling with Morality. CANOE Columnist (January 29).
Ernst and Young (1994) Ontario Casino Corporation: Assessment of Casino Windsor. Toronto, ON: Ontario Casino Corporation.
Evans, Richard (2000) Taxman Handicapped in New Betting Coup. The Daily Telegraph (January 22).
Ey, C.S. (1998) Gambling on the Internet. Baltimore Business Journal 6, 2 (June 5): 9.
Ezell, J.S. (1960) Fortune’s Merry Wheel. Cambridge, MA: Harvard University Press.
Faust, F. (1998) Study Says Missouri Is a Winner in Casino Gambling. St. Louis Post-Dispatch (February 1): E2.
Ferris J., T. Stirpe, and A. Ialomiteanu (1996) Gambling in Ontario: A Report from a General Population Survey on Gambling-Related Problems and Opinions. Revised Edition. Toronto: Addiction Research Foundation.
Firestone, D. (1999) South Carolina Again Fails to Rein In Video Poker. The New York Times (June 30): A12.
Fisher, S. (1993) The Pull of the Fruit Machine: A Sociological Typology of Young Players. The Sociological Review (August) 41, 3: 446–74.

Gambling with Our Future? 138
Fraser Institute Digital PublicationFebruary 2002
France, C. (1902) The Gambling Impulse. American Journal of Psychology 13: 364–407.
Gaming Commission (1988) Report on the Status of Gaming in British Columbia. Province of British Columbia (January 1).
Gemini Research (1994) Social Gaming and Problem Gaming in British Columbia. (Available from British Columbia Lottery Corporation, Kamloops, BC).
Golden Casket Lottery Corporation Limited (1999) Submission to the Productivity Commission’s Inquiry into Australia’s Gambling Industries (January). Digital document: www.indcom.gov.au/inquiry/gambling/subs/sublist.html.
Goodman, R. (1995) The Global Gambling Experiment. Wilson Quarterly 19, 4 (Autumn): 28.
Gower, P. (1999) Reading, Writing, and the Races. The Globe and Mail (August 7): D1–D2.
The Guardian (1999) Blackjack, Kickbacks, and the Fall of Caesars Casino. The Guardian (May 17). Digital document: www.guardianunlimited.co.uk/Archive/Article/0,4273,3865764,00.html.
Gumbel, P. (1999) Las Vegas Hotel Boom Begins Paying Off. Wall Street Journal (April 20): B1, B4.
Harris, C. (1999) You Bet Again: Gambling Patterns Nationwide. The Globe and Mail (August 3).
Henriksson, L.E. (1996) Hardly a Quick Fix: Casino Gambling in Canada. Canadian Pubic Policy 22, 2: 116–28.
Henriksson, L.E., and R.G. Lipsey (1999) Should the Provinces Expand Gambling? Canadian Public Policy 25,2 (June).
Herman, R.D., Ed. (1967) Gambling. New York, Evanston, and London: Harper & Row.
Hill, J. R. (n.d.) Video Vice: The Economic and Social Consequences of Legalising Video Gambling in Alabama. Digital document: www.alabamafamily.org/pubs/vidvice.htm.

Gambling with Our Future? 139
Fraser Institute Digital PublicationFebruary 2002
Hughes, V. (1996) Gambling and the State. IPI Review (March).
Hutchinson, Brian (1999) Betting the House: Winners, Losers and the Politics of Canada’s Gambling Obsession. Toronto: Penguin.
Jackson, A. J., and C.T. Griffiths (1991) Canadian Criminology: Perspectives on Crime and Criminality. School of Criminology, Simon Fraser University. Toronto: Harcourt Brace Jovanovich (Canada).
Janower, C.R. (n.d.) Gambling on the Internet. Harvard Law School. Digital document: jcmc.mscc.huji.ac.il/vol2/issue2/janower.html.
Johnson, Lewis D., and Bohumir Pazderka (1995) It’s No Gamble: The Economic and Social Benefits of Stock Markets. Vancouver: The Fraser Institute.
Kallick, M., D. Suits, T. Dielman, and J. Hybels (1979) A Survey of American Gambling Attitudes and Behavior. Prepared by Survey Research Center Institute for Social Research, The University of Michigan.
King, R. (n.d.) Gambling and Organized Crime. Washington, DC: Pubic Affairs Press.
Ladouceur, R., J.M. Boisvert, M. Pepin, M. Loranger, and C. Sylvain (1994)Social and Economic Costs of Pathological Gambling. Journal of Gambling Studies 10: 399–409.
Leven-Phares Associates (1998) The Economic Impact of Gaming in Missouri. Commissioned by Civic Progress, St. Louis, Missouri (April).
Local Government Association of Tasmania (1998) Submission on Australia’s Gambling Industries (November). Digital document: www.indcom.gov.au/inquiry/gambling/subs/sublist.html.
Lotteries Commission of New Brunswick (1998) 1997–1998 Annual Report. Digital document: www.gov.nb.ca/finance/annrep/lottery/98/lotrp98e.htm.
Loto-Quebec (1998a) Annual Report 1997–1998.
Loto-Quebec (1998b) Loto-Quebec and its Evolution: A Profile of the Corporation and its Subsidiaries.

Gambling with Our Future? 140
Fraser Institute Digital PublicationFebruary 2002
Macauley G. (1994) Review of Report to the Ontario Casino Project Ontario Casino Market and Economic Impact Study by The Coopers & Lybrand Consulting Group (August 12, 1993). Submitted to Ann Ehrcke, Director, Gaming Policy Project, Ministry of Government Services, Government of Ontario.
Manitoba Lotteries Corporation (1998) Annual Report 1997–1998.
Margolis, J., et al. (1997) Casino and Crime: An Analysis of the Evidence. Prepared for the American Gaming Association.
Marshall, K. (1996) A Sure Bet Industry. Perspectives 8, 3 (Autumn). Catalogue no. 75-001-XPE. Ottawa: Statistics Canada.
Marshall, K. (1998) The Gambling Industry: Raising the Stakes. Perspectives 10, 4 (Winter). Catalogue no. 75-001-XPE. Ottawa: Statistics Canada.
Marshall, K. (2000) Update on Gambling. Perspectives (Spring). Catalogue no. 75-001-XPE. Ottawa: Statistics Canada.
McClearly, R, and K. Chew with W. Feng, V. Merrill, C. Napolitano, M. Males, B. Graffeo (1998) Suicide and Gambling: An Analysis of Suicide Rates in US Counties and Metropolitan Areas: A Report to the American Gaming Association. Department of Environmental Analysis & Design School of Ecology, University of California Irvine.
McGowan, R. (1994) State Lotteries and Legalized Gambling: Painless Revenue or Painful Mirage. London: Quorum Books/Wesport.
McGowan, R. (1997) Legalized Gambling: A History. In M.E. Williams (ed.), Legalized Gambling (San Diego, CA: Green Haven Press): 13–31.
McMillen, J., and P. Grabosky (1998) Trend and Issues in Crime and Criminal Justice No. 88: Internet Gambling. Australian Institute of Criminology (June). Digital document: www.aic.gov.au/publications/tandi/tandi88-txt.html.
Melzer, B. (1998) Bye Bye Cyber Bookie? ABCNEWS (October 24). Digital document: more.abcnews.go.com/sections/business/DailyNews/gamble1024/index.html
Mental Health Foundation of Australia (1998) Submission to the Productivity Commission’s Enquiry into Australia’s Gambling Industries. Digital document: www.indcom.gov.au/inquiry/gambling/subs/sublist.html

Gambling with Our Future? 141
Fraser Institute Digital PublicationFebruary 2002
Miers, D (1996) Gambling Cultures. In J. McMillen (ed.), Objectives and Systems in the Regulation of Commercial Gambling (London and New York: Routledge): 288–311.
Miller, J. D. (1998) Just One More Bet. ABC NEWS (December 15). Digital document: more.abcnews.go.com/sections/business/gambling1215/index.html.
Miller, W.J, and M.D. Schwartz (1998) Casino Gambling and Street Crime. The Annals of The American Academy of Political and Social Science (March).
Ministry of Employment and Investment [Government of British Columbia] (1997) Request for Proposals: Destination and Charitable Gaming Facilities in the Province of British Columbia. British Columbia: Lotteries Advisory Committee.
Ministry of Health [Government of British Columbia] (1995) Problem Gambling: Background Information. British Columbia: Adult Clinical and Addictions Services Branch.
Missouri Gaming Commission (1998) Annual Report to the General Assembly: Fiscal Year 1998.
Moore, P.G. (1994) A National Lottery in the UK. Journal of Applied Statistics (December 15).
Moran, A. (1998) Submission to the Productivity Commission’s Inquiry into Australia’s Gambling Industries. Digital document: www.ipa.org.au/Speechesandsubmssns/ampcgamblingsub.html.
Morse, A. (1998) Internet Gambling Targeted. ABCNEWS (Washington). Digital document: more.abcnews.go.com/sections/us/gamlbing728/index.html.
MPM Gaming Research (1998) Annual Gaming Report Appendices: Volume II. In Alcohol and Gaming Authority, Interim Report: Toward a Convenience Model of Gaming and Its Social Effects in Nova Scotia.
Munting, R. (1996) An Economic and Social History of Gambling in Britain and the USA. Manchester and New York: Manchester University Press.
Muska, D. (1999) Cover Story: www.prohibition.gov. Nevada Journal. Digital document: nj.npri.org/nj99/06/cover_story.htm.

Gambling with Our Future? 142
Fraser Institute Digital PublicationFebruary 2002
National Advisory Council on Consumer Affairs (1998) Response to the Issues Paper “Australia’s Gambling Industries”. Submission to the Productivity Commission’s Inquiry into Australia’s Gambling Industries. Digital document: www.indcom.gov.au/inquiry/gambling/subs/sublist.html.
National Center for Policy Analysis (1999) Who Pays for Bankruptcies? Idea House. Digital document: www.ncpa.org/pd/economy/dec96i.html.
National Center for Responsible Gaming [NCRG] (1998) 1998 Annual Report. Kansas City, Missouri.
National Council on Welfare (1996) Gambling in Canada. A Report by the National Council of Welfare.
National Gambling Impact Study Commission [NGISC] [USA] (1999a)Executive Summary. (June).
National Gambling Impact Study Commission [NGISC] [USA] (1999b)Final Report. (June).
National Opinion Research Center at the University of Chicago [NORC] (1999a) Gambling Impact and Behavior Study. Report to the National Gambling Impact Study Commission (April 1).
National Opinion Research Center at the University of Chicago [NORC] (1999b) Overview of National Survey and Community Database Research on Gambling Behavior. Report to the National Gambling Impact Study Commission (February 1).
Neal, M. (1999a) The Ongoing Effects of Deregulation on Betting Shop Customer Profile and Behavior. Unpublished Paper. (Mark Neal is a Lecturer at Zayed University in the United Arab Emirates).
Neal, M. (1999b) You Lucky Punters!: A Study of Gambling in Betting Shops. Unpublished Paper. (Mark Neal is a Lecturer at Zayed University in the United Arab Emirates).
Norris, F. (1999) It’s Time for Honest Ads from State Lotteries. New York Times (June 28): A20.
Gambling with Our Future? 143
Fraser Institute Digital PublicationFebruary 2002
Nova Scotia Alcohol and Gaming Authority (1997/1998a) Annual Gaming Report: Volume I. Prepared for The Honourable Kenneth MacAskill Minister Responsible for the Administration of Part II of the Gaming Control Act (December).
Nova Scotia Alcohol and Gaming Authority (1997/1998b) Annual Gaming Report Appendices: Volume II. Prepared for The Honourable Kenneth MacAskill Minister Responsible for the Administration of Part II of the Gaming Control Act.
NSW Lotteries (1998a) Submission to the Independent Pricing and Regulatory Tribunal (IPART) Gaming Inquiry (August). Digital document: www.indcom.gov.au/inquiry/gambling/subs/sublist.html.
NSW Council on Problem Gambling (1998b) Submission to Productivity Commission Industries Inquiry. Digital document: www.indcom.gov.au/inquiry/gambling/subs/sublist.html.
O’Brien, T.L. (1998) Bad Bet: The Inside Story of the Glamour, Glitz, and Danger of America’s Gambling Industry. Toronto: Times Business/Random House.
Ontario Casino Corporation (1995/1996, 1996/1997, 1998) Annual Report.
Ontario Lottery Corporation (1998) Annual Report 1996–1997.
Pearce, J. (1996) Cities a Sure Bet for Casino Profits. Weekly Mail & Guardian. (July 19). Digital document: web.sn.apc.org/wmail/issues/960719/NEWS45.html.
Phinney, D. (1998) Indians Gamble in Cyberspace. ABCNEWS. (November 21). Digital document: more.abcnews.go.com/sections/us/casinointernet1120/index.html.
Productivity Commission (1999) Australia’s Gambling Industries: Draft Report. Volume 1: Report. Digital document: www.pc..gov.au/inquiry/gambling/draftreport.html.
Queensland Government (1998) Submission to the Productivity Commission Inquiry into Australia’s Gambling Industries (December).
Riley, J. (1999) Will Uncle Sam Trump Internet Gamblers? Wall Street Journal (May 14): A14.

Gambling with Our Future? 144
Fraser Institute Digital PublicationFebruary 2002
Room, R., N. Turner, and A. Ialomiteanu (1998) Community Effects of the Opening of the Niagara Casino: A First Report. Available from the Addiction Research Foundation Division, Centre for Addiction and Mental Health, Toronto.
Room, R., N. Turner, and A. Ialomiteanu (1999) Community Effects of the Opening of the Niagara Casino. Centre for Social Research on Alcohol and Drugs, Stockholm University, Stockholm, Sweden, and Addiction Research Foundation Division Centre for Addiction and Mental Health, Toronto, Ontario, Canada.
Rose, I.N. (1986) Gambling and the Law (1st ed.). Hollywood, CA: Gambling Times.
Rose, I.N. (1995) Gambling and the Law: Endless Fields of Dreams. Journal of Gambling Studies 11: 15–33.
Rosecrance, J. (1998) Gambling without Guilt: The Legitimisation of an American Pastime. Pacific Grove, CA: Brooks/Cole.
Ryan, T.P., and J.F. Speyrer (1999) Gambling in Louisiana: A Benefit/Cost Analysis. Prepared for The Louisiana Gaming Control Board (April).
Sama, Siobhan H., Ed. (1999) Report on Gaming Legislation and Regulation in British Columbia (January 1999).
Saskatchewan Gaming Corporation (1998) Annual Report.
Saskatchewan Liquor and Gaming Authority (1998) Annual Report 1997-1998.
Seelig, M.Y., and J.H. Seelig (1998) Place Your Bets: On Gambling, Government and Society. Canadian Public Policy 24, 1: 91–106.
Selby, W. (1996) Gambling Cultures. In J. McMillen (ed.), Social Evil or Social Good? Lotteries and State Regulation in Australia and the United States (Routledge: London and New York): 65–85.
Shaffer, S., M. Hall, and J. Vander Bilt (1997) Estimating the Prevalence of Disordered Gambling Behavior in the United Sates and Canada: A Meta Analysis. Massachusetts: Harvard Medical School Division on Addictions.
Sheridan, E. (1998) South Africa Welcomes Four Casinos to Country. Hotel & Motel Management 213, 7 (April 20): 6.

Gambling with Our Future? 145
Fraser Institute Digital PublicationFebruary 2002
Smith, G., and J. Azmier (1997) Gambling and the Public Interest? Report for the Canada West Foundation (November).
Smith, J., (1998) Gambling Taxation in Australia. Discussion Paper Number 16. Prepared for Australian Research Institute. Digital document: www.tai.org.au/DP16title.html.
Smith, J.F. (1996) Gambling Cultures. In J. McMillen (ed.), When It’s Bad It’s Better: Conflicting Images of Gambling in American Culture (London and New York: Routledge): 101–15.
Statistics Canada (1997a) Average Expenditure per Household. Digital document: www.statcan.gc.ca/english/Pgdb/People/Families/famil16i.htm.
Statistics Canada (1997b) Canadian Crime Statistics. Canadian Centre for Justice Statistics. Catalogue no. 85-205-XPE.
Standing Committee on Community Services [Government of Nova Scotia] (1999a) Minutes for Thursday, April 1, 8:00 am, Halifax. Digital document: www.gov.ns.ca/legi/hansard/comm/cs/cs990401.htm.
Standing Committee on Community Services [Government of Nova Scotia] (1999b) Minutes for Thursday, April 29, 1:00 pm, Halifax. Digital document: www.gov.ns.ca/legi/hansard/comm/cs/cs990429.htm.
Standing Committee on Community Services [Government of Nova Scotia] (1999c) Socioeconomic Impact of Video Lottery Terminals (May). Submitted by Porter Dillon Limited in association with Sterling Research Incorporated. Halifax, Nova Scotia.
Sterling Research Inc. (1998a) Two Sides of Gaming: Perceptions of the Social Costs and Benefits of Gaming among Regular Video Lottery, Casino, Bingo, and Lottery Players.
Sterling Research In.c (1998b) What Is in a Name? Exploring Definitions of Problem Gambling among Nova Scotians. Report prepared for the Nova Scotia Alcohol and Gaming Authority (July).
Sullum, J. (1999) Some Bets Are Off. Reason Online. Digital document: www.reason.com/sullum/060999.html.

Gambling with Our Future? 146
Fraser Institute Digital PublicationFebruary 2002
Tasmanian Gaming Commission (1998a) Australian Gambling Statistics 1972/73 to 1996/97. Digital document: www.lotteryinsider.com.au/stats/.
Tasmanian Gaming Commission (1998b) Tasmania’s Problem Gambling Strategy. A submission by the Tasmanian Gaming Commission to the Productivity Commission Gambling Inquiry (November). Digital document: www.indcom.gov.au/inquiry/gambling/subs/sublist.html.
Thomas, R., (1999) Gambling Craze Fed by Internet. TheGuardian (March 28). Digital document: www.guardianunlimited.co.uk/Archive/Article/0,4273,3845585,00.html
Thompson, W.N. (1994) Legalized Gambling: A Reference Handbook. Santa Barbara, CA: ABC-CLIO.
Todd, Douglas (2000) Government-Backed Gambling Is Not All Bad. The Vancouver Sun (August 4).
UK National Lottery (1999) National Lottery Information WebSite. Digital document: www.national-lottery.co.uk.
UNLV International Gaming Institute (1996) The Gaming Industry: Introduction and Perspective. Las Vegas, NV: University of Nevada Las Vegas International Gaming Institute. Published simultaneously in Canada by John Wiley.
US Bureau of the Census (1998) Statistical Abstract of the United States: 1998 (118th edition). Washington, DC: US Department of Commerce.
Vaillancourt, François, and Alexandre Roy (2000) Gambling and Governments in Canada, 1969–1998: How Much? Who Plays? What Payoff? Toronto: The Canadian Tax Foundation.
Vancouver Board of Trade (1994) Discussion Paper. Report by the Gaming Task Force (July 8).
Victorian Casino and Gaming Authority (1998) Second Submission to the Productivity Commission Inquiry into Australia’s Gambling Industries. Digital document: www.indcom.gov.au/inquiry/gambling/subs/sublist.html.
Volberg, R.A. (1994) The Prevalence and Demographics of Pathological Gamblers: Implications for Public Health. American Journal of American Health 84,2: 237–41.

Gambling with Our Future? 147
Fraser Institute Digital PublicationFebruary 2002
Volberg, R.A. (1996) Problem Gambling in New Brunswick: Review and Recommendations. Report to the New Brunswick Department of Finance. Digital document: www.gov.nb.ca/finance/vlt/appendfe.htm.
Volberg, R.A, (1997) Gambling and Problem Gambling in Oregon. Report to the Oregon Gambling Addiction Treatment Foundation. Roaring Spring, PA: Gemini Research.
Wageneraar, W.A. (n.d.) Paradoxes of Gambling Behavior. Hove and London; Hillsdale, MI: Lawrence Erlbaum.
Wall Street Journal (1999) Study Finds Indistinct Link between Gambling, Bankruptcy. Wall Street Journal (August 12).
Waytiuk, J. (1999) Manitoba Bets and Wins on Gambling. The Financial Post. (May 24).
Western Australian Government (1998) Western Australian Government Submission. Prepared for the Productivity Commission Inquiry: Australia’s Gambling Industries (November).
Western Canada Lottery Corporation (1998) Annual Report 1998.
Will, George F. (1999) Gambler Nation. The Sacramento Bee (June 27). Digital document: www.sacbee.com/voices/national/will/will_19990627.html.
Will, George F. (2000) Runnin’, Gunnin’ and Gambling. Washington Post (March 12).
Wilson, P. (1999) Betting on the Net. The Vancouver Sun (June 24): E1–E2.
Woellert, L., and P. Dwyer (1999) Big Casinos’ Big Score. Business Week (June 21): 66–76.
Youngman Berdahl, L. (1999) Gambling in Canada: Triumph, Tragedy, or Tradeoff? (Summary Report: The Impact of Gaming upon Canadian Non-Profits, A 1999 Survey of Gaming Grant Recipients.) Canada West Foundation (July).
Zielbauer, Paul. (1999) With New Casino, Mohawks Hope to Reserve Their Fortunes. The New York Times (April 12).

Gambling with Our Future? 148
Fraser Institute Digital PublicationFebruary 2002
About the authors
Patrick Basham is a Senior Fellow at The Cato Institute in Washington, DC. For-merly Director of the Social Affairs Centre at The Fraser Institute, he has authored,co-authored, and edited books, studies, papers, and articles on a variety of policytopics for both general and academic audiences. Following Bachelor’s and Master’sdegrees from Carleton University and the University of Houston, respectively, hecompleted a doctoral dissertation in Political Science and shortly will receive hisPh.D. from Cambridge University.
Karen White holds a Bachelor of Public Relations from Mount Saint Vincent Uni-versity and an MBA from Saint Mary’s University, Halifax, Nova Scotia. Ms Whitehas a background in public relations, marketing, and market research. She was an in-tern at The Fraser Institute during the summer of 1999 and is now working in publicrelations at Argyle Rowland Worldwide in Toronto, Ontario.

Gambling with Our Future? 149
Fraser Institute Digital PublicationFebruary 2002
About this publication
Fraser Institute Digital Publications are published from time to time by The FraserInstitute (Vancouver, British Columbia, Canada) to provide timely and comprehen-sive studies of current issues in economics and public policy.
Distribution These publications are available from www.fraserinstitute.ca in Por-table Document Format (PDF) and can be read with Adobe Acrobat Reader, which isavailable free of charge from Adobe Systems Inc. To down-load Acrobat Reader, goto this link: http://www.adobe.com/products/acrobat/readstep.html with yourBrowser.
Disclaimer The authors of this publication have worked independently and opin-ions expressed by them are, therefore, their own and do not necessarily reflect theopinions of the members or the trustees of The Fraser Institute.
Copyright Copyright© 2002 by The Fraser Institute. All rights reserved.
Date of issue February 2002
Editing, design and production Lindsey Thomas Martin

Gambling with Our Future? 150
Fraser Institute Digital PublicationFebruary 2002
About The Fraser Institute
The Fraser Institute is an independent Canadian economic and social research andeducational organization. It has as its objective the redirection of public attention tothe role of competitive markets in providing for the well-being of Canadians. Wheremarkets work, the Institute’s interest lies in trying to discover prospects for improve-ment. Where markets do not work, its interest lies in finding the reasons. Wherecompetitive markets have been replaced by government control, the interest of theInstitute lies in documenting objectively the nature of the improvement or deterio-ration resulting from government intervention. The work of the Institute is assistedby an Editorial Advisory Board of internationally renowned economists. The FraserInstitute is a national, federally chartered, non-profit organization financed by thesale of its publications and the tax-deductible contributions from its members, fromfoundations, and from other supporters; it receives no government funding.
Membership For information about becoming a member of The Fraser Institute,please contact the Development Department via e-mail: [email protected]; via telephone: 604.688.0221 ext. 586; via fax: 604.688.8539.
In Calgary, please contact us via e-mail: [email protected]; via telephone:403.216.7175 or, toll free, 1.866.716.7175; via fax: 403.234.9010.
From Toronto, please telephone 416.363.6575 or fax 416.601.7322.
Media For media enquiries, please contact Suzanne Walters, Director of Commu-nications, via e-mail: [email protected]; via telephone: 604.714.4582 or,from Toronto, 416.363.6575 ext. 582.
Ordering publications For information about ordering the printed publications ofthe Fraser Instiute, please contact the book sales coordinator via e-mail: [email protected]; via telephone: 604.688.0221 ext. 580 or, toll free, 1.800.665.3558 ext. 580;via fax: 604.688.8539.