games and economic behavior - marco faravelli · 2017-12-08 · games and economic behavior. ......
TRANSCRIPT

Games and Economic Behavior 93 (2015) 1–23
Contents lists available at ScienceDirect
Games and Economic Behavior
www.elsevier.com/locate/geb
Mandate and paternalism: A theory of large elections ✩
Marco Faravelli a,∗, Priscilla Man a, Randall Walsh b
a School of Economics, University of Queensland, Australiab Dept. of Economics, University of Pittsburgh & National Bureau of Economic Research, United States
a r t i c l e i n f o a b s t r a c t
Article history:Received 4 August 2014Available online 22 June 2015
JEL classification:D72C72
Keywords:MandateTurnoutLarge electionsCostly votingPaternalism
We propose a game theoretic costly voting model of large elections that incorporates the assumption that mandate matters. This innovation is motivated by empirical evidence that US Representatives with larger victory margins on average vote in a more partisan manner. If voters are paternalistic, this new model predicts strictly positive limiting turnout rates as the population grows arbitrarily large. The model also preserves stylized comparative statics results of costly voting models, including the underdog effect and the competition effect. Finally, we develop an innovative computational strategy to solve the model for large, finite, electorates and show that our results are not only qualitatively, but also quantitatively relevant.
© 2015 Elsevier Inc. All rights reserved.
1. Introduction
It is natural to think of elections as winner take all contests. Be it a ballot for a member of parliament or a presidential election, we typically believe that the winner will have her own way, while the loser will have no say. Consequently, it is equally customary in voting theory to model elections as winner take all tournaments, where only the candidate who receives the most votes wins the prize. However, in reality elections are more complex and mandate plays a role in shaping the policy implemented by the winner. This notion has received attention in the political science literature and various explanations for the presence of a mandate effect have been put forward.1 In this paper we argue that the policies adopted by elected politicians are closer to the “center” when their margin of victory is smaller and more “extreme” when their seats are won with a landslide victory. We present empirical evidence from US Congressional voting records in support of this thesis and propose a new theory of large elections that takes mandate into account. While one may be tempted to think of the winner take all assumption as an innocuous simplification, we show that a small deviation from the standard approach generates different and more realistic predictions.
One of the differences generated relates to the “paradox of voting”, first identified by Anthony Downs (1957) in the original formulation of his rational choice theory. In a two-candidate winner take all election in which citizens pay a cost to vote, turnout rate is predicted to quickly converge to zero as the electorate grows. The paradox remains whether it is cast in
✩ An earlier version of this paper was published as an NBER working paper in September of 2011 with the title “Smooth Politicians and Paternalistic Voters: a Theory of Large Elections” (NBER working paper No. 17397). Marco Faravelli’s research was supported by the Australian Research Council’s Discovery Projects funding scheme (project number DP140102426).
* Corresponding author.E-mail addresses: [email protected] (M. Faravelli), [email protected] (P. Man), [email protected] (R. Walsh).
1 See Smirnov and Fowler (2007) for a survey.
http://dx.doi.org/10.1016/j.geb.2015.05.0090899-8256/© 2015 Elsevier Inc. All rights reserved.

2 M. Faravelli et al. / Games and Economic Behavior 93 (2015) 1–23
decision theoretic terms, as in Downs, or in game theoretic terms used by recent authors (Ledyard, 1981, 1984; Palfrey and Rosenthal, 1983, 1985). Notably, the assumption that the policy implemented depends on the margin of victory provides a substantial step towards the resolution of the paradox of voting. We show that, under this more realistic assumption, turnout converges to zero at a drastically slower rate than under the winner take all assumption. If we further assume that voters are paternalistic — i.e., they derive spillover benefits from the impact that a policy has on other individuals — our model delivers a strictly positive limiting turnout rate as the size of the electorate grows without bound.2 In other words, the paradox of voting disappears. Conversely, turnout converges to zero in a winner take all framework even with paternalistic voters.
This positive limiting turnout result is driven by a delicate balance between the significance of one vote on the man-date and the magnitude of the paternalism spillover. The rates at which these two effects converge to zero and infinity, respectively, balance out in equilibrium, prompting a positive proportion of the electorate to vote. We demonstrate that this positive proportion need not be one. We show that, given any policy rule (a mapping from vote share to policy outcome), the limiting turnout is strictly less than one whenever voters’ paternalism falls below some threshold.
Further characterizing the equilibrium, we show that under mild symmetry assumptions (so that supporters of neither party are ex-ante more motivated to vote), we obtain the “underdog effect” — that members of the minority party turn out to vote at higher rates than those of the majority; as well as the “competition effect” — that closer elections generate higher turnout.3 These effects have been well-documented, both in laboratory experiments and empirically in large elections (Levine and Palfrey, 2007; Shachar and Nalebuff, 1999; Blais, 2000). However, theoretical predictions for such effects have been notoriously difficult to derive in game theoretical models of large elections (Taylor and Yildirim, 2010). This is largely due to the fact that most of these models predict zero turnout in large elections, thereby stripping off the possibility for meaningful limiting turnout analysis. Our ability to predict strictly positive turnout in large elections enables us to generate these predictions matching stylized empirical findings in a game theoretical framework without reliance on preference for voting or coordination devices.
The limiting results are of interest not because the population is indeed infinite, but because the limiting case is an approximation of a large election. For this reason we also take a numerical approach to solve models of large, finite elections. This has typically been computationally hard due to the need for computing binomial probabilities. We overcome this difficulty through the concentration properties of binomial distributions (cf., Hoeffding, 1963), which allow us to drastically reduce the number of terms to be computed. On a technical note, given that our computational method is not specific to smooth policy rules, we believe that it might be useful for other researchers in this field. We use this approach to provide the solution to our model for a population of 75 000 voters and for several policy rules and different parameters. This exercise is useful in three ways. First, we show that the limiting turnout is an excellent approximation (to the fourth decimal digit) of the turnout with a finite electorate of this size. Second, the exercise allows us to check our theoretical predictions against empirical observations. We calibrate the policy rule using the aforementioned US Congressional voting data and calculate the predicted turnout using our model. Under plausible preference parameters, the predicted turnout rates fit well with the empirical observations. Third, we highlight the crucial role of relaxing the winner take all assumption. Computing the outcome for a relatively close election (which favors the winner take all rule), we calculate the turnout rate under a proportional policy rule with a low paternalism factor and find that, under a winner take all policy rule with 75 000 voters, the paternalism required to achieve the same turnout rate is 200 trillion times higher.
The game theoretic literature on costly voting is extensive.4 Nonetheless, the prediction that turnout converges to zero as the size of the electorate grows has remained typical.5 Part of the literature has attempted to overcome this result by assuming a preference for the act of voting itself (Riker and Ordeshook, 1968). We maintain that voting is instrumental. Another part of the literature assume the existence of some coordination mechanism (such as a leader who can mobilize supporters) that effectively reduces the voting game to one with a small number of players (Harsanyi, 1977, 1992; Morton, 1991; Shachar and Nalebuff, 1999). One notable example is the “ethical voter” model by Feddersen and Sandroni (2006), in which a proportion of the voters receive a benefit for following the voting strategy that would be adopted by a social planner whose party preference is aligned with hers.6 In this strand of literature, voters within the same party do not interact strategically among themselves. Our model departs from this setting by assuming that all voters interact with each other strategically, thereby allowing voters within the same party to free-ride on each other.
Two concurrent and independent papers by Evren (2012) and Myatt (2012) tackle the paradox of voting by introducing uncertainty to a winner take all election with paternalistic voters.7 Evren introduces uncertainty over the proportion of other-regarding voters. Myatt, on the other hand, introduces uncertainty over the beliefs on voters’ party alliance. These
2 To be precise, by “strictly positive limiting turnout rate” we mean that the proportion of potential voters who turn out is bounded away from zero — as opposed to the case where the absolute number of voters is bounded away from zero, but the proportion goes to zero.
3 The terms underdog effect and competition effect are introduced by Levine and Palfrey (2007).4 See, for instance, Campbell (1999), Börgers (2004), Goeree and Grosser (2007), Krasa and Polborn (2009), Krishna and Morgan (2012). The empirical
implications of the pivotal voter model in small elections have been examined by Coate et al. (2008). There are also information aggregation voting models that analyze voters’ participation. See McMurray (2013).
5 E.g., see Taylor and Yildirim (2010).6 Coate and Conlin (2004) use a version of this model to explain turnout in the Texas liquor referenda.7 Paternalism also appears in Feddersen and Sandroni (2006) in the sense that an ethical voter projects her preferred election outcome onto the entire
measure of voters. Myatt (2012) does not incorporate paternalism in his basic model, but his Proposition 7 considers paternalistic voters.

M. Faravelli et al. / Games and Economic Behavior 93 (2015) 1–23 3
Fig. 1. Examples of smooth policy rule.
different forms of uncertainty “smooth” the expected utility of each voter in the sense of slowing the rate at which the benefit from voting approaches zero, just as mandate does in our model. Thus Evren’s, Myatt’s and our models present three different (and mutually compatible) approaches to resolve the paradox of voting. It is noteworthy that our model does not assume any uncertainty over a standard costly voting model, suggesting that significant election turnout can be compatible with models without additional uncertainty.
Closest to our work are the papers by Castanheira (2003) and Herrera et al. (2014b) that compare voters’ behavior under “power sharing rules” to winner take all elections.8 Both papers show that, under their particular form of power sharing rule (Castanheira uses a quadratic loss function and a weighted average policy rule between the two parties, with the weights being smooth functions of the mandate; Herrera et al. use a simple proportional rule9), the benefit from voting is inversely proportional to the expected number of voters. Both papers conclude from this result that turnout converges to zero at a slower rate under power sharing than in a winner take all election (unless the winner take all election is of the knife-edge case where the two parties are exactly symmetric). Our paper generalizes their result to account for any form of mandate consideration. The advantage of this generalization is three-fold. First, when there is no paternalism, our result (see Corol-lary 1) can be viewed as an extension of the famous zero turnout result of Palfrey and Rosenthal (1985) to a very general class of policy rules. Second, we demonstrate that the limiting underdog and competition effect do not depend on the spe-cific functional form of the electoral rule, nor on the specific distribution of voting costs. Finally, proofs of the convergence rate in both Castanheira and Herrera et al. rely on the functional form they impose. In particular, Herrera et al. utilize a closed form marginal benefit function. Our proof adopts instead a general statistical inequality (Hoeffding, 1963), freeing us from the reliance on specific functional forms. This is a solid technical advancement for the literature on power sharing.
2. Mandate matters: empirical evidence
The notion that the margin of victory matters has been discussed in the political science literature and different ex-planations have been proposed (see Smirnov and Fowler, 2007). The two leading arguments are that candidates may find an extreme partisan position risky for the next election unless they are supported by a large mandate and/or the margin of victory may signal the position of the center of the electorate, toward which candidates lean. Formally, Razin (2003)proposes a model of “responsive candidates” who infer information on an imperfectly observed common preference shock from the election result, and position themselves optimally given this inference.
We do not intend to offer a theoretical foundation for why elected officials respond to their mandate. However, we do wish to provide an interpretation of this crucial assumption and provide empirical support for the presence of a mandate effect. For simplicity, suppose that the policy position of a given elected official can be mapped into the interval [0, 1] and that members of party A strictly prefer outcomes closer to 1, while members of party B strictly prefer outcomes closer to 0. Assume that, if elected, candidates respond to the margin of victory in terms of their policy positions. Thus, in a two-party election, the proportion of votes received by party A can be mapped into a policy outcome through an increasing function G — which we assume to be smooth. This G function can be viewed as a “policy rule”. We plot several possible policy rules against the mandate of party A in Fig. 1.10 The dotted line presents a “proportional rule” under which the winning
8 Relatedly, Faravelli and Sanchez-Pages (2014) and Kartal (2014) compare welfare under plurality and proportional representation.9 Herrera et al. (2014b) also consider Tullock contest success function power sharing rules but do not provide closed form analytical expressions for
them.10 All three policy rules in Fig. 1 are symmetric around 1/2. This is not necessary for obtaining our positive limiting turnout result. See Section 3 for the
precise restrictions on the G function.

4 M. Faravelli et al. / Games and Economic Behavior 93 (2015) 1–23
Table 1Estimations of the effect of margin of victory on degree of partisanship, US 105th to 111th Congressa.
Congress 105th 106th 107th 108th 109th 110th 111th 105th–111th 105th–111th
Victory margin 0.1368∗∗∗ 0.0572∗∗ 0.1754∗∗∗ 0.0599∗∗ 0.1431∗∗∗ 0.2443∗∗∗ 0.2604∗∗∗ 0.1507∗∗∗ 0.0746∗∗∗(0.0338) (0.0263) (0.0343) (0.0271) (0.0275) (0.0257) (0.0299) (0.0111) (0.0095)
Years in office −0.0008 −0.0010 −0.0007 −0.0013 −0.0001 0.0001 0.0011 −0.0002 0.0049∗∗∗(0.0010) (0.4261) (0.3867) (0.0009) (0.0009) (0.0008) (0.0009) (0.0004) (0.0006)
Candidate FE · · · · · · · No YesCongress FE · · · · · · · Yes Yes
Marginal effectb 0.2011 0.1060 0.2452 0.1082 0.2479 0.4338 0.3981 0.2473 0.1224
N 423 431 428 430 431 424 432 2999 2999No. legislators 423 431 428 430 431 424 432 753 753Partisanship
Mean 0.4253 0.4426 0.4496 0.4661 0.4793 0.4881 0.5017 0.4647 0.4647S.D. 0.1498 0.1551 0.1778 0.1439 0.1445 0.1465 0.1705 0.1578 0.1578
Victory marginMean 0.3033 0.4264 0.3953 0.4253 0.4070 0.3603 0.3740 0.3847 0.3847S.D. 0.2201 0.2876 0.2487 0.2597 0.2503 0.2602 0.2608 0.2590 0.2590
a The dependent variable in each regression is the degree of partisanship which is constructed using Poole and Rosenthal’s DW-Nominate Scores (see text). Numbers in parentheses are standard errors. ∗ , ∗∗ and ∗∗∗ indicate statistical significance at 10%, 5% and 1% levels, respectively.
b Measures the change in partisanship (expressed in standard deviations) associated with a one standard deviation increase in the margin of victory.
politician responds to the mandate at a constant rate. It approximates a proportional representation democracy. The solid line represents a “quasi-majority rule” under which the winning politician responds to the mandate at a decreasing rate. It approximates policy outcomes under direct election regimes such as the US Congress. Notice that winner take all majority rule can be viewed as the limiting case of a quasi-majority rule when G becomes a step function. The dashed line is an “unconventional rule” under which the winning politician responds to the mandate at an increasing rate. It is rarely observed empirically but is still admitted by the model.
Do politicians adopt a smooth policy rule? There are significantly little empirical evidence on this subject. Fowler (2005)shows that candidates in US Senate races respond to increases in previous election’s Republican vote by adopting a more conservative position in the current race. Somer-Topcu (2009) finds that political parties respond to declining vote shares by changing the policies they support using a sample of 23 Democracies between 1945 and 1988 from the Comparative Manifesto Project. Peterson et al. (2003) proxy “mandate” to the winning party by analyzing newspaper coverage in US Presidential and off-year election and provide empirical evidence that Members of Congress deviate from their historical voting pattern in the direction of the mandate following a “mandate” election.
To provide more direct support for the presence of a mandate effect, we analyze the impact of margin of victory on the voting behavior of US Members of Congress for the 105th (1997–1998) through the 111th Congress (2009–2010). We iden-tify the political position of a given Member of Congress in a given year by the first dimension of her DW-Nominate Score (Poole and Rosenthal, 2001).11 This component of the DW-Nominate Score measures liberal–conservative leaning based on all roll-call votes during each Congressional Session. We construct the degree of partisanship for each Congressperson in each year as the distance between her DW-Nominate Score and the mid-point between the scores of the most liberal Republican and the most conservative Democrat (expressed in terms of absolute value).
We then regress the degree of partisanship on the margin of victory in the election in which the Congressperson won her seat, as well as on years in office. The first seven columns of Table 1 report the results for each of the seven included ses-sions. The eighth column pools the data for the seven congressional sessions into a single regression with the incorporation of congress-level fixed effects. In all cases the coefficient on margin of victory is highly statistically significant. To provide a more intuitive interpretation of the results, we also report the predicted marginal effect associated with a one standard deviation increase in the margin of victory — expressed in terms of standard deviations in partisanship. For example, in the 105th Congress, a one standard deviation increase in the margin of victory will be associated with a 0.2 standard deviation increase in degree of partisanship. The estimated marginal effects across all seven congresses range between 0.11 and 0.44, with a pooled estimate of 0.25.
Of course, these results do not necessarily imply a direct causal link. One alternative explanation is that more ideo-logically extreme candidates select into districts with larger partisan majorities. However, even in the presence of such a selection process, as long as election outcomes can be considered as the most direct measure of a given district’s voter ideology, voters would still benefit by increasing their supported candidate’s margin of victory as it would eventually lead to preferred policy outcomes through the recruitment of candidates with preferable policy positions.
11 See Poole and Rosenthal (2001) for details on the construction of the DW-Nominate Score. A complete set of scores for the 1st through 111th Congress are available online at http://pooleandrosenthal.com/dwnominate.asp. We restrict our analysis to the 105th to 111th Congress because of the limited availability of digitized data in the earlier periods.

M. Faravelli et al. / Games and Economic Behavior 93 (2015) 1–23 5
Nonetheless, we also use the panel structure of the data to investigate the direct, within representative, connection between margin of victory and partisan voting behavior. The final column of Table 1 reports the results of regressing the degree of partisanship on our explanatory variables with both Congress fixed effects and Congressperson fixed effects, using the pooled data from the seven Congresses. This allows us to evaluate how voting behavior of a given candidate evolves in response to changes in her margin of victory. Again the coefficient on the margin of victory is significant at the 1% level, with an estimated marginal effect of 0.12. Thus, even when we focus solely on the within candidate variation in ideological voting patterns, there is clear evidence supporting the assumption that mandate matters.
3. Model
We model an election with N + 1 citizens and two parties, A and B . Denote a generic citizen by i and a generic party by P . Each citizen has, independently, the same ex-ante probability α ∈ (0, 1) of being a supporter of party A and 1 − αof supporting party B . Citizens choose simultaneously to vote for the candidate of party A, the candidate of party B or to abstain.12 If citizen i votes (instead of abstaining), she bears a voting cost of ci . The voting costs of citizens are identically and independently drawn from a non-degenerate interval C ⊆ R+ according to the cumulative distribution function F with a density function f , where f (c) > 0 for all c ∈ C . Let c = inf C . We assume that c < 1/2 to eliminate uninteresting equilibria in which nobody votes simply because all voting costs are too high.13 Each citizen’s party alliance and voting cost are her private information, but their distributions are commonly known.
Let nA and nB be the numbers of votes cast for parties A and B respectively. Party P ’s mandate is equal to the proportion of the votes received by its candidate, except when no one votes, in which case each party receives a mandate of 1/2. Thus,
mP (nP ,nQ ) ={ nP
nP +nQif nP + nQ > 0
12 if nP + nQ = 0
, (1)
where P , Q ∈ {A, B} and P �= Q . To operationalize the mandate effect we assume that each member of party P receives a direct benefit as a result of her party’s mandate. This benefit is denoted by G(mP ) where G : [0, 1] → [0, 1] is a continuous, strictly increasing, twice differentiable function whose first derivative is bounded away from 0 and infinity.14
Citizens may be paternalistic. If a supporter of party P receives a gross benefit of b from the election, she will also enjoy a paternalism benefit equal to γP b for each other citizen in the society,15 where γP ≥ 0. We label the case of γP = 0 for P = A, B as “no paternalism”, while γA, γB > 0 is labeled as paternalism. All payoff information is common knowledge.
Let i be a member of party P with voting cost ci . Let v P and v Q be the number of votes cast for parties P and Q , both exclusive of i. Then i’s utility is
[1 + γP N]G(mP (v P + 1, v Q )) − ci if i votes for party P ;
[1 + γP N]G(mP (v P , v Q + 1)) − ci if i votes for party Q ; and
[1 + γP N]G(mP (v P , v Q )) if i abstains.
As specified, the model defines a Bayesian game. A pure strategy for an individual is a pair of (measurable) voting rules, (sA
i , sBi ), where sP
i : C → {A, B, Abstain} assigns a choice for each voting cost when i belongs to party P . Notice that for each party affiliation and voting cost realization, voting for the opposite party is always strictly worse than abstaining regardless of the number of votes cast for the own and opposite party. Thus at no voting cost would any best-responding citizen vote for the opposite party. In addition, conditional on party alliance and other citizens’ voting rules, the difference between the expected payoffs from voting for own party and abstaining is strictly decreasing in individual i’s cost of voting. Thus any best response of citizen i to any profile of other citizens’ strategy must be monotone — i.e., for each party P , there exists a cut-off cost cP such that when i is a P -supporter, she votes for P for all c < cP and abstains for all c > cP .
In our analysis, we consider symmetric Bayesian–Nash equilibria in which all citizens use the same pair of voting rules, i.e., (sA
i , sBi ) = (sA, sB) for all i. By our argument above, this equilibrium pair of voting rules involves two cut-off costs
(c A, cB).16 Define the turnout of party P as the probability that a randomly chosen supporter of P votes. In equilibrium, the turnout of party P is F (cP ). Since there is a one-to-one relationship between cP and party P ’s turnout, we will refer to an equilibrium solely by (a, b) = (F (c A), F (cB)).
12 For ease of exposition, we use the terms “party P ” and “candidate of party P ” interchangeably.13 In the standard winner take all costly voting model, c < 1/2 ensures that a voter has a strictly positive probability of voting when she knows she is
pivotal with probability 1.14 One interpretation of the model’s “preference for mandate” is that it captures the behavioral notion that voters simply enjoy winning with a larger
mandate. However, we prefer to consider the model within the context of our previous discussion and interpret G(.) as representing the process through which larger voting majorities are translated into increasingly partisan (and thus more preferred) policy outcomes.15 In order to obtain our limiting results (Theorem 2), the paternalism factor has to be asymptotically linear in N . However, given a fixed N (as in our
computation section), all we need is the value of the paternalism factor at the chosen N to be strictly positive.16 Strictly speaking, an equilibrium should also specify the actions chosen at the two cut-off points. However, ci = c A and ci = cB are zero probability
events. The actions at these two points would not affect ex-ante calculations. Hence we will only describe an equilibrium by the cut-offs.

6 M. Faravelli et al. / Games and Economic Behavior 93 (2015) 1–23
4. Mandate and paternalism
When N is finite, an equilibrium exists by the Brouwer Fixed-Point Theorem17:
Proposition 1. For finite N, a pure strategy symmetric monotone Bayesian–Nash equilibrium exists.
Let (aN , bN) be an equilibrium turnout profile in an election with N + 1 citizens.18 For each N , let T N = αaN + (1 −α)bN
be the ex-ante equilibrium overall turnout rate (i.e., turnout unconditional on party alliance). Notice that {(aN , bN)}N ⊂[0, 1]2 possesses a convergent subsequence. Passing to subsequence if necessary, let {(T N )}N be the corresponding conver-gent subsequence of equilibrium overall turnout.
We will first consider the case of no paternalism (i.e., γP = 0 for both parties P ). Define the expected gross marginal benefit of voting to be the difference between the expected benefit from voting and from abstaining, both without taking into account the voting cost. The following theorem gives the convergent rate of the voting benefit along any (not necessarily equilibrium) sequence of turnout profiles such that the limiting turnout is strictly positive.
Theorem 1. Assume no paternalism. Let {(aN, bN)}N be a convergent sequence of turnout profiles (not necessarily in equilibrium) such that limN→∞ T N > 0. The expected gross marginal benefit of voting to any voter along this sequence converges to 0 at the rate of 1/Nas N approaches infinity.
Corollary 1. Assume no paternalism. Any convergent sequence of equilibrium overall turnout rates {(T N)}N converges to 0.
Proof. Suppose not. Then by Theorem 1 the expected gross marginal benefit of voting to any voter goes to 0 as N goes to infinity. But this means (aN , bN) → (0, 0). �
Corollary 1 can be viewed as an extension of the zero turnout result of Palfrey and Rosenthal (1985) to a general class of policy rules. However, Theorem 1 reveals a crucial difference between models with and without mandate concerns — had there been no mandate concern, the expected gross marginal benefit of voting would have converged to 0 exponentially (see the proof of Proposition 2). In other words, adding a mandate consideration slows down the vanishing rate of voting benefits (given a fixed turnout).
Theorem 1 is important for the paradox of voting despite it not being an equilibrium result. If we attempt to explain election turnouts by social preference (e.g., civic duty, other-regarding preference), the strength of such social preference required can be significantly smaller when there is a mandate consideration. Indeed, if γA , γB > 0, our model with mandate consideration predicts strictly positive limiting equilibrium turnout.
Theorem 2. Suppose γA, γB > 0. Let {(aN , bN )}N be a convergent (sub)sequence of equilibrium turnout profiles and let (a∗, b∗) be its limit. Then a∗, b∗ > 0.
This is a consequence of Theorem 1, as the linearly increasing paternalism benefits counteracts the diminishing expected gross marginal benefit of voting (over abstaining), which vanishes exactly at the rate of 1/N . Had the limiting turnout been zero, the large gross marginal benefit of voting would prompt citizens to vote, which cannot be an equilibrium.
Theorem 2 is not a mere consequence of the paternalism assumed. Indeed, if there is no preference for mandate, the limiting turnout is still zero even under our paternalism assumption.
Proposition 2 (No preference for mandate). Suppose γA, γB > 0 and consider a winner take all election, i.e.,
G(mP ) ={0 if mP < 1/2
1/2 if mP = 1/21 if mP > 1/2.
If α �= 1/2,19 then the limiting overall turnout is zero.
Proposition 2 reiterates the importance of Theorem 1 — that the rate of convergence matters. In both models with and without mandate concerns, the expected impact of a single vote on the outcome vanishes as the number of votes cast gets large, either because the pivotal probability is too small, or because the difference that a single vote makes on the mandate is too small. Yet as the expected benefit from voting under a preference for mandate decreases at the rate of 1/N , a linearly
17 The proofs of all theorems and propositions are presented in Appendices A and B.18 If there are multiple equilibria at N , just pick any one of them.19 The knife-edge case of α = 1/2 is a well-known exception. In this case, the probability that each voter is pivotal vanishes at the rate of 1/
√N in a
symmetric equilibrium. With paternalism, the expected gross benefit goes to infinity.

M. Faravelli et al. / Games and Economic Behavior 93 (2015) 1–23 7
increasing paternalism benefit is sufficient to balance it out. The same paternalism is insufficient for a positive limiting turnout in a winner take all election, where the expected benefit from voting vanishes exponentially.
Conversely, the limiting turnout rates need not be 1, which would be the case if the expected gross benefit from voting went to infinity with N . Indeed, the sequence of turnout profiles is interior in many settings.
Proposition 3. If C , the support of voting cost, is unbounded from above, then aN, bN < 1 for all N. If C is bounded from above, then given α and G, there exist strictly positive γA and γB sufficiently small that aN , bN < 1 for all N sufficiently large.
When the convergent sequence of equilibrium voting probabilities is interior, the limiting probabilities satisfy the follow-ing condition:
Proposition 4. If {(aN , bN)}N ⊂ [0, 1)2 converges to (a∗, b∗), then (a∗, b∗) satisfies
γA1 − m∗
A
T ∗ G ′(m∗A) = F −1(a∗)
γBm∗
A
T ∗ G ′(1 − m∗A) = F −1(b∗) (2)
where T ∗ = αa∗ + (1 − α)b∗ is the limiting total turnout (the probability that a citizen votes) and m∗A = αa∗/T ∗ is the limiting
mandate of party A.
Theorem 2 and Proposition 4 are statements about the limiting turnout only. They do not imply higher turnout for larger society. Nothing prohibits {aN } and {bN } from being decreasing sequences.
5. Numerical examples
Three questions remain: First, are the above limiting results good approximations for large but finite elections? Second, is our model giving quantitatively reasonable predictions? Third, is mandate making an economically significant difference when it comes to the paradox of voting? We answer these questions by performing a set of numerical exercises.
5.1. Parameterization
We consider three classes of G functions: the Winner take all Rule as described in Proposition 2, the Proportional Rule defined by G(m) = m, and the class of “Constant Absolute Risk Aversion” (CARA) G functions with parameter k, i.e.,
G(m) = G(m) − 1
2(ek/2 − 1),
where
G(m) ={
ekm if m ∈ [0,1/2]2ek/2 − ek(1−m) if m ∈ [1/2,1] .
The parameter k = G ′(m)/G(m) would be the coefficient of absolute risk aversion if G was a von Neumann–Morgenstern utility function. When k → 0, G approaches the identity function (i.e., the proportional rule). When k → ∞, G approaches the step function for winner take all election. One may therefore consider this class of functions as the policy rules “be-tween” the winner take all rule and the proportional rule.
The size of the electorate (minus one), N , is set at 75 000. The limiting turnouts as N → ∞ are also computed for comparison. Voting cost is assumed to be uniformly distributed on [0, 1/2]. We consider two values of the prior support for party A, α, 0.55 and 0.65. The former represents a close election, while the latter roughly matches the mean margin of victory in the empirical study in Section 2.20 The two parties are assumed to have the same paternalism factor, that is, γA = γB = γ . We choose two (relatively low) values for γ : γ = 0.05 and γ = 0.1. All parameter values are summarized in Table 2. It should be noted, though, that our primary goal is to compare turnout rates under different policy rules at these parameter values, rather than to argue that these parameter values are necessarily “correct”.
With N = 75 000, solving for the exact equilibrium turnout is computationally heavy. The insight here is to note that the probability of a realization of a binomial random variable vanishes exponentially away from the mean. We can therefore truncate the distribution such that the expected benefit from the truncated tails is less than half of the approximation error allowed, which is set at 10−8. The details of our computation strategy are provided in Appendix B.21
20 Due to the underdog effect (see Section 6, Proposition 5), α = 0.55 means that the margin of victory of party A is strictly smaller than 10%. In our numerical exercises, this margin is typically around 5%. Similarly, α = 0.65 results in a margin of victory around 20%, which seems to be a typical victory margin from Fig. 2.21 The computation codes (written in Mathematica) are available from the authors upon request.

8 M. Faravelli et al. / Games and Economic Behavior 93 (2015) 1–23
Fig. 2. Fitted CARA function for the US 2008 Congressional Election.
Table 2Parameter values for numerical exercises.
Parameters Notations Value(s)
Population N 75 000, N → ∞ limitVoting cost distribution N/A Uniform on [0,1/2]Prior support of A α 0.55, 0.65Paternalism factor γ 0.05, 0.1Absolute risk aversion coefficient k 4.75, 10, 20Approximation error allowed ε 10−8
5.2. Limiting approximation
We first check whether the N → ∞ limiting case is a good approximation to large elections. To this end, we calculated the turnout rates when N = 75 000 and N → ∞ under the winner take all rule, the proportional rule and the CARA function with k = 10. Table 3 gives the results. In most cases, the difference is less than 0.01%, indicating that the limiting case is an excellent approximation to large elections of interests. The largest discrepancy occurs at the winner take all election with α = 0.55, where the turnout rate at N = 75 000 is about 4% while the limiting turnout is zero (Proposition 2). Nonetheless, a 4% turnout in 75 000-voter election is, politically and economically, not much different from a zero turnout.
However, the difference between the computation time required for the N = 75 000 and the limiting cases is remarkable. Even for the proportional rule, which is computationally the lightest, the exact N = 75 000 calculation is about 3000 times longer than the limiting approximation. For the CARA function, an N = 75 000 exercise requires 80–110 hours while the limiting approximation takes at most 0.05 second. Thus, analyzing the N → ∞ limiting case as an approximation for large elections saves a significant amount of analytical and computational costs without losing much precision.
5.3. A simple calibration
As the limiting approximation is an efficient tool for analyzing large elections, we would like to check whether our limiting model gives reasonable predictions. To this end we utilize the Congress roll-call votes record in the 111th Congress (2009–2010) as described in Section 2. We linearly transform the D-W Nominate scores so that they have a minimum of 0 and a maximum of 1. Then we fit a CARA function to the data by minimizing the mean squared error of the actual and predicted scores. This gives us k = 4.75, as plotted in Fig. 2. We then calculated the predicted limiting turnout rate under the CARA function with k = 4.75 for different combinations of values of α and γ . This gives overall turnout rates of about 30%–48% (see Column 3, Table 4).
If one thinks that Congresspersons’ behavior in the 2009–2010 Congress will affect voters perception of their benefit function in the 2010 election (i.e., voters’ perception of G is adaptive), we can compare our predicted turnouts to the actual

M. Faravelli et al. / Games and Economic Behavior 93 (2015) 1–23 9
Table 3Comparison between N = 75 000 and limiting turnouts.
Winner-take-all Proportional CARA k = 10
α = 0.55, γ = 0.05
N 75 000 ∞∗ 75 000 ∞ 75 000 ∞a 4.1261% 0 21.2960% 21.2933% 42.1586% 42.1475%b 4.4115% 0 23.5436% 23.5406% 46.6046% 46.5959%T 4.2545% 0 22.3074% 22.3046% 44.1593% 44.1493%Computation time† 2′2′′ N/A 1′1′′ 0.02′′ 80h11′24′′ 0.03′′
α = 0.55, γ = 0.1
N 75 000 ∞∗ 75 000 ∞ 75 000 ∞a 4.4598% 0 30.1150% 30.1132% 59.6149% 59.6056%b 4.7683% 0 33.2934% 33.2914% 65.9033% 65.8965%T 4.5986% 0 31.5453% 31.5434% 62.4447% 62.4365%Computation time† 2′18′′ N/A 1′2′′ 0.02′′ 91h43′48′′ 0.03′′
α = 0.65, γ = 0.05
N 75 000 ∞∗ 75 000 ∞ 75 000 ∞a 0.5880% 0 19.3815% 19.3791% 29.6294% 29.6201%b 0.7228% 0 26.4126% 26.4092% 40.3740% 40.3654%T 0.6352% 0 21.8424% 21.8396% 33.3900% 33.3810%Computation time† 1′50′′ N/A 1′15′′ 0.02′′ 111h47′45′′ 0.05′′
α = 0.65, γ = 0.1
N 75 000 ∞∗ 75 000 ∞ 75 000 ∞a 0.6237% 0 27.4078% 27.4062% 41.8972% 41.8892%b 0.7666% 0 37.3505% 37.3483% 57.0922% 57.0853%T 0.6737% 0 30.8878% 30.8859% 47.2155% 47.2078%Computation time† 1′46′′ N/A 1′17′′ 0.02′′ 109h51′29′′ 0.05′′
∗ Theoretical prediction due to Proposition 2.† Of a Mathematica code on a desktop computer with a 3.06 GHz Duo Core Processor and 4 GB of memory.
Table 4Turnout rates at N = 75 000.
Winner take all Proportional CARA k = 4.75 CARA k = 10 CARA k = 20
α = 0.55, γ = 0.05
a 4.1261% 21.2960% 32.4656%∗ 42.1586% 52.4090%∗b 4.4115% 23.5436% 35.8920%∗ 46.6046% 57.9403%∗T 4.2545% 22.3074% 34.0075%∗ 44.1593% 54.8981%∗
α = 0.55, γ = 0.1
a 4.4598% 30.1150% 45.9132%∗ 59.6149% 74.1175%∗b 4.7683% 33.2934% 50.7590%∗ 65.9033% 81.9400%∗T 4.5986% 31.5453% 48.0938%∗ 62.4447% 77.6376%∗
α = 0.65, γ = 0.05
a 0.5880% 19.3815% 26.1326%∗ 29.6294% 28.4409%∗b 0.7228% 26.4126% 35.6127%∗ 40.3740% 38.7585%∗T 0.6352% 21.8424% 29.4506%∗ 33.3900% 32.0521%∗
α = 0.65, γ = 0.1
a 0.6237% 27.4078% 36.9571%∗ 41.8972% 40.2216%∗b 0.7666% 37.3505% 50.3640%∗ 57.0922% 54.8127%∗T 0.6737% 30.8878% 41.6495%∗ 47.2155% 45.3285%∗
∗ Limiting approximation.
turnout rate in the 2010 US Congressional election, which is 42% among all registered voters and 38% among the voting age population.22 Both numbers fit remarkably well with our predicted turnouts. If instead one believes that voters in the 2008 election correctly forecast the Congresspersons’ behavior in the 2009–2010 Congress, we can compare our predicted turnout to the actual turnout in the 2008 US Congressional election, which is 64% among registered voters and 57% among the voting age population. While both numbers are higher than our predicted values, it should be noted that 2008 is a Presidential election year, possibly resulting a higher γ for voters (as they are likely to be more drawn into the election).
22 All turnout data in this section are obtained from http://www.idea.int/vt/.

10 M. Faravelli et al. / Games and Economic Behavior 93 (2015) 1–23
Fig. 3. Policy rules used in numerical exercises.
Indeed, with α = 0.55 and k = 4.75, overall turnout rates of 59% and 68% can be generated by setting γ = 0.15 and γ = 0.2, respectively.
5.4. Effect of mandate consideration
More important, however, is the question of how mandate consideration affects turnout prediction quantitatively. To this end, we calculated the turnout rates under the winner take all rule, proportional rule, and CARA functions with k = 4.75, k = 10 and k = 20 for a comparison. Fig. 3 plots the CARA functions used.
The quantitative effect of mandate concerns on turnout is significant, as demonstrated by Table 4. For a close election with α = 0.55, which favors the winner take all rule, the turnout rate under proportional rule is 5 to 7 times that under winner take all. The CARA functions give even higher turnout rates. At γ = 0.05, the CARA functions with parameter k = 10and k = 20 result in the overall turnout of 44% and 55%, respectively, being 10 and 12 times of that under a winner take all rule. When γ = 0.1, the CARA functions with k = 10 and k = 20 yield the turnout rates of 62% and 78%, respectively. With the same α and γ , the winner take all rule generates a turnout of 4.6%, less than one-tenth of the turnouts under the CARA functions.
The effect of mandate concern is more visible at α = 0.65, where the turnout under the winner take all rule converges to zero at a faster rate. For both values of γ used, the overall turnout under winner take all is less than 1%. Meanwhile, the turnout rates in models with considerable mandate concerns are generally around 30–45%, more than 45 times higher than that under winner take all.
If one finds our parameters reasonable, then our model yields turnout predictions matching empirically observed turnout rates in some national elections. For examples, when α = 0.55, the turnout rates under the CARA functions with k = 10 and 20 are in the range of 44–78%, roughly matching typical national election turnouts in North America and Europe. On the lower end of empirical turnout rates, the 2011 Switzerland Parliamentary election records a turnout rate of 49% among registered voters and 40% among the voting age population. The registered voter and voting age population turnout rates in the UK 2010 Parliamentary election are 66% and 61%, respectively. On the higher end of empirical turnout rates, the Italy 2013 Parliamentary election turnout rates stand at 75% among registered voters and 68% among the voting age population. All these empirical turnout rates are compatible with the results of our numerical exercises. It should also be noted that γ does not have to be a lot higher for a higher turnout. In fact, when α = 0.55, with a CARA k = 10 function, γ = 0.3 is sufficient to generate an overall turnout of 97.7%, with full turnout from the minority party.
If instead one finds our paternalism factors too high to be reasonable, then a drastically more unreasonable paternalism factor is required to generate the same turnout rate under the winner take all rule. For instance, when α = 0.55, to generate an overall turnout of 22% (the predicted turnout under the proportional rule when γ = 0.05), a γ of 10 trillions (1013) is required for the winner take all rule. If we would like to match the turnout rate under the CARA k = 4.75 function, the γrequired would be even higher.
6. Equilibrium analysis
The numerical examples in Section 5 suggests that the limiting equilibrium in our model with low level of paternalism provides an excellent approximation to large elections. Given our parameterization, the numerical exercises also produce

M. Faravelli et al. / Games and Economic Behavior 93 (2015) 1–23 11
turnout rates matching empirical observations. We now wish to demonstrate yet another advantage of our approximation — that its comparative statics match stylized facts about large elections.
The assumptions required for Proposition 4 are rather general. To allow for a meaningful equilibrium analysis, however, we must impose some symmetry across the two parties. Otherwise, the comparison across the two parties could arise simply out of the asymmetries and may have little to do with the election game per se.
To this end, we require that all citizens, conditional on their party alliance, are ex-ante identical in terms of their utilities. First, we assume that the two parties are identical in terms of their paternalism (i.e., γA = γB = γ ). Second, we assume that the benefit from mandate is symmetric around 1/2. That is, for any mandate m ∈ [0, 1], G(1 − m) = 1 − G(m).23 Using the interpretation in Section 2, this is saying that, in case of victory, either candidate responds to mandate in the same magnitude. Under the above symmetry assumptions, Equation (2) can be rewritten as
γ1 − m∗
A
T ∗ G ′(m∗A) = F −1(a∗) (3)
γm∗
A
T ∗ G ′(1 − m∗A) = F −1(b∗). (4)
The only asymmetry we allow is the (expected) size of the parties. Without loss of generality we assume that party A is the larger party. That is, α ≥ 1/2.
We begin by proving the existence of an underdog effect: that supporters of the smaller party vote more frequently, but the larger party still secures a greater mandate.
Proposition 5 (Underdog effect). Suppose α ≥ 1/2. Then a∗ ≤ b∗ and m∗A ≥ 1/2. Moreover, both inequalities are strict whenever
α > 1/2.
The term underdog effect was coined by Levine and Palfrey (2007). It is documented in large elections by Shachar and Nalebuff (1999), Blais (2000). Taylor and Yildirim (2010) formalize the notion in a general game theoretic framework for small elections. However, in their model the underdog effect disappears when N → ∞, since turnout converges to zero. In contrast, our Proposition 5 offers a theoretical foundation for the underdog effect in a large election. Kartal (2014) obtains a similar finding. Unlike her result, our proposition does not require diminishing marginal mandate.
The underdog effect compares voting behaviors across parties given fixed party sizes. It is caused by the relatively higher incentive to free-ride experienced by the majority supporters, but it depends neither on the curvature of G (the smooth policy rule), nor on the distribution of voting costs. All it requires is that supporters across parties have the same preference parameters (so that none of them are more zealous about voting ex-ante) and that the preference for mandate be symmetric around 1/2.
In contrast, the effect of a change in α on turnout is affected by both the curvature of G and the distribution of voting costs. The former governs the rate of returns to voting arising from changes in the expected number of votes for each party (and the associated change in mandate benefits). The latter affects responsiveness to changes in expected votes through changes in the gross benefits of voting. To make our analysis tractable, we impose two mild assumptions. First, we assume that the marginal benefit from mandate when a party is winning is decreasing. This is the usual “decreasing returns” assumption in economics. In elections, though, it has the additional interpretation that, when the votes are asymmetrically split, an extra vote for the winning party is worth less than an extra vote for the losing party. We think of this as a realistic feature of most elections. Mathematically this translates to G being concave on [1/2, 1]. That is, G has the same general shape as the quasi-majority rule described in Section 2. Second, we assume that the distribution F satisfies the following condition:
f (c)c
F (c)is weakly decreasing in c.
In other words, the elasticity of the cumulative distribution function is decreasing in c. Interestingly, while in our work this assumption is sufficient to guarantee the presence of a competition effect, in Herrera et al. (2014a) a strict version of this assumption guarantees an increasing relation between the relative support ex-ante (i.e., in preferences) for the two parties and the relative support ex-post (i.e., in turnout) for the two parties. This assumption is also used by Che et al. (2013). We note that this is a fairly innocuous assumption, as it is satisfied by virtually all of the commonly used distributions with support in R+ , including log-normal distributions, exponential distributions, Pareto distributions on [c, ∞) for c > 0, uniform distributions on [c, c] where c ≥ 0, Weibull distributions and single parameter Fréchet distributions.
Given the above assumptions, we obtain the competition effect, which states that total turnout decreases as the election becomes more lopsided.
Proposition 6 (Competition effect). When α ∈ [1/2, 1) increases,
23 This immediately implies G ′(1 − m) = G ′(m) and G ′′(1 − m) = −G ′′(m) for all m ∈ [0, 1].

12 M. Faravelli et al. / Games and Economic Behavior 93 (2015) 1–23
(1) Party A’s turnout, a∗, decreases;(2) Expected proportion of votes for party B (out of all citizens), (1 − α)b∗ , decreases;(3) Mandate for party A, m∗
A , increases; and(4) Total turnout, T ∗ , decreases.
While the first three comparative statics in this proposition deal with each party’s turnout and mandate, the last result is commonly known in the voting literature as the competition effect. Like the underdog effect, the term competition effect was coined by Levine and Palfrey (2007) and documented in large elections by Shachar and Nalebuff (1999), Blais (2000). The competition effect has been difficult to obtain in models of large elections (Krasa and Polborn, 2009). Indeed, Taylor and Yildirim (2010, p. 464) concede, “the widely held intuition that elections with a more evenly split electorate should generate a greater expected turnout appears to be a property of small elections”. It should be pointed out, though, that the standard costly voting model fails to predict the competition effect in large election because it predicts zero limiting turnout. Thus, by adopting the assumptions that mandate matters and voters are paternalistic, we are able to overcome this obstacle and provide a theoretical prediction for the competition effect in large elections.
The intuition behind this result is fairly straightforward. Under our decreasing returns assumption, members of the ma-joritarian party have less incentives to vote when they expect to win by a landslide than in a close election. The decrease in their turnout offsets the increase in the size of the majority party under the assumption on the elasticity of the distribution function. Meanwhile, the proportion of votes for the smaller party decreases. The total turnout is therefore reduced.
7. Conclusion
This paper argues and provides support for the notion that mandate (magnitude of victory) has consequences in elec-tions. We show that this new, realistic assumption makes a substantial difference on turnout in an otherwise standard two-candidate costly voting model. Together with the assumption of paternalism, we obtain strictly positive turnout ratios in large elections, with comparative statics that match stylized facts. Our numerical computation exercises indicate that the effect of introducing mandate concerns is quantitatively relevant.
In concluding, we remark on a few features of our approach. First, we are able to provide the rate of convergence of the voting benefit without relying on specific functional forms of the policy rule (or power-sharing rule as in Castanheira, 2003 and Herrera et al., 2014b). Second, although our theorems are stated for the limiting case, they are equally relevant for large, finite elections, as our numerical exercise has demonstrated. Third, we show that in a winner take all election a paternalism factor 200 trillion times larger is required to match the turnout rates predicted by our model. Finally, we devise an innovative computation strategy for calculating equilibrium turnout rates, which might prove helpful for future research.
Appendix A. Omitted proofs
A.1. Notations for the appendix
From the point of view of a voter, the number of votes for parties A and B , both exclusive of herself, are random variables. Given N , denote these variables as v N
A and v NB , respectively. Define also the random variable MN = v N
A + v NB . Let
M and v be a generic realization of MN and v NP (P may be A or B , depending on the context), respectively. Denote the
“marginal mandate benefit from voting” (over abstaining) for a party P supporter as
u P (M, v) = G(mP (v + 1, M − v)
)− G(mP (v, M − v)
),
where mP is defined in Equation (1).Given a turnout profile (a, b), let T (a, b) = αa + (1 − α)b be the unconditional turnout rate. Let p P (a, b) be the ex-ante
probability that a voter votes for P (i.e., p A(a, b) = αa and pB(a, b) = (1 − α)b). The dependence of T , and p on (a, b) will often be suppressed. We can write the expected marginal gross benefits of voting (over abstaining) for a member of party P as:
U NP (a,b, γP ) = (1 + γP N
) N∑M=0
M∑v=0
(N
M
)(M
v
)(1 − T )N−M pv
P pM−vQ u P (M, v),
where Q is the other party. This is an expectation under a multinomial distribution: each of the N other voters is either not voting (with probability 1 − T ), voting for A (with probability p A = αa) and voting for B (with probability pB = (1 − α)b). Thus we may also write
U NP (a,b, γP ) = Ea,b
[(1 + γP N)u P (MN , v N
P )]
.

M. Faravelli et al. / Games and Economic Behavior 93 (2015) 1–23 13
A.2. Existence of symmetric Bayesian–Nash equilibrium (Proposition 1)
As argued in Section 3, any best response of citizen i is monotone in the voting cost. In equilibrium, the turnout of party P is the probability that its supporter has a voting cost below U P (a, b). Hence a turnout profile (a, b) can be supported as a symmetric Bayesian Nash equilibrium if and only if
a = F(
U NA (a,b, γA)
)b = F
(U N
B (a,b, γB))
. (5)
Given N , γA and γB , define a function ϕ : [0, 1]2 → [0, 1]2 by
ϕ(a,b) =(
F(U N
A (a,b, γA)), F(U N
B (a,b, γB)))
.
Since U NA , U N
B are jointly continuous in (a, b), and F is a continuous function, ϕ is a continuous function mapping from a compact, convex Euclidean space into itself. By the Brouwer Fixed-Point Theorem, ϕ has a fixed-point. This fixed-point satisfies Equations (5) and is therefore a symmetric Bayesian Nash equilibrium turnout profile.
A.3. Convergent rate of voting benefits (Theorem 1)
We first give an application of Hoeffding’s Inequality (Hoeffding, 1963), which is then used to prove a lemma on the bounds of the voting benefit. Theorem 1 follows as a corollary of the lemma.
As in Section A.1, let MN denote the random variable of the number of voters turning out to vote (exclusive of the decision-making voter) when there are N + 1 citizens. Given a turnout profile (aN , bN), write T N = αaN + (1 − α)bN as the overall turnout rate.
Fact 1. For any ε > 0,
Pr[∣∣∣MN − T N N
∣∣∣≥ εN]
≤ 2e−2ε2 N .
Proof. Since MN is the sum of N independent Bernoulli random variables with mean T N , Hoeffding’s Inequality requires
Pr[∣∣∣MN − T N N
∣∣∣≥ εN]
≤ 2e− 2ε2 N2N
= 2e−2ε2 N . �Fixing an ε > 0, let I N
M(ε) = [(T N − ε)N, (T N + ε)N].
Lemma A.1. Fix an ε > 0. For each N, each γP and each turnout profile (a, b),
hNP (a,b, γP ) ≤ U N
P (a,b, γP ) ≤ hNP (a,b, γP ) + e−2ε2 N(1 + γP N),
where
hNP (a,b, γP ) = Pr
[MN ∈ I N
M(ε)]
Ea,b
[(1 + γP N)u P (MN , v N
P )
∣∣∣MN ∈ I NM(ε)
].
Proof. We can write
uNP (a,b, γP ) = Pr
[MN ∈ I N
M(ε)]
E[(1 + γP N)u P (MN , v N)
∣∣∣MN ∈ I NM(ε)
]+ Pr
[MN /∈ I N
M(ε)]
E[(1 + γP N)u P (MN , v N)
∣∣∣MN /∈ I NM(ε)
].
The second term is weakly positive (since u P is). Thus hNP (a, b, γP ) ≤ uN
P (a, b, γP ).
Fact 1 implies Pr[
MN /∈ I NM(ε)
]≤ 2e−2ε2 N . Meanwhile, u P is bounded above by 1/2. Thus the second term is weakly
smaller than
(1 + γP N)2e−2ε2 N 1
2,
which gives the stated upper bound of U N (a, b, γP ). �
P
14 M. Faravelli et al. / Games and Economic Behavior 93 (2015) 1–23
To prove Theorem 1, let {(aN , bN)}N be a convergent sequence of turnout profiles such that T = limN T N > 0. Due to Lemma A.1, it suffices to show that hN
P (aN , bN , 0) converges to 0 at the rate of 1/N .So take an ε ∈ (0, T ). For all sufficiently large N , each M ∈ I N
M(ε) is strictly positive. Hence,
u P (M, v) = G
(v + 1
M + 1
)− G
( v
M
)= G ′ ( v
M
)�(M, v) + o (�(M, v)) , (6)
where
�(M, v) = M − v
M(M + 1).
Each M ∈ I NM(ε) can be written as tN for some t ∈ [T N − ε, T N + ε], which is bounded away from zero and infinity for N
large. Thus in this range,
�(M, v) =(
1 − v
M
) 1
tN + 1
for some finite t > 0. Thus,
hNP (aN ,bN ,0) = Pr
[MN ∈ I N
M(ε)]
EaN ,bN
[G ′(
v NP
MN
)(1 − v N
P
MN
)1
tN + 1
∣∣∣MN ∈ I NM(ε)
]
where t = MN/N . By Fact 1, Pr[
MN ∈ I NM(ε)
]converges to 1. G ′(m) is bounded away from zero and infinity for all m ∈ [0, 1].
As 1/(tN + 1) converges to 0 at the rate of 1/N , so does hNP (aN , bN , 0).
A.4. Limiting equilibrium under mandate and paternalism (Theorem 2, Propositions 3 and 4)
We will first prove, using two lemmas, that the limiting overall turnout rate T = αa + (1 −α)b, must be strictly positive. This allows us to derive an expression for the limiting payoff in Lemma A.4. Theorem 2, Propositions 3 and 4 follow from this lemma.
Lemma A.2. If γP > 0 for at least one party P , then T N N → ∞ as N → ∞.
Proof. Suppose by contradiction that limN T N N = r for some finite r. Then the distribution of MN converges to a Poisson distribution with mean r. Hence,
limN
Pr[
MN = 0]
= e−r .
Since u P is positive,
U NP (aN ,bN , γP ) ≥ (1 + γP N)Pr
[MN = 0
]u P (0,0).
Taking limits on both sides,
limN
U NP (aN ,bN , γP ) ≥ lim
N(1 + γP N)
e−r
2.
As the right hand side goes to infinity, so must U NP (aN , bN , γP ). Yet this means members of party P turnout to vote with
strictly positive probability at the limit, contradicting limN T N N being finite. �Lemma A.3. If γA, γB > 0, then limN T N > 0.
Proof. By Lemma A.2, for all but a finite set of N , at least one of aN and bN is strictly positive. Name the parties so that limN(bN/aN) �= 0.24 Suppose by contradiction that bN → 0.
Consider a party A supporter. For each N ,
U NA (aN ,bN , γA) ≥ Pr
[MN ≥ T N N
]EaN ,bN
[(1 + γA N)u A(MN , v N
A )
∣∣∣MN ≥ T N N]
.
24 As a convention, if aN = 0 for all N sufficiently large, define limN (bN/aN ) = ∞ �= 0.
M. Faravelli et al. / Games and Economic Behavior 93 (2015) 1–23 15
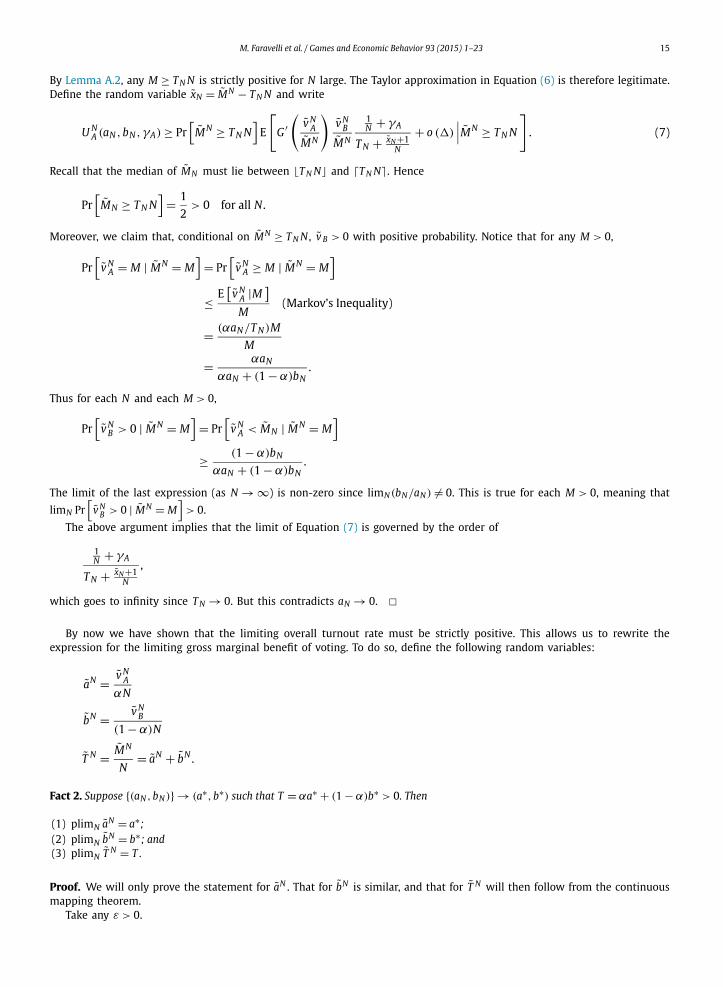
By Lemma A.2, any M ≥ T N N is strictly positive for N large. The Taylor approximation in Equation (6) is therefore legitimate. Define the random variable xN = MN − T N N and write
U NA (aN ,bN , γA) ≥ Pr
[MN ≥ T N N
]E
[G ′(
v NA
MN
)v N
B
MN
1N + γA
T N + xN+1N
+ o (�)
∣∣∣MN ≥ T N N
]. (7)
Recall that the median of MN must lie between T N N� and �T N N�. Hence
Pr[
MN ≥ T N N]
= 1
2> 0 for all N .
Moreover, we claim that, conditional on MN ≥ T N N , v B > 0 with positive probability. Notice that for any M > 0,
Pr[
v NA = M | MN = M
]= Pr
[v N
A ≥ M | MN = M]
≤ E[v N
A |M ]M
(Markov’s Inequality)
= (αaN/T N)M
M
= αaN
αaN + (1 − α)bN.
Thus for each N and each M > 0,
Pr[
v NB > 0 | MN = M
]= Pr
[v N
A < MN | MN = M]
≥ (1 − α)bN
αaN + (1 − α)bN.
The limit of the last expression (as N → ∞) is non-zero since limN (bN/aN ) �= 0. This is true for each M > 0, meaning that limN Pr
[v N
B > 0 | MN = M]
> 0.
The above argument implies that the limit of Equation (7) is governed by the order of
1N + γA
T N + xN +1N
,
which goes to infinity since T N → 0. But this contradicts aN → 0. �By now we have shown that the limiting overall turnout rate must be strictly positive. This allows us to rewrite the
expression for the limiting gross marginal benefit of voting. To do so, define the following random variables:
aN = v NA
αN
bN = v NB
(1 − α)N
T N = MN
N= aN + bN .
Fact 2. Suppose {(aN , bN)} → (a∗, b∗) such that T = αa∗ + (1 − α)b∗ > 0. Then
(1) plimN aN = a∗;(2) plimN bN = b∗; and(3) plimN T N = T .
Proof. We will only prove the statement for aN . That for bN is similar, and that for T N will then follow from the continuous mapping theorem.
Take any ε > 0.

16 M. Faravelli et al. / Games and Economic Behavior 93 (2015) 1–23
Pr[∣∣∣aN − a∗
∣∣∣≥ ε]
≤ Pr[∣∣∣aN − aN
∣∣∣+ ∣∣aN − a∗∣∣≥ ε]
= Pr[∣∣∣aN − aN
∣∣∣≥ ε − ∣∣aN − a∗∣∣]= Pr
[∣∣∣v NA − αaN N
∣∣∣≥ (ε − ∣∣aN − a∗∣∣)αN]
≤ 2e−2(ε−∣∣aN −a∗∣∣)2α2 N ,
where the last inequality follows from Hoeffding’s Inequality. Taking limit on both sides,
limN
Pr[∣∣∣aN − a∗
∣∣∣≥ ε]
≤ limN
2e−2(ε−∣∣aN −a∗∣∣)2α2 N = 0. �
We can now derive an expression for the limiting gross benefit of voting as follows:
Lemma A.4. Suppose {(aN , bN)} → (a∗, b∗). If T = αa∗ + (1 − αb∗) = limN T N > 0, then
limN
U A(aN ,bN , γA) = γA G ′(
αa∗
T
)(1 − α)b∗
T 2, and
limN
U B(aN ,bN , γB) = γB G ′(
(1 − α)b∗
T
)αa∗
T 2.
Proof. We will prove this for party A. That for party B is analogous.Recall the expression hN
A in Lemma A.1. Take an ε < T . Notice that MN ∈ I NM(ε) implies T N ∈ [T N − ε, T N + ε]. As
T N → T > 0, for ε < T , T N − ε > 0 for all N sufficiently large.
limN
U A(aN ,bN , γA) = limN
hNA (aN ,bN , γA) (Lemma A.1)
= limN
E[(1 + γA N)u P (MN , v N
A )
∣∣∣MN ∈ I NM(ε)
](Fact 1)
= limN
E
[(1 + γA N)
[G ′(
v NA
MN
)�(MN , v N
A ) + o (�)
]∣∣∣MN ∈ I NM(ε)
](Equation (6))
= limN
E
[G ′(
αaN
T N
)((1 − α)bN
T N
)1 + γA N
T N N + 1
∣∣∣T N ∈ [T N − ε, T N + ε]]
= limN
γAE
[G ′(
αaN
T N
)(1 − α)bN
(T N)2
∣∣∣T N ∈ [T − ε, T + ε]]
.
Define the function
πA(a,b) ={
G ′(
αaαa+(1−α)b
)(1−α)b
(αa+(1−α)b)2 if a + b > 0
1/2 otherwise.
By Fact 2, plim T N = T , which means
limN
E[πA(aN , bN)
∣∣∣T N ∈ [T − ε, T + ε]]
= limN
E[πA(aN , bN)
].
Also, plim T N = T implies πA is continuous except on a set of (a, b) that occurs with zero probability at the limit. By the continuous mapping theorem and Fact 2,
plimN πA(aN , bN) = πA(plim aN ,plim bN) = πA(a∗,b∗).
It follows, then
limN
U NP (aN ,bN , γA) = lim
NγAE
[πA(aN , bN)
∣∣∣T N ∈ [T − ε, T + ε]]
= γAπA(a∗,b∗)
= γA G ′(
αa∗) (1 − α)b∗2
. �
T T
M. Faravelli et al. / Games and Economic Behavior 93 (2015) 1–23 17
We can now prove Theorem 2, Proposition 3 and Proposition 4.
Proof of Theorem 2. We have already shown that if {(aN , bN)} is a sequence of equilibrium turnout profiles converging to (a∗, b∗), then a∗ + b∗ > 0. It remains to prove that if a∗ > 0, so must b∗ . Suppose by contradiction that a∗ > 0 but b∗ = 0. By Lemma A.4,
limN
U NA (aN ,bN , γA) = γA G ′ (1)
0
(αa∗)2= 0.
But this contradicts aN → a∗ > 0. �Proof of Proposition 3. First suppose C , the support of voting cost, is unbounded from above. For each finite N , U N
P (aN , bN , γP ) is finite for each party P and each (aN , bN) ∈ [0, 1]2. Thus aN = F (U NA (aN , bN , γA)) and bN = F (U N
B (aN , bN ,
γB)) are both strictly less than 1.Now suppose C is bounded above by c. When γA, γB > 0, by Lemma A.3 the T > 0. Thus the expression
G ′(
αa∗
T
)(1 − α)b∗
T 2
is finite. Lemma A.4 implies limN U NA (aN , bN , γA) < c for γA sufficiently small. In other words, there exists an open interval
below c such that an A-supporter with voting cost within this interval will abstain for N sufficiently large. Hence aN < 1for all N sufficiently large. The case for party B is similar and is therefore omitted. �Proof of Proposition 4. By Theorem 2, if {(aN , bN)}N ⊂ [0, 1)2 is convergent, then for all but finitely many N , (aN , bN) ∈(0, 1)2. For any (aN , bN) ∈ (0, 1)2, the equilibrium condition requires
U NA (aN ,bN , γA) = F −1(aN)
U NB (aN ,bN , γB) = F −1(bN).
Taking limits and using Lemma A.4, we obtain the limiting expressions in Proposition 4. �A.5. Winner take all election (Proposition 2)
In a winner take all election, voting yields a gross marginal benefit of 1/2 if the vote cast is pivotal and 0 otherwise. Write
Pr[
pivNA
]= Pr
[v N
A = v NB or v N
A + 1 = v NB
]Pr[
pivNB
]= Pr
[v N
A = v NB or v N
B + 1 = v NA
]as the probability that a vote for party A and B is pivotal when there are N citizens, respectively. Given a turnout profile (a, b), the expected gross marginal benefits of voting of the two parties are
U NA (a,b, γA) = 1
2E[(1 + γA N)Pr
[pivN
A
]](8)
U NB (a,b, γB) = 1
2E[(1 + γB N)Pr
[pivN
B
]]. (9)
Suppose by contradiction that there is a sequence of equilibria {(aN , bN)}N → (a∗, b∗) where a∗ + b∗ > 0. Given N , the ex-ante probability that any citizen would vote is T N = αaN + (1 − α)bN . Conditional on voting, a citizen votes for A with probability mN
A = αaN/T N . Using Poisson approximations (see Myerson, 2000, Eq. (5.5)),25
Pr[
pivNA
]≈ e
−2T N N
(√mN
A −√
1−mNA
)2
4
√π T N N
√mN
A (1 − mNA )
⎛⎜⎝√
mNA +
√1 − mN
A√mN
A
⎞⎟⎠
Pr[
pivNB
]≈ e
−2T N N
(√mN
A −√
1−mNA
)2
4
√π T N N
√mN
A (1 − mNA )
⎛⎜⎝√
mNA +
√1 − mN
A√1 − mN
A
⎞⎟⎠ .
25 Two functions of N are approximately equal if their ratio converges to 1 as N goes to infinity. This equivalent relation is denoted by the symbol ≈.

18 M. Faravelli et al. / Games and Economic Behavior 93 (2015) 1–23
(Note that Myerson’s approximation is valid as long as aN + bN > 0.) Plugging back to Equations (8) and (9):
U NA ≈ 1
2E
⎡⎢⎢⎣(1 + γA N)
e−2T N N
(√mN
A −√
1−mNA
)2
4
√π T N N
√mN
A (1 − mNA )
⎛⎜⎝√
mNA +
√1 − mN
A√mN
A
⎞⎟⎠⎤⎥⎥⎦
U NB ≈ 1
2E
⎡⎢⎢⎣(1 + γB N)
e−2T N N
(√mN
A −√
1−mNA
)2
4
√π T N N
√mN
A (1 − mNA )
⎛⎜⎝√
mNA +
√1 − mN
A√1 − mN
A
⎞⎟⎠⎤⎥⎥⎦ .
Fact 3. If α �= 1/2, then limN N(
√mN
A −√
1 − mNA )2 > 0.
Proof. Suppose limN N(
√mN
A −√
1 − mNA )2 = 0. Then
limN
U NA = lim
NE
[1 + γA N
4√
π T N N(1/2)
]= ∞
limN
U NB = lim
NE
[1 + γB N
4√
π T N N(1/2)
]= ∞.
Thus (a∗, b∗) = (1, 1). But this means
1
2= m∗
A = limN
αaN
αaN + (1 − α)bN= α
α + (1 − α)= α. �
If α �= 1/2, U NP is of the same order as
e−2T N N(
√mN
P −√
1−mNP )2√
N → 0
as N → ∞. This contradicts a∗ + b∗ > 0.
A.6. Underdog effect (Proposition 5)
Suppose by contradiction that α ≥ 1/2 and a∗ > b∗ . Dividing Equation (3) by (4) and using the symmetry of G we get
(1 − α)b∗
αa∗ = F −1(a∗)F −1(b∗)
. (10)
Since α ≥ 1/2 and a∗ > b∗ , the left hand side is strictly less than 1. Meanwhile, the right hand side is strictly greater than 1 since F −1 is a strictly increasing function. Contradiction. Moreover, if α > 1/2 and a∗ = b∗ , then the left hand side is still strictly less than 1 while the right hand side is exactly 1, which is also a contradiction.
Now if a∗ ≤ b∗ , Equation (10) implies
(1 − α)b∗ ≤ αa∗
1 − m∗A ≤ m∗
A ,
with strictly inequalities if a∗ < b∗ . Therefore m∗A ≥ 1/2, with a strict inequality when α > 1/2.
A.7. Competition effect (Proposition 6)
This proof is mainly about elasticities. Thus for any variable x to be determined, write
εx = dx
dα
α
x
as the elasticity of x with respect to α (evaluated at the original value of α). For example, εa would be the elasticity of a∗with respect to α. Since we will only consider party A’s mandate, m∗
A , we will write εm as the elasticity of m∗A with respect
to α.

M. Faravelli et al. / Games and Economic Behavior 93 (2015) 1–23 19
For each party P , let c∗P = F −1(p∗) be the limiting cut-off voting cost below which a P -supporter would vote. Write also:
σ ∗G = −G ′′(m∗
A)m∗A
G ′(m∗A)
,
σ AF = F (c∗
A)
f (c∗A)c∗
A
and σ BF = F (c∗
B)
f (c∗B)c∗
B
.
By Proposition 5, b∗ ≥ a∗ . Hence c∗B ≥ c∗
A . Given the assumption that f (c)c/F (c) is decreasing in c, σ BF ≥ σ A
F .Differentiate Equations (3) and (4) with respect to α. Completing elasticities we obtain:
−εT −(
m∗A
1 − m∗A
+ σ ∗G
)εm = σ A
F εa (11)
−εT + (1 − σ ∗G
)εm = σ B
F εb . (12)
Using the expressions for T ∗ and m∗A ,
εT = m∗A(1 + εa) + (1 − m∗
A)
(− α
1 − α+ εb
)εm = 1 + εa − εT
= (1 − m∗A)
[(1 + εa) −
(− α
1 − α+ εb
)].
Adopt the following shorthands:
x = dαa∗
dα
α
αa∗ = 1 + εa; y = d(1 − α)b∗
dα
α
(1 − α)b∗ = − α
1 − α+ εb;
z = 2m∗A − 1 + σ ∗
G (1 − m∗A).
Notice that since 1/2 ≤ m∗A < 1 and σ ∗
G ≥ 0, z ≥ 0.Using the expressions above, we can rewrite Equations (11) and (12) as the following system of linear equations:(−z − (1 + σ A
F ) z−z z − (1 + σ B
F )
)(xy
)=( −σ A
Fα
1−α σ BF
).
The determinant of this system is
D =[−z − (1 + σ A
F )][
z − (1 + σ BF )]+ z2
= z(σ BF − σ A
F ) + (1 + σ AF )(1 + σ B
F )
> 0.
Using Cramer’s rule:
x = 1
D
[−σ A
F (z − (1 + σ BF )) − α
1 − ασ B
F z
]
= 1
D
[−z
(σ A
F + α
1 − ασ B
F
)+ σ A
F (1 + σ BF )
]
≤ (1 + σ AF )(1 + σ B
F )
z(σ BF − σ A
F ) + (1 + σ AF )(1 + σ B
F )
≤ 1.
Therefore x = 1 + εa ≤ 1, meaning that εa ≤ 0. In other words, a∗ falls when α increases. However, it is not possible to determine the sign of x without further assumption.
Similarly,
y = 1
D
[−(z + (1 + σ A
F ))α
1 − ασ B
F − zσ AF
]
= 1
D
[−z
(σ A
F + α
1 − ασ B
F
)− α
1 − α(1 + σ A
F )σ BF
]< 0.

20 M. Faravelli et al. / Games and Economic Behavior 93 (2015) 1–23
Hence (1 −α)b∗ falls as α increases. However, it is not possible to tell whether y is greater than or smaller than −α/(1 −α). The sign of εb is unknown.
Recall that (the relation sgn= means the two expressions are of the same sign):
εmsgn= x − y
sgn= −z
(σ A
F + α
1 − ασ B
F
)+ σ A
F (1 + σ BF )
+ z
(σ A
F + α
1 − ασ B
F
)+ α
1 − α(1 + σ A
F )σ BF
> 0.
Therefore m∗A increases as α increases.
Finally we would like to consider the turnout.
εTsgn= m∗
A
[−z
(σ A
F + α
1 − ασ B
F
)+ σ A
F (1 + σ BF )
]
+ (1 − m∗A)
[−z
(σ A
F + α
1 − ασ B
F
)− α
1 − α(1 + σ A
F )σ BF
]
= −z
(σ A
F + α
1 − ασ B
F
)
+ m∗Aσ A
F (1 + σ BF ) − (1 − m∗
A)α
1 − α(1 + σ A
F )σ BF . (13)
The first term of expression (13) is weakly negative. Meanwhile,
m∗A = αa∗
T ∗ ≤ αb∗
T ∗ = α
1 − α(1 − m∗
A),
and
σ AF (1 + σ B
F ) = σ AF + σ A
F σ BF ≤ σ B
F + σ AF σ B
F = σ BF (1 + σ A
F ).
Thus the last two terms in expression (13) together are also negative. Total turnout falls as α increases.
Appendix B. Numerical computation strategy
As in Appendix A, let u P (M, v) be a party P supporter’s marginal mandate benefit from voting (over abstaining) when there are M other voters who votes and among them v votes for P . Write U P (a, b) as the expected marginal gross benefits of voting for a member of party P , that is
U P (a,b) = (1 + γ N)Ea,b
[u P (M, v)
].
Under the uniform distribution assumption adopted in the numerical exercise, a pair of equilibrium turnout rates (a, b)
satisfies
U A(a,b) = max
{min
{a
2,
1
2
},0
}(14)
U B(a,b) = max
{min
{b
2,
1
2
},0
}. (15)
For the limiting case, we solve for the solution to the system in Equations (3) and (4), using the uniform distribution.
B.1. Solution regarding large factorials
Since M and v are distributed according to a binomial distribution, to evaluate the expected marginal gross benefit functions, one would need to evaluate many binomial coefficients. This is computationally heavy when N is at the range we would like to consider.
To get around this problem, we realize that the probability of a binomial random variable vanishes exponentially away from the mean. Now suppose we set the precision of the numerical exercise to ε (i.e., the expected benefits and the inverse of the c.d.f. will be considered “the same” if they are less than ε apart). Since u A and uB are bounded above by (1 +γ N)/2, ignoring a subset of the support with probability smaller than ε/(1 + γ N) will at most result in an approximation error of ε/2 on the benefit function side.

M. Faravelli et al. / Games and Economic Behavior 93 (2015) 1–23 21
By Hoeffding’s Inequality,
Pr[∣∣∣M − NT
∣∣∣≥ δ]
≤ 2e−2δ2
N .
Solving for δ such that the right hand side of the above inequality is equal to ε/(1 + γ N) we get:
2e−2δ2
N = ε
1 + γ N
δ =√
N ln
√2(1 + γ N)
ε.
Therefore, instead of summing the relevant terms for all M from 0 to N , we sum only those M falling in the range [NT − δ,
NT + δ]. Since δ increases only at the rate of √
N , this reduces the computation burden.
B.2. Search
The stability of the system to be solved (Equations (14) and (15)) varies as different G functions are being used. We adopt a method of search that applies to all G functions considered to ensure that our search will stop at the solution.
Due to the underdog effect, any solution (a, b) satisfies a ≤ b and αa ≥ (1 −α)b. Thus the solution must lie in the triangle bounded by a = b, αa = (1 − α)b and b = 1 in the [0, 1]2 box. Next, it can be verified that the limiting approximations26 of U A and U B under each of the G specifications satisfy the following conditions in the triangular area considered:
(0) U A and U B are continuous in (a, b).(1) 2U A − a and U B are strictly decreasing in a.(2) Along the a = b ray,
(a) 2U A − a is strictly decreasing in a;(b) 2U B − b is strictly decreasing in b; and(c) U A < U B at each point on the ray.
(3) Along the αa = (1 − α)b ray,(a) 2U A − a is strictly decreasing in a;(b) 2U B − b is strictly decreasing in b; and(c) U A = U B at each point on the ray.
Given these conditions, we search the triangular area in the following manner:
Step 1. Check whether 2U A(1, 1) ≥ 1 and 2U B(1, 1) ≥ 1. If yes, then (a, b) = (1, 1) is an equilibrium. Halt and output (1, 1).
Step 2. If 2U B(1, 1) ≥ 1 and 2U A(1, 1) < 1, by (1), 2U B(a, 1) ≥ 1 for all a ∈ [ 1−αα , 1]. Also, since ( 1−α
α , 1) is on the αa =(1 − α)b ray, by (3c) 2U A( 1−α
α , 1) = 2U B( 1−αα , 1) ≥ 1 > 1−α
α . Thus we can use the method of bisection on the b = 1 line to search for an a ∈
[1−αα ,1
]such that 2U A(a, 1) = a. Then (a, b) = (a, 1) is an equilibrium. Halt and output (a, 1).
Step 3. If 2U B(1, 1) < 1, by (2c) 2U A(1, 1) < 1. There are two cases possible:
Case I: 2U B( 1−αα , 1) > 1.
By (3c), 2U A( 1−αα , 1) = 2U B( 1−α
α , 1) ≥ 1 > 1−αα . Use the method of bisection on the b = 1 line to search for
an a ∈[
1−αα ,1
]such that 2U A(a, 1) = a. If 2U B(a, 1) ≥ 1, then (a, b) = (a, 1) is an equilibrium and we can stop.
Otherwise, there exists an a ∈[
1−αα ,a
]such that 2U B(a, 1) = 1.
Meanwhile, since 2U B(0, 0) > 0, there exists a b ∈ [0, 1] such that 2U B(b, b) = b. By (2c), 2U A(b, b) < b. Yet as 2U A( 1−α
α , 1) > 1−αα , by (3a) 2U A( 1−α
α b, b) > 1−αα b. Thus there exists an a ∈
[1−αα b,b
]such that 2U A(a, b).
Conditions (2a), (2b), (3a) and (3b) imply that each of the 2U A(a, b) = a and 2U B (a, b) = b loci can cut each of the two boundary rays only once. The above argument therefore means that there exists an (a, b) within the convex hull of
(1−αα ,1
), (1, 1), (b, b) and
(1−αα b,b
)such that 2U A(a, b) = a and 2U B(a, b) = b. See Fig. 4a for an
illustration.
26 At the large N we have considered, the actual functions are close to the limiting approximations. Since we make only qualitative restrictions below, we check only the limiting functions, rather than the actual ones.

22 M. Faravelli et al. / Games and Economic Behavior 93 (2015) 1–23
Fig. 4. Step 3: two possible cases.
Fig. 5. Four areas for the search in Step 3.
Case II: 2U B( 1−αα , 1) < 1.
Since 2U B(0, 0) > 0, there exists a b ∈ [0, 1] such that 2U B ( 1−αα b,b) = b. By (3c), 2U A( 1−α
α b,b) > 1−αα b. Also,
since U B is decreasing in a, 2U B(b,b) < b. By (2c), then, 2U A(b,b) < b. Continuity of U A implies the existence of an a ∈
[1−αα b,b
]such that 2U A(a,b) = a.
Meanwhile, by (2b), there exists a b ∈ [0,b] such that 2U B(b, b) = b. By (2c), 2U A(b, b) < b. Yet as 2U A( 1−α
α b,b) > 1−αα b, (3a) implies 2U A( 1−α
α b, b) > 1−αα b. Hence there is an a ∈
[1−αα b,b
]such that 2U A(a, b) = a.
Conditions (2a), (2b), (3a) and (3b) imply that each of the 2U A(a, b) = a and 2U B (a, b) = b loci can cut each of the two boundary rays only once. The above argument therefore means that there exists an (a, b) within the convex hull of
(1−αα b,b
), (b,b), (b, b) and
(1−αα b,b
)such that 2U A(a, b) = a and 2U B (a, b) = b. See Fig. 4b for
an illustration.
In either case, the locus of 2U A(a, b) = a cuts that of 2U B (a, b) = b from above at least once. Around this intersection, the two loci separate four areas (see Fig. 5):
Area 1: 2U A(a, b) > a and 2U B(a, b) > b.Area 2: 2U A(a, b) > a and 2U B(a, b) < b.Area 3: 2U A(a, b) < a and 2U B(a, b) < b.Area 4: 2U A(a, b) < a and 2U B(a, b) > b.
(The signs of the inequalities are determined by Condition (1) above.) We can then find the equilibrium, which is the intersection of the loci, using the following search algorithm:
State Variables: bh , bl (the high and low bounds of b)Initialization: bh = 1 (Case I) or b (Case II), bl = bIteration: Given bh and bl , set b = (bh + bl)/2. Let ah and al be the high and low bounds of a given b. Set ah = b, al = 1−α
α band a = (ah + al)/2. Evaluate 2U A(a, b) and 2U B(a, b) to check the area to which (a, b) belongs. Transit according to the following rules:• If (a, b) is in Area 1, set al = a. Take the new a = (ah + al)/2 and keep b. Re-evaluate the area of the new point
and transit.• If (a, b) is in Area 2, set bh = b and repeat the iteration.• If (a, b) is in Area 3, set ah = a. Take the new a = (ah + al)/2 and keep b. Re-evaluate the area of the new point
and transit.• If (a, b) is in Area 4, set bl = b and repeat the iteration.

M. Faravelli et al. / Games and Economic Behavior 93 (2015) 1–23 23
Halting: Stop either the distance of the current ah and al is smaller than the required precision, or when the distance of the current bh and bl is smaller than the required precision. In the former case, output the equilibrium a to be the mid-point between the final ah and al , and the equilibrium b to be the b at which these bounds of a are evaluated. In the latter case, output the equilibrium b to be the mid-point between the final bh and bl , and the a to be the mid-point between the last two a’s when bh and bl are reset.
References
Blais, A., 2000. To Vote or Not to Vote: The Merits and Limits of Rational Choice Theory. University of Pittsburgh Press, Pittsburgh.Börgers, T., 2004. Costly voting. Amer. Econ. Rev. 94 (1), 57–66.Campbell, C., 1999. Large electorates and decisive minorities. J. Polit. Economy 107 (6), 1199–1217.Castanheira, M., 2003. Victory margins and the paradox of voting. Europ. J. Polit. Economy 19 (4), 817–841.Che, Y.K., Dessein, W., Kartik, N., 2013. Pandering to persuade. Amer. Econ. Rev. 103 (1), 47–79.Coate, S., Conlin, M., 2004. A group rule-utilitarian approach to voter turnout: theory and evidence. Amer. Econ. Rev. 94 (5), 1476–1504.Coate, S., Conlin, M., Moro, A., 2008. The performance of pivotal-voter models in small-scale elections: evidence from Texas liquor referenda. J. Public
Econ. 92, 582–596.Downs, A., 1957. An Economic Theory of Democracy. Harper and Row, New York.Evren, Ö., 2012. Altruism and voting: a large-turnout result that does not rely on civic duty or cooperative behavior. J. Econ. Theory 147 (6), 2124–2157.Faravelli, M., Sanchez-Pages, S., 2014. (Don’t) make my vote count. J. Theor. Polit. http://dx.doi.org/10.1177/0951629814556174.Feddersen, T.J., Sandroni, A., 2006. A theory of participation in elections. Amer. Econ. Rev. 96 (4), 1271–1282.Fowler, J.H., 2005. Turnout in a small world. In: Zuckerman, A. (Ed.), Social Logic of Politics. Temple University Press, Philadelphia, pp. 269–287.Goeree, J., Grosser, J., 2007. Welfare reducing polls. Econ. Theory 31 (1), 51–68.Harsanyi, J.C., 1977. Morality and the theory of rational behavior. Soc. Res. 44 (4), 623–656.Harsanyi, J.C., 1992. Game and decision theoretic models in ethics. In: Aumann, R., Hart, S. (Eds.), Handbook of Game Theory with Economic Applications,
vol. I. Elsevier, Amsterdam, pp. 669–707.Herrera, H., Morelli, M., Nunnari, S., 2014a. Turnout across democracies. NBER working paper No. 20451.Herrera, H., Morelli, M., Palfrey, T.R., 2014b. Turnout and power sharing. Econ. J. 124, F131–F162.Hoeffding, W., 1963. Probability inequalities for sums of bounded random variables. J. Amer. Statistical Assoc. 58 (301), 13–30.Kartal, M., 2014. A comparative welfare analysis of electoral systems with endogenous turnout. Econ. J. http://dx.doi.org/10.1111/ecoj.12150.Krasa, S., Polborn, M.K., 2009. Is mandatory voting better than voluntary voting? Games Econ. Behav. 66 (1), 275–291.Krishna, V., Morgan, J., 2012. Voluntary voting: costs and benefits. J. Econ. Theory 147 (6), 2083–2123.Ledyard, J., 1981. The paradox of voting and candidate competition: a general equilibrium analysis. In: Horwich, G., Quirk, J.P. (Eds.), Essays in Contemporary
Fields of Economics. Purdue University Press, West Lafayette.Ledyard, J., 1984. The pure theory of two candidate elections. Public Choice 44 (1), 7–41.Levine, D.K., Palfrey, T.R., 2007. The paradox of voter participation? A laboratory study. Amer. Polit. Sci. Rev. 101 (1), 143–158.McMurray, J.C., 2013. Aggregating information by voting: the Wisdom of the experts versus the Wisdom of the masses. Rev. Econ. Stud. 80, 277–312.Morton, R.B., 1991. Groups in rational turnout models. Amer. J. Polit. Sci. 35 (3), 758–776.Myatt, D.P., 2012. A rational choice theory of voter turnout. Working paper. London Business School.Myerson, R.B., 2000. Large Poisson games. J. Econ. Theory 94 (1), 7–45.Palfrey, T.R., Rosenthal, H., 1983. A strategic calculus of voting. Public Choice 41 (1), 7–53.Palfrey, T.R., Rosenthal, H., 1985. Voter participation and strategic uncertainty. Amer. Polit. Sci. Rev. 79 (1), 62–78.Peterson, D.A.M., Grossback, L.J., Stimson, J.A., Gangl, A., 2003. Congressional response to mandate elections. Amer. J. Polit. Sci. 47 (3), 411–426.Poole, K.T., Rosenthal, H., 2001. D-NOMINATE after 10 years: a comparative update to congress: a political economic history of roll-call voting. Legis. Stud.
Q. 26 (1), 5–29.Razin, R., 2003. Signaling and election motivations in a voting model with common values and responsive candidates. Econometrica 71 (4), 1083–1119.Riker, W.H., Ordeshook, P.C., 1968. A theory of the calculus of voting. Amer. Polit. Sci. Rev. 62 (1), 25–42.Shachar, R., Nalebuff, B., 1999. Follow the leader: theory and evidence on political participation. Amer. Econ. Rev. 89 (3), 525–547.Smirnov, O., Fowler, J.H., 2007. Mandates, Parties, and Voters: How Elections Shape the Future. Temple University Press, Philadelphia.Somer-Topcu, Z., 2009. Timely decisions: the effects of past national elections on party policy change. J. Polit. 71 (1), 238–248.Taylor, C., Yildirim, H., 2010. A unified analysis of rational voting with private values and group-specific costs. Games Econ. Behav. 70 (2), 457–471.