games in the eurasian gas supply network - munich personal
TRANSCRIPT

MPRAMunich Personal RePEc Archive
Games in the Eurasian gas supplynetwork: Multinational bargaining,Strategic investment, and Hold-up
Svetlana Ikonnikova
University of Texas at Austin
2007
Online at http://mpra.ub.uni-muenchen.de/17852/MPRA Paper No. 17852, posted 13. October 2009 16:33 UTC

Games in the Eurasian gas supply network:
Multinational bargaining, Strategic investment, and Hold-up
Svetlana Ikonnikova
Humboldt University of Berlin
Abstract
The paper analyzes multilateral relations and distortions of investments in the Eurasian gas
network, supplying gas from countries of the Former Soviet Union to Western Europe. We use a
two stage model of endogenous coalition formation to study cooperation among gas producers and
transiters, some lacking the ability to make long-term commitments. In the first stage, the players
cooperate to invest in pipelines and contract the sharing of rents. In the second stage, players
form supply chains and bargain over supply profit sharing. Since competing supply chains can
be formed, cooperation involves externalities. Our quantitative analysis predicts overinvestment
as well as underinvestment in the network as an attempt to create countervailing power. Among
other things we explain why Russia invests in the expensive pipeline through the Baltic sea and
why Caspian gas producers are eager to build expensive bypasses around Russia.
Keywords: strategic investment, hold-up, coalitional bargaining, gas supply
JEL class.: L14, L91, L95, C71, C72, Q41

1 Introduction
Natural gas is the environment-friendly source of energy. Its share in the EU primary energy
consumption is over 20% at present and it is likely to increase in the future. While the consumption
of gas in Europe is growing, its domestic production is declining, so a substantial part of gas is to
be imported. Over a quarter of the total consumption is satisfied with gas from the Former Soviet
Union (FSU). Since alternative producers, like Algeria, Norway, and exporters of liquified natural
gas, are not able to increase their supplies considerably, the dependence of the EU on FSU gas will
grow in the future. This fact raises concerns on reliability and security of supplies from FSU.
In the past, a network of pipelines was built to deliver gas from the Soviet Union, namely from
Russia and Caspian Republics, including Turkmenistan, Kazakhstan, Azerbaijan, and Uzbekistan,
to the European market. The pipelines of the Eurasian gas network pass across Russia, Ukraine,
Belarus, and Eastern European countries connecting fields in permafrost regions of Siberia and
the steppes of central Asia with the Western European transport system. After the collapse of the
Soviet Union, most of the Republics became independent countries, each pursuing its own interests.
Russia inherited the majority of gas fields and all export routes, including those linking Caspian
producers with the European market. To insure its revenues, Russia blocked the access to its export
pipeline system and squeezed out potential competitors, establishing itself as the only gas exporter
in the region.
However, for the delivery of its gas to the markets in Western Europe, Russia itself depends on
newly independent Ukraine and Belarus. For a decade, these two transiters have exploited their
control over the essential transport capacities as a bargaining chip in negotiations with Russia.
Production and transportation of natural gas are characterized by large upfront investment costs,
most of which are sunk after capacities are installed. Building a pipeline requires international
cooperation among the countries, on which territories the pipeline will pass. The parties of the
supply chain have to form a stable coalition in order to coordinate investment and agree on long
term rent sharing. Within the EU there acts an established legal system, built on a number
of Treaties, to enforce property and contract rights. In particular, the EU members signed the
Energy Charter Treaty - an international agreement, which regulates and adds credibility to energy
trade, transit and investments within Europe. However, at present, there is no international court
system established to enforce gas transit contracts within FSU and hence, there is a risk of ex post
opportunism. Once investments are made, transit countries enjoy a much increased bargaining
power. If they cannot credibly commit to stick to a long-term agreement on profit sharing, other
countries will anticipate a strategic abuse and distort their investment.
Thus, to gain leverage over the transiters and strengthen its bargaining position, Russia decided
to diversify its export routes and establish a new path to Europe. It would be enough to upgrade
and renovate of the Ukrainian transport system and build another pipeline in Belarus to satisfy
2

the growing demand. Yet, in 2005 Russia initiated the construction of a large offshore pipeline -
the North European Gas Pipeline, also known as Nord Stream. The pipeline will stretch through
the Baltic sea and connect Russia directly to Europe, bypassing all the transit countries. The new
project is by far the most expensive of all options. It is at least four times more expensive than the
upgrade of the Ukrainian system and twice as expensive as the second pipeline through Belarus.
The observed investment pattern considerably deviates from the ”non-strategic” investments,
which would maximize the profit of the entire network and minimize transportation cost. In this
paper we study how investments may alter the power structure in the Eurasian supply chain in
order to provide a rationale for the observed developments in the network.
As the gas demand in Europe is growing, other FSU producers intend to enter the European
market. The Caspian Republics can export as much gas as Russia does and do so at lower costs.
Currently, the Caspian producers can reach the European market only via Russia. Unable to
market their gas directly, the Caspian producers have been forced to sell their gas to Russia at
low prices. However, with the support of the United States and the EU, these producers have
developed plans to bypass Russia. The USA have offered its help to build a Trans-Caspian pipeline
passing through Azerbaijan, Georgia, and Turkey. The EU has suggested an alternative route
across Iran and Turkey - the Nabucco pipeline. Both projects are expensive, with transportation
costs significantly exceeding the costs of transit through Russia. Progress has also been slow due
to the the difficult political situation in the region. Nevertheless, the installation of pipelines have
been started. A Georgian section of the pipeline, connecting Turkish border with Azerbaijan, is
close to completion. Turkmenistan and Iran have a tentative agreement to raise financial capital to
proceed with the Nabucco pipeline. The potential transiters for the Caspian gas can not afford a
large scale investment as well as can not pay for the increase in bargaining power up front. However,
after the pipelines are installed, the transiters will gain a strategic advantage and thus, the hold-up
problem arises. In this work, we analyze how the ability to commit affects investment and try to
answer the question whether the Caspian pipelines will finally be built.
The formation of a competing supply chain by the Caspian players will reduce Russian profits.
Hence, the cooperation among players of the network involves a kind of externalities. Anticipating a
potential loss, Russia has already made substantial concessions to the Caspian producers to prevent
the construction of the alternative pipelines. It has contracted a large increase in gas imports and
agreed to a much higher price for Turkmen gas. In this paper, we study the interrelated issues of
bargaining in vertical supply chains with externalities and strategic investments to understand the
change in relations between Russia and the Caspian Republics.
To analyze multinational relationship and distortion of investments in the Eurasian gas supply
network we use a two stage model, with a setting similar to the one developed by Kreps and
Scheinkman (1989) to represent the problem. At the first stage, players form coalitions and invest
in transport capacities, contracting how the future investment profits are shared. At the second
3

stage, investment costs are sunk, players form supply chains and bargain on supply profits sharing.
We assume that supply coalitions formed at the second stage compete in prices, given the capacities
installed at the first period. Reliable players commit not to renegotiate the cooperation of the first
stage. Since unreliable players may renegotiate at the second stage to get a higher payoff, they do
not take part in cooperation of the first stage.
We derive the bargaining power and a coalition structure in the network endogenously. Therefore,
on each stage we have to solve coalition formation and bargaining game. To do so, we describe the
game in ”partition function form” (PFF), introduced by Thrall and Lucas (1963).1 The partition
function allows to introduce interdependencies among players and captures the presence of exter-
nalities. It assigns to every possible coalition a value with respect to the entire coalition structure.
A number of solution concepts have been proposed for games in partition function form (PFF).
Some authors have developed extensive form approaches to a PFF game, e.g. Bloch (1996), Ray,
Vohra (1999), and Gomes (2005). These models differ in protocols, which determine the order of
players’ moves and hence, how a game develops. To avoid protocol dependency of the outcome
various axiomatic solutions have been proposed, e.g Do, Norde (2002), Ju (2004), and Clippel,
Serrano (2005). These models characterize a modification of the Shapley value and are based
on the assumption that a grand coalition always forms. This assumption considerably limits the
implications of these solutions. For our analysis, we choose another solution concept which has
been proposed by Maskin (2003). The approach of Maskin (2003) is based on the ”random order
bargaining” concept, which essentially describes a game in extensive form. However, to specify
the development of the game Maskin (2003) uses a set of axioms, which characterize the desirable
properties of the solution. A major advantage of Maskin’s (2003) solution is that it determines
both the expected coalition structure and the expected payoffs of players endogenously.
In the quantitative part of the paper we numerically solve for equilibrium coalition structures,
investments and expected payoffs of the players. The number of player in the network is small.
Information on production, transport and investment costs for the existing and prospecting pipeline
projects enable us to estimate the supply function. We derive the linear residual demand for the
former Soviet Union region gas based on marginal costs of other European exporters. We assume
that the bargaining among the network players is efficient and so is the use of the existing network,
though investments in the capacities may be inefficient for strategic reasons. In the result, the
European supply chain provides us with a rather unique opportunity to confront the theoretical
solution of game theory with real world experience.
We consider three scenarios, which vary in the assumptions on the players’ ability to commit.
As a benchmark case we take the situation in which all the players can credibly commit. The
1In the presence of externalities, we cannot describe the bargaining game in characteristic function form, since a
value of a coalition depends on the allocation of the players outside. Therefore, we can not apply solution concepts,
such as Shapley value (1953), Owen value (1977), core, and etc.
4

resulting first best investment plan would maximize the profit of the whole network. The second
scenario describes the situation where only producers, Russia and Turkmenistan, can commit, while
transiters are prone to recontract. In the third scenario none of the players can commit.
We find that the hold-up problem leads to overinvestment, as well as underinvestment, and ”un-
dercooperation”. Underinvestment occurs when investment in a cost efficient pipeline weakens the
bargaining position of a producer too much. Overinvestment occurs when investment in expen-
sive pipelines, while reducing overall profits, yields a large enough gain in bargaining power. In
other words, players increase capacities to strengthen their bargaining position vis-a-vis unreliable
partners. By undercooperation we mean a more splintered coalition structure compared to the one
which would prevail if all the players can commit.
It turns out that the ability to commit to long-term profit sharing is of an overriding importance
and diminishes the role of investment cost. In the second scenario, when the transiters cannot
commit, the producers cooperate at the investment stage and invest in expensive direct pipelines.
The resulting overcapacity is justified by a bargaining advantage of the producers at the second
stage. Yet if we assume that the producers were also not able to commit, competing supply
coalitions form. The Caspian producers would build the pipelines bypassing Russia, in spite of the
assumed unreliability of the Caspian transiters. Russia would still build the direct Baltic pipeline.
The lack of commitment would substantially reduce the profit of the network.
This paper continues the analysis provided by Hubert, Ikonnikova (2004) and Ikonnikova (2006).
Similar to Hubert, Ikonnikova (2004), we consider how the hold-up problem affects investments in
the Eurasian network. In this paper, however, we add the Caspian Republics into consideration and
enrich the model with externalities. We extend the framework of Ikonnikova (2006), who derives
the strategic value of investment options in the Eurasian network in the presence of externalities,
but assumes that all the players can commit. In our analysis we assume that some players lack
the ability to make long-term commitments and opt to renegotiate their payoffs ex post to extract
quasi-rents. By its application, the paper also relates to the literature on gas market: Grais,
Zheng (1996), Stern (1999), Opitz, von Hirschhausen (2000) and von Hirschhausen, Meinhart,
Pavel (2005). These works quantify the impact of cooperation on the supply network extension
and consider the incentives to extend the pipelines along Ukraine and Belarus under different
cooperation regimes. The Stackelberg leadership, Nash barganing, Nash product concepts have
been applied to predict investments and payoffs of the countries. However, all the previous works
focus only on the relation of Russia and its transiters, so that the issue of externalities does not
arise. We are not aware of any study tackling the coalition formation issue and hence, we pioneer
in this respect.
From a standpoint of a general bargaining problem with externalities, our work relates to studies
on other topics. In particular, Eyckmans, Tulkens (2001) explore the issue of Kyoto protocol, where
players are countries and externalities are emissions affecting the environment of others. Jehiel,
5

Moldovanu (1996) study a patent acquisition problem, in which oligopoly firms collude to buy an
innovation from a rival. Fridolfsson, Stennek (2002) analyze preemptive mergers, where firms merge
with the hope of avoiding the negative externalities of being an ”outsider” of the deal. Finally,
Calvert, Dietz (1998) consider the formation of political parties. All these studies use the Nash
equilibrium and Markov equilibrium solution concepts to find an outcome of a coalition formation
game. To the best of our knowledge, our work is the first attempt to use the solution of Maskin
(2003). Besides, we are aware of only two previous application of a partition function form game to
analyze a real world problem. Eyckmans, Tulkens (2001) applied PFF game to study greenhouse
gas emissions and Pintassilgo (2003) use PFF game to analyze the Northern Atlantic bluefin tuna
fisheries. Both focus on a fair sharing rule for the distribution of the returns from cooperation,
which will ensure stability of a coalition structure. Our approach is different since we derive the
sharing of the profit endogenously.
Although the results of our analysis fit the reality quite well, there are a number of limitations
which lead to some discrepancy with the real world figures. Hence, several issues are left for
further research. First, we do not explicitly model the interaction of the FSU gas producers with
other exporters at the European market, such as Norway, Algeria, and African and Middle East
supplies of liquified natural gas. Rather, we model the European market non–strategically and
simply estimate a residual demand for gas from the Former Soviet Union. Second, in our study
we focus on the relationship of producers and transiters only. However, in reality, major European
importers, like French monopoly Gas du France, German giants E.ON and Wintershall, or Italian
Eni, do take an active part in investments in pipelines. Hence, a natural extension of the models
would be to include gas importers into the investment game. Third, our model is static by its
nature. We assume that the players make investment decisions and negotiate cooperation once
and for all. Hence, we do not account for the dynamics of repeated interaction. In the absence of
an international enforcement system long-term cooperation can be sustained by mutual threat of
retaliation in future periods. This type of dynamic cooperation, referred to as collusion, is explored
in the literature on cartels and can be applied to the Eurasian gas network. Our fourth restriction
concerns the players’ ability to commit. In the course of our analysis we consider only extreme
cases assuming that players either can commit or not. Alternatively, one could assume that players
renegotiate with some probability.
The remainder of the paper is organized as follows. Section 2 introduces the players and explains
their conflicts. Section 3 presents a formal modal. In Section 4 we give the assumptions of the
quantitative analysis. In Section 5 we discuss the numerical results. Section 6 concludes.
6

2 Players and their Relations
In the following, we distinguish the two types of players in the Eurasian gas supply network:
producers and transiters. The producers are Russia and Turkmenistan, the latter representing the
Caspian gas producers.2 Production fields are distant, to reach the European market the producers
turn to transiters for transportation services. At present, Ukraine and Belarus transport Russian
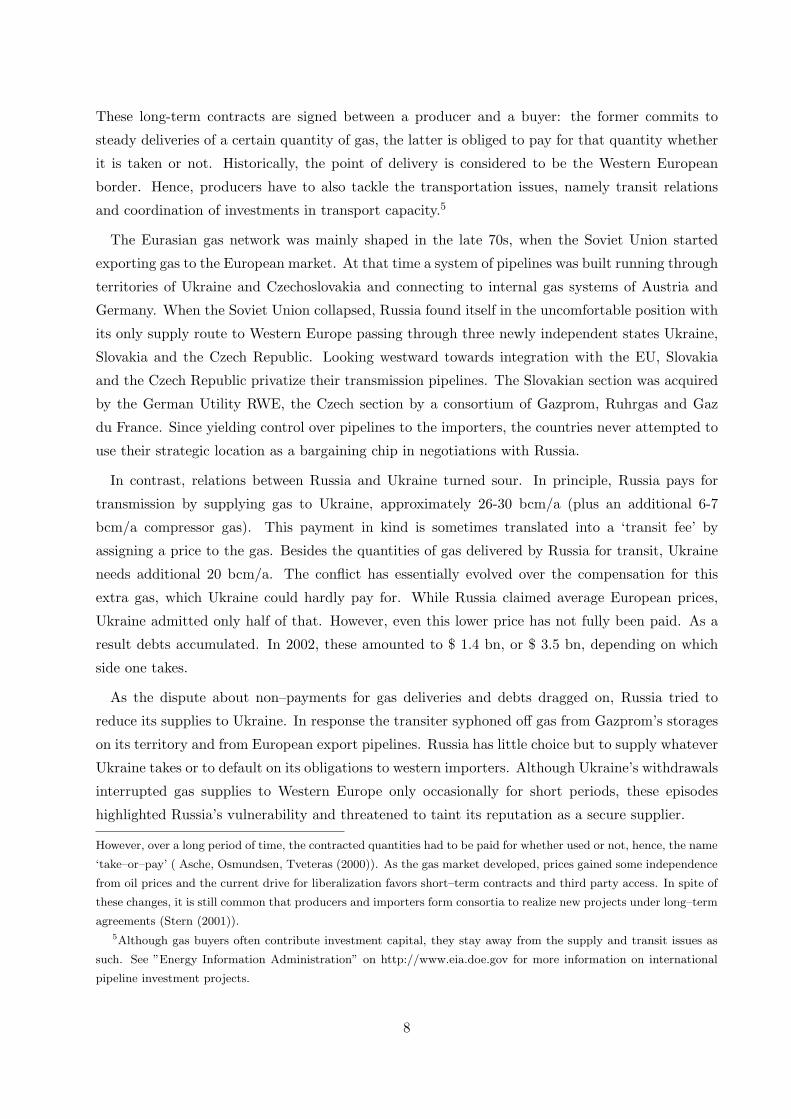
gas. Azerbaijan, Georgia and Iran are the prospective transiters for the Caspian gas.3
Figure 1: The Eurasian gas supply network
United Kingdom
Ukraine
Turkmenistan
Turkey
Sweden
Spain
Slovakia
Russia
Romania
Poland
Norway
Morocco
Lithuania
Libya
Latvia
Kazakhstan
Italy
Iraq
Iran
Hungary
Germany
Georgia
France
Finland
Estonia
Czech Rep.
Belarus
Azerbaidjan
Austria
Algeria
Moscow
Berlin
Trans-Caspian
Gas Pipeline
Nor
th E
urop
ean
Gas
Pip
elin
e
Blu
e S
tream
Yamal
Nabucco
Pro
gres
s
Torzhok
Vyborg
Uchta
Velke
Kapusany
Eletz
Stockmanskoye Yamal
Yamburgskoye
Urengoy
ZapolyarnoyeVuktylskoye
Orenburgskoye
Erzurum
gas field in production
gas field to be developed
pipelines
operating
under constrution
projected
possible
major knot
city
European countries buy gas by ”take-or-pay” contracts, typically ranging from 15 to 25 years.4
2International gas affairs in the Former Soviet Republics are run by state monopolies, therefore, we will refer to
respective countries instead of naming the companies, e.g. Russia instead of Gazprom.3We do not consider other countries involved in gas transportation, e.g. Poland, Czech Republic, Turkey and etc.
Assuming the open access and regulated tariffs there, we focus on interactions between the Former Soviet Republics
only.4So called ‘take–or–pay’ contracts regulate prices and quantities to ensure the efficient usage of the capacities and
steady revenues. To account for changes in the economic environment gas prices used to be indexed to oil prices.
7
These long-term contracts are signed between a producer and a buyer: the former commits to
steady deliveries of a certain quantity of gas, the latter is obliged to pay for that quantity whether
it is taken or not. Historically, the point of delivery is considered to be the Western European
border. Hence, producers have to also tackle the transportation issues, namely transit relations
and coordination of investments in transport capacity.5
The Eurasian gas network was mainly shaped in the late 70s, when the Soviet Union started
exporting gas to the European market. At that time a system of pipelines was built running through
territories of Ukraine and Czechoslovakia and connecting to internal gas systems of Austria and
Germany. When the Soviet Union collapsed, Russia found itself in the uncomfortable position with
its only supply route to Western Europe passing through three newly independent states Ukraine,
Slovakia and the Czech Republic. Looking westward towards integration with the EU, Slovakia
and the Czech Republic privatize their transmission pipelines. The Slovakian section was acquired
by the German Utility RWE, the Czech section by a consortium of Gazprom, Ruhrgas and Gaz
du France. Since yielding control over pipelines to the importers, the countries never attempted to
use their strategic location as a bargaining chip in negotiations with Russia.
In contrast, relations between Russia and Ukraine turned sour. In principle, Russia pays for
transmission by supplying gas to Ukraine, approximately 26-30 bcm/a (plus an additional 6-7
bcm/a compressor gas). This payment in kind is sometimes translated into a ‘transit fee’ by
assigning a price to the gas. Besides the quantities of gas delivered by Russia for transit, Ukraine
needs additional 20 bcm/a. The conflict has essentially evolved over the compensation for this
extra gas, which Ukraine could hardly pay for. While Russia claimed average European prices,
Ukraine admitted only half of that. However, even this lower price has not fully been paid. As a
result debts accumulated. In 2002, these amounted to $ 1.4 bn, or $ 3.5 bn, depending on which
side one takes.
As the dispute about non–payments for gas deliveries and debts dragged on, Russia tried to
reduce its supplies to Ukraine. In response the transiter syphoned off gas from Gazprom’s storages
on its territory and from European export pipelines. Russia has little choice but to supply whatever
Ukraine takes or to default on its obligations to western importers. Although Ukraine’s withdrawals
interrupted gas supplies to Western Europe only occasionally for short periods, these episodes
highlighted Russia’s vulnerability and threatened to taint its reputation as a secure supplier.
However, over a long period of time, the contracted quantities had to be paid for whether used or not, hence, the name
‘take–or–pay’ ( Asche, Osmundsen, Tveteras (2000)). As the gas market developed, prices gained some independence
from oil prices and the current drive for liberalization favors short–term contracts and third party access. In spite of
these changes, it is still common that producers and importers form consortia to realize new projects under long–term
agreements (Stern (2001)).5Although gas buyers often contribute investment capital, they stay away from the supply and transit issues as
such. See ”Energy Information Administration” on http://www.eia.doe.gov for more information on international
pipeline investment projects.
8

Meanwhile, in late 90s the capacity of the Ukrainian transmission network, which we will name
Ukold, dropped to 70bcm/a due to aging compressors, lack of maintenance and underinvestment.
The cheapest and fastest option to increase export capacities would be to upgrade the Ukrainian
system. By replacing old compressors the transmission capacity could easily be increased by 15
bcm/a. Hereafter, we will refer to this possibility as Upgrade. In 2004 Gazprom and Ukrainian
Naftogas reached a tentative agreement according to which Russia in co–operation with German
Ruhrgas would attract $ 2.5 bn to upgrade the system. Ukraine in its turn should have given the
investors a control stake over the transit system. However, after Ukraine refused to sell the required
package of shares, Russia declined to invest in Upgrade.
Instead, as a direct threat to Ukraine’s strategic position, plans have been drawn up for a twin–
pipeline going to Germany through Belarus and Poland. In 1994 Russia started the project often
referred to as Y amal.6 Initially Yamal included two pipelines with total capacity of 56bcm/a.
Eventually, only the first export line, so called Yamal 1 was installed. In the late nineties this
pipeline with a potential capacity of 28 bcm/a had compressors to support only 18 bcm/a and
reached its planned level only in 2006. Together with the first pipeline, at major river–crossings
pipes for the second band, Yamal 2, have been laid.
To manage the transit through Yamal in Poland a joint stock company, EuroPolGaz, was estab-
lished in which Polish PGNiG and Russian Gazprom hold equal shares. In 2004 Poland became an
EU-member and since then its transit obligations can be enforced by the European legal system.
Russia and Belarus agreed on a long–term solution for sales and transit relationships, including the
transfer of the assets of Beltransgaz, Belarus’ national gas company, to Gazprom under a 99–year
lease. In exchange, Russia would have increased gas supplies to Belarus, which like Ukraine, buys
Russian gas for its domestic needs at a special price. Yet, the Belorussian parliament did not ratify
the agreement. Thus, Russia failed to gain control and to guarantee security of its export via
Belarus. Instead, it again found itself in a weak bargaining position.
After the dissolution of the Union, Belarus’ ties with Russia remained very close and its ability
to act independently was fairly restricted due to its weak economy. The country had to rely on
subsidies from Russia in the form of reduced prices on a bundle of goods, including gas. However,
even in this situation Belarus accumulated significant debts. Shortly after the pipeline was installed,
Belarus start exploiting its strategic position in financial disputes with Russia. Every attempt of
Russia to raise the prices has resulted in renegotiations over the proportional increase in transit fees.
When Russia cut off gas supply to Belarus in February 2006, the transiter took the required gas
from export pipelines. To fulfil its export obligations Russia had to compromise and restored the
6The name came from the idea to connect this pipeline to a large gas field in the Yamal peninsular. As demand
was weak during the nineties the project was gradually scaled down. The development of the field was postponed.
Only the section of the pipeline, from the Russian border to Europe, was to be built. See the extended description
and the complete history of the project in Stern (2005).
9

delivery. A number of short-term agreements were produced to settle the feuds, but little progress
was made to find a long-term solution. Only recently, on 31 December 2006, a new long-term
contract was signed. It doubled the gas prices for Belarus from 47$/tcm to 100$/tcm, which is still
only a half of the price Western Europe pays, and envisaged a stepwise adjustment to international
prices by 2011. However, the increase in prices is partially compensated by a 70% increase of transit
fees and by cash payments, that Gazprom is expected to make for the acquisition of Beltransgaz
(see Yafimova and Stern (2007) for details). Given Gazprom’s past failures in attempts to gain
control over transit pipelines, it is very likely that Belarus may again fail to implement the last
step and Gazprom’s payments would mainly offset the price increase.
Increasing frustration with the demands of transit countries led Russia to look for a direct,
although much more costly, offshore option. The project, known in 2000 under the name of North-
Trans Gas and later called the North European Gas pipeline or Nord Stream, has been designed
to carry Russian gas through the Baltic sea directly to the German border. The project, which
we further denote as NEGP, was initially under the control of the German-Russian consortium of
Gazprom, Wintershall, and E.ON-Ruhrgas. Investment costs of this offshore pipeline are at least
twice as high as that of any onshore pipelines, and NEGP has long been regarded as unfeasible.
Nevertheless, Russia started work on the offshore section of NEGP in 2005. Originally planned
capacities were from 18 to 30 bcm/a, but the new scale of the project is 55bcm/a.
Several observations are particularly notable in this context. First, the transiters, Belarus and
Ukraine, failed to establish long-term stable relations with Russia. They are involved in continuous
bargaining over compensation for transit and for import of Russian gas. The renegotiations high-
light the commitment problem. As a result, investments suffer from the hold-up problem. Second,
despite the conflicts, interruptions to Russian supply have been very rare and short. As a rule, the
players bargain and use their capacities efficiently. Third, we note that Russia’s choice of invest-
ments reflects the desire to strengthen its position. However, while the capital costs of investment
projects are known, the strategic gains can not be estimated directly.
Prospective players
During the Soviet time, Russia and other Republics consumed a significant amount of gas from
Caspian Republics, of whom the largest gas supplier was Turkmenistan. Turkmen gas, together
with Russian gas, was also sent to the European market. After the collapse of the Soviet Union,
the Caspian producer demanded ”world prices” for their gas, but the FSU countries were not able
to pay that price. Then, Turkmenistan stopped the delivery to its former customers hoping to
receive profit from export to Europe. However, all the export routes from the Caspian fields to
Europe run through the Russian territory. In the 90s gas demand in Europe shrank. To secure its
own export revenues Russia denied potential rivals’ access to its pipeline system. As a result, gas
10

production in Turkmenistan dropped from 84bcm/a in 1991 to 13bcm/a in 1998.7
With no other options to market its gas, Turkmenistan had to agree to supply Russia and
neighboring countries for a price almost three time lower than that paid by Europe.8 The largest
consumer for Caspian gas was Ukraine. Turkmenistan had to meet Ukraine’s demand not covered
by gas import from Russia. However, when Ukraine was unable to pay for its import, Turkmenistan
simply cut its deliveries. This move put Russia into troubles, as Ukraine threatened to take gas
from the export pipelines. In 2004 Russia signed an agreement with Turkmenistan to buy its gas
for Ukraine to relieve itself from the increased burden.
The terms of the cooperation between Russia and Turkmenistan, however, are highly dependent
on the outside options of the Caspian producer. After 1997, the demand in Europe recovered
and entered a phase of steady growth. Producers of the Caspian region again turned an eye on
the European market. After keeping their fields idle for the last decade, they can easily raise the
extraction since fields are developed and equipment is in place. The milder climate conditions
of Caspian fields give them a cost advantage compared to most of the Russian fields, which are
situated in the permafrost terrain. All this makes Turkmenistan, which can cover up to 80% of the
Russian export, a potentially strong competitor in the European market. However, to reach the
European market, the Caspian producers will have to bypass Russia.
At the beginning of the century, the USA and the EU proposed two projects with the intention
to abate the dependency on the Russian gas supply and enhance the opportunity for the Caspian
producers to access the European market. The USA offered its support to the Trans-Caspian
Pipeline, to which we will refer as TCP . The project was first proposed in 1999 to supply 30bcm/a
of Turkmen gas to Turkey across the Caspian sea and Azerbaijan. However, while Turkmenistan and
Azerbaijan were arguing over a transit contract, Russian Gazprom accelerated its own negotiations
with Turkey. As a result, Russia contracted to supply 16bcm/a of gas and started building the
Blue Stream pipeline to supply Russian gas to Turkey through the bottom of the Black sea. A key
partner in the construction of the pipeline was Italian gas monopoly Eni, who’s intentions were
to extend the pipeline further to deliver gas via Turkey to Italy. In 2003, when the United States
suggested to build a pipeline bypassing Russia, the TCP project was revised and extended. The
new plan was to export Turkmen gas via Azerbaijan and Georgia to Turkey and further to Italy
and through Bulgaria to Austria.
In December 2006 Baku-Tbilisi-Ceyhan pipeline, the Georgian section of TCP connecting Turkish
system with Azerbaijan, start delivering Azeri gas to Turkey. The growing US influence in the
region made Georgia look like a reliable transiter. However, the project still faces a number of
7See gas production statistic in Stern (2005).8Until 2005, Turkmenistan obtained 44$/tcm for its gas. As Ukraine agreed to pay more for Russian gas, the
payment to the Caspian producer rose to 65$/tcm. At present, the price agreed with Russia is 100$/tcm, whereas
Europe pays more than 200$/tcm.
11

difficulties. The Nagorno-Karabakh conflict complicates installation of the pipeline and its security
in Azerbaijan. The country has a tight budget and can hardly pay investment costs up front. The
unstable position of the country complicates the attraction of the financial capital from outside.
Besides, as before Azerbaijan and Turkmenistan stalled on a transit deal. Turkmenistan agrees to
give up one third of supply profit on account of transit, yet Azerbaijan insists on at least a half.
Taking into account the history of the dispute one can assume that it will take a long time to reach
a compromise.
Sceptical on a result of these negotiations, the European Union favors an alternative pipeline
running through Iran to Turkey and further to Europe. However, this pipeline, which we will refer
to as Nabucco, also faces obstacles. Iran holds huge gas reserves and seems to be interested in
the project for itself. Although it is ready to pay up front for its part of the pipeline and readily
agrees on terms of a transit deal proposed by Turkmenistan, it seems very likely, that it would like
to use the existing capacity for its own supply. A pipeline connecting the Nebit Dag, Korpedze
and Okarem fields in Turkmenistan with the internal Iran grid at the Kord-Kul node was already
launched in 1999. Currently it delivers less than 10bcm/a to Iran, but the plan for the additional
20bcm/a with a further connection to Turkey has already been outlined. However, it is unlikely
that the project will be implemented without Turkmenistan, therefore Iran has to agree with a role
of a transiter.
Some concerns regarding both Caspian pipelines have also been raised against Turkey. The
country is located at the crossroad between Caspian and Middle East Countries. As the gas flow to
Europe was growing, Turkey became ambitious to establish itself as an exporting country.9 Hence
there is a chance, that once the pipelines are completed, Turkey would recontract to change its
role from a transiter to the role of an exporter. At the same time, however, it is looking forward
towards its joining the EU. Hence, Europe has some leverage over Turkey, which might be pushed
to sign the Energy Treaty, the agreement obliging its members to undertake a third party access
to transit facilities. In this case, Turkey would not be permitted to compel a resale contract from
Turkmenistan. In view of this argument, it seems more adequate to assume that Turkey will be
held back, so that the Caspian producers can rely on the access to the transit capacities.
Despite all the problems, the Caspian pipelines present a viable threat for Russia. First, it
may lose the inflow of low cost Caspian gas10 and will have to develop new fields, significantly
increasing the supply costs. Second, if Turkmenistan enters the market, Russia will meet a stronger
competition and lose a part of its export profits. In view of the competition and its negative impact,
9Turkey imports Russian gas through the Blue stream pipeline in the Black Sea. The amount of gas contracted
leaves Turkey with 6-8 bcm/a of excess gas. Recently, Turkey won the right to sell excess gas to Europe. Together
with 5bcm/a of Iranian gas and over 20bcm/a of Turkmen gas, Turkey may export up to 30bcm/a.10At present, fields in Siberia are at peak production or in decline. To increase its export Russia has to develop
new fields on the Yamal peninsular. This requires significant investments and will raise the supply cost of Russian
gas.
12

Russia had to comply with demands of Turkmenistan in recent negotiations over the export price on
Turkmen gas. In 2005 Turkmenistan enjoyed a 20% increase in prices from 44$/tcm to 56$/tcm and
in 2006 the price jumped to 100$/tcm. Russia also contracted a drastic increase of Turkmen export
volumes from 30 bcm/a in 2006 to 80 bcm/a in 2025. These concessions dampened Turkmenistan’s
interest in the alternative routes. At present at looks as if the bypass projects have been postponed.
To conclude, it is worth mentioning a few issues related to the Caspian players. If Turkmenistan
succeeds in forming a coalition with Iran and/or Azerbaijan, a competing supply chain will form.
Competition will reduce profits of Russian gas supply and weaken the strategic position of Russia.
We refer to this negative effect as ”externality”. Further, by analogy with the Russian supply chain,
the lack of enforcement of transit contracts between Turkmenistan and its transiters, results in the
hold-up problem. In the next section we develop a formal model of how network architecture and
investments determine the cooperation and the sharing of profits in the network.
3 The model
3.1 Basic notions
To analyze the investment problem we use a two stage model. We consider a set of players N =
{.., i, ..} consisting of producers and transiters cooperating to sell gas. Gas is transported through
pipelines. Before trade takes place the players set up capacities by investing in pipelines. Players
may form coalitions to invest cooperatively. By the time of supply, investment costs are sunk and
capacities generate quasi-rents. Before implementing the investments, members of coalitions sign
long-term contracts specifying how expected rents are to be shared. We assume that some players
may be not able to credibly commit to such contracts and may renegotiate payoffs ex post. Hence,
the ”hold-up” problem may arise. As a result, only credible players will cooperate to invest.
In detail the game unfolds as follows. At the first stage, marked with the superscript I, players
form ”investment coalitions” SI . The set of coalitions P I = {.., SIk , ..} is referred to as a partition,
or a coalition structure. We assume that coalitions embedded in any partition are pairwise disjoined
Sk ∩ Sh = ∅ for all k 6= h and⋃|P |
k=1 Sk = N , where | · | denotes cardinality. In view of the hold-up
problem we limit the set of possible coalition structures by allowing only the set of credible players
N c to form coalitions. The players, who cannot credibly commit N \ N c, play as singletons. We
denote the new set of partitions formed within this restriction as ΠI . Note that ΠI is a subset of
the set PI of all possible coalition structures that can be formed by the players N . The two sets
are equal if all the players can commit ΠI = PI ⇔ N = N c, if none of the players can commit
N c = ∅ the only possible partition is a set of singletons ΠI = {N}.Each coalition SI ∈ ΠI invests in network capacities k∗(SI) to maximize its future rent. The
rent depends on the total capacity of the network and hence, on the entire partition. Therefore,
13

we use a partition function for its representation. The partition function w : ΠI → R|ΠI | maps all
possible terminal coalition structures into a vector of values for embedded coalitions wI(SI ; ΠI).
The advantage of the PFF approach is that it captures the presence of externalities. Formally, we
speak of externalities whenever
∃S : w(S; P ) 6= w(S; P′) , for P \ Sk \ Sj = P
′ \ {Sk ∪ Sj} (1)
there is at least one coalition, which value changes with a change in a partition. When the inequality
sign in (1) becomes ”greater than”, the externalities are negative. In this case the union of the
coalitions Sk and Sj impose a loss on S. If the inequality sign is ”less than”, the externalities are
positive. This means that the merger of Sk and Sj brings S a gain.
Forming coalitions, the players simultaneously bargain over the rent sharing and fix the payoffs
ψI = (.., ψIi , ..) with long-term contracts. To sum up, at the first stage, the coalition formation and
bargaining game in a partition function form (PFF) is given by (N, N c, wI). The solution of this
game we search as a vector of expected payoffs E[ψI ] and a probability distribution of equilibrium
partitions p(ΠI).
At the second or ”supply” stage, investment costs are sunk, the network capacities k∗ =∑
SI∈ΠI k∗(SI)
are fixed and players form coalitions S and supply gas to the market. We will use the superscript
S to label the variables of the second stage.11 At this stage, the set of players is represented by
coalitions ΠI formed at the previous stage of our model. In other words, each coalition SI acts
as a single player. We denote the coalition structure at the second stage as PS . Newly formed
coalitions S compete on the market setting prices pS and quantities qS . The market equilibrium
depends on the supply chains, or coalitions PS formed. As a result, supply profits are again given
by a partition function wS(S; PS). As in the first stage, joining in coalitions players bargain over
sharing of the supply profits. The outcome of the bargaining - vector of payoffs ψS = (.., ψSSI , ..) -
determines the rents of the first stage coalitions.
In short, the second stage is described by the game in partition function form (ΠI , wS). The
outcome of the game is the pair (E[ψS ], p(PS)) - the vector of expected payoffs and probability
distribution of coalition structures.
By its structure, our two stage game is similar to a composite game developed by Owen (1977).
Owen (1977) modelled a game, in which players form ’a priory’ coalitions to gain an advantage
in subsequent bargaining, where these coalitions act as units. He defined the expected payoff of a
player as an outcome of the bargaining over sharing of the expected profit of an ’a priory’ coalition,
which the player joins. The approach of Owen (1977) is based on the Shapley value and hence, does
not allow for externalities. We extend the framework of Owen (1977) to games with externalities
by using the PFF game solution of Maskin (2003).
11However, to avoid cumbersome notations we will denote coalitions formed at this stage as S instead SS .
14

To solve the investment problem we need to find the outcome of the game (N, N c, wI). To do
so, we must calculate the values of the partition function. In what follows, we will first define
how the values of the partition function are calculated. We work out the game backwards and
hence, start with the bargaining at the second stage (ΠI , wS) considering all possible equilibrium
partitions of the first stage ΠI . Then, we proceed with the partition function wI . We will describe
the solution concept of the game in partition function form in section 3.4, until then we assume
that we know how (E[ψI ], p(ΠI)) and (E[ψS ], p(PS)) are determined based on the values of the
partition functions.
3.2 The second stage
At the second stage the capacities of the network k∗ = {k∗l }l∈L for L = {NEGP , Ukold, Upgrade,
Y amal1, Y amal2, TCP , Nabucco} are fixed. By forming a coalition players combine their re-
sources. We denote the capacities that a coalition has at its disposal by k∗(S).12 The available
capacities constrain supply: qS ≤ k∗(S). In order to be able to supply a coalition must include at
least one producer. In our case, we have only two producers, so that at most two supply coalitions
can form. We assume coalitions compete in prices and use the insight of Kreps, Scheinkman (1983)
to analyze the price competition under capacity constraints. Each coalition sets a price and serves
demand up to available capacities:
qS =
min[ k∗(S), max[0, D(pS)− k∗(S′)] ], pS > pS′
min[k∗(S), D(pS)], pS < pS′
min[k∗(S), max[D(pS)2 , D(pS)− k∗(S′)] ], pS = pS′
(2)
here D(p) is the demand function and S and S′are the competing coalitions. The coalition, which
sets a lower price, supplies first, high price coalition faces residual demand. Following Kreps,
Scheinkman (1983), we assume the efficient rationing of demand. If the prices are the same,
competing coalitions share the demand equally. If both producers are in the same coalition, they
form monopoly. As a result, coalitions obtain a net profit π(S; k∗(S), k∗(S′); pS , pS′ ) = pSqS −
tc(qS), where tc(·) is the total cost of supply.
According to Lemmas 2 to 6 in Kreps, Scheinkman (1983) there can be a pure strategy and
a mixed strategy equilibrium. The former occurs when the total capacity is in the Cournot re-
gion, that is smaller than the optimal Cournot response: r(k∗(S′)) = arg maxk∗(S) p(k∗(S) +
k∗(S′))k∗(S) − tc(k∗(S)) ≥ k∗(S). In this case, coalitions earn Cournot profits. If k∗(S) > k∗(S′)
and k∗(S) ≥ r(k∗(S′)) there is a mixed strategy equilibrium, and the expected profit of a larger
(in terms of capacity) coalition is equal to π∗(S; k∗) = p(r(k(S′)) + k(S
′))r(k(S
′)) − tc(r(k(S
′))).
12Capacities available to a coalition are the pipelines running through the territories of the coalition members. For
instance, Russia controls NEGP k∗({r}) = {k∗NEGP }, Ukraine - Ukold and Upgrade k∗({u}) = {k∗Ukold, k∗Ukold}.
15

The coalition with smaller capacities earns the expected profit of k(S′)/k(S) · π∗(S; k∗).13 The
equilibrium profits determine the values of the partition function:
wS(SS ;PS) = π∗(S; k∗) (3)
For coalitions consisting of transiters only we have wS(SS ; PS) = 0.
Calculating the values of the partition function for all possible PS , we obtain a full description
of the game of the second stage, and can solve for the equilibrium (E[ψS ], p(PS)). Since the values
of the partition function depend on capacities, the outcome of the game also depends on k∗. To
make this relation explicit we further write E[ψS(k∗)] and p(PS(k∗)). Now we proceed with the
first stage at which the capacities are chosen.
3.3 The first stage
At this stage players form coalitions and agree on a long-term rent sharing. Recall that by as-
sumption some players can not commit and will recontract. As a result, only credible players can
cooperate in coalitions, whereas the others will act as singletons. Anticipating their future payoff
E[ψSSI (k∗)] members of coalitions SI invest as to maximize:
π∗(SI ; ΠI) = maxk(SI)
E[ψSSI (ko + k(SI) + k(ΠI \ SI))]− I(k(SI)) (4)
here ko is the initial capacities of the network.14 Coalitions choose investments k∗(SI) taking into
account the decisions of the outsiders k∗(ΠI \ SI). To find the Nash equilibrium SI for a given
partition ΠI we solve the optimization problem (4) simultaneously for all coalitions embedded in
ΠI . Repeating the procedure for all feasible ΠI we define the partition function:
wI(SI ; ΠI) = π∗(SI ; ΠI) (5)
Finally, we proceed with the solution of the bargaining game and determine how the rents are
shared, i.e. find (E[ψI ], p(P I)).15
3.4 The solution concept
As we have already mentioned in Introduction, for our analysis, we adopt the solution concept,
which has been recently proposed by Maskin (2003). In this approach, the players negotiate se-
quentially and the game is described in an extensive form. To introduce the extensive form Maskin
(2003) uses the random order bargaining procedure developed by Weber (1988). The procedure
13For more detail see Kreps, Scheinkman (1983).14Since a coalition can invest in any pipeline in the network, in contrast to k∗(S), the vector k∗(SI) can include
capacities which are not under the control of i ∈ SI at the second stage.15Note that for the players who can not commit E[ψI
i ] = E[ψSi (k∗)]− I(k({i})).
16

is commonly used in cooperative game theory to represent bargaining, in particular to depict the
general solution concept - Shapley value (1952). Under random order bargaining, coalition forma-
tion is considered as a sequential process. The players enter the bargaining process one by one in
some order θ = {.., θi, ..}, where θi gives the entry number position of a player i. When player i
enters the game, he observes a partial partition P formed by his predecessors j : θj < θi. At each
node of the game, represented by the pair (P, i), the new coming player chooses to join one of the
existing coalitions or to start a new one. We will use a subscript to point out, which coalition the
player joins: if player i joins S ∈ P then P → PS∪i. If the player sets a new coalition P → P ∪ {i}we write P{i}. Decisions on allocation are irreversible so that coalitions may only increase but not
break apart. Hereafter, we will distinguish terminal partitions, formed by all the players PN :⋃|P N |
k=1 Sk = N , where | · | is a cardinality, and partial partitions P formed by K ⊆ N .16
Given the allocation, the player is assigned a payoff. The payoff depends on the partition function,
the order, and the partial partition P , which has formed: ψi(w, θ, P ). We will distinguish the
equilibrium payoff vector ψ∗(w, θ) under the terminal equilibrium coalition structure P ∗(θ) given
the order θ and a payoff vector ψ(w, θ, PN ) corresponding to some terminal partition PN . To
simplify notation we will omit the argument w in the payoff function assuming that a partition
function is given.
The overall solution is obtained as a randomization over all possible θ. Following Maskin (2003),
we assume the orders of players to be equally probable Pr(θ) = 1/|N |! and calculate the expected
payoff vector of the game as:
E[ψ∗i ] =∑
θ∈Θ
1|N |! · ψ
∗i (θ) (6)
The probability distribution for the equilibrium partition is obtained as the probability weighted
collection of P ∗(θ).
Maskin (2003) accepts the fundamental assumption that players cooperate within and play non
- cooperatively across coalitions. This property is expressed in the first axiom:17
(i) the sharing of joint profits within each coalition should be Pareto optimal for any terminal
partition
∑
i∈S
ψi(PN ) = w(S; PN ) for ∀S, PN (7)
16In this section we will consider the general solution concept without reference to a particular stage of the model.
To simplify the notations, we will omit upper indexes.17In the course of the paper we change the original sequence of the axioms by Maskin (2003). We start with the
axioms describing the properties of the solution common to other PFF solutions, and then formulate the specific to
Maskin (2003) ones.
17

where ψ(PN ) is the payoff vector given some partition of players PN . The axiom requires that
coalitions distribute their profits fully among their members. This condition is sometimes called
”budget-balancing” and was justified by Aumann and Dreze (1974).
Maskin (2003) applies backward induction to solve the extensive form game. To that end, he
formulates the second axiom, which states consistency, or sequential rationality, of the equilibrium
outcome as follows:
(ii) for any i and partial partition P , if i is assigned to S ∈ P and S ∪ i ⊆ S∗ where S∗ ∈ P ∗(θ),
then the equilibrium partition P ∗(θ) resulting from P is the same as the one resulting from
PS∪i, and so is the payoff vector ψ∗(P ∗(θ)) = ψ∗(P ∗S∪i(θ))
There remain two questions to be answered: to which coalition is a player allocated and how are
payoffs to players determined? The answers are specific to Maskin (2003) and are the essence of his
solution. By his third axiom, Maskin (2003) demands efficiency of a players’ allocation: a player
joins the coalition such that his allocation has the greatest impact on the profit of this coalition. The
impact of the player’s allocation also reflects externalities. It is a relative measure and corresponds
to a particular alternative. Namely, it is presented by the gross marginal contribution of a player to
a coalition S given the alternative coalition S′, that is how much a profit of S changes if the player
instead of joining this coalition will join S′: w(S ∪ i; PN
S∪i) − w(S; PNS′∪i). A positive contribution
creates incentives for coalitions to attract the player, since they will lose otherwise.
The partition function w gives the worth of coalitions under all possible terminal partitions PN .
Yet, to continue with axioms for allocation and assignment of payoffs we need to know the values
of the coalitions embedded in partial partitions. We denote them w(S;P ). Since we solve the game
backwards, we can determine the allocation and the payoff of the last player l : θi < θl for ∀i for
all possible PN knowing only w. Then, we can reduce a game to N \ l, and calculate the values of
coalitions in partitions PN\l. For the coalitions not including l the value is w(S; PN\l) = w(S;PN ),
for the coalition S′ ∈ PN : l ∈ S
′the w(S
′;PN \ l) = w(S
′;PN ) − ψl(PN ). Generalizing, for a
partial partition P formed by j : θj < θi we obtain:
w(S; P ) = w(SN ; PN )−∑
i∈SN\Sψi (8)
where SN ∈ PN and S ⊆ SN
In words, the value w can be interpreted as an undistributed profit of a coalition S.
Now we proceed with the third axiom
(iii) each player is allocated to the coalition S ∈ P , to which his gross marginal contribution is
greatest
w(S ∪ i; PS∪i)− w(S; PS′∪i) ≥ w(S′′ ∪ i; PS′′∪i)− w(S′′;PS∪i) (9)
∀S′′ : S′′ 6= S S′ = arg maxS′′
[w(S′′ ∪ i; PS′′∪i)− w(S′′;PS∪i)] (10)
18

In words, of all possible alternatives S′′
one finds the one S′, compared to which the allocation of
i to S has the largest impact (10). The coalition S attracts the player if the contribution of the
player to S with respect to S′is greater than to S
′with respect to S.
In a competition for a new player coalitions should be able to offer him at least as much as the
others are ready to pay. In the result, payoffs of players are defined as follows:
(iv) every player earns his opportunity payoff, i.e. the second greatest gross marginal contribution
ψi(P, θ) = w(S′ ∪ i; PS′∪i)− w(S′; PS∪i) (11)
3.5 Equilibrium
According to Maskin (2003) for any superadditive game (N,w) the solution, satisfying axioms (i)-
(iv) exists. This claim is proved as Theorem 1. The proof is done by construction and is based on
the case of |N | = 3. Maskin (2003) asserts that for |N | > 3 the result of the theorem holds as well.
However, we have found that, in general, this is not true. We present our finding in the following
proposition:
Proposition 1 For a game in partition function form (N,w) with |N | > 3, a solution pair
(E[ψ∗], p(P ∗)) satisfying axioms (i)-(iv) may not exist
We prove this proposition by an example, which is given in Appendix 9.
Furthermore, in Theorem 2, Maskin (2003) claims that if all externalities are non-positive the
solution (E[ψ∗], p(P ∗)) fulfilling the axioms (i)-(iv) is unique. Once again the proof is done by
construction for N = 3. In the course of our analysis we have revealed that this claim is not
necessarily valid for |N | > 3. We state this result as
Proposition 2 For a game in a partition function form (N,w) with |N | > 3 in which all exter-
nalities are nonpositive, that is for any S, Sk, and Sj: w(S; P ) 6= w(S; P′), where P \ Sk \ Sj =
P′ \ {Sk ∪ Sj}, the solution (E[ψ∗], p(P ∗)) may not be unique
A proof by example is provided in Appendix 10.
In our study the number of players N = 6 and, according to propositions (1) and (2) we may
encounter the problems of non-existence and multiplicity. Non-existence of an equilibrium is a
conceptual problem since in this case it is not clear what the outcome of the game is.18 There is no
18Note, however, that the solution of Maskin (2003) is not the only one susceptive to the non-existence problem.
There are many others solutions, in particular, those based on a Nash equilibrium, in which an equilibrium may not
exist.
19

reasonably simple way to show in which cases an equilibrium always exists in general.19 Fortunately,
in our calculations we have not encountered the problem of non-existence. This is largely due to a
specific property of our game. We formulate this finding in
Proposition 3 For a game in a partition function form (N, w) with |N | > 3 the solution (E[ψ∗], p(P ∗))
exists, if at any node (P, i) of the game there exist at most one coalition S ∈ P for which it matters
to which of the alternative coalitions the new player is going to be allocated, so that
w(S; PS′∪i) 6= w(S; PS′′∪i)
and for all other S 6= S it holds true that
w(S; PS′∪i) = w(S; PS
′′∪i)
We prove proposition (3) and discuss in more detail the properties of our game in Appendix 11.
As multiple equilibria are concerned, they do occur in the course of our analysis. However, this
does not present a severe problem since the choice of an equilibrium does not change the outcome
of the game. In our analysis, multiplicity occurs only when the contribution of a player to all
coalitions is zero. According to axiom (iii) the player can then be allocated to any coalition. As the
number of such cases is small, we have been able to check that the allocations and the payoffs of
the other players do not depend on the allocation of that player. To avoid additional complexity in
computations we apply a simple tie-breaking rule: we assign such a player to the coalition formed
by the first player.
4 Quantitative Assumptions
To calculate profits of gas supply and to solve the investment game numerically we have to make
assumptions on demand and supply functions as well as on investment costs of the pipeline projects.
In this section we introduce these assumptions in turn.
4.1 Demand
The market, we have in mind, is represented by the core members of the European Union – EU15,
who’s share in total European gas consumption is over 90%.20 We refer to these countries as
Western Europe. The import demand of Western Europe is covered by Algeria, Norway, LNG
19See Ikonnikova and Willems (2007) for a further discussion on possible refinements to overcome the problem of
non-existence and sufficient conditions for an equilibrium to exist.20EU15 includes Austria, Denmark, Finland, France, Germany, Greece, Ireland, Italy, Luxembourg, Netherlands,
Portugal, Spain, Sweden, Switzerland, and the UK. We look at the market formed by these countries as a whole,
without specifying demand for each individual country.
20

suppliers, and the Former Soviet Union. The demand for FSU natural gas depends on preferences
for natural gas, the prices of other exporters and substitutes such as oil and gas from competitors,
preferences for diversifying energy supply, the cost of transporting gas within Western Europe
etc. Unfortunately, data on gas prices and consumption in Western Europe are too poor to allow
an econometric estimation of this function. The bulk of the deliveries is under a small number
of long–term contracts, the details of which are not made public. Available data on gas prices
largely reflect oil–price movements. They are of little relevance for the buyers tied up in these
agreements. Moreover, many of the important structural determinants of demand for FSU gas,
such as environmental concerns, preferences for diversity of supplies, turbine technology etc., are
changing fast. For simplicity, we take a linear specification of the demand function and make
‘plausible assumptions’ for the parameters.21 From figures on current and future marginal cost of
nonRussian suppliers provided in Observatoire Mediterraneen de LEnergie (2002) we estimate a
residual demand for the Former Soviet gas.
Based on data for the future consumption we calibrate the demand and supply functions as to
fit the capacities and investment patterns observed. We adjusting ”the future demand” function
to the planned development of the network, namely the building of NEGP. We obtain the demand
with the intercept equal to 190 and the slope of 0.3. We present further details in Appendix 8.
4.2 Supply
Costs of supply consist of production and transportation costs. Production cost account for gas
extraction and depend on terrain, climate conditions as well as infrastructure in place. The costs
vary with fields and are specified for each producer individually. We assume a linear increasing
function for the average production cost aci(q) = m + c · q, we use the subscript to refer to the
producer. Production costs tend to increase as production from old low cost fields declines and new,
more expensive fields have to be developed. Hence, we again derive different functions depending
on a time frame.
After 2000 the growth of domestic as well as of European gas demand led to increases in produc-
tion. Old fields, like Medvezhye were in depletion and new gas fields have to be tapped. The costs
of production from recently developed fields such as Zapolyarnoye are estimated in the range of 20
to 30 $/tcm ( World Bank (2005)). The cost of mt =20 $/tcm can also be taken as a ”sensible”
figure for gas production in Turkmenistan. In ”The strategy for the Russian gas industry develop-
ment” (2004) it is suggested that the costs of Russian gas may increase up to 40 $/tcm, if fields
like Stockman or Yamal have to be developed.
Further, according to scenarios of Russia energy sector development presented by World Bank
(2003), we estimate the slope of the production cost function for Russia as cr=0.4. For Turk-
21The detailed description of how we derive the demand for gas from FSU is given in the Appendix 8
21

menistan Mavrakis&Thomaidis&Ntroukas (2006) provide data which give the slope of production
cost for Turkmenistan ct=0.35.
Transportation costs account for operation costs and gas losses. These costs depend on the
length of a pipeline and specific features of the track. The operation costs consist of expenses on
management and maintenance of pipelines and compressor stations m and gas losses g, that is the
per cent of gas utilized by compressors on pumping to keep the pressure in pipelines. Costs grow
with the supply distance d. For the onshore pipeline the loss factor is g = 0.25% of gas per 100km,
for the high pressure underwater pipelines the figure is doubled g = 0.5%.22 The maintenance
costs also differ for onshore and offshore pipelines. Here we assume m = 0.1$/tcm · 100km and
m = 0.2$/tcm · 100km, respectively.23
The total cost of gas supply includes both production and transportation costs. For our analysis
we derive a simplified formula of the total cost of supply. We take that the costs should include all
the expenses on the way, namely gas consumption by compressor stations and operation costs.24
Then, we obtain:
tc(q) = ((ml
gl+ aci(q))egl·dl − ml
gl)ql, i ∈ {r, t}. (13)
Note, transport cost parameters are specified for each pipeline l.
As we express all figures on an annual basis, we also annualize investment cost, which are usually
given in total. We use the following formula: Ii = r·Ii(1−(1+r)−t) , where Ii is the total investment per
capacity. We take the real interest rate for investment to be r = 0.15. The lifetime of pipelines is
taken to be t = 25 years.
We distinguish two types of investment projects: projects to increase capacity of an installed
pipeline and projects to build a new pipeline. The first type of projects include installation of extra
compressor stations and can be completed within months. As for a new pipeline, it might take two
or three years, before the pipeline goes into operation and can deliver gas. To take this delay into
account we inflate the investment cost of new pipelines by 15%.
Table 1 gives the aggregate figures for supply and investment costs for the investment options
under the consideration. The figures for supply costs are calculated for the total supply of one
thousand cubic meter of gas. In the table we mark with a star new pipelines, for which we inflate
22See Oil, gas and coal supply outlook (1995) for further explanations of the transportation technology.23Maintenance costs are estimated based on operation costs details provided by Frank Tauchnitz (Wintershall).24With every additional 100km the expenses increase due to gas consumption by compressor stations and mainte-
nance costs that we express as follows:
tc(q, d +4)− tc(q, d)
4 = m + g · tc(q, d) (12)
Taking the limit, we obtain a differential equation. We solve the equation given that supply costs at the source
(d = 0) are equal to the production cost. For further details see Hubert, Ikonnikova (2003).
22

Table 1: Description of the links
Link max capacity invest. cost distance supply cost countries, forming
kl[bcm/a] Il[$/tcm] d[100km] tc(1tcm)[$] a supply chain
Ukold 70 sunk 16 17.2 Russia, Ukraine
Yamal1 28 16.1/sunk 16 17.2 Russia, Belarus
Upgrade 15 7.7 16 17.2 Russia, Ukraine
Yamal2∗ ∞ 15.2 16 17.2 Russia, Belarus
NEGP∗ ∞ 24.9 16 17.2 Russia
TCP∗ 30 23.7 38 15.0 Turkmen., Azerb.
Nabucco∗ 30 23.7 38 15.0 Turkmen., Iran
the values. The first two rows of the table describe the existing pipelines in Ukraine and Belarus.
Their capacities are fixed and investment costs are sunk. But if we look backwards to when the
first Yamal pipeline was built we find that the investment cost of Yamal 1 was equal to 16.1$/tcm.
The next two links are the extension of the first two pipelines: Upgrade of Ukrainian pipeline
system and the second Yamal pipeline. These two investment projects are the cheapest investment
options, as one may see from the second column of figures.
The second column shows that we limit the capacities of investment projects TCP, Upgrade and
Nabucco. To install capacity over the given limits, one would need to invest in the extension of the
connected transmission network, i.e. the pipeline system in East Europe and Turkey. New players
will be involved and supply costs of the unit of quantity delivered to the market will soar. In
contrast, the Yamal 2 and NEGP directly join with the European gas network. Europe is assumed
to adjust the internal grid to the import needs on its own, so no restrictions are put on the pipelines
going directly to the EU border or owned by the EU companies. We assume the length of all the
pipelines delivering Russian gas to be roughly the same. It is true for all the pipelines except for
Ukrainian system, which is about 400km longer. Hubert & Ikonnikova (2003) have checked that
this assumption does not lead to significant change in results, while allows us to avoid additional
complexity in calculations.
5 Results
Based on the quantitative assumptions presented in the previous section, we evaluate the partition
functions wI , wS . From these we calculate the equilibrium coalition structures and the expected
payoffs at the first and second stages. Finally, we solve for the equilibrium investments and find
23

the resulting supply quantities.25 We make these calculations for the three scenarios, varying the
assumption on who can commit to a long-term profit sharing. The first scenario is a benchmark
case, in which we assume that all players can commit. In this case, the hold-up problem does not
arise and the first best strategy is chosen. We call this scenario accordingly - ”first best”. In the
second scenario, titled ”{r, t}”, we assume that only Russia and Turkmenistan have the ability to
make credible long-term commitments, while the transiters are prone to renegotiate their payoffs,
after the new capacities are in place. Our third scenario, labelled ”{∅}”, reflects the situation, in
which none of the players can commit. Table 2 and Table 3 present the results.
Table 2: Equilibrium investments, quantities, profits
scenario extra capacitya [bcm/a]∑
SqS ‖
∑lkl
∑lIl net profitb
NEGP TCP Nab Uup Yam [bcm/a] $bn $bn
first bestc 0 0 0 15 28 141 ‖ 141 0.5 16.3
{r, t} 105 0 0 0 0 141 ‖ 203 2.6 14.0
{∅} 87 30 30 0 0 141 ‖ 245 3.6 12.9
a Besides, there are two existing pipelines kUkold =70bcm/a and kY amal1 =28bcm/a
b for demand p(q)=250-0.4q and supply costs acr=40+0.4q and act=30+0.35q
c when the grand coalition forms
Table 3: Expected payoffs in $mln
first bestc {r, t} {∅}ψI ψS ψI ψS ψI ψS
Russia 10.2 8.6 10.0 12.7 8.6 10.8
Turkmenistan 3.5 1.0 3.4 1.4 2.1 3.5
Ukraine 0.8 4.0 0.3 0.9 0.2 0.2
Belarus 0.6 2.3 0.2 0.4 0.2 0.2
Azerbaijan 0.7 0 0 0 0.9 0.9
Iran 0.7 0 0 0 0.9 0.9
For the first scenario we obtain that in equilibrium the grand coalition will be formed with a
probability of 0.91 at the investment stage P I = {N}. With a probability of 0.09 two competing
coalitions will form P I = {{r, b, u}, {t, a, i}}.26 The grand coalition will install additional capacities
so as to maximize the network profit and invests in the pipelines with the lowest capacity costs. As
it is shown in the first row of figures in Table 2, the players will invest in 15 bcm/a of Upgrade and
25Calculations are performed with Mathematica 5.1 program. Files with results are available upon request.26With the probability less than 1% Azerbaijan and Iran will be left outside the coalition.
24

28 bcm/a of Yamal2. With 43 bcm/a of extra capacity, the total capacity of the network is 141
bcm/a, which is equal to the profit maximizing supply quantity. Deducting annual investment cost
in the amount of $0.5bn, the players obtain a net profit of $16.3bn. This profit is shared among the
players according to ψI as given in the second column of Table 3. If competing supply chains are
formed, the coalition {r, b, u} will invest in Upgrade and add 10bcm/a. The Caspian players will
build both TCP and Nabucco with the total capacity of 60bcm/a. However, at the second stage,
the grand coalition forms and the players use the capacities installed at the first stage efficiently
and supply 141bcm/a. In the next subsection we will look in more detail, why competing supply
chains may form although players can commit.
Now to justify our next scenario, we consider a thought experiment on what would happen if the
players renegotiate after the capacities are installed. The second column of table 9, entitled ψS ,
presents the result of such an imaginary ex post bargaining. One can see, that Ukraine and Belarus
would benefit a lot from recontracting, since the additional capacities strengthen their bargaining
position and enable them to extract more rent. Hence, in the absence of international institutions,
which would enforce investment contracts, renegotiations are to be expected. This leads us to the
next scenario.
5.1 Hold-up and distortions
Assuming that the transiters can not commit we obtain that at the first stage the partition P I =
{{r, t}, {a}, {b}, {i}, {u}} will form with probability 1. As the second row of Table 2 shows, the
producers will not implement Upgrade and Yamal 2, but will invest in the direct offshore pipeline.
The North European Gas Pipeline will be built with a capacity of 105 bcm/a. At the supply stage
the grand coalition will form, with the probability 0.99, and the optimal supply quantities will
again be 141 bcm/a. As a result, 62bcm/a of new capacity will be left idle. With total investment
cost of $2.6bn, the net network profit will be $14.0bn, that is much less than in the first best case.
Hence, we obtain that the hold-up problem leads not only to underinvestment as commonly
predicted, but also to overinvestment and excess capacities. The producers underinvest in cheap
options in Ukraine and Belarus, and overinvest in NEGP. These ”strategic distortions” of invest-
ments reflect the efforts of the producers to strengthen their bargaining position and gain leverage
vis-a-vis unreliable transiters. NEGP will allow the producers to bypass all the transiters and
hence, will grant them a great strategic advantage in bargaining.
To motivate the third scenario, we look at what would happen if the producers fall apart and
recontract ex post. The fourth column in Table 3 gives the expected payoffs of the players in this
situation. Since ψIr < ψS
r we conclude, that now it is Russia who has incentives to renege on the
agreement.
This leads us to the scenario ”{∅}” in which no player can commit. As the last row in Table 2
25

shows, in equilibrium NEGP, TCP, and Nabucco will be built with the capacity of 87 bcm/a, 30
bcm/a, and 30 bcm/a, respectively. We find that the players will form the grand coalition at the
supply stage, with a probability of about 0.85. With a probability 15% two competing coalitions
{r, b, u} and {t, a, i} will form. Columns five and six report the expected payoffs of the players.
We obtain that in equilibrium only Russia and Turkmenistan will invest. Therefore, the expected
payoffs at the supply and investment stages are the same for the transiters, while the payoffs of
Russia and Turkmenistan are reduced at the investment stage by investment costs.
In the third scenario we again observe strategic distortions of investments, including underin-
vestment, overinvestment, and excess capacity. If the grand coalition forms at the supply stage,
more than a half of the new capacities will not be used. If the Caspian players form a separate
coalition, capacities of TCP and Nabucco will be fully used to compete with Russian supply. Two
thirds of the capacities along the Baltic sea will be left idle. Hence, the more players are not able
to commit, the larger overinvestments are and the less likely the grand coalition be formed.
Considering the aggregate network profits given in the last column of Table 2, we evaluate the
costs of the lack of commitment. The inability of transiters to commit to long-term rent sharing
results in the loss of $2.3bn, as the investment costs soar by almost three times, from $0.5bn
to $2.6bn. Altogether, the lack of commitment, combined with the absence of any enforcement
institution leads to the waste of over $3.1bn annually.
5.2 Formation of competing coalitions
As we have mentioned above, under ”all can commit” scenario, competing coalitions may form.
Now we look at this phenomenon in more detail. First, note that the probability 0.09 means,
that the partition P ∗ = {{t, a, i}, {r, b, u}} forms in 66 orders θ out of |N |! = 6!. We find that
a distinguishing feature of these orders is that Russia enters the game only after all the Caspian
players and Ukraine or Belarus have already arrived. Here, for illustrative purpose we consider the
order θ : (t, a, b, i, u, r). Although the game is in fact solved backwards, we will discuss the moves
in the natural order.
Azerbaijan as a second players has to choose whether to join Turkmenistan or start a new
coalition. As we have already discussed in this section, a transiter always joins his complement
producer, hence {t, a} forms. The next step, allocation of Belarus, is a turning point of a game.
If Belarus joins {t, a}, the grand coalition will form, if the transiter starts a new coalition, then
competing coalitions form. Let’s assume that Belarus enters coalition {t, a}. By the next step Iran
will join Turkmenistan, without whom it can not use his resources. Then Ukraine enters the game.
We find that Ukraine will not join {t, a, b, i}, because the worth of its resources is diminished by
presence of other transiters. Instead Ukraine will organize a new coalition, which Russia joins on
the next step. Russia will prefer to join Ukraine, because as in the case of Ukraine, the value of
26

its resources is smaller in the presence of Turkmenistan. Even without Russia, Turkmenistan can
supply its gas via TCP and Nabucco, whereas the worth of a coalition of Ukraine without Russia
is zero. Hence, we calculate that Russia’s contribution to {u} is larger than to {t, a, b, i}. To sum
up, the partition {{r, u}, {t, a, b, i}} would form, if Belarus enters the existing coalition.
Coming back to the question of the allocation of Belarus, we see that if it joins {t, a}, its resources
will be idle without Russia. Therefore, Belarus may prefer to start a new coalition. In this case,
the choice of Iran does not change and {t, a, i} forms. When Ukraine enters the game, it will join
Belarus. In principle, it may start a new coalition {u} or join {t, a, i}. Russia will prefer to follow
Ukraine both in {{t, a, i}, {u}, {b}} in {{t, a, i, u}, {b}}. However, neither of the two alternatives
will give Ukraine a larger payoff, than in the {b, u} case. Finally, Russia enters the game and joins
the coalition of complement transiters forming P ∗ = {{t, a, i}, {r, b, u}}.Similar reasoning is applied to ∅ scenario. Competing coalitions form in 108 orders at the supply
stage. In these orders Russia, as in the example discussed above, arrives after the Caspian players.
Thus, we revealed that the outcome of the game depends on the worth of resources of a player in
the presence of other players.
5.3 Conclusions
In this paper we have developed a framework for the analysis of endogenous coalition formation
and multilateral bargaining in an environment with externalities. We applied our study to analyze
the Eurasian gas supply network. Since there are no international institutions which could enforce
contracts between the countries involved in the network, we assumed that a commitment problem
may arise. Our calculations demonstrate that the countries have incentives to hold-up in order to
extract higher profits.
We looked at three different scenarios, varying the assumption on the players’ ability to commit.
Our results support the assumption that investments are mainly driven by strategic considerations
and the desire to strengthen the bargaining position. We have shown that the ”hold-up” prob-
lem may lead to underinvestments as well as overinvestments and excess capacities. The players
underinvest in capacities of unreliable parties and overinvest in capacities which strengthen their
bargaining position.
Applying the model to the Eurasian gas supply network we succeeded in providing a rational for
observed investment patterns. We find that the ability to commit prevails over investment costs. In
our analysis we obtain that whenever there is a possibility that Ukraine and Belarus will recontract,
the North European Gas Pipeline will be built. The disputes between Russia and Ukraine and
Belarus questioned the credibility of these countries and led to strategic distortions in investments:
underinvestments in the upgrade of the Ukrainian system and the Yamal 2 pipeline. Both projects
have been abandoned in favor of the expensive Baltic pipeline. The fact that investment in NEGP
27

is under its way confirms our results. However, as to the amount for overinvestment our predictions
appear to be too large. This result can be explained by the static nature of our model.27 Recall
that in our study we assume that the countries can invest, and hence, change their bargaining
position, only once.
Furthermore, according to our results, the larger the number of players who can not commit,
the larger is the overinvestment. If none of the players can commit, NEGP, TCP, and Nabucco
will be built. This finding also corresponds with reality. When relations between Turkmenistan
and Russia were bad, Turkmenistan worked out projects to bypass Russia. It signed a series of
tentative agreements with the potential transiters, namely Turkey, Azerbaijan, and Iran, and even
started to build sections of TCP in Georgia with massive support of the United States. However,
after Russia has made price concessions and agreed to transit Turkmen gas, Turkmenistan slowed
down the realization of its plans. Our calculations suggest that the only way to prevent TCP and
Nabucco if Russia credibly commits to transit Turkmen gas. Otherwise, the Caspian producers
will build the pipelines bypassing Russia, in spite of all the difficulties, if Russia does not prove its
ability to commit.
6 Acknowledgments
I am in debt to thank my thesis adviser Franz Hubert, Christian Wey, Christian von Hirschhausen,
Francis Bloch, Jonatan Stern, and Bert Willems for their helpful comments on drafts of this paper.
I also benefited from the discussions in seminars at Humboldt University of Berlin, WZB, DIW,
Universit Catholique de Louvain, from comments of participants of a number of conferences, e.g.
Conference of American Economic Association, European Association for Research in Industrial
Economics Conference and International Indusial Organization Conference.
27See Hubert and Suleymanova (2006) for more details.
28

References
7 References
About the concept of the development of the gas market in Russian Federation (2003), Report to theGovernment of Russian Federation
Andrew, Ellis & Einar, Bowitz, & Kjell, Roland (2000), ”Structural change in Europe’s gas markets: Threescenarios for the development of the European gas market to 2020”, Energy Policy, Vol. 28, No. 5
Asche, Frank & Osmundsen, Petter & Tveteras, Regnar (2000), European market integration for gas?Volume flexibility and political risk, Energy Economics, vol. 24, No. 3, pp. 249-265
Asche, Frank & Osmundsen, Petter & Tveteras, Regnar (2001), Energy taxes and natural gas demand inEU-countries, Working paper 516, CES ifo
Bandyopadhyay, Siddhartha & Chatterjee, Kalyan (2006), Coalition theory and its applications: A survey,The Economic Journal, Vol. 116, Issue 509
Bloch, Francis (1996), Sequential formation of coalitions in Games with Externalities and fixed payoffdivision, Games and Economics Behavior, Vol. 14
Bloch, Francis (2002) Coalitions and Networks in Industrial Organization, The Manchester School 70 (1),pp. 36-55
Bloch, F. & Gomes, A. (2006), Contracting with Externalities and Outside Options, Journal of EconomicTheory, Elsevier, Vol. 127(1), pp. 172-201
Boots, Maroeska & Rijkers, Fieke & Hobbs, Benjamin (2004), Trading in the downstream European gasmarket: A successive oligopoly approach, The Energy Journal, Vol. 25(3)
Bothe, David & Seeliger, Andreas (2005), Forecasting European Gas Supply Selected results from EUGASmodel and historical verification, EWI Working Paper, Nr 05.01
Brown, Murray & Chiang, Shin-Hwan (2003), Coalitions in Oligopolies: An introduction to the SequentialProcedure, Contributions to economic analysis 259, Elsevier
British Petroleum (2003, 2004, 2005), Statistical Review of World Energy
Calvert, Randall & Dietz, Nathan (1998), Legislative coalitions in a bargaining model with externalities,Institute of Political Economy, Working paper 16
Chakravorti, Bhaskar & Conley, John (2004), Bargaining efficiency and the repeated prisoners’ dilemma,Economics Bulletin, Vol. 3, No. 3
Che, Yeon & Hausch, Donald (1999), Cooperative investments and the value of contracting, The AmericanEconomic Review, Vol. 89, No. 1
Chollet, Andreas & Meinhart, Berit & von Hirschhausen, Christian & Opitz, Petra (2001a), Analysis ofthe Russian gas export to Western Europe, DIW Discussion Paper
Clippel, Geoffroy & Serrano, Roberto (2005), Marginal Contributions and Externalities in the Value, Work-ing Papers 2005-11, Brown University, Department of Economics
Do, Kim & Norde, Henk (2002), The Shapley value for partition function form games, Discussion Paper 4,Tilburg University, Center for Economic Research
29

Dutta, Bhaskar & Jackson, Matthew (2001), On the Formation of Networks and Groups, in the Modelsof the Strategic Formation of Networks and Groups, edt. by Dutta, Bhaskar & Jackson, Matthew,Heidelberg: Springer Verlag
”East-West Debt” news, September 2000, www.eastwest.be/ukraine.html
Energy Charter documents http://www.encharter.org/
Energy Information Administration (2002), Russia: Oil and natural gas export pipelines, http://www.eia.doe.gov/emeu/cabs/russpip.html
Eni’s Annual Report (2005), Fact book 2005, http://www.eni.it/sustainability/english/
EU Green Paper (2006), Green Paper, A European Strategy for Sustainable, Competitive and SecureEnergy, COM(2006)105 final, Brussels 8.3.06
Europaische Kommission, Grunbuch: Hin zu einer europaischen Strategie fur Energieversorgungssicherheit,(2001)
Eyckmans, Johan & Tulkens, Henry (2001), Simulating coalitionally stable burden sharing agreements forthe climate change problem,CORE Discussion Paper 9926 and CLIMNEG Working Paper 18
Framini, Franchesca (2002), Dynamic accumulation in bargaining games, Working paper, University ofGlasgow
Fridolfsson, Sven-Olof & Stennek, Johan (2002), Why mergers reduce profits and raise share prices – Atheory of preemptive mergers, Industrial Institute for Economic and Social Research, Series Paper 511
Funaki, Yukihiko & Yamato, Takehiko (1999), The core of an economy with a common pool resource: Apartition function form approach, International Journal of Game Theory, Vol. 28, No 2
Golombek, Rolf & Gjelsvik, Eystein & Rosendahl, Knut Einar (1995), Effect of liberalizing the natural gasmarkets in Western Europe, The Energy Journal Vol. 16(1)
Gomes, Armando (2001), Multilateral Negotiations and Formation of Coalitions, Computing in Economicsand Finance 2001, Series Paper 224
Gomes, Armando (2005), Multilateral Contracting with Externalities, Ecomometrica, Vol. 73(4)
Grais, Wafik & Zheng, Kangbin (1996), Strategic interdependence in European east-west gas trade: ahierarchical Stackelberg game approach, The Energy Journal Vol. 17(3)
Hafner, Manfred (2003), Future natural gas supply options and supply costs for Europe, ObservatoireMditerranen de l’Energie
Harbaugh, Rick (2001), Equity Stakes and Hold-up Problems, Claremont Institute for Economic PolicyStudies, Working paper
Hart, Sergiu & Kurz, Mordecai (1983), Endogenous Formation of Coalitions, Econometrica, Vol. 51, No.4. (Jul., 1983), pp. 1047-1064
von Hirschhausen, Christian & Meinhart, Berit & Pavel, Ferdinand (2005), Transporting russian gas toWestern Europe – A simulation Analysis, Energy Journal, Vol. 26(2)
Holz, Franziska & Kalashnikov, Vitaly (2005), A Strategic Model of European Gas Supply, DIW Discussionpaper
Hubert, Franz & Ikonnikova, Svetlana (2004), Hold-up, Multilateral Bargaining, and Strategic Investment:The Eurasian Supply Chain for Natural Gas, Working paper
30

Hubert, Franz & Ikonnikova, Svetlana (2003), Strategic Investment and Bargaining Power in Supply Chains:A Shapley Value Analysis of the Eurasian Gas Market, WZB Discussion Paper
Hubert, Franz & Ikonnikova, Svetlana (2003), Investment Options and Bargaining Power in the EurasianSupply Chain for Natural Gas, Humboldt University Discussion Paper
Ikonnikova, Svetlana & Willems, Bert (2007), Comment on the solution for a coalition formation andbargaining with externalities by Maskin (2003), Catholic University of Leuven Discussion Paper
Im, Hyejoon (2004), Trade blocks and foreign direct investment: Endogenous coalition structure, Workingpaper, POSCO Research Institute
Importing gas in to the UK - gas quality issues (2003), The report to Department of Trade and Industry,Ofgem and the Health and Safety Executive
Inderst, Roman & Wey, Christian (2003), Bargaining, Mergers, and Technology Choice in BilaterallyOligopolistic Industries, RAND Journal of Economics, The RAND Corporation, Vol. 34(1), pages1-19, Spring
International Energy Agency (2002), Russia Energy survey
Jackson, Matthew (2003), A survey of models of network formation: Stability and efficiency, in GroupFormation in Economics: Networks, Clubs, and Coalitions, edited by Gabrielle Demange and MyrnaWooders, Cambridge University Press: Cambridge.
Janeba, Eckhard (2000), Tax competition when governments lack commitment: Excess capacity as a coun-tervailing threat, American Economic Reveiw, Vol. 90(5)
Jehiel, Phillippe & Moldovanu, Benny (1996), Strategic nonparticipation, The Rand Journal of Economics,Vol. 27(1)
Jeon, Seonghoon (2002), Shapley Bargaining and Merger Incentives in Network Industries with EssentialFacilities, Sogang University, Discussion Paper
Ju, Y. (2004), The consensus value for games in partition function form, Discussion Paper 60, TilburgUniversity, Center for Economic Research
Koczy, Laszlo (2004), The core of the partition function form game, EconWPA Working paper
Kreps, David & Scheinkman, Jose (1983), Quantity precommitment and Bertrand competition yield Cournotoutcomes, The Bell Journal of Economics, Vol. 14, No. 2. (Autumn), pp. 326-337
Littlechild, S. & Thompson, G. (1977), Aircraft Landing Fees: A Game Theory Approach, The Bell Journalof Economics, Vol. 8, No. 1
Machiel, Mulder & Gijsbert, Zwart (2005), Modelling long run strategic behavior on the liberalized Euro-pean gas market, Netherlands Bureau for Economic Policy Analysis (CPB)
Maskin, Eric (2003), Coalitional Bargaining with Externalities, Mimeo
Mavrakis, Dimitrios & Thomaidis, Fotios & Ntroukas, Ioannis (2006), An assessment of the natural gassupply potential of the south energy corridor from the Caspian Region to the EU, Energy Policy, Vol.34, No. 13
Montero, Maria (1999), Coalition formation in games with externalities, Working paper, CentER for Eco-nomic Research, Tilburg University
31

Moreno, Diego & Ubeda, Luis (2006), Capacity precommitment and price competition yield the Cournotoutcome, Games and Economic Behavior, Vol 56 (2006), pp. 323-332
Myerson, R. B. (1976), ”Values of Games in Partition Function Form,” International Journal of GameTheory 6, 23-31
Myerson, R. B. (1980), ”Conference Structures and Fair Allocation Rules,” International Journal of GameTheory 9, 169-182
Nabiev Rizvan (2003), Euroasiatische Gasallianz oder Sudeuropaeischer Gasring?, Eurasisches Magazin07-03
Observatoire Mediterraneen de L’Energie (2002), Assessment of internal and external gas supply optionsfor the EU, Executive Summary
Oil, gas and coal supply outlook (2005), edition of the World Energy Outlook
Opitz, Petra & von Hirschhausen, Christian (2000), Ukraine as the gas bridge to Europe? Economic andgeopolitical considerations, Institute for Economic Research and Policy Consulting - IER, WorkingPaper
Owen, G. (1977), Values of games with a priori unions, Essays in Mathematical Economics and GameTheory, edt. R. Henn & O. Moeschlin, Springer-Verlag, pp. 7688
Platts, Global Energy Report (2002), LNG Guide 5.
Poten & Partners (2004), Spot and Short-Term LNG Trades and Shipping, Reports and Analysis, LNGConsulting Products
Rajan, Roby (1989), Endogenous Coalition Formation in Cooperative Oligopolies, International EconomicReview, Vol. 30, No. 4
Ray, Debraj & Vohra, Rajiv (1996), A Theory of Endogenous Coalition Structure, mimeo, Boston Univercity
Ray, Debraj & Vohra, Rajiv (1999), A Theory of Endogenous Coalition Structures, Games and EconomicBehavior, Vol. 26, pp. 286-336
Reform and restructuring of the gas industry in economies in transition, Paper, ECE Gas Centre Series 9
Rich, Vera (2002), Does Ukraine Need More Nuclear-Power Reactors? RFE/RL Poland, Belarus, andUkraine Report, June 2002
Russian Economic Society (2002), International gas consortium, Vestnik 43.
Salant&Switzer&Reynolds (1983), Losses from horizontal merger: the effects of an exogenous change inindustry structure on Cournot-Nash equilibrium, Quarterly Journal of Economics Vol. XCVIII, No.2.
Segal, Ilya (2003), Collusion, Exclusion, and Inclusion in Random-Order Bargaining, Review of EconomicStudies, Vol. 70 Issue 2
Shapley, L. S. (1953), A Value for n-person games, in Contributions to the Theory of Games II (Annals ofMathematics Studies 28), H. W. Kuhn and A. W. Tucker (eds.), Princeton University Press, 307317.
Stern, Jonathan P (1995), The Russian gas bubble, The Royal Institute of International Affairs.
Stern, Jonathan P (1999), Soviet and Russian gas: The origins and evolution of Gazprom’s export strategy,in: Mabro, Robert & Wybrew-Bond, Ian (ed.), Gas to Europe. The strategies of four major suppliers,Oxford University Press
32

Stern, Jonathan P (2001), Traditionalists versus the new economy: competing agendas for European gasmarkets to 2020, The Royal Institute of International Affairs
Stern, Jonathan P (2005), The Future of Russian gas and Gazprom, published by OIES and OxfordUniversity Press
Stern, Jonathan P (2006), The Russian-Ukrainian gas crises of January 2006, Oxford Energy Comment,Oxford institute of energy studies
Stole, Lars & Zwiebel, Jeff (1996a), Intra-Firm Bargaining under Non-Binding Contracts, The Review ofEconomic Studies, Vol. 63, No. 3. (Jul., 1996), pp. 375-410
Stole, Lars & Zwiebel, Jeff (1996b), Organizational design and technology choice under intra-firm bargain-ing, American Economic Review 86, 195-222.
Tonjes, Christoph (2006), Gas to Power - Europe, International Gas Union / Energy Delta Institute,Groningen, The Netherlands
The European Union of the Natural Gas Industry, Eurogas (2001), Natural gas consumption in WesternEurope, Press Release, Brussel
Thrall, R. & Lucas, W. (1963), n-Person Games in Partition Function Form, Naval Research Logistics,Quarterly X, pp. 281-298
Tulkens, Henry & Chander, Parkash (1997), The core of an economy with multilateral environmentalexternalities, International Journal of Game Theory, Vol. 26, No 3
de Vivies, Patrice (2005), LNG: Making gas markets global, IEA/GLE joint working workshop CRE
Walsh, William & Parkes, David & Das, Rjarshi (2005), Choosing Samples to Compute Heuristic-StrategyNash Equilibrium, Working Paper
World Bank (2005), On a loan/credit/grant in the amount of US$ million to the Russian Federation for aRussia Energy Efficiency, Implementation Completion Report No 26027 (CPL-38760)
World Gas Intelligence (2005), New Gazprom vision, Energy Report, June 29
Yafimava, Katja & Stern, Jonathan P (2007), The 2007 Russia-Belarus gas agreement, Oxford EnergyComment, Oxford institute of energy studies
Yi, S.-S. and H. Shin (2000), Endogenous Formation of Research Coalitions with Spillovers, InternationalJournal of Industrial Organization, vol. 18, pp. 229-256
8 Appendix
In this section we describe the procedure used to estimate the demand for FSU gas. As mentioned in section4, we derive the residual demand function based on European gas consumption data and on information onsupply quantities and costs of all European exporters. We take that consumption of gas Q is exogenouslygiven and use the figures from BP Annual Energy Report (2005) and International Gas Union Report(2006). The information on capacities and marginal costs mc of all exporters are taken from ObservatoireMediteranen de L’Energie(2003).
We obtain the import demand for gas in Western Europe by deducting from the consumption of a cor-responding year, quantities Qdom covered by domestic production of the EU countries. The rest Qim =
33

Q−Qdom is imported from the Former Soviet Union (FSU) producers and ”other” exporters. To derive theresidual demand for FSU gas we assume that a reduction of supply from FSU would lead to an increase insupply from ”other” sources q−FSU , rather than a change in total demand. Hence, the associated changes inprice are determined by the cost of the marginal supplier who replaces, or is driven out by, FSU gas. Figure2 illustrates the approach to estimation of the demand function. Suppose Russia supplies qFSU out of
6
-
Qim
mc
∑exporters qi =
S(p)
6 6mc−FSU mcFSU
︸ ︷︷ ︸Qim
︷ ︸︸ ︷︷ ︸︸ ︷q−FSU qFSU
Figure 2: Estimating the demand for FSU gas
total Qim. According to the data in Observatoire Mediteranen de L’Energie(2003), Nigeria LNG is the mostexpensive non-FSU gas producer. It supplies about 5 bcm/a. The second most expensive supplier is Omanwith 1 bcm/a. Continuing down to the cheapest exporter, we end up with Algeria. If Russia increased itssupply it would squeeze out the most expensive competitor first, the second most expensive exporter nextand so on. Thus, we derive the demand for FSU gas as qFSU = Qim − q−FSU (mc).
The gas market is not perfectly competitive and the price for gas includes a substantial mark up onmarginal cost. To obtain a realistic picture of the price for FSU gas we inflate the marginal cost by amark-up of 20%. Finally, assuming a linear form of the inverse residual demand function, we estimatethe parameters of the demand for FSU gas. For all three time perspectives we obtain price elasticities atequilibrium consumption around - 3.5. The high elasticity of demand reflects the flexibility of the Europeanbuyers in the choice of a producer. The obtained elasticity is close by its value to the estimates for theEuropean market provided in Boots, Rijkers, and Hobbs (2004).
9 Appendix
In this section we prove proposition 1 providing an example of a superadditive game (N, w) in which thesolution of Maskin (2003) does not result in any equilibrium. We consider a game of four players N ={a, b, c, d}. Let the players arrive to the game in the natural order θ: (a, b, c, d) and when player d entersthe game, he meets a coalition structure {{a}, {b}, {c}}. For simplicity we will omit additional bracketsand write P = {a, b, c}. In principle, player d can be allocate to any of the three coalitions (players), orstart a new coalition. To determine the equilibrium allocation we must apply axiom (iii) of Maskin (2003).According to this axiom, the player is allocated to the coalition to which his gross marginal contribution is
34

the largest. Let the values of the partition function be the following:
w(a; {a, b, c, d}) = 3
w(b; {a, b, c, d}) = 3
w(c; {a, b, c, d}) = 3
w(d; {a, b, c, d}) = 1
w(ad; {ad, b, c}) = 5
w(bd; {a, bd, c}) = 5
w(cd; {a, b, cd}) = 5
w(b; {ad, b, c}) = 1
w(c; {a, bd, c}) = 1
w(a; {a, b, cd}) = 1
w(c; {ad, b, c}) = 2
w(a; {a, bd, c}) = 2
w(b; {a, b, cd}) = 2
First, we notice that the game is superadditive that is for any Si and Sj the following holds w(Si; P ) +w(Sj ;P ) ≤ w(Si ∪ Sj ; PSi∪Sj ):
∀ S 6= d such that S ∈ {a, b, c, d} : w(S; {a, b, c, d}) = 3 w(d; {a, b, c, d}) = 1
w(S ∪ d;PS∪d) = 5 > 3 + 1
The superadditivity implies that player d will not start a new coalition, since his contribution to any coalitionis greater than his stand alone value. Let’s show that d also can not be allocated to a, b, or c:
(i) d can not be allocated to a. We find that
w(bd; {a, bd, c})− w(b; {ad, b, c}) > w(cd; {a, b, cd})− w(c; {ad, b, c}) 4 > 3
this means that coalition a will compete for player d with coalition b. We check that
w(ad; {ad, b, c})− w(a; {a, bd, c}) < w(bd; {a, bd, c})− w(b; {ad, b, c}) 3 < 4
hence, player d can not be assigned to a.
(ii) d can not join b. The best alternative to b is c, because
w(ad; {ad, b, c})− w(a; {a, bd, c}) < w(cd; {a, b, cd})− w(c; {a, bd, c}) 4 < 3
Morevore, the contribution of d to coalition c is greater than to b
w(bd; {a, bd, c})− w(b; {a, b, cd}) < w(cd; {a, b, cd})− w(c; {a, bd, c}) 3 < 4
therefore, d will not be allocated to b
(iii) c can not hold d. Under the partition {a, b, cd} the relative contribution of d to a is larger than to b
w(bd; {a, bd, c})− w(b; {a, b, cd}) < w(ad; {ad, b, c})− w(a; {a, b, cd}) 4 < 3
this means that c has to compete with a to get d. In this case, however,
w(cd; {a, b, cd})− w(c; {ad, b, c}) < w(ad; {ad, b, c})− w(a; {a, b, cd}) 3 < 4
so we infer that d will not join c
Hence, we have shown that there is no equilibrium allocation for d and proposition 1 is proved.
35

10 Appendix
To prove proposition 2 we again take an example of four players N = {a, b, c, d}. We consider the game,which the players enter in natural order θ: (a, b, c, d). Let player d enters the game when the players areorganized in partition P = {a, b, c}. Below we provide a partition function for which there exist more thanone equilibrium allocation of d.
The values of the partition function be the following:
w(a; {a, b, c, d}) = 4
w(b; {a, b, c, d}) = 4
w(c; {a, b, c, d}) = 4
w(d; {a, b, c, d}) = 1
w(ad; {ad, b, c}) = 5
w(bd; {a, bd, c}) = 5
w(cd; {a, b, cd}) = 5
w(b; {ad, b, c}) = 3
w(c; {ad, b, c}) = 2
w(c; {a, bd, c}) = 2
w(a; {a, bd, c}) = 3
w(a; {a, b, cd}) = 1
w(b; {a, b, cd}) = 1
We check that the game is superadditive:
∀ S 6= d and S ∈ {a, b, c, d} : w(S; {a, b, c, d}) = 4 w(d; {a, b, c, d}) = 1 (14)
w(S ∪ d; PS∪d) = 5 ≥ 4 + 1
Notice that all externalities are nonpositive: for any i 6= j: w(i; {a, b, c, d}) ≥ w(i; {jd, ..}):
w(a; {a, b, c, d}) = 4 ≥ w(a; {a, bd, c}) = 3
w(a; {a, b, c, d}) = 4 ≥ w(a; {a, b, cd}) = 1
w(b; {a, b, c, d}) = 4 ≥ w(b; {ad, b, c}) = 3
w(b; {a, b, c, d}) = 4 ≥ w(b; {a, b, cd}) = 1
w(c; {a, b, c, d}) = 4 ≥ w(c; {ad, b, c}) = 2
w(c; {a, b, c, d}) = 4 ≥ w(c; {a, bd, c}) = 2
Thus, the merger of d and any player imposes a loss on a third party.
Now we proceed with the allocation of player d. Applying axiom (iii) of Maskin (2003), we compare thecontribution of d to different coalitions.
(i) d can be allocated to a. We find that
w(bd; {a, bd, c})− w(b; {ad, b, c}) < w(cd; {a, b, cd})− w(c; {ad, b, c}) 2 < 3
that means that coalition a will compete for player d with coalition c. Since
w(ad; {ad, b, c})− w(a; {a, b, cd}) > w(cd; {a, b, cd})− w(c; {ad, b, c}) 4 > 3
36

according to the solution of Maskin (2003) player d can be allocated to a.
(ii) d can be allocated to b. We find that the best alternative to b is c, since
w(ad; {ad, b, c})− w(a; {a, bd, c}) < w(cd; {a, b, cd})− w(c; {a, bd, c}) 2 < 3
We observe that the contribution of d to b is larger than to c
w(bd; {a, bd, c})− w(b; {a, b, cd}) > w(cd; {a, b, cd})− w(c; {a, bd, c}) 4 > 3
therefore, we conclude d can join b.
(iii) c can not hold d. Under the partition {a, b, cd} the contributions of d to a and b are equal
w(bd; {a, bd, c})− w(b; {a, b, cd}) = w(ad; {ad, b, c})− w(a; {a, b, cd}) 4 = 4
In this case we should check both coalitions, whether d can join them
w(cd; {a, b, cd})− w(c; {ad, b, c}) < w(ad; {ad, b, c})− w(a; {a, b, cd}) 3 < 4
w(cd; {a, b, cd})− w(c; {a, bd, c}) < w(bd; {a, bd, c})− w(b; {a, b, cd}) 3 < 4
thus, c fails to attract d from both a and b.
According to the results of (i) and (ii), we have obtained that d can be allocated to both a and b. Hence,we have multiple equilibria.
11 Appendix
In this section we prove that proposition 2 provides a sufficient condition for an equilibrium under thesolution of Maskin (2003) to exist.
Consider an arbitrary game (N, w) and fix some order θ. Let’s take an arbitrary node (P, i), in which playeri enters the game and observe partition P with coalitional profits described by function w. Assume thatthere is the only coalition S such that its worth depends on the allocation of i: w(S; PS′∪i) 6= w(S; PS′′∪i)for any S
′, S
′′ 6= S.
Since the contribution of i to coalitions in P\S is always the same, we can arrange these coalitions accordingto the contribution of i in ascending order. Denote by S
′the coalition with the greatest contribution
w(S′ ∪ i; PS′∪i)− w(S
′; ·) ≥ w(S
′′ ∪ i; PS′′∪i)− w(S′′; ·) where S
′′ ∈ P \S \S′. To prove the proposition it is
enough to consider whether the player can be allocated to S′or S, since by our assumption S
′can overbid
all other coalitions P \ S \ S′.
(i) if the contribution of i to S under PS′∪i is smaller than the contribution of i to S′, then player i is
allocated to S′according to axiom (iii), since
w(S′ ∪ i)− w(S
′) ≥ w(S ∪ i; PS∪i)− w(S; PS′∪i) ∀ S ∈ P \ S
′(15)
(ii) if the contribution of i to S under PS′∪i is greater than the contribution of i to S′, then player i is
allocated to S, because
w(S ∪ i; PS∪i)− w(S;PS′∪i) ≥ w(S′ ∪ i)− w(S
′) ∀ S
′ ∈ P (16)
37

Thus, we have shown that the equilibrium allocation exists and hence, proposition (3) is proved.
Now we use proposition (3) to explain why we do not encounter the problem of non-existence. First,notice that if the node (P, i) is such that |P | ≤ 2 following Maskin (2003) we can proved that an equilibriumexists. For the other nodes we distinguish two cases: (I) when i is a producer and (II) when i is a transiter.
(I) Suppose a producer enters the game. Since in our analysis we have only two producers two situationsare possible: (i) the other producer has already arrived and (ii) the other producer will enter the game later.
(i) the producer can face the following coalitions: a coalition including the rival producer and coalitionsconsisting of transiters only. The value of the coalition with the other producer may depend on whichalternative the producer selects. All coalitions containing only transiters are not affected by the choiceof the producer, their value will be zero if the producer does not join them. Thus, there is only onecoalition such that w(S;PS′∪i) 6= w(S; PS′′∪i) and we can apply proposition 6.
(ii) if the other producer comes later, the present coalitions include only transiters. The value of coalitionswith the transiters, who are complementary to the producer, does depend on which alternative theproducer chooses. But in principle, the allocation of the producer may affect the allocation of the otherproducer and hence, it might matter for the transiters who are complementary to the other producer.If these transiters form one coalition or there is only one such transiter, we can use proposition6. Otherwise, there are two coalitions for which the allocation of the producer might be relevant.Fortunately, even in this case we can use proposition 6, because
(a) If Russia enters the game and Turkmenistan follows, then the coalitions at question are Azerbaijanand Iran. These players are symmetric and the allocation of Russia affects them in a similarway, therefore it is enough to consider only one of them. If there is only one coalition is suchthat w(S; PS′∪i) 6= w(S;PS′′∪i), we can use proposition 6.
(b) If Turkmenistan enters the game and Russia follows, then the coalitions at question are Ukraineand Belarus. We find that the allocation of Turkmenistan does not change the preference ofRussia on which transiter to join. Thus, for all coalitions which w(S; PS′∪i) = w(S;PS′′∪i) andby proposition 6 the equilibrium exists.
(II) Now we look at the situation when a transiter enters the game. Here, we will distinguish three cases:(i) both producers are present, (ii) a complementary producer is absent, and (iii) both producers are absent.
(i) in the presence of both producers the allocation of the transiter is relevant for at most two coalitions,those including the producers, since his contribution to any other coalition is zero. The situationreduces to P ≤ 2 and the result of Maskin (2003) can be used.
(ii) in this case we should take into account that the allocation of the transiter may change the allocationof the complementary producer, who comes later. In this respect, the allocation of the transiter mayaffect the value of the coalition including the other producer. Besides, the allocation choice mattersfor the other complement transiter, if he is present. The other coalitions are irrelevant, their value iszero and we can neglect them. Hence, we obtain that only two coalitions are relevant and we againuse the proof of Maskin (2003).
(iii) when both producers are absent, the observed coalitions consist of transiters. We are interested onlyin the case when there are three coalitions. The allocation of the transiter might matter only forthe transiters complementary to the other producer. Since the allocation of the transiter may changethe preferences of his complementary producer that, in turn, by (ii) of (I) can lead to the change in
38

the allocation of the other producer. However, as we have discussed in (ii) of (I), in this case theequilibrium will exist.
39