gao-12-838, federal disaster assistance: improved criteria
TRANSCRIPT

FEDERAL DISASTER ASSISTANCE
Improved Criteria Needed to Assess a Jurisdiction’s Capability to Respond and Recover on Its Own
Report to Congressional Addressees
September 2012
GAO-12-838
United States Government Accountability Office
GAO

United States Government Accountability Office
Highlights of GAO-12-838, a report to congressional addressees
September 2012
FEDERAL DISASTER ASSISTANCE Improved Criteria Needed to Assess a Jurisdiction's Capability to Respond and Recover on Its Own
Why GAO Did This Study
The growing number of disaster declarations—a record 98 in fiscal year 2011 compared with 65 in 2004—has contributed to increased federal disaster costs. FEMA leads federal efforts to respond to and recover from disasters and makes recommendations to the President, who decides whether to declare a disaster and increase the usual federal cost share of 75 percent. This report addresses (1) the number of declarations requested and approved from fiscal years 2004-2011 and associated DRF obligations; (2) the criteria FEMA used to recommend a declaration for PA, and the extent that FEMA assessed whether an effective response to a disaster was beyond the capabilities of state and local governments; (3) how FEMA determined whether to recommend cost share adjustments, and their costs; and (4) FEMA’s administrative cost percentages for declarations. GAO reviewed declaration data for fiscal years 2004-2011 and conducted site visits in 2011 to the two FEMA regions with the highest DRF obligations. The results are not generalizable, but provide insights.
What GAO Recommends
GAO recommends, among other things, that FEMA develop a methodology to more accurately assess a jurisdiction’s capability to respond to and recover from a disaster without federal assistance, develop criteria for 100 percent cost adjustments, and implement goals for and track administrative costs. FEMA concurred with the first two, but partially concurred with the third, saying it would conduct a review before taking additional action.
What GAO Found
During fiscal years 2004-2011, the President received governors’ requests for 629 disaster declarations and approved 539, or 86 percent, of which the Federal Emergency Management Agency (FEMA) reported 71 percent were for severe storms. For these 539 declarations, FEMA obligated $80.3 billion, or an average of about $10 billion a year, from the Disaster Relief Fund (DRF), as of January 31, 2012. Almost half of the obligations were for Hurricane Katrina; excluding obligations for Hurricane Katrina, FEMA obligated $40.6 billion, or an average of about $5 billion a year. As of January 31, 2012, FEMA anticipated that when all 539 declarations are closed, total DRF obligations will be about $91.5 billion.
GAO’s analysis shows that FEMA primarily relied on a single criterion, the per capita damage indicator, to determine whether to recommend to the President that a jurisdiction receive public assistance (PA) funding. However, because FEMA’s current per capita indicator, set at $1 in 1986, does not reflect the rise in (1) per capita personal income since it was created in 1986 or (2) inflation from 1986 to 1999, the indicator is artificially low. The indicator would be $3.57 in 2011 had it been adjusted for increases in per capita income and $2.07 in 2012 had it been adjusted for inflation from 1986 to 1999, rather than its current $1.35. GAO’s analysis of FEMA’s anticipated obligations for 508 declarations with PA during fiscal years 2004-2011 shows that 44 percent and 25 percent would not have met the indicator if it had been adjusted for increases in personal income and inflation, respectively, since 1986. Further, the per capita indicator does not accurately reflect a jurisdiction’s capability to respond to or recover from a disaster without federal assistance. GAO identified other measures of fiscal capacity, such as total taxable resources, that could be more useful in determining a jurisdiction’s ability to pay for damages to public structures. Developing a methodology to more comprehensively assess state capabilities and reexamining the basis for the indicator could help FEMA more accurately determine a jurisdiction’s capacity to respond without federal assistance.
FEMA recommends raising the usual 75 percent federal share for PA to 90 percent when federal obligations, excluding FEMA administrative costs, meet a qualifying threshold. However, FEMA has no specific criteria for assessing requests to raise the federal share for emergency work to 100 percent, but relies on its professional judgment. For the 539 disaster declarations during fiscal years 2004-2011, governors made 150 requests to adjust the federal cost share to 90 or 100 percent; 109, or 73 percent, were approved or statutorily mandated, mostly for hurricanes. Without specific criteria for 100 percent cost share, FEMA risks making inconsistent or inequitable recommendations to the President.
GAO’s analysis of administrative costs for 539 disaster declarations during fiscal years 2004-2011 shows that administrative cost percentages frequently exceeded FEMA’s targets, although FEMA does not require that they be met. GAO’s analysis of 1,221 disaster declarations shows that average administrative costs doubled from 9 to 18 percent during fiscal years 1989-2011, the time period for which FEMA has data available. FEMA is working on short- and long-term actions to improve efficiencies in delivering disaster assistance, but the agency does not plan to set goals or track performance for administrative costs. Until this happens, it will be difficult for FEMA to ensure assistance is being delivered in an efficient manner.
View GAO-12-838. For more information, contact William O. Jenkins at (202) 512-8757 or [email protected].

Page i GAO-12-838 Federal Disaster Assistance
Letter 1
Background 7 Over 500 Disasters Were Declared during Fiscal Years 2004
through 2011 with Total Obligations of Over $90 Billion Anticipated 14
Eligibility for Assistance Is Primarily Determined Using a Damage Estimate Indicator 22
FEMA Does Not Have Specific Criteria to Evaluate Some Cost Share Adjustment Requests and Does Not Track Additional Costs for All Adjustments 33
Costs of Providing Disaster Assistance Have Increased, but FEMA Is Working to Reduce Costs 38
Conclusions 48 Recommendations for Executive Action 50 Agency Comments and Our Evaluation 51
Appendix I GAO Analyses of the Number of Disaster Declarations and Amount of Obligations 54
Appendix II Objectives, Scope, and Methodology 65
Appendix III Total Public Assistance Indicator Amount for Fiscal Year 2012, by Jurisdiction 69
Appendix IV Description of Three Approaches to Measure a Jurisdiction’s Fiscal Capacity 71
Appendix V Comments from the Department of Homeland Security 78
Appendix VI GAO Contact and Staff Acknowledgments 82
Contents

Page ii GAO-12-838 Federal Disaster Assistance
Tables
Table 1: Number of Disaster Declarations Requested and Approved during Fiscal Years 2004 through 2011 14
Table 2: Obligations by Fiscal Year for 539 Disaster Declarations during Fiscal Years 2004 through 2011 19
Table 3: Number and Percentage of Closed Disasters Declared during Fiscal Years 1989 through 2011, by Obligation Amounts as of January 31, 2012 21
Table 4: Number and Percentage of Disasters Declared during Fiscal Years 2004 through 2011, by Combined Actual and Projected Total Obligation Amounts, as of April 30, 2012 22
Table 5: Three Potential Approaches to Measure a Jurisdiction’s Fiscal Capacity 32
Table 6: Number of Cost Share Adjustments Requested and Approved, Fiscal Years 2004 through 2011 34
Table 7: Average Administrative Cost Percentages for 1,221 Disaster Declarations during Fiscal Years 1989 through 2011 41
Table 8: Average Administrative Cost Percentages by Type of Assistance during Fiscal Years 1989 through 2011 44
Table 9: Status of Disaster Declarations during Fiscal Years 1992 through 2011, as of January 31, 2012 54
Table 10: Number of Disaster Declarations during Fiscal Years 1953 through 2011 by Jurisdiction 55
Table 11: Disaster Declarations by Incident Type during Fiscal Years 2004 through 2011 58
Table 12: Obligations for Disaster Declarations during Fiscal Years 2004 through 2011, by Jurisdiction, as of January 31, 2012 59
Table 13: Obligations Per Person Including Hurricane Katrina for Disaster Declarations during Fiscal Years 2004 through 2011, by Jurisdiction 61
Table 14: Obligations Per Person Excluding Hurricane Katrina for Disaster Declarations during Fiscal Years 2004 through 2011, by Jurisdiction 63
Table 15: 2010 Population and Total PA Per Capita Indicator Amount for Fiscal Year 2012, by Jurisdiction 69
Table 16: PA Indicator Adjusted by Jurisdiction for 2009 TTR 77

Page iii GAO-12-838 Federal Disaster Assistance
Figures
Figure 1: Number of Disaster Declarations during Fiscal Years 1953 through 2011 10
Figure 2: Disaster Declaration Process 13 Figure 3: Number of Disaster Declarations during Fiscal Years 2004
through 2011, by Jurisdiction 16 Figure 4: Major Disaster Declarations by Type of Assistance, Fiscal
Years 2004 through 2011 17 Figure 5: Disaster Relief Fund Obligations, Including Hurricane
Katrina, by Jurisdiction during Fiscal Years 2004 through 2011, as of January 31, 2012 20
Figure 6: Comparison of Actual Public Assistance Per Capita Indicator with the Indicators if They Had Been Adjusted for Increases in Personal Income and Inflation, 1986 through 2011 26
Figure 7: Frequency of Declarations above and below FEMA’s Target of 20 Percent or Less for Administrative Costs for Small Declarations during Fiscal Years 1989 through 2011 42
Figure 8: Frequency of Declarations above and below FEMA’s Target of 15 Percent or Less for Administrative Costs for Medium Declarations during Fiscal Years 1989 through 2011 43
Figure 9: Frequency of Declarations above and below FEMA’s Target of 12 Percent or Less for Administrative Costs for Large Declarations during Fiscal Years 1989 through 2011 44
Figure 10: Number of Disaster Declarations and Amount of Obligations by FEMA Region during Fiscal Years 2004 through 2011 57

Page iv GAO-12-838 Federal Disaster Assistance
Abbreviations DHS Department of Homeland Security DRF Disaster Relief Fund FCO federal coordinating officer FEMA Federal Emergency Management Agency GDP gross domestic product GSP gross state product IA Individual Assistance IFMIS Integrated Financial Management Information System JFO joint field office NEMIS National Emergency Management Information System PA Public Assistance PCI state personal income PDA Preliminary Damage Assessment PPD-8 Presidential Policy Directive-8 TTR Total Taxable Resources
This is a work of the U.S. government and is not subject to copyright protection in the United States. The published product may be reproduced and distributed in its entirety without further permission from GAO. However, because this work may contain copyrighted images or other material, permission from the copyright holder may be necessary if you wish to reproduce this material separately.

Page 1 GAO-12-838 Federal Disaster Assistance
United States Government Accountability Office Washington, DC 20548
September 12, 2012
The Honorable Jason Chaffetz Chairman Subcommittee on National Security, Homeland Defense, and Foreign Operations Committee on Oversight and Government Reform House of Representatives The Honorable Roy Blunt United States Senate
The growing number of major disaster declarations has contributed to an increase in federal expenditures for disaster assistance.1
1Hereafter in this report, major disaster declarations are referred to as disaster declarations. In addition to issuing major disaster declarations, the President may issue emergency declarations (42 U.S.C. § 5191) and fire assistance declarations (42 U.S.C. § 5187). If the President declares an emergency, the federal government may provide immediate and short-term assistance that is necessary to save lives, protect property and public health and safety, or lessen or avert the threat of a catastrophe, among other things. 42 U.S.C. § 5192. Federal assistance may not exceed $5 million under an emergency declaration unless continued emergency assistance is immediately required; there is a continuing and immediate risk to lives, property, public health or safety; and necessary assistance will not otherwise be provided on a timely basis. 42 U.S.C. § 5193. Upon the request of a governor, the President may issue a fire assistance declaration that provides financial and other assistance to supplement state and local firefighting resources for fires that threaten destruction that might warrant a major disaster declaration. 44 C.F.R. § 204.21.
For example, during the 8 fiscal years from 2004 through 2011, Presidents declared 26 percent more major disaster declarations than during the preceding 8 fiscal years from 1996 through 2003. The Federal Emergency Management Agency (FEMA), a component of the Department of Homeland Security (DHS), leads the federal effort to mitigate, respond to, and recover from disasters, both natural and man-made. Disaster declarations can trigger a variety of federal response and recovery assistance for government and nongovernmental entities, households, and individuals. FEMA’s disaster assistance programs include Individual Assistance (IA) and Public Assistance (PA), which provide financial
Page 2 GAO-12-838 Federal Disaster Assistance
assistance to individuals and jurisdictions, respectively.2 Typically, FEMA pays 75 percent of the PA costs for disaster declarations, and state and local governments pay the other 25 percent. However, governors can request that the President approve an adjustment to the cost share, so that state and local governments would pay less than 25 percent.3
FEMA’s Disaster Relief Fund (DRF) is the major source of federal disaster recovery assistance for state and local governments when a disaster is declared. The DRF is appropriated no-year funding, which allows FEMA to direct, coordinate, manage, and fund response and recovery efforts associated with domestic disasters and emergencies.
4 FEMA categorizes DRF obligations according to five categories: IA, PA, Hazard Mitigation, Mission Assignments, and Administration.5
2Hereafter in this report, jurisdictions refer to U.S. states, the District of Columbia, U.S. territories, Freely Associated States (nations in free association with the United States under the Compacts of Free Association), and local governments. The IA program provides for the necessary expenses and serious needs of disaster victims that cannot be met through insurance or low-interest Small Business Administration loans. For example, FEMA may provide temporary housing assistance, counseling, unemployment compensation, or medical expenses incurred as a result of a disaster. The PA program provides for debris removal; emergency protective measures; and the repair, replacement, or restoration of disaster-damaged, publicly owned facilities and the facilities of certain private nonprofit organizations that provide services otherwise performed by a government agency.
During fiscal years 2004 through 2011, PA was the category with the largest obligations. In addition, from fiscal years 2004 through 2011, the costs to administer some declarations exceeded the amount of federal assistance provided. In August 2011, the DRF diminished to a level that caused
344 C.F.R. § 206.47. 4No-year funds are available for obligation without fiscal year limitation. An obligation is a definite commitment that creates a legal liability of the government for the payment of goods and services ordered or received, or a legal duty on the part of the United States that could mature into a legal liability by virtue of actions on the part of the other party beyond the control of the United States. Payment may be made immediately or in the future. An agency incurs an obligation, for example, when it places an order, signs a contract, awards a grant, purchases a service, or takes other actions that require the government to make payments to the public or from one government account to another. GAO, A Glossary of Terms Used in the Federal Budget Process, GAO-05-734SP (Washington, D.C.: September 2005). 5Hazard Mitigation provides additional funds to states to assist communities in implementing long-term measures to help reduce the potential risk of future damages to facilities. Mission Assignments are costs paid by FEMA for work assigned to other agencies and departments.

Page 3 GAO-12-838 Federal Disaster Assistance
FEMA to temporarily halt funding on long-term recovery projects and focus on immediate needs. According to the FEMA Administrator, because of the shortage of available balances in the DRF, FEMA accelerated its efforts to recover previously obligated funds from states for completed projects that had unexpended balances. During fiscal year 2011, FEMA deobligated and recovered $2.2 billion from prior disaster declarations.
In 2001, we reported on the need for improvements to the criteria and eligibility procedures that FEMA used to make recommendations to the President for disaster declaration requests.6 In 2012, we reiterated the need for FEMA to, among other things, reexamine the criteria FEMA primarily uses to make recommendations to the President for disaster declaration requests.7 Furthermore, we have identified as a 21st century challenge the determination of costs to be borne by federal, state, and local governments or the private sector in preparing for, responding to, and recovering from disasters of all types.8
This report provides the results of our review of federal disaster assistance efforts by addressing the following questions: (1) For each fiscal year from 2004 through 2011, how many disaster declaration requests did FEMA receive, how many were approved, for which types of disasters, and how much were the associated obligations from the DRF? (2) What criteria has FEMA used to recommend to the President that a disaster declaration is warranted for PA, and to what extent does FEMA assess whether an effective response to a disaster is beyond the capabilities of state and local governments? (3) How does FEMA
6GAO, Disaster Assistance: Improvement Needed in Disaster Declaration Criteria and Eligibility Assurance Procedures, GAO-01-837 (Washington, D.C.: Aug. 31, 2001). 7GAO, 2012 Annual Report: Opportunities to Reduce Duplication, Overlap and Fragmentation, Achieve Savings, and Enhance Revenue, GAO-12-342SP (Washington, D.C.: Feb. 28, 2012), 321–328. 8Since September 11, 2001, the federal government has provided billions of dollars to state and local governments for planning, equipment, and training to enhance the capabilities of first responders to respond to both smaller-scale natural disasters and terrorist attacks. However, the federal financial assistance provided in the last several years has not been guided by a clear risk-based strategic plan that outlines the role of federal, state, and local governments in identifying, enhancing, maintaining, and financing critical first responder capabilities for emergencies. See GAO, 21st Century Challenges: Reexamining the Base of the Federal Government, GAO-05-325SP (Washington, D.C.: Feb. 1, 2005).

Page 4 GAO-12-838 Federal Disaster Assistance
determine whether a cost share adjustment recommendation for PA is warranted and how much additional federal assistance did jurisdictions receive during fiscal years 2004 through 2011 because of cost share adjustments? (4) What were FEMA’s administrative cost percentages for disaster declarations during fiscal years 2004 through 2011, how have they changed over time, and what actions is FEMA taking, if any, to reduce the costs of delivering disaster assistance?
To determine how many disaster declaration requests FEMA received, how many were approved, for which types of disasters, and how much the associated obligations were from the DRF, we obtained and analyzed data for each disaster declaration approved during fiscal years 2004 through 2011. We focused on this time frame because it contains the most current data for disaster declarations. It also comprises the time period after FEMA was merged into the newly created DHS, on March 1, 2003, and predates Hurricane Katrina in 2005. We focused primarily on fiscal years 2004 through 2011; however, to provide historical context and to compare results across similar periods, we also reviewed obligations data during fiscal years 1989 through 2011. In addition, to provide further historical perspective, we include information on the number of disaster declarations by jurisdiction from the first presidential disaster declaration in fiscal year 1953 through fiscal year 2011 in appendix I. FEMA provided data to us from its National Emergency Management Information System (NEMIS) and Integrated Financial Management Information System (IFMIS). To assess the reliability of these data, we reviewed the data that FEMA officials provided and discussed data quality control procedures with them. We determined that the data we used from these systems were sufficiently reliable for the purposes of this report.
To determine the criteria that FEMA used to recommend to the President that a disaster declaration was warranted for PA, and to what extent FEMA assessed whether an effective response to a disaster was beyond the capabilities of jurisdictions, such as state and local governments, we examined FEMA policies, regulations, and other documents related to the disaster declaration process. We also interviewed FEMA officials in headquarters and 2 of 10 FEMA regions as well as officials in two state

Page 5 GAO-12-838 Federal Disaster Assistance
emergency management agencies.9 In addition, to determine the probability that a state was granted PA if the related damage estimate met or exceeded the PA per capita indicator, we obtained and analyzed data within Preliminary Damage Assessments (PDA) from fiscal years 2008 through 2011.10
To determine how FEMA evaluated whether a cost share adjustment recommendation was warranted and how much additional federal assistance jurisdictions received during fiscal years 2004 through 2011 because of the adjustments, we obtained and reviewed relevant laws, regulations, and policies. We also reviewed Standards for Internal Control in the Federal Government to assess FEMA’s process for making recommendations to the President on the need for cost share adjustments.
To assess the reliability of these data, we reviewed the data that FEMA officials provided and discussed data quality control procedures with them. We determined that the PDA data were sufficiently reliable for the purposes of this report.
11
9In addition to conducting interviews with officials in FEMA headquarters, we conducted site visits in September 2011 to the two FEMA regions that had the highest total obligations during fiscal years 2004 through 2011. The regional administrative offices were located in Atlanta, Georgia, and Denton, Texas, respectively. At each region, we interviewed the Regional or Deputy Administrator and various other regional personnel. In addition, we visited the emergency management agencies for Georgia and Oklahoma and interviewed various officials, including the directors for each of these agencies. We selected the Georgia and Oklahoma state emergency management agencies based on their respective proximity to FEMA’s regional offices, their high level of experience with disasters, and their availability for a visit during September 2011. We wanted to avoid states that were actively responding to a disaster during that time. While the information we obtained on these site visits is not generalizable, the information provided important insights into the disaster declaration process.
We also obtained and analyzed the cost share
10The PA per capita indicator is an amount of funding, $1.35 per capita for fiscal year 2012, that is multiplied by the population of the jurisdiction (for example, state) for which the governor is requesting a disaster declaration for PA, to arrive at a threshold amount, which is compared with the estimated amount of damage done to public structures. 44 C.F.R. § 206.48 (a)(1). FEMA uses the comparison as an indicator of the jurisdiction’s need for federal assistance. For this analysis, we used 4 years of data (fiscal years 2008 through 2011) instead of 8 years of data (fiscal years 2004 through 2011) because PDA summaries are available in electronic format only back to fiscal year 2008. PDAs are conducted to identify the amount of damage a jurisdiction has incurred as a result of a disaster. Because of the associated workload and length of time required to provide PDA summaries in paper format, we did not request that FEMA provide PDA summaries prior to fiscal year 2008. 11GAO, Standards for Internal Control in the Federal Government, GAO/AIMD-00-21.3.1 (Washington, D.C.: November 1999).

Page 6 GAO-12-838 Federal Disaster Assistance
adjustments and types requested, approved, and denied during fiscal years 2004 through 2011. We interviewed FEMA officials who process cost share adjustment requests and participate in making recommendations to the President as to whether the requests should be approved or denied. To assess the reliability of these data, we reviewed the data that FEMA officials provided and discussed data quality control procedures with them. We determined that the cost share adjustment data were sufficiently reliable for the purposes of this report.
To determine what FEMA’s administrative cost percentages were for disaster declarations, we obtained DRF obligations, projected obligations, and related data for 1,221 disaster declarations during fiscal years 1989 through 2011.12 The projected obligations were FEMA’s estimates, as of April 30, 2012, of the anticipated total obligations—actual to date and estimated—for each disaster eligible to receive federal disaster assistance after April 30, 2012.13 We compared FEMA’s administrative cost percentages for each disaster declaration from fiscal years 2004 through 2011 with FEMA’s administrative cost percentage target ranges and FEMA’s administrative cost percentages for disaster declarations from fiscal years 1989 through 2003.14
12We examined fiscal years 1989 through 2011 because FEMA does not maintain detailed financial data on disaster declarations prior to fiscal year 1989.
We used these time periods because they provide larger sample sizes and an opportunity to assess potential trends over a longer period of time. In addition, we included projected obligations in our analysis because FEMA officials told us that administrative costs are typically higher as a percentage of assistance costs in the early months following a disaster. By including projected obligations, we were able to analyze disaster obligations—actual and
13In 2008, we analyzed 83 disaster declarations to determine the reliability of FEMA’s projections. We found that after the declarations had been open for 6 months, FEMA’s projections were within roughly 10 percent of the amount that was ultimately obligated. While the results could not be generalized across all disaster declarations, the analysis provides valuable insight into the reliability of FEMA’s projections after a declaration has been open for 6 months. As our projections data were as of April 30, 2012, all open disaster declarations from fiscal years 2004 through 2011 had been open for at least 6 months. Thus, we believe the projections are reliable for purposes of this report. Our 2008 analysis can be found within GAO, Disaster Cost Estimates: FEMA Can Improve Its Learning from Past Experience and Management of Disaster-Related Resources, GAO-08-301 (Washington, D.C.: February 2008). 14The administrative costs that we identify in this report were defined by FEMA as obligations from the DRF that support the delivery of disaster assistance.

Page 7 GAO-12-838 Federal Disaster Assistance
estimated—for the entire time period that disaster declarations were in the following three levels of status: programmatically open, closed, and reconciled.15
We conducted this performance audit from July 2011 through September 2012 in accordance with generally accepted government auditing standards.
To assess the reliability of these data, we reviewed the data that FEMA officials provided and discussed data quality control procedures with them. We determined that the DRF data were sufficiently reliable for the purposes of this report. To determine what actions FEMA is taking, if any, to reduce the costs of delivering disaster assistance, we reviewed relevant FEMA documents and briefings, and interviewed FEMA officials.
16
Those standards require that we plan and perform the audit to obtain sufficient, appropriate evidence to provide a reasonable basis for our findings and conclusions based on our audit objectives. We believe that the evidence obtained provides a reasonable basis for our findings and conclusions based on our audit objectives. For more information on our scope and methodology, see appendix II.
The Robert T. Stafford Disaster Relief and Emergency Assistance Act (Stafford Act), as amended, established the basic process for states to request a presidential disaster declaration.17
15According to FEMA officials, administrative costs are typically higher as a percentage of assistance costs in the early months following a disaster, with the administrative cost percentage typically decreasing as the declaration matures. Thus, administrative costs for declarations with ongoing assistance, particularly recently declared disasters, could overstate final administrative costs as a percentage of total disaster assistance obligations. FEMA has three levels of status for disaster declarations—programmatically open, closed, and reconciled. Programmatically open means that all financial decisions are not completed and eligible work remains. Closed means that financial decisions have been made, but all projects are not complete. Reconciled means that all projects are complete and the FEMA-state agreement is closed.
The act also generally defines the federal government’s role during the response and recovery after a disaster and establishes the programs and process through which the federal government provides disaster assistance to state and local
16During this time, we reported preliminary observations on opportunities to reduce the costs to the federal government related to major disaster declarations. See GAO-12-342SP. 321-328. 1742 U.S.C. § 5170.
Background

Page 8 GAO-12-838 Federal Disaster Assistance
governments, tribes, and certain nonprofit organizations and individuals.18
FEMA’s disaster declarations process is implemented by FEMA headquarters as well as its 10 regional offices. FEMA’s Administrator, in accordance with the Post-Katrina Emergency Management Reform Act of 2006 (Post-Katrina Act), appoints a Regional Administrator to head each regional office.
In addition to its central role in recommending to the President whether to declare a disaster, FEMA has primary responsibility for coordinating the federal response when a disaster is declared as well as recovery, which typically consists of providing grants to assist state and local governments and certain private nonprofit organizations to alleviate the damage resulting from such disasters.
19 Regional Administrators—in partnership with state, local, and tribal governments, and other nongovernmental organizations—oversee emergency management activities within their respective geographical area.20 Joint Field Offices (JFO) are temporary FEMA offices established to respond to declared disasters and are headed by Federal Coordinating Officers (FCO) who, among other things, coordinate the activities of the disaster reserve workforce deployed for a particular disaster. Once a disaster is declared, FEMA deploys Disaster Assistance Employees and any other employees needed to the affected jurisdiction(s).21
FEMA provides assistance through the PA, IA, and Hazard Mitigation programs as well as through Mission Assignments. For instance, some declarations may provide grants only for IA and others only for PA. Hazard Mitigation grants, on the other hand, are available for all declarations if the affected area has a FEMA-approved Hazard Mitigation plan.
1842 U.S.C. § 5121 et seq. 196 U.S.C. § 317. 20“Emergency management” is defined as the managerial function charged with creating the framework within which communities reduce vulnerability to hazards and cope with disasters. 21Disaster Assistance Employees are a cadre of temporary reserve staff who go to field locations to help communities respond to and recover from disasters.

Page 9 GAO-12-838 Federal Disaster Assistance
According to FEMA, the agency is evolving from originally focusing on grants management to being an organization implementing increasingly more complex programs, with an increasingly sophisticated and specialized workforce and procedures in response to changing circumstances and expectations. As illustrated by figure 1, the number of disaster declarations has significantly increased since 1953, when the first presidential disaster declaration was issued.22
22The first presidential disaster declaration was issued in 1953 under the authority of the Disaster Relief Act of 1950. Pub. L. No. 81-875, 64 Stat. 1109.
See appendix I for more information about the number of disaster declarations.
The Changing Disaster Declaration Environment

Page 10 GAO-12-838 Federal Disaster Assistance
Figure 1: Number of Disaster Declarations during Fiscal Years 1953 through 2011
Various factors have contributed to the increase in disaster declarations. Population growth has occurred in U.S. geographic areas that are vulnerable when a disaster hits, such as those near coastlines. FEMA officials also cited more active weather patterns as a factor. FEMA

Page 11 GAO-12-838 Federal Disaster Assistance
guidance to states and localities and the enhanced capabilities and professionalization of state and local emergency management personnel have also been factors. For example, in 1999, FEMA published a list of factors that it considers when evaluating disaster declaration requests. According to FEMA and state emergency management officials from two states, the guidance, along with state and local emergency management officials’ additional knowledge about the process and the enhanced transparency of the process for federal disaster declarations, has helped state and local officials better justify a request for federal disaster assistance. Increased media attention on disasters, especially those in which there have been casualties or deaths, has also been a factor, according to FEMA and state emergency management officials for two states.
The disaster assistance process generally starts at the local level, proceeds to the county and state levels, and then to the federal level. The Stafford Act states that the governor of the affected state shall request a declaration by the President that a disaster exists.23 FEMA is the primary federal disaster assistance agency, but others can have major roles, such as the U.S. Army Corps of Engineers, which can provide engineering and contracting support to FEMA.24
As part of the request to the President, a governor must affirm that the state’s emergency plan has been implemented and the situation is of such severity and magnitude that effective response is beyond the capabilities of the state and the affected local governments and that federal assistance is necessary, among other things.
25
2342 U.S.C. § 5170. In addition to issuing major disaster declarations, the President may issue emergency declarations. If the President declares an emergency, the federal government may provide immediate and short-term assistance that is necessary to save lives, protect property and public health and safety, or lessen or avert the threat of a catastrophe, among other things. 42 U.S.C. § 5192. Federal assistance may not exceed $5 million under an emergency declaration unless continued emergency assistance is immediately required; there is a continuing and immediate risk to lives, property, public health or safety; and necessary assistance will not otherwise be provided on a timely basis. 42 U.S.C. § 5193.
Before a governor
24Federal agencies may provide assistance under Titles IV and V of the Stafford Act only upon a presidential declaration, but some federal agencies may respond to disasters under separate authorities. 2544 C.F.R. § 206.36.
Disaster Declaration Process

Page 12 GAO-12-838 Federal Disaster Assistance
asks for federal disaster assistance, state and local officials typically conduct an initial PDA to identify the amount of damage and determine if the damage exceeds their capability to respond and recover without federal assistance. Based on the initial PDA findings, a joint PDA, in which FEMA participates, may be requested by the governor.26 FEMA uses the joint PDA in its evaluation of the state’s need for federal assistance and makes a recommendation to the President as to whether the request for a disaster declaration should be approved or denied. Later in this report, we discuss in more detail how FEMA evaluates the need for PA. To evaluate the need for IA, FEMA considers various factors, including insurance coverage; the extent to which volunteer agencies and state or local programs can meet the needs of disaster victims; concentration of damages due to the disaster; number of deaths and injuries; amount of disruption to normal community services; amount of emergency needs, such as extended or widespread loss of power or water; and special populations, such as elderly or low-income people.27 Figure 2 shows the basic process that is followed from the time a disaster occurs until the President approves or denies a governor’s disaster declaration request.28
26The requirement for a joint PDA may be waived for those incidents of unusual severity and magnitude that do not require field damage assessments to determine the need for supplemental federal assistance or in other instances as determined by the Regional Administrator upon consultation with the state. 44 C.F.R. § 206.33.
2744 C.F.R. § 206.48(b). 28In November 2009, FEMA implemented a new policy for disaster declarations for snowstorms. Prior to that, snowstorms were only declared as emergencies. The process for snowstorms is the same as that used for other types of disasters; however, a disaster declaration resulting from a snowstorm requires record or near-record snowfall—within 10 percent of a county’s record snowfall as measured in inches. Covered costs for snowstorms include sanding, salting, de-icing, and removing snow.

Page 13 GAO-12-838 Federal Disaster Assistance
Figure 2: Disaster Declaration Process

Page 14 GAO-12-838 Federal Disaster Assistance
During this period, FEMA received 629 disaster declaration requests and approved 539 of them. Most disaster declarations were for severe storms. FEMA anticipates that when all disasters declared during fiscal years 2004 through 2011 are closed, its total obligations for these disasters will exceed $90 billion.
The President received requests from governors during fiscal years 2004 through 2011 for 629 disaster declarations and approved 539 of them, or 86 percent, as shown in table 1.
Table 1: Number of Disaster Declarations Requested and Approved during Fiscal Years 2004 through 2011
Fiscal year Number requested Number approved Percentage approved 2004 76 65 86 2005 55 45a 82 2006 67 53 79 2007 78 68 87 2008 79 68 86 2009 72 63 88 2010 90 79 88 2011 112 98 88 Total 629 539 86
Source: GAO analysis of FEMA data. aDespite the amount of destruction wrought by Hurricane Katrina in fiscal year 2005, only 4 of the 45 disaster declarations were associated with Hurricane Katrina—1 declaration each in Florida, Alabama, Mississippi, and Louisiana.
Governors can appeal a decision when the President initially denies a disaster declaration request.29
2944 C.F.R. § 206.46.
During fiscal years 2004 through 2011, governors made 629 requests for disaster declarations, and the President ultimately denied 90 of them, or 14 percent.
Over 500 Disasters Were Declared during Fiscal Years 2004 through 2011 with Total Obligations of Over $90 Billion Anticipated
Most Declarations for Severe Storms, Highest in Southeast and Central Midwest

Page 15 GAO-12-838 Federal Disaster Assistance
FEMA has 10 regions throughout the United States that, among other things, provide technical assistance to state and local officials and make recommendations to FEMA headquarters as to whether a disaster declaration is warranted. Individual FEMA regions had varying numbers of disaster declarations during fiscal years 2004 through 2011. The two FEMA regions that had the most disaster declarations were Region IV in the Southeast and Region VII in the central Midwest, which together accounted for 163, or 30 percent, of the 539 declarations. The two FEMA regions that had the fewest declarations were Regions IX and X along the west coast, including Alaska, which together accounted for 71 declarations, or 13 percent. See appendix I, figure 10, for a map that shows the number of declarations by FEMA region.
During fiscal years 2004 through 2011, the average number of disaster declarations was 9.3 for each of the 58 jurisdictions—that is, the 50 states, the District of Columbia, 5 territories, and 2 Freely Associated States.30 However, our analysis shows that some jurisdictions had over 20 disaster declarations, while other jurisdictions had 3 or fewer disaster declarations during this period. For example, Oklahoma had the most disaster declarations at 25, while Colorado and Guam had 1 each and the Marshall Islands did not have any. In addition, the 5 jurisdictions with the highest number of disaster declarations accounted for 105, or 19 percent, of the 539 declarations during fiscal years 2004 through 2011, whereas the 4 jurisdictions with the lowest number of disaster declarations accounted for 4, or less than 1 percent.31
30The 5 territories are American Samoa, Guam, the U.S. Virgin Islands, the Commonwealth of the Northern Mariana Islands, and the Commonwealth of Puerto Rico. The 2 Freely Associated States are the Federated States of Micronesia and the Republic of the Marshall Islands.
See figure 3 for the number of disaster declarations for each jurisdiction.
31For the analysis of the jurisdictions with the lowest number of disaster declarations during fiscal years 2004 through 2011, we report on 4 jurisdictions because 6 jurisdictions tied for the fifth lowest, with 3 disaster declarations each.

Page 16 GAO-12-838 Federal Disaster Assistance
Figure 3: Number of Disaster Declarations during Fiscal Years 2004 through 2011, by Jurisdiction
Note: In addition to Pohnpei, the Federated States of Micronesia consists of three additional major island groups, including Chuuk, Yap, and Kosrae.
As reported by FEMA, severe storms accounted for 71 percent of declarations during fiscal years 2004 through 2011. According to FEMA officials, a disaster is classified as a severe storm when multiple storm-related incidents (for example, floods or heavy rains) affect a jurisdiction, but no single incident type is responsible for the majority of the damage.

Page 17 GAO-12-838 Federal Disaster Assistance
See appendix I, table 11, for the number and percentage for each of the incident types that occurred during fiscal years 2004 through 2011.
For each disaster declaration, various types of assistance can be approved. For example, the President can approve PA only, IA only, or PA and IA for each declaration. As shown in figure 4, during fiscal years 2004 through 2011, 6 percent of the declarations were awarded for IA only, while a total of 94 percent of declarations were awarded for either PA only or IA and PA.
Figure 4: Major Disaster Declarations by Type of Assistance, Fiscal Years 2004 through 2011

Page 18 GAO-12-838 Federal Disaster Assistance
Through January 31, 2012, FEMA obligated $80.3 billion, or an average of about $10 billion a year, from the DRF for 539 disasters declared during fiscal years 2004 through 2011; and FEMA anticipates that when all 539 declarations are closed, obligations will be about $91.5 billion. Thirteen of these declarations had incurred obligations of over $1 billion each.32
Almost half of the $80.3 billion in obligations was for Hurricane Katrina. Excluding obligations of $39.7 billion for Hurricane Katrina, FEMA obligated $40.6 billion for the other disaster declarations during fiscal years 2004 through 2011, or an average of about $5 billion a year. Total obligations are higher for fiscal years 2004, 2005, and 2008 than for the remaining 5 years primarily because of hurricanes that occurred with more frequency or force during those years. For example, over half of the $8.8 billion for disasters declared in fiscal year 2004 was due to four hurricanes, over half of the $44.9 billion for disasters declared in fiscal year 2005 was for Hurricane Katrina, and about half of the $10.3 billion for disasters declared in fiscal year 2008 was for Hurricanes Ike and Gustav. Table 2 shows the obligations by fiscal year.
32In addition to the $80.3 billion for the 539 disaster declarations during fiscal years 2004 through 2011, FEMA obligated funds for disaster declarations that occurred prior to fiscal year 2004 but were still receiving obligations during fiscal years 2004 through 2011. The $80.3 billion in obligations also excludes FEMA obligations for Emergency Declarations, Fire Management Assistance Grants, and non-DRF obligations of appropriated funds for FEMA and federal agencies outside of DHS, such as the Department of Defense and Department of Health and Human Services. In addition to the 13 disasters that had exceeded $1 billion in obligations, other disasters declared during fiscal years 2004 through 2011 that were still open as of January 31, 2012, could reach obligations of over $1 billion as FEMA continues to obligate funds for them.
Total Obligations of Over $90 Billion Anticipated for Disasters Declared during Fiscal Years 2004 through 2011

Page 19 GAO-12-838 Federal Disaster Assistance
Table 2: Obligations by Fiscal Year for 539 Disaster Declarations during Fiscal Years 2004 through 2011
(Dollars in millions)
Fiscal year Public
Assistance Individual
Assistance Hazard
Mitigation Mission
Assignment Administration Totala 2004 $3,725 $2,741 $435 $817 $1,077 $8,794 2005 (including Katrina)
17,770 15,529 1,431 4,143 5,993 44,867
2005 (excluding Katrina)
2,067 1,504 278 472 776 5,097
2006 2,605 633 206 151 386 3,982 2007 1,628 336 238 6 281 2,488 2008 6,116 1,880 816 157 1,394 10,364 2009 1,700 340 236 41 455 2,772 2010 1,616 828 120 6 451 3,022 2011 1,599 1,213 41 438 769 4,061 Total (including Katrina)
$36,759 $23,500 $3,522 $5,761 $10,806 $80,349a
Total (excluding Katrina)
$21,057 $9,476 $2,369 $2,090 $5,589 $40,579a
Source: GAO analysis of FEMA data.
Note: This analysis shows obligations from the DRF only and does not include any potential administrative cost expenditures from FEMA’s other annual appropriations. Also, the obligations exclude obligations by other federal agencies and state and local governments. aObligations for each year may not add up to the total obligations reported because of rounding.
Obligations for disaster declarations during fiscal years 2004 through 2011 varied greatly by FEMA region and jurisdiction. FEMA Region VI had the highest obligations at $40.0 billion. However, when excluding obligations from all FEMA regions due to Hurricane Katrina, FEMA Region IV had the highest obligations at $13.2 billion. FEMA Region X had the lowest obligations at $0.6 billion. As shown in figure 5, the amount of obligations also varied greatly by jurisdiction for disasters declared during fiscal years 2004 through 2011. For example, Louisiana had the highest obligations, at $32.3 billion, but after excluding obligations for Hurricane Katrina, Florida had the highest obligations, at $9.3 billion, while for the jurisdictions with the lowest obligations, Guam had $1.9 million and the Marshall Islands did not have any. As a comparison, the nationwide average obligations per jurisdiction were $1.38 billion, and decreased to $700 million when obligations for Hurricane Katrina were excluded. Appendix I, figure 10, shows the obligations by FEMA region for fiscal years 2004 through 2011.

Page 20 GAO-12-838 Federal Disaster Assistance
Figure 5: Disaster Relief Fund Obligations, Including Hurricane Katrina, by Jurisdiction during Fiscal Years 2004 through 2011, as of January 31, 2012
Note: For the jurisdictions that had disaster declarations for Hurricane Katrina, the obligations excluding Hurricane Katrina were Alabama, $1.4 billion; Florida, $9.3 billion; Louisiana, $3.8 billion; and Mississippi, $236 million. In addition to Pohnpei, the Federated States of Micronesia consists of three additional major island groups, including Chuuk, Yap, and Kosrae.
Furthermore, obligations for individual disaster declarations declared during fiscal years 2004 through 2011 varied greatly. For example, as of January 31, 2012, FEMA had obligated $28.5 billion for Louisiana’s fiscal year 2005 Hurricane Katrina disaster declaration compared with about

Page 21 GAO-12-838 Federal Disaster Assistance
$803,000 for a South Dakota disaster declaration during that same fiscal year. Disaster declarations can take over a decade to close; therefore, to obtain a more comprehensive and longer-term perspective, we analyzed obligations for 811 disaster declarations during fiscal years 1989 through 2011 that had been closed as of January 31, 2012.33
Table 3: Number and Percentage of Closed Disasters Declared during Fiscal Years 1989 through 2011, by Obligation Amounts as of January 31, 2012
Of the 811 closed declarations, we found that 440, or 54 percent, had obligations of less than $10 million (see table 3).
Obligations for each disaster declarationa
Number of disaster declarations Percentage of total
Less than $1 million 21 3 $1 million to less than $5 million 261 32 $5 million to less than $10 million 158 19 $10 million to less than $25 million 179 22 $25 million to less than $50 million 81 10 $50 million to less than $100 million 55 7 At least $100 million 56 7 Total 811 100
Source: GAO analysis of FEMA data. aObligations include the funds obligated by FEMA from the DRF and exclude obligations by other federal agencies and state and local governments. These amounts are not in constant, inflation-adjusted dollars, because the data were not detailed enough to identify the specific year an obligation was made.
For those disaster declarations approved during fiscal years 2004 through 2011, we analyzed the total obligations as of April 30, 2012, for closed disasters, and the total projected obligations—actual to date and estimated—for those declarations that remained open as of April 30, 2012.34
33We analyzed reconciled and closed disaster declarations because all financial decisions have been made for these declarations.
Specifically, for open declarations as of April 30, 2012, instead of analyzing how much FEMA had obligated as of that date, we analyzed
34Throughout this report, projected obligations refers to the actual amount obligated by FEMA as of April 30, 2012, plus the amount FEMA anticipates obligating between April 30, 2012, and the date a disaster declaration is ultimately reconciled. The information we analyzed included projections data for each declaration approved during fiscal years 1989 through 2011; however, the results within table 4 only focus on fiscal years 2004 to 2011.

Page 22 GAO-12-838 Federal Disaster Assistance
the amount FEMA had obligated plus the amount FEMA anticipated it would obligate from the time a declaration was approved through its closure. On the basis of our analysis, when all 539 declarations that were declared during fiscal years 2004 through 2011 are eventually closed, FEMA anticipates that 193, or 36 percent, will have total obligations of less than $10 million, thus signifying that these were relatively small disasters (see table 4).
Table 4: Number and Percentage of Disasters Declared during Fiscal Years 2004 through 2011, by Combined Actual and Projected Total Obligation Amounts, as of April 30, 2012
Obligations for each disaster declarationa
Number of disaster declarations
Percentage of total
Less than $1 million 5 1 $1 million to less than $5 million 99 18 $5 million to less than $10 million 89 17 $10 million to less than $25 million 140 26 $25 million to less than $50 million 76 14 $50 million to less than $100 million 55 10 At least $100 million 75 14 Total 539 100
Source: GAO analysis of FEMA data. aObligations include the funds obligated by FEMA from the DRF and exclude obligations by other federal agencies and state and local governments. These amounts are not in constant, inflation-adjusted dollars, because the data were not detailed enough to identify the specific year an obligation was made.
The per capita damage indicator FEMA uses to assess a jurisdiction’s eligibility for PA is the primary factor on which disaster declaration decisions are based. However, the per capita damage indicator is artificially low. In addition, FEMA’s process to determine eligibility for federal assistance does not comprehensively assess a jurisdiction’s capability to respond to and recover from a disaster on its own.
Eligibility for Assistance Is Primarily Determined Using a Damage Estimate Indicator

Page 23 GAO-12-838 Federal Disaster Assistance
According to FEMA and state emergency management officials, FEMA has primarily relied on a single indicator, the statewide per capita damage indicator, to determine whether to recommend that a jurisdiction receive PA funding. In fiscal year 2012, the per capita indicator is $1.35.35 Thus, a state with 10 million people would generally have to incur $13.5 million in estimated eligible disaster damages to public structures for FEMA to recommend that a disaster declaration for PA is warranted.36 However, other factors could also influence the recommendation, such as whether a jurisdiction has incurred multiple disasters within a short period of time. Of the 58 jurisdictions for fiscal year 2012, based on population, California has the highest statewide indicator total, at $50.3 million, while Wyoming has the lowest amount at $760,895.37
FEMA’s method to determine the affected jurisdictions’ capabilities to respond without federal assistance relies on a governor’s certification and damage estimates. The Stafford Act requires that a governor’s request for a disaster declaration be based on a finding that the disaster is of such severity and magnitude that an effective response is beyond the capabilities of the jurisdiction and that federal assistance is necessary.
See appendix III, table 15, for the total PA per capita indicator amounts for each of the 58 jurisdictions.
38 FEMA officials stated that governors must certify in their letter to the President requesting a disaster declaration that the disaster is beyond the capabilities of the jurisdiction. FEMA regulations list quantitative and qualitative factors, such as recent disasters within the same jurisdiction that the agency considers when determining whether a disaster declaration is warranted.39
3576 Fed. Reg. 63,936 (Oct. 14, 2011).
However, in describing the declarations process, FEMA and emergency management officials in two states said that FEMA uses the statewide per capita indicator as the primary
36In addition to using a PA indicator for states, FEMA uses a PA indicator for counties to help determine a county’s need for assistance. The countywide per capita indicator for fiscal year 2012 is $3.39. 76 Fed. Reg. 63,936 (Oct. 14, 2011). 37FEMA has established a minimum threshold of $1 million in PA damages per disaster in the belief that even the lowest population states can cover this level of public assistance damage. 44 C.F.R. § 206.48(a)(1). 3842 U.S.C. § 5170. In this report, we consider a state’s capabilities to respond to and recover from a disaster to include elements such as the fiscal capacity and preparedness of the state. 3944 C.F.R. § 206.48.
FEMA Relies Almost Exclusively on a Single Indicator

Page 24 GAO-12-838 Federal Disaster Assistance
determining factor for PA funding. This damage indicator, which FEMA has used since 1986, is essentially a proxy fiscal measure of a state’s capacity to respond to and recover from a disaster, rather than a more comprehensive assessment of a state’s fiscal capacity.
According to our analysis of readily available indicator data, as well as officials in two FEMA regions and state emergency management officials in two states, the principal factor used to determine eligibility for a disaster declaration was whether the damage estimate exceeded the PA per capita indicator. Our analysis of 246 disaster declarations during fiscal years 2008 through 2011 identified the PA per capita indicator as having been the primary determining factor—essentially being used as an eligibility threshold.40 Specifically, 244 of the 246 approved disaster declarations that we reviewed, or 99 percent, had PA damage estimates that met or exceeded the PA per capita indicator in effect in the year in which the disaster was declared.41
Seven gubernatorial requests for a disaster declaration during fiscal years 2008 through 2011 had a damage estimate higher than the PA per capita indicator yet were denied for various reasons, such as the damage being a result of multiple storms or the normal depreciation of structures rather than a single disaster.
Because FEMA’s current per capita indicator does not reflect the rise in (1) per capita personal income since it was created in 1986 or (2) inflation from 1986 to 1999, the indicator is artificially low. In 1986, FEMA proposed a $1.00 per capita indicator for PA as a means of gauging a jurisdiction’s fiscal capacity.42
40The Stafford Act prohibits a geographic area from being precluded from receiving assistance solely by virtue of an arithmetic formula or sliding scale based on income or population. 42 U.S.C. § 5163. We only reviewed FEMA’s PDA summaries as far back as fiscal year 2008 because that is when FEMA began maintaining them in electronic format. For each of the 308 disaster declarations during fiscal years 2008 through 2011, we reviewed the PDA summary to determine whether a governor requested PA and the President approved PA, and whether the PA damage estimate met or exceeded the PA per capita indicator. Of the 308 PDA summaries, 246 of them included the data necessary to determine whether the PA damage estimate met or exceeded the PA per capita indicator.
The indicator was based on the 1983 per capita personal income nationwide, then estimated at $11,667. Current
41As discussed later in this report, the PA per capita indicator remained at $1.00 from 1986 through 1999 and has been adjusted for inflation on an annual basis since 2000. 4251 Fed. Reg. 13,332 (Apr. 18, 1986).
FEMA’s Per Capita Indicator Used to Assess Eligibility Is Artificially Low

Page 25 GAO-12-838 Federal Disaster Assistance
FEMA officials were unable to explain how per capita personal income was used to establish the indicator level at $1.00. However, FEMA documentation noted that the agency thought it reasonable that a state would be capable of providing $1.00 for each resident of that state to cover the damage from a disaster. While the proposed rule was not codified in 1986, FEMA began to use the $1.00 per capita indicator informally as part of its preliminary damage assessment efforts and did not adjust the indicator annually for either inflation or increases in national per capita income. In 1998, FEMA considered adjusting the PA indicator to $1.51 to account for inflation since 1986, but because of input from state emergency management officials, FEMA decided not to do so.
In 1999, FEMA issued a rule codifying the per capita indicator at $1.00, which was stipulated to include an annual adjustment for inflation, but the rule was silent on whether the indicator would continue to be based on nationwide per capita personal income.43
4364 Fed. Reg. 47,697 (Sept. 1, 1999).
As a result, the indicator has risen 35 percent from $1.00 to $1.35 in the 13 years since FEMA began its annual inflationary adjustments. Figure 6 shows the actual increases in the per capita indicator for PA from 1986 to 2010 compared with the increases that would have occurred if FEMA had adjusted the indicator for inflation or the increase in per capita personal income during this period.

Page 26 GAO-12-838 Federal Disaster Assistance
Figure 6: Comparison of Actual Public Assistance Per Capita Indicator with the Indicators if They Had Been Adjusted for Increases in Personal Income and Inflation, 1986 through 2011
FEMA officials stated that the rise in construction and other costs to respond to and recover from disasters have outpaced the rise in the per capita indicator. In jurisdictions with smaller populations, damage to a single building or facility, such as a water treatment facility, could result in a damage estimate sufficient to meet the per capita damage threshold and warrant a disaster declaration. For example, the damage from Hurricane Katrina to a single water treatment facility in Carrollton, Louisiana, exceeded Louisiana’s 2005 per capita threshold.44
44The Carrollton, Louisiana, water treatment facility was eligible for and did receive PA funding.
In addition, the Washington National Cathedral incurred approximately $15 million of damage during the August 23, 2011, earthquake in Washington, D.C.,

Page 27 GAO-12-838 Federal Disaster Assistance
which has a per capita damage indicator threshold of less than $1 million.45
The Stafford Act requires that conditions due to a disaster be beyond a jurisdiction’s (state and local) capability to respond effectively before disaster assistance from the federal government is warranted.
46 The law, however, prohibits FEMA from denying federal assistance solely by virtue of an arithmetic formula or sliding scale based on income or population.47 According to Standards for Internal Control in the Federal Government, activities should be established to monitor indicators and controls should be aimed at validating the propriety and integrity of such indicators.48
Our analysis of actual and projected obligations for 508 disaster declarations in which PA was awarded during fiscal years 2004 through 2011 showed that fewer disasters would have met either the personal income-adjusted or the inflation-adjusted PA per capita indicators for the years in which the disaster was declared.
Had the indicator been adjusted for inflation beginning when FEMA started using it in 1986, the indicator would have risen more than 100 percent, from $1.00 to $2.07 in 2012. Had the indicator been adjusted for increases in per capita personal income since 1986, the indicator would have risen over 250 percent, from $1.00 to $3.57 in 2011, based on 2011 national per capita personal income of $41,663.
49
45FEMA determined that the National Cathedral was not eligible for PA; therefore the damage estimate was not included in the PDA and the cathedral was not eligible to receive PA funds. The epicenter of the earthquake was in Virginia.
Specifically, our analysis showed that 44 percent of the 508 disaster declarations would not have met the PA per capita indicator if adjusted for the change in per capita personal income since 1986. Similarly, our analysis showed that 25 percent
4642 U.S.C. § 5170. 4742 U.S.C. § 5163. 48GAO/AIMD-00-21.3.1. 49Our analysis included FEMA’s projected obligations as of April 30, 2012, for only those 508 disaster declarations that had received PA and had been declared during fiscal years 2004 through 2011. We did not analyze the 31 disaster declarations that received IA only. We analyzed obligations instead of PDA damage estimates for PA because FEMA officials stated that estimating the damage from a disaster is sometimes stopped when the estimate equals or exceeds the PA per capita indicator. Therefore, we concluded that conducting the analysis using projected obligations would be more accurate than using incomplete PDA damage estimates for PA.

Page 28 GAO-12-838 Federal Disaster Assistance
of the 508 disaster declarations would not have met the PA per capita indicator if adjusted for inflation since 1986.50 Thus, had the indicator been adjusted annually since 1986 for personal income or inflation, fewer jurisdictions would have met the eligibility criteria that FEMA primarily used to determine whether federal assistance should be provided, which would have likely resulted in fewer disaster declarations.51
In discussions with FEMA officials about raising the per capita damage indicator, they noted that updating the indicator completely in a single year could create problems for jurisdictions, which, in response, may need to increase their rainy day fund or take other actions to adjust to the change. However, FEMA officials stated that adjusting the indicator in a phased approach over several years would be more feasible for jurisdictions. The current annual inflation adjustment generally increases the damage indicator incrementally. However, were the “catch-up” inflation adjustment (from $1.35 to $2.07) implemented in a single year, the increase would be considerably more than the annual inflation adjustments since 1999. For example, for a jurisdiction with a population of 5 million, fully implementing the catch-up adjustment for inflation would raise the damage indicator from $6.75 million to $10.35 million. Adjusting the indicator in phases over several years could help FEMA examine future requests for disaster declarations in a manner that reflects changes in per capita income or inflation since 1986 and provide jurisdictions more time to plan for and adjust to the change.
50In addition to our analysis of the 508 disaster declarations, we separately analyzed 144 of the 508 declarations wherein all financial decisions had been made as of January 31, 2012. Thus, we relied on actual obligations rather than projections to conduct the analysis. Our analysis of the 144 declarations showed that fewer disasters would have met either the personal income-adjusted or the inflation-adjusted PA per capita indicators for the years in which the disasters were declared. Specifically, our analysis showed that 49 percent of the 144 disaster declarations would not have met the PA per capita indicator if adjusted for the change in per capita personal income since 1986. Similarly, 31 percent of the 144 disaster declarations would not have met the PA per capita indicator if adjusted for inflation since 1986. 51In May 2012, the DHS Office of Inspector General reached a similar conclusion based on its analysis that, if FEMA had continually updated the indicator for changes in economic conditions, many recent disasters would not have met the financial statewide per capita indicator for federal assistance. See DHS Office of Inspector General, Opportunities to Improve FEMA’s Public Assistance Preliminary Damage Assessment Process, OIG-12-709 (Washington, D.C.: May 2, 2012).

Page 29 GAO-12-838 Federal Disaster Assistance
Reliance on the PA per capita indicator to determine a jurisdiction’s eligibility for federal assistance—whether the indicator is artificially low or adjusted for increases in personal income or inflation—does not provide an accurate measure of a jurisdiction’s capability to respond to or recover from a disaster without federal assistance. Determining a jurisdiction’s fiscal capacity is important because a jurisdiction with greater resources should be able to more easily recover in the aftermath of a disaster than a jurisdiction with fewer resources. Further, a jurisdiction’s fiscal capacity is an important component of the jurisdiction’s overall response and recovery capability.
In 1999, when the rule was codified to set the per capita indicator at $1.00, FEMA stated that it recognized that a straight per capita figure may not be the best measurement of a state’s capability, but that it provided a simple, clear, consistent, and long-standing means of measuring the severity, magnitude, and impact of a disaster while at the same time ensuring that the President can respond quickly and effectively to a governor’s request for assistance.52 As we reported in 2001, per capita personal income is a relatively poor indicator of a jurisdiction’s fiscal capacity because it does not comprehensively measure all income potentially subject to jurisdiction taxation and is not necessarily indicative of jurisdiction or local capability to respond effectively without federal assistance.53
5264 Fed. Reg. at 47,697 (Sept. 1, 1999); 64 Fed. Reg. 3910, 3911 (Jan. 26, 1999).
For example, it does not include income produced in a jurisdiction unless it is received as income by a jurisdiction resident. Thus, profits retained by corporations for business investment, though potentially subject to jurisdiction taxation, are not included in a jurisdiction per capita income measure because they do not represent income received by jurisdiction residents. In 2001, we recommended that FEMA consider alternative criteria. FEMA’s response noted that we provided valuable input for the FEMA team that was reviewing the disaster declaration process and the criteria used to assess jurisdiction damages. According to FEMA, in 2001, the President’s budget for fiscal year 2002 included a provision for the development of improved guidelines for disaster assistance that provided jurisdictions with meaningful criteria that must be met to become eligible for federal disaster assistance. FEMA undertook a review of disaster declaration guidelines; however, no
53GAO-01-837.
FEMA’s Eligibility Process Does Not Comprehensively Assess a Jurisdiction’s Capability to Respond and Recover

Page 30 GAO-12-838 Federal Disaster Assistance
changes to the established declaration guidelines were adopted, and ultimately, FEMA did not change its reliance on the per capita indicator.
The Post-Katrina Act required FEMA to develop a set of preparedness metrics that could be used to assess operational preparedness capability.54
Without an established means of assessing jurisdiction response and recovery capability, FEMA has continued to rely primarily on the per capita damage indicator when determining whether a disaster declaration is warranted. The National Preparedness Goal, released in September 2011, identifies 31 core capabilities and targets. Further, FEMA officials stated that jurisdictions provided reports to FEMA on their preparedness, including their core capabilities, on December 31, 2011. According to FEMA, the state preparedness reports resulted in up to 155 individual measures to track residual capability gaps, the results of which are reported by core capability in the annual National Preparedness Report. These core capabilities are the latest evolution of the Target Capabilities List.
Also, Presidential Policy Directive-8 (PPD-8), issued in March 2011, required the Secretary of Homeland Security to develop a national preparedness system to, in part, define existing capabilities and capability gaps, and drive investments to close those gaps across the nation’s federal, state, local, tribal, and territorial governments. Much of the growth in disaster declarations has occurred at the same time (that is, since the terrorist attacks of September 11, 2001) that the federal government has provided more than $37 billion to state and local governments to enhance their preparedness to protect against, respond to, and recover from disasters of all types. However, FEMA has not yet finished developing metrics to assess state preparedness capability, a fact that limits its ability to comprehensively assess jurisdictions’ disaster preparedness and capabilities.
55
546 U.S.C. § 749.
While the preliminary core capability targets provide a basis for jurisdictions to understand the core capabilities, FEMA has not yet developed national preparedness capability requirements based on established metrics for the core capabilities at the state and local levels—as called for in the Post-Katrina Act and PPD-8. In addition, according to
55GAO, Federal Emergency Management Agency: Continuing Challenges Impede Progress in Managing Preparedness Grants and Assessing National Capabilities, GAO-12-526T (Washington, D.C.: Mar. 20, 2012).
Page 31 GAO-12-838 Federal Disaster Assistance
FEMA officials, FEMA does not have any plans or policies in place to use preparedness data to inform its recommendations regarding presidential disaster declarations. Metrics to assess a jurisdiction’s disaster preparedness and capabilities could augment the PA per capita indicator, and other relevant information, to provide a more comprehensive understanding of a jurisdiction’s capacity to respond to and recover from a disaster without federal assistance.
The 2011 state preparedness reports provide some potentially useful information to understand a state’s response capabilities. However, FEMA does not use these reports or an assessment of a jurisdiction’s response capabilities to determine eligibility for disaster assistance, and the FEMA Administrator stated that state and local governments are capable of handling much of the workload related to responding to a declared disaster, which has allowed FEMA to mostly focus on recovery efforts.56
As we previously reported and continue to believe, Total Taxable Resources (TTR), a measure developed by the U.S. Department of the Treasury, provides a more comprehensive measure of a jurisdiction’s fiscal capacity than FEMA’s current PA indicator.
Recovery refers to efforts aimed at restoring an area to its prior status, including the reconstruction of damaged structures, including its housing stock, business establishments, public facilities, and the environment. The availability of funds is critical to these efforts; however, FEMA does not conduct an assessment of a jurisdiction’s fiscal capacity to fund a recovery effort without federal assistance before determining whether to award federal assistance.
57
56The Honorable W. Craig Fugate, FEMA Administrator, Testimony before the House of Representatives, Committee on Appropriations Subcommittee on Homeland Security, Budget Hearing–Federal Emergency Management Agency–Director and State and Local Witnesses, March 7, 2012.
For example, TTR includes much of the business income that does not become part of the income flow to jurisdiction residents, undistributed corporate profits, and rents and interest payments made by businesses to out-of-jurisdiction real estate owners and lenders. In the case of FEMA’s PA program, adjustments for TTR in setting the threshold for a disaster declaration could result in a more realistic estimate of a jurisdiction’s ability to respond to a disaster. Furthermore, since TTR provides estimates of each
57GAO-01-837.

Page 32 GAO-12-838 Federal Disaster Assistance
jurisdiction’s fiscal capacity, adjustments for TTR growth would vary by jurisdiction. FEMA could also use other measures of fiscal capacity, such as state personal income or gross state product, to more accurately determine a jurisdiction’s ability to pay for damages to public structures without federal assistance.58
Table 5: Three Potential Approaches to Measure a Jurisdiction’s Fiscal Capacity
Table 5 describes three potential approaches to measure a jurisdiction’s fiscal capacity. Federal departments and agencies have used some of these approaches to help determine a jurisdiction’s fiscal capacity and the extent to which a jurisdiction should be eligible for federal assistance. For example, the Department of Health and Human Services’ Substance Abuse and Mental Health Services Administration’s block grant program and Community Mental Health Service use TTR. Also, personal income is used by many federal grant programs.
Potential approach Description State Personal Income Personal income is the income received by all persons
from all sources. Personal income is the sum of net earnings by place of residence, property income, and personal current transfer receipts.a
Gross State Product (GSP) Also known as Gross Domestic Product by state, GSP is the state counterpart of the nation’s gross domestic product (GDP), the Bureau of Economic Analysis’ featured and most comprehensive measure of U.S. economic activity. GDP by state is derived as the sum of the GDP originating in all the industries in a state.b
Total Taxable Resources TTR is the unduplicated sum of the income flows produced within a state (GSP) and the income flows received by its residents (personal resident income) that a state can potentially tax. TTR does not consider the actual fiscal choices made by states. It measures all income flows a state can potentially tax.c
Source: GAO analysis of Bureau of Economic Analysis and U.S. Department of Treasury data. ahttp://www.bea.gov/newsreleases/regional/spi/sqpi_newsrelease.htm, bhttp://www.bea.gov/newsreleases/regional/gdp_state/gsp_newsrelease.htm, and chttp://www.treasury.gov/resource-center/economic-policy/taxable-resources/Pages/Total-Taxable-Resources.aspx.
58In addition to TTR, personal resident income, and gross state product, Representative Tax System is a measure of fiscal capacity. However, we did not include it as a potential means for FEMA to assess fiscal capacity because it is not currently calculated for U.S. jurisdictions, although it could be should FEMA choose to do so.

Page 33 GAO-12-838 Federal Disaster Assistance
Without an accurate assessment of a jurisdiction’s capabilities to respond to and recover from a disaster without federal assistance, including a jurisdiction’s preparedness capabilities and fiscal capacity, FEMA runs the risk of recommending that the President award federal assistance to jurisdictions that have the capability to respond and recover on their own. Reexamining the basis for the PA indicator and the usefulness of preparedness metrics and jurisdiction fiscal capacity could help FEMA more accurately determine whether a jurisdiction should be eligible for federal assistance. In appendix IV, we provide additional information about the three approaches to measure a jurisdiction’s fiscal capacity as well as examples of how these fiscal measures could assist FEMA in more accurately determining whether the magnitude of damage is beyond the capacity of the jurisdiction.
According to the Stafford Act, the usual cost share arrangement for disaster declarations calls for the federal government to pay not less than 75 percent of the eligible PA costs of a disaster and nonfederal entities (that is, state and local governments) to pay the remaining 25 percent; at a governor’s request, the President can adjust this cost share.59
Governors can request that the President reduce the 25 percent cost share for nonfederal governments to 10 percent or 0 percent.
FEMA has specific criteria to evaluate a request to adjust the federal share from 75 percent to 90 percent, but does not have specific criteria to evaluate a request to adjust the federal share to 100 percent. Adjusting the federal share to 100 percent is typically done for emergency work such as life- saving activities and debris removal projects through FEMA’s PA program. In addition, FEMA does not know the additional costs (that is, the costs of paying an additional 15 or 25 percent) associated with either type of cost share adjustment because the agency does not track these costs.
60
5942 U.S.C. §§ 5170b(b), 5172(b), 5173(d). Generally, there is no nonfederal share for IA (FEMA’s Other Needs Assistance program does require a cost share). 42 U.S.C. § 5174(g).
FEMA generally
6044 C.F.R. § 206.47. Instead of jurisdictions paying cash for their 25 percent or 10 percent share of eligible PA costs, they can use in-kind donations. According to FEMA, donated resources used on eligible work that is essential to meet immediate threats to life and property resulting from a major disaster may be credited toward the nonfederal cost share. For example, donated resources may include volunteer labor, equipment, materials, food, and shelter.
FEMA Does Not Have Specific Criteria to Evaluate Some Cost Share Adjustment Requests and Does Not Track Additional Costs for All Adjustments

Page 34 GAO-12-838 Federal Disaster Assistance
follows the same process to evaluate a request from a governor for a cost share adjustment as it follows to evaluate a request for a disaster declaration, according to FEMA officials. FEMA makes a recommendation to the President as to whether the request for a cost share adjustment should be approved or denied and the President makes the decision.
For the 539 disaster declarations during fiscal years 2004 through 2011, governors requested that the President adjust the usual federal/nonfederal (that is, state and local government) cost share 150 times. As shown in table 6, 109 of the 150 requests, or 73 percent, were approved during this period. However, 23 of the 109 cost share adjustments were required by provisions in law; therefore, FEMA’s recommendation was not a factor in whether these cost share adjustment requests were approved or denied.61 For example, 10 of the 23 cost share adjustments required by law were for Hurricanes Katrina, Wilma, Dennis, and Rita.62
Table 6: Number of Cost Share Adjustments Requested and Approved, Fiscal Years 2004 through 2011
Fiscal year Number requested Number approved Percent approved 2004 29 22 76 2005 46 42 91 2006 7 5 71 2007 9 3 33 2008 23 17 74 2009 15 7 47 2010 9 6 67 2011 12 7 58 Total 150 109 73
Source: GAO analysis of FEMA data.
61 Excluding the 23 legislatively required cost share adjustments from the 150 total requests means that FEMA’s recommendation was a factor in 127 of the requested cost share adjustments. The President approved 86 of the 127 cost share adjustment requests, or 68 percent. 62 See, e.g., Pub. L. No. 110-28, § 4501, 121 Stat. 112, 156 (2007) (“… the Federal share of assistance, including direct Federal assistance, provided for the States of Alabama, Florida, Louisiana, Mississippi, and Texas in connection with Hurricanes Katrina, Wilma, Dennis, and Rita under sections 403, 406, 407, and 408 of the Robert T. Stafford Disaster Relief and Emergency Assistance Act… shall be 100 percent of the eligible costs under such sections.”).

Page 35 GAO-12-838 Federal Disaster Assistance
Note: For the number of cost share adjustments requested and approved, we used the fiscal year in which the disaster declaration was approved. Of the 109 cost share adjustments, 23 were required by legislation. Excluding the 23 cost share adjustments, the President approved 86 of the 127 cost share adjustment requests, or 68 percent.
Our analysis shows that 64 of the 109 cost share adjustments during fiscal years 2004 through 2011 were for the following six disasters: 23 for Hurricane Katrina, 11 for Hurricane Rita, 9 for Hurricane Ike, 8 for Hurricane Ivan, 7 for midwest flooding in fiscal year 2008, and 6 for Hurricane Dennis. Furthermore, 34 of the 109 cost share adjustments involved a single adjustment, whereas 23 cost share adjustments involved multiple adjustments. FEMA officials explained this by stating that a 100 percent cost share adjustment could be approved for a 72-hour period and the governor could subsequently request another 100 percent cost share adjustment for another 72-hour period, which the President could approve. For example, the disaster declaration in Louisiana in fiscal year 2005 for Hurricane Katrina had 8 cost share adjustments and the disaster declaration in Mississippi in fiscal year 2005 for Hurricane Katrina had 9 cost share adjustments.
According to FEMA officials, although the process is similar, the agency uses different criteria to evaluate a request from a governor to increase the federal government share for PA up to 90 percent than it does for requests up to 100 percent. Specifically, FEMA may recommend to the President that the federal cost share be increased up to 90 percent when a disaster is so extraordinary that actual federal obligations, excluding FEMA administrative costs, meet or exceed a qualifying threshold. To determine the threshold, the jurisdiction population is multiplied by a per capita amount, which is $135 for calendar year 2012 (or 100 times the 2012 per capita damage indicator of $1.35).63
6344 C.F.R. § 206.47(b).
Forty-one of the 109 cost share adjustments increased the federal cost share to 90 percent and reduced the nonfederal share to 10 percent. According to FEMA’s regulations, if warranted by the needs of the disaster, FEMA may recommend up to 100 percent federal funding for emergency work, such as debris removal and emergency protective measures, for a limited period in the initial days of the disaster irrespective of the per capita

Page 36 GAO-12-838 Federal Disaster Assistance
amount.64
Unlike its evaluation of a request that the federal share be increased from 75 percent up to 90 percent, FEMA does not use specific criteria to evaluate requests to adjust the federal cost share up to 100 percent. FEMA officials stated that a recommendation to the President for up to a 100 percent cost share adjustment is based on a subjective assessment of the jurisdiction’s needs and that it is usually pretty obvious when a jurisdiction needs debris removal and emergency protective measures, although the officials acknowledged that FEMA’s recommendation is a judgment call. According to FEMA, it does not use the same criteria to evaluate a request for a 100 percent cost share adjustment as it uses for a 90 percent cost share adjustment because the criteria for the 90 percent adjustment are based on actual federal obligations. FEMA officials explained that they would not be able to apply those criteria for the 100 percent adjustment in the initial days of a disaster because there would not be much, if any, funding obligated at that point. However, criteria for assessing a request for a 100 percent cost share adjustment for PA (that is, emergency work) do not have to be the same criteria FEMA uses to assess requests for 90 percent cost share adjustments. For example, FEMA’s IA grant program uses multiple factors to determine whether to recommend to the President that a jurisdiction be granted IA.
Sixty-eight of the 109 cost share adjustments increased the federal cost share to 100 percent.
65
We have previously reported that clear criteria are important for controlling federal costs and helping to ensure consistent and equitable eligibility determinations.
66 For example, if a 100 percent cost share adjustment is approved, the federal government could pay millions of dollars more than it ordinarily would for a single disaster declaration. Furthermore, Standards for Internal Control in the Federal Government state that internal control activities help ensure that management’s directives are carried out and that actions are taken to address risks.67
6444 CFR §206.47(d). Generally, 72 hours is the period of time that the federal government will pay 100 percent of these costs; however, the President can extend the time period.
6544 C.F.R. § 206.48(b). 66GAO/RCED, Disaster Assistance: Improvements Needed in Determining Eligibility for Public Assistance, GAO-96-113 (Washington, D.C.: May 1996). 67GAO/AIMD-00-21.3.1.

Page 37 GAO-12-838 Federal Disaster Assistance
Moreover, internal control standards state that control activities should be an integral part of an entity’s accountability for stewardship of government resources. Without such activities, FEMA is at risk that its recommendations related to 100 percent cost share adjustments may not be justified. Further, relying on professional judgment only, FEMA is at risk of making inconsistent, and potentially inequitable, recommendations to the President about whether to grant 100 percent cost share adjustments.
In addition, FEMA officials stated that they do not know the costs associated with the 109 cost share adjustments because the agency does not track the costs for all cost share adjustments, although on rare occasions, at the request of congressional staff, FEMA officials have identified the costs associated with cost share adjustments, such as those for Hurricane Katrina. The officials stated that they have not routinely tracked the additional costs associated with cost share adjustments because they did not see a need for this information. According to Standards for Internal Control in the Federal Government, program managers need financial data to determine whether they are meeting their goals for accountability for effective and efficient use of resources.68
Financial information is needed for both external and internal uses, and on a day-to-day basis to make operating decisions, monitor performance, and allocate resources. Pertinent information should be identified, captured, and distributed in a form and time frame that permits people to perform their duties efficiently. Because FEMA does not track the costs associated with cost share adjustments, FEMA does not know the financial impact of its recommendations to the President on whether to increase the federal cost share for PA. Understanding the financial impact of FEMA’s recommendations to the President for cost share adjustments would enable FEMA to make more informed recommendations and estimate the impact of the adjustments on available DRF balances.
68 GAO/AIMD-00-21.3.1.

Page 38 GAO-12-838 Federal Disaster Assistance
FEMA’s administrative cost percentages have often surpassed its targets for all sizes of disasters and have doubled in size since fiscal year 1989. FEMA provided guidance for administrative cost targets but does not assess how well the targets were achieved. The agency is working on three short- and long-term initiatives to deliver disaster assistance in a more efficient manner.
Our analysis of the 539 disaster declarations during fiscal years 2004 through 2011 shows that 37 percent of the declarations exceeded administrative cost percentage targets established in guidance prepared by FEMA in 2010.69 Administrative cost percentages varied widely among disaster declarations that required a similar amount of federal financial assistance, suggesting that certain declarations may have been administered more efficiently than others. In addition, FEMA’s average administrative cost percentage for disaster declarations has doubled since fiscal year 1989.70
FEMA’s administrative costs relate to the delivery of disaster assistance programs, such as the PA or IA programs, and are primarily obligated
69In November 2010, FEMA established administrative cost percentage target ranges for disaster declarations. According to FEMA officials, the target ranges are not considered formal guidance and FEMA officials responsible for managing administrative costs are not held accountable for meeting the targets; however, the targets are supposed to shape how its leaders in the field think about gaining and sustaining efficiencies in operations. Event Level 1 declarations—with projected obligations of $500 million to $5 billion—have an administrative cost percentage target range of 8 percent to 12 percent of total obligations. Event Level 2 declarations—with projected total obligations from $50 million to $500 million—have a target range of 9 percent to 15 percent. Event Level 3 declarations—with projected obligations of less than $50 million—have a target range of 12 percent to 20 percent. 70According to FEMA officials, the agency relied on the Statement of Federal Financial Accounting Standards 4 to define its administrative costs. Agency officials calculate a declaration’s administrative cost percentage by dividing administrative cost obligations by total obligations. Total obligations include funds obligated for PA, IA, Hazard Mitigation, Mission Assignment, and administration. We calculated administrative cost percentages using the formula provided by FEMA.
Costs of Providing Disaster Assistance Have Increased, but FEMA Is Working to Reduce Costs
Administrative Cost Percentages Often Exceeded FEMA’s Targets and Have Doubled since Fiscal Year 1989

Page 39 GAO-12-838 Federal Disaster Assistance
from the DRF.71 Examples of administrative costs include the salary and travel costs for the disaster reserve workforce, rent and security expenses associated with JFO facilities, and supplies and information technology support for JFO staff. According to FEMA officials, the agency’s administrative costs are primarily due to activities at JFOs; however, administrative costs can also be incurred at FEMA regional offices, headquarters, and other locations.72
We analyzed actual administrative costs for disaster declarations that were closed as of April 30, 2012, and, for declarations that were still open as of April 30, 2012, we analyzed actual obligations as of April 30, 2012, plus the amount that FEMA projected to obligate in the future until the declarations are eventually closed.
73
• For small disaster declarations (total obligations of less than $50 million), the target range for administrative costs is 12 percent to 20
FEMA categorizes disaster declarations using three event levels, essentially small, medium, or large based on the amount of federal funding obligated for the disaster, and has established target ranges for administrative cost percentages for each. Our analysis shows that FEMA frequently exceeded the administrative cost percentage targets established by FEMA guidance for all three sizes of disaster declarations during fiscal years 2004 through 2011. Specifically:
71In addition to FEMA’s administrative costs, funds are obligated from the DRF to reimburse states and localities for certain administrative costs. Because these administrative costs are for state and local activities rather than FEMA activities, we did not include the costs in our administrative cost analyses. Further, certain administrative costs associated with disaster declarations are obligated from FEMA’s annual appropriations. For example, according to FEMA officials, the salary of a full-time FEMA employee who works at headquarters is obligated from the agency’s appropriations, even if the employee works on a specific disaster declaration. As FEMA could not quantify the amount of administrative costs obligated from its appropriations that related to disaster declarations, these costs were excluded from our administrative cost analyses. 72In addition to using JFOs, FEMA utilizes other temporary offices to respond to disaster declarations, including Disaster Recovery Centers and PA Processing Centers, which also incur administrative costs. 73FEMA uses three categories to characterize the status of a disaster declaration: programmatically open, closed, and reconciled. “Programmatically open” means that all financial decisions are not completed and eligible work remains. “Closed” means that financial decisions have been made, but all projects are not complete. “Reconciled” means that all projects are complete and the FEMA-state agreement is closed.

Page 40 GAO-12-838 Federal Disaster Assistance
percent; for the 409 small declarations that we analyzed, 4 out of every 10 had administrative costs that exceeded 20 percent.
• For medium disaster declarations (total obligations of $50 million to $500 million), the target range for administrative costs is 9 percent to 15 percent; for the 111 declarations that we analyzed, almost 3 out of every 10 had administrative costs that exceeded 15 percent.
• For large disaster declarations (total obligations greater than $500 million to $5 billion), the target range for administrative costs is 8 percent to 12 percent; for the 19 large declarations that we analyzed, over 4 out of every 10 had administrative costs that exceeded 12 percent.74
For small declarations that we analyzed, administrative cost percentages averaged 20 percent and ranged from less than 1 percent to 73 percent. Thus, on average, small disaster declarations were within the upper limit of FEMA’s target range. However, 12 small declarations had administrative cost percentages greater than 50 percent, which means that FEMA obligated more for administrative costs than for disaster assistance.
75
74Two of the 19 large disaster declarations had projected obligations over $5 billion, which is above the dollar range that FEMA uses to define large declarations. We included them in the group of large declarations.
For example, if FEMA required $6 million to deliver $4 million in disaster assistance to a jurisdiction, then the related administrative cost percentage would be 60 percent of the total DRF obligations of $10 million. For medium declarations that we analyzed, administrative cost percentages averaged 12 percent and were, therefore, in the middle of the target range. However, administrative cost percentages for medium declarations ranged from less than 1 percent to 55 percent and, for 1 medium declaration, FEMA obligated more for administrative costs than for disaster assistance. For large declarations that we analyzed, administrative cost percentages averaged 13 percent—slightly above the upper limit of the target range—and ranged from 3 percent to 25 percent; therefore, none of the large
75The administrative cost percentage is a percentage of the total obligation, not a percentage of the amount for disaster assistance. For example, if FEMA obligated $5 million for administrative costs and $5 million for disaster assistance, we divided the $5 million in administrative costs by $10 million ($5 million in administrative costs plus $5 million in disaster assistance). Therefore, in this example, the administrative cost percentage is 50 percent of the total $10 million obligation for that disaster.
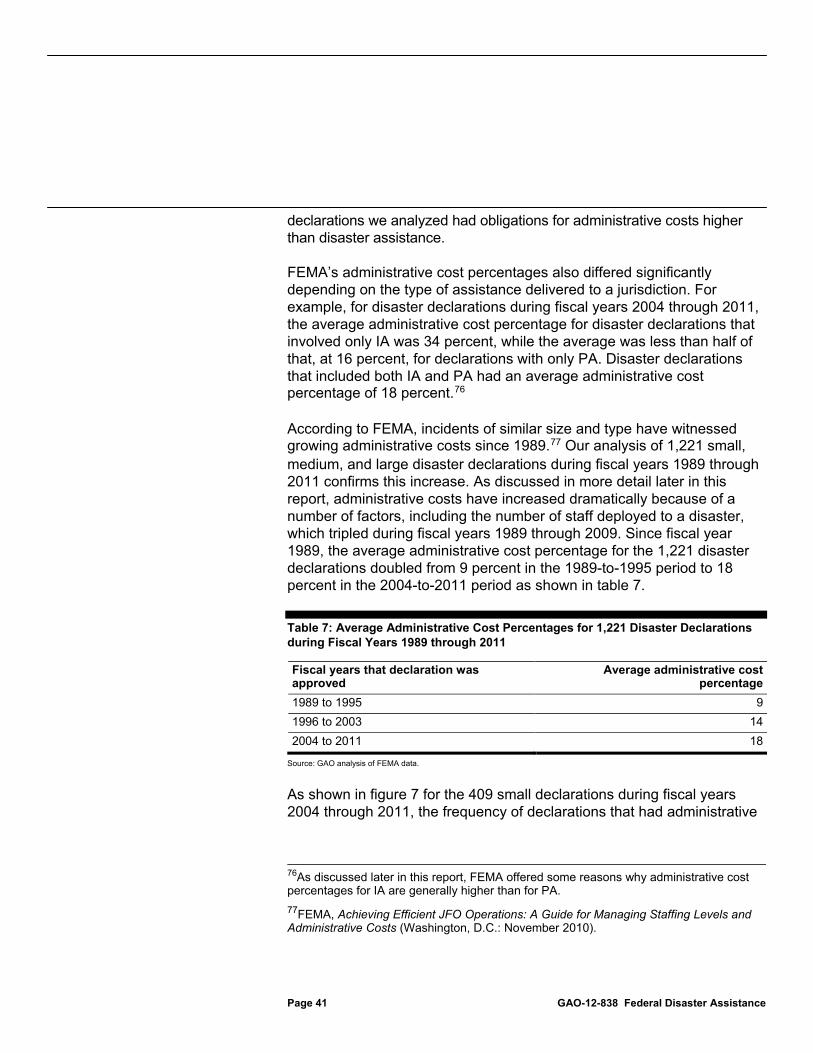
Page 41 GAO-12-838 Federal Disaster Assistance
declarations we analyzed had obligations for administrative costs higher than disaster assistance.
FEMA’s administrative cost percentages also differed significantly depending on the type of assistance delivered to a jurisdiction. For example, for disaster declarations during fiscal years 2004 through 2011, the average administrative cost percentage for disaster declarations that involved only IA was 34 percent, while the average was less than half of that, at 16 percent, for declarations with only PA. Disaster declarations that included both IA and PA had an average administrative cost percentage of 18 percent.76
According to FEMA, incidents of similar size and type have witnessed growing administrative costs since 1989.
77
Table 7: Average Administrative Cost Percentages for 1,221 Disaster Declarations during Fiscal Years 1989 through 2011
Our analysis of 1,221 small, medium, and large disaster declarations during fiscal years 1989 through 2011 confirms this increase. As discussed in more detail later in this report, administrative costs have increased dramatically because of a number of factors, including the number of staff deployed to a disaster, which tripled during fiscal years 1989 through 2009. Since fiscal year 1989, the average administrative cost percentage for the 1,221 disaster declarations doubled from 9 percent in the 1989-to-1995 period to 18 percent in the 2004-to-2011 period as shown in table 7.
Fiscal years that declaration was approved
Average administrative cost percentage
1989 to 1995 9 1996 to 2003 14 2004 to 2011 18
Source: GAO analysis of FEMA data.
As shown in figure 7 for the 409 small declarations during fiscal years 2004 through 2011, the frequency of declarations that had administrative
76As discussed later in this report, FEMA offered some reasons why administrative cost percentages for IA are generally higher than for PA. 77FEMA, Achieving Efficient JFO Operations: A Guide for Managing Staffing Levels and Administrative Costs (Washington, D.C.: November 2010).

Page 42 GAO-12-838 Federal Disaster Assistance
cost percentages above FEMA’s target of no more than 20 percent is five times what it was during fiscal years 1989 through 1995.78
Figure 7: Frequency of Declarations above and below FEMA’s Target of 20 Percent or Less for Administrative Costs for Small Declarations during Fiscal Years 1989 through 2011
As shown in figure 8 for the 111 medium declarations during fiscal years 2004 through 2011, the frequency of declarations that had administrative cost percentages above FEMA’s target range of no more than 15 percent, is almost 10 times what it was during fiscal years 1989 through 1995.
78We examined fiscal years 1989 through 2011 because FEMA maintains detailed financial data on disaster declarations only back to fiscal year 1989. To examine whether administrative costs changed over time, we divided the 23 years into three periods—two periods of 8 years each and one period of 7 years. FEMA officials stated that no significant changes have been made to the agency’s definition of administrative costs during fiscal years 1989 through 2011.

Page 43 GAO-12-838 Federal Disaster Assistance
Figure 8: Frequency of Declarations above and below FEMA’s Target of 15 Percent or Less for Administrative Costs for Medium Declarations during Fiscal Years 1989 through 2011
As shown in figure 9, for the 19 large declarations during fiscal years 2004 through 2011, the frequency of declarations that had administrative cost percentages above FEMA’s target of no more than 12 percent is 42 percent, whereas, during fiscal years 1996 to 2003, 20 percent of the large declarations exceeded FEMA’s target and, during fiscal years 1989 through 1995, there were no large declarations that exceeded FEMA’s target.

Page 44 GAO-12-838 Federal Disaster Assistance
Figure 9: Frequency of Declarations above and below FEMA’s Target of 12 Percent or Less for Administrative Costs for Large Declarations during Fiscal Years 1989 through 2011
Furthermore, our analysis of administrative cost percentages by type of disaster assistance shows a similar trend of significant increases since fiscal year 1989. As shown in table 8, since fiscal year 1989, administrative cost percentages doubled for declarations with IA only, quadrupled for declarations with PA only, and doubled for declarations with PA and IA.
Table 8: Average Administrative Cost Percentages by Type of Assistance during Fiscal Years 1989 through 2011
Type of assistance 1989-1995 1996-2003 2004-2011 IA 17% 27% 34% PA 4% 11% 16% PA, IA 9% 14% 18%
Source: GAO analysis of FEMA data.

Page 45 GAO-12-838 Federal Disaster Assistance
FEMA officials created a management guide to better manage some of the controllable factors for administrative costs. The guide noted that administrative costs had been steadily rising for 20 years and that little emphasis had been placed on controlling overall costs. The guide set target ranges for administrative costs, but according to FEMA officials, the administrative cost goals are not required to be met. While a number of factors affect FEMA’s administrative cost percentages, the agency is working to better manage some of the factors it can control. According to FEMA officials, the amount and type of assistance provided to a jurisdiction are factors that significantly affect administrative cost percentages. Some of the key factors that FEMA can control include the number of staff deployed to a disaster and amount of overtime these staff can work. FEMA officials stated that managing staffing levels according to need throughout the course of a disaster can be a cost-effective alternative to requiring staff to work overtime.
FEMA officials stated that the amount and type of assistance provided to a jurisdiction can affect a disaster declaration’s administrative cost percentage. For example, FEMA may be able to achieve economies of scale for relatively large disasters, thereby reducing the related administrative cost percentage. In contrast, relatively small disasters do not benefit from economies of scale and may experience high administrative cost percentages because of the need for a certain number of staff. For instance, according to a FEMA official responsible for controlling disaster-related costs, a typical declaration requires a minimum of 30 to 35 staff to deliver PA and an additional 30 to 35 people to deliver IA. Therefore, even for a small disaster declaration that includes IA and PA, 60 to 70 staff will be required to administer the assistance. According to FEMA officials, declarations that include IA often experience higher administrative cost percentages. Moreover, FEMA officials stated that the delivery of IA can be more labor intensive than the delivery of PA, as IA often requires one-on-one attention to individuals and families affected by a disaster. Costs associated with a typical JFO, such as rent and employee travel, can be reduced when FEMA utilizes a virtual JFO; however, because of the personal nature of the response required for IA, FEMA is rarely able to utilize a virtual JFO for a declaration with IA according to FEMA officials.79
79A virtual JFO is an off-site location wherein disaster workforce personnel utilize communication tools to deliver disaster assistance programs.
Furthermore, while there is no limit on the
FEMA Provided Targets for Administrative Costs in Its Guidance to Staff but Does Not Assess Performance in Achieving the Targets

Page 46 GAO-12-838 Federal Disaster Assistance
amount of PA a jurisdiction can receive, the maximum amount an individual/household can receive for IA is $31,400 in fiscal year 2012. As a result of the limit for IA, it is more difficult for FEMA to achieve economies of scale when delivering IA compared with PA.
According to FEMA officials, certain factors that affect administrative costs are managed by the designated FCO.80
In November 2010, the FEMA Administrator issued guidance to FCOs on how to better control staffing levels and administrative costs associated with disaster declarations. For example, the document provided guidance on how FCOs can set targets for administrative cost percentages, plan staffing levels, time the deployment of staff, and determine whether to use virtual JFOs. According to FEMA, the guidance is not required to be followed because the agency’s intent was to ensure that it was providing guidance to shape how its leaders in the field think about gaining and sustaining efficiencies in operations rather than to lay out a prescriptive formula. In addition, FEMA has a strategic plan that calls for improving the delivery of disaster assistance while minimizing opportunities for
FCOs are primarily responsible for managing JFO operations and planning FEMA’s initial disaster response and recovery efforts, including the number of staff needed, and when and how long the staff will be deployed. Salaries, benefits, and travel costs for FEMA staff, as well as costs associated with contractors, account for roughly three-quarters of a disaster declaration’s administrative costs. Also, the average number of FEMA staff deployed to a disaster has increased significantly, from fewer than 500 in fiscal year 1989 to over 1,500 in fiscal year 2009. When we asked FEMA why the staff deployed to a disaster had tripled during this time, FEMA stated that it is extremely difficult to identify any principal factors causing increases in staff and costs because of the complexities associated with the underlying factors, particularly in light of the span of time involved. In addition, for small declarations, a JFO typically closes within 90 days of its opening, and FEMA officials stated that the majority of administrative costs are obligated before a JFO closes. Therefore, planning for and managing the first 90 days of disaster response and recovery can greatly affect the administrative costs for a small declaration.
80The FCO is a position created by the Stafford Act and is appointed by the President to manage federal resource support activities related to disaster declarations. 42 U.S.C. § 5143. The FCO is responsible for coordinating the timely delivery of federal disaster assistance resources and programs to the affected localities.

Page 47 GAO-12-838 Federal Disaster Assistance
waste, fraud, and abuse. To accomplish this, FEMA plans to collaboratively adopt and communicate policies and practices that successfully safeguard against waste, fraud, and abuse. The plan states that, to justify FEMA funding to all of its stakeholders, including taxpayers, there must be a focus on identifying outcomes and measuring performance. Furthermore, according to the plan, FEMA’s ability to analyze and evaluate the results of its plans, programs, and organizational initiatives is key to managing its strategic and long-range organizational goals. However, neither the guidance to FCOs nor the strategic plan sets goals for administrative cost percentages that are required to be met or tracked for performance. While we recognize complexities exist that can affect administrative costs for disasters, FEMA’s implementation of goals to control administrative costs and monitoring of performance in achieving these goals would provide valuable information in assessing the agency’s performance in this area and help to provide reasonable assurance that FEMA is delivering disaster assistance in an efficient manner.
FEMA officials are considering other short- and long-term actions to increase efficiencies in the delivery of disaster assistance. According to FEMA officials, on the basis of a recent review of the PA program, the agency created a plan with three initiatives focused on delivering assistance to jurisdictions in a more efficient manner. The first initiative under this plan attempts to promote consistency across FEMA’s 10 regional offices. For example, FEMA plans to issue a Public Assistance Program Field Operations Pocket Guide to provide consistent guidance and approaches to regional staff to help ensure that PA policies are being consistently followed across FEMA regions. FEMA provided the PA Pocket Guide to FEMA regional staff and state, local, and tribal officials who attended FEMA’s PA Conference and State Workshop in April 2012 to solicit feedback.
The second initiative attempts to reduce the problems associated with debris removal. For example, the agency hopes to reduce its reliance on the Army Corps of Engineers for debris removal, which FEMA officials said can be costlier than hiring local contractors. According to FEMA officials, the agency plans to implement this initiative during the next 2 to 3 years and it may require regulatory changes.
The third initiative addresses inefficiencies within the permanent work portion of PA and includes the consideration of a new model to deliver this assistance. In October 2011, the FEMA Administrator testified that
FEMA Is Working to Increase Efficiencies in Delivering Disaster Assistance

Page 48 GAO-12-838 Federal Disaster Assistance
the agency is considering a new, two-step process wherein FEMA and the state would agree on the estimated damages for a large-scale project and FEMA would make a one-time payment to the state.81 The Administrator stated that the agency currently uses a reimbursement program, which requires a high degree of FEMA oversight and administrative costs.82
While FEMA officials told us that the agency is in the conceptual stages of developing the new model, officials have identified some potential benefits. For example, the new model could lower FEMA’s administrative costs and the time needed to close a disaster declaration. In addition, the new model could allow states to rebuild as they see fit rather than requiring states to replace damaged structures to the status that existed prior to the disaster, which is FEMA’s current practice. According to FEMA officials, implementation of this model could require regulatory and legislative changes and is, therefore, years away.
Disaster declarations have increased over recent decades, and FEMA has obligated over $80 billion in federal assistance for disasters declared during fiscal years 2004 through 2011, highlighting the importance of FEMA’s assessment of jurisdictions’ capabilities to respond and recover without federal assistance. The PA per capita indicator is artificially low because it does not reflect the rise in per capita personal income since 1986 or 13 years of inflation from 1986, when the indicator was set at $1.00 and adopted for use, to 1999. By primarily relying on an artificially low indicator, FEMA’s recommendations to the President are based on damage estimates and do not comprehensively assess a jurisdiction’s capability to respond to and recover from a disaster on its own. For example, on the basis of FEMA’s actual and estimated disaster assistance obligations, more than one-third of the 539 major disasters declared during fiscal years 2004 through 2011 are expected to have total
81Statement of the Honorable W. Craig Fugate, Administrator, FEMA, before the House Committee on Transportation and Infrastructure, Subcommittee on Economic Development, Public Buildings, and Emergency Management, Streamlining Emergency Management: Improving Preparedness, Response, and Cutting Costs, U.S. House of Representatives (Washington, D.C.: October 13, 2011). 82Under the current reimbursement program, the state and local governments pay for the item or service and submit documentation to FEMA officials, who review the documentation to ensure it is an eligible expense and reimburse the state and local governments.
Conclusions

Page 49 GAO-12-838 Federal Disaster Assistance
DRF obligations of less than $10 million, and more than 60 percent are expected to have total obligations of less than $25 million. Therefore, many of these declarations were for relatively small disasters. At a minimum, adjusting the existing PA per capita indicator fully for changes in per capita income or inflation could ensure that the per capita indicator more accurately reflects changes in U.S. economic conditions since 1986, when the indicator was adopted. Making the appropriate inflation adjustment to the indicator would raise it from $1.35 to $2.07. A change of this size in 1 year could present challenges for jurisdictions, which could find that disasters with PA damage estimates that would now qualify for PA would no longer qualify. Thus, phasing in the adjustment over several years could provide jurisdictions time to take actions, such as increasing any rainy day funds, to adjust to the effects of higher qualifying indicators.
A more comprehensive approach to determine a jurisdiction’s capabilities to respond to a disaster would be to replace or supplement the current indicator with more complete data on a jurisdiction’s fiscal resources, such as TTR, and would be informed by data on a jurisdiction’s response and recovery assets and capabilities. Because FEMA’s current approach of comparing the amount of disaster damage with the PA per capita indicator does not accurately reflect whether a jurisdiction has the capabilities to respond to and recover from a disaster without federal assistance, developing a methodology that provides a more comprehensive assessment of jurisdictions’ response and recovery capabilities, including a jurisdiction’s fiscal capacity, could provide FEMA with data that are more specific to the jurisdiction requesting assistance. For example, developing preparedness metrics in response to the Post-Katrina Act and Presidential Policy Directive-8 could provide FEMA with readily available information on jurisdictions’ response and recovery capabilities. Without an accurate assessment of jurisdictions’ capabilities to respond to and recover from a disaster, FEMA runs the risk of recommending to the President that federal disaster assistance be awarded without considering a jurisdiction’s response and recovery capabilities or its fiscal capacity. As we recommended in 2001, we continue to believe that FEMA should develop more objective and specific criteria to assess the capabilities of jurisdictions to respond to a disaster. Given the legislative and policy changes over the past decade, we believe that including fiscal and nonfiscal capabilities, including available preparedness metrics in its assessment, would allow FEMA to make more informed recommendations to the President when determining a jurisdiction’s capacity to respond without federal assistance.

Page 50 GAO-12-838 Federal Disaster Assistance
Making informed recommendations to the President about whether cost share adjustments should be granted is important for FEMA and the requesting jurisdictions because every cost share adjustment has financial implications for both entities. A specific set of criteria or factors to use when considering requests for 100 percent cost share adjustments would provide FEMA a decision-making framework and enable more consistent and objectively based recommendations to the President. Also, when FEMA recommends that a cost share adjustment be approved and the President approves it, the federal government assumes the financial burden of paying 15 percent or 25 percent more in PA, which could total millions of dollars. Tracking the additional costs to the federal government because of cost share adjustments would allow FEMA to better understand the financial implications of its recommendations to the President.
FEMA’s average administrative costs as a percentage of total DRF disaster assistance obligations have risen for disasters of all sizes. The agency recognized that delivering assistance in an efficient manner is important and published guidance to be used throughout the agency to help rein in administrative costs. However, FEMA has not implemented the goals and does not track performance against them. Over time, reducing administrative costs could save billions of dollars—dollars that could be used to fund temporary housing, infrastructure repairs, and other disaster assistance. Therefore, incentivizing good management over administrative costs by adopting administrative cost percentage goals and measuring performance against these goals would help provide FEMA with additional assurance that it is doing its utmost to deliver disaster assistance in an efficient manner.
To increase the efficiency and effectiveness of the process for disaster declarations, we recommend that the FEMA Administrator take the following four actions:
1. Develop and implement a methodology that provides a more comprehensive assessment of a jurisdiction’s capability to respond to and recover from a disaster without federal assistance. This should include one or more measures of a jurisdiction’s fiscal capacity, such as TTR, and consideration of the jurisdiction’s response and recovery capabilities. If FEMA continues to use the PA per capita indicator to assist in identifying a jurisdiction’s capabilities to respond to and recover from a disaster, it should adjust the indicator to accurately reflect the annual changes in the U.S. economy since 1986, when the
Recommendations for Executive Action

Page 51 GAO-12-838 Federal Disaster Assistance
current indicator was first adopted for use. In addition, implementing the adjustment by raising the indicator in steps over several years would give jurisdictions more time to plan for and adjust to the change.
2. Develop and implement specific criteria or factors to use when evaluating requests for cost share adjustments that would result in the federal government paying up to 100 percent of disaster declaration costs.
3. Annually track and monitor the additional costs borne by the federal government for the cost share adjustments.
4. Implement goals for administrative cost percentages and monitor performance to achieve these goals.
We provided a draft of this report to DHS for comment. We received written comments from DHS on the draft report, which are summarized below and reproduced in full in appendix V. DHS concurred with three recommendations and partially concurred with the fourth recommendation.
Regarding the first recommendation, that FEMA develop and implement a methodology that provides a more comprehensive assessment of a jurisdiction’s capability to respond to and recover from a disaster without federal assistance, DHS concurred. DHS stated that a review of the criteria used to determine a state’s response, recovery, and fiscal capabilities is warranted and that such a review would include the need to update the per capita indicator as well as a review of alternative metrics. DHS stated that any changes would need to be made through the notice and comment rulemaking process and that, if changes are made to the per capita indicator, FEMA’s Office of Response and Recovery will review the feasibility of phasing them in over time. However, the extent to which the planned actions will fully address the intent of this recommendation will not be known until the agency completes its review and implements a methodology that provides a more comprehensive assessment of a jurisdiction’s capability to respond and, if the per capita indicator continues to be used, adjusts the per capita indicator to accurately reflect annual changes in the U.S. economy since 1986. We will continue to monitor DHS’s efforts.
Agency Comments and Our Evaluation

Page 52 GAO-12-838 Federal Disaster Assistance
Regarding the second recommendation, that FEMA develop and implement specific criteria or factors to use when evaluating requests for cost share adjustments that would result in the federal government paying up to 100 percent of disaster declaration costs, DHS concurred with the recommendation and stated that FEMA’s Office of Response and Recovery will review specific cost share factors or criteria and develop guidelines to support decision making. These actions, if implemented effectively, should address the intent of the recommendation.
DHS concurred with the third recommendation, to track and monitor the additional costs associated with cost share adjustments, and stated that FEMA’s Office of Response and Recovery will be responsible for tracking these costs on an annual basis. DHS stated that such actions would provide valuable information for budgetary purposes and for decision makers who consider requests for cost share adjustments. We agree. Thus, these actions, if implemented effectively, should address the intent of the recommendation.
DHS partially concurred with the fourth recommendation, to implement goals for administrative cost percentages and monitor performance to achieve these goals. Specifically, DHS stated that it agrees that setting goals and monitoring performance for achieving these goals is a good practice in any program and can help ensure more effective and efficient operations. However, DHS stated that it plans to conduct a review to better understand and describe its current measures. DHS stated that a number of factors affect administrative costs, which can present difficulties when trying to implement a simple measure of percentage of administrative costs to total costs. For example, DHS noted that the types of assistance provided and the location of the JFO would affect the percentage of administrative costs. DHS also stated that establishing meaningful administrative cost percentage goals will be challenging because of the many factors involved and that a suite of measures to track administrative cost percentages could help ensure more effective and efficient operations. Thus, DHS is pursuing development of such a suite of measures. We agree that a number of factors affect the percentage of administrative costs and that establishing meaningful administrative cost percentage goals can be challenging. In developing a suite of measures, it is important that FEMA’s leadership be able to use them to effectively monitor a disaster declaration’s overall administrative costs in addition to the factors that affect administrative costs. If these measures allow FEMA to monitor overall administrative costs as well as the factors that affect such costs, then development and implementation of such measures should meet the intent of the recommendation.

Page 53 GAO-12-838 Federal Disaster Assistance
DHS also provided technical comments, which we incorporated, as appropriate.
We will send copies of this report to the Secretary of Homeland Security, the FEMA Administrator, and appropriate congressional committees. If you or your staffs have any questions about this report, please contact me at (202) 512-8777 or [email protected]. Contact points for our Offices of Congressional Relations and Public Affairs may be found on the last page of this report. Other key contributors to this report are listed in appendix VI.
William O. Jenkins, Jr. Director Homeland Security and Justice

Appendix I: GAO Analyses of the Number of Disaster Declarations and Amount of Obligations
Page 54 GAO-12-838 Federal Disaster Assistance
Disaster declarations can take a decade or more to close because of a number of factors, including the Federal Emergency Management Agency’s (FEMA) reimbursement process for Public Assistance (PA) infrastructure projects, which can take a long time to finish. In addition, some projects are delayed because of disagreements, and sometimes litigation, over the appropriate amount that should be obligated, according to FEMA officials. As shown below in table 9, the oldest open disaster dates back to 1992, making it 20 years old, and only 54 percent of disaster declarations from fiscal year 2001 were closed as of January 31, 2012. All disaster declarations prior to fiscal year 1992 are closed. Table 9 shows the number of major disaster declarations by fiscal year that were open as of January 31, 2012, and the percentage of declarations that have been closed for each year since fiscal year 1992.1
Table 9: Status of Disaster Declarations during Fiscal Years 1992 through 2011, as of January 31, 2012
Number of disaster declarations Fiscal year Declared Open Closed Percentage closed 1992 46 1 45 98 1993 39 1 38 97 1994 36 2 34 94 1995 29 4 25 86 1996 72 2 70 97 1997 49 4 45 92 1998 61 8 53 87 1999 53 10 43 81 2000 40 9 31 78 2001 50 23 27 54 2002 42 16 26 62 2003 62 29 33 53 2004 65 46 19 29 2005 45 31 14 31 2006 53 46 7 13 2007 68 65 3 4 2008 68 68 0 0 2009 63 63 0 0 2010 79 79 0 0 2011 98 98 0 0
Source: GAO analysis of FEMA data.
1Figure 1 presented earlier in the report includes data on declarations since 1953, when the first presidential disaster declaration was issued.
Appendix I: GAO Analyses of the Number of Disaster Declarations and Amount of Obligations
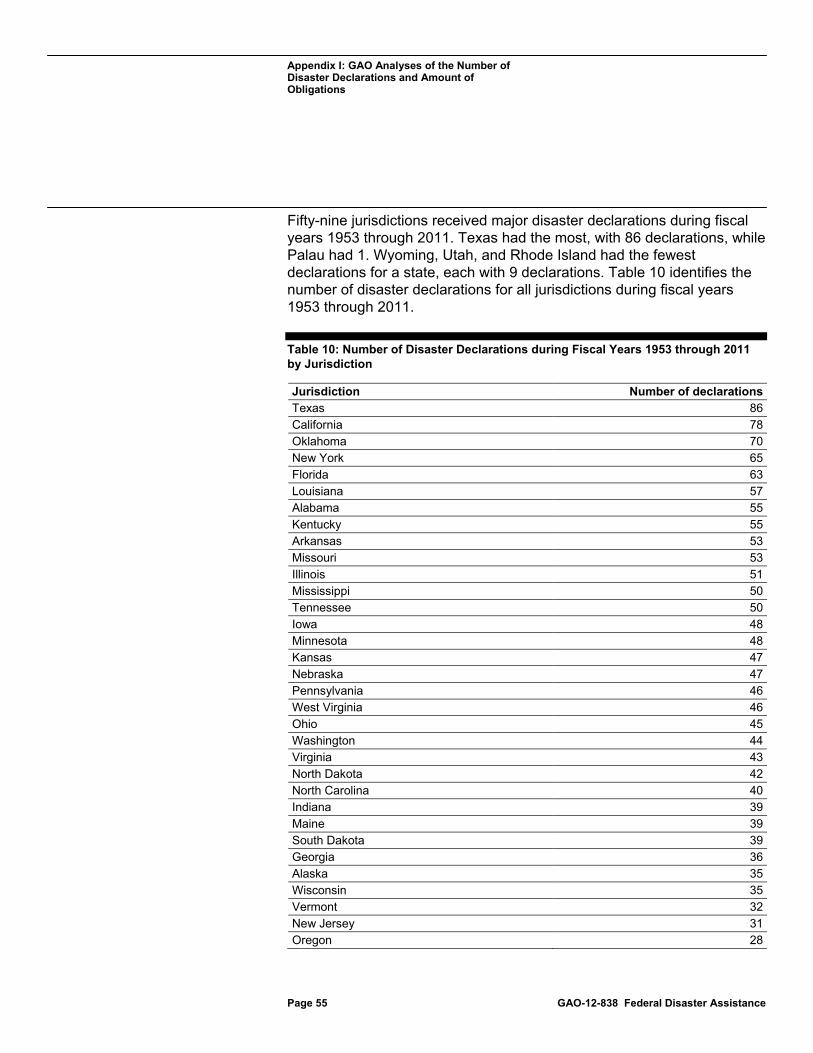
Appendix I: GAO Analyses of the Number of Disaster Declarations and Amount of Obligations
Page 55 GAO-12-838 Federal Disaster Assistance
Fifty-nine jurisdictions received major disaster declarations during fiscal years 1953 through 2011. Texas had the most, with 86 declarations, while Palau had 1. Wyoming, Utah, and Rhode Island had the fewest declarations for a state, each with 9 declarations. Table 10 identifies the number of disaster declarations for all jurisdictions during fiscal years 1953 through 2011.
Table 10: Number of Disaster Declarations during Fiscal Years 1953 through 2011 by Jurisdiction
Jurisdiction Number of declarations Texas 86 California 78 Oklahoma 70 New York 65 Florida 63 Louisiana 57 Alabama 55 Kentucky 55 Arkansas 53 Missouri 53 Illinois 51 Mississippi 50 Tennessee 50 Iowa 48 Minnesota 48 Kansas 47 Nebraska 47 Pennsylvania 46 West Virginia 46 Ohio 45 Washington 44 Virginia 43 North Dakota 42 North Carolina 40 Indiana 39 Maine 39 South Dakota 39 Georgia 36 Alaska 35 Wisconsin 35 Vermont 32 New Jersey 31 Oregon 28

Appendix I: GAO Analyses of the Number of Disaster Declarations and Amount of Obligations
Page 56 GAO-12-838 Federal Disaster Assistance
Jurisdiction Number of declarations New Hampshire 27 Massachusetts 26 Hawaii 25 Michigan 25 Puerto Rico 25 Federated States of Micronesia 24 Arizona 23 Idaho 23 New Mexico 23 Maryland 21 Montana 20 Nevada 17 Virgin Islands 17 Colorado 16 Connecticut 16 South Carolina 15 Delaware 14 Northern Mariana Islands 14 Guam 12 American Samoa 11 District of Columbia 10 Rhode Island 9 Utah 9 Wyoming 9 Marshall Islands 7 Palaua 1
Source: GAO analysis of FEMA data. a We did not include Palau in our analysis of disaster declarations during fiscal years 2004 through 2011 because Palau is a Freely Associated State that, under the terms of its Compact of Free Association with the United States, ceased to receive disaster assistance from the U.S. government. Prior to entering the compact, Palau received one disaster declaration as a territory.
The number of major disaster declarations and total obligations varied among FEMA regions during fiscal years 2004 through 2011. For example, FEMA Region X had 32 declarations, while FEMA Region IV had 87. In addition, obligations for FEMA Region VI during this time, which was affected by Hurricane Katrina, reached nearly $40 billion, while FEMA Region X had obligations of $647 million. See figure 10 for more information.

Appendix I: GAO Analyses of the Number of Disaster Declarations and Amount of Obligations
Page 57 GAO-12-838 Federal Disaster Assistance
Figure 10: Number of Disaster Declarations and Amount of Obligations by FEMA Region during Fiscal Years 2004 through 2011
Note: American Samoa, Federated States of Micronesia, Guam, Marshall Islands, U.S. Virgin Islands, Commonwealth of the Northern Mariana Islands, and Commonwealth of Puerto Rico are not visually represented in the figure, but the number of disaster declarations and obligations due to these jurisdictions were included in the figure under Regions II and IX. Specifically, the U.S. Virgin Islands and Commonwealth of Puerto Rico are served by FEMA Region II, and America Samoa, Federated States of Micronesia, Guam, Marshall Islands, and Commonwealth of the Northern Mariana Islands are served by FEMA Region IX.

Appendix I: GAO Analyses of the Number of Disaster Declarations and Amount of Obligations
Page 58 GAO-12-838 Federal Disaster Assistance
FEMA classifies major disaster declarations by incident type, and these types include floods, tornadoes, and hurricanes, among other types of disasters—both natural and man-made. As shown in table 11, the most frequent type of incident was, according to FEMA data, severe storms, which accounted for 71 percent of the declarations during fiscal years 2004 through 2011.
Table 11: Disaster Declarations by Incident Type during Fiscal Years 2004 through 2011
Incident typea Number of declarations Percentage of total Severe storm 385 71 Hurricane 37 7 Flood 34 6 Fire 21 4 Snow 20 4 Severe ice storm 12 2 Tornado 8 1 Typhoon 7 1 Other 5 1 Earthquake 4 1 Tsunami 3 1 Freezing 2 Less than 0.5 Dam/levee break 1 Less than 0.5 Total 539 100
Source: GAO analysis of FEMA data. aWe are reporting the incident type for each disaster declaration as assigned by FEMA.
FEMA obligates funds from the Disaster Relief Fund (DRF) to help jurisdictions respond to and recover from declared disasters. FEMA classifies these funds into five categories: PA, Individual Assistance, Hazard Mitigation, Mission Assignments, and Administration. Table 12 shows the obligations for each category by jurisdiction.

Appendix I: GAO Analyses of the Number of Disaster Declarations and Amount of Obligations
Page 59 GAO-12-838 Federal Disaster Assistance
Table 12: Obligations for Disaster Declarations during Fiscal Years 2004 through 2011, by Jurisdiction, as of January 31, 2012
(Dollars in millions)
Disaster assistance
Jurisdiction Public
Assistance Individual
Assistance Hazard
Mitigation Mission
Assignment Total
assistance Administration Grand
total Alabama (including Katrina)
$656 $903 $99 $383 $2,041 $414 $2,456
Alabama (excluding Katrina)
536 297 53 320 1,206 228 1,433
Alaska 81 5 7 1 95 25 120 American Samoa 74 66 4 9 153 64 217 Arizona 43 0 2 0 44 9 53 Arkansas 372 53 50 3 477 80 557 California 1,057 113 76 4 1,251 117 1,368 Colorado 0 1 a a 1 2 3 Connecticut 38 18 2 a 58 28 85 Delaware 12 0 1 0 12 2 14 District of Columbia 12 0 0 0 12 1 13 Federated States of Micronesia
16 8 1 a 25 8 33
Florida (including Katrina)
4,904 2,201 498 847 8,449 1,128 9,578
Florida (excluding Katrina)
4,687 2,201 490 847 8,225 1,105 9,331
Georgia 190 80 57 1 329 94 422 Guam 1 0 0 0 1 1 2 Hawaii 56 16 4 a 76 17 93 Idaho 12 0 a 0 12 4 17 Illinois 251 481 23 3 757 98 855 Indiana 213 140 40 3 396 66 463 Iowa 1,626 227 296 10 2,158 169 2,327 Kansas 973 89 94 4 1,160 71 1,231 Kentucky 375 102 45 2 524 108 632 Louisiana (including Katrina)
13,682 11,353 981 2,742 28,758 3,579 32,337
Louisiana (excluding Katrina)
1,770 991 172 328 3,261 587 3,848
Maine 74 4 6 a 84 21 $105 Maryland 96 0 2 0 98 6 104 Massachusetts 173 99 9 1 282 58 340 Michigan 15 45 4 0 64 8 72 Minnesota 168 38 13 3 222 41 264 Mississippi (including Katrina)
3,561 3,111 296 1,207 8,174 2,072 10,246

Appendix I: GAO Analyses of the Number of Disaster Declarations and Amount of Obligations
Page 60 GAO-12-838 Federal Disaster Assistance
Disaster assistance
Jurisdiction Public
Assistance Individual
Assistance Hazard
Mitigation Mission
Assignment Total
assistance Administration Grand
total Mississippi (excluding Katrina)
107 54 6 13 180 56 236
Missouri 592 112 66 152 923 137 1,060 Montana 32 7 1 0 40 17 57 Nebraska 292 8 29 a 329 37 366 Nevada 21 2 2 a 25 5 30 New Hampshire 91 15 12 a 119 28 147 New Jersey 193 232 37 2 464 71 535 New Mexico 57 8 1 0 66 17 82 New York 839 266 40 22 1,168 152 1,320 North Carolina 152 102 5 1 259 70 329 North Dakota 437 209 21 42 710 146 856 Northern Mariana Islands
10 14 2 0 26 6 32
Ohio 238 92 29 1 359 45 404 Oklahoma 463 37 38 1 539 82 622 Oregon 106 9 19 0 134 24 159 Pennsylvania 276 298 25 10 610 85 695 Puerto Rico 152 485 17 9 664 99 763 Rhode Island 27 42 4 a 73 18 91 South Carolina 43 8 3 0 54 7 61 South Dakota 200 13 8 1 222 52 273 Tennessee 332 203 56 2 593 118 711 Texas 2,795 1,843 395 280 5,313 1,056 6,369 Utah 28 0 1 0 28 7 36 Vermont 51 28 3 1 82 36 118 Virgin Islands 18 0 1 0 19 8 27 Virginia 144 14 6 a 164 22 187 Washington 209 43 41 a 293 58 352 West Virginia 108 117 19 12 256 58 314 Wisconsin 113 138 30 a 282 50 332 Wyoming 8 3 a 0 11 3 15 Total $36,759 $23,500 $3,522 $5,761 $69,542 $10,806 $80,349
Source: GAO analysis of FEMA data.
Note: Total obligations include obligations for Hurricane Katrina and do not factor in jurisdictions’ obligations that exclude Hurricane Katrina. aObligations less than $0.5 million

Appendix I: GAO Analyses of the Number of Disaster Declarations and Amount of Obligations
Page 61 GAO-12-838 Federal Disaster Assistance
Obligations on a per person basis varied for disasters declared during fiscal years 2004 through 2011. For example, including Hurricane Katrina, Louisiana had the highest per capita obligations at $7,236, but excluding obligations for Hurricane Katrina, American Samoa had the highest obligations at $3,795 per person. For the lowest obligations per person, Colorado had 81 cents and the Marshall Islands had zero. See tables 13 and 14 for obligations on a per person basis for all 58 jurisdictions when including and excluding obligations for Hurricane Katrina, respectively.
Table 13: Obligations Per Person Including Hurricane Katrina for Disaster Declarations during Fiscal Years 2004 through 2011, by Jurisdiction
Rank order Jurisdiction
Obligated per person as of January 31, 2012
1. Louisiana $7,236 2. American Samoa 3,795 3. Mississippi 3,602 4. North Dakota 1,332 5. Iowa 795 6. Florida 599 7. Alabama 552 8. Northern Mariana Islands 460 9. Kansas 458 10. South Dakota 362 11. Federated States of Micronesia 307 12. Texas 305 13. Virgin Islands 245 14. Nebraska 214 15. Arkansas 208 16. Puerto Rico 200 17. Vermont 194 18. Alaska 191 19. Missouri 189 20. Oklahoma 180 21. West Virginia 174 22. Kentucky 156 23. Tennessee 125 24. New Hampshire 119 25. Rhode Island 87 26. Maine 82

Appendix I: GAO Analyses of the Number of Disaster Declarations and Amount of Obligations
Page 62 GAO-12-838 Federal Disaster Assistance
Rank order Jurisdiction
Obligated per person as of January 31, 2012
27. Hawaii 77 28. Indiana 76 29. New York 70 30. Illinois 69 31. New Jersey 64 32. Montana 63 33. Wisconsin 62 34. Washington 60 35. Pennsylvania 57 36. Minnesota 54 37. Massachusetts 54 38. Georgia 52 39. Oregon 46 40. New Mexico 45 41. North Carolina 41 42. California 40 43. Ohio 36 44. Wyoming 29 45. Virginia 26 46. Connecticut 25 47. District of Columbia 22 48. Maryland 20 49. Delaware 18 50. Utah 16 51. South Carolina 15 52. Nevada 15 53. Idaho 13 54. Guam 12 55. Arizona 10 56. Michigan 7 57. Colorado 0.81 58. Marshall Islands 0
Total $23,362
Source: GAO analysis of FEMA data.

Appendix I: GAO Analyses of the Number of Disaster Declarations and Amount of Obligations
Page 63 GAO-12-838 Federal Disaster Assistance
Table 14: Obligations Per Person Excluding Hurricane Katrina for Disaster Declarations during Fiscal Years 2004 through 2011, by Jurisdiction
Rank order Jurisdiction
Obligated per person as of January 31, 2012
1. American Samoa $3,795 2. North Dakota 1,332 3. Louisiana 861 4. Iowa 795 5. Florida 584 6. Northern Mariana Islands 460 7. Kansas 458 8. South Dakota 362 9. Alabama 322 10. Federated States of Micronesia 307 11. Texas 305 12. Virgin Islands 245 13. Nebraska 214 14. Arkansas 208 15. Puerto Rico 200 16. Vermont 194 17. Alaska 191 18. Missouri 189 19. Oklahoma 180 20. West Virginia 174 21. Kentucky 156 22. Tennessee 125 23. New Hampshire 119 24. Rhode Island 87 25. Mississippi 83 26. Maine 82 27. Hawaii 77 28. Indiana 76 29. New York 70 30. Illinois 69 31. New Jersey 64 32. Montana 63 33. Wisconsin 62 34. Washington 60

Appendix I: GAO Analyses of the Number of Disaster Declarations and Amount of Obligations
Page 64 GAO-12-838 Federal Disaster Assistance
Rank order Jurisdiction
Obligated per person as of January 31, 2012
35. Pennsylvania 57 36. Minnesota 54 37. Massachusetts 54 38. Georgia 52 39. Oregon 46 40. New Mexico 45 41. North Carolina 41 42. California 40 43. Ohio 36 44. Wyoming 29 45. Virginia 26 46. Connecticut 25 47. District of Columbia 22 48. Maryland 20 49. Delaware 18 50. Utah 16 51. South Carolina 15 52. Nevada 15 53. Idaho 13 54. Guam 12 55. Arizona 10 56. Michigan 7 57. Colorado 0.81 58. Marshall Islands 0
Total $13,222
Source: GAO analysis of FEMA data.

Appendix II: Objectives, Scope, and Methodology
Page 65 GAO-12-838 Federal Disaster Assistance
This report addresses the following questions: (1) For each fiscal year from 2004 through 2011, how many disaster declaration requests did FEMA receive, how many were approved, for which types of disasters, and how much were the associated obligations from the DRF? (2) What criteria has FEMA used to recommend to the President that a disaster declaration is warranted for PA, and to what extent does FEMA assess whether an effective response to a disaster is beyond the capabilities of state and local governments? (3) How does FEMA determine whether a cost share adjustment recommendation for PA is warranted and how much additional federal assistance did jurisdictions receive during fiscal years 2004 through 2011 because of cost share adjustments? (4) What were FEMA’s administrative cost percentages for disaster declarations during fiscal years 2004 through 2011, how have they changed over time, and what actions is FEMA taking, if any, to reduce the costs of delivering disaster assistance funds?
To determine how many disaster declaration requests FEMA received, how many were approved, for which types of disasters, and how much the associated obligations were from the DRF, we obtained data for each disaster declaration approved during fiscal years 2004 through 2011.1
1The obligations data were current as of January 31, 2012. When finalizing our study, we received projected obligations data from FEMA that included updated actual obligations as of April 30, 2012. However, we did not receive detailed actual obligations data that would have allowed us to update all of our actual obligations data analysis, so this analysis remained as of January 31, 2012.
We focused on this time frame because it contains the most current data for disaster declarations. It also comprises the time period after FEMA was merged into the newly created DHS, on March 1, 2003, and predates Hurricane Katrina in 2005. We focused primarily on fiscal years 2004 through 2011; however, to provide historical context and to compare results across similar periods, we also reviewed obligations data from fiscal years 1989 through 2011. In addition, to provide further historical perspective, we include information on the number of disaster declarations by jurisdiction from the first presidential disaster declaration in fiscal year 1953 through fiscal year 2011 in appendix I. FEMA provided data to us from its National Emergency Management Information System (NEMIS) and Integrated Financial Management Information System (IFMIS). To determine whether the data were reliable, we reviewed the data that FEMA officials provided and discussed data quality control procedures to ensure the integrity of the data with them. We determined
Appendix II: Objectives, Scope, and Methodology

Appendix II: Objectives, Scope, and Methodology
Page 66 GAO-12-838 Federal Disaster Assistance
that the data we used from these systems were sufficiently reliable for the purposes of this report.
To determine the criteria that FEMA used to recommend to the President that a disaster declaration was warranted for PA, and to what extent FEMA assessed whether an effective response to a disaster was beyond the capabilities of jurisdictions, such as state and local governments, we examined FEMA policies, regulations, and other documents related to the disaster declarations process. To determine the probability of a disaster declaration request being approved for PA if the Preliminary Damage Assessments (PDA) met or exceeded the PA per capita indicator, we obtained and analyzed data on FEMA’s PDAs from fiscal years 2008 through 2011. For this analysis, we used 4 years of data (fiscal years 2008 through 2011) instead of 8 years of data (fiscal years 2004 through 2011) that we used for other analyses because FEMA did not have data for fiscal years 2004 through 2007 in an electronic format. We believe that our analysis of 4 years of data is sufficient for purposes of this report. Specifically, we analyzed 246 disaster declarations during fiscal years 2008 through 2011, and excluded 293 declarations during fiscal years 2004 through 2007 because FEMA had readily available data only for PDAs for fiscal years 2008 through 2011. For each of the 246 disaster declarations, we reviewed the PDAs to determine whether a state requested PA, whether the President approved it, and the extent to which the PA damage estimate exceeded the PA per capita indicator.
In addition, we conducted an analysis to determine whether disaster declarations from 2004 through 2011 would have met the PA per capita indicator if adjusted for the change in per capita personal income since 1986. Our analysis included FEMA’s projected obligations as of April 30, 2012, for only those 508 disaster declarations that had received PA and had been declared during fiscal years 2004 through 2011. We did not analyze the 31 disaster declarations that only received IA. We analyzed obligations instead of PDA damage estimates for PA because FEMA officials stated that estimating the damage from a disaster is sometimes stopped when the estimate equals or exceeds the PA per capita indicator. Therefore, we concluded that conducting the analysis using projected obligations would be more accurate than using incomplete PDA damage estimates for PA. In addition, we separately analyzed actual obligations for 144 closed disaster declarations because closed declarations would be either complete or very close to being complete. To determine whether the data were reliable, we reviewed the data that FEMA officials provided and discussed data quality control procedures to ensure the integrity of

Appendix II: Objectives, Scope, and Methodology
Page 67 GAO-12-838 Federal Disaster Assistance
the data with them. We determined that the data we used from PDAs were sufficiently reliable for the purposes of this report.
To determine how FEMA evaluated whether a cost share adjustment recommendation was warranted and how much additional federal assistance states received during fiscal years 2004 through 2011 because of the adjustments, we obtained and reviewed relevant laws, regulations, and policies. We also obtained and analyzed the cost share adjustments and types requested, approved, and denied during fiscal years 2004 through 2011. In addition, we interviewed FEMA officials who process cost share adjustment requests and participate in making recommendations to the President as to whether the requests should be approved or denied. We also reviewed internal control standards for the federal government related to ensuring management directives are carried out and that actions are taken to address risks.2
To determine FEMA’s administrative cost percentages for disaster declarations, we obtained DRF actual obligations, projected obligations, and related data for all 1,221 disaster declarations from fiscal years 1989 through 2011. While the focus of our objective was fiscal years 2004 through 2011, we obtained obligations data back to fiscal year 1989 to assess potential trends over time because FEMA only maintains obligations data since then. To assess FEMA’s current practices, we compared FEMA’s administrative cost percentages for disaster declarations during fiscal years 2004 through 2011 with FEMA’s target ranges for administrative cost percentages. To identify potential trends over time, we compared FEMA’s administrative cost percentages during fiscal years 1989 through 2003 with FEMA’s administrative cost percentages during fiscal years 2004 through 2011 and with FEMA’s target ranges. According to FEMA officials, administrative costs are typically higher in the early months of a declaration, typically decreasing as the declaration matures (that is, as labor-intensive response activities decline). In order to ensure the results of both analyses were not skewed
To determine whether the data were reliable, we reviewed the data that FEMA officials provided and discussed data quality control procedures to ensure the integrity of the data with them. We determined that the cost share adjustment data were sufficiently reliable for the purposes of this report.
2GAO, Standards for Internal Control in the Federal Government, GAO/AIMD-00-21.3.1 (Washington, D.C.: November 1999).

Appendix II: Objectives, Scope, and Methodology
Page 68 GAO-12-838 Federal Disaster Assistance
by declarations that had not yet matured and whose administrative costs were high, we analyzed actual administrative costs for disaster declarations that were closed as of April 30, 2012. For declarations that were still open as of April 30, 2012, we analyzed actual obligations as of April 30, 2012, plus the amount that FEMA projected to obligate in the future until the declarations are eventually closed. To determine whether the data were reliable, we reviewed the data that FEMA officials provided and discussed data quality control procedures to ensure the integrity of the data with them. We determined that the DRF data were sufficiently reliable for the purposes of this report. To determine what actions FEMA is taking, if any, to reduce the costs of delivering disaster assistance, we interviewed FEMA officials and reviewed relevant policies, documents, and briefings.
In addition to conducting interviews with officials in FEMA headquarters for all four objectives, we conducted site visits to two FEMA regions—Regions IV and VI, which had the highest total obligations during fiscal years 2004 through 2011. The regional administrative offices were located in Atlanta, Georgia, and Denton, Texas, respectively. At each region, we interviewed the Regional or Deputy Administrator and various other personnel. In addition, we visited the emergency management agencies for Georgia and Oklahoma—one state within each of the two FEMA regions. We selected the two state emergency management agencies—Georgia and Oklahoma—based on their respective proximity to FEMA’s regional offices, their high level of experience with disasters, and their availability for a visit during September 2011. We wanted to avoid states that were actively responding to a disaster during that time. While the information we obtained on these site visits is not generalizable, the visits provided important insights into the disaster declaration process.
We conducted this performance audit from July 2011 through September 2012 in accordance with generally accepted government auditing standards. Those standards require that we plan and perform the audit to obtain sufficient, appropriate evidence to provide a reasonable basis for our findings and conclusions based on our audit objectives. We believe that the evidence obtained provides a reasonable basis for our findings and conclusions based on our audit objectives.

Appendix III: Total Public Assistance Indicator Amount for Fiscal Year 2012, by Jurisdiction
Page 69 GAO-12-838 Federal Disaster Assistance
FEMA uses a PA per capita indicator to help determine a jurisdiction’s need for federal assistance in the wake of a disaster. Table 15 shows how the indicator is calculated for each jurisdiction. FEMA multiplies the 2010 population for each jurisdiction by the PA per capita indicator for the fiscal year in which the disaster occurs. In fiscal year 2012, the PA per capita indicator is $1.35. The results of these calculations are the total indicator amounts in table 15. If the PA damage estimate exceeds the total indicator amount, a jurisdiction is likely to receive a major disaster declaration.
Table 15: 2010 Population and Total PA Per Capita Indicator Amount for Fiscal Year 2012, by Jurisdiction
Jurisdiction 2010 population Total indicator amount
(based on $1.35 per capita)a California 37,253,956 $50,292,841 Texas 25,145,561 33,946,507 New York 19,378,102 26,160,438 Florida 18,801,310 25,381,769 Illinois 12,830,632 17,321,353 Pennsylvania 12,702,379 17,148,212 Ohio 11,536,504 15,574,280 Michigan 9,883,640 13,342,914 Georgia 9,687,653 13,078,332 North Carolina 9,535,483 12,872,902 New Jersey 8,791,894 11,869,057 Virginia 8,001,024 10,801,382 Washington 6,724,540 9,078,129 Massachusetts 6,547,629 $,839,299 Indiana 6,483,802 8,753,133 Arizona 6,392,017 8,629,223 Tennessee 6,346,105 8,567,242 Missouri 5,988,927 8,085,051 Maryland 5,773,552 7,794,295 Wisconsin 5,686,986 7,677,431 Minnesota 5,303,925 7,160,299 Colorado 5,029,196 6,789,415 Alabama 4,779,736 6,452,644 South Carolina 4,625,364 6,244,241 Louisiana 4,533,372 6,120,052
Appendix III: Total Public Assistance Indicator Amount for Fiscal Year 2012, by Jurisdiction
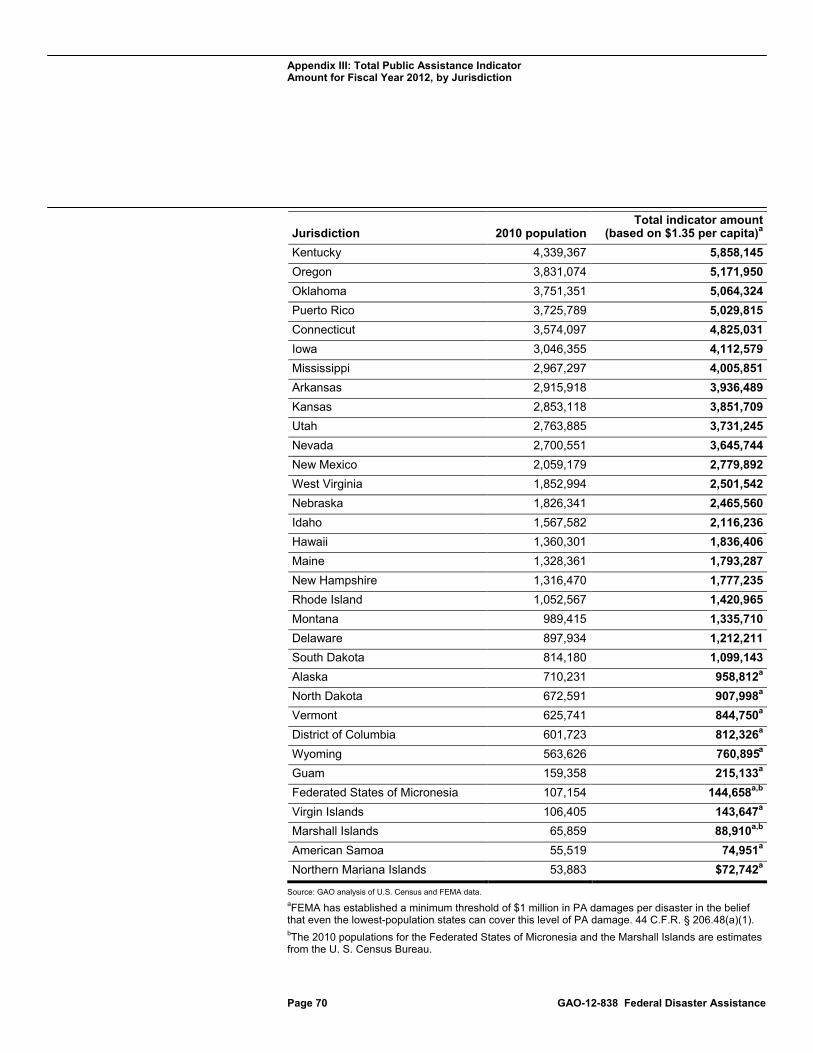
Appendix III: Total Public Assistance Indicator Amount for Fiscal Year 2012, by Jurisdiction
Page 70 GAO-12-838 Federal Disaster Assistance
Jurisdiction 2010 population Total indicator amount
(based on $1.35 per capita)a Kentucky 4,339,367 5,858,145 Oregon 3,831,074 5,171,950 Oklahoma 3,751,351 5,064,324 Puerto Rico 3,725,789 5,029,815 Connecticut 3,574,097 4,825,031 Iowa 3,046,355 4,112,579 Mississippi 2,967,297 4,005,851 Arkansas 2,915,918 3,936,489 Kansas 2,853,118 3,851,709 Utah 2,763,885 3,731,245 Nevada 2,700,551 3,645,744 New Mexico 2,059,179 2,779,892 West Virginia 1,852,994 2,501,542 Nebraska 1,826,341 2,465,560 Idaho 1,567,582 2,116,236 Hawaii 1,360,301 1,836,406 Maine 1,328,361 1,793,287 New Hampshire 1,316,470 1,777,235 Rhode Island 1,052,567 1,420,965 Montana 989,415 1,335,710 Delaware 897,934 1,212,211 South Dakota 814,180 1,099,143 Alaska 710,231 958,812a North Dakota 672,591 907,998a Vermont 625,741 844,750a District of Columbia 601,723 812,326a Wyoming 563,626 760,895a Guam 159,358 215,133a Federated States of Micronesia 107,154 144,658a,b Virgin Islands 106,405 143,647a Marshall Islands 65,859 88,910a,b American Samoa 55,519 74,951a Northern Mariana Islands 53,883 $72,742a
Source: GAO analysis of U.S. Census and FEMA data. aFEMA has established a minimum threshold of $1 million in PA damages per disaster in the belief that even the lowest-population states can cover this level of PA damage. 44 C.F.R. § 206.48(a)(1). bThe 2010 populations for the Federated States of Micronesia and the Marshall Islands are estimates from the U. S. Census Bureau.

Appendix IV: Description of Three Approaches to Measure a Jurisdiction’s Fiscal Capacity
Page 71 GAO-12-838 Federal Disaster Assistance
The Stafford Act requires that a governor’s request for a major disaster declaration be based on a finding that the disaster is of such severity and magnitude that an effective response is beyond the capabilities of the jurisdiction and that federal assistance is necessary.1
Jurisdictions’ abilities to finance their own disaster relief and recovery vary with their fiscal capacity, among other factors. A jurisdiction’s fiscal capacity is defined as the ability of a government to raise revenue from its own sources, by taxes, license fees, user charges, and public enterprises, among other devices. Fiscal capacity is usually expressed as a percentage of the national average for the 50 states plus the District of Columbia, in the form of an index number. For example, if a jurisdiction’s capacity is equal to 100 percent or 90 percent of the national average, its index number would be 100 or 90, respectively. In general, the ability of jurisdictions to pay for public services increases with the size of their economies. The simplest application of fiscal capacity criteria to disaster assistance is an adjustment of the per capita indicator for every jurisdiction. “Richer” jurisdictions—those above the national average—would have a higher level, reflecting their greater ability to pay, while “poorer” jurisdictions would have a lower level. The fiscal capacity index could be converted into a percentage (for instance, 110 = 110 percent or 90 = 90 percent) and applied to each jurisdiction’s per capita indicator
In the wake of a disaster, FEMA prepares dollar estimates of the damage to public infrastructure incurred in an area that would be eligible for federal assistance under a federal major disaster declaration. Currently the key metric for determining eligibility for federal disaster assistance is a “per capita indicator,” which, since 1999, has been adjusted annually for inflation. For 2012, the indicator is $1.35 per capita (that is, total estimated damages eligible for federal PA divided by the jurisdiction’s population equals $1.35 or more). Damage estimates in excess of this number typically result in FEMA recommending that the President issue a major disaster declaration, which makes jurisdictions eligible for federal reimbursement of at least 75 percent of certain repair and replacement costs. The per capita indicator FEMA currently uses is not a measure of a jurisdiction’s fiscal capacity to address the damages caused by a disaster. Rather, there is an assumption that generally jurisdictions are unable without federal major disaster assistance to rectify damages that equal or exceed $1.35 per capita.
142 U.S.C. § 5170.
Appendix IV: Description of Three Approaches to Measure a Jurisdiction’s Fiscal Capacity

Appendix IV: Description of Three Approaches to Measure a Jurisdiction’s Fiscal Capacity
Page 72 GAO-12-838 Federal Disaster Assistance
($1.35 times the population) to get an adjusted indicator. For example, a jurisdiction with a population of 10 million would have a per capita indicator of $13.5 million dollars ($1.35 times its 10 million population). If the jurisdiction’s capacity index was 100 percent, its capacity threshold would be the same as the current indicator—$13.5 million. However, if the jurisdiction’s fiscal capacity index was 110 (indicating a fiscal capacity index 10 percent above the national average), its damage threshold would be $14.85 million—$13.5 million plus 10 percent of $13.5 million. The variation in the results could be narrowed, if desired, by setting upper and lower limits to the adjustments, among other possible methods. However, adjusting the per capita indicator according to a jurisdiction’s fiscal capacity would not necessarily reduce total federal spending. It is possible that disaster assistance adjusted by fiscal capacity, and focused on jurisdictions with below-average fiscal capacity, could increase total federal spending. How total annual spending is affected would depend on the specific disasters taking place for that year, as well as the affected jurisdictions.
In addition to the theoretical aspects of comparing and contrasting various measurements of fiscal capacity, there are other matters to consider.2
Simple and easy to calculate: For political acceptance and analytical ease, the methodology of measurement should be as simple as possible. For practicality and transparency, a measure should be easy and inexpensive to calculate.
Specifically, there are certain attributes that are desirable in a fiscal capacity measure. These attributes could help FEMA determine the extent to which the agency could use measurements of jurisdiction fiscal capacity when determining a jurisdiction’s eligibility for federal assistance. These attributes include the following:
Convenient, available, and timely: Ideally the data for a measure would be routinely collected, checked, and published by a government agency on a timely basis. For example, the measurement should be possible on an annual basis with as little a time lag as possible, in order to provide the most timely indicator of jurisdictions’ capacities.
2Stephen M. Barro, “Macroeconomic Versus RTS Measures of Fiscal Capacity: Theoretical Foundations and Implications for Canada,” Institute of Intergovernmental Relations, Working Paper, (Queens University, 2002), 1-5.

Appendix IV: Description of Three Approaches to Measure a Jurisdiction’s Fiscal Capacity
Page 73 GAO-12-838 Federal Disaster Assistance
Comprehensive: A measure should be comprehensive with respect to the implementation of its approach. Incompleteness could bias results.
Analytically sound: The principal analytical choice in capacity measurement is between economic measures that aim for comprehensive measurement free of double-counting, and tax base measures that in some way take account of governments’ choices in how to tax.3
Does not affect or is not affected by any individual jurisdiction’s fiscal choices: Capacity measures should not be affected by or affect a jurisdiction’s actual fiscal choices, in terms of what to tax, how to tax, or how much to tax. In principle a government’s fiscal behavior could affect its own tax bases. No capacity measure makes any adjustments based on the impact of taxes on a state’s economy because of the extreme difficulty of arriving at a simple method of making such adjustment that would earn political consensus.
There is debate among economists as to which type of measurement (economic or tax base) is more analytically sound.
The three fiscal capacity measures discussed below provide various methods that can be used to determine a jurisdiction’s fiscal capacity. Each of these measures has benefits and potential shortcomings regarding the extent to which they measure a jurisdiction’s fiscal capacity.
State personal income (PCI): As a measurement of a jurisdiction’s fiscal capacity, state personal income is simple, available, and timely. The personal income of all residents of a jurisdiction consists of labor earnings, proprietors’ and partnership income, rent, interest, dividends, and transfers (public cash benefits). It is the most commonly used measure in the United States for federal grants. PCI is simple and familiar to most people, and it is routinely calculated and published by the federal government on a jurisdiction-by-jurisdiction basis. More local measures of personal income are less comprehensive, for lack of data. Some jurisdictions may choose to tax only part of income, or not to tax it at all.
3The three fiscal measures we discuss in this appendix are economic measures. However, in addition to TTR, personal resident income, and gross state product, Representative Tax System (RTS) is a tax base measure. We did not include RTS as a potential means for FEMA to assess fiscal capacity because it is not currently calculated for U.S. jurisdictions, although it could be should FEMA choose to do so.
Fiscal Capacity Measurements

Appendix IV: Description of Three Approaches to Measure a Jurisdiction’s Fiscal Capacity
Page 74 GAO-12-838 Federal Disaster Assistance
PCI aims to be a comprehensive measure of residents’ personal income, without regard to how they are taxed.
PCI is not a comprehensive measure of a jurisdiction’s fiscal capacity and is affected by a jurisdiction’s fiscal choices. The principal shortcoming of PCI is its failure to reflect a jurisdiction’s ability to raise tax revenue from nonresidents, also known as tax exporting. For example, a jurisdiction government may tax nonresident commuters, property owners, shoppers, and tourists. The ability to export taxes varies sharply across jurisdictions. Also, data on one component of personal income, accrued capital gains, is not available. More generally, changes in asset values are not captured in any fiscal capacity measures, because of lack of data. Another missing element in PCI is the net income of a jurisdiction’s government enterprises. An example is state-owned liquor stores, whose profits never pass through private hands. Another example is royalties paid to governments by extractive industries, such as oil, gas, and uranium. These scenarios amount to income received by a jurisdiction’s residents, through their government. In one state (Alaska), a share of such revenue—a “bonus” payment—is paid directly to state residents, which would appear as part of PCI. To a limited extent, PCI is biased to the extent to which a jurisdiction government finances transfer payments with taxes on income, since this income is counted twice, once by source and the second time by receipt.
Gross state product (GSP): As a measure of a jurisdiction’s fiscal capacity, GSP is simple, available, timely, and not affected by a jurisdiction’s fiscal choices. Also called gross domestic product by state, GSP consists of all income “produced” in a state. It includes labor earnings of those who work in a jurisdiction, irrespective of their residence, the net income of business firms operating in a jurisdiction, indirect business taxes paid to the governments of the jurisdiction, and the output of the public sector (in national income accounting, government output is valued at cost). GSP partially captures the ability of a jurisdiction to export taxes, since it includes income received by nonresidents and by the residents’ own governments directly. As with PCI, with the benefit of government publication, the data are available on a timely basis and are easily converted into a fiscal capacity index. It is less affected by a jurisdiction’s fiscal choices than PCI because it does not double-count income.
Similar to PCI, GSP is not a comprehensive measure of a jurisdiction’s fiscal capacity. More specifically, PCI includes income received by a jurisdiction’s residents, but not income generated in a jurisdiction but

Appendix IV: Description of Three Approaches to Measure a Jurisdiction’s Fiscal Capacity
Page 75 GAO-12-838 Federal Disaster Assistance
received by nonresidents. GSP does not include income received by a jurisdiction’s residents that originates elsewhere.
Total taxable resources (TTR): As a measure of a jurisdiction’s fiscal capacity, TTR is comprehensive, available, and not affected by jurisdictions’ fiscal choices. According to the Department of the Treasury (Treasury), the object of TTR is to capture the unduplicated sum of PCI and GSP that is susceptible to taxation by a jurisdiction’s government.4 By this means the entirety of income potentially exposed to taxation is measured. In practice the calculation is relatively simple. A jurisdiction’s GSP is supplemented with income received by jurisdiction residents that originated in other jurisdictions. This would include the labor earnings of residents who commute to jobs in other jurisdictions, and the capital income (mainly interest, dividends, rent, and capital gains) of all jurisdiction residents due to asset holdings in other jurisdictions. It excludes indirect business taxes paid to the federal government (such as the payroll tax and federal excises). TTR is used in two grant programs—the Department of Health and Human Services’ Substance Abuse and Mental Health Services Administration’s block grant program and Community Mental Health Service—and is calculated by Treasury.5
TTR is a complex measure of a jurisdiction’s fiscal capacity and is not as timely as other measures. A crude measure of TTR is obtained by simply averaging a jurisdiction’s PCI and GSP. This was done for official TTR estimates between 1992 and 1997. Subsequently the calculations were based more closely on the original conceptual framework for TTR. At present there is a 2-year lag in the publication of TTR estimates by Treasury. As of May of 2012, the most recent year available is 2009. The primary reason for the delay in publishing TTR estimates is the need to wait for federal excise tax revenues and nontax liabilities, and federal civilian enterprise surpluses, to become available. These data are provided to Treasury in August or September for the year ending 20 months prior. According to the Chief of the Regional Product Branch, Regional Product Division, at the Bureau of Economic Analysis, it could
4U.S. Department of the Treasury, Office of Economic Policy, Treasury Methodology for Estimating Total Taxable Resources (TTR), (Washington, D.C.: revised November 2002). http://www.treasury.gov/resource-center/economic-policy/taxable-resources/Pages/Total-Taxable-Resources.aspx. 5Michael L. Compson, “Historical Estimates of Total Taxable Resources for U.S. States, 1981-2000,” The Journal of Federalism, 33:2 (Spring 2003), 55-72.

Appendix IV: Description of Three Approaches to Measure a Jurisdiction’s Fiscal Capacity
Page 76 GAO-12-838 Federal Disaster Assistance
be possible to speed up the availability of TTR by 2 or 3 months. In addition, TTR is less transparent than PCI or GSP. It relies on approximations of capital income (dividends, interest, and rent), since such quantities are not reported by place of origination. It does not discriminate among income flows according to the degree of susceptibility to taxation.
Each of these three measures of a jurisdiction’s fiscal capacity to respond to and recover from a disaster without federal assistance has its limitations and can affect each jurisdiction somewhat differently, compared with using the current $1.35 per capita damage estimate indicator. FEMA’s current per capita indicator is simple and easy to understand, but it is not a measure of a jurisdiction’s fiscal capacity. Nor does FEMA have a useful measure of a jurisdiction’s response capabilities. All current measures of those capabilities are jurisdictions’ self-reported data without reference to common metrics for assessing capability. Because FEMA’s per capita indicator does not comprehensively assess a jurisdiction’s response and recovery capabilities, including a jurisdiction’s fiscal capacity, some combination of these measures could provide a more robust and useful assessment of a jurisdiction’s capability to respond to and recover from a disaster without federal assistance, or with minimal federal assistance. This could include exploring the usefulness of supplementing the current damage indicator (which does not fully reflect changes in inflation since its adoption in 1986) with other measures of a jurisdiction’s fiscal capacity and response capability.
For example, one potential alternative methodology could involve adjusting the per capita indicator for each jurisdiction based on a measure of jurisdiction fiscal capacity. If FEMA were to adjust the PA indicator for inflation, the adjusted PA indicator for fiscal year 2011 would be $2.07. Beginning with the adjusted PA indicator of $2.07, each jurisdiction’s PA indicator could then be adjusted based on that jurisdiction’s fiscal capacity. For example, if the $2.07 base were adjusted for “jurisdiction A,” which has a 2009 TTR index of 71.8, jurisdiction A’s PA indicator would be $1.49. If the $2.07 base were adjusted for “jurisdiction B’s” 2009 TTR index of 149, jurisdiction B’s PA indicator would be $3.08 (see table16). The variation in jurisdiction A’s $1.49 indicator and jurisdiction B’s $3.08 indicator represents the difference in the two jurisdiction’s fiscal capacities in accordance with each jurisdiction’s TTR. In making any changes or enhancements to the methods used to assess a jurisdiction’s fiscal capacity, policymakers would need to consider the relative priority of key
Examples of Fiscal Measures Applied to the Per Capita Indicator
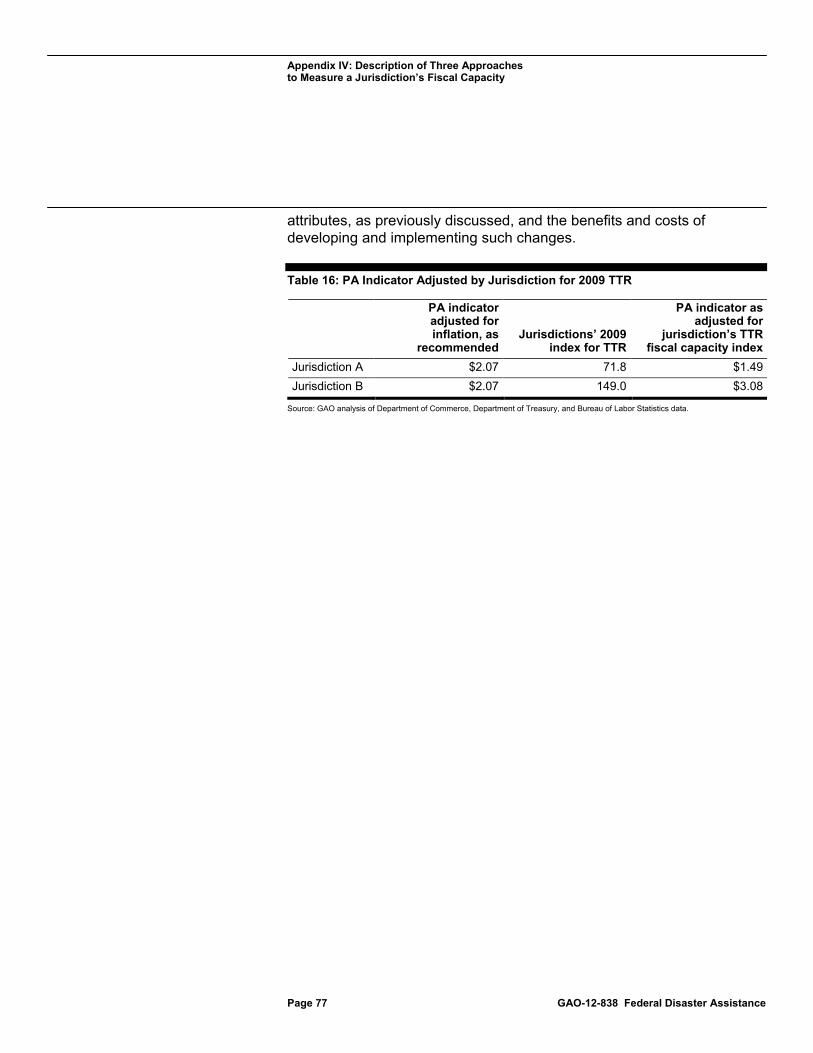
Appendix IV: Description of Three Approaches to Measure a Jurisdiction’s Fiscal Capacity
Page 77 GAO-12-838 Federal Disaster Assistance
attributes, as previously discussed, and the benefits and costs of developing and implementing such changes.
Table 16: PA Indicator Adjusted by Jurisdiction for 2009 TTR
PA indicator adjusted for inflation, as
recommended Jurisdictions’ 2009
index for TTR
PA indicator as adjusted for
jurisdiction’s TTR fiscal capacity index
Jurisdiction A $2.07 71.8 $1.49 Jurisdiction B $2.07 149.0 $3.08
Source: GAO analysis of Department of Commerce, Department of Treasury, and Bureau of Labor Statistics data.

Appendix V: Comments from the Department of Homeland Security
Page 78 GAO-12-838 Federal Disaster Assistance
Appendix V: Comments from the Department of Homeland Security

Appendix V: Comments from the Department of Homeland Security
Page 79 GAO-12-838 Federal Disaster Assistance

Appendix V: Comments from the Department of Homeland Security
Page 80 GAO-12-838 Federal Disaster Assistance

Appendix V: Comments from the Department of Homeland Security
Page 81 GAO-12-838 Federal Disaster Assistance

Appendix VI: GAO Contact and Staff Acknowledgments
Page 82 GAO-12-838 Federal Disaster Assistance
William O. Jenkins Jr., (202) 512-8777 or [email protected]
In addition to the contact named above, Leyla Kazaz (Assistant Director), David Alexander, Lydia Araya, Peter DelToro, Joseph E. Dewechter, Jeffrey Fiore, Carol Henn, R. Denton Herring, Tracey King, Linda Miller, Max Sawicky, and Jim Ungvarsky made key contributions to this report.
Appendix VI: GAO Contact and Staff Acknowledgments
GAO Contact
Staff Acknowledgments
(440978)

The Government Accountability Office, the audit, evaluation, and investigative arm of Congress, exists to support Congress in meeting its constitutional responsibilities and to help improve the performance and accountability of the federal government for the American people. GAO examines the use of public funds; evaluates federal programs and policies; and provides analyses, recommendations, and other assistance to help Congress make informed oversight, policy, and funding decisions. GAO’s commitment to good government is reflected in its core values of accountability, integrity, and reliability.
The fastest and easiest way to obtain copies of GAO documents at no cost is through GAO’s website (www.gao.gov). Each weekday afternoon, GAO posts on its website newly released reports, testimony, and correspondence. To have GAO e-mail you a list of newly posted products, go to www.gao.gov and select “E-mail Updates.”
The price of each GAO publication reflects GAO’s actual cost of production and distribution and depends on the number of pages in the publication and whether the publication is printed in color or black and white. Pricing and ordering information is posted on GAO’s website, http://www.gao.gov/ordering.htm.
Place orders by calling (202) 512-6000, toll free (866) 801-7077, or TDD (202) 512-2537.
Orders may be paid for using American Express, Discover Card, MasterCard, Visa, check, or money order. Call for additional information.
Connect with GAO on Facebook, Flickr, Twitter, and YouTube. Subscribe to our RSS Feeds or E-mail Updates. Listen to our Podcasts. Visit GAO on the web at www.gao.gov.
Contact:
Website: www.gao.gov/fraudnet/fraudnet.htm E-mail: [email protected] Automated answering system: (800) 424-5454 or (202) 512-7470
Katherine Siggerud, Managing Director, [email protected], (202) 512-4400, U.S. Government Accountability Office, 441 G Street NW, Room 7125, Washington, DC 20548
Chuck Young, Managing Director, [email protected], (202) 512-4800 U.S. Government Accountability Office, 441 G Street NW, Room 7149 Washington, DC 20548
GAO’s Mission
Obtaining Copies of GAO Reports and Testimony
Order by Phone
Connect with GAO
To Report Fraud, Waste, and Abuse in Federal Programs
Congressional Relations
Public Affairs
Please Print on Recycled Paper.