gao-17-669r accessible version, department of … · organizational structure since it began...
TRANSCRIPT

Page 1 GAO-17-669R Department of Education
441 G St. N.W. Washington, DC 20548
Accessible Version
June 12, 2017
The Honorable Virginia Foxx Chairwoman Committee on Education and the Workforce House of Representatives
The Honorable Brett Guthrie Chairman Subcommittee on Higher Education and Workforce Development Committee on Education and the Workforce House of Representatives
The Honorable Todd Rokita Chairman Subcommittee on Early Childhood, Elementary and Secondary Education Committee on Education and the Workforce House of Representatives
The Honorable Glenn Grothman House of Representatives
Department of Education: Staffing Levels Have Generally Decreased Over Time, while Contracting Levels Have Remained Relatively Stable
The U.S. Department of Education (Education) plays a key role in supporting educational opportunities for students from kindergarten through postsecondary education, managing approximately $111 billion in funding during fiscal year 2015. This includes distributing grants to states and localities and overseeing compliance with federal education laws. It also includes managing federal student aid programs for students attending institutions of higher education. In fiscal year 2015, Education employed approximately 4,000 full time equivalent (FTE) employees. You asked us to review trends in Education’s staffing levels, use of contracting, and organizational structure since it began operations in fiscal year 1980.1
This report examines trends at Education in:
1. staffing, both in levels and distribution, including what is known about significant factors driving changes in Education’s FTEs and how Education’s trends compare to other selected federal domestic policy agencies;
1The Department of Education was established as a cabinet level agency by the Department of Education Organization Act of 1979. Pub. L. No. 96-88, 93 Stat. 668. This law was signed in October 1979, making fiscal year 1980 the first year of operation.

2. use of contracting, including what is known about the purposes for which contracting is used and factors driving changes in Education’s use of contracts; and,
3. creation of new offices within Education.
To complete work for all three objectives, we reviewed relevant federal laws and Education regulations that pertain to the staffing and organizational structure at Education. We also reviewed previous GAO reports and spoke with Education officials involved with budgeting and management. For our first objective, we analyzed data from the Office of Management and Budget’s (OMB) MAX database. The fiscal years we analyzed varied based on the purpose of a given analysis. Specifically, we reviewed data from fiscal years 1981-2015 to identify overall staffing levels at Education and the distribution of staff among offices during fiscal years 1999-2015.
Page 2 GAO-17-669R Resource Trends at Education
2 The most recent data available at the start of our review was from fiscal year 2015. To compare staffing trends with other selected domestic policy agencies, we used the OMB MAX database FTE information for fiscal years 1991-2015. These selected agencies included another cabinet-level agency—Department of Housing and Urban Development (HUD)—as well as two sub-cabinet agencies—the U.S. Department of Agriculture’s Food and Nutrition Service and the Department of Health and Human Services’ Administration for Children and Families.3 We selected these agencies because, like Education, they are domestic policy agencies that also provide support for children, families, or individuals through grants to state and local governments or loans to eligible individuals.4 For objective two, we analyzed data from the OMB MAX database (fiscal years 1980-2015) to identify overall trends in the proportion of Education obligations that were used for contracting and data from fiscal years 2011-2015 to identify how these contracting obligations were divided among Education’s offices.5 We also used the most recent five years of data from the Federal Procurement Data System-Next Generation (FPDS-NG) (fiscal years 2012-2016) to identify more details about the types of contracts issued by Education. Our analysis focused on obligations and contracting authorities provided to the Department of Education. According to Education officials, the Office of Federal Student Aid (FSA) also receives funding for its debt collection contracts from the Department of the Treasury as a portion of successful collections; these amounts are not included in our analysis because they are not reflected in Education’s OMB MAX data.6 Data reported in MAX are subject to rigorous review and checks through OMB to help ensure consistency of the data. Accordingly, such data were considered reliable for the purpose of this report. We also assessed the 2As required by OMB Circular A-11, agencies develop their budget information and enter the data into the Office of Management and Budget’s budget data system (MAX). FTE data were not available for fiscal year 1980—the year Education was first in operation. We began our analysis of staffing distribution among offices in fiscal year 1999 because this was the first fiscal year that the Office of Federal Student Aid (FSA) was in operation as a performance based organization, and hence, the first year we could consistently compare across offices. 3Our comparison among these selected agencies begins in fiscal year 1991 because the necessary OMB MAX data were not available for the Administration for Children and Families prior to that year.
4Cabinet-level agencies are subject to some statutory staffing requirements such as those in the 1990 Chief Financial Officers Act. These requirements inherently have some effect on staffing levels at cabinet-level agencies, such as the Department of Education and HUD, but not the sub-cabinet level, such as Food and Nutrition Service and Administration for Children and Families.
5We used MAX data for this analysis because it allowed us to compare total obligations and contracting-related obligations. FPDS-NG is the official federal source for contracting data but does not allow for this comparison.
6The Office of Federal Student Aid is named in statute as the “Performance-based organization for the delivery of Federal student financial assistance.” See 20 U.S.C. § 1018. This report will refer to this office as the “Office of Federal Student Aid” or “FSA.”

reliability of FPDS-NG data by (1) reviewing existing information about the FPDS-NG system and the data it produces, (2) speaking with agency officials, and (3) verifying select data elements against source documents. We determined they were sufficiently reliable for our purposes. For objective three, we reviewed documents and organizational charts from Education, as well as relevant federal laws, Education regulations, and executive orders.
We conducted this performance audit from April 2017 to June 2017 in accordance with generally accepted government auditing standards. Those standards require that we plan and perform the audit to obtain sufficient, appropriate evidence to provide a reasonable basis for our findings and conclusions based on our audit objectives. We believe that the evidence obtained provides a reasonable basis for our findings and conclusions based on our audit objectives.
Education Staffing Levels Have Generally Decreased and Staffing Distribution Has
Page 3 GAO-17-669R Resource Trends at Education
Shifted Toward the Office of Federal Student Aid
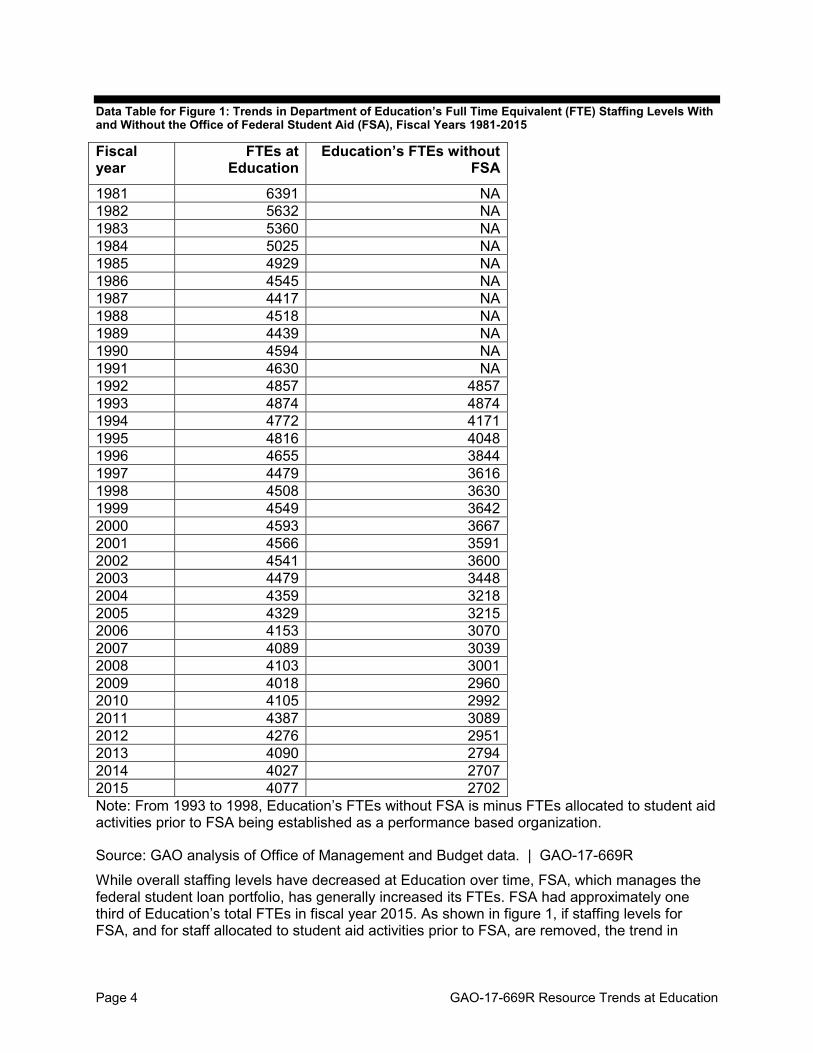
Staffing levels at Education have declined overall from a high of 6,391 FTEs in fiscal year 1981 to 4,077 FTEs in fiscal year 2015 (see fig. 1). More specifically, staffing levels decreased by 23 percent from fiscal years 1981 to 1985, and then declined more gradually, decreasing by 17 percent from fiscal year 1985 to 2015. Within that overall trend, however, FTEs increased for more than a single year period between fiscal years 1989-1993, 1997-2000, and 2009-2011. The 2010 increases in staff coincided with increased funding Education received through the American Recovery and Reinvestment Act.7 As of fiscal year 2015, Education was close to its lowest overall staffing level, which occurred in fiscal year 2009 with 4,018 FTEs. Figure 1: Trends in Department of Education’s Full Time Equivalent (FTE) Staffing Levels With and Without the Office of Federal Student Aid (FSA), Fiscal Years 1981-2015
Note: FTE information was not available in 1980, the first fiscal year that Education was operating. FSA was established in 1998 and began operating as a performance based organization in fiscal year 1999. Prior to federal law establishing FSA in 1998, FTEs for administering federal student aid programs were associated with other offices within the Department and first itemized in the OMB database in 1994.
7Among other purposes, the American Recovery and Reinvestment Act of 2009 (Recovery Act) appropriated $70.3 billion for three education programs: the State Fiscal Stabilization Fund; Title I, Part A of the Elementary and Secondary Education Act of 1965; and Individuals with Disabilities Education Act, Part B.
Data Table for Figure 1: Trends in Department of Education’s Full Time Equivalent (FTE) Staffing Levels With
Page 4 GAO-17-669R Resource Trends at Education
and Without the Office of Federal Student Aid (FSA), Fiscal Years 1981-2015
Fiscal year
FTEs at Education
Education’s FTEs without FSA
1981 6391 NA 1982 5632 NA 1983 5360 NA 1984 5025 NA 1985 4929 NA 1986 4545 NA 1987 4417 NA 1988 4518 NA 1989 4439 NA 1990 4594 NA 1991 4630 NA 1992 4857 4857 1993 4874 4874 1994 4772 4171 1995 4816 4048 1996 4655 3844 1997 4479 3616 1998 4508 3630 1999 4549 3642 2000 4593 3667 2001 4566 3591 2002 4541 3600 2003 4479 3448 2004 4359 3218 2005 4329 3215 2006 4153 3070 2007 4089 3039 2008 4103 3001 2009 4018 2960 2010 4105 2992 2011 4387 3089 2012 4276 2951 2013 4090 2794 2014 4027 2707 2015 4077 2702 Note: From 1993 to 1998, Education’s FTEs without FSA is minus FTEs allocated to student aid activities prior to FSA being established as a performance based organization.
Source: GAO analysis of Office of Management and Budget data. | GAO-17-669R
While overall staffing levels have decreased at Education over time, FSA, which manages the federal student loan portfolio, has generally increased its FTEs. FSA had approximately one third of Education’s total FTEs in fiscal year 2015. As shown in figure 1, if staffing levels for FSA, and for staff allocated to student aid activities prior to FSA, are removed, the trend in
Education’s overall staffing levels shows a greater decrease over time.
Page 5 GAO-17-669R Resource Trends at Education
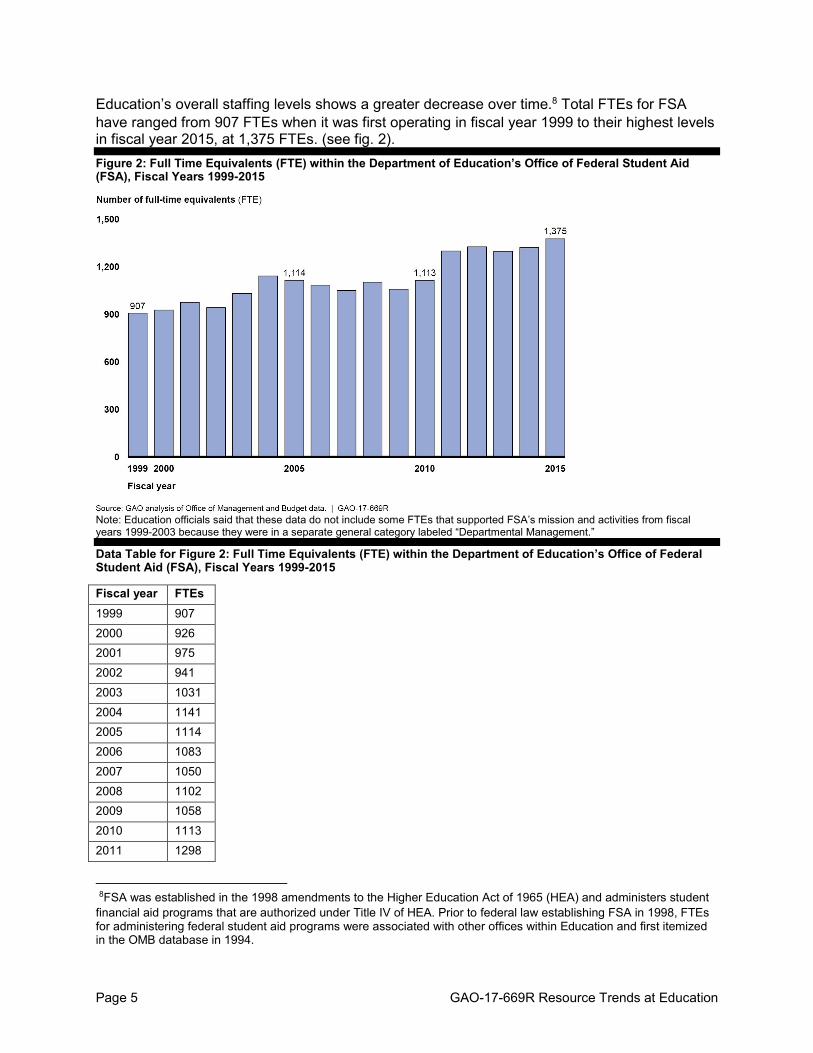
8 Total FTEs for FSA have ranged from 907 FTEs when it was first operating in fiscal year 1999 to their highest levels in fiscal year 2015, at 1,375 FTEs. (see fig. 2). Figure 2: Full Time Equivalents (FTE) within the Department of Education’s Office of Federal Student Aid (FSA), Fiscal Years 1999-2015
Note: Education officials said that these data do not include some FTEs that supported FSA’s mission and activities from fiscal years 1999-2003 because they were in a separate general category labeled “Departmental Management.”
Data Table for Figure 2: Full Time Equivalents (FTE) within the Department of Education’s Office of Federal Student Aid (FSA), Fiscal Years 1999-2015
Fiscal year FTEs 1999 907 2000 926 2001 975 2002 941 2003 1031 2004 1141 2005 1114 2006 1083 2007 1050 2008 1102 2009 1058 2010 1113 2011 1298
8FSA was established in the 1998 amendments to the Higher Education Act of 1965 (HEA) and administers student financial aid programs that are authorized under Title IV of HEA. Prior to federal law establishing FSA in 1998, FTEs for administering federal student aid programs were associated with other offices within Education and first itemized in the OMB database in 1994.
Page 6 GAO-17-669R Resource Trends at Education
Fiscal year FTEs2012 1325 2013 1296 2014 1320 2015 1375
Source: GAO analysis of Office of Management and Budget data. | GAO-17-669R
FSA’s staffing levels increased significantly from fiscal year 2011 to 2015. The timing of this increase was influenced by key changes in federal student loan programs that occurred in 2008-2010, according to Education officials. Specifically, beginning in 2008, changes in the student loan market led numerous schools to transition from the Federal Family Education Loan (FFEL) Program, under which most federal student loans were originated by private lenders, to the Direct Loan Program.9 Education officials also stated that the economic downturn in 2008 coincided with an increase in student loan volume as individuals returned to school. In addition, the SAFRA Act terminated the authority to make or insure new loans under the FFEL Program after June 30, 2010.10 Since then, all subsequent federal student loans have originated under the Direct Loan Program. Education staff are responsible for administering different aspects of the Direct Loan Program than they were for the FFEL Program, such as managing the loan application and award process and overseeing the performance of contracted loan servicers who handle billing, customer service, and other tasks. As such, since 2010, the President requested additional FTEs in several budget requests for Education that specifically state that they were made, in part, to enhance administrative capacity for the Direct Loan Program.
Between fiscal years 1991 and 2015, the combined total FTEs for all federal agencies decreased at a rate of 4 percent.11 We compared staffing levels at Education to three other selected domestic policy agencies that also provide support for children, families, or individuals through grants to state and local governments or loans to eligible individuals. We found that FTE levels at all four agencies dropped during this time period, although Education’s levels decreased less than the others (see fig. 3).12
9The subprime mortgage crisis and the collapse of auction rate securities made it more difficult for lenders participating in the FFEL Program to obtain capital to make loans. As a result, some lenders decided not to originate new federal student loans in the 2008 school year and numerous schools transitioned to the Direct Loan Program.
10Pub. L. No. 111-152, § 2201, 124 Stat. 1029, 1074. The SAFRA Act was enacted as part of the Health Care and Education Reconciliation Act of 2010. Although new loans can no longer be issued under the FFEL Program, Education retains a portfolio of previously issued loans.
11This total does not include FTEs at the U.S. Postal Service, but includes FTEs at all other federal agencies, including civilian employees at the Department of Defense.
12Fiscal year 1991 was the first year data were available for all comparison agencies.

Figure 3: Percent Reductions of Full Time Equivalent (FTE) Staffing Levels for All Federal Agencies
Page 7 GAO-17-669R Resource Trends at Education
Combined and at Four Federal Domestic Policy Agencies, Fiscal Years 1991- 2015
Note: This table provides information starting in fiscal year 1991. Prior to that time, FTE data for the Administration for Children and Families were not consistently available. Cabinet-level agencies are subject to some statutory staffing requirements such as those in the 1990 Chief Financial Officers Act. These requirements inherently have some effect on staffing levels at cabinet-level agencies, but not the sub-cabinet level (e.g., Food and Nutrition Service and Administration for Children and Families.) FTE staffing levels for “All Federal Agencies” does not include FTEs at the U.S. Postal Service, but includes FTEs at all other federal agencies, including civilian employees at the Department of Defense.
Data Table for Figure 3: Percent Reductions of Full Time Equivalent (FTE) Staffing Levels for All Federal Agencies Combined and at Four Federal Domestic Policy Agencies, Fiscal Years 1991- 2015
Percentage decrease in full-time equivalents (FTEs)
All federal agencies -4
Department of Education -12
Food And Nutrition Service -24
Administration for Children and Families -39
Department of Housing and Urban Development
-40
Source: GAO analysis of Office of Management and Budget data. | GAO-17-669R
Staffing level decreases among our four selected agencies ranged from a 12 percent decrease at Education to a 40 percent decrease at HUD. The differences in the extent of these decreases among the four agencies appear to be the result of factors such as changes to individual agencies’ responsibilities. For example, the Administration for Children and Families experienced a significant shift in its responsibilities during this time period: In 1996, the Personal Responsibility and Work Opportunity Reconciliation Act changed the federal role in financing welfare programs, included new federal oversight responsibilities; increased the state role; and corresponded with a reduction in the number of federal employees involved in the program.13 In another example, former HUD secretaries implemented significant staff reductions during this time period as part of the administration’s efforts to reform the agency.
13This law replaced the Aid to Families with Dependent Children program—essentially a federal-state matching grant—with the Temporary Assistance for Needy Families block grant--a $16.5 billion per year fixed federal funding stream to states. The Administration for Children and Families has been responsible for administering both of these programs.

Contracting Expenses Comprise a Consistent Share of Education’s Budget and
Page 8 GAO-17-669R Resource Trends at Education
Frequently Support FSA’s Mission
Contracts represented approximately the same percentage of Education’s total annual obligations in fiscal years 1980-2015, according to OMB data (see fig. 4). In fiscal year 2015, Education obligated approximately $1.9 billion to contracts, which represented approximately 2 percent of its approximately $111 billion in total obligations that year.14 Throughout the history of the department, contracts have represented about 1 to 2 percent of Education’s total annual obligations. Those total obligations have ranged from about $83 billion in fiscal year 1980, to about $145 billion in fiscal year 2009.
Figure 4: Department of Education Contracting Obligations Compared to Total Obligations, Fiscal Years 1980-2015
Note: Education’s obligations for contracts have ranged from a low of approximately $176 million in fiscal year 1983 to a high of about $1.9 billion in fiscal year 2015. Data for Education are not available for 1981. Total obligations include grant funds that Education distributes to states and localities and student aid that it distributions to individuals. Total obligations have ranged from approximately $82 billion to $145 billion, and were approximately $111 billion in fiscal year 2015. The analysis in this figure estimates Education’s contracting obligations related to funds appropriated to the department, using Office of Management and Budget accounting codes for contracting. According to Education officials, FSA receives funding for its debt collection contracts from Treasury as a portion of successful collections; these amounts are not included in our analysis.
Data Table for Figure 4: Department of Education Contracting Obligations Compared to Total Obligations, Fiscal Years 1980-2015
Fiscal years All others Contracts15
1980 10690 244 1981 No data No data 1982 14816 216 1983 15416 176 1984 16833 195 1985 18535 241 14Total obligations include grant funds that Education distributes to states and localities and student aid that it distributions to individuals.
15 (Approximately 1% to 2% of total obligations)

Page 9 GAO-17-669R Resource Trends at Education
Fiscal years All others Contracts15
1986 18685 212 1987 19692 235 1988 20393 251 1989 24152 267 1990 24854 297 1991 28127 347 1992 32032 436 1993 31671 605 1994 33313 529 1995 33819 715 1996 30195 614 1997 36617 697 1998 34785 752 1999 33276 788 2000 41154 954 2001 49782 1066 2002 60804 1156 2003 70165 1307 2004 76122 1307 2005 80647 1796 2006 102504 1272 2007 81786 1254 2008 82519 1216 2009 143217 1341 2010 133019 1629 2011 105034 1653 2012 101700 1678 2013 97923 1845 2014 105988 1841 2015 108741 1857 Source: GAO analysis of Office of Management and Budget data. | GAO-17-669R
Similar to the distribution of FTEs, a significant portion of Education’s contracting obligations are related to FSA.16 For fiscal years 2011-2015, contracting obligations attributed to FSA comprised the majority of total contracting obligations from Education’s appropriations. Currently, FSA contracts with private loan servicers to handle billing and other tasks such as responding to borrowers’ questions about the Direct Loan Program. According to Education officials, total obligations for FSA contracts in a given year are affected by program operations and the economy. In light of the statutory requirement to originate all loans through the Direct Loan Program beginning in July 2010, officials said contracting obligations were increased to handle the increased loan volume. In terms of the economy, if additional students take out loans during an economic downturn, or default on existing loans, it changes the amount of Education’s contracts with loan servicers.17
16FSA was established in the 1998 amendments to the HEA and first began operations in fiscal year 1999.
17GAO has identified challenges associated with overseeing loan servicing contracts and ways that FSA’s oversight of the contracts could be improved. See: GAO, Federal Student Loans: Education Could Improve Direct Loan

In addition to contracts related to federal student aid, contracts related to information technology services and education research also comprise a significant portion of Education’s total contracting obligations, according to our analysis of federal procurement data for fiscal years 2012-2016. For example, over that time Education entered into contracts to maintain information technology and telecommunications equipment at its offices. Education also contracts with external research organizations to evaluate some of its programs, including recent evaluations of School Improvement Grants and the DC Opportunity Scholarship Program.
Page 10 GAO-17-669R Resource Trends at Education
18
Offices Within Education Were Created by Laws, Presidential Executive Orders, and a Directive from Department Leadership
Offices within Education have been created by federal laws,19 presidential executive orders,20 and a directive from department leadership (see fig. 5). About half the key offices at Education as of May 2017 were created when the department began operations, and all key offices except for seven were created by statute.21 Of the 11 offices added since 1980, 6 were created by presidential executive order. The purposes of these offices include building partnerships with outside organizations, providing policy and program guidance to the department, and advising the President on important issues related to elementary, secondary, and postsecondary education.
Program Customer Service and Oversight, GAO-16-523 (Washington, D.C.: May 16, 2016) and GAO, Federal Student Loans: Better Oversight Could Improve Defaulted Loan Rehabilitation, GAO-14-256 (Washington, D.C.: May 6, 2014).
18The Institute of Education Sciences is Education’s primary research and evaluation arm and often contracts with external research organizations to evaluate programs. See: GAO, Education Research: Further Improvements Needed to Ensure Relevance and Assess Dissemination Efforts, GAO-14-8 (Washington D.C.: Dec. 5, 2013).
19See, e.g., the Department of Education Organization Act, Pub. L. No. 96-88 Title II, 93 Stat. 668, 672.
20See, e.g., Exec. Order No. 13531 (February 26, 2010) (Promoting Excellence, Innovation, and Sustainability At Historically Black Colleges and Universities).
21In some cases, the names of offices have changed since they were originally established by statute. In the case of the Institute of Education Sciences (Institute), the responsibilities of the office also changed over time. This office was originally called the “Office of Educational Research and Improvement” and was renamed through the Education Sciences Reform Act. The Education Sciences Reform Act specified that the functions of the Institute were, broadly speaking, to conduct scientifically valid research in education, enhance national capacity to conduct scientifically valid research in education, and disseminate the results of scientifically valid research in education. Education officials described the Institute as different from its predecessor office because, among other things, the Act established increased independence for the Institute. See GAO-14-8 for more information about the Institute.

Figure 5: Key Offices at the Department of Education and the Authority Under Which Each Was Established,
Page 11 GAO-17-669R Resource Trends at Education
as of May 2017
Note: Dates provided for offices established by statute identify the year that Congress passed the relevant law and may have begun their operations in a subsequent year. This figure reflects the names of offices as provided by Education; they do not always correspond to the names provided in federal law or executive order and, in some cases, have changed over time. a Federal law created an officer position corresponding to this office, but did not create the office itself. b Department of Education Organizing Act established an Under Secretary of Education. In 1990, an appropriations act renamed the "Under Secretary of Education" the "Deputy Secretary of Education." In 1991, the National Dropout Prevention Act created the current position of "Under Secretary of Education." c In some cases, an executive order explicitly establishes an office within Education, while in others, Education established an office in response to an executive order.
Text of Organizational chart, Figure 5: Key Offices at the Department of Education and the Authority Under Which Each Was Established, as of May 2017
1) Office of the Secretarya (1979), Est by Statute (Also has tow departments directly reporting (see below).
a) Institute of Education Sciences (1979), Est by Statute
b) Office for Civil Rights (1979), Est by Statute
c) Office of Communications and Outreacha (1979), Est by Statute
d) Office of Education Technology (1994), Est by Statute
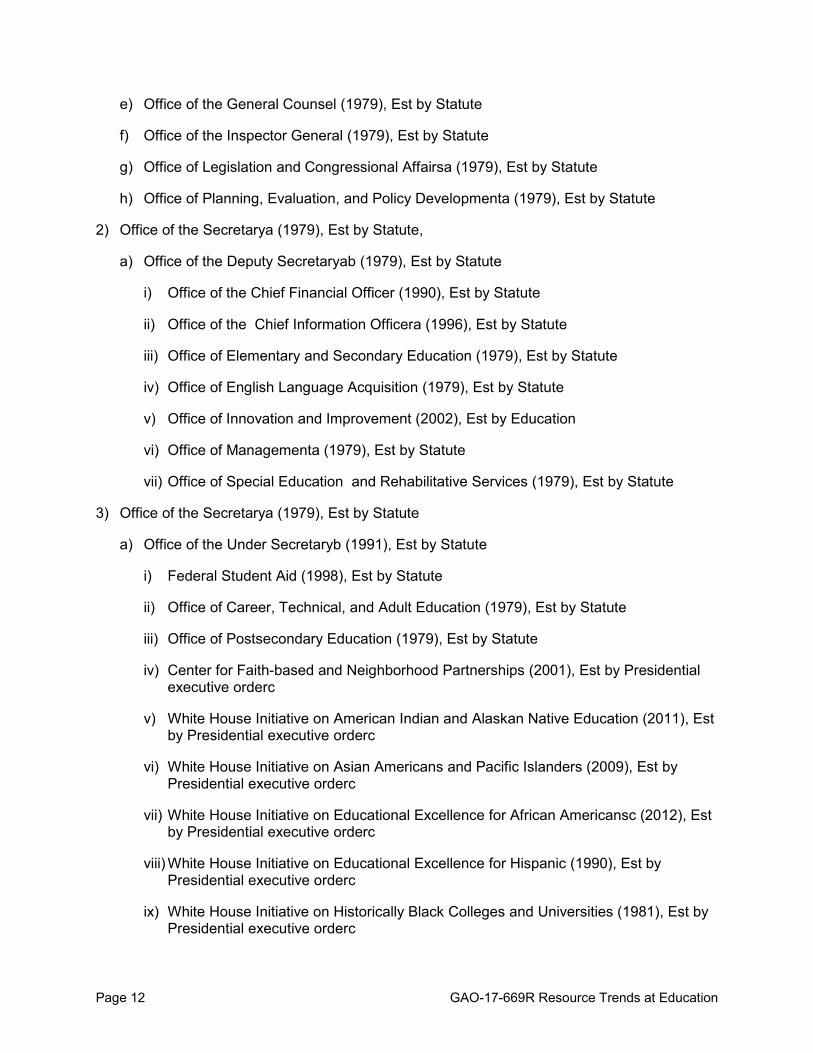
e) Office of the General Counsel (1979), Est by Statute
f) Office of the Inspector General (1979), Est by Statute
g) Office of Legislation and Congressional Affairsa (1979), Est by Statute
h) Office of Planning, Evaluation, and Policy Developmenta (1979), Est by Statute
2) Office of the Secretarya (1979), Est by Statute,
a) Office of the Deputy Secretaryab (1979), Est by Statute
i) Office of the Chief Financial Officer (1990), Est by Statute
ii) Office of the Chief Information Officera (1996), Est by Statute
iii) Office of Elementary and Secondary Education (1979), Est by Statute
iv) Office of English Language Acquisition (1979), Est by Statute
v) Office of Innovation and Improvement (2002), Est by Education
vi) Office of Managementa (1979), Est by Statute
vii) Office of Special Education and Rehabilitative Services (1979), Est by Statute
3) Office of the Secretarya (1979), Est by Statute
a) Office of the Under Secretaryb (1991), Est by Statute
i) Federal Student Aid (1998), Est by Statute
ii) Office of Career, Technical, and Adult Education (1979), Est by Statute
iii) Office of Postsecondary Education (1979), Est by Statute
iv) Center for Faith-based and Neighborhood Partnerships (2001), Est by Presidential executive orderc
v) White House Initiative on American Indian and Alaskan Native Education (2011), Est by Presidential executive orderc
vi) White House Initiative on Asian Americans and Pacific Islanders (2009), Est by Presidential executive orderc
vii) White House Initiative on Educational Excellence for African Americansc (2012), Est by Presidential executive orderc
viii) White House Initiative on Educational Excellence for Hispanic (1990), Est by Presidential executive orderc
ix) White House Initiative on Historically Black Colleges and Universities (1981), Est by Presidential executive orderc
Page 12 GAO-17-669R Resource Trends at Education

a Federal law created an officer position corresponding to this office, but did not create the office itself.
b Department of Education Organizing Act established an Under Secretary of Education. In 1990, an appropriations act renamed the "Under Secretary of Education" the "Deputy Secretary of Education." In 1991, the National Dropout Prevention Act created the current position of "Under Secretary of Education."
c In some cases, an executive order explicitly establishes an office within Education, while in others, Education established an office in response to an executive order.
Of the other 5 offices established since 1980, 4 were established by law and 1 by department leadership, and include the following significant additions:
· FSA was authorized flexibility to manage internal functions, such as hiring personnel and acquiring equipment, while also being required to meet measurable performance goals and objectives. Since its inception in 1998, FSA has administered a group of federal student aid programs authorized under Title IV of the Higher Education Act of 1965, including the Direct Loan Program and the FFEL Program.
Page 13 GAO-17-669R Resource Trends at Education
22 · The Office of the Chief Financial Officer (OCFO) was established in 1990 by provisions
in the 1990 Chief Financial Officers Act. Among other responsibilities, the OCFO manages financial execution of Education’s budget and oversees its financial management personnel, activities, and operations.
· The Office of Innovation and Improvement (OII) was created in 2002 by departmental leadership in an effort to consolidate the functions of multiple existing federal programs including programs previously housed within Education’s Office of Elementary and Secondary Education and Office of Educational Research and Improvement. OII oversees activities that support arts education, community and magnet schools, and public school choice programs and also houses the Office of Non-Public Education and Military Affairs.
Agency Comments and Our Evaluation
GAO is not making any recommendations in this report. In its comments, Education suggested we include additional information about its total obligations, which we incorporated as appropriate. Education also stated that its FTEs decreased while its workload and obligations increased, and disagreed with the agencies GAO selected for comparison purposes, particularly because their FTEs decreased more than Education’s. We continue to believe that the comparison is appropriate for our purposes because of similarities in the agencies’ respective missions and the proportions of their total obligations used for grants or loans to states, localities, or individuals. Further, we selected these agencies prior to analyzing changes in FTE levels. GAO makes no conclusions or observations about the appropriateness of Education’s FTE levels, as such an analysis was outside the scope of our review. Education also provided technical comments which we incorporated, as appropriate.
As agreed with your offices, unless you publicly announce the contents of this report earlier, we plan no further distribution until 30 days from the report date. At that time, we will send copies to 22GAO designated student financial aid programs as high-risk in 1990, before the creation of FSA, and continued to monitor student financial aid as a high-risk issue until 2005, when it was removed from the high-risk list. See: GAO, High Risk Series: An Update, GAO-05-207 (Washington, D.C.: January 2005)

appropriate congressional committees, to the Secretary of Education, and other interested parties. In addition, the report will be available at no charge on the GAO website at http://www.gao.gov.
If you or your staff have any questions about this report, please contact me at (617) 788-0580 or [email protected]. Contact points for our Offices of Congressional Relations and Public Affairs may be found on the last page of this report. In addition to the contact named above, Bill Keller (Assistant Director), Barbara Steel-Lowney (Analyst-in-Charge), Debra Prescott, Aaron Karty, Jennifer McDonald, and Sarah Sheehan made key contributions to this report. Also contributing to this report were Susan Aschoff, James Bennett, Deborah Bland, Monika Gomez, Sheila McCoy, Jean McSween, Beth Reed Fritts, John Mingus, Benjamin Sinoff, and Tatiana Winger.
Jacqueline M. Nowicki, Director Education, Workforce, and Income Security Issues
Page 14 GAO-17-669R Resource Trends at Education
Page 15 GAO-17-669R Resource Trends at Education

Page 16 GAO-17-669R Resource Trends at Education
Text of Agency Comment Letter
Page 17 GAO-17-669R Resource Trends at Education
Page 1
June 2, 2017
Ms. Jacqueline M. Nowicki Director, Education, Workforce, And Income Security Issues Government Accountability Office 441 G Street, N.W.
Washington, D.C. 20548
Dear Ms. Nowicki:
I am writing to respond to the Government Accountability Office (GAO) draft report titled "Department of Education: Staffing Levels Have Generally Decreased Over Time, while Contracting Levels Have Remained Relatively Stable (GA0-17-669R)." The U.S. Department of Education (Department) appreciates the opportunity to review and provide comments for your consideration on the report. We have three comments below.
First, we appreciate GAO confirming that the staffing levels at the Department have declined substantially from fiscal year 1981 to fiscal year 2015 (as reflected in Figure 1). We also appreciate GAO noting in that same time period, the Department's overall financial obligations (funds we manage) and workload increased dramatically (represented in Figure 4). Despite having the third largest discretionary budget of all Cabinet-level agencies behind only the Department of Defense and the Department of Health and Human Services, the Department of Education has the fewest staff. The Department's administrative funds (including salary and expenditures) are approximately one percent of the total annual program appropriations and new loan volume administered by the Department. We would appreciate if GAO would add to both the Note and the narrative with
Figure 4: 1) a list of the total obligations for each fiscal year in the chart; and 2) an explanation of the range from the lowest amount of the total obligations (and the year) to the highest amount of the total obligations (and the year), and the most recent amount (for fiscal year 2015). In addition, it would be helpful to define the term "total obligations" to note specifically whether this includes all funds appropriated to the Department or only those funds the Department awards to others.
Second, the review of the question regarding Department full time equivalent (FTE) employees cannot be understood in a vacuum without also examining the data comparing the number of FTEs with the workload and funding dollars that the Department manages. The workload data is contained in the most recent annual performance reports of the Department. We would appreciate a note in both Figure 1 and Figure 4 recognizing that the FTE staffing levels have declined over the same period of time that workload and the amount of total obligations (funds managed) have increased.
Third, we have concerns about the comparison that GAO makes in Figure 3 between the Department and the three federal agencies and sub-agencies that GAO selected as experiencing staffing reductions from 1991 to 2015. We do not agree that the three selected reflect the correct comparison in terms of mission, workload, and work type. However, more salient is that the other

Page 2
agencies that GAO chose to use in the chart experienced staffing reductions that are much larger than that experienced by the Department, and it raises the question of the comparison and the implication that the Department's staffing reduction could be higher (which seems very puzzling given the increased workload and total obligations during this period). Additionally, staffing reductions at these other agencies were for reasons unrelated to the work tasked to the Department by Congress, and we object to the inclusion of the chart without a workload and financial obligation analysis of each of the components being compared.
We have also included some technical comments regarding the Department's contracts and FTE staffing at Federal Student Aid.
Thank you for the opportunity to respond to the GAO report. If you or your staff members have any questions regarding our response, please contact me at (202) 260-8230 or by e-mail at [email protected].
Sincerely,
Joseph C. Conaty
Delegated the Duties and Functions of the Deputy Secretary
(101997)
Page 18 GAO-17-669R Resource Trends at Education