gap pattern of the largest primeval beech forest of...
TRANSCRIPT

Gap pattern of the largest primeval beech forestof Europe revealed by remote sensing
M. L. HOBI,1,2,� C. GINZLER,1 B. COMMARMOT,1 AND H. BUGMANN2
1Swiss Federal Institute for Forest, Snow and Landscape Research WSL, Zurcherstrasse 111, 8903 Birmensdorf, Switzerland2Forest Ecology, Institute of Terrestrial Ecosystems, Department of Environmental Systems Science,
Swiss Federal Institute of Technology Zurich, 8092 Zurich, Switzerland
Citation: Hobi, M. L., C. Ginzler, B. Commarmot, and H. Bugmann. 2015. Gap pattern of the largest primeval beech
forest of Europe revealed by remote sensing. Ecosphere 6(5):76. http://dx.doi.org/10.1890/ES14-00390.1
Abstract. Little is known about the gap pattern of primeval beech forests, since large-scale studies with
continuous coverage are lacking. Analyses of forest structural patterns have benefitted from advances in
remote sensing, especially with the launch of satellites providing data of submetric ground resolution.
These developments can strongly advance our knowledge of natural forest dynamics and disturbance
regimes. The Uholka-Shyrokyi Luh forest in the Ukrainian Carpathians, the largest remnant of primeval
European beech (Fagus sylvatica L.) covering 102.8 km2, is an outstanding object to analyze the frequency
distribution of gap sizes and to infer processes of forest dynamics. A stereo pair of very high-resolution
WorldView-2 satellite images was used to characterize the forest’s gap pattern. Canopy gaps were first
digitized stereoscopically based on the image pair. In a second step, spectral properties in the red and
yellow frequency bands were used to distinguish the stereoscopically mapped gap areas from non-gap
areas, which enabled gap mapping over the entire study area. To validate the spectral gap mapping 338
randomly distributed samples were assigned manually to gap and non-gap areas based on the ortho-
images. We found excellent agreement except for an overestimation of gaps close to clouds due to diffuse
image areas. The frequency distribution of gap size revealed the forest to be structured by a small-scale
mosaic of gaps mainly ,200 m2 (98% of the gaps). Only a few large, stand-replacing events were detected,
most probably caused by a wind storm in March 2007 and a heavy wet snow fall in October 2009. The
small canopy gaps reflect fine-scale processes shaping forest structure, i.e., the death of single trees or
groups of a few trees and is in line with the findings of the terrestrial forest inventory. We conclude that
remote sensing approaches based on very high-resolution satellite images are highly useful to characterize
even small-scale forest disturbance regimes and to study long-term gap dynamics. Stereo satellite images
provide two viewing angles of the study area, thus allowing for a highly accurate mapping of canopy gaps
in forests with a complex topography.
Key words: canopy gap; Carpathian Biosphere Reserve; disturbance regime; Fagus sylvatica; forest dynamics; spectral
image analysis; old-growth forest; satellite; virgin forest; WorldView-2.
Received 14 October 2014; revised 15 December 2014; accepted 23 December 2014; final version received 13 February
2015; published 12 May 2015. Corresponding Editor: D. P. C. Peters.
Copyright: � 2015 Hobi et al. This is an open-access article distributed under the terms of the Creative Commons
Attribution License, which permits unrestricted use, distribution, and reproduction in any medium, provided the
original author and source are credited. http://creativecommons.org/licenses/by/3.0/
� E-mail: [email protected]
INTRODUCTION
Natural disturbances are key drivers of forest
dynamics, largely shaping vertical structure as
well as horizontal patterns (White 1979). The
disturbance regime can be defined as the
characteristics (frequency, extent and severity)
of the dominant disturbance types as well as
v www.esajournals.org 1 May 2015 v Volume 6(5) v Article 76

their interactions (Frelich 2002). In temperateforests, the major natural disturbances are fire,windstorms, ice storms, droughts and insectoutbreaks (Pickett and White 1985). CentralEuropean temperate forests are mainly affectedby wind and, to a smaller extent, by snow andice, while forest fire and drought are typicallylimited to drier areas, e.g., the Mediterranean(Schelhaas et al. 2003). European beech forests, inparticular, are thought to be dominated by small-scale disturbance events, with wind as the maindisturbance agent (Splechtna and Gratzer 2005,Firm et al. 2009). Given that severe stand-replacing events appear to be rare (Tabaku2000, Drossler and von Lupke 2005), forestdynamics are understood to be shaped by fine-scale processes (Trotsiuk et al. 2012, Hobi et al.2014).
Disturbances in natural beech-dominated for-ests have been studied using a wide range ofmethods. Based on field mapping of tree crownsor canopy gaps, detailed information on gapsizes and vertical forest structure has beenobtained in a number of studies (e.g., Koop andHilgen 1987, Tabaku 2000, Drossler and vonLupke 2005, Butler Manning 2007, Nagel andSvoboda 2008, Kucbel et al. 2010, Bottero et al.2011). Dendroecological analysis has proved tobe a valuable method for reconstructing pastdisturbance events and their frequency (e.g.,Szwagrzyk and Szewczyk 2001, Piovesan et al.2005, Samonil et al. 2009, Samonil et al. 2012,Trotsiuk et al. 2012, Nagel et al. 2014). Theseterrestrial approaches, however, require a greatamount of effort to obtain field measurementsand are therefore only feasible for small areas,i.e., a few hectares at most. To study thedynamics and patterns of natural beech forests,surveys at the landscape level are required.Terrestrial inventories (e.g., Commarmot et al.2013) provide a rich picture of forest properties,but by definition they lack continuous spatialcoverage, and drawing inferences on spatialpatterns and underlying ecological processes isexceedingly difficult (Hobi et al. 2014). Remotesensing methods may fill this gap. Previousstudies using remotely sensed image data (e.g.,Zeibig et al. 2005, Kenderes et al. 2008, Garbarinoet al. 2012, Rugani et al. 2013, Blackburn et al.2014) have shown that these techniques arehighly promising for the continuous mapping
of disturbances at the landscape level.Recent advances in disturbance dynamics
research based on optical imagery have madeuse of a time-series (yearly) Landsat imagery,covering decades of change of the Earth’s surface(Cohen et al. 2010, Kennedy et al. 2010). Theseapproaches for multi-temporal change detectioncan be applied, for example, to monitor forestfires, insect-related mortality, or post-disturbanceregrowth at an annual time scale (e.g., Coops etal. 2010, Schroeder et al. 2011, Kennedy et al.2012). However, the spatial resolution of Landsatis limited (28.5 m pixels), and thus these data failto allow for reconstructing small-scale distur-bance processes.
With the launch of very high-resolution satel-lites, starting with IKONOS in 1999, the mappingof small-scale forest disturbance events overlarge spatial extents has become feasible. IKO-NOS images, with their submetric resolution,have been used in previous studies to analyzeforest structure (Kayitakire et al. 2006), the size oftree crowns (Song et al. 2010) and the severity ofwind disturbance (Rich et al. 2010). This break-through for small-scale mapping with satelliteimages was followed by the launch of othersatellites such as QuickBird, GeoEye-1, World-View-1, and WorldView-2 (Jacobsen 2012). Dig-italGlobe’s World-View-2 satellite has beenoperational since 2010 and provides stereoimagery with a panchromatic ground samplingdistance of 0.5 m. Some of the first studies basedon WorldView-2 used the images to map urbantree species in Tampa (Florida, USA) (Pu andLandry 2012) and to quantify tree mortality inmixed-species woodlands (Garrity et al. 2013).An accuracy study conducted in the lowlands ofSwitzerland revealed the benefit of stereo World-View-2 images for the 3D modeling of forestcanopies (Hobi and Ginzler 2012), which allowsfor the analysis of vertical forest structure andholds potential for canopy gap detection.
We thus used stereo WorldView-2 images tocharacterize the disturbance regime of a uniquenatural beech forest, i.e., the Uholka-ShyrokyiLuh primeval beech forest in the UkrainianCarpathians, the largest such forest in Europe(cf. Commarmot et al. 2013). Due to its remote-ness and large area (102.8 km2), it can beexpected that its present structure is the resultof natural processes and the forest is not
v www.esajournals.org 2 May 2015 v Volume 6(5) v Article 76
HOBI ET AL.

influenced by former or recent anthropogenicuse. Earlier studies on this forest focused on asmall-scale dendroecological assessment of treeage structure (Trotsiuk et al. 2012) and asystematic terrestrial survey of forest character-istics including tree species composition, canopystructure and gap size distribution using 500 m2
plots on a regular grid (Commarmot et al. 2013,Hobi et al. 2014). The combination of these datasets with a remote sensing approach provides thepotential to derive a comprehensive view of thedisturbance regime at the landscape scale.
In our study, we hypothesize that the largestEuropean primeval beech forest shows a fine-scale mosaic of canopy gaps over the entire forestarea (102.8 km2) with .95% of the gaps smallerthan 200 m2 in size. Specifically, we will (1)characterize the density of canopy gaps and theirsize distribution for the entire area of the largestEuropean primeval beech forest, (2) evaluate thepotential of high-resolution WorldView-2 stereosatellite images for the detection of fine-scalecanopy gaps in forests with a complex topogra-phy, and (3) draw inferences on the driverscausing these gaps by combining the canopy gapmap with ancillary information from dendro-chronology and the terrestrial inventory.
MATERIALS AND METHODS
Study areaThe study was conducted in the Uholka-
Shyrokyi Luh primeval European beech (Fagussylvatica L.) forest in the southwestern UkrainianCarpathians (48818 0 N and 23842 0 E, centercoordinates). The forest is an almost pure beechforest (97.3%, by basal area) characterized by amultilayered, uneven-aged canopy structure anda high abundance of old trees (Commarmot et al.
2013). A high volume of living trees of 582.1 6
13.5 m3�ha�1 and a total deadwood volume of162.5 6 8.4 m3�ha�1 of all decay classes suggestthat the forest has an old-growth character (Hobiet al. 2014). The study perimeter covers an area of10,282 ha of forest within the CarpathianBiosphere Reserve (CBR) belonging to the trans-national UNESCO World Heritage site ‘‘PrimevalBeech Forests of the Carpathians and the AncientBeech Forests of Germany’’.
The Uholka-Shyrokyi Luh massif consists offlysch layers with marls and sandstone, and ofJurassic limestone and cretaceous conglomerates.The climate is temperate, with a mean annualtemperature of 7.78C (�2.78C in January and17.98C in July), measured at the meteorologicalstation of the CBR in Uholka at 430 m a.s.l.(average for 1990–2010 AD). Mean annualprecipitation is 1,134 mm (1980–2010 AD). Theforest reserve is divided into two parts of similarsize: Uholka in the south and Shyrokyi Luh in thenorth. Together, they cover an altitude of 400 to1,300 m a.s.l. and are characterized by a stronglyfissured terrain with valleys of streams and hillranges. Human impact is thought to be low, asonly very few anthropogenic traces, such aswaste, traces of livestock grazing, researchmarkings and small footpaths, were found whenconducting the inventory (Commarmot et al.2013). We therefore consider this beech forest tobe primeval (a synonym to virgin) based on theargument that it has never been influencedsignificantly by humans (Peterken 1996).
Image source, characteristics and orientationAn optical stereo data set acquired on July 22,
2010 by the WorldView-2 satellite was used.WorldView-2, operational since January 2010, isthe first very high-resolution 8-band multispec-tral commercial satellite to provide a groundsampling distance of 0.5 m in the panchromaticand 1.84 m in the multispectral data (Table 1).The images have a dynamic range of 11 bits perpixel. The sensor is able to collect stereo imagesby looking forward (hereafter ‘‘image F’’) andbackward (hereafter ‘‘image B’’) from its actualposition (DigitalGlobe 2009), which involvesviewing angles of up to 458 off-nadir (Table 2).This is called the ‘‘along-track’’ configuration, asthe stereo images are taken from the same orbitat different angles along the flight direction by
Table 1. Wavelength of the eight spectral bands
provided by the WorldView-2 high-resolution stereo
satellite.
Spectral bands of WV2 Wavelength [nm]
Coastal 400–450Blue 450–510Green 510–580Yellow 585–625Red 630–690Red edge 705–745Near-IR1 770–895Near-IR2 860–1040
v www.esajournals.org 3 May 2015 v Volume 6(5) v Article 76
HOBI ET AL.

rotating the camera around its axes (Poli andToutin 2012). This has the advantages that (1) thetime difference between the two stereo images isvery small (about a minute), and (2) the imagesare acquired under the same atmospheric condi-tions.
Image orientation was provided by the rationalpolynomial coefficients (RPCs) originating fromstar tracker observations and satellite ephemeris(Fraser et al. 2006). This geometric relationship isexpressed by 80 coefficients (Grodecki and Dial2003). To improve image orientation, groundcontrol points (GCPs) were measured by GPS(Trimble Geoexplorer XH 2005) with an accuracyof 610 cm (standard deviation) after differentialcorrection. Using 9 GCPs, the image orientationcould be refined to a total root mean square error(RMSE) of 0.59 m. Panchromatic and multispec-tral ortho-images from WorldView-2 were thencalculated using a digital terrain model digitizedfrom the contour lines of a topographic map.Since this was an ancient map of the area, itsscale, geolocation and accuracy as well as themethod for contour line generation is unknown.No further corrections for topography or atmo-spheric distortion were made, since we did notplan to apply the parameters for gap mapping toother areas and used only one image scene at aspecific time step. For all further analyses, cloudsand open areas such as pastures and flood plainswere masked out. This reduced the studyperimeter to a forested area of 9,276 ha.
Canopy gap assessmentCanopy surface model.—A 3D softcopy station
(SocetSet 5.6, BAE Systems) and commercial GISsoftware (ArcMap10, ESRI) were used to gener-ate digital surface models (DSMs) of the forestcanopy based on the stereo pair of panchromaticimages. The Next-Generation Automatic TerrainExtraction (NGATE) of SocetSet 5.6 (BAE Sys-tems 2007, DeVenecia et al. 2007) was used forimage matching, which is based on image
correlation and edge matching (Zhang et al.2007). The available digital terrain model basedon digitized contour lines turned out to be notaccurate enough: in some areas tree heights wereunrealistically high (.60 m) and in others far toolow or even negative. Thus, the calculation of acanopy height model was not possible, and localstatistics with moving window techniques werecalculated from the digital surface model only.Although the accuracy of WorldView-2 DSMsover different land cover types was found to behigh (Hobi and Ginzler 2012), this approachfailed to map the small-scale mosaic of canopygaps in the Uholka-Shyrokyi Luh primeval beechforest; only larger gaps (.500 m2) could beidentified.
This failure is attributable mainly to the lowimage matching success (76%), which resultedfrom two factors: the complex topography of thearea and the large viewing angles of the satellite.The differences in InTrack viewing angles (in thedirection of flight) of more than 308 led toconsiderable differences in the two images, asthe screened trees were viewed from stronglydifferent angles. With a CrossTrack viewingangle of �248 (across the direction of flight) thesatellite was scanning the area from the westerndirection, which led to an additional tilt of thescreened objects. In combination with the ruggedtopography, east-facing areas were thus in theshadow of the satellite and exceedingly difficultto match. The canopy surface approach could,therefore, only be used for the mapping of largeopen areas, and a spectral image analysis methodhad to be developed for the extraction of canopygap information.
Spectral image analysis.—In a first step, forestcanopy gaps were digitized stereoscopicallyusing the image pair, but only large gaps visiblein both images could be digitized. In a secondstep canopy gaps were mapped separately inboth multispectral ortho-images based on theirspectral information. This approach allowed for
Table 2. WorldView-2 viewing angles for the acquisition of the forward and the backward image.
Image details Image F (forward) Image B (backward)
Image acquisition 22 July 2012, 12:52:01 GMT 22 July 20120, 12:51:10 GMTMean InTrack view angle 13.9 �19.2Mean CrossTrack view angle �23.4 �24.6Mean OffNadir view angle 27.0 30.8
v www.esajournals.org 4 May 2015 v Volume 6(5) v Article 76
HOBI ET AL.

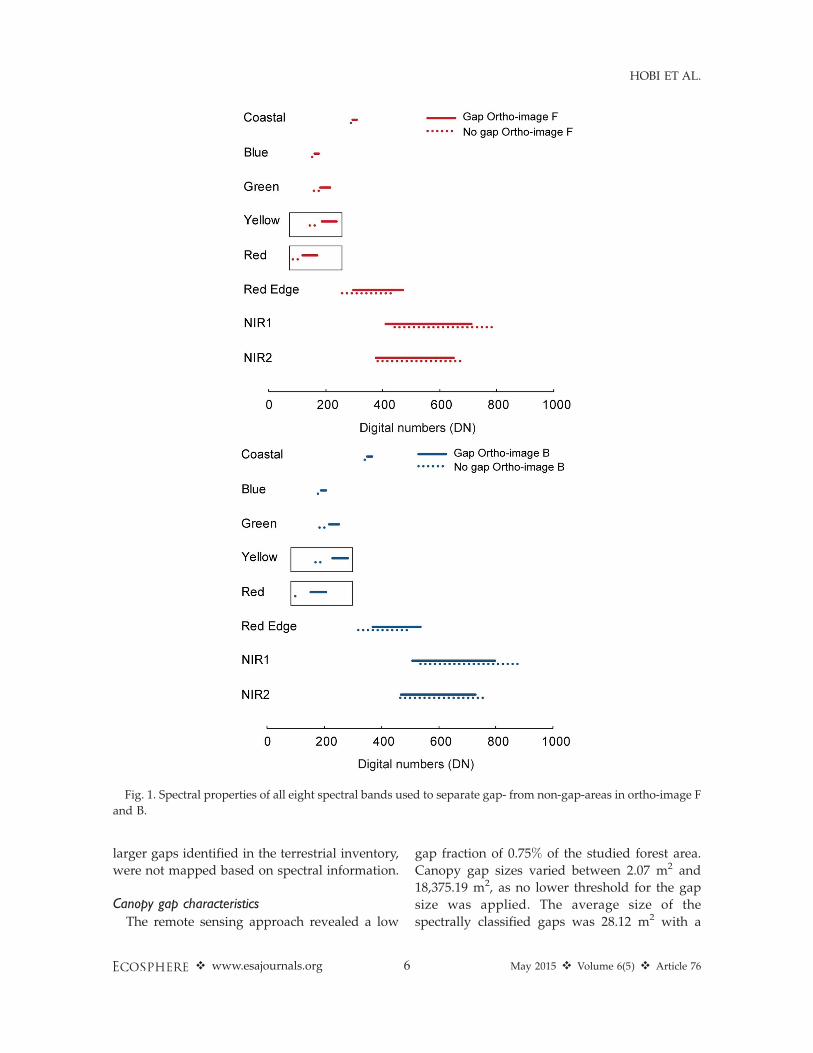
the delineation of small gaps as well. Minimumgap size was not defined, as only gaps visible onthe ortho-images were mapped. The mean andstandard deviation of the digital numbers of allgap pixels within each spectral band werecalculated. For all eight spectral bands, as wellas for the normalized difference vegetation index(NDVI) and the modified red-edge NDVIedgebased on the red edge instead of the red band,the range of the mean 6 standard deviation ofthe digital numbers was used to test thedifferentiation of gap vs. non-gap areas.
The yellow and red bands of the WorldView-2satellite images proved most useful in separatinggap from non-gap areas (Fig. 1). Consequently,their additive combination was used for thedelineation of canopy gaps. Only areas that layin the range of the mean 6 one standarddeviation of the digital numbers of both theyellow (210.89 6 25.79 for ortho-image F and255.32 6 27.6 for ortho-image B) and the red(143.54 6 25.24 for ortho-image F and 179.58 6
27.29 for ortho-image B) spectral bands wereclassified as canopy gap areas. NDVI andNDVIedge were not suitable for separating gapand non-gap areas because their spectral prop-erties were overlapping in a substantial part oftheir range.
To validate the spectral gap mapping, 338randomly distributed samples of 2,500 m2 eachwere used. Based on the spectral propertieswithin each cluster, it was manually decidedwhether the sample was situated in a gap or anon-gap area. This manually interpreted data setwas then compared to the result of the spectralgap mapping. The correct classification rate(CCR) and the kappa coefficient (K) were usedas statistical measures for the validation of thecanopy gap maps. Additionally, the producer’saccuracy (the probability that a gap or non-gaparea existing in the manually interpreted datawas classified as such) and user’s accuracy (theprobability that a pixel classified as gap or non-gap area in the map existed in the manuallyinterpreted data) were calculated.
Gap mapsGap areas were classified as 1 (one) and non-
gap-areas as 0 (zero). For better visibility, canopygap maps were calculated with a raster size of 50by 50 m, denoting gap percentage by a value
between 0 (low gap percentage) and 1 (high gappercentage). Three maps of canopy gap distribu-tion were generated: one based on the classifica-tion of ortho-image F, one based on theclassification of ortho-image B, and one in whichthe information of both ortho-images was com-bined. For the latter, areas where both mapsshowed canopy gaps and areas where only onemap showed a gap were distinguished. Thisinformation was used for the evaluation of theadvantages of using a stereo pair of satelliteimages for such a classification instead of onlyone image.
Gap and disturbance estimationin the terrestrial inventory
Ground data were collected in a terrestrialinventory in summer 2010, where besides vari-ous tree and stand characteristics the size ofcanopy gaps was estimated on a systematic gridwith 353 sample plots within the forested area(Commarmot et al. 2013). On 314 plots, it wasestimated whether the sample plot center was ina canopy gap, distinguishing six size classes, i.e.,20–50 m2, 51–200 m2, 201–500 m2, 501–1000 m2,1001–5000 m2, .5000 m2, or under a closedcanopy. A gap was defined as an opening in thecanopy with a minimum width of 5 m measuredfrom crown margin to crown margin, and wheregap fillers height is below one third of canopyheight of the surrounding stand. Using cross-validation, the agreement between field-mea-sured and classified gaps was estimated, andthe producer’s and user’s accuracies, correctclassification rate (CCR) and the kappa coeffi-cient (K) were calculated.
RESULTS
Spatial canopy gap distributionGap density was found to be high in the
northwestern part of Shyrokyi Luh, in somedistinct regions in the central part of Uholka, andclose to the western border of Uholka (Fig. 2a).Besides these areas, gap density was generallylow. The terrestrial data showed a similar patternwith gaps of different sizes scattered all over thestudy area (Fig. 2b). The higher frequency ofcanopy gaps in the northwestern part of Shyr-okyi Luh, however, was only partly evident fromthe terrestrial inventory. Conversely, some of the
v www.esajournals.org 5 May 2015 v Volume 6(5) v Article 76
HOBI ET AL.
larger gaps identified in the terrestrial inventory,
were not mapped based on spectral information.
Canopy gap characteristics
The remote sensing approach revealed a low
gap fraction of 0.75% of the studied forest area.
Canopy gap sizes varied between 2.07 m2 and
18,375.19 m2, as no lower threshold for the gap
size was applied. The average size of the
spectrally classified gaps was 28.12 m2 with a
Fig. 1. Spectral properties of all eight spectral bands used to separate gap- from non-gap-areas in ortho-image F
and B.
v www.esajournals.org 6 May 2015 v Volume 6(5) v Article 76
HOBI ET AL.

standard deviation of 189.10 m2. The frequencydistribution of the gap sizes had a negativeexponential form. Occasionally, larger stand-replacing disturbance events occurred, as evidentfrom the few gaps �0.5 ha but the forest was
mostly dominated by canopy gaps with an areaof ,200 m2 (98% of the classified gaps), probablyoriginating from the death of one to four singletrees (Fig. 3). This general picture is similar to theresults of the terrestrial inventory, where 60% ofthe measured canopy gaps were ,200 m2 and afew larger canopy gaps were scattered all overthe study area (Fig. 2b).The share of small gaps,however, was higher in the spectrally mappedgaps (Fig. 4a) than in the gaps assessed terrestri-ally, while the field survey revealed a higherpercentage of gaps in the larger size classes (Fig.4b). This became evident when the spectrallymapped gaps were classified into the same sizecategories as in the terrestrial survey.
Validation of canopy gap classificationVisually, there were some differences between
the classifications of ortho-image F and ortho-image B, especially near clouds (Fig. 5). Based onthe accuracy statistics of the cross-validation withthe training area data, the classification results ofortho-image B were found to be more reliablethan those of ortho-image F (Tables 3a and 4a).This is however mostly related to clouds anddiffuse image areas and not dependent on theviewing angle of the satellite. The producer’saccuracy was above 65% for both ortho-images;this can be considered as being quite accurate forthe mapping of canopy gaps. The low user’saccuracy of ortho-image F, however, showed thatthe mapping based on ortho-image F failed toreliably distinguish gap- and non-gap areas insome areas. Overall, the kappa values indicatedthat the mapping based on ortho-image Fshowed only weak agreement, while the map-ping based on ortho-image B showed strongagreement with gaps mapped manually in thetraining areas.
By additively combining the information fromthe two ortho-images, the mapping success ofcanopy gaps was generally higher. Small gapswere mostly mapped on one ortho-image only,whereas larger gaps were mapped more accu-rately due to the combination of the informationfrom the two ortho-images (Fig. 6). Therefore, themapping results of the two ortho-images werecombined to obtain a gap map of the entire studyperimeter.
The validation of the canopy gap maps basedon the terrestrial inventory data was difficult, as
Fig. 2. Map of the classified canopy gaps based on
the additive combination of ortho-image F and B (a) in
comparison to the canopy gaps measured at the plot
center in the terrestrial inventory (b).
v www.esajournals.org 7 May 2015 v Volume 6(5) v Article 76
HOBI ET AL.

not all the sample plots could be accurately geo-referenced during the inventory. But in generalthe terrestrial gap data showed the same patternas the remote sensing one. As expected, user’sand producer’s accuracies for non-gap areas werequite high in the cross-validation with the fielddata (Tables 3b and 4b). However, the accuracymeasures for gap areas were low.
DISCUSSION
Canopy gap patternThe Uholka-Shyrokyi Luh forest was charac-
terized by a low gap fraction, with ,1% of thearea classified as gap by spectral analysis. Moststudies in beech-dominated primeval forestsreported higher gap fractions, varying between
Fig. 3. Frequency distribution of the spectrally mapped canopy gap sizes within the study perimeter. The
distribution shows few stand replacing disturbance events with gap sizes larger than 5,000 m2, but most gaps are
,200 m2 in area.
Fig. 4. Comparison of the frequency distribution of the canopy gaps delineated with the remote sensing
approach and (b) estimated in the terrestrial inventory using the size classes of the terrestrial inventory.
v www.esajournals.org 8 May 2015 v Volume 6(5) v Article 76
HOBI ET AL.

1.7% and 16% (Meyer et al. 2003, Drossler andvon Lupke 2005, Splechtna and Gratzer 2005,Zeibig et al. 2005, Nagel and Svoboda 2008,Kenderes et al. 2009, Garbarino et al. 2012,Rugani et al. 2013). Differences in the gapfraction can be due to different gap definitions(e.g., Runkle 1992) and the methods of gapsampling (e.g., Yamamoto et al. 2011). Somecanopy gap definitions are based on a minimumsize of the gaps or a threshold of heightdifference compared to the surrounding canopy.
Gap fractions derived from terrestrial analysesare particularly difficult to compare to those fromremote sensing approaches, as the definition of a‘‘gap’’ per se is not identical. With the remotesensing approach based on spectral informationused in the present study, only gaps withoutregeneration allowing to see the soil are mapped,whereas in the terrestrial approach, a gap wasdefined as an opening in the canopy where gapfillers do not exceed one third of canopy height.Thus, even 10–30 year old gaps may have been
Fig. 5. Gap maps based on spectral gap mapping on ortho-image F (a) and ortho-image B (b).
Table 3. Cross-validation of the spectral gap mapping based (a) on the randomly distributed samples of the
manually mapped canopy gaps and (b) on the terrestrial inventory data to distinguish gap from non-gap areas
within ortho-image F and B.
Area
Ortho-image F Ortho-image B
Spectrally mapped gaps Spectrally mapped gaps
Gap No gap Row total Gap No gap Row total
a) Manually mapped gapsGap 257 47 304 299 4 303No gap 5 29 34 12 23 35Column total 262 76 338 311 27 338
b) Field dataGap 49 71 120 12 108 120No gap 48 144 192 16 176 192Column total 97 215 312 28 284 312
v www.esajournals.org 9 May 2015 v Volume 6(5) v Article 76
HOBI ET AL.

assessed in the field study, while the spectralanalyses probably captured mainly the mostrecent gaps.
This difference in gap definition may explainalso why the terrestrial inventory revealed ahigher percentage of large gaps, which needparticularly long to close again. The area-widecontinuous mapping of canopy gaps in our studyrevealed that not only the few large, but also thesmall gaps were not distributed evenly over thearea but occurred clustered. The sampling designof the terrestrial inventory failed to capture suchlocally higher gap densities, which could beanother reason for the higher share of large andlower share of small gaps in the field studycompared to the remote sensing analysis.
The average gap size in our study (28.12 m2)was smaller than the mean gap size found inother studies of beech-dominated primeval for-ests, which ranged from 61 to 137 m2 (Meyer etal. 2003, Zeibig et al. 2005, Nagel and Svoboda2008, Kenderes et al. 2009, Bottero et al. 2011).Average gap sizes are largely influenced by theminimum gap size defined and thus not reallycomparable. Despite the completely differentmethods using different gap definitions, the gapsize distribution, however, showed a similarpicture, with most of the gaps being smallerthan 200 m2 in area.
Meyer at al. (2003) investigated the formationof canopy gaps in three Albanian primeval beech
forests and found average canopy gap size to besmaller than the crown projection area of onedominant beech tree. This suggests that mostcanopy gaps are formed by the death of singletrees. This is in line with the findings of Drosslerand von Lupke (2005) regarding Slovakianprimeval beech forest reserves, where more thanhalf of the gaps were found to be caused by thedeath of one tree, and 80% by the death of up tothree trees. Based on the size distribution andspatial patterning of the canopy gaps found inour study, we conclude that the Uholka-ShyrokyiLuh forest is also shaped by a small-scaledisturbance regime, and canopy gaps formedby single trees are prevailing. Rare disturbanceevents of moderate severity rather lead to locallyhigher densities of small gaps than to large, standreplacing ones.
Canopy gap assessment using high-resolutionstereo satellite images
Spectral image analysis of high-resolutionstereo satellite images proved to be highlysuitable for generating maps of canopy gaps inthe Uholka-Shyrokyi Luh primeval beech forest.The different viewing angles of the stereo satelliteimages allowed for a comprehensive mapping ofcanopy gaps within the study perimeter. Sincesmall gaps were detected mostly on one imageonly, the additive combination of images fromdifferent viewing angles is an asset if fine-scaleforest canopy gap extraction is sought. Theidentification of larger canopy gaps was alsoimproved, since their shape could be identified in
Table 4. Statistical measures of the validation of the
spectral gap mapping based (a) on the randomly
distributed samples of the manually mapped canopy
gaps and (b) on the terrestrial inventory data using
ortho-image F and B.
Accuracy measureOrtho-image
FOrtho-image
B
a)Producer’s accuracy gap [%] 84.54 98.68Producer’s accuracy no gap [%] 85.29 65.71User’s accuracy gap [%] 98.09 96.14User’s accuracy no gap [%] 38.16 85.19Kohen’s kappa coefficient K 0.45 0.72Correct classification rate CCR 0.85 0.95
b)Producer’s accuracy gap [%] 40.83 10.00Producer’s accuracy no gap [%] 75.00 91.67User’s accuracy gap [%] 50.52 42.86User’s accuracy no gap [%] 66.98 61.97Kohen’s kappa coefficient K 0.16 0.02Correct classification rate CCR 61.86 60.26
Fig. 6. Example of the combination of the two
canopy gap maps, showing the advantages of using a
stereo pair of satellite images for gap mapping.
v www.esajournals.org 10 May 2015 v Volume 6(5) v Article 76
HOBI ET AL.

more detail, thus better matching their realproperties.
Only a few studies on the disturbance regimeof primeval beech forests have been based onsatellite remote sensing methods as a landscapeapproach covering large areas. Garbarino et al.(2012) studied gap dynamics in an old-growthforest in Bosnia over an area of 298 ha by meansof Kompsat-2 satellite images, which are compa-rable to those used in our study, providing aground resolution of 1 m in the panchromaticand 4 m in the multispectral bands. Using anunsupervised pixel-based classification approachand an artificial neural network, they found goodagreement between classified and photo-inter-preted gaps. Apart from the overestimation ofcanopy gaps in diffuse areas close to clouds, thereliability of the spectral image analysis approachused in our study was quite high as well. Theoverestimation of gaps near clouds was strongeron ortho-image F than on ortho-image B;consequently, the user’s accuracy for the classifi-cation of non-gap areas from ortho-image F wasless than half of that for ortho-image B. As theseareas are distinct in their extent, they can easilybe masked out for the ecological interpretation.
The calculation of digital surface models of theforest canopy failed to map the fine-scale mosaicof canopy gaps within this forest, even thoughcanopy surface models have been used widely inforest research for such purposes (Hirschmugl etal. 2007, Vega and St-Onge 2008). Provided thatan accurate digital terrain model (DTM) exists,canopy height models, which have becomepopular for disturbance analysis by means ofcanopy gaps or canopy height profiles (Fujita etal. 2003, Henbo et al. 2004, Vepakomma et al.2010), could be calculated by subtracting theterrain model from the surface model (St-Onge etal. 2008, Vepakomma et al. 2008). However, forour study area in the Ukraine, as well as formany other countries, accurate DTMs are lack-ing. Hence, approaches based on the calculationof local variations in canopy surface height mayhave high potential for disturbance analysis, astested by Betts et al. (2005) in a small, flatNothofagus forest area in New Zealand. As thegap definition in canopy height models is moresimilar to the one used in field studies, the resultsmay be better comparable to terrestrial surveysthan with our approach. However, in our case,
the large viewing angles of the satellite and thecomplex topography of our study area limitedthe success of image matching during the canopysurface generation, which is the key prerequisitefor such an analysis. It was only possible to maplarger openings in the canopy based on thecanopy surface model, and a spectral imageanalysis approach had to be used to map thedominating small-scale mosaic of canopy gaps inthis primeval beech forest.
Inferences regarding the disturbance regimeOur canopy gap assessment confirms the
hypothesis that the disturbance regime of thelargest primeval forest in Europe is characterizedby small to moderate disturbance events withcanopy gaps rarely exceeding the crown projec-tion area of a few trees and a very low frequencyof stand-replacing disturbance events. Two majorlarge-scale events have influenced our results: awind storm in March 2007 and heavy wet snowfall in October 2009 (Local Forest Service, personalcommunication). These moderate disturbanceevents likely account for the few gaps with areasof several thousand square meters to around 2 hain the study perimeter. Besides these rare largeopenings, such disturbances lead to a higherdensity of small canopy gaps ,200 m2 in locallydistinct areas of the forest. This small-scalemosaic of small gaps favors the preservation ofbeech, since the ingrowth of other species woulddepend on larger canopy gaps allowing moresunlight to reach the forest floor. These findingsare in line with two dendroecological analysesthat suggested a small-scale mosaic of distur-bance events and an absence of frequent stand-replacing disturbances (Trotsiuk et al. 2012, Hobiet al. 2014).
With the remote sensing approach used here,an area of several thousand hectares could beanalyzed, which makes this assessment unique inthe context of research in primeval beech forests.Our results expand the findings from studiesconducted on much smaller monitoring plots,confirming that the processes shaping beechforests occur on small spatial scales. Openingsof .1,000 m2 in beech-dominated forests incentral Europe have been documented as well(Drossler and von Lupke 2005, Nagel andSvoboda 2008), and they play an important rolein determining successional pathways of forests,
v www.esajournals.org 11 May 2015 v Volume 6(5) v Article 76
HOBI ET AL.

as they may induce changes in forest structure(inducing homogeneous stand structures) andtree composition (establishment of light-demand-ing tree species) (Leibundgut 1959, Korpel’ 1995,Heiri et al. 2009). This kind of natural successionwas found, for example, in the Badın fir-beechvirgin forest in the Western Carpathians, where,after windthrow, a high abundance of Salix capreaL. was observed (Korpel’ 1995). In the Uholka-Shyrokyi Luh primeval beech forest, however,the few larger disturbance events seem not toalter forest structure or composition over largeareas. For example, in the terrestrial inventory noevidence of changes in tree species compositionwas observed, i.e., light-demanding species wereunable to establish in the gaps, irrespective oftheir size (Hobi et al. 2014).
CONCLUSIONS
High-resolution stereo satellite images werefound to provide highly valuable input data forcanopy disturbance analysis at the landscapelevel. Given that the images are free of clouds, acomplete spatial coverage can be achieved in ashort period of time. These relatively new stereosatellite images hold promise for canopy gapassessments. They provide two different viewingangles of the target area and thus allow for amore reliable classification of gaps in the forestcanopy compared to the use of only one image.The remote sensing approach supported thefindings of previous terrestrial analyses that thelargest European primeval beech forest is shapedby a small-scale disturbance regime and only asmall amount of the forest area (,1%) is in thegap phase. Canopy gaps mainly smaller than 200m2 (98% of the classified gaps), corresponding tothe crown projection area of one to a few trees,are the major drivers of forest dynamics in thisprimeval beech forest, whereas stand-replacingevents are rare.
We thus hypothesize that this forest is in adynamic equilibrium, being characterized by asmall-scale mosaic of patches in different devel-opmental phases, and that it will maintain itscurrent structure in the long run, provided thatthere will be no ‘catastrophic’ events. The multi-layered, uneven-aged canopy structure with thestrong dominance of beech and an exceedinglylow abundance of early successional species
found in the terrestrial forest inventory supportthis hypothesis (see Hobi et al. 2014). Thissuggests that gap dynamics may be characterizedas a shifting of gaps opening and closing,whereas the gap fraction and frequency distri-bution remain roughly constant. To test thishypothesis in more detail, a spatio-temporalapproach would be needed. The remote sensingmethod presented here allows an area-widecontinuous mapping of canopy gaps with areasonable effort and is thus useful for analyzingalso remote and not easily accessible forests. Aseven small gaps can be reliably detected as longas they are new and not yet filled by regenera-tion, the method may be particularly suited tostudy long-term canopy dynamics and quantifyannual gap formation rates. We therefore sug-gest, as a call to further research, the repetition ofthe spectral canopy gap assessments over time,so as to follow the fate of individual gaps as wellas to analyze the gap size distribution over theentire forest.
ACKNOWLEDGMENTS
This research was funded by the State Secretary forEducation, Research and Innovation, Switzerland. Weare grateful to Niklaus Zimmermann (WSL) andDavid Frank (WSL) for providing valuable feedbackon an earlier manuscript version. We thank CurtisGautschi for the linguistic revision of the text. Detailedcomments by anonymous reviewers have greatlyimproved the manuscript.
LITERATURE CITED
BAE Systems. 2007. Next-Generation Automatic Ter-rain Extraction (NGATE): Innovation in the cost-effective derivation of elevation data from imagery.White Paper. BAE Systems, London, UK.
Betts, H. D., L. J. Brown, and G. H. Stewart. 2005.Forest canopy gap detection and charcterisation bythe use of high-resolution digital elevation models.New Zealand Journal of Ecology 29:95–103.
Blackburn, G. A., Z. Abd Latif, and D. S. Boyd. 2014.Forest disturbance and regeneration: a mosaic ofdiscrete gap dynamics and open matrix regimes?Journal of Vegetation Science 25:1341–1354.
Bottero, A., M. Garbarino, V. Dukic, Z. Govedar, E.Lingua, T. A. Nagel, and R. Motta. 2011. Gap-phasedynamics in the old-growth forest of Lom, Bosniaand Herzegovina. Silva Fennica 45:875–887.
Butler Manning, D. 2007. Stand structure, gap dynam-ics and regeneration of a semi-natural mixed beech
v www.esajournals.org 12 May 2015 v Volume 6(5) v Article 76
HOBI ET AL.

forest in limestone in central Europe: a case study.Dissertation. Freiburger Forstliche Forschung Band38, Freiburg, Germany.
Cohen, W. B., Z. G. Yang, and R. Kennedy. 2010.Detecting trends in forest disturbance and recoveryusing yearly Landsat time series: 2. TimeSync—Tools for calibration and validation. Remote Sens-ing of Environment 114:2911–2924.
Commarmot, B., U.-B. Brandli, F. Hamor, and V.Lavnyy, editors. 2013. Inventory of the largestprimeval beech forest in Europe: A Swiss-Ukraini-an scientific adventure. Swiss Federal ResearchInstitute, Birmensdorf, Switzerland; Ukrainian Na-tional Forestry University, L’viv, Ukraine; Carpa-thian Biosphere Reserve, Rakhiv, Ukraine.
Coops, N. C., S. N. Gillanders, M. A. Wulder, S. E.Gergel, T. Nelson, and N. R. Goodwin. 2010.Assessing changes in forest fragmentation follow-ing infestation using time series Landsat imagery.Forest Ecology and Management 259:2355–2365.
DeVenecia, K., S. Walker, and B. Zhang. 2007. Newapproaches to generating and processing highresolution elevation data with imagery. Photo-grammetric Week 07:297–308.
DigitalGlobe. 2009. WorldView-2: spacecraft informa-tion and specifications. DigitalGlobe, Longmont,Colorado, USA.
Drossler, B., and B. von Lupke. 2005. Canopy gaps intwo virgin beech forest reserves in Slovakia.Journal of Forest Science 51:446–457.
Firm, D., T. A. Nagel, and J. Diaci. 2009. Disturbancehistory and dynamics of an old-growth mixedspecies mountain forest in the Slovenian Alps.Forest Ecology and Management 257:1893–1901.
Fraser, C., G. Dial, and J. Grodecki. 2006. Sensororientation via RPCs. Isprs Journal of Photogram-metry and Remote Sensing 60:182–194.
Frelich, L. E. 2002. Forest dynamics and disturbanceregimes studies from temperate evergreen-decidu-ous forests. Cambridge University Press, Cam-bridge, UK.
Fujita, T., A. Itaya, M. Miura, T. Manabe, and S.-I.Yamamoto. 2003. Long-term canopy dynamicsanalysed by aerial photographs in a temperateold-growth evergreen broad-leaved forest. Journalof Ecology 91:686–693.
Garbarino, M., Borgogno Mondino, E. E. Lingua, T.Nagel, V. Duki�c, Z. Govedar, and R. Motta. 2012.Gap disturbances and regeneration patterns in aBosnian old-growth forest: a multispectral remotesensing and ground-based approach. Annals ofForest Science 69:617–625.
Garrity, S. R., C. D. Allen, S. P. Brumby, C. Gang-odagamage, N. G. McDowell, and D. M. Cai. 2013.Quantifying tree mortality in a mixed specieswoodland using multitemporal high spatial reso-lution satellite imagery. Remote Sensing of Envi-
ronment 129:54–65.Grodecki, J., and G. Dial. 2003. Block adjustment of
high-resolution satellite images described by ratio-nal polynomials. Photogrammetric Engineeringand Remote Sensing 69:59–68.
Heiri, C., A. Wolf, L. Rohrer, and H. Bugmann. 2009.Forty years of natural dynamics in Swiss beechforests: structure, composition, and the influence offormer management. Ecological Applications19:1920–1934.
Henbo, Y., A. Itaya, N. Nishimura, and S. I. Yamamoto.2004. Long-term canopy dynamics in a large areaof temperate old-growth beech (Fagus crenata)forest: analysis by aerial photographs and digitalelevation models. Journal of Ecology 92:945–953.
Hirschmugl, M., M. Ofner, J. Raggam, and M. Schardt.2007. Single tree detection in very high resolutionremote sensing data. Remote Sensing of Environ-ment 110:533–544.
Hobi, M. L., B. Commarmot, and H. Bugmann. 2014.Pattern and process in the largest primeval beechforest of Europe (Ukrainian Carpathians). Journalof Vegetation Science. doi: 10.1111/jvs.12234
Hobi, M. L., and C. Ginzler. 2012. Accuracy assessmentof digital surface models based on WorldView-2and ADS80 stereo remote sensing data. Sensors12:6347–6368.
Jacobsen, K. 2012. Sensors with a GSD of 1 m or less. InI. Dowman, K. Jacobsen, G. Konecny, and R.Sandau, editors. High resolution optical satelliteimagery. Whittles, Caithness, Scotland, UK.
Kayitakire, F., C. Hamel, and P. Defourny. 2006.Retrieving forest structure variables based onimage texture analysis and IKONOS-2 imagery.Remote Sensing of Environment 102:390–401.
Kenderes, K., K. Kral, T. Vrska, and T. Standovar. 2009.Natural gap dynamics in a Central Europeanmixed beech-spruce-fir old-growth forest. Eco-science 16:39–47.
Kenderes, K., B. Mihok, and T. Standovar. 2008. Thirtyyears of gap dynamics in a Central European beechforest reserve. Forestry 81:111–123.
Kennedy, R. E., Z. G. Yang, and W. B. Cohen. 2010.Detecting trends in forest disturbance and recoveryusing yearly Landsat time series: 1. LandTrendr—Temporal segmentation algorithms. Remote Sens-ing of Environment 114:2897–2910.
Kennedy, R. E., Z. Q. Yang, W. B. Cohen, E. Pfaff, J.Braaten, and P. Nelson. 2012. Spatial and temporalpatterns of forest disturbance and regrowth withinthe area of the Northwest Forest Plan. RemoteSensing of Environment 122:117–133.
Koop, H., and P. Hilgen. 1987. Forest dynamics andregeneration mosaic shifts in unexploited beech(Fagus sylvatica) stands at Fontainebleau (France).Forest Ecology and Management 20:135–150.
Korpel’, S. 1995. Die Urwalder der Westkarpaten.
v www.esajournals.org 13 May 2015 v Volume 6(5) v Article 76
HOBI ET AL.

Gustav Fischer Verlag, Stuttgart, Deutschland.Kucbel, S., P. Jaloviar, M. Saniga, J. Vencurik, and V.
Klimas. 2010. Canopy gaps in an old-growth fir-beech forest remnant of Western Carpathians.European Journal of Forest Research 129:249–259.
Leibundgut, H. 1959. Uber Zweck und Methodik derStruktur- und Zuwachsanalyse von Urwaldern.Schweizerische Zeitschrift fur Forstwesen110:111–124.
Meyer, P., V. Tabaku, and B. von Lupke. 2003. Strukturalbanischer Rotbuchen-Urwalder - Ableitungen fureine naturnahe Buchenwirtschaft. Forstwissen-schaftliches Centralblatt 122:47–58.
Nagel, T., and M. Svoboda. 2008. Gap disturbanceregime in an old-growth Fagus-Abies forest in theDinaric Mountains, Bosnia-Herzegovina. CanadianJournal of Forest Research 38:2728–2737.
Nagel, T., M. Svoboda, and M. Kobal. 2014. Distur-bance, life history traits, and dynamics in an old-growth forest landscape of southeastern Europe.Ecological Applications 24:663–679.
Peterken, G. F. 1996. Natural woodland ecology andconservation in northern temperate regions. Cam-bridge University Press, Cambridge, UK.
Pickett, S. T. A., and P. S. White. 1985. The ecology ofnatural disturbance and patch dynamics. AcademicPress, Orlando, Florida, USA.
Piovesan, G., A. Di Filippo, A. Alessandrini, F. Biondi,and B. Schirone. 2005. Structure, dynamics anddendroecology of an old-growth Fagus forest in theApennines. Journal of Vegetation Science 16:13–28.
Poli, D., and T. Toutin. 2012. Review of developmentsin geometric modelling for high resolution satellitepushbroom sensors. Photogrammetric Record27:58–73.
Pu, R., and S. Landry. 2012. A comparative analysis ofhigh spatial resolution IKONOS and WorldView-2imagery for mapping urban tree species. RemoteSensing of Environment 124:516–533.
Rich, R. L., L. Frelich, P. B. Reich, and M. E. Bauer.2010. Detecting wind disturbance severity andcanopy heterogeneity in boreal forest by couplinghigh-spatial resolution satellite imagery and fielddata. Remote Sensing of Environment 114:299–308.
Rugani, T., J. Diaci, and D. Hladnik. 2013. Gapdynamics and structure of two old-growth beechforest remnants in Slovenia. PLoS ONE 8:e52641.
Runkle, J. 1992. Guidelines and sample protocol forsampling forest gaps. General technical report.Department of Agriculture, Forest Service, PacificNorthwest Research Station, Portland, Oregon,USA.
Samonil, P., L. Antolik, M. Svoboda, and D. Adam.2009. Dynamics of windthrow events in a naturalfir-beech forest in the Carpathian mountains. ForestEcology and Management 257:1148–1156.
Samonil, P., P. Dolezelova, I. Vasıckova, D. Adam, M.
Valtera, K. Kral, D. Janık, and B. Sebkova. 2012.Individual-based approach to the detection ofdisturbance history through spatial scales in anatural beech-dominated forest. Journal of Vegeta-tion Science 24:1167–1184.
Schelhaas, M.-J., G.-J. Nabuurs, and A. Schuck. 2003.Natural disturbances in the European forests in the19th and 20th centuries. Global Change Biology9:1620–1633.
Schroeder, T. A., M. A. Wulder, S. P. Healey, and G. G.Moisen. 2011. Mapping wildfire and clearcutharvest disturbances in boreal forests with Landsattime series data. Remote Sensing of Environment115:1421–1433.
Song, C. H., M. B. Dickinson, L. H. Su, S. Zhang, andD. Yaussey. 2010. Estimating average tree crownsize using spatial information from Ikonos andQuickBird images: Across-sensor and across-sitecomparisons. Remote Sensing of Environment114:1099–1107.
Splechtna, B., and G. Gratzer. 2005. Natural distur-bances in Central European forests: approachesand preliminary results from Rothwald, Austria.Forest Snow and Landscape Research 79:57–67.
St-Onge, B., Y. Hu, and C. Vega. 2008. Mapping theheight and above-ground biomass of a mixed forestusing lidar and stereo Ikonos images. InternationalJournal of Remote Sensing 29:1277–1294.
Szwagrzyk, J., and J. Szewczyk. 2001. Tree mortalityand effects of release from competition in an oldgrowth Fagus Abies Picea stand. Journal ofVegetation Science 12:621–626.
Tabaku, V. 2000. Struktur von Buchen-Urwaldern inAlbanien im Vergleich mit deutschen Buchen-Naturwaldreservaten und -Wirtschaftswaldern.Dissertation. Cuvillier Verlag, Gottingen, Deutsch-land.
Trotsiuk, V., M. L. Hobi, and B. Commarmot. 2012.Age structure and disturbance dynamics of therelic virgin beech forest Uholka (Ukrainian Carpa-thians). Forest Ecology and Management 265:181–190.
Vega, C., and B. St-Onge. 2008. Height growthreconstruction of a boreal forest canopy over aperiod of 58 years using a combination ofphotogrammetric and lidar models. Remote Sens-ing of Environment 112:1784–1794.
Vepakomma, U., D. Kneeshaw, and B. St-Onge. 2010.Interactions of multiple disturbances in shapingboreal forest dynamics: a spatially explicit analysisusing multi-temporal lidar data and high-resolu-tion imagery. Journal of Ecology 98:526–539.
Vepakomma, U., B. St-Onge, and D. Kneeshaw. 2008.Spatially explicit characterization of boreal forestgap dynamics using multi-temporal lidar data.Remote Sensing of Environment 112:2326–2340.
White, P. 1979. Pattern, process, and natural distur-
v www.esajournals.org 14 May 2015 v Volume 6(5) v Article 76
HOBI ET AL.

bance in vegetation. Botanical Review 45:229–299.Yamamoto, S.-I., N. Nishimura, T. Torimaru, T.
Manabe, A. Itaya, and K. Becek. 2011. A compar-ison of different survey methods for assessing gapparameters in old-growth forests. Forest Ecologyand Management 262:886–893.
Zeibig, A., J. Diaci, and S. Wagner. 2005. Gapdisturbance patterns of a Fagus sylvatica virgin
forest remnant in the mountain vegetation belt of
Slovenia. Forest Snow and Landscape Research
79:69–80.
Zhang, B., S. Miller, S. Walker, and K. DeVenencia.
2007. Next Generation Automatic Terrain Extrac-
tion using Microsoft UltraCam imagery. ASPS 2007
Annual Conference, Tampa, Florida, USA.
v www.esajournals.org 15 May 2015 v Volume 6(5) v Article 76
HOBI ET AL.