gardner denver 1999 annual report - iis...
TRANSCRIPT

GARDNER DENVER 1800 Gardner Expressway, Quincy, Illinois 62301
GARDNER DENVER 1999 Annual Report
Table of Contents
Financial Highlights 1
Strategies for Growth 2
Product Matrix 3
Chairman’s Letter 4
Financial History 14
Management’s Discussion and Analysis 15
Financial Statements and Notes 22
Shareholder Information 37
Directors and Officers 38
Gardner Denver is a market leading pro-
ducer of compressors and blowers for indus-
trial applications and pumps for the petrole-
um and industrial markets. Our products and
engineered solutions are sold through our
multi-channel, worldwide distribution system.
Our strategy focuses on growth through
acquisition, increased market share, product
development, cost reductions and penetration
of niche markets that are expanding faster
than the economy.
Gardner Denver’s products are used for
power applications in virtually every market
sector ranging from industrial movement, to
environmental processes, to healthcare
applications and energy production.
Our experienced management team and
excellent workforce have the track record,
ability and opportunity to deliver on our strat-
egy of . . . POWERING GROWTH.
1
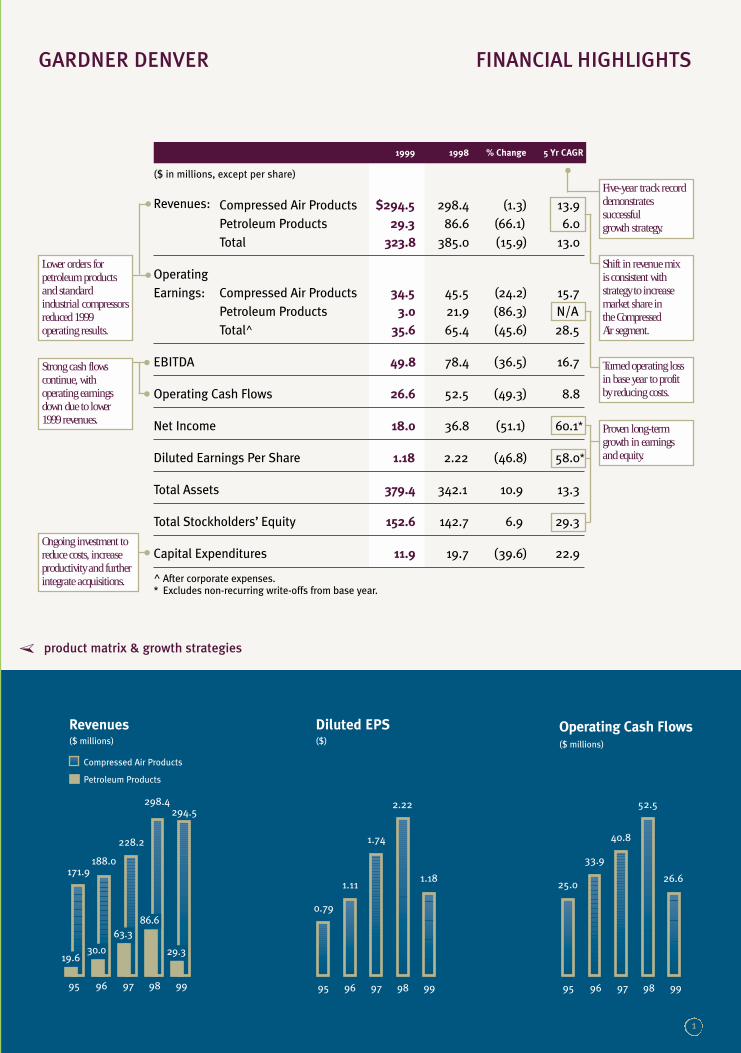
Five-year track recorddemonstratessuccessful growth strategy.
GARDNER DENVER FINANCIAL HIGHLIGHTS
Revenues($ millions)
Compressed Air Products
Petroleum Products
171.9188.0
228.2
298.4294.5
95 96 97 98 99
19.630.0
63.3
86.6
29.3
Diluted EPS($)
0.79
1.11
1.74
2.22
1.18
95 96 97 98 99
Operating Cash Flows($ millions)
95 96 97 98 99
25.0
33.9
40.8
52.5
26.6
Lower orders for petroleum productsand standard industrial compressorsreduced 1999 operating results.
Strong cash flows continue, with operating earningsdown due to lower1999 revenues.
Ongoing investment toreduce costs, increaseproductivity and furtherintegrate acquisitions.
Shift in revenue mix is consistent withstrategy to increasemarket share in the CompressedAir segment.
1999 1998 % Change 5 Yr CAGR
($ in millions, except per share)
Revenues: Compressed Air Products $294.5 298.4 (1.3) 13.9
Petroleum Products 29.3 86.6 (66.1) 6.0
Total 323.8 385.0 (15.9) 13.0
Operating
Earnings: Compressed Air Products 34.5 45.5 (24.2) 15.7
Petroleum Products 3.0 21.9 (86.3) N/A
Total^ 35.6 65.4 (45.6) 28.5
EBITDA 49.8 78.4 (36.5) 16.7
Operating Cash Flows 26.6 52.5 (49.3) 8.8
Net Income 18.0 36.8 (51.1) 60.1*
Diluted Earnings Per Share 1.18 2.22 (46.8) 58.0*
Total Assets 379.4 342.1 10.9 13.3
Total Stockholders’ Equity 152.6 142.7 6.9 29.3
Capital Expenditures 11.9 19.7 (39.6) 22.9
^ After corporate expenses.* Excludes non-recurring write-offs from base year.
product matrix & growth strategies
➣
Turned operating lossin base year to profit by reducing costs.
Proven long-termgrowth in earnings and equity.
2
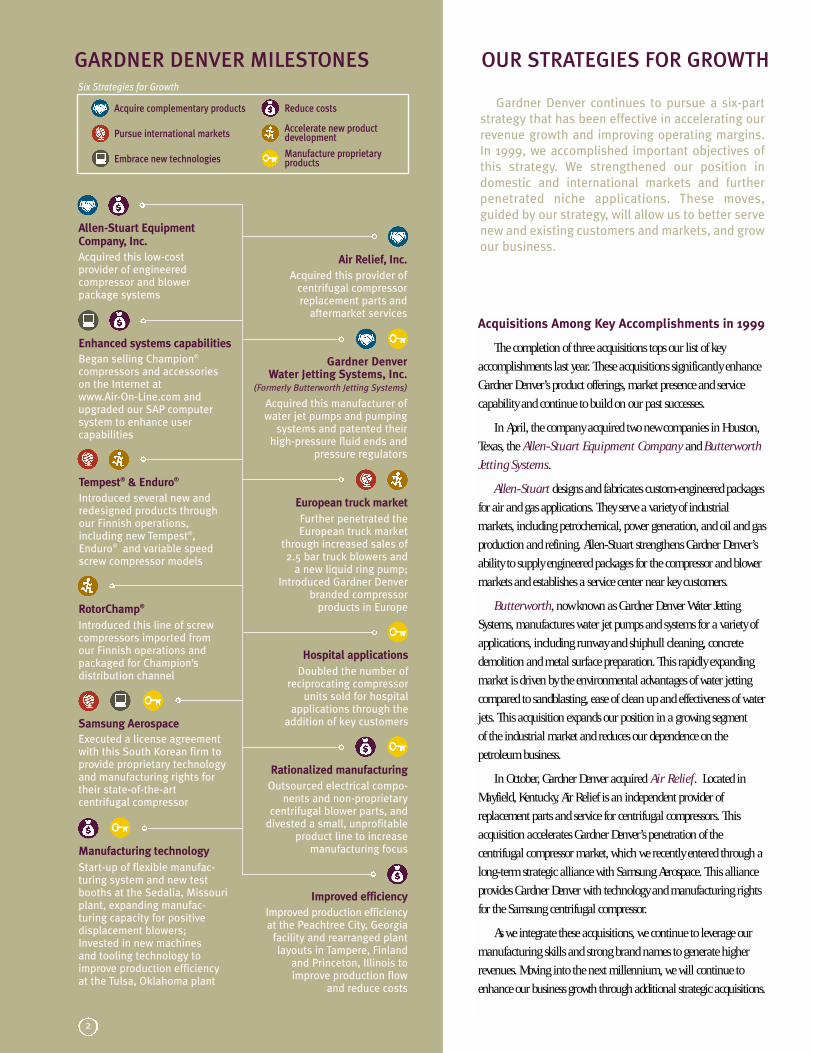
GARDNER DENVER MILESTONES
Allen-Stuart Equipment Company, Inc.
Acquired this low-costprovider of engineeredcompressor and blowerpackage systems
Gardner Denver Water Jetting Systems, Inc.
(Formerly Butterworth Jetting Systems)
Acquired this manufacturer ofwater jet pumps and pumping
systems and patented theirhigh-pressure fluid ends and
pressure regulators
Enhanced systems capabilities
Began selling Champion®
compressors and accessorieson the Internet at www.Air-On-Line.com andupgraded our SAP computersystem to enhance user capabilities
European truck market
Further penetrated theEuropean truck market
through increased sales of2.5 bar truck blowers and
a new liquid ring pump;Introduced Gardner Denver
branded compressor products in EuropeRotorChamp®
Introduced this line of screwcompressors imported fromour Finnish operations andpackaged for Champion’sdistribution channel
Rationalized manufacturing
Outsourced electrical compo-nents and non-proprietary
centrifugal blower parts, anddivested a small, unprofitable
product line to increase manufacturing focus
Samsung Aerospace
Executed a license agreementwith this South Korean firm toprovide proprietary technologyand manufacturing rights fortheir state-of-the-artcentrifugal compressor
Acquire complementary products
Pursue international markets
Embrace new technologies
OUR STRATEGIES FOR GROWTH
Tempest® & Enduro®
Introduced several new andredesigned products throughour Finnish operations,including new Tempest®,Enduro® and variable speedscrew compressor models
Hospital applications
Doubled the number of reciprocating compressor
units sold for hospital applications through the
addition of key customers
Air Relief, Inc.
Acquired this provider ofcentrifugal compressorreplacement parts and
aftermarket services
Gardner Denver continues to pursue a six-part
strategy that has been effective in accelerating our
revenue growth and improving operating margins.
In 1999, we accomplished important objectives of
this strategy. We strengthened our position in
domestic and international markets and further
penetrated niche applications. These moves,
guided by our strategy, will allow us to better serve
new and existing customers and markets, and grow
our business.
Manufacturing technology
Start-up of flexible manufac-turing system and new testbooths at the Sedalia, Missouriplant, expanding manufac-turing capacity for positivedisplacement blowers;Invested in new machines and tooling technology toimprove production efficiencyat the Tulsa, Oklahoma plant
Acquisitions Among Key Accomplishments in 1999
The completion of three acquisitions tops our list of key
accomplishments last year. These acquisitions significantly enhance
Gardner Denver’s product offerings, market presence and service
capability and continue to build on our past successes.
In April, the company acquired two new companies in Houston,
Texas, the Allen-Stuart Equipment Company and Butterworth
Jetting Systems.
Allen-Stuart designs and fabricates custom-engineered packages
for air and gas applications. They serve a variety of industrial
markets, including petrochemical, power generation, and oil and gas
production and refining. Allen-Stuart strengthens Gardner Denver’s
ability to supply engineered packages for the compressor and blower
markets and establishes a service center near key customers.
Butterworth, now known as Gardner Denver Water Jetting
Systems, manufactures water jet pumps and systems for a variety of
applications, including runway and shiphull cleaning, concrete
demolition and metal surface preparation. This rapidly expanding
market is driven by the environmental advantages of water jetting
compared to sandblasting, ease of clean up and effectiveness of water
jets. This acquisition expands our position in a growing segment
of the industrial market and reduces our dependence on the
petroleum business.
In October, Gardner Denver acquired Air Relief. Located in
Mayfield, Kentucky, Air Relief is an independent provider of
replacement parts and service for centrifugal compressors. This
acquisition accelerates Gardner Denver’s penetration of the
centrifugal compressor market, which we recently entered through a
long-term strategic alliance with Samsung Aerospace. This alliance
provides Gardner Denver with technology and manufacturing rights
for the Samsung centrifugal compressor.
As we integrate these acquisitions, we continue to leverage our
manufacturing skills and strong brand names to generate higher
revenues. Moving into the next millennium, we will continue to
enhance our business growth through additional strategic acquisitions.
Improved production efficiencyat the Peachtree City, Georgia
facility and rearranged plantlayouts in Tampere, Finland
and Princeton, Illinois toimprove production flow
and reduce costs
Improved efficiency
Reduce costs
Accelerate new product development
Manufacture proprietary products
Six Strategies for Growth

3
➣ compressors ➣ blowers ➣ industrial pumps ➣ petroleum pumps
product offering
brand names
markets served
product applications
competitivestrengths
recently introduced
products
manufacturingand packaging
locations
Reciprocating, rotary screw andsliding vane compressors from 0.5 horsepower (HP) to 900 HP
PRODUCTGROUPS
Gardner Denver – Electra-Screw, Electra-Saver, Electra-Saver II, Twistair
Champion – RotorChampTamrotor – Tempest, Enduro
Mining, textile, food processing, electronics, aerospace, furniture,paper, military, steel, specialtygases, medical services, automotiveservice centers, bottle blowing, oiland natural gas, industrial plantsand locomotive air needs
Process air, pneumatic tools, actuation, membrane technology,shop/plant air, bulk material andliquid conveying, boosting air andgas, locomotive air brakes, PETbottle blowing, and oil and natural gas drilling
Broad HP offering, advancedmicroprocessor controls, part loadcapacity control, direct driven/slowturning equipment, diverse product offering, standard or engineered packages
Low HP/low sound/cost competitive packages, 200 HPdirect driven screw packages
Quincy, IllinoisSedalia, MissouriPrinceton, IllinoisHouston, TexasMayfield, KentuckyManteca, CaliforniaTampere, Finland
Positive displacement and centrifugal blowers from 0 to 45,000 cubic feet per minute(CFM)
Sutorbilt, DuroFlow, CycloBlower,Lamson, TurboTron, Wittig,Invincible and CatVac
Dairy, printing, carpet cleaning,wastewater treatment, landfill gas recovery, industrial cleaning,sewer cleaning, chemical, food,grain and plastic processing, utilities, pulp and paper andindustrial gas
Pneumatic conveying, dry and liquid bulk transporting, waste-water treatment, aeration, blow-off,drying/cooling, air knife andvacuum systems, gas boosting and dust collection
Depth and breadth of products and services available to markets served, and engineered packagecapability
2.5 bar CycloBlower, variable frequency drive multistage centrifugal systems, MVP (modularvacuum or pressure) positivedisplacement blower packages
Peachtree City, GeorgiaSedalia, Missouri Baltic, OhioHouston, TexasSchopfheim, Germany
High- and ultrahigh-pressurepumps, pump packages and accessories from 75 HP to 750 HP and pressures up to36,000 pounds per square inch(PSI)
Liqua-Blaster, Ultra Blast 36 andAmerican Waterblaster
Airports, construction, chemicalprocessing, marine, mining,refineries, ship yards, steel millsand surface preparation
Industrial cleaning, cutting and maintenance
Safer for the environment, stainless-steel fluid end, field-tested design
Water-jetting unit capable of36,000 PSI
Fort Worth, TexasHouston, Texas
Duplex, triplex and quintuplexpositive displacement reciprocatingpumps from 16 HP to 3,000 HP
Gardner Denver, Geoquip, Ajax and OPI
Oil and natural gas
Oil and natural gas drilling,cementing, acidizing, fracturing,salt water disposal and oil transfer
Leader in the well stimulationmarket and key alliance withmajor well stimulation company
3,000 HP stimulation pump andtriplex pump for trenchless applications; lightweight 2,000 HPdrilling pump
Quincy, IllinoisTulsa, OklahomaFort Worth, Texas
4
To Our Shareholders:
Gardner Denver enters 2000 well positioned to benefit from
improvements in the industrial and energy sectors, fueled by the power
and pervasiveness of compressed air applications throughout the world.
Nineteen ninety-nine was a challenging year.
The prolonged decline in industrial capacity
utilization in 1998 and 1999, and the lower
oil and natural gas prices which occurred
through early 1999, contributed to a greater-
than-anticipated reduction in revenues
and earnings per share in 1999.
Revenues declined by 16% in 1999
from 1998. This revenue reduction,
compounded by less manufac-
turing leverage and lower benefits
of inventory reduction programs,
resulted in net income falling by
51% and diluted earnings per
share decreasing 47%.
Incremental revenue contribu-
tions, diversification and
production efficiencies from our strategic acquisitions helped us
successfully weather the only significant period of market weakness
since our spin-off five years ago. Despite a difficult 1999, our revenues
and earnings per share have increased at compounded average annual
rates of 13% and 58%, respectively, over the past five years.
We generate more cash than is needed to run our business,
providing opportunities to make acquisitions and invest in operating
efficiencies, product innovation, distribution enhancements and
e-business initiatives.
Moving into the new millennium, we envision Gardner Denver as
a company with even greater leadership in the global market for
compressed air. Our objective is to achieve an internal rate of growth
that exceeds the Gross Domestic Product rate of expansion, by
increasing market share and penetrating niche markets that grow
faster than the economy. Examples of these markets are plastic bottle
blowing, wastewater treatment, industrial cleaning and medical
services. We will compound this growth through completing
synergistic acquisitions.
We are truly an international company, with manufacturing and
warehouse locations around the world. Our global presence allows us
to further diversify our revenue base and enhance our product line
and distribution channels. It also positions us to make strategic
acquisitions in the rapidly consolidating European market.
Acquisitions have been core to our effective business strategy.
Gardner Denver has completed nine acquisitions since 1996, which
provided 47% of our total revenues in 1999. We attribute our
successful acquisition track record to knowing the types of companies
to acquire and executing acquisitions under terms that offer a fair
return to the sellers and optimum value to our shareholders. We
know how to rapidly unlock engineering, distribution and
marketing synergy between our existing operations and our
newly acquired companies.
As a result, our acquisition strategy has accelerated revenue
growth, opened new markets, reinforced our leadership position and
provided diversification. Examples include:
• the Lamson acquisition, which made us the largest manufacturer
of blowers in the world;
• the Champion acquisition which moved us into the automotive
services and medical markets;
• penetration of the European market through the addition of
Tamrotor compressors in Finland and Wittig blowers in
Germany; and
• our alliance with Samsung and acquisition of Air Relief which
accelerated our entry into the centrifugal compressor market.
Within the petroleum market, the acquisition of TCM and Geoquip
enabled Gardner Denver to be a sole source provider of well servicing
le
tt
er
➣ “we generate more cash than is needed, providing opportunities to make acquisitions”

5
pumps and aftermarket services to key customers in this
industry. These acquisitions were well-timed and provided
significant earnings leverage during the petroleum market
expansion in 1997 and 1998. As the petroleum market
recovers from its previous downturn, this leverage opportunity
will return, and the resulting cash flow will fund further
growth in compressed air products.
We closely monitor macroeconomic statistics and industry
trends that have historically correlated with order flow and
revenues. For example, when capacity utilization exceeds 80%
to 81%, we have seen stronger demand for air compressors
used in industrial manufacturing. In 1998 and 1999,
capacity utilization declined as production of industrial
equipment slowed. Recently, we have seen an improvement
in capacity utilization, which moved from 79.6% in the
second quarter of 1999 to 80.1% in the fourth quarter, and
a corresponding increase in orders for compressor products.
Likewise, petroleum sales are strongly correlated with oil
prices and rig count. With the recovery of oil prices, we have
recently seen increased orders for replacement parts and well
servicing pumps.
Economic cycles are part of the environment in which we
do business, and our track record demonstrates our ability to
plan strategically and manage our business for optimum cash
flow. The highlights listed in our 1999 milestones and other
information throughout our annual report demonstrate that
each of our acquisitions and operating initiatives fulfills
several strategic objectives of our six-part growth strategy.
Among these initiatives is the launch of e-business, which
we will continue to develop through 2000 and beyond. In
1999, we began marketing some compressor products and
accessories on-line through our web site Air-On-Line.com.
We also believe that industrial companies such as Gardner
Denver have numerous opportunities through e-business
initiatives to improve communication, support distribution,
manage the supply chain, build sales and increase efficiency.
Our experienced, dedicated management team and work-
force have been instrumental in successfully managing
through the downturn of 1999 and continue their commit-
ment to maximizing the opportunities ahead. The strength
of the Gardner Denver team is reinforced by our corporate
governance, compensation and performance incentive
policies which align management’s interests with those
of our shareholders.
We believe there is a strong relationship between
executive stock ownership and corporate performance.
Therefore, Gardner Denver officers, directors and key
management personnel have specific stock ownership levels
they must achieve.
All of these factors – well-executed strategy, proven track
record, appropriate performance incentives and sound
corporate governance – combine to create a compelling
opportunity for our shareholders. Amid a consolidating
market environment, we’re focused on creating value as we:
• employ capital for growth, operating improvements and
system enhancements;
• expand into new markets that grow faster than
the economy;
• invest in management talent and workforce development;
• position the Company for recovery in demand for
industrial equipment and petroleum products; and
• continue to increase market visibility to support
increased valuation.
We appreciate your interest in Gardner Denver and wish
you prosperity and peace in the coming year.
Ross J. CentanniChairman, President and Chief Executive OfficerFebruary 7, 2000
Revenues fromAcquisitions($ millions)
Total
Base
Production of Industrial Equipmentannual rate of change
Q1 Q2 Q3 Q4 Q1 Q2 Q3 Q4
Recent improvements in keyindicators signal potentialdemand improvement in 2000.
Incremental revenues from
acquisitions helped offset
the economic downturn
of 1999.
1998 1999
U.S. ManufacturingCapacity Utilizationpercent
Q1 Q2 Q3 Q4 Q1 Q2 Q3 Q4
82.0
1998 1999
79.7
80.1
79.6
79.6
80.2
80.3
81.0
-2.1
-0.8
-0.5
0.7
-1.0
0.90.8
0.1
191.5218.0
291.5
385.0
323.8
95 96 97 98 99
218
.3
193
.7
191.
5 22
9.0
170
.2

mo
ve
me
nt
➣ powering products for movement
Gardner Denver is a leader in many key markets for compressed air that power applications
for movement, the environment and health. The myriad of uses for compressors helps explain
why demand for Gardner Denver’s products is so pervasive and why our prospects for growth
are so promising.
Gardner Denver also continues as a leader in the energy market, driven by innovative
applications of our compressor and pump products. Although highly cyclical, the petroleum
and natural gas industries continue to provide the Company with cash flow to finance our
strategies for growth and expansion.
Compressed air is often called the “fourth utility,” following electricity, natural gas/oil and
water. Nearly every industry uses compressors to provide plant air. Compressed air leverages
a plant’s utility costs through the efficient use of power.
Compressed air has a number of advantages compared to electrical or hydraulic power
sources. Air tools run cooler and provide more power per unit of weight than electrical tools.
Air tools also have fewer moving parts, usually require less maintenance (and thus cost less
to operate), and are safer to operate when compared to electrical or hydraulic tools.
6
Sutorbilt® positive displace-ment blower package usedfor pneumatic conveying.

Air is used to manufacture the products we use every day, moving material along an
assembly line, operating pneumatic tools and powering mechanical devices used in operations
such as painting and packaging.
Compressors and vacuum pumps are used to transport heavy bulk materials through
pipelines. Pumps are also used to transfer oil and water. Many different materials, such as grain,
dry cement, limestone, chemicals and plastics, can be moved with blowers instead of mechanical
conveyors. Gardner Denver manufactures products that are used in each of these diverse applica-
tions. Our products are used in delicate operations such as holding paper in place during
printing and in powerful applications such as bending and shaping metal.
Compressed air is used in many unique applications. We sell to clothing manufacturers, who
use air to cool needles when they sew. Our compressors provide the power to cover Olympic slopes
with artificial snow, and we are a leading supplier of reciprocating compressors for pneumatic
braking systems, sanding and horn operations on railroad engines. Our blowers supply the deep
vacuum required to dry wood pulp to produce paper, and our compressors drive controls, hoists
and cutters in various stages of the papermaking process.
7
Gardner Denver manufactures posi-
tive displacement and centrifugal
blowers. Blowers differ from
compressors in that they produce a
high volume of air at low pressures
and vacuums. Our blower product
offering can provide air flows up to
45,000 cubic feet per minute. One of
our blowers can provide enough air
flow to fill the largest Goodyear ®
blimp in just six minutes.
Gardner Denver is the largest
manufacturer of blowers and well
servicing pumps in the world.
➣
➣
8
➣ powering equipment for a cleaner environment
en
vir
on
me
nt
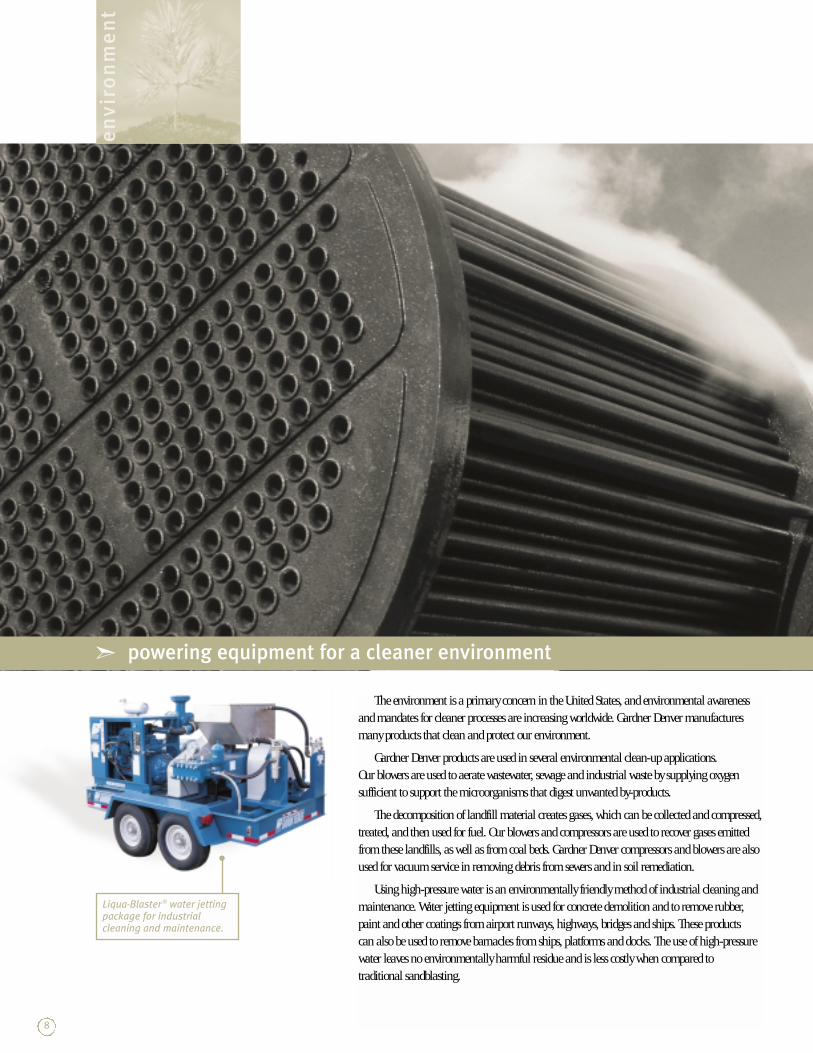
The environment is a primary concern in the United States, and environmental awarenessand mandates for cleaner processes are increasing worldwide. Gardner Denver manufacturesmany products that clean and protect our environment.
Gardner Denver products are used in several environmental clean-up applications. Our blowers are used to aerate wastewater, sewage and industrial waste by supplying oxygen sufficient to support the microorganisms that digest unwanted by-products.
The decomposition of landfill material creates gases, which can be collected and compressed,treated, and then used for fuel. Our blowers and compressors are used to recover gases emittedfrom these landfills, as well as from coal beds. Gardner Denver compressors and blowers are alsoused for vacuum service in removing debris from sewers and in soil remediation.
Using high-pressure water is an environmentally friendly method of industrial cleaning andmaintenance. Water jetting equipment is used for concrete demolition and to remove rubber,paint and other coatings from airport runways, highways, bridges and ships. These products can also be used to remove barnacles from ships, platforms and docks. The use of high-pressurewater leaves no environmentally harmful residue and is less costly when compared to traditional sandblasting.
Liqua-Blaster ® water jettingpackage for industrialcleaning and maintenance.

9
In air separation applications, such as bleaching paper, our blowers are used as a more costcompetitive alternative to cryogenic processing. Blowers are used in pneumatic conveying toreplace open belt and screw conveyors, reducing dust pollution.
Historically, gasoline vapors from auto refueling, pressure relief of propane and butane tanks, or vapors from liquid tanks and liquid pipelines were released into the atmosphere. Since EPA regulations now prohibit this practice, these vapors can be collected using GardnerDenver compressors.
In the interest of preserving natural resources while maintaining lifestyle conveniences, demand for recyclable containers such as polyethylene terephthalate (PET) bottles has increaseddramatically. Millions of plastic bottles are used every day for soft drinks and other food products.Product quality and reliability are critical in the PET bottle industry. Our reciprocatingcompressor packages provide high-pressure oil-free air for manufacturers forming many of these bottles daily.
Gardner Denver continues to penetrate these promising markets, because we recognize theeconomic importance of these products, and value the environmental benefits that we all share.
Water jets used to clean vehicles
in self-service car washes typically
operate around 1,500 PSI. By
comparison, the 36,000 PSI water
jets manufactured by Gardner
Denver would strip the car’s paint
down to the metal! Water jets like
these are so powerful they can cut
a bridge apart, leaving the iron
infrastructure to be reused.
A $100 investment in Gardner
Denver stock in December 1994
would be worth 42% more today
than a comparable investment
in the S&P 500.
➣
➣

10
➣ powering clean air systems for health
he
al
th
Many of Gardner Denver’s compressed air products are used throughout the healthcare
industry. Our compressors and blowers are found in many applications used in hospitals and
other medical facilities. These applications require 100% reliability, such as when powering
surgical tools or providing breathing air for patients. In the fast-growing industry of pharma-
ceuticals, Gardner Denver blowers and compressors are used for component conveying, mixing,
pressing and packaging medicines.
Delicate instrumentation and many industries such as pharmaceuticals, electronics, chemicals,
medical, food and textiles, require oil-free air to assure that products are not contaminated.
These non-lubricated applications represent 15% to 20% of the total compressed air market, as
compared to applications for lubricated compressors which use oil for lubrication and cooling
purposes. Oil-free compressors are specialized units which typically cost more than lubricated
units due to their complex package design or the expensive materials required in their production.
To further penetrate premium niche markets for oil-free air, Gardner Denver has researched
water-lubricated bearings and new material technology for its oil-free rotary compressors. Gardner Denver ® oil-free reciprocating compressor forpharmaceutical manufacturing.

11
Our compressors are also used in a revolutionary dental process called “air abrasion.” This
delicate dentistry technique, which relies on compressed air for the drilling process, is a virtually
painless alternative to the traditional dentist’s drill.
Gardner Denver’s products are also used in industries that must provide a totally sanitary
product. Our blowers, another oil-free product, are used in milking dairy cows. Our blowers
prevent the contamination of the milk with oil, and also have the competitive advantage of
being able to run in reverse to back-flush the milking system during the cleaning process.
Our pumps are used for water well drilling and our water jetting products are used to
remove harmful chemicals from kettles, pipes and mixers.
We see tremendous opportunities in the fast-growing healthcare market and increasing
demand for products that keep our homes and workplaces clean. We produce the blowers used in
portable, industrial vacuum cleaners. These vacuums are used to clean the carpets of thousands
of homes, office buildings and industrial complexes. Automotive service centers and rental
agencies also use vacuum systems to clean car interiors for their customers.
Gardner Denver is the second largest
manufacturer of compressed air
products in the United States and
fourth largest in the world. About
$4 billion of compressors and
blowers are sold around the world
every year, for many different appli-
cations. Gardner Denver sells these
products to so many different
customers and applications, that no
customer represents more than 2%
of our compressor revenue volume.
Over the past five years, Gardner
Denver’s earnings per share
has grown an average of 58%
per year.
➣
➣
12
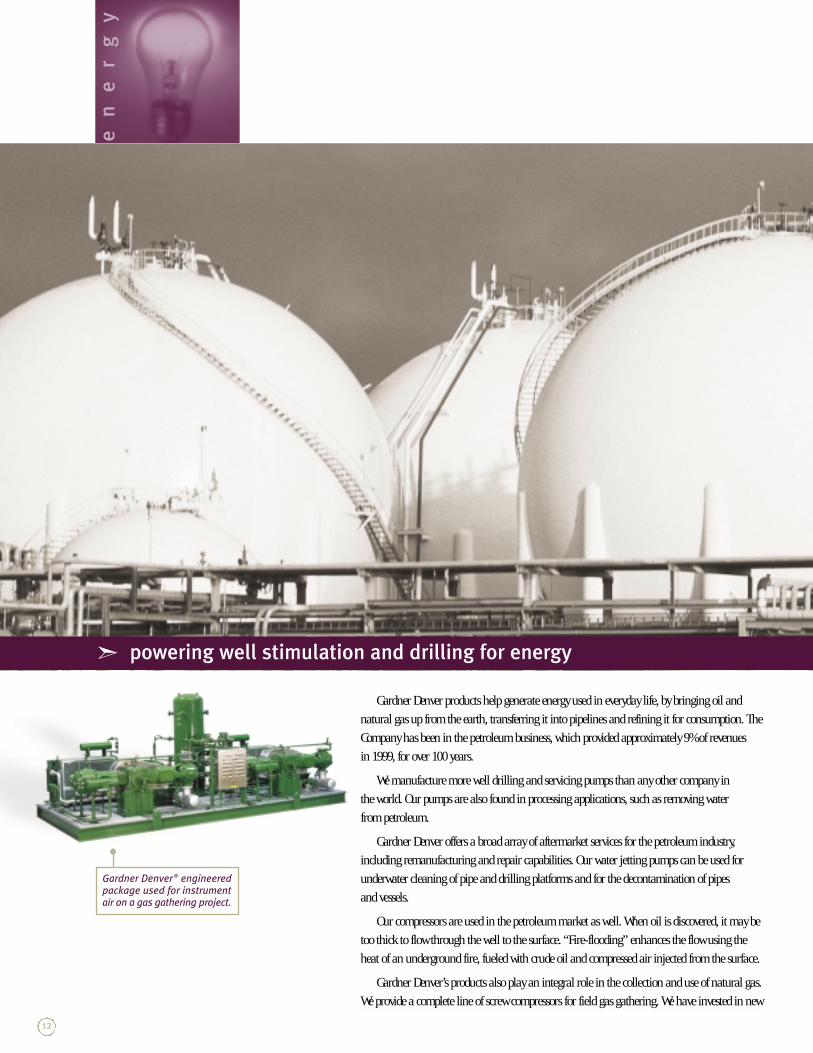
Gardner Denver products help generate energy used in everyday life, by bringing oil and
natural gas up from the earth, transferring it into pipelines and refining it for consumption. The
Company has been in the petroleum business, which provided approximately 9% of revenues
in 1999, for over 100 years.
We manufacture more well drilling and servicing pumps than any other company in
the world. Our pumps are also found in processing applications, such as removing water
from petroleum.
Gardner Denver offers a broad array of aftermarket services for the petroleum industry,
including remanufacturing and repair capabilities. Our water jetting pumps can be used for
underwater cleaning of pipe and drilling platforms and for the decontamination of pipes
and vessels.
Our compressors are used in the petroleum market as well. When oil is discovered, it may be
too thick to flow through the well to the surface. “Fire-flooding” enhances the flow using the
heat of an underground fire, fueled with crude oil and compressed air injected from the surface.
Gardner Denver’s products also play an integral role in the collection and use of natural gas.
We provide a complete line of screw compressors for field gas gathering. We have invested in new
➣ powering well stimulation and drilling for energy
en
er
gy
Gardner Denver ® engineeredpackage used for instrumentair on a gas gathering project.
13
product designs so that our units require less maintenance and operate more efficiently than
those of our competitors. Our products compress natural gas gathered at well heads and inject
the gas into distribution lines that send it all over the country.
The natural gas pipeline system is filled with gas at specific pressures. In periods of peak
demands, such as extreme cold, there is not enough pressure or volume. A mixture of propane
and compressed air is put into the pipeline in a process called “peak shaving,” so that sufficient
gas is available.
We also produce compressors that condense natural gas into storage tanks at filling stations.
Compressors can be used to fill natural gas tanks that run forklifts in factories and warehouses,
as well. Compressors may be used to fill natural gas tanks on automobiles as gasoline prices
increase and this alternative fuel becomes economically feasible.
Energy markets are largely driven by the price of oil and natural gas. Prices fell dramatically
in 1998 and early 1999, due to excess capacity during a time of weakened worldwide consumption.
Prices recovered during 1999, which has led to increased orders for replacement parts and well
servicing pumps and may lead to improved revenues in this segment in 2000.
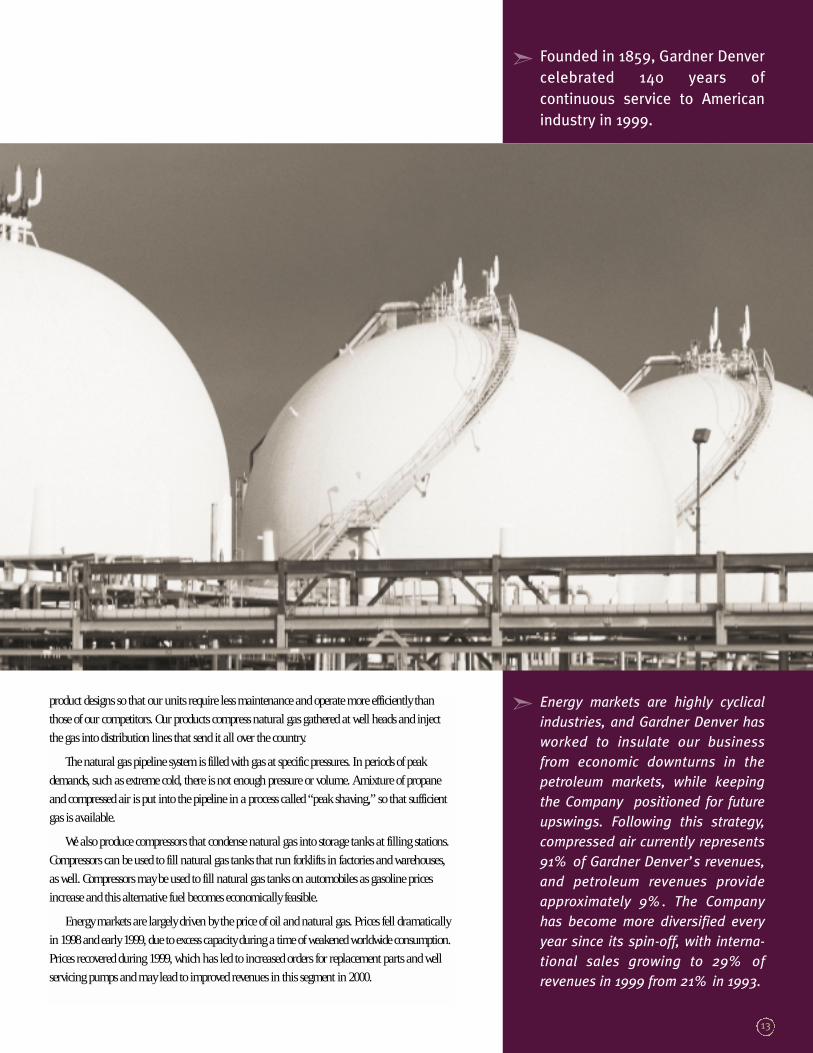
Founded in 1859, Gardner Denver
celebrated 140 years of
continuous service to American
industry in 1999.
Energy markets are highly cyclical
industries, and Gardner Denver has
worked to insulate our business
from economic downturns in the
petroleum markets, while keeping
the Company positioned for future
upswings. Following this strategy,
compressed air currently represents
91% of Gardner Denver’s revenues,
and petroleum revenues provide
approximately 9%. The Company
has become more diversified every
year since its spin-off, with interna-
tional sales growing to 29% of
revenues in 1999 from 21% in 1993.
➣
➣
14
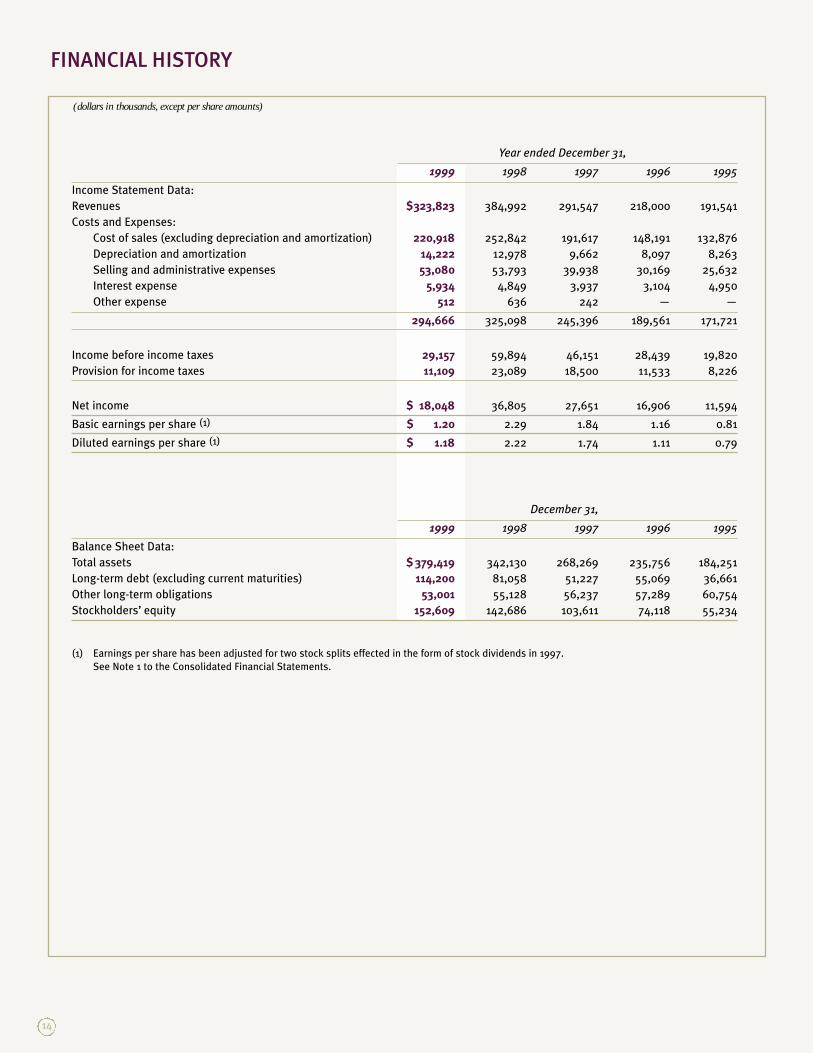
FINANCIAL HISTORY
(dollars in thousands, except per share amounts)
Year ended December 31,
1999 1998 1997 1996 1995)
Income Statement Data:
Revenues $323,823 384,992 291,547 218,000 191,541)
Costs and Expenses:
Cost of sales (excluding depreciation and amortization) 220,918 252,842 191,617 148,191 132,876)
Depreciation and amortization 14,222 12,978 9,662 8,097 8,263)
Selling and administrative expenses 53,080 53,793 39,938 30,169 25,632)
Interest expense 5,934 4,849 3,937 3,104 4,950)
Other expense 512 636 242 — —)
294,666 325,098 245,396 189,561 171,721)
Income before income taxes 29,157 59,894 46,151 28,439 19,820)
Provision for income taxes 11,109 23,089 18,500 11,533 8,226)
Net income $ 18,048 36,805 27,651 16,906 11,594)
Basic earnings per share (1) $ 1.20 2.29 1.84 1.16 0.81)
Diluted earnings per share (1) $ 1.18 2.22 1.74 1.11 0.79)
December 31,
1999 1998 1997 1996 1995)
Balance Sheet Data:
Total assets $ 379,419 342,130 268,269 235,756 184,251)
Long-term debt (excluding current maturities) 114,200 81,058 51,227 55,069 36,661)
Other long-term obligations 53,001 55,128 56,237 57,289 60,754)
Stockholders’ equity 152,609 142,686 103,611 74,118 55,234)
(1) Earnings per share has been adjusted for two stock splits effected in the form of stock dividends in 1997.
See Note 1 to the Consolidated Financial Statements.
MANAGEMENT’S DISCUSSION AND ANALYSIS
The following discussion should be read in conjunction with theconsolidated financial statements and notes thereto.
Overview
The Company’s operations are organized into two reportablesegments - Compressed Air Products and Petroleum Products. In theCompressed Air Products segment, the Company designs, manufac-tures, markets and services the following products for industrial andcommercial applications: reciprocating, rotary screw and slidingvane air compressors, and positive displacement and centrifugalblowers. Aftermarket parts and services for centrifugal compressorsand water jet pumps and systems for industrial cleaning and mainte-nance are also included in this segment. The largest markets forGardner Denver’s compressed air products are durable goods manu-facturers; process industries such as petroleum, primary metals,pharmaceuticals, food and paper; original equipment manufacturers;manufacturers of carpet cleaning equipment, pneumatic conveyingequipment and dry bulk trailers; wastewater treatment facilities;industrial cleaning and maintenance; and automotive service centers.Revenues of the Compressed Air Products segment constitutedapproximately 91% of total revenues in 1999.
In the Petroleum Products segment, the Company designs, manu-factures, markets and services a diverse group of pumps used in oiland natural gas production, well servicing and stimulation and oil andgas drilling. Typical applications include oil transfer, saltwaterdisposal, ammine pumping for gas processing, enhanced oil recovery,hydraulic power, and other liquid transfer applications. Revenues ofthe Petroleum Products segment constituted approximately 9% oftotal revenues in 1999.
The Company sells its products through independent distributors,sales representatives and directly to original equipment manufac-turers, engineering firms and end users.
In October 1999, the Company acquired Air Relief, Inc. (“AirRelief ”). Air Relief, located in Mayfield, Kentucky, is an independentprovider of replacement parts and service for centrifugal compres-sors. Air Relief enhances Gardner Denver’s ability to penetrate thecentrifugal compressor market by adding key centrifugal compressorengineering, assembly, sales and service capabilities.
In April 1999, the Company acquired Allen-Stuart Equipment Co.,Inc. (“Allen-Stuart”). Allen-Stuart, located in Houston, Texas, designsand fabricates custom-engineered packages for compressor andblower equipment in air and gas applications. Allen-Stuart serves awide variety of industrial markets, including petrochemical, powergeneration, oil and natural gas production and refining. The additionof Allen-Stuart enhances Gardner Denver’s ability to supply engineeredpackages, incorporating the wide range of compressor and blowerproducts manufactured by Gardner Denver. It also enables GardnerDenver to establish a service center near key Southwestern customers.
Also in April 1999, the Company acquired Butterworth JettingSystems, Inc. (“Butterworth”). Butterworth, also located in Houston,Texas, is a manufacturer of water jet pumps and systems serving theindustrial cleaning and maintenance market. Applications in thismarket include runway and shiphull cleaning, concrete demolitionand metal surface preparation. This acquisition, which was renamedGardner Denver Water Jetting Systems, Inc., enables Gardner Denverto expand its position in the rapidly-growing water jet market.
Butterworth, Allen-Stuart and Air Relief are included in theCompany’s Compressed Air Products segment.
The Company purchased the Wittig Division of MannesmannDemag AG (“Wittig”) in March 1998. Wittig, located in Schopfheim,Germany, is a leading manufacturer of rotary sliding vane compres-sors and vacuum pumps. Wittig’s products primarily serve the truckblower market for liquid and dry bulk conveyance, as well as otherindustrial applications. The acquisition of Wittig expanded theCompany’s manufacturing presence in Europe and provided distribu-tion channels for positive displacement blowers, which are producedin the United States. Wittig is included in the Company’s CompressedAir Products segment.
In January 1998, the Company purchased Champion PneumaticMachinery Company, Inc. (“Champion”). Champion, located inPrinceton, Illinois, is a leading manufacturer of low horsepower reci-procating compressors. Champion opened new market opportunitiesfor Gardner Denver products and expanded the range of recipro-cating compressors available to existing distributors. Champion isincluded in the Company’s Compressed Air Products segment.
In January 1998, the Company also acquired GeologicalEquipment Corporation (“Geoquip”). Geoquip, a leading manufac-turer of pumps, ranging from 350 to 2,400 horsepower, is located inFort Worth, Texas. The operation also remanufactures pumps andprovides repair services. The addition of Geoquip enhanced theGardner Denver well servicing product line and expanded theCompany’s presence in remanufacturing and repair services.Geoquip is included in the Company’s Petroleum Products Segment.
In 1997, Gardner Denver acquired Oy Tamrotor Ab (“Tamrotor”),located in Tampere, Finland. This operation designs and manufac-tures lubricated rotary screw compressor air ends and providesGardner Denver with a manufacturing base in Europe, as well asmarket penetration in several European compressor markets.Tamrotor was liquidated in 1999 and the Company currently conductsbusiness in Finland as Gardner Denver Oy (“GD Oy”). GD Oy isincluded in the Company’s Compressed Air Products segment.
The acquisitions completed in 1999, 1998 and 1997 providegrowth opportunities through synergistic product lines and domesticand international market penetration.
The following table sets forth percentage relationships to revenuesof certain income statement items for the years presented.
15

MANAGEMENT’S DISCUSSION AND ANALYSIS
Year ended December 31,
1999 1998 1997
Revenues 100.0% 100.0 100.0
Costs and Expenses:
Cost of sales (excluding depreciation and amortization) 68.2 65.7 65.7
Depreciation and amortization 4.4 3.4 3.3
Selling and administrative expenses 16.4 14.0 13.7
Interest expense 1.8 1.2 1.4
Other expense 0.2 0.1 0.1
91.0 84.4 84.2
Income before income taxes 9.0 15.6 15.8
Provision for income taxes 3.4 6.0 6.3
Net income 5.6% 9.6 9.5
YEAR ENDED DECEMBER 31, 1999, COMPARED
WITH YEAR ENDED DECEMBER 31, 1998
Revenues
Revenues decreased $61.2 million (16%) to $323.8 million in1999, compared to $385.0 million in 1998. Excluding incrementalrevenue from acquisitions completed since January 1998, whichadded $27.6 million to compressor revenues in 1999, revenuesdecreased $88.8 million (23%) as compared to 1998.
Revenues in the Compressed Air Products segment decreased $3.9million (1%) to $294.5 million in 1999, compared to $298.4 millionin 1998. Excluding incremental revenue from acquisitions,compressed air product revenues decreased $31.5 million (11%)from 1998. Reduced standard industrial compressor and engineeredpackage revenues resulted primarily from a declining rate of growthin industrial production and lower manufacturing capacity utilizationin the United States, which has occurred since the fourth quarter of1997, and a softer European economy in 1999.
The significant decline in the price of oil in 1998 and early 1999caused a reduction in demand for drilling and well servicing pumpsin 1999. As a result, petroleum revenues declined $57.2 million(66%) to $29.3 million in 1999, compared to $86.6 million in 1998when revenues were generated through production from the order backlog.
Costs and Expenses
Gross margin (defined as revenues less cost of sales) in 1999decreased $29.3 million (22%) to $102.9 million from $132.2million in 1998. This reduction resulted primarily from the lowerrevenue volume, compounded by a decrease in the gross margin as apercentage of revenues (gross margin percentage). Gross marginpercentage decreased to 31.8% in 1999 from 34.3% in 1998, princi-
pally attributable to three factors. First, acquisitions negativelyaffected the gross margin percentage as these companies, in theaggregate, currently generate lower gross margins than theCompany’s previously existing operations. Second, the negativeimpact of decreased leverage of production overhead costs over alower revenue base was only partially offset by cost reduction effortsand increased operating efficiencies. Finally, gross margin was nega-tively impacted by a significantly lower LIFO liquidation benefit, assmaller reductions in LIFO inventory levels were realized in 1999compared to 1998. In 1999, gross margins were enhanced $0.4million as a result of the liquidation of LIFO inventory layers,compared to $4.5 million in 1998.
Depreciation and amortization increased 10% to $14.2 million in1999, compared to $13.0 million in 1998. The increase in deprecia-tion and amortization expense was due to goodwill amortizationassociated with acquisitions and ongoing capital expenditures.Depreciation and amortization expense, as a percentage of revenues,increased to 4.4% in 1999 from 3.4% in 1998. This percentageincrease was due to the factors noted above, combined with the effectof lower revenues.
Selling and administrative expenses decreased in 1999 by 1% to$53.1 million from $53.8 million for 1998. Incremental expenses of$4.6 million related to acquisitions were more than offset bydecreases in manpower levels and discretionary spending. Excludingthe impact of acquisitions, selling and administrative expensesdecreased $5.3 million (10%) from 1998. As a percentage ofrevenues, selling and administrative expenses were 16.4% in 1999,compared to 14.0% in 1998. This percentage increase was primarilydue to the decrease in revenues and the addition of acquisitionsreferred to above, which, in the aggregate, have higher selling andadministrative expenses relative to sales than the Company’s previ-ously existing operations.
16

Compressed Air Products’ operating earnings (defined asrevenues less cost of sales, depreciation and amortization, and selling and administrative expenses excluding unallocated corporateadministrative expenses) decreased $11.0 million (24%) to $34.5million, compared to $45.5 million in 1998. This decline was due tothe revenue reduction, the negative impact of decreased leverage ofthe segment’s fixed and semi-fixed costs over a lower revenue baseand the effect of newly acquired operations that currently generatelower operating earnings (after amortization of goodwill associatedwith the acquisitions), as a percentage of revenues, than theCompany’s previously existing operations. Operating earnings werealso negatively impacted by an increased allocation of shared costssince the segment’s revenues represented a greater percentage of theCompany’s total revenues in 1999 as compared to 1998, and areduced benefit resulting from the liquidation of LIFO inventorylevels. Manpower reductions, reduced discretionary spending andother cost reduction efforts partially offset these negative factors. As apercentage of revenues, operating earnings declined to 11.7% in1999 compared to 15.2% in 1998.
Operating earnings for the Petroleum Products segment decreased$18.9 million to $3.0 million in 1999, an 86% decrease from $21.9million in 1998. This decline was primarily attributable to therevenue reduction, the negative impact of decreased leverage of thesegment’s fixed and semi-fixed costs over a lower revenue base, and areduced benefit resulting from the liquidation of LIFO inventorylevels, partially offset by manpower reductions, reduced discretionaryspending and other cost reduction efforts. As a percentage ofrevenues, operating earnings for this segment declined to 10.2% in1999 compared to 25.3% in 1998.
Interest expense increased $1.1 million (22%) to $5.9 million for1999, compared to $4.8 million in 1998, due primarily to higheraverage debt outstanding in 1999. The average interest rate for 1999was 5.9%, compared to 5.8% for 1998. See Note 9 to theConsolidated Financial Statements for further information on theCompany’s borrowing arrangements.
Income
Income before income taxes declined $30.7 million (51%) to$29.2 million in 1999 from $59.9 million in 1998. This decreasewas primarily the result of lower revenues and reduced gross marginsin 1999, as discussed above.
The provision for income taxes decreased by $12.0 million to$11.1 million in 1999 compared to $23.1 million in 1998, as a resultof the lower income before taxes and a lower overall effective tax rate.The Company’s effective tax rate was 38.1% in 1999 compared to38.6% in 1998. The lower effective tax rate in 1999 was primarily dueto increased savings from the Company’s foreign sales corporation(the “FSC”) and the implementation of other tax strategies.
Net income decreased $18.8 million, or 51%, to $18.0 million
($1.18 diluted earnings per share) in 1999 compared to $36.8million ($2.22 diluted earnings per share) in 1998. In 1999, netincome included $0.3 million in after-tax LIFO income ($0.02 dilutedearnings per share), compared with $2.8 million ($0.17 dilutedearnings per share) in 1998. Excluding the after-tax benefit of LIFOincome, net income declined $16.3 million (48%), primarily due tothe revenue reduction and less leverage of fixed costs over lowerproduction volume, partially offset by lower income taxes.Acquisitions completed since January 1998 were slightly accretive to the Company’s net income in 1999.
Outlook
Demand for petroleum products is related to market expectationsfor oil and natural gas prices. During the first quarter of 1999,orders for the Company’s petroleum products reached their lowestlevel for the 1998 – 1999 time frame, as a result of the substantialdecline in the prices of oil and natural gas in 1998 and early 1999.Orders for petroleum products were $29.2 million in 1999, adecrease of $27.0 million compared to $56.2 million in 1998. Order backlog for the Petroleum Products segment was $6.5 millionat both December 31, 1999 and 1998.
Increases in demand for these products are dependent uponsustained appreciation in oil and natural gas prices, which theCompany cannot predict. However, the price of oil increased signifi-cantly during 1999 and the Company experienced improvement inorders for petroleum parts during the third quarter of 1999 andorders for well servicing pumps began to improve during the fourthquarter. The Company believes that if oil and natural gas pricesremain near current levels, and day rates and the rig count continueto increase, demand for well servicing pumps may continue toimprove in 2000 and increased drilling pump revenues may occur inthe second half of the year.
In 1999, orders for compressed air products, including $22.0million from acquisitions, increased $13.0 million to $289.5 million,compared to $276.5 million in 1998. Order backlog for theCompressed Air Products segment was $47.4 million as of December 31,1999, compared to $43.7 million as of December 31, 1998. Theincrease in both orders and backlog for this segment was due solelyto newly acquired companies.
Because air is often used as a fourth utility in the manufacturingprocess, demand for compressed air products is correlated to manu-facturing capacity utilization rates and the rate of change of industrialequipment production. These indicators demonstrated someimprovements in the fourth quarter of 1999, compared to their rela-tive weakness in 1998 and early 1999. Over longer time periods,demand also follows the economic growth patterns indicated by therates of change in the Gross Domestic Product. As the industrialeconomic environment continues to improve in the United States andEurope, orders for compressor products may continue to recover
17

MANAGEMENT’S DISCUSSION AND ANALYSIS
slowly. However, since demand for these products tends to lag thecycle of industrial demand in general, significant changes in orders forcompressor products are not anticipated until the second half of 2000.
YEAR ENDED DECEMBER 31, 1998, COMPARED
WITH YEAR ENDED DECEMBER 31, 1997
Revenues
Revenue growth in 1998 was primarily achieved through acquisi-tions and incremental shipments of petroleum products frombacklog. Revenues were $385.0 million in 1998, which was $93.5million or 32% higher than $291.5 million for 1997 and included$78.9 million from acquisitions completed since June 1997.Excluding incremental revenue from acquisitions, revenues increased$14.6 million (5%), primarily through shipments of petroleum products from the December 31, 1997 order backlog.
Revenues in the Compressed Air Products segment increased$70.2 million (31%) to $298.4 million in 1998 compared to $228.2million in 1997. Excluding incremental revenues from acquisitions,which contributed $68.7 million, Compressed Air Product revenuesincreased $1.5 million. Although revenues increased in this segmentduring the first part of 1998 as a result of the penetration of nichemarkets, such as field gas gathering, and growth in the U.S. economy,demand for compressed air products slowed during the second halfof 1998, as overall manufacturing output decreased in the UnitedStates. This reduced demand caused revenues in this segment for thelast half of 1998 to be less than revenues for the last half of 1997,excluding acquisitions.
In the Petroleum Products segment, revenues increased $23.3million (37%) to $86.6 million in 1998, compared to $63.3 millionin 1997. An acquisition contributed $10.2 million of this increase.Excluding incremental revenues from this acquisition, petroleumproducts revenues increased $13.1 million (21%), primarily as aresult of shipping drilling pumps from the order backlog that existedat the end of 1997.
Costs and Expenses
Gross margin in 1998 increased $32.2 million (32%) to $132.2million from $99.9 million in 1997, primarily as a result of the addi-tional sales volume. Incremental gross margin due to acquisitionscompleted since June 1997 accounted for $23.7 million of thisincrease. In 1998, gross margins were enhanced $4.5 million as aresult of the liquidation of LIFO inventory layers, compared to $1.2million in 1997. Gross margin was negatively affected by $1.1 millionof severance and relocation expenses related primarily to re-sizingthe Petroleum Products segment in response to decreased demandand integrating acquisitions in the fourth quarter of 1998. As apercentage of revenues, gross margin was 34.3% in both 1998 and 1997.
The acquisitions completed since June 1997 negatively affectedthe gross margin percentage as these entities currently generate lowergross margins than the Company’s previously existing operations.Excluding the impact of acquisitions, LIFO income and the fourthquarter severance and relocation expenses noted above, gross marginas a percentage of revenues improved to 34.3% in 1998 from 33.9%in 1997. This improvement in gross margin percentage was primarilythe result of increased leverage of production overhead costs, petro-leum product price increases implemented in 1997, cost reductionefforts such as manufacturing process improvements and animproved sales mix. These positive factors were partially offset byincremental expenses related to a plant relocation, which wascompleted in the fourth quarter of 1998, and the negative effects of inflation.
Depreciation and amortization increased 34% to $13.0 million in1998, compared with $9.7 million in 1997. Of the $3.3 millionincrease, $2.9 million was due to acquisitions completed in 1997 and1998. Increased levels of capital expenditures also contributed to theincrease in depreciation expense. Depreciation and amortization as apercentage of revenues was 3.4% in 1998, compared to 3.3% in 1997.
Selling and administrative expenses increased in 1998 by 35% to$53.8 million from $39.9 million for 1997. Approximately $12.6million of the $13.9 million increase was attributable to newlyacquired operations. The remaining increase was due primarily toexpenses related to a plant and division headquarters relocation,which was completed in the fourth quarter of 1998. As a percentageof revenues, selling and administrative expenses were 14.0% in 1998,compared to 13.7% in 1997. The increase in this ratio was attribut-able to acquisitions completed since June 1997, which have highercosts relative to sales than the Company’s existing operations.Excluding these acquisitions, selling and administrative expenses, as apercentage of revenues, decreased to 13.5% in 1998, from 13.7% inthe previous year.
Compressed Air Products’ operating earnings increased $6.9million (18%) to $45.5 million in 1998 compared to 1997 levels of$38.6 million. As a percentage of revenues, operating earningsdeclined to 15.2% in 1998 compared to 16.9% in 1997. This deterio-ration in Compressed Air Products’ operating earnings (as apercentage of revenues), was primarily due to newly acquired opera-tions. These acquired operations generated lower operating earnings(after amortization of goodwill associated with the acquisitions) thanthe Company’s previously existing operations. Operating earnings (asa percentage of revenues) were also negatively affected by expensesassociated with a plant and division headquarters relocation,completed in the fourth quarter of 1998, and the impact of fourthquarter expenses associated with further integrating recent acquisi-tions, partially offset by incremental LIFO income generated in 1998.
Operating earnings in the Petroleum Products segment increased$8.7 million to $21.9 million in 1998, a 66% increase from $13.2
18

million in 1997. As a percentage of revenues, operating earnings forthis segment improved significantly to 25.3% in 1998 compared to20.9% in 1997. This improvement was primarily the result of signifi-cant volume increases, as the Company was able to increase theleverage of its manufacturing operations and administrative expenses,incremental LIFO income compared to the prior year and priceincreases implemented in the second half of 1997. This improvementwas partially offset by the impact of fourth quarter expenses associatedwith re-sizing the segment in response to decreased demand.
Interest expense increased $0.9 million (23%) to $4.8 million in1998 compared to $3.9 million in 1997, due to incremental debtincurred for the acquisitions, partially offset by a lower overallaverage borrowing rate in 1998. The average interest rate for 1998was 5.8% compared to 7.3% for 1997, primarily due to lower interestrates on incremental 1998 borrowings.
Income
Income before income taxes increased $13.7 million (30%) to$59.9 million in 1998 from $46.2 million in 1997. Approximately$3.6 million of this improvement was attributable to the incrementalimpact of acquisitions completed since June 1997, net of goodwillamortization and interest expense on debt incurred to complete thesetransactions. The remaining $10.1 million increase was primarily aresult of higher revenue volume, incremental LIFO income, increasedleverage of costs and lower interest expense (excluding debt relatedto acquisitions) in 1998, compared to the previous year.
The provision for income taxes increased by $4.6 million to $23.1million in 1998 compared to 1997, as a result of the increase inincome before taxes, partially offset by a reduction in the Company’soverall effective tax rate. The Company’s effective tax rate for 1998was 38.6%, compared to 40.1% for 1997. The lower effective tax ratein 1998 was due to savings from the FSC, the lower statutory tax ratein Finland compared to the United States and the implementation ofother tax strategies.
Net income increased $9.1 million, or 33%, to $36.8 million($2.22 diluted earnings per share) in 1998 compared to $27.7million ($1.74 diluted earnings per share) in 1997. In 1998, netincome included approximately $2.2 million ($0.13 diluted earningsper share) incremental after-tax income from acquisitions and $2.1million ($0.13 diluted earnings per share) additional after-tax LIFOincome, compared to 1997. Net income for 1998 was reduced by$0.6 million ($0.04 diluted earnings per share) due to after-taxexpenses to re-size the Petroleum Products segment and integrateacquisitions. Excluding incremental income from acquisitions andLIFO, and expenses incurred to re-size the Petroleum Productssegment and integrate acquisitions, net income increased $5.4million (20%) in 1998 compared to 1997 and diluted earnings pershare increased $0.26. This increase was primarily attributable tosales volume growth of petroleum products, the related increased
leverage of manufacturing costs and administrative expenses, andprice increases for petroleum products.
LIQUIDITY AND CAPITAL RESOURCES
Operating Working Capital
During 1999, operating working capital (defined as receivablesplus inventories, less accounts payable and accrued liabilities)increased $16.4 million, with acquisitions completed in 1999 repre-senting $10.5 million of this increase. Excluding acquisitions, theremaining increase in operating working capital was related to adecrease in accounts payable and accrued liabilities, partially offsetby a reduction in receivables. The decrease in accounts payable andaccrued liabilities was due to lower capital expenditures and reducedpurchases as production volume declined. The decrease in revenuesresulted in the receivables reduction.
Cash Flows
During 1999, the Company generated cash flows from operationstotaling $26.6 million, a decrease of $25.9 million (49%) comparedto 1998. This reduction was primarily the result of the decrease innet income and increase in operating working capital discussedabove (net of the impact of acquired working capital). During 1999,the Company had net borrowings of $37.5 million under its creditfacilities. These funds, along with cash generated from operations,were used to complete acquisitions valued at $41.0 million, repurchaseshares of the Company’s common stock and fund capital projects.The cash flows provided by operating and financing activities andused for investing activities resulted in a net cash increase of $2.8million for 1999.
Capital Expenditures and Commitments
Capital projects to increase operating efficiency, productioncapacity and product quality resulted in expenditures of $11.9 millionin 1999 compared to $19.7 million in 1998. This decline wasprimarily due to completion of a new manufacturing facility in Georgiain 1998. Commitments for capital expenditures at December 31, 1999totaled $3.4 million. Capital expenditures related to environmentalprojects have not been significant in the past and are not expected tobe significant in the foreseeable future.
In October 1998, Gardner Denver’s Board of Directors authorizedthe repurchase of up to 1,600,000 shares of the Company’s commonstock to be used for general corporate purposes. Approximately200,000 shares remain available for repurchase under this program.The Company has also established a Stock Repurchase Program forits executive officers to provide a means for them to sell GardnerDenver common stock and obtain sufficient funds to meet alternativeminimum tax obligations which arise from the exercise of incentivestock options. During 1999, 780,442 shares were repurchased
19

MANAGEMENT’S DISCUSSION AND ANALYSIS
under these repurchase programs at a cost of $10.9 million. As ofDecember 31, 1999, a total of 1,535,542 shares have been repur-chased at a cost of $22.1 million under both repurchase programs.In 1999, the Company also acquired 20,859 shares of its commonstock, valued at $0.4 million, which were tendered for the exercise ofstock options.
Liquidity
During 1998, the Company entered into a new revolving line ofcredit agreement with an aggregate $125 million borrowing capacity(the “Credit Line”) and terminated the previous line of credit. OnDecember 31, 1999, the Credit Line had an outstanding balance of$74.3 million, leaving $50.7 million available for future use or toissue as letters of credit. The Credit Line requires no principalpayments during the term of the agreement, which expires in January 2003.
The Company’s borrowing arrangements are generally unsecuredand permit certain investments and dividend payments. There are nomaterial restrictions on the Company as a result of its credit arrange-ments, other than customary covenants regarding certain earnings,liquidity, and capital ratios.
Management currently expects that the Company’s future cashflows will be sufficient to fund its scheduled debt service and providerequired resources for working capital and capital investments.
Market Risk
The Company is exposed to market risk related to changes ininterest rates and European and other foreign currency exchangerates, and selectively uses derivative financial instruments, includingforwards and swaps, to manage these risks. The Company does nothold derivatives for trading purposes. The value of market-risk sensi-tive derivatives and other financial instruments is subject to change asa result of movements in market rates and prices. Sensitivity analysisis one technique used to evaluate these impacts. Based on a hypo-thetical ten percent change in interest rates or ten percent weakeningin the U.S. Dollar across relevant foreign currencies, principally theEuro, the potential losses in future earnings, fair value and cash flowsare not material to the Company.
Impact of Year 2000 Issues
Many older computer systems, and other systems with embeddedchip technology, processed dates based on two digits for the year of atransaction rather than a full four digits. These systems may havebeen unable to properly process dates in the year 2000 and beyond.The Company utilizes a number of computer systems across its world-wide operations. Based on activity to date, the Company believes thatall of its key computer systems are year 2000 compliant. TheCompany has resolved its year 2000 coding issues through eitherreplacement of old systems with new year 2000 compatible systemsor reprogramming of existing systems. Costs incurred solely to
address its year 2000 issues were less than $0.5 million. To date, theCompany is not aware of any significant year 2000 problems involvingits major customers and suppliers.
New Accounting Standard
In June 1998, the FASB issued Statement of Financial AccountingStandards No. 133, “Accounting for Derivative Instruments andHedging Activities” (“SFAS 133” or the “Statement”). The Statementestablishes accounting and reporting standards requiring that everyderivative instrument be recorded in the balance sheet as either anasset or liability, measured at its fair value. The Statement requiresthat changes in the derivative’s fair value be recognized currently inearnings unless specific hedge accounting criteria are met. Specialaccounting for qualifying hedges allows a derivative’s gains and lossesto offset related results on the hedged item in the income statement,and requires that a company must formally document, designate andassess the effectiveness of transactions that receive hedge accounting.
SFAS 133 is effective for fiscal years beginning after June 15, 2000and thus, the Company will adopt SFAS 133 on January 1, 2001. TheCompany has reviewed its current derivative instruments and hedgingactivities and has determined that the adoption of SFAS 133 would nothave had a material impact on its consolidated financial statements asof December 31, 1999.
Cautionary Statements Regarding Forward-
Looking Statements
This Annual Report to Stockholders, including Management’sDiscussion and Analysis and the Chairman’s Letter, contains forward-looking statements within the meaning of the federal securities laws.As a general matter, forward-looking statements are those focusedupon anticipated events or trends and expectations and beliefsrelating to matters that are not historical in nature. Such forward-looking statements are subject to uncertainties and factors relating tothe Company’s operations and business environment, all of which aredifficult to predict and many of which are beyond the control of theCompany. Such uncertainties and factors could cause actual resultsof the Company to differ materially from those matters expressed inor implied by such forward-looking statements. Such uncertaintiesand factors could include among others: the speed with which theCompany is able to integrate its recent acquisitions and realize therelated financial benefits; the level of oil and natural gas prices,drilling and production, which affect demand for the Company’spetroleum products; pricing of Gardner Denver’s products; changesin the general level of industrial production and industrial capacityutilization rates in the United States and the rate of economic growthoutside the United States, which affect demand for the Company’scompressed air products; the degree to which the Company is able topenetrate niche markets; and the successful implementation of costreduction efforts.
20

REPORT OF MANAGEMENT AND INDEPENDENT PUBLIC ACCOUNTANTS
Report of Management
The Company’s management is responsible for the integrityand accuracy of the financial statements. Management believesthat the financial statements have been prepared in conformitywith generally accepted accounting principles appropriate in thecircumstances. In preparing the financial statements, managementmakes informed judgments and estimates, where necessary, toreflect the expected effects of events and transactions that havenot been completed.
In meeting its responsibility for the reliability of the financialstatements, management relies on a system of internalaccounting controls. This system is designed to provide reason-able assurance that assets are safeguarded and transactions areexecuted in accordance with management’s authorization andrecorded properly to permit the preparation of financial statements in accordance with generally accepted accountingprinciples. The design of this system recognizes that errors orirregularities may occur and that estimates and judgments arerequired to assess the relative cost and expected benefits of thecontrols. Management believes that the Company’s accounting
controls provide reasonable assurance that errors or irregularitiesthat could be material to the financial statements are preventedor would be detected within a timely period.
The Audit and Finance Committee of the Board of Directors (the “Committee”), which is comprised solely of Directors whoare not employees of the Company, is responsible for monitoringthe Company’s accounting and reporting practices. TheCommittee meets with management periodically to review itsactivities and ensure that it is properly discharging its responsi-bilities. The Committee also meets periodically with theindependent auditors, who have free access to the Committeeand the Board of Directors, to discuss internal accountingcontrol and auditing, financial reporting and tax matters.
The independent auditors are engaged to express an opinionon the Company’s consolidated financial statements. Theiropinion is based on procedures which they believe to be sufficient to provide reasonable assurance that the financialstatements contain no material errors.
21
Report of Independent Public Accountants
To Gardner Denver, Inc.We have audited the accompanying consolidated balance
sheet of Gardner Denver, Inc. (a Delaware corporation) andsubsidiaries as of December 31, 1999 and 1998, and the relatedconsolidated statements of operations, stockholders’ equity andcash flows for each of the three years in the period endedDecember 31, 1999. These consolidated financial statements arethe responsibility of the Company’s management. Our responsi-bility is to express an opinion on these consolidated financialstatements based on our audits.
We conducted our audits in accordance with auditing stan-dards generally accepted in the United States. Those standardsrequire that we plan and perform the audit to obtain reasonableassurance about whether the financial statements are free ofmaterial misstatement. An audit includes examining, on a testbasis, evidence supporting the amounts and disclosures in thefinancial statements. An audit also includes assessing theaccounting principles used and significant estimates made by
management, as well as evaluating the overall financial statementpresentation. We believe that our audits provide a reasonablebasis for our opinion.
In our opinion, the financial statements referred to abovepresent fairly, in all material respects, the financial position ofGardner Denver, Inc. and subsidiaries as of December 31, 1999and 1998, and the results of their operations and their cashflows for each of the three years in the period ended December 31,1999, in conformity with accounting principles generally acceptedin the United States.
St. Louis, MissouriFebruary 7, 2000
Ross J. CentanniChairman, President and Chief Executive Officer
Philip R. RothVice President, Finance and Chief Financial Officer
22
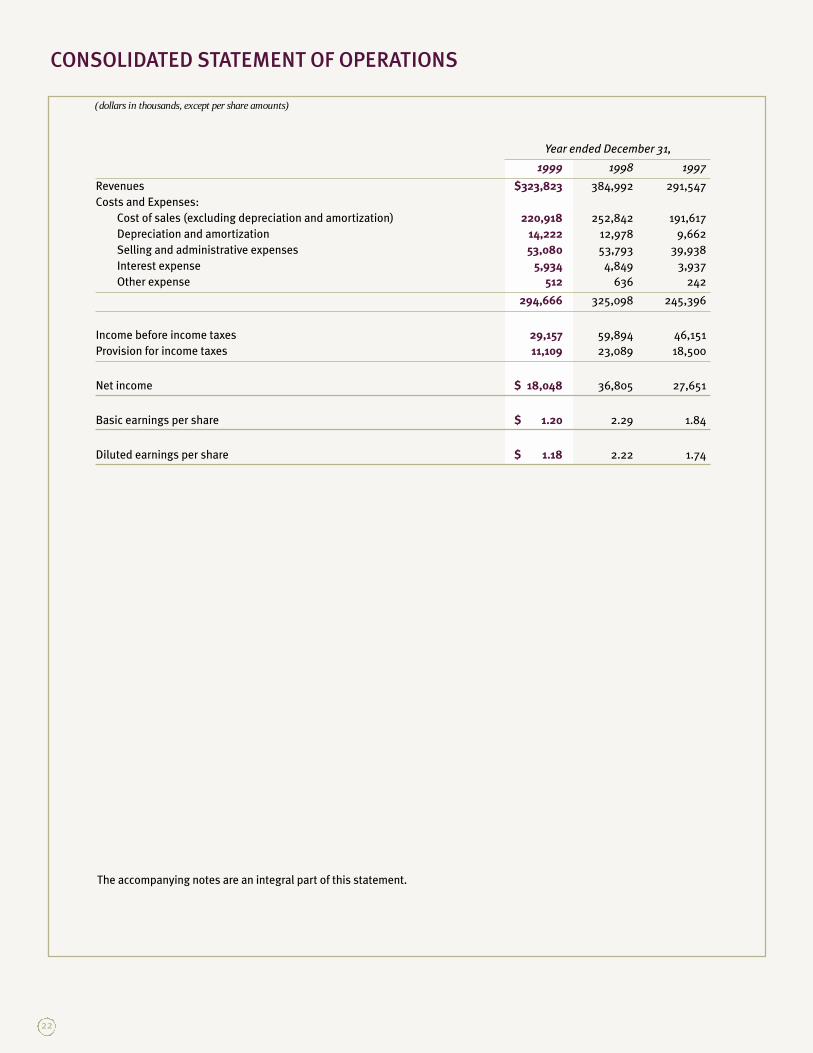
CONSOLIDATED STATEMENT OF OPERATIONS
(dollars in thousands, except per share amounts)
The accompanying notes are an integral part of this statement.
Year ended December 31,
1999 1998 1997
Revenues $323,823 384,992 291,547
Costs and Expenses:
Cost of sales (excluding depreciation and amortization) 220,918 252,842 191,617
Depreciation and amortization 14,222 12,978 9,662
Selling and administrative expenses 53,080 53,793 39,938
Interest expense 5,934 4,849 3,937
Other expense 512 636 242
294,666 325,098 245,396
Income before income taxes 29,157 59,894 46,151
Provision for income taxes 11,109 23,089 18,500
Net income $ 18,048 36,805 27,651
Basic earnings per share $ 1.20 2.29 1.84
Diluted earnings per share $ 1.18 2.22 1.74

CONSOLIDATED BALANCE SHEET
The accompanying notes are an integral part of this statement.
(dollars in thousands, except per share amounts)
December 31,
1999) 1998)
Assets
Current assets:
Cash and equivalents $ 27,317) 24,474)
Receivables (net of allowances of $4,838 in 1999 and $4,371 in 1998) 72,272) 69,617)
Inventories, net 60,356) 53,115)
Deferred income taxes 3,664) 2,445)
Other 2,770) 2,154)
Total current assets 166,379) 151,805)
Property, plant and equipment, net 62,892) 59,261)
Intangibles, net 138,584) 114,254)
Deferred income taxes 6,151) 12,172)
Other assets 5,413) 4,638)
Total assets $379,419) 342,130)
Liabilities and Stockholders’ Equity
Current liabilities:
Short-term borrowings and current maturities of long-term debt $ 5,289) 2,452)
Accounts payable and accrued liabilities 54,320) 60,806)
Total current liabilities 59,609) 63,258)
Long-term debt, less current maturities 114,200) 81,058)
Postretirement benefits other than pensions 43,377) 46,612)
Other long-term liabilities 9,624) 8,516)
Total liabilities 226,810) 199,444)
Stockholders’ equity:
Common stock, $.01 par value; 50,000,000 shares authorized; 15,079,247 and
15,496,849 shares issued and outstanding in 1999 and 1998, respectively 167) 163)
Capital in excess of par value 157,367) 153,656)
Treasury stock at cost, 1,604,587 and 803,286 shares in 1999 and 1998, respectively (23,541) (12,259)
Retained earnings 21,354) 3,306)
Accumulated other comprehensive loss (2,738) (2,180)
Total stockholders’ equity 152,609) 142,686)
Total liabilities and stockholders’ equity $379,419) 342,130)
23
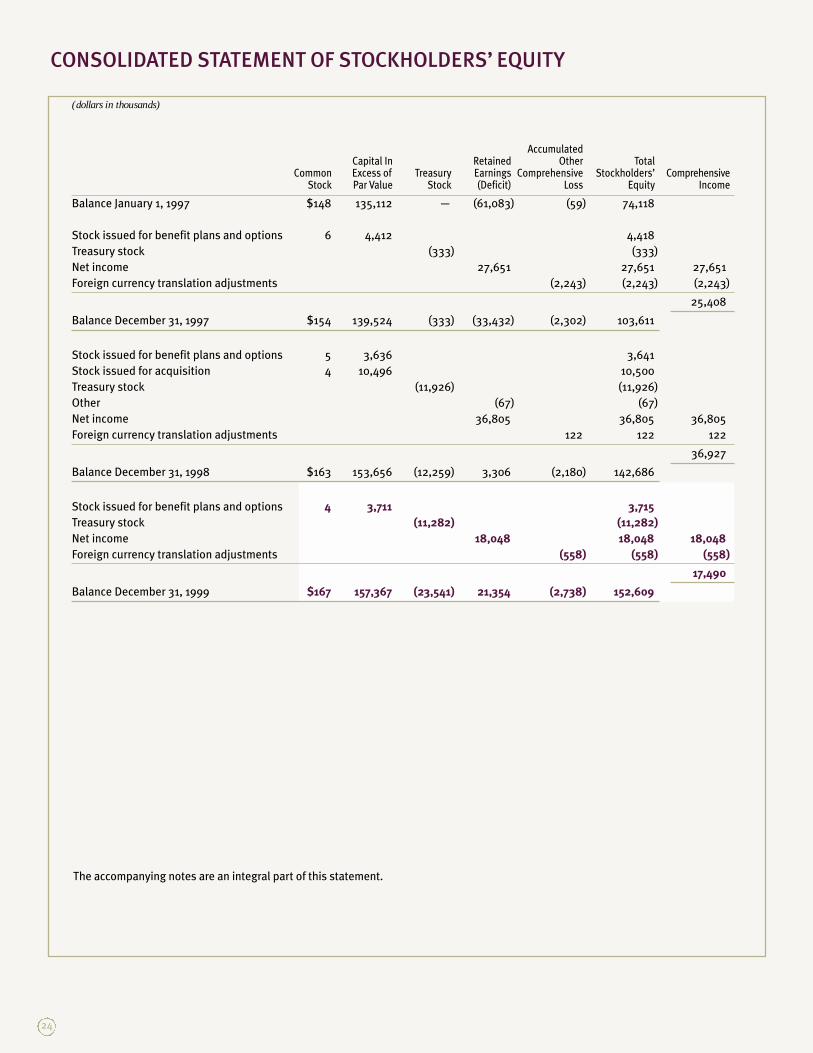
CONSOLIDATED STATEMENT OF STOCKHOLDERS’ EQUITY
(dollars in thousands)
The accompanying notes are an integral part of this statement.
Accumulated)Capital In) Retained) Other) Total)
Common) Excess of ) Treasury) Earnings) Comprehensive) Stockholders’) ComprehensiveStock) Par Value) Stock) (Deficit)) Loss) Equity) Income
Balance January 1, 1997 $148) 135,112) —) (61,083) (59) 74,118)
Stock issued for benefit plans and options 6) 4,412) 4,418)
Treasury stock ) (333) (333)
Net income ) 27,651) 27,651) 27,651)
Foreign currency translation adjustments (2,243) (2,243) (2,243)
25,408)
Balance December 31, 1997 $154) 139,524) (333) (33,432) (2,302) 103,611)
Stock issued for benefit plans and options 5) 3,636) 3,641)
Stock issued for acquisition 4) 10,496) 10,500)
Treasury stock (11,926) (11,926)
Other (67) (67)
Net income 36,805) 36,805) 36,805)
Foreign currency translation adjustments ) 122) 122) 122)
36,927)
Balance December 31, 1998 $163) 153,656) (12,259) 3,306) (2,180) 142,686)
Stock issued for benefit plans and options 4) 3,711) 3,715)
Treasury stock (11,282) (11,282)
Net income ) 18,048) 18,048) 18,048)
Foreign currency translation adjustments (558) (558) (558)
17,490)
Balance December 31, 1999 $167) 157,367) (23,541) 21,354) (2,738) 152,609)
24
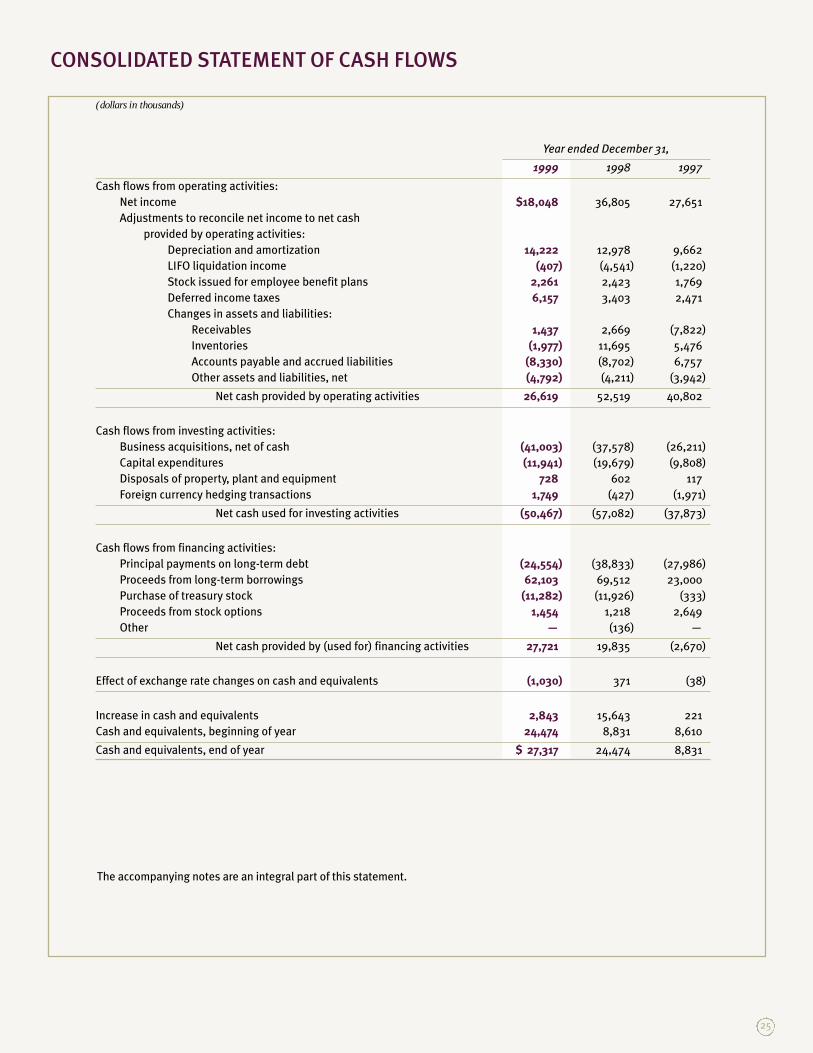
CONSOLIDATED STATEMENT OF CASH FLOWS
(dollars in thousands)
Year ended December 31,
1999) 1998) 1997)
Cash flows from operating activities:
Net income $18,048) 36,805) 27,651)
Adjustments to reconcile net income to net cash
provided by operating activities:
Depreciation and amortization 14,222) 12,978) 9,662)
LIFO liquidation income (407) (4,541) (1,220)
Stock issued for employee benefit plans 2,261) 2,423) 1,769)
Deferred income taxes 6,157) 3,403) 2,471)
Changes in assets and liabilities:
Receivables 1,437) 2,669) (7,822)
Inventories (1,977) 11,695) 5,476)
Accounts payable and accrued liabilities (8,330) (8,702) 6,757)
Other assets and liabilities, net (4,792) (4,211) (3,942)
Net cash provided by operating activities 26,619) 52,519) 40,802)
Cash flows from investing activities:
Business acquisitions, net of cash (41,003) (37,578) (26,211)
Capital expenditures (11,941) (19,679) (9,808)
Disposals of property, plant and equipment 728) 602) 117)
Foreign currency hedging transactions 1,749) (427) (1,971)
Net cash used for investing activities (50,467) (57,082) (37,873)
Cash flows from financing activities:
Principal payments on long-term debt (24,554) (38,833) (27,986)
Proceeds from long-term borrowings 62,103) 69,512) 23,000)
Purchase of treasury stock (11,282) (11,926) (333)
Proceeds from stock options 1,454) 1,218) 2,649)
Other —) (136) —)
Net cash provided by (used for) financing activities 27,721) 19,835) (2,670)
Effect of exchange rate changes on cash and equivalents (1,030) 371) (38)
Increase in cash and equivalents 2,843) 15,643) 221)
Cash and equivalents, beginning of year 24,474) 8,831) 8,610)
Cash and equivalents, end of year $ 27,317) 24,474) 8,831)
The accompanying notes are an integral part of this statement.
25
26
NOTES TO CONSOLIDATED FINANCIAL STATEMENTS
Note 1: Summary of Significant Accounting Policies
Basis of Presentation
The accompanying consolidated financial statements reflect theoperations of Gardner Denver, Inc. (“Gardner Denver” or the“Company”) and its subsidiaries. Certain prior year amounts havebeen reclassified to conform with current year presentation.
All shares of common stock and per share amounts have beenadjusted to give retroactive effect to a three-for-two stock split distrib-uted on December 29, 1997 to stockholders of record at the close ofbusiness on December 8, 1997 and a two-for-one stock split distrib-uted on January 15, 1997 to stockholders of record at the close ofbusiness on December 27, 1996. Both stock splits were effected inthe form of a stock dividend.
Principles of Consolidation
The accompanying consolidated financial statements include theaccounts of the Company and its wholly-owned subsidiaries. Allsignificant intercompany transactions and accounts have been elimi-nated. Investments in entities in which the Company has 20% to 50%ownership are accounted for by the equity method.
Use of Estimates
The preparation of financial statements in conformity with gener-ally accepted accounting principles requires management to makeestimates and assumptions that affect the reported amounts of assetsand liabilities, the disclosure of contingent assets and liabilities at thedate of the financial statements and the reported amounts of revenuesand expenses during the reporting period. Actual results could differfrom these estimates.
Foreign Currency Translation
Assets and liabilities of the Company’s foreign operations aretranslated at the exchange rate in effect at the balance sheet date,while revenues and expenses are translated at average rates prevailingduring the year. Translation adjustments are reported in accumulatedother comprehensive loss, a separate component of stockholders’ equity.
Revenue Recognition
The Company recognizes revenues when goods are shipped to the customer.
Cash Equivalents
Cash equivalents are highly liquid investments (valued at cost,which approximates fair value), acquired with an original maturity ofthree months or less.
Inventories
Inventories are carried at the lower of cost or market value. Themajority of the Company’s inventory is accounted for on a last-in,first-out (LIFO) basis. The remaining inventory is accounted for on afirst-in, first-out (FIFO) basis.
Property, Plant and Equipment
Property, plant and equipment are carried at cost. Depreciation isprovided using the straight-line method over the estimated useful livesof the assets: buildings - 10 to 45 years; machinery and equipment -10 to 12 years; office furniture and equipment - 3 to 10 years; andtooling, dies, patterns, etc. - 3 to 7 years.
Intangibles
Intangibles consist primarily of goodwill related to the variousacquisitions completed by the Company. Goodwill is amortized on astraight-line basis over the period estimated to be benefited, notexceeding 40 years. The Company assesses the recoverability of anintangible asset by determining whether the amortization of the assetbalance over its remaining life can be recovered through related estimated undiscounted future cash flows.
Income Taxes
The Company has determined tax expense and other deferred taxinformation based on the liability method. Deferred income taxes are provided to reflect temporary differences between financial and tax reporting.
Research and Development
Costs for research and development are expensed as incurred andwere $2,754, $3,479 and $2,845 for the years ended December 31,1999, 1998 and 1997, respectively.
Financial Instruments
Included on the balance sheet is a foreign currency forwardcontract in Finnish Markka to hedge foreign exchange translation riskassociated with the Company’s investment in its Finnish subsidiary,Gardner Denver Oy. The contract is marked to market and both unre-alized and realized gains and losses are included as a component ofaccumulated other comprehensive loss in stockholders’ equity. Therewere no off-balance sheet derivative financial instruments as ofDecember 31, 1999 and 1998.
(dollars in thousands, except per share amounts)

Note 2: Acquisitions
During 1999, the Company completed three acquisitions. OnOctober 25, 1999, the Company purchased 100% of the issued andoutstanding stock of Air Relief, Inc. (“Air Relief”), located inMayfield, Kentucky. On April 5, 1999, the Company purchased 100%of the issued and outstanding stock of Butterworth Jetting Systems,Inc. (“Butterworth”), located in Houston, Texas. On April 1, 1999,the Company purchased 100% of the issued and outstanding stock ofAllen-Stuart Equipment Co., Inc. (“Allen-Stuart”), also located inHouston, Texas. The aggregate purchase price for these three acqui-sitions was approximately $41.0 million and was allocated to assetsand liabilities based on their respective fair values at the dates ofacquisition. This allocation resulted in aggregate costs in excess ofnet assets acquired of $29.5 million.
On March 9, 1998, the Company purchased substantially all of theassets and assumed certain agreed upon liabilities of the WittigDivision of Mannesmann Demag AG (“Wittig”). Wittig is located inSchopfheim, Germany. On January 29, 1998, the Company purchasedsubstantially all of the assets and assumed certain agreed upon liabili-ties of Champion Pneumatic Machinery Company, Inc. (“Champion”),located in Princeton, Illinois. On January 5, 1998, the Companyacquired substantially all of the assets and assumed certain agreedupon liabilities of Geological Equipment Corporation (“Geoquip”)located in Fort Worth, Texas. The aggregate purchase price for thesethree acquisitions was approximately $48.0 million. The purchaseprice for these acquisitions was paid in cash ($37.6 million) and
430,695 shares of Gardner Denver common stock. The aggregatepurchase price was allocated to assets and liabilities based on theirrespective fair values at the dates of acquisition and resulted in aggre-gate costs in excess of net assets acquired of $29.2 million.
On June 30, 1997, the Company purchased 100% of the issuedand outstanding stock of Oy Tamrotor Ab (“Tamrotor”), located inTampere, Finland, for approximately $26.2 million. The purchaseprice was allocated to assets and liabilities based on their respectivefair values at the date of acquisition, and resulted in cost in excess ofnet assets acquired of $15.4 million. Tamrotor was liquidated in1999 and the Company now conducts business in Finland as GardnerDenver Oy.
All acquisitions have been accounted for by the purchase method,and accordingly, their results are included in the Company’s consoli-dated financial statements from the respective dates of acquisition.Under the purchase method, the purchase price is allocated based onthe fair value of assets received and liabilities assumed as of theacquisition date. The purchase price allocations for Allen-Stuart,Butterworth and Air-Relief, used in preparation of the December 31,1999 consolidated balance sheet, are preliminary and subject toadjustment in 2000, when finalized.
As a result of the stability of the product technology, markets andcustomers associated with these acquisitions, the cost in excess of netassets acquired for each acquisition is being amortized over 40 years,using the straight-line method.
27
Note 3: Inventories
December 31,
1999) 1998)
Raw materials, including parts and subassemblies $ 37,597) 42,006)
Work-in-process 9,395) 8,167)
Finished goods 25,543) 17,159)
Perishable tooling and supplies 2,506) 2,525)
75,041) 69,857)
Excess of current standard costs over LIFO costs (6,455) (7,037)
Allowance for obsolete and slow-moving inventory (8,230) (9,705)
Inventories, net $60,356) 53,115)
During 1999, 1998 and 1997, reductions in inventory quantities(net of acquisitions) resulted in liquidations of LIFO inventory layerscarried at lower costs prevailing in prior years. The effect was toincrease net income in 1999, 1998 and 1997 by $252, $2,788 and$732, respectively. It is the Company’s policy to record the earnings
effect of LIFO inventory liquidations in the quarter in which adecrease for the entire year becomes certain. In each of the years1997 through 1999, the LIFO liquidation income was recorded in thefourth quarter.

28
NOTES TO CONSOLIDATED FINANCIAL STATEMENTS
Note 6: Pension and Other Postretirement Benefits
The Company sponsors retirement plans covering substantially allemployees. Benefits are provided to employees under defined benefitpay-related and service-related plans which are noncontributory.Annual contributions to retirement plans equal or exceed theminimum funding requirements of the Employee Retirement IncomeSecurity Act. The Company also sponsors defined contribution plans.Benefits are determined and funded annually based on terms of theplans or as stipulated in a collective bargaining agreement.
In addition, salaried employees who retired prior to 1989, as wellas certain other employees who were near retirement and elected toreceive certain benefits, have retiree medical, prescription and life
insurance benefits. All other active salaried employees will not havepostretirement medical benefits. The hourly employees have separateplans with varying benefit formulas. In all cases, however, currentlyactive hourly employees, except for certain employees who are nearretirement, will not receive healthcare benefits after retirement. All of the Company’s postretirement medical plans are unfunded.
The following tables provide a reconciliation of the changes inboth the pension and other postretirement plans benefit obligationsand fair value of assets over the two-year period ending December 31,1999, and a statement of the funded status as of December 31, 1999and 1998:
Note 4: Property, Plant and Equipment and Intangibles
December 31,
1999) 1998)
Property, plant and equipment:
Land and land improvements $ 4,695) 4,453)
Buildings 36,069) 35,187)
Machinery and equipment 81,812) 78,950)
Tooling, dies, patterns, etc. 30,671) 28,241)
Office furniture and equipment 10,479) 10,144)
Other 3,484) 1,507)
Construction in progress 8,258) 6,823)
175,468) 165,305)
Accumulated depreciation (112,576) (106,044)
Property, plant and equipment, net $ 62,892) 59,261)
Intangibles:
Goodwill $159,494) 132,541)
Other 5,145) 3,855)
164,639) 136,396)
Accumulated amortization (26,055) (22,142)
Intangibles, net $138,584) 114,254)
Note 5: Accounts Payable and Accrued Liabilities
December 31,
1999) 1998)
Accounts payable - trade $ 28,405) 26,762)
Salaries, wages and related fringe benefits 3,840) 7,978)
Product liability, workers’ compensation and other insurance 4,058) 3,752)
Other 18,017) 22,314)
Total accounts payable and accrued liabilities $ 54,320) 60,806)
(dollars in thousands, except per share amounts)

29
Other
Postretirement
Pension Benefits Benefits
1999) 1998) 1999) 1998)
Reconciliation of benefit obligation
Obligation at January 1 $ 54,106) 48,781) $ 27,481) 27,939)
Service cost 1,721) 1,243) 24) 28)
Interest cost 3,453) 3,569) 1,877) 1,860)
Actuarial (gain) loss (4,627) 3,782) (1,866) (58)
Acquisition —) 2,328) —) —)
Benefit payments (5,850) (5,826) (2,255) (2,288)
New participants 396) —) —) —)
Effect of exchange rate changes (339) 229) —) —)
Obligation at December 31 $48,860) 54,106) $ 25,261) 27,481)
Reconciliation of fair value of plan assets
Fair value of plan assets at January 1 $ 55,083) 55,178)
Actual return on plan assets 6,273) 5,134)
Employer contributions 576) 597)
Benefit payments (5,850) (5,826)
Fair value of plan assets at December 31 $ 56,082) 55,083) $ —) —)
Funded status
Funded status at December 31 $ 7,222) 977) $(25,261) (27,481)
Unrecognized transition liability (asset) 43) (163) —) —)
Unrecognized prior-service cost (880) (966) (4,040) (5,240)
Unrecognized gain (11,422) (4,903) (16,444) (16,259)
Accrued benefit liability $ (5,037) (5,055) $(45,745) (48,980)
The aggregate accumulated benefit obligation and fair value of plan assets for pension plans with accumulated benefit obligations in excess ofplan assets at December 31, 1999 and 1998 are as follows:
December 31,
1999) 1998)
Accumulated benefit obligation $ 7,890) 8,487)
Fair value of plan assets $ 3,914) 3,791)

30
NOTES TO CONSOLIDATED FINANCIAL STATEMENTS
Pension Benefits Other Postretirement Benefits
1999) 1998) 1997) 1999) 1998) 1997)
Service cost $ 1,721) 1,243) 904) $ 24) 28) 30)
Interest cost 3,453) 3,569) 3,500) 1,877) 1,860) 2,005)
Expected return on plan assets (4,424) (4,443) (4,148) —) —) —)
Amortization of transition asset (206) (209) (209) —) —) —)
Amortization of prior-service cost 167) (86) 10) (1,200) (1,200) (1,200)
Amortization of net gain 4) (64) (16) (1,673) (2,431) (2,504)
Net periodic benefit expense (income) 715) 10) 41) $ (972) (1,743) (1,669)
Defined contribution plans 3,471) 3,576) 2,723)
Total retirement plan expense $ 4,186) 3,586) 2,764)
COMPUTATIONAL ASSUMPTIONS
Pension and Other Postretirement Benefits
Net Periodic Expense Benefit Obligation
Year ended December 31, December 31,
1999 1998 1997 1999 1998
Discount rate 6.75% 7.25% 7.50% 8.25% 6.75%
Pension Benefits
Rate of increase in compensation levels 5.00% 5.50% 5.50% 5.00% 5.00%
Expected long-term rate of return on assets 8.50% 8.50% 8.50% — —
For measurement purposes, the annual rate of increase in the percapita cost of covered healthcare benefits assumed for 1999 was7.0% for participants under age 65 and 6.0% for participants overage 65. The rates were assumed to decrease gradually each year to arate of 5.5% for 2004 and remain at that level thereafter.
Assumed healthcare cost trend rates have a significant effect onthe amounts reported for the postretirement medical plans. A onepercentage point change in assumed healthcare cost trend rateswould have the following effects:
One Percentage Point
Increase Decrease
Effect on total of service and interest cost components of
net periodic other postretirement benefit cost - increase (decrease) 8.2% (7.2%)
Effect on the postretirement benefit obligation - increase (decrease) 8.0% (7.0%)
The full-time salaried and hourly employees of the Company’sWittig operation in Germany, acquired in March 1998, have pensionbenefits provided under defined benefit pay-related and service-related plans which are noncontributory. Consistent with the practicein Germany, these plans are unfunded. As a result of the acquisitionof Wittig and the unfunded nature of the plans, the full amount of theprojected pension benefit obligation as of the acquisition date wasrecorded as an accrued benefit liability on the Consolidated BalanceSheet. The change in the pension benefit obligation and the net peri-odic pension benefit expense from the acquisition date forward havebeen included in the preceding pension benefit tables.
The full-time salaried and hourly employees of the Company’soperations in Finland have pension benefits which are guaranteed by
the Finnish government. Although the plans are similar to definedbenefit plans, the guarantee feature of the government causes thesubstance of the plans to be defined contribution. Therefore, thediscounted future liability of these plans is not included in the liability for defined benefit plans, but the expense for the Company’scontribution is included in the pension benefit cost for defined contribution plans.
Certain of the Company’s full-time salaried and nonunion hourlyemployees are eligible to participate in the Company’s RetirementSavings Plan (the “Savings Plan”), which is a qualified plan under therequirements of Section 401(k) of the Internal Revenue Code. TheCompany’s matching contributions to the Savings Plan are in the formof the Company’s common stock.
The following table provides the components of net periodic benefit expense (income) for the plans for the years ended December 31, 1999, 1998 and 1997.
(dollars in thousands, except per share amounts)

Note 7: Stock-Based Compensation Plans
Under the Company’s Long-Term Incentive Plan (the “IncentivePlan”), designated employees are eligible to receive awards in theform of stock options, stock appreciation rights, restricted stockgrants or performance shares, as determined by the ManagementDevelopment and Compensation Committee of the Board of Directors.An aggregate of 2,750,000 shares of common stock has been reservedfor issuance under the Incentive Plan. Through December 31, 1999,the Company has granted options on 2,379,009 shares. Under theIncentive Plan, the option exercise price equals the fair market valueof the common stock on the date of grant. One-third of employeeoptions granted become vested and exercisable on each of the firstthree anniversaries of the date of grant. The options granted toemployees in 1997 expire five years after the date of grant. Theoptions granted to employees in 1998 and 1999 expire ten years after the date of the grant.
Under the Incentive Plan, each nonemployee director is automati-cally granted an option to purchase 3,000 shares of common stockon the day after each annual meeting of stockholders. These optionsare granted at the fair market value of the common stock on the dateof grant, become exercisable on the first anniversary of the date ofgrant (or upon retirement, death or cessation of service due todisability, if earlier) and expire five years after the date of grant.
The Company also has an employee stock purchase plan (the“Stock Purchase Plan”), a qualified plan under the requirements ofSection 423 of the Internal Revenue Code, and has reserved 675,000shares for issuance. In 1997, all eligible employees who enrolled inthe offering received options to purchase shares of common stock at
the lesser of 90% of the fair market price of the stock on the offeringdate or 100% of the fair market price on the exercise date. The 1997offering under the Stock Purchase Plan required participatingemployees to have the purchase price of the options withheld fromtheir pay over a two-year period. The exercise date for the 1997 offeringwas November 8, 1999, at which time employees elected to purchase30,328 shares at $13.56 per share, the fair market price on this date.
In November 1999, the Stock Purchase Plan was amended topermit eligible employees to purchase shares at the lesser of 90% ofthe fair market price of the common stock on either the offering dateor the exercise date. At that time, the Stock Purchase Plan was alsoamended to require participants to have the purchase price of theiroptions withheld from their pay over a one-year period. The exercisedate for the most recent offering is January 2, 2001. As of December 31,1999, employees had enrolled to purchase 148,582 shares at anoffering price of $10.74 per share and 218,905 shares remainedavailable under the Stock Purchase Plan for future offerings.
The Company accounts for both the Incentive Plan and the StockPurchase Plan using the intrinsic value methodology prescribed byAPB Opinion No. 25, “Accounting for Stock Issued to Employees.”Statement of Financial Accounting Standards No. 123, “Accounting forStock-Based Compensation” (“SFAS 123” or the “Statement”), requirespro forma disclosure of the impact on earnings as if the compensationcosts for these plans had been determined consistent with the fair valuemethodology of this Statement. The Company’s net income and earn-ings per share would have been reduced to the following pro formaamounts under SFAS 123:
31
1999 1998 1997
Net income As reported $18,048 36,805 27,651
Pro forma 17,043 35,655 26,817
Basic earnings per share As reported $ 1.20 2.29 1.84
Pro forma 1.13 2.22 1.78
Diluted earnings per share As reported $ 1.18 2.22 1.74
Pro forma 1.11 2.15 1.69
A summary of the status of the Company’s Incentive Plan atDecember 31, 1999, 1998 and 1997, and changes during the years
then ended, is presented in the table and narrative below (underlyingshares in thousands):
1999 1998 1997
Wtd. Avg. Wtd. Avg. Wtd. Avg.
Exercise Exercise Exercise
Shares Price Shares Price Shares Price
Options outstanding, beginning of year 1,077) $ 12.36 1,174) $ 6.91 1,371) $ 4.88
Granted 223) 13.00 257) 26.01 159) 18.28
Exercised (219) 4.76 (334) 3.64 (293) 3.96
Forfeited (9) 19.36 (20) 13.57 (63) 5.27
Options outstanding, end of year 1,072) 13.99 1,077) 12.36 1,174) 6.91
Options exercisable, end of year 647) 11.11 623) 6.49 627) 4.17

32
NOTES TO CONSOLIDATED FINANCIAL STATEMENTS
The following table summarizes information about fixed-price stock options outstanding at December 31, 1999 (underlying shares in thousands):
Options Outstanding Options Exercisable
Number Wtd. Avg. Wtd. Avg. Number Wtd. Avg.
Range of Outstanding Remaining Exercise Exercisable Exercise
Exercise Prices at 12/31/99 Contractual Life Price at 12/31/99 Price
$ 3.00– 5.00 204 0.2 years $ 3.58 204 $ 3.58
5.01 – 10.00 248 6.1 8.68 248 8.68
10.01 – 20.00 354 6.7 14.33 85 16.62
20.01 – 30.00 266 7.2 26.42 110 26.17
The fair value of each option granted under the Incentive Plan andthe Stock Purchase Plan is estimated on the date of grant using theBlack-Scholes option pricing model. The following weighted averageassumptions were used for grants in 1999, 1998 and 1997, respec-tively: risk-free interest rates of 5.4%, 5.4% and 6.3%; expectedvolatility of 38%, 36% and 35%; and expected lives of 2.9, 4.8 and 3.3years. The valuations assume no dividends are paid. The weightedaverage fair values of options granted in 1999, 1998 and 1997 were$4.07, $10.31 and $7.01, respectively.
Note 8: Stockholders’ Equity and Earnings Per Share
At December 31, 1999 and 1998, 50,000,000 shares of $.01 parvalue common stock and 10,000,000 shares of $.01 par valuepreferred stock were authorized. Shares of common stock issuedand outstanding at December 31, 1999 and 1998, were 15,079,247and 15,496,849, respectively. No shares of preferred stock wereissued or outstanding at December 31, 1999 or 1998. The shares ofpreferred stock, which may be issued without further stockholderapproval (except as may be required by applicable law or stockexchange rules), may be issued in one or more series, with thenumber of shares of each series and the rights, preferences and limi-tations of each series to be determined by the Board of Directors.
The following table details the calculation of basic and dilutedearnings per share:
Year ended December 31,
1999 1998 1997
Amt. Amt. Amt.
Net Wtd. Avg. Per Net Wtd. Avg. Per Net Wtd. Avg. Per
Income Shares Share Income Shares Share Income Shares Share
Basic earnings per share:
Income available to
common stockholders $18,048 15,018,219 $1.20 $36,805 16,066,699 $2.29 $27,651 15,059,569 $1.84
Diluted earnings per share:
Effect of dilutive securities:
Stock options granted
and outstanding — 340,057 — 543,308 — 812,158
Income available to
common stockholders
and assumed conversions $18,048 15,358,276 $1.18 $36,805 16,610,007 $2.22 $27,651 15,871,727 $1.74
(dollars in thousands, except per share amounts)

On January 20, 1998, the Company entered into an agreement fora new revolving line of credit with an aggregate $125,000 borrowingcapacity and terminated the previous agreement. Of the availablecredit line, $74,297 was outstanding at December 31, 1999, leaving$50,703 available for additional borrowings or to issue as letters ofcredit. The total debt balance will mature on January 20, 2003. InSeptember 1996, the Company obtained fixed rate financing byentering into an unsecured senior note agreement for $35,000. Thisnote has a ten-year final, seven-year average maturity with principalpayments beginning in 2000. Both of the Company’s borrowingagreements are unsecured and permit certain investments and divi-dend payments. There are no material restrictions on the Companyas a result of these agreements, other than customary covenantsregarding certain earnings, liquidity and capital ratios.
On April 23, 1998, the Fayette County Development Authorityissued $9,500 in industrial revenue bonds, on behalf of the Company,to finance the cost of constructing and equipping a new manufac-turing facility in Peachtree City, Georgia. The principal for theseindustrial revenue bonds is to be repaid in full on March 1, 2018.These industrial revenue bonds are secured by a letter of credit.
Maturities of long-term debt for the five years subsequent toDecember 31, 1999 are $5,289, $5,320, $5,028, $79,310 and$5,004, respectively.
Included in short-term borrowings and current maturities of long-term debt at December 31, 1998 was a credit facility for Tamrotor,denominated in Finnish Markka, with an outstanding balance of$2,156. At December 31, 1999, there was no outstanding balanceunder this facility. The average interest rate for this facility was 3.6%for the year ended December 31, 1999.
Interest paid in 1999, 1998 and 1997 was $5,489, $5,494 and$4,374, respectively.
The rentals for all operating leases were $2,437, $2,531 and$2,108 in 1999, 1998 and 1997, respectively.
Note 10: Income Taxes
The following table details the components of the provision forincome taxes. A portion of these income taxes will be payable withinone year and are, therefore, classified as current, while the remainingbalance is deferred.
33
Note 9: Long-Term Debt and Other Borrowing Arrangements
December 31,
1999) 1998)
Credit line, due 2003 (1) $ 74,297) 35,987)
Unsecured senior note, due 2006 (2) 35,000) 35,000)
Variable rate industrial revenue bond, due 2018 (3) 9,500) 9,500)
Other 692) 3,023)
119,489) 83,510)
Current maturities of long-term debt (5,289) (2,452)
Long-term debt, less current maturities $114,200) 81,058)
(1) The facility was effective January 20, 1998. The loans under the facility may be denominated in U.S. Dollars or in several foreign currencies. At December 31, 1999, theoutstanding balance consisted of two loans: $64,000 and DM 20,000. The interest rate varies with market rates for federal funds and/or LIBOR for the applicablecurrency and the Company’s debt to adjusted income ratio. As of December 31, 1999, the rates for the U.S. Dollar loan and the German Mark loan were 6.5% and 3.5%,respectively, and averaged 5.7% and 3.5%, respectively, for the year ended December 31, 1999.
(2) On September 26, 1996, the Company entered into an unsecured senior note agreement at a fixed interest rate of 7.3%. This debt matures in ten years and requiresequal annual principal payments for seven years beginning September 26, 2000.
(3) The interest rate varies with market rates for tax-exempt industrial revenue bonds. As of December 31, 1999, this rate was 5.5% and averaged 3.4% for the year endedDecember 31, 1999.
Year ended December 31,
1999) 1998) 1997)
Income taxes:
Current:
U.S. federal $ 5,298) 16,164) 13,936)
U.S. state and local 605) 1,847) 1,593)
Non – U.S. 404) 1,066) 253)
Current 6,307) 19,077) 15,782)
Deferred:
U.S. federal 4,309) 3,587) 2,190)
U.S. state and local 493) 410) 251)
Non – U.S. —) 15) 277)
Deferred 4,802) 4,012) 2,718)
Provision for income taxes $ 11,109) 23,089) 18,500)

34
NOTES TO CONSOLIDATED FINANCIAL STATEMENTS
(dollars in thousands, except per share amounts)
The following table reconciles the statutory U.S. federal corporate income tax rate to the Company’s effective tax rate (as a percentage of theCompany’s income before income taxes):
Year ended December 31,
1999 1998 1997
U. S. federal income tax rate 35.0% 35.0 35.0
Changes in the tax rate resulting from:
State and local income taxes 3.4 3.4 3.4
Nondeductible goodwill 3.5 1.6 1.7
Foreign sales corporation benefit (2.5) (1.1) (1.5)
Other, net (1.3) (0.3) 1.5
Effective income tax rate 38.1% 38.6 40.1
December 31,
1999) 1998)
Components of deferred tax balances:
Deferred tax assets:
Reserves and accruals $ 11,046) 11,601)
Postretirement benefits other than pensions 17,841) 19,102)
Other 1,318) 628)
Total deferred tax assets 30,205) 31,331)
Deferred tax liabilities:
LIFO inventory (4,507) (4,398)
Plant and equipment (6,022) (5,048)
Intangibles (2,028) (973)
Other (7,833) (6,295)
Total deferred tax liabilities (20,390) (16,714)
Net deferred tax assets $ 9,815) 14,617)
U.S. deferred income taxes are not provided on certain undistrib-uted earnings of non-U.S. subsidiaries because the Company intendsto reinvest such earnings indefinitely. The estimated amount ofincome taxes that would be incurred should such earnings be distrib-uted is not significant due to available foreign tax credits and earningsand profit levels.
Income taxes paid in 1999, 1998 and 1997 were $6,975, $17,827and $15,138, respectively.
Note 11: Off-Balance Sheet Risk, Concentrations of
Credit Risk and Fair Value of Financial Instruments
Off-Balance Sheet Risk and Concentrations of Credit Risk
There were no off-balance sheet derivative financial instrumentsas of December 31, 1999 and 1998.
Concentrations of credit risk with respect to trade receivables arelimited due to the wide variety of customers and markets into whichthe Company’s products are sold, as well as their dispersion acrossmany different geographic areas. As a result, as of December 31,
1999, the Company does not consider itself to have any significantconcentrations of credit risk.
Fair Value of Financial Instruments
The Company’s financial instruments consist primarily of cash andequivalents, trade receivables, trade payables, debt instruments and aforward foreign currency contract hedging the Company’s investmentin its Finnish operations. The book values of these instruments arenot materially different from their respective fair values.
Note 12: Contingencies
The Company has been identified as a potentially responsible partywith respect to various sites designated for cleanup under variousstate and federal laws. The Company does not own any of these sites.The Company believes that the costs related to these sites will not havea materially adverse effect on its consolidated financial position,results of operations or liquidity. In addition to the environmentalmatters, the Company is a party to various other legal proceedingsand administrative actions, which are of an ordinary or routinenature, incidental to the operations of the Company.
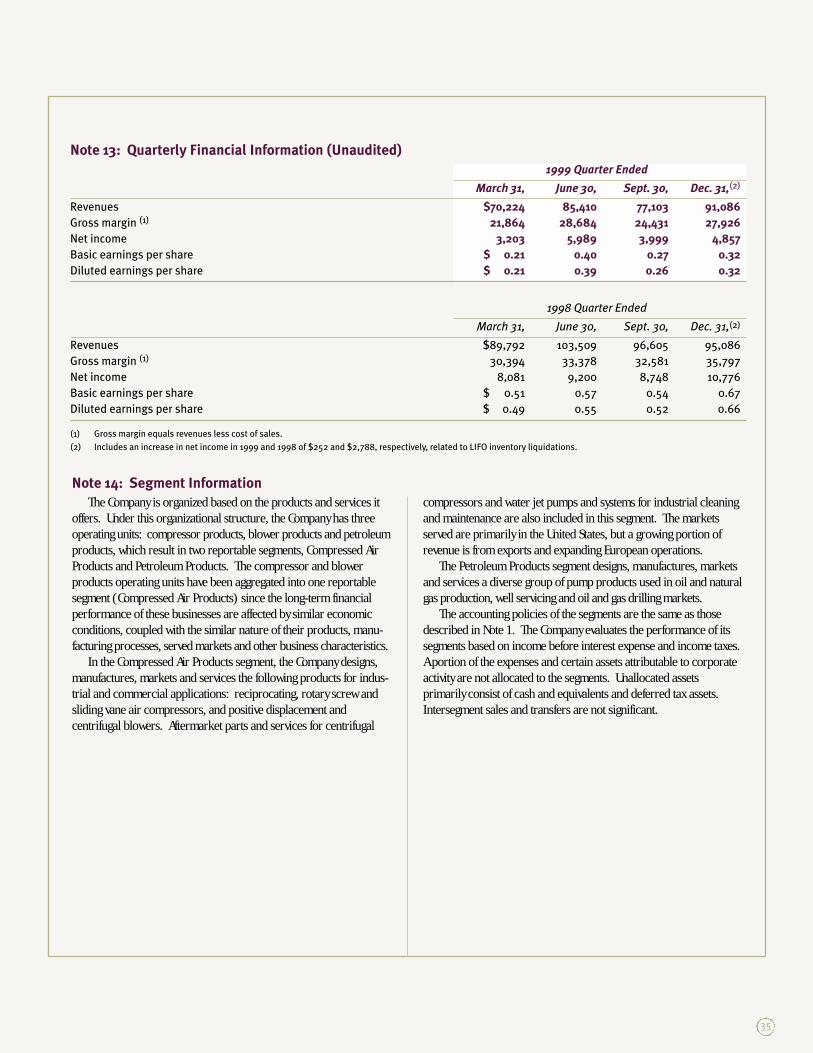
35
Note 13: Quarterly Financial Information (Unaudited)
1999 Quarter Ended
March 31, June 30, Sept. 30, Dec. 31,(2)
Revenues $70,224 85,410 77,103 91,086
Gross margin (1) 21,864 28,684 24,431 27,926
Net income 3,203 5,989 3,999 4,857
Basic earnings per share $ 0.21 0.40 0.27 0.32
Diluted earnings per share $ 0.21 0.39 0.26 0.32
1998 Quarter Ended
March 31, June 30, Sept. 30, Dec. 31,(2)
Revenues $89,792 103,509 96,605 95,086
Gross margin (1) 30,394 33,378 32,581 35,797
Net income 8,081 9,200 8,748 10,776
Basic earnings per share $ 0.51 0.57 0.54 0.67
Diluted earnings per share $ 0.49 0.55 0.52 0.66
(1) Gross margin equals revenues less cost of sales.
(2) Includes an increase in net income in 1999 and 1998 of $252 and $2,788, respectively, related to LIFO inventory liquidations.
Note 14: Segment Information
The Company is organized based on the products and services itoffers. Under this organizational structure, the Company has threeoperating units: compressor products, blower products and petroleumproducts, which result in two reportable segments, Compressed AirProducts and Petroleum Products. The compressor and blowerproducts operating units have been aggregated into one reportablesegment (Compressed Air Products) since the long-term financialperformance of these businesses are affected by similar economicconditions, coupled with the similar nature of their products, manu-facturing processes, served markets and other business characteristics.
In the Compressed Air Products segment, the Company designs,manufactures, markets and services the following products for indus-trial and commercial applications: reciprocating, rotary screw andsliding vane air compressors, and positive displacement andcentrifugal blowers. Aftermarket parts and services for centrifugal
compressors and water jet pumps and systems for industrial cleaningand maintenance are also included in this segment. The marketsserved are primarily in the United States, but a growing portion ofrevenue is from exports and expanding European operations.
The Petroleum Products segment designs, manufactures, marketsand services a diverse group of pump products used in oil and naturalgas production, well servicing and oil and gas drilling markets.
The accounting policies of the segments are the same as thosedescribed in Note 1. The Company evaluates the performance of itssegments based on income before interest expense and income taxes.A portion of the expenses and certain assets attributable to corporateactivity are not allocated to the segments. Unallocated assetsprimarily consist of cash and equivalents and deferred tax assets.Intersegment sales and transfers are not significant.
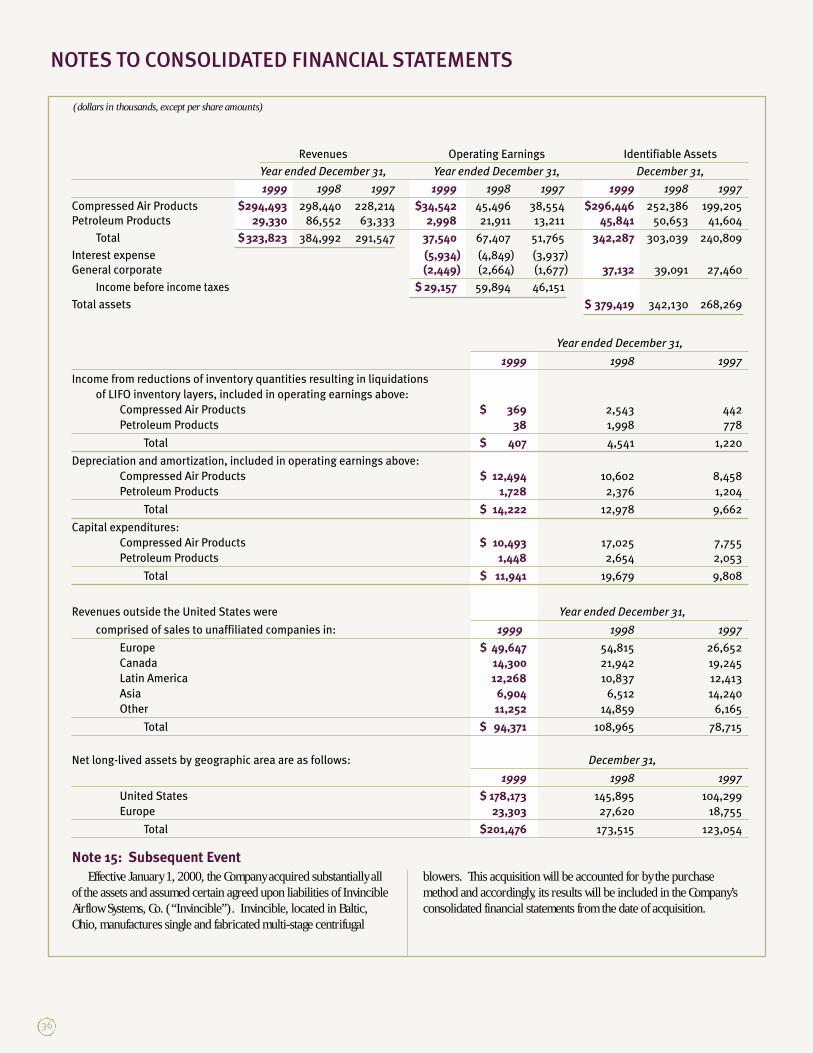
36
NOTES TO CONSOLIDATED FINANCIAL STATEMENTS
Note 15: Subsequent Event
Effective January 1, 2000, the Company acquired substantially allof the assets and assumed certain agreed upon liabilities of InvincibleAirflow Systems, Co. (“Invincible”). Invincible, located in Baltic,Ohio, manufactures single and fabricated multi-stage centrifugal
blowers. This acquisition will be accounted for by the purchasemethod and accordingly, its results will be included in the Company’sconsolidated financial statements from the date of acquisition.
(dollars in thousands, except per share amounts)
Revenues Operating Earnings Identifiable Assets
Year ended December 31, Year ended December 31, December 31,
1999 1998 1997 1999) 1998) 1997) 1999 1998 1997
Compressed Air Products $294,493 298,440 228,214 $34,542) 45,496) 38,554) $296,446 252,386 199,205
Petroleum Products 29,330 86,552 63,333 2,998) 21,911) 13,211) 45,841 50,653 41,604
Total $323,823 384,992 291,547 37,540) 67,407) 51,765) 342,287 303,039 240,809
Interest expense (5,934) (4,849) (3,937)
General corporate (2,449) (2,664) (1,677) 37,132 39,091 27,460
Income before income taxes $ 29,157) 59,894) 46,151)
Total assets $ 379,419 342,130 268,269
Year ended December 31,
1999 1998 1997
Income from reductions of inventory quantities resulting in liquidations
of LIFO inventory layers, included in operating earnings above:
Compressed Air Products $ 369 2,543 442
Petroleum Products 38 1,998 778
Total $ 407 4,541 1,220
Depreciation and amortization, included in operating earnings above:
Compressed Air Products $ 12,494 10,602 8,458
Petroleum Products 1,728 2,376 1,204
Total $ 14,222 12,978 9,662
Capital expenditures:
Compressed Air Products $ 10,493 17,025 7,755
Petroleum Products 1,448 2,654 2,053
Total $ 11,941 19,679 9,808
Revenues outside the United States were Year ended December 31,
comprised of sales to unaffiliated companies in: 1999) 1998 1997
Europe $ 49,647 54,815 26,652
Canada 14,300 21,942 19,245
Latin America 12,268 10,837 12,413
Asia 6,904 6,512 14,240
Other 11,252 14,859 6,165
Total $ 94,371 108,965 78,715
Net long-lived assets by geographic area are as follows: December 31,
1999 1998 1997
United States $ 178,173 145,895 104,299
Europe 23,303 27,620 18,755
Total $201,476 173,515 123,054

SHAREHOLDER INFORMATION
Stock Information
Gardner Denver’s common stock has traded on the New YorkStock Exchange since August 14, 1997 under the ticker symbolGDI. Prior to this date, the Company’s common stock traded onthe Nasdaq National Market tier of the Nasdaq Stock Market
under the symbol GDMI.The quarterly high and low sales prices for the Company’s
common stock for the two most recent years, as reported by the New York Stock Exchange, are as follows:
37
As of March 1, 2000, there were approximately 8,600holders of record of Gardner Denver’s common stock.
Dividends
Gardner Denver has not paid a cash dividend since its spin-off in April 1994. The cash flow generated by the Companyis currently utilized for debt service and capital accumulationand reinvestment.
Transfer Agent and Registrar
EquiServeP.O. Box 2500 Jersey City, New Jersey 07303-2500(800) 519-3111(201) 324-1225(201) 222-4955 (for the hearing impaired)E-mail address: [email protected]
News Releases by Fax
Gardner Denver’s news releases, including the quarterlyearnings release, are available by fax, without charge, by calling (800) 758-5804, extension 303875, or by visiting our website at http://www.gardnerdenver.com.
Form 10-K
A copy of the annual report on Form 10-K filed with theSecurities and Exchange Commission is available, withoutcharge, upon written request to the Corporate Secretary at the Company’s address indicated below.
Annual Meeting
The 2000 Annual Meeting of Stockholders will be held onMay 2 at the Holiday Inn Quincy, 201 South Third Street, Quincy,Illinois, starting at 1:30 p.m.
Corporate Offices
Gardner Denver, Inc.1800 Gardner ExpresswayQuincy, Illinois 62301(217) 222-5400E-mail address: [email protected]
Internet Access
For access to information on your Gardner Denver invest-ment via the Internet, registered shareholders may contact theCompany’s transfer agent at (877) 843-9327 for a personalidentification number and then visit their website athttp://www.equiserve.com.
1998 Quarter Ended
March 31, June 30, September 30, December 31,
High $29 15/16 30 7/16 28 1/4 18 3/4
Low $19 1/2 24 1/2 13 23/32 10 3/8
1999 Quarter Ended
March 31, June 30, September 30, December 31,
High $17 19 5/16 21 3/4 16 13/16
Low $11 9/16 14 1/16 14 3/4 11

38
BOARD OF DIRECTORS AND CORPORATE OFFICERS
BOARD OF DIRECTORS
Donald G. Barger, Jr.
Vice President and Chief Financial OfficerHillenbrand Industries Inc.
Ross J. Centanni
Chairman, President and Chief Executive OfficerGardner Denver, Inc.
Frank J. Hansen
President and Chief Executive OfficerIDEX Corporation
Raymond R. Hipp
Chairman, President and Chief Executive OfficerAlternative Resources Corporation
Thomas M. McKenna
PresidentUnited Sugars Corporation
Alan E. Riedel
Vice Chairman (retired)Cooper Industries, Inc.
Michael J. Sebastian
Executive Vice President (retired)Cooper Industries, Inc.
Richard L. Thompson
Group President and Executive Office MemberCaterpillar Inc.
CORPORATE OFFICERS
Ross J. Centanni
Chairman, President and Chief Executive Officer
David Brown
Vice President and General Manager,Gardner Denver Blower Division
Helen W. Cornell
Vice President, Corporate Secretary and Treasurer
Steven M. Krivacek
Vice President, Human Resources
Daniel C. Rizzo, Jr.
Vice President and Corporate Controller
Philip R. Roth
Vice President, Finance and Chief Financial Officer
J. Dennis Shull
Vice President and General Manager,Gardner Denver Compressor and Pump Division