garfunkelux holdco 2 s.a. qe 31 march 2020 results · 2 s.a. (“the company”) and its...
TRANSCRIPT
Garfunkelux Holdco 2 S.A.
QE 31 March 2020
Results

2
1. Highlights
120 Month Estimated Remaining Collections (“ERC”) at £3,399.3m as of 31 March 2020, up 8.6% since 31 March 2019.
Portfolio investments acquired for the three months ending 31 March 2020 total £58.1m.
Debt Purchase gross cash collections of £189.7m in the three months ending 31 March 2020, an increase of 2.6% on the three months ending 31 March 2019.
Cash income of £227.7m in the three months ending 31 March 2020, up 1.1% compared to the three month period ending 31 March 2019.
Cash EBITDA(1) for the three months ended 31 March 2020 of £120.5m, a 11.3% increase on the three month period ending 31 March 2019, with LTM Cash EBITDA to 31 March 2020 of £508.2m.
Net debt to LTM Pro forma Cash EBITDA(2) is at 4.7x as at 31 March 2020.
Net secured debt to LTM Pro forma Cash EBITDA(2) is at 3.9x as at 31 March 2020.
(1) Cash EBITDA is defined as collections on owned portfolios plus other turnover, less collection activity costs and other expenses
(which together equals servicing costs) and before exceptional items, depreciation and amortisation.
(2) Pro forma LTM Cash EBITDA as quoted is defined as Group Cash EBITDA for the twelve months ended 31 March 2020,
adjusted for Pro forma cost adjustments.

3
1. Highlights (continued)
Commenting on the results, Colin Storrar, CEO, said:
“The first quarter continued the momentum of 2019, and demonstrated a resilient business, with collection performance in line with our forecasts, continued strong cash flow generation and a robust liquidity position.
We remain pragmatic in our assessment of the purchasing landscape, with a focus on maintaining that strong liquidity level. Where deals arise, we will invest for value, growth and the long-term benefit of the
business.
I am hugely proud of the whole Lowell team across Europe and the way that they have dealt with the
situation. Without them we could not support our customers, and we could not deliver our purpose: to make credit work better for all.
We have the right fundamentals in place: strong foundations; clarity of our purpose and strategy, and a proven ability to adapt at speed. This give me confidence that we will continue to evolve and grow our business in the right way in what will become an increasingly attractive market.”
About Lowell:
Lowell is one of Europe’s largest credit management companies with a mission to make credit work better for all. It operates in the UK, Germany, Austria, Switzerland, Denmark, Norway, Finland and Sweden.
Lowell’s unparalleled combination of data analytics insight and robust risk management provides clients with expert solutions in debt purchasing, third party collections and business process outsourcing. With its ethical approach to debt management, Lowell always looks for the most appropriate, sustainable and fair outcome for each customer’s specific circumstances. Lowell was formed in 2015 following the merger of the UK and German market leaders: the Lowell Group
and the GFKL Group. In 2018, Lowell completed the acquisition of the Carve-out Business from Intrum, which has market leading positions in the Nordic region. It is backed by global private equity firm Permira and Ontario Teachers’ Pension Plan.
For more information on Lowell, please visit our investor website: www.lowell.com

4
1. Highlights (continued)
Non-IFRS financial measures
We have included certain non-IFRS financial measures in this trading update, including Estimated Remaining Collections (“ERC”), Cash EBITDA and Gross Money Multiples (“GMMs”). We present ERC because it represents our expected gross cash proceeds of the purchased debt portfolios
recorded on our balance sheet over the 84-month, 120-month and 180-month periods. ERC is calculated as of a point in time assuming no additional purchases are made. ERC is a metric that is also often used
by other companies in our industry. We present ERC because it represents our best estimate of the undiscounted cash value of our purchased debt portfolios at any point in time, which is an important supplemental measure for our board of directors and management to assess the gross cash generation capacity of the assets backing our business. In addition, the instruments
governing our indebtedness use ERC to measure our compliance with certain covenants and, in certain circumstances, our ability to incur indebtedness. Our ERC projection, calculated by our proprietary analytical models, utilises historical portfolio collection performance data and assumptions about future collection rates. While we cannot guarantee that we will achieve such collections and while our ERC projection may not be comparable to similar metrics used by other companies in our industry, our ERC forecasts have historically proven to be somewhat conservative through all phases of the economic cycle.
We present Cash EBITDA because we believe it may enhance an investor’s understanding of our underlying cash flow generation at a given point in time that can be used to service or pay down debt, pay income taxes, purchase new debt portfolios and for other uses. Cash EBITDA is defined as collections on owned portfolios plus other turnover, less collection activity costs and other expenses (which together equals servicing costs) and before exceptional items, depreciation and
amortisation.
Our board of directors and management use Cash EBITDA to understand cash profit in a period, mindful it is neither a proxy for future periods (since it is a lagged measure which can be influenced by the volume and mix of purchases in the latter months of the reported period), nor is it an indication of run off cash generation as the current cost base is representative of our front loaded cost curves and recent purchasing activity. Cash EBITDA is not a measure calculated in accordance with IFRS and our use of the term Cash EBITDA may vary from others in our industry. For a reconciliation of Cash EBITDA to operating profit, see
page 2. We present Gross Money Multiples (“GMMs”) because it represents our expected gross cash return from purchased debt portfolios. In addition, GMMs are one of a number of return metrics that we use when making pricing and investment decisions. GMMs can be reported on a rolling basis or on a static basis. On a rolling basis, GMMs are calculated as the sum of gross collections achieved to date plus our ERC as at the reporting date, divided by purchase price. All things being equal and based on this
rolling definition, GMMs should improve over time as portfolios and vintages mature. On a static basis,
GMMs are calculated over a static time-period – for example, a static 120m GMM will be based upon either gross collections achieved to date plus the remaining months of ERC required to get to a 120m total period or the original priced 120m collection expectations, divided by purchase price. ERC, Cash EBITDA and GMMs and all other non-IFRS measures have important limitations as analytical tools and you should not consider them in isolation or as substitutes for analysis of
our results as reported under IFRS.

5
2. Operating & financial review
The following table summarises key performance indicators at, and for the periods ended 31 March 2020 and 31 March 2019.
(£ in millions unless otherwise noted)
Three months
ended or as at
31 March 2020
Three months
ended or as at
31 March 2019
Portfolio investments acquired 58.1 93.5
Gross cash collections (in total) 437.3 455.5
Gross cash collections (DP ‘debt purchase’) 189.7 184.9
Gross cash collections (3PC ‘third party collections’) 247.6 270.6
3PC income 38.0 40.3
Cash income 227.7 225.2
Cash EBITDA(1) 120.5 108.3
84 month ERC 2,827.8 2,608.0
120 month ERC 3,399.3 3,128.7
180 month ERC 4,008.0 3,721.1
(1) Cash EBITDA is defined as collections on owned portfolios plus other turnover, less collection activity costs and other expenses
(which together equals servicing costs) and before exceptional items, depreciation and amortisation.
6
2. Operating & financial review (continued)
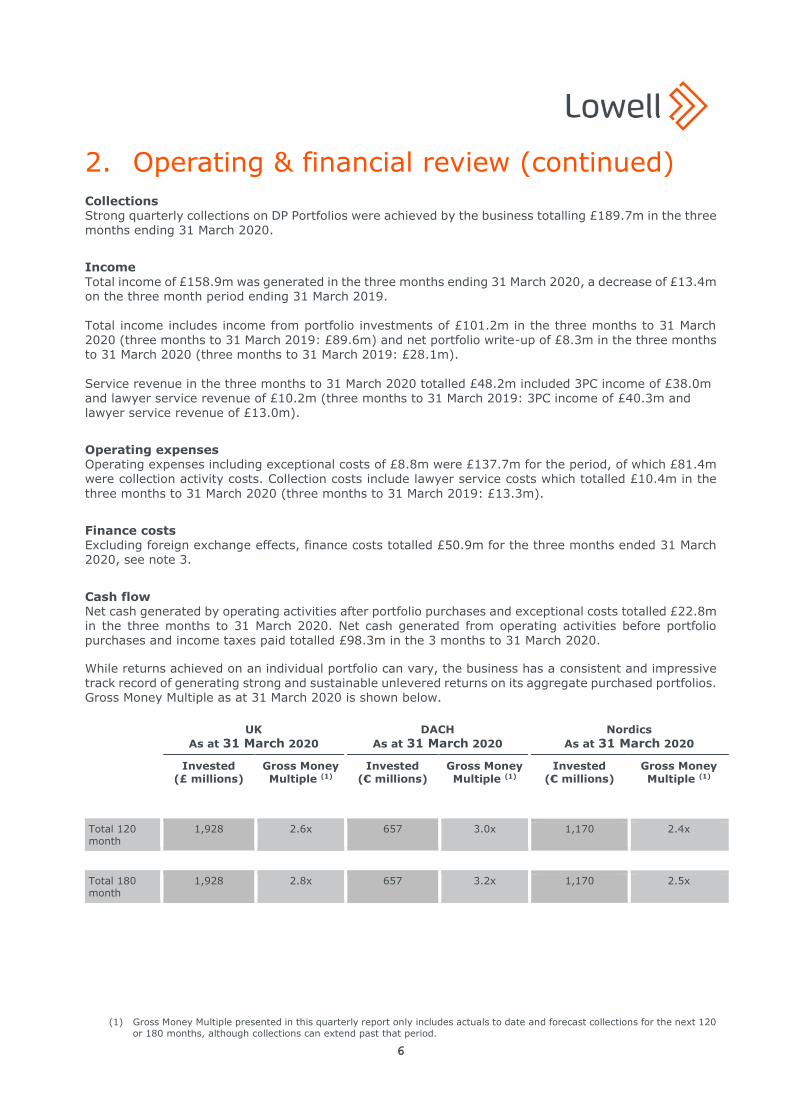
Collections Strong quarterly collections on DP Portfolios were achieved by the business totalling £189.7m in the three months ending 31 March 2020.
Income
Total income of £158.9m was generated in the three months ending 31 March 2020, a decrease of £13.4m on the three month period ending 31 March 2019. Total income includes income from portfolio investments of £101.2m in the three months to 31 March
2020 (three months to 31 March 2019: £89.6m) and net portfolio write-up of £8.3m in the three months to 31 March 2020 (three months to 31 March 2019: £28.1m).
Service revenue in the three months to 31 March 2020 totalled £48.2m included 3PC income of £38.0m and lawyer service revenue of £10.2m (three months to 31 March 2019: 3PC income of £40.3m and lawyer service revenue of £13.0m).
Operating expenses Operating expenses including exceptional costs of £8.8m were £137.7m for the period, of which £81.4m were collection activity costs. Collection costs include lawyer service costs which totalled £10.4m in the
three months to 31 March 2020 (three months to 31 March 2019: £13.3m).
Finance costs Excluding foreign exchange effects, finance costs totalled £50.9m for the three months ended 31 March 2020, see note 3.
Cash flow Net cash generated by operating activities after portfolio purchases and exceptional costs totalled £22.8m in the three months to 31 March 2020. Net cash generated from operating activities before portfolio purchases and income taxes paid totalled £98.3m in the 3 months to 31 March 2020.
While returns achieved on an individual portfolio can vary, the business has a consistent and impressive track record of generating strong and sustainable unlevered returns on its aggregate purchased portfolios. Gross Money Multiple as at 31 March 2020 is shown below.
UK
As at 31 March 2020
DACH
As at 31 March 2020
Nordics
As at 31 March 2020
Invested (£ millions)
Gross Money Multiple (1)
Invested (€ millions)
Gross Money Multiple (1)
Invested (€ millions)
Gross Money Multiple (1)
Total 120 month
1,928 2.6x 657 3.0x 1,170 2.4x
Total 180 month
1,928 2.8x 657 3.2x 1,170 2.5x
(1) Gross Money Multiple presented in this quarterly report only includes actuals to date and forecast collections for the next 120
or 180 months, although collections can extend past that period.

Garfunkelux Holdco 2 S.A.
Unaudited condensed consolidated interim statement of comprehensive income
3 months ended 31 March 2020
7
Note
3 months to 31 March 2020
£000
3 months to 31 March 2019
£000
Continuing operations
Income
Income from portfolio investments 4 101,215 89,585
Net portfolio write up 4 8,295 28,055
Portfolio fair value release 4 (322) (391)
Service revenue 2 48,177 53,340
Other revenue 1,157 1,375
Other income 358 338
Total income 158,880 172,302
Operating expenses
Collection activity costs (81,363) (88,552)
Other expenses (56,381) (67,067)
Total operating expenses (137,744) (155,619)
Operating profit 21,136 16,683
Finance income 9,439 1,629
Finance costs 3 (61,400) (60,066)
Loss for the period, before tax (30,825) (41,754)
Tax credit 6,955 2,978
Loss for the period (23,870) (38,776)
Other comprehensive income
Items that will or may be reclassified subsequently to profit or loss
Foreign operations – foreign currency translation differences (23,592) 9,541
Net fair value gains – cash flow hedges - (312)
Other comprehensive income, net of tax (23,592) 9,229
Total comprehensive expenditure for the period (47,462) (29,547)
The notes on pages 11 to 19 form part of the interim financial statements.

Garfunkelux Holdco 2 S.A.
Unaudited condensed consolidated interim statement of financial position
As at 31 March 2020
8
Note
31 March 2020 £000
31 March 2019 £000
Assets
Non-current assets
Goodwill 1,203,812 1,188,987
Intangible assets 145,065 155,010
Property, plant and equipment 52,037 59,674
Portfolio investments 4 1,059,569 1,008,912
Other financial assets 9,706 8,868
Deferred tax assets 22,920 14,719
Total non-current assets 2,493,109 2,436,170
Current assets
Portfolio investments 4 588,571 549,162
Inventories 73 90
Trade and other receivables 5 56,800 51,465
Other financial assets 11,477 7,459
Derivatives 3,694 -
Assets for current tax 3,019 4,149
Cash and cash equivalents 139,510 134,734
Total current assets 803,144 747,059
Total assets 3,296,253 3,183,229
Equity
Share capital 4,385 4,385
Share premium and similar premiums 516,721 516,721
Reserves (114,430) (88,385)
Retained deficit (294,495) (249,304)
Total equity 112,181 183,417
Liabilities
Non-current liabilities
Borrowings 7 2,582,962 2,508,911
Provisions 14,915 10,266
Other financial liabilities 36,151 47,247
Deferred tax liabilities 38,785 47,141
Total non-current liabilities 2,672,813 2,613,565
Current liabilities
Trade and other payables 6 94,533 113,529
Provisions 18,247 16,251
Borrowings 7 344,099 205,441
Derivatives 7,338 10,999
Other financial liabilities 13,993 10,692
Current tax liabilities 33,049 29,335
Total current liabilities 511,259 386,247
Total equity and liabilities 3,296,253 3,183,229
The notes on pages 11 to 19 form part of the interim financial statements.

Garfunkelux Holdco 2 S.A.
Unaudited condensed consolidated interim statement of changes in equity
3 months ended 31 March 2020
9
Share
Capital
£000
Share
premium
& similar
premiums
£000
Capital
Reserve
£000
Translation
reserve
£000
Valuation
reserve
£000
Hedging
reserve
£000
Retained
deficit
£000
Total
£000
Balance at 31 December 2018 4,385 516,721 (7,946) (89,614) (54) - (210,528) 212,964
Loss for the period - - - - - - (38,776) (38,776)
Exchange differences - - - 9,541 - - - 9,541
Net fair value gains – cash flow hedges - - - - - (312) - (312)
Total comprehensive income/ (expenditure)
- - - 9,541 - (312) (38,776) (29,547)
Balance at 31 March 2019 4,385 516,721 (7,946) (80,073) (54) (312) (249,304) 183,417
Loss for the period - - - - - - (21,321) (21,321)
Net fair value loss – cash flow hedges - - - - - 312 - 312
Actuarial loss on pension - - - - (1,537) - - (1,537)
Deferred tax on pensions - - - - 710 - - 710
Exchange differences - - - (1,593) - - (1,593)
Total comprehensive income/ (expenditure)
- - - (1,593) (827) 312 (21,321) (23,429)
Adjustment in relation to purchase of shares in subsidiaru
- - (345) - - - - (345)
Balance at 31 December 2019 4,385 516,721 (8,291) (81,666) (881) - (270,625) 159,643
Loss for the period - - - - - - (23,870) (23,870)
Exchange differences - - - (23,592) - - - (23,592)
Total comprehensive income/ (expenditure)
- - - (23,592) - - (23,870) (47,462)
Balance at 31 March 2020 4,385 516,721 (8,291) (105,258) (881) - (294,495) 112,181
The notes on pages 11 to 19 form part of the interim financial statements.

Garfunkelux Holdco 2 S.A.
Unaudited condensed consolidated interim statement of cash flows
3 months ended 31 March 2020
10
Note
3 months to 31 March 2020
£000
3 months to 31 March 2019
£000
Net cash generated by/(used in) operating activities 8 22,818 (16,886)
Investing activities
Purchase of property, plant and equipment (767) (1,933)
Purchase of intangible assets (3,245) (4,293)
Proceeds from sale of subsidiary, net of cash disposed - 3,441
Net cash used in investing activities (4,012) (2,785)
Financing activities
Proceeds from loans and borrowings 96,097 76,758
Repayment of borrowings (74,419) (19,918)
Payment of lease liabilities (3,265) (2,006)
Interest paid (26,629) (25,223)
Net cash used in financing activities (8,216) 29,611
Net increase in cash and cash equivalents 10,590 9,940
Cash and cash equivalents at beginning of period 124,495 129,171
Effect of movements in exchange rates on cash held 4,425 (4,377)
Cash and cash equivalents at end of period 139,510 134,734
The notes on pages 11 to 19 form part of the interim financial statements.

Garfunkelux Holdco 2 S.A.
Notes to the unaudited condensed consolidated interim financial statements
3 months ended 31 March 2020
11
1. Accounting policies
General information and basis of preparation
These interim financial statements have been prepared in accordance with International Financial Reporting Standards (IFRS) as adopted by the European Union. These interim financial statements have been prepared on a historical cost basis except for derivative financial instruments that have been measured at fair value. Those standards have been applied consistently to the historical periods.
Basis of consolidation The Group interim financial statements consolidate the interim financial statements of Garfunkelux Holdco
2 S.A. (“the Company”) and its subsidiaries (together “the Group”) for the three month period ending 31 March 2020. The Group controls an investee if and only if the Group has:
Power over the investee (i.e. existing voting rights that give it the current ability to direct the relevant activities of the investee);
Exposure, or rights, to variable return from its involvement with the investee; and
The ability to use its power over the investee to affect its return.
Generally, there is a presumption that a majority of voting rights results in control. To support its presumption and when the Group has less than a majority of voting rights or similar rights of an investee,
the Group considers all relevant facts and circumstances in assessing whether it has power over an investee including:
The contractual arrangements with the other investee;
Rights arising from the contractual arrangements; and
The Group voting rights and potential voting rights.
All intra-group transactions, balances, income and expenses are eliminated on consolidation.
Going concern In assessing whether the going concern basis is appropriate to adopt, the directors have undertaken a thorough review of forecast cash flow models and scenarios for a period in excess of 12 months from the
date of approval of these accounts.
These scenarios have been subject to stress testing, and downside scenarios have been considered as a result of the impact of COVID-19 on the Group’s cash flows. In the scenarios considered to be reasonable by management the Group maintains sufficient liquidity and cash reserves to continue in operational existence for the foreseeable future. Consequently, the directors believe that it remains appropriate to prepare the interim financial statements
on a going concern basis.
Foreign currency The Group entities initially record all their transactions in the Functional Currency of each entity and items included in the financial statements of these entities are measured using their Functional Currency. Transactions in foreign currencies are translated to the respective Functional Currencies of Group entities at the foreign exchange rate ruling at the date of the transaction. Monetary assets and liabilities
denominated in foreign currencies at the balance sheet date are retranslated to the Functional Currency at the foreign exchange rate ruling at that date. Foreign exchange differences arising on translation are
recognised in the Statement of Comprehensive Income (“SCI”). Non-monetary assets and liabilities that

Garfunkelux Holdco 2 S.A.
Notes to the unaudited condensed consolidated interim financial statements
3 months ended 31 March 2020
12
1. Accounting policies (continued)
Foreign currency (continued)
are measured in terms of historical cost in a foreign currency are translated using the exchange rate at the date of the transaction. Non-monetary assets and liabilities denominated in foreign currencies that are stated at fair value are retranslated to the Functional Currency at foreign exchange rates ruling at the dates the fair value was determined.
The assets and liabilities of foreign operations, including goodwill and fair value adjustments arising on consolidation, are translated to the Group’s Presentational Currency (Sterling) at foreign exchange rates
ruling at the balance sheet date. The revenues and expenses of foreign operations are translated at an average rate for the period where this rate approximates to the foreign exchange rates ruling at the dates of the transactions. Exchange differences arising from this translation of foreign operations are reported as an item of other comprehensive income and accumulated in the translation reserve.
Business combinations Acquisitions of subsidiaries and businesses are accounted for using the acquisition method. The
consideration for each acquisition is measured at the aggregate of the fair values (at the date of exchange) of assets given, liabilities incurred or assumed, and equity instruments issued by the Group in exchange for control of the acquiree. Acquisition-related costs are recognised in the SCI as incurred.
Goodwill Goodwill arising in a business combination is recognised as an asset at the date that control is acquired
(the acquisition date). Goodwill is measured as the excess of the sum of the consideration transferred, the amount of any non-controlling interest in the acquiree and the fair value of the acquirer’s previously held equity interest (if any) in the entity over the net of the acquisition date amounts of the identifiable assets acquired and the liabilities assumed. Total goodwill is tested for impairment annually. Additionally, if there is evidence of impairment in any cash-generating unit (“CGU”), goodwill allocated to that CGU is also tested for impairment.

Garfunkelux Holdco 2 S.A.
Notes to the unaudited condensed consolidated interim financial statements
3 months ended 31 March 2020
13
1. Accounting policies (continued)
Revenue recognition and effective interest rate method
Finance revenue on portfolio investments Income from portfolio investments represents the yield from acquired portfolio investments, net of VAT where applicable. Acquired portfolio investments are held to collect contractual cash flows of payments
of solely principal and interest, recognising them at amortised cost in line with IFRS 9.
The effective interest rate (“EIR”) is the rate that exactly discounts estimated future cash receipts of the acquired portfolio asset to the net carrying amount at initial recognition, (i.e. the price paid to acquire the asset). These estimated future cash receipts are reflective of the conditions within the markets which the Group operates and range from 84 months to 120 months. Acquired portfolio investments are acquired at a deep discount and classified as purchased or credit impaired (“POCI”) in line with IFRS 9. As a result the estimated future cash flows, and hence EIR, reflect
the likely credit losses within each portfolio. Increases in portfolio carrying values can and do occur should forecasted cash flows be deemed greater than previous estimates and because of the rolling nature of the period to derive future cash receipts. The difference in carrying value following an enhanced collection forecast is recognised in the net portfolio write up line within income, with subsequent reversals also recorded in this line. This line represents the
net impairment gains on portfolio investments. As part of the acquisition accounting around the purchase of Metis Bidco Limited by Simon Bidco Limited on 13 October 2015 the portfolio investments were uplifted to their fair value at the date of acquisition. The portfolio fair value release represents the unwinding of this fair value uplift. This uplift is being unwound in line with the standard profile of a gross collection curve of these portfolios.
Service Revenue
Service revenue represents amounts receivable for tracing and debt collecting services (commissions and fees) provided to third party clients including collection lawyers, net of VAT where applicable. Performance obligations within service contracts are the collection of cash and hence these are satisfied when the Group collects on debt. Payment is due from clients shortly after cash is collected on their behalf. Revenue is recognised when performance obligations are satisfied.
Impairment of acquired portfolio investments
Acquired portfolio investments are reviewed for indications of impairment at the Statement of Financial Position (“SFP”) date in accordance with the IFRS 9 forward looking expected credit loss (“ECL”) model. As the Group’s portfolio investments are classified as POCI assets, lifetime ECL is included in the calculation of EIR. The estimation of ECL includes an assessment of forward-looking economic
assumptions. Impairment represents changes to carrying values, discounted at the EIR, of the portfolio investments as a result of reassessments of the estimated future cash flows. These are recognised in net portfolio write up in the SCI. The impairment adjustment is calculated by discounting regularly revised cash flow forecasts developed for each individual portfolio investment, at the initially set EIR. The cash flow forecasts, which represent the undiscounted value of the ERC of the Group’s portfolio investments at a given point in time, are
calculated over the portfolio expected useful life, based on previous month’s collections and portfolio performance information collated within our proprietary valuation models.

Garfunkelux Holdco 2 S.A.
Notes to the unaudited condensed consolidated interim financial statements
3 months ended 31 March 2020
14
1. Accounting policies (continued)
Financial instruments
Financial assets and financial liabilities are recognised in the Group’s consolidated SFP when the Group becomes a party to the contractual provisions of the instrument. Financial assets and liabilities at fair value through profit or loss
This category relates to financial assets and liabilities that must be recognised at fair value through profit or loss. Such assets or liabilities are initially recognised at cost, which at this point equates to fair value.
They must be measured subsequently at fair value. Loans and receivables Acquired portfolio investments are acquired from institutions at a substantial discount from their face value. The portfolios are initially recorded at their fair value, being their acquisition price, and are subsequently measured at amortised cost using the EIR method.
The portfolio investment is analysed between current and non-current in the SFP. The current asset is determined using the expected cash flows arising in the next twelve months after the SFP date. The residual amount is classified as non-current. Portfolio investments include litigation costs which represent upfront fees paid during the litigation
process, expected to be recoverable from the customer and added to the customer account balance to be recovered at a later date. Trade receivables, loans, and other receivables that have fixed or determinable payments that are not quoted in an active market are classified as ‘Trade and other receivables’. Trade and other receivables are measured at amortised cost using the EIR method, less any impairment. Interest income is recognised by applying the effective interest rate, except for short-term receivables (including trade receivables)
when the recognition of interest would be immaterial. The Group has forward flow agreements in place in relation to the future acquisition of portfolio investments. The fair value and subsequent amortised cost of portfolios acquired under these agreements are determined on the same basis as the Group’s other portfolio investments. Impairment of financial assets
Financial assets, other than those held at fair value through profit or loss / SCI (FVTPL), are assessed for
indicators of impairment at each period end. Financial assets are impaired where there is objective evidence that, as a result of one or more events that occurred after the initial recognition of the financial asset, the estimated future cash flows of the investment have been affected.
Financial liabilities and equity
Debt and equity instruments are classified as either financial liabilities or as equity in accordance with the substance of the contractual arrangement. Financial liabilities
All financial liabilities held by the Group are measured at amortised cost using the EIR method, except for those measured at fair value through the SCI, e.g. derivative liabilities. The Group derecognises financial liabilities when, and only when, the Group’s obligations are discharged, cancelled or they expire.

Garfunkelux Holdco 2 S.A.
Notes to the unaudited condensed consolidated interim financial statements
3 months ended 31 March 2020
15
1. Accounting policies (continued)
Collection activity costs
Collection activity costs represent direct staff costs and the direct third party costs in providing services as a debt collection agency or collecting debts on acquired portfolio investments; examples include printing and postage, third party commissions, search and trace costs, litigation, telephone and SMS costs.
Taxation
The tax expense represents the sum of the tax currently payable and deferred tax. Current tax
The tax currently payable is based on taxable profit for the period. Taxable profit differs from net profit as reported in the SCI because it excludes items of income or expense that are taxable or deductible in other periods and it further excludes items that are never taxable or deductible. The Group’s liability for
current tax is calculated using tax rates that have been enacted or substantively enacted by the period end. Deferred tax
Deferred tax is the tax expected to be payable or recoverable on differences between the carrying amounts of assets and liabilities in the financial statements and the corresponding tax bases used in the
computation of taxable profit, and is accounted for using the balance sheet liability method.
Provisions Provisions are recognised when the Group has a present obligation (legal or constructive) as a result of a past event, if it is probable that the Group will be required to settle that obligation and if a reliable estimate of the amount of the obligation can be made.
2. Service revenue
3 months to 31 March 2020
3 months to 31 March 2019
£000 £000
3PC income 37,971 40,308
Lawyer service revenue 10,206 13,032
48,177 53,340

Garfunkelux Holdco 2 S.A.
Notes to the unaudited condensed consolidated interim financial statements
3 months ended 31 March 2020
16
3. Finance costs
3 months to 31 March 2020
3 months to 31 March 2019
£000 £000
Interest payable on the Senior Secured Notes 27,504 27,617
Interest payable on the Senior Unsecured Notes 5,404 6,325
Fees payable on the notes 2,704 1,813
Interest and fees payable on Revolving credit facility 2,821 1,794
Interest payable on shareholder loan 9,273 8,468
Interest payable on securitisation 2,128 2,146
Net loss on financial instruments designated as FVTPL - 10,326
Other interest payable 536 860
Net foreign exchange loss 10,549 177
Interest expense from lease liabilities 481 540
61,400 60,066
4. Portfolio investments
31 March 2020 31 March 2019
£000 £000
Non-current 1,059,569 1,008,912
Current 588,571 549,162
Total 1,648,140 1,558,074
31 March 2020 31 March 2019
£000 £000
At start of the period 1,660,138 1,561,013
Portfolios acquired during the period 58,093 93,518
Collections in the period (189,674) (184,857)
Income from portfolio investments 101,215 89,585
Net portfolio write up 8,295 28,055
Portfolio fair value release (322) (391)
Other 10,395 (28,849)
At end of the period 1,648,140 1,558,074

Garfunkelux Holdco 2 S.A.
Notes to the unaudited condensed consolidated interim financial statements
3 months ended 31 March 2020
17
5. Trade and other receivables
31 March 2020 31 March 2019
£000 £000
Trade receivables 13,131 12,896
Prepayments and accrued income 19,675 19,895
Other receivables 22,458 16,284
Tax receivable 1,536 2,390
56,800 51,465
6. Trade and other payables
31 March 2020 31 March 2019
£000 £000
Trade payables 11,369 16,399
Other taxes and social security 7,927 7,905
Accruals and deferred income 34,661 36,115
Other payables 40,576 53,110
94,533 113,529
Other payables includes amounts due of £0.5m in respect of portfolios purchased but not yet paid for as at 31 March 2020 (31 March 2019: £8.8m).

Garfunkelux Holdco 2 S.A.
Notes to the unaudited condensed consolidated interim financial statements
3 months ended 31 March 2020
18
7. Borrowings
31 March 2020 31 March 2019
£000 £000
Non-current
Unsecured borrowing at amortised cost
Senior Notes 196,500 230,000
Prepaid costs on unsecured borrowings (5,204) (5,833)
Shareholder loan owed to Garfunkelux Holdco 1 S.à r.l. 414,052 365,634
Total unsecured 605,348 589,801
Secured borrowing at amortised cost
Senior Secured Notes 1,825,418 1,790,628
Prepaid costs on secured borrowings (24,951) (37,708)
Securitisation loans 177,147 166,190
Total secured 1,977,614 1,919,110
Total borrowings due for settlement after 12 months 2,582,962 2,508,911
Current
Unsecured borrowing at amortised cost
Interest on Senior Notes 9,006 10,542
Other interest payable 560 1,385
Total unsecured 9,566 11,927
Secured borrowing at amortised cost
Interest on Senior Secured Notes 27,227 27,135
Revolving credit facility 231,120 90,483
Securitisation loans 76,186 75,896
Total secured 334,533 193,514
Total borrowings due for settlement before 12 months 344,099 205,441
On 17 January 2020, the Group used the availability of its UK securitisation facility to draw down a further £77.9m of funding.

Garfunkelux Holdco 2 S.A.
Notes to the unaudited condensed consolidated interim financial statements
3 months ended 31 March 2020
19
8. Note to the statement of cashflows
Note
3 months to 31 March 2020
£000
3 months to 31 March 2019
£000
Loss for the period before tax (30,825) (41,754)
Adjustments for:
Income on portfolio investments 4 (101,215) (89,585)
Net portfolio write up 4 (8,295) (28,055)
Portfolio fair value release 4 322 391
Collections on owned portfolios 4 189,674 184,857
Depreciation and amortisation 10,078 9,767
Finance income (9,439) (1,629)
Loss on disposal of property, plant and equipment and intangible assets 128 262
Finance costs 3 61,400 60,066
Unrealised gains from foreign exchange 212 4,248
Increase in trade and other receivables (9,519) (6,752)
Decrease in trade and other payables (6,001) (1,400)
Movement in other net assets 1,740 (505)
Cash generated by operating activities before portfolio acquisitions 98,260 89,911
Portfolios acquired (1) (73,974) (105,710)
Net cash generated by/(used in) operating activities 24,286 (15,799)
Income taxes paid (1,468) (1,087)
Net cash generated by/(used in) operating activities 22,818 (16,886)
(1) Portfolios acquired represents the amount paid for portfolio purchases in the period, taking into account timing
differences

20
Reconciliations
Profit to Cash EBITDA 3 months to
31 March 2020
£000
Loss for the period (23,870)
Net finance costs 51,961
Taxation expense (6,955)
Operating profit 21,136
Portfolio amortisation 88,459
Net portfolio write up (8,295)
Portfolio fair value release 322
Non-recurring costs/exceptional items, net of exceptional income 8,788
Depreciation, amortisation and impairment 10,078
Cash EBITDA 120,488
Cash collections to Cash EBITDA 3 months to
31 March 2020
£000
Cash collections 189,674
Other income 49,692
Operating expenses (137,744)
Non-recurring costs/exceptional items, net of exceptional income 8,788
Depreciation, amortisation and impairment 10,078
Cash EBITDA 120,488
Net cash flow to Cash EBITDA 3 months to
31 March 2020
£000
Increase in cash in the period 10,590
Movement in debt (21,678)
Portfolios acquired 73,974
Interest paid 26,629
Income taxes paid 1,468
Capital expenditure and financial investment 4,012
Payment of lease liabilities 3,265
Cash flow before interest, portfolio purchases, tax expenses and capital expenditure 98,260
Working capital adjustments 13,440
Non-recurring costs/exceptional items, net of exceptional income 8,788
Cash EBITDA 120,488