gas to power in spain - unece · ♦ no. 4 power generation ♦ no. 5 gas distribution 2 ♦ no. 1...
TRANSCRIPT

1
Gas to Power in Spain
16th Anual session of the Working Party UNECE Geneva, January 24th 2006

2
The Gas Natural Group

3
A leading multinational Group in the energy sector which operates across the entire natural gas value chain…
Gas and electricity
assets
Gas transport and gas
infrastructure assets
>380 TWh (252 in Europe and 128 in America)Combination of NATURAL GAS and LNG>40% FOBDemand on both sides of the Atlantic
Maghreb-Europe gas pipeline (136 TWh)8 methane tankers (702,000 m3) + 1 new one in 2007 (138,000 m3)Regasificationplant in Puerto RicoPermits requested for two regasificationplants in ItalyProjects for regasificationplants in North America
Gas distribution network 96,003 Km:
37,839 Spain54,601 LatAm3,563 Italy
Electricity generation in operation:
1,914 MW in Spain271 MW in Puerto Rico
Combined-cycle plants and wind farms under construction and pending permits:
>4,200 MW in Spain250 MW in Puerto Rico
9.7 million:4.9 Spain4.5 LatAm0.3 Italy
1.4 contracts per customer in Spain
Gas supply and demandUpstream
Gas prospecting project in GassiChergui (Algeria)Integrated LNG project in GassiTouil (Algeria)
Customers
Figures at 31st March 2005

4
(30/09/2005)International Presence
MexicoMexico
ColombiaColombia
ArgentinaArgentina
BrazilBrazil
MoroccoMorocco
PortugalPortugal
SpainSpainItalyItaly
Puerto RicoPuerto Rico Algeria
Number of total customersGas Natural Group
9,998,000Spain: 5,003,000
America: 4,690,000Italy: 275,000
Number of total customersGas Natural Group
9,998,000Spain: 5,003,000
America: 4,690,000Italy: 275,000
FranceFrance

5
AAG: 9%
Leader in Spain, a growing market
Natural gas as source of primary energy
15%
Number of customers (m)
Sources of electricity generation
Source: National Energy Plan 2002-2011 and company analysis
Evolution of total gas demand
2004 2011
13%
4%
2002 2004 2006 2008 2010Residential Industrial CCGT
100200300400500
TWh
Coal Nuclear Hydraulic Renewable Fuel Gas
23%30%
15%19%
13% 12%7%
16%
8%
19%
4%
33%
AAG: 9%AAG: 2%
51015202530
2002 2003 2005 2007 2009 2011
%
EU Spain Gas Electricity
28%
23.4
5.7
27.0
7.3
2004 2011 2004 2011

6
Development of the electricity business in Spain
In line with the objective of having 4,800 MW of combined cycles in 2008
Combined cyclesIn operation• 400 MW San Roque• 400 MW St. Adriàde Besòs
• 800 MW Arrúbal• 1,200 MW Escombreras
Under construction• 800 MW Plana del Vent
Permits pending• 400 MW Malaga• 800 MW Port of Barcelona
Wind powerIn operation• 610 MW (~300 MW attributable)
Under development• 1,228 MW
The acquisition of DERSA, a company in Navarre, in April 2005 ensures fulfilment of the Strategic Plan

7
Tender offer for 100% of the share capital of Endesa by Gas Natural

8
Transaction details
Tender offer for 100% of the share capital of Endesa by Gas Natural
Offer consideration: 65.5% in shares and 34.5% cash
€7.34 in cash and 0.569 Gas Natural shares for each Endesa share
Tender offer implies a value of €21.301 for each Endesa share, or a premium of
14.8% to Endesa’s closing price the day before the offer
19.4% to Endesa’s average price over the last 6 months
The offer is conditioned on reaching a minimum 75% of Endesa and on the removal of existing limitations in the by-laws of Endesa (e.g. the 10% voting right limit)
The tender offer envisages two simultaneous processes in Spain and the US
Endesa’s shareholders will benefit from an enhanced strategic positioning while immediately receiving a premium for their shares
Note: 1 Based on Gas Natural’s share price of €24.53 as of 02 September 2005 (last closing, pre-announcement)

08/02/2006 10:46 gasnaturalcs\Roadshow April 2004\Presentacion en
Ingles\20040412 English version9
Announcement and filing with CNMV
Filings to regulator ("CNE") and Antitrust Authority
Regulatory reviewCNE, Antitrust and Government evaluations
Regulatory suspension lifted
Spanish Tender OfferCNMV approval
Tender Offer period
Gas Natural EGM approves capital increase
US registration / Tender OfferAnnouncement
US shareholders receive offer document
Tender Offer period
2005 2006Oct Nov Dec Jan Feb Mar AprSep May
Expected transaction timetable

08/02/2006 10:46 gasnaturalcs\Roadshow April 2004\Presentacion en
Ingles\20040412 English version10
Combined market positions
Global utilities – ranking by customer connections2
Electricity and gas in Spain1No.1
Electricity and gas in LatAmNo.1
Global LNG supplyNo.3
Global customer connections2No.3
A global leader in the energy sector
33.5 32.9 31.2 31.0 27.7
15.2
0
10
20
30
40
Enel E.ON New Group RWE Tokyo Electric GDF
(m)
Note:1 By customers, post proposed disposals 2 Post proposed disposals; listed companies only, presented on consolidated basis; includes only gas and electricity customers; Source: Company estimates

11
Strong and balanced positions in highgrowth markets 1
Notes:1 Data presented post proposed disposals2 Excluding municipal utilities3 Excluding state-owned companiesSource: Company estimates
Italy
♦ No. 4 Power generation♦ No. 5 Gas distribution 2
♦ No. 1 Power supplier♦ No. 1 Power distribution♦ No. 1 Gas distribution♦ No. 2 Power generation
Iberia
LNG
♦ JV with Repsol YPF gives access to LNG reserves
♦ No. 1 Atlantic trade♦ Fleet of 12 LNG tankers
Regasification plant projectExploration blocksExisting regasification plantLiquefication plant project
LNG flows
PipelineProject pipeline
LatAm 3
♦ No. 1 Power generation♦ No. 1 Power distribution♦ No. 1 Gas distribution
Expected LNG flows

12
The Spanish Market

13
Natural gas and power Generation
Because of evident economic and environmental advantages, natural gas will have the leading role for power generation during next decades
0
20
40
60
80
100
120
Lignite
Anthracite
Fuel oil
Gas-oil
Natural
gas
kg C
O2/G
J
CO2 emissions by type of fuel
010203040506070
Nuclear
Fuel oil
Domestic
F. B.
Biomass
LigniteIm
p. F. B
.
CCGT
Euro
s/M
Wh
Production cost by type of technology(5,000 hours per annum, not subsidized
Source: ECBase: Real costs, year 2000
14
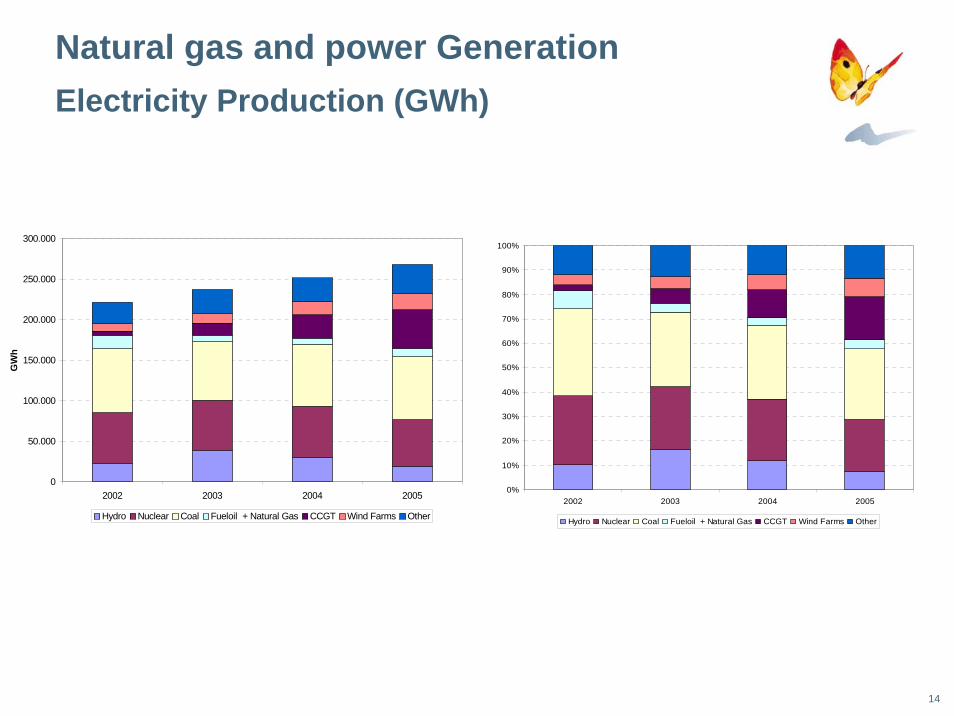
Natural gas and power Generation
0
50.000
100.000
150.000
200.000
250.000
300.000
2002 2003 2004 2005
GW
h
Hydro Nuclear Coal Fueloil + Natural Gas CCGT Wind Farms Other
Electricity Production (GWh)
0%
10%
20%
30%
40%
50%
60%
70%
80%
90%
100%
2002 2003 2004 2005
Hydro Nuclear Coal Fueloil + Natural Gas CCGT Wind Farms Other
15
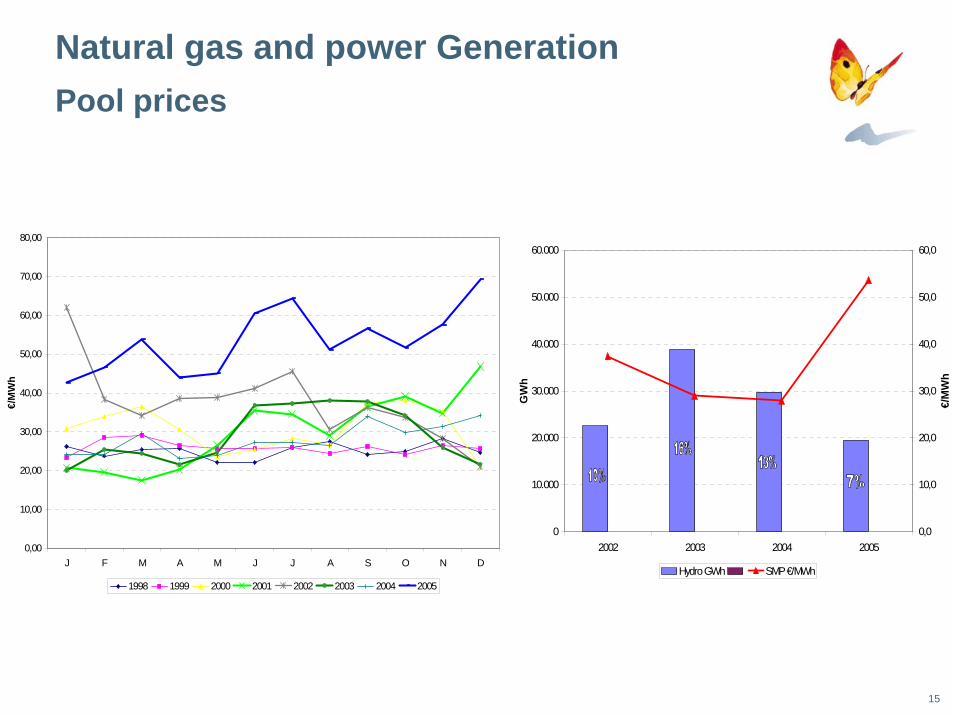
Natural gas and power GenerationPool prices
0
10.000
20.000
30.000
40.000
50.000
60.000
2002 2003 2004 2005
GW
h0,0
10,0
20,0
30,0
40,0
50,0
60,0
€/M
Wh
Hydro GWh SMP €/MWh
0,00
10,00
20,00
30,00
40,00
50,00
60,00
70,00
80,00
J F M A M J J A S O N D
€/M
Wh
1998 1999 2000 2001 2002 2003 2004 2005

16
Natural Gas and Power GenerationMW
0
10.000
20.000
30.000
40.000
50.000
60.000
70.000
80.000
2002 2003 2004 2005
MW
Hydro Nuclear Coal Fueloil + Natural Gas CCGT Wind Farms Other
Expected New CCGT
2006 2007 2008High case 5.200 6.000 1.600Medium case 1.600 1.600 1.600Low case 1.600 1.600 1.200

17
Natural Gas Demand in Spain
Source: Spanish Economy Office
• Spanish market, unlike other European markets, has not reached maturity yet. Natural gas share is low compared to the EU average of 24%.
• Expected consumption increase amounts 26 bcm (18 bcm in 2001 vs 44 bcm in 2011), 60% of total increase (15 bcm) is due to the development of CCGT.
05
1015202530
2001 2002 2004 2006 2008 2011
%
EU Spain
CAGR: 9%
Natural gas in primary energy consumption
CAGR: 2%
0
10
20
30
40
50
2001 2003 2005 2007 2009 2011
Bcm
Conventional Demand CCGT
Evolution of total gas demand

18
Possible scenario of gas supply to EU 2011
Algeria
Trinidad Tobago
Nigeria
North Sea
Libya EgyptIran
Yemen
QatarOmanAbu
Dhabi
Angola/Guinea
FSU

19
Spanish Gas Market: an LNG market
• To cover the expected demand, new contracts need to be signed with existing and new suppliers.
• Particularly, to satisfy demand in 2006-2010 new gas supplies willbe contracted.
• Future gas supplies will be mainly LNG. Natural gas pipeline will be restricted to the existing Norwegian and Maghreb pipelines. Only a new direct line from Algeria could be considered.
• In order to accommodate new LNG deliveries the existing infrastructure is being expanded (regasification plants of Barcelona, Cartagena, Huelva and Bilbao), 2 new regasification plants under construction, Sagunto (2006) and Mugardos (2006) and 2 more in the project phase, Tenerife and Gran Canaria.

20
LNG demand in Spain
• Spain is the third LNG consumer country in the world, with 2/3 of total gas consumption supplied by LNG
Japan 79,8 100%South Korea 26,2 100%Spain 15,0 63%USA 14,4 2%France 9,9 22%
LNG Consumption
bcm
LNG as % of Total
Supplies

21
Supplies to Spain Evolution by source
0%
10%
20%
30%
40%
50%
60%
70%
80%
90%
100%
1997 2004
Domestic Prod. Algeria GN Norway Algeria LNG Lybia Persian Gulf Nigeria Others
NG
LNG

22
Regasification capacity: planned expansion
Total regas capacity:13,5 bcm/y
Huelva3 bcm/y
Cartagena3 bcm/y
Barcelona7,5 bcm/y
Huelva
Cartagena/
Barcelona
Total regas capacity:13,5 bcm/y
Huelva3 bcm/y
Cartagena3 bcm/y
Barcelona7,5 bcm/y
Huelva
Cartagena/
Barcelona
2001 2011
Mugardos5 bcm/y
Bilbao7,5 bcm/y
Huelva8 bcm/y
Cartagena9 bcm/y
Sagunto5 bcm/y
Barcelona11 bcm/y
Mugardos/
Bilbao/y
Huelva
Cartagena/
Sagunto/
Barcelona
Total regas capacity:40-60 bcm/y
2001 2011

23
Spanish Gas Market: an LNG market
OPERATING TERMINALSBARCELONA (EXPANSION)CARTAGENA (EXPANSION)HUELVA (EXPANSION)BBG (BILBAO)
UNDER PROJECT / CONSTRUCTIONSAGUNTO (VALENCIA)REGANOSA (LA CORUÑA)CANARY ISLANDS
PORTUGAL:SINES
New Scenarios could facilitate Gas to Gas CompetitionNew LNG SuppliesNew LNG Gates:
FERROL
A CORUÑA
PONTEVEDRA
LUGO
ORENSE
OVIEDO
BILBAO
SANTANDER
PAMPLONA
LOGROÑO
SORIA
BURGOSPALENCIA
VALLADOLID
LEÓN
SEGOVIASALAMANCA
ZAMORA
AVILA MADRIDGUADALAJARA
CUENCA
ALBACETECI UDAD REAL
TOLEDOCÁCERES
BADAJOZ
HUESCA
ZARAGOZA
TERUEL
GIRONA
BARCELONALLEIDA
TARRAGONA
CASTELLÓN
VALENCIA
ALICANTE
MURCIA
ALMERÍAGRANADA
JAÉN
MÁLAGA
CÓRDOBA
CÁDIZ
HUELVASEVILLA
VITORIA
PALMA DE MALLORCA
SINES
SANTA CRUZ DE TENERIFE
LAS PALMAS
(4)
(2)(2)
S. SEBASTIAN
CARTAGENA
1º 1º
4º 5º
1º 2º
2º1º
4º 5º
6º
Group C
Group A,B1
Group B2
Existing infrastructure
Basic Gas Infrastructure
Regasification Plant
Compression Station
National Gas Field
Underground Gas Storage
5º
3º
3º
1º 2º
5º
3º
3º
1º 2º
Current infrastructure
Under construction
Urgent infrastructure
8º 9º7º

24
• PROJECTS UNDER EUROPEAN UMBRELLA• LNG AS KEY SUPPLY• SWAP AND ARBITRAGE OPPORTUNITIES
LNG HUB
PIPEGAS HUB
PanEuropean New Hubs: Spain Key LNG Player

25
(2)
(2)
(2)
(1)(1)
(3)
(5)
(2)
(2)
(3)
(2)
(4)
m12
entry/exit points
> 80 bcm
Spanish Gas Market: LNG Hub

26
Spanish Gas Market: Pricing
Supplier Client
Price Brent/SMP related???
Henry HubNBPBrentSMP
Due to the LNG important share in the supply matrix, price would be strongly influenced by global LNG markets
27
Thank You