gas transport properties in polycarbonate
TRANSCRIPT
GAS TRANSPORT PROPERTIES IN POLYCARBONATE
------
INFLUENCE OF THE COOLING RATE, PHYSICAL AGING, AND ORIENTATION
by
Christelle M. Laot
Dissertation submitted to the Faculty of the
Virginia Polytechnic Institute and State University
in partial fulfillment of the requirements for the degree of
Doctor of Philosophy
in
Chemical Engineering
Dr. Eva Marand, Chair
Dr. Richey M. Davis
Dr. Hervé Marand
Dr. Ravi Saraf
Dr. Garth L. Wilkes
October 17th, 2001
Blacksburg, Virginia
Keywords: polycarbonate, gas transport, free volume, permeation, permeability, solubility, diffusion, cooling rate, physical aging.
Copyright 2001, Christelle M. Laot
GAS TRANSPORT PROPERTIES IN POLYCARBONATE
------ INFLUENCE OF THE COOLING RATE,
PHYSICAL AGING, AND ORIENTATION
Christelle M. Laot Department of Chemical Engineering
Virginia Polytechnic Institute and State University Blacksburg, VA 24061-0211
ABSTRACT
The objective of this research work was to understand the molecular mechanism
of gas transport through amorphous glassy polymers. Especially, emphasis was placed on
determining whether or not gas transport in amorphous glassy polymers is directly
correlated with the free volume content. Free volume arguments are indeed commonly
used to explain the gas transport process.
The gas transport properties of bisphenol-A polycarbonate films were examined
as a function of the cooling rate, physical aging, and orientation. Such conditions affect
the free volume content and its size and shape distribution. Results obtained from
permeation experiments were accompanied with dynamic mechanical and density
measurements.
The experimental results suggest that the diffusion coefficient of small gas
molecules in glassy polycarbonate is influenced by the local dynamics or mobility of the
polymer chains rather than by the overall free volume content. Indeed, the diffusion
coefficient of N2 for instance was reduced in fast-cooled samples, despite of the fact that
those samples possessed a greater overall free volume content. Fast cooling rates may
generate highly restricted conformations which hinder local motions, and therefore tend
to increase the activation energy of diffusion. As expected, the greater the free volume
content, the greater was the solubility coefficient. The increase in the polymer relaxation
times with aging time is believed to restrict the local chain motions, leading to enhanced
activation energies of diffusion, and therefore to reduced diffusion coefficients. The
change in the solubility coefficients with physical aging revealed that the aging process

Abstract ii
might not affect all the cavity sizes in polycarbonate equally. According to free volume
arguments, one would anticipate that the physical aging of fast-cooled samples (which
possess more free volume) should be enhanced compared to that of slowly-cooled
samples. Quite interestingly, the decrease in the diffusion coefficient with aging was
found to occur much slower in fast-cooled samples, despite of the higher initial free
volume content. In contrast, properties directly related to the free volume content, such as
density or isothermal DMTA measurements actually showed a greater aging rate in the
sample containing the greatest amount of free volume. Slow-cooled samples that are in a
low energy conformational state may loose their internal degrees of freedom more
rapidly, due to the closer interchain packing and the possibly restricted segmental
motions. Studies dealing with orientation and gas transport were complicated by several
factors. For instance the fact that the permeation experiments were performed
perpendicularly to the orientation of the chains and not along the orientation axis limited
the sensitivity of the gas transport properties to orientation.
This work points out that dynamic rather than static models should be developed
to predict the gas transport phenomenon.

Acknowledgments I would like to thank the following people for their help and support in conducting this research:
• Dr. Eva Marand, my advisor at Virginia Tech, for her support throughout the five years I have spent in the United States. I acknowledge Dr. Marand’s efforts to provide the funding for this research project. I have especially appreciated the freedom she gave me to perform the research that interested me, and to allow me to finish my dissertation in Europe.
• Dr. Chris Cornelius for his many excellent comments and suggestions, for his continuing interest in this research project, and most of all for his friendship.
• Dr. Richey M. Davis, Dr. Hervé Marand, Dr. Ravi Saraf, and Dr. Garth L. Wilkes for all their constructive critique which helped me to improve my work.
• I thank all other colleagues and fellow students who have to remain unnamed here.
I owe much to Bayer AG (Leverkusen, Germany) for giving me the opportunity of working as a research scientist in polymer physics. They put their trust in me before I received the doctorate. Finally I would like to thank the following people:
• My friends, especially Xianqin, for all their encouragements and friendship. • My parents and my brothers Philippe and Gérald for their support and love
throughout my studies over the years. • Thomas for his support, encouragements, patience, and love while writing this
dissertation.

Table of Contents Abstract ................................................................................................................................i Acknowledgments..............................................................................................................iii Table of Contents ...............................................................................................................iv List of Figures .....................................................................................................................x List of Tables..................................................................................................................xxiv Chapter 1 - Introduction...............................................................................1
1.1 Motivation and objectives..............................................................................1 1.2 Proposal..........................................................................................................5 1.3 Outline............................................................................................................8
1.4 References......................................................................................................9
Chapter 2 - Background on gas transport ............................................... 13
2.1 Introduction..................................................................................................13
2.2 Transport parameters....................................................................................13 2.2.1 The permeability coefficient P ......................................................14 2.2.2 The solubility coefficient S ...........................................................15 2.2.3 The diffusion coefficient D ...........................................................17
2.3 Influence of the polymer structure on gas transport ....................................18
Table of Contents v
2.3.1 Free volume...................................................................................19 2.3.2 Others ............................................................................................19
2.4 Gas sorption in amorphous polymers ..........................................................21
2.4.1 Introduction ...................................................................................21 2.4.2 The Dual Mode Sorption (DMS) model .......................................23
2.4.2.1 The Henry's Law (rubbery polymers) ...............................23 2.4.2.2 The Langmuir-type sorption..............................................24 2.4.2.3 The DMS model ................................................................24
2.5 Permeation experiments...............................................................................28
2.6 References....................................................................................................34 Chapter 3 - Literature review on physical aging and orientation,
and their effects on the gas transport properties ................ 40
3.1 Introduction..................................................................................................40
3.2 Physical aging ..............................................................................................40 3.2.1 Origin and typical aspects .............................................................41
3.2.1.1 Origin ................................................................................41 3.2.1.2 Typical aspects ..................................................................45
3.2.2 Macrostructural and microstructural properties ............................46 3.2.2.1 Macrostructural relaxation ................................................47
3.2.2.1.1 Volume relaxation ...........................................47 3.2.2.1.2 Enthalpy relaxation .........................................48 3.2.2.1.3 Mechanical and dielectric responses ...............50 3.2.2.1.4 Conclusions .....................................................50
3.2.2.2 Microstructural aspects .....................................................51 3.2.2.2.1 Electron spin resonance (ESR)........................51 3.2.2.2.2 Fluorescence spectroscopy..............................52 3.2.2.2.3 Positron annihilation .......................................52 3.2.2.2.4 Photochromic probes and labels......................54 3.2.2.2.5 Infrared and Raman spectroscopies.................54 3.2.2.2.6 Other methods .................................................55
3.2.2.3 Conclusions .......................................................................55 3.2.3 Physical aging: what is known and what remains to be known....56
3.2.3.1 What is known...................................................................56 3.2.3.2 What remains to be known................................................57
3.2.4 Physical aging of polycarbonate ...................................................61
3.3 Orientation ...................................................................................................62
3.4 Physical aging and gas transport..................................................................63

Table of Contents vi
3.5 Orientation and gas transport .......................................................................66
3.6 References....................................................................................................70 Chapter 4 – Experimental details ............................................................. 80
4.1 Introduction..................................................................................................80
4.2 The materials................................................................................................80 4.2.1 The polycarbonate .........................................................................81 4.2.2 Gel permeation chromatography (GPC) .......................................82 4.2.3 Polycarbonate film preparation from pellets.................................83
4.3 The instrumental methods............................................................................86 4.3.1 Permeation.....................................................................................87 4.3.2 Dynamic mechanical thermal analysis (DMTA) ..........................93 4.3.3 Density .........................................................................................95 4.3.4 Birefringence.................................................................................99 4.3.5 Fourier transform infrared spectroscopy (FTIR).........................101
4.4 Analysis of the gas permeation data ..........................................................104
4.4.1 The gas permeation data..............................................................104 4.4.2 Determination of the gas transport coefficients (P, D, S) ...........105 4.4.3 Determination of the gas transport activation energies
(EP, ED��û+S)................................................................................109 4.4.4 Others .......................................................................................113
4.5 Conclusions................................................................................................116
4.6 References..................................................................................................117
Chapter 5 – Is the transport of gas molecules through polymers
directly related to the amount of free volume? ............... 121
5.1 Introduction................................................................................................121
5.2 Experimental details...................................................................................122 5.2.1 The materials ...............................................................................122 5.2.2 The instrumental methods ...........................................................123
5.3 Results and discussion ...............................................................................124 5.3.1 Density results .............................................................................125 5.3.2 DMTA results..............................................................................126
5.3.2.1 Tg .....................................................................................126 5.3.2.2 Frequency activation energy ...........................................128 5.3.2.3 WLF parameters and fragility concepts ..........................130

Table of Contents vii
5.3.2.3.1 WLF parameters............................................130 5.3.2.3.2 Fragility concepts ..........................................137 5.3.2.3.3 Summary .......................................................140
5.3.3 Permeation results .......................................................................143 5.3.3.1 Determination of the gas transport coefficients (P, D, S)...........................................................................143 5.3.3.2 Determination of the gas transport activation energies
(EP, ED, û+S) .................................................................146
5.4 Conclusions................................................................................................149 5.5 References..................................................................................................152
Chapter 6 – Effect of the cooling rate on the gas transport properties
of polycarbonate ................................................................. 155
6.1 Introduction................................................................................................155 6.2 Experimental details...................................................................................157
6.2.1 The materials ...............................................................................157 6.2.2 The instrumental methods ...........................................................161
6.3 Results and discussion ...............................................................................162 6.3.1 Density results .............................................................................162 6.3.2 DMTA results..............................................................................163 6.3.3 Density / DMTA results ..............................................................171 6.3.4 Permeation results .......................................................................175
6.3.4.1 Determination of the gas transport coefficients (P, D, S)...........................................................................175 6.3.4.2 Fractional free volume (FFV) calculations .....................188 6.3.4.3 Analysis of the permeation data in terms of the
predicted FFV..................................................................198 6.3.4.4 Determination of the gas transport activation energies
(EP, ED, û+V��DQG�WKH�SUHH[SRQHQWLDO�IDFWRUV (Po, Do, So)........................................................................204 6.3.4.4.1 The gas transport activation energies
(EP, ED, ûHs).................................................204 6.3.4.4.2 The preexponential factors (Po, Do, So) .........209 6.3.4.4.3 Summary of the permeation results...............211
6.3.4.5 Verification of the relationship between ED and Do........213 6.3.4.6 Determination of the average distances
between polymer chains ................................................215
6.4 Conclusions................................................................................................217 6.5 References..................................................................................................219

Table of Contents viii
Chapter 7 – Physical aging in amorphous glassy
bisphenol-A polycarbonate as revealed by gas transport measurements ............................................. 227
7.1 Introduction................................................................................................227 7.2 Experimental details...................................................................................230
7.2.1 The materials ...............................................................................230 7.2.2 The instrumental methods ...........................................................233
7.3 Results and discussion ...............................................................................235 7.3.1 Annealing temperature determination.........................................235 7.3.2 Density results .............................................................................236 7.3.3 FTIR results.................................................................................237 7.3.4 DMTA results..............................................................................238
7.3.4.1 Physical aging characterization.......................................238 7.3.4.2 Memory effects characterization.....................................242 7.3.4.3 Isothermal experiments ...................................................243
7.3.5 Permeation results .......................................................................246 7.3.5.1 Physical aging characterization.......................................247 7.3.5.2 Aging results as a function of time..................................248 7.3.5.3 Cooling rate / aging results..............................................252 7.3.5.4 Permeation data discussion .............................................255 7.3.5.5 Activation energies..........................................................261 7.3.5.6 Other................................................................................263
7.4 Conclusions................................................................................................264 7.5 References..................................................................................................265
Chapter 8 – Effect of orientation on the transport of gas molecules
through amorphous glassy bisphenol-A polycarbonate . 269
8.1 Introduction................................................................................................269 8.2 Experimental details...................................................................................271
8.2.1 The materials ...............................................................................271 8.2.2 The instrumental methods ...........................................................272
8.2.2.1 Stretching ........................................................................272 8.2.2.2 Density ............................................................................276 8.2.2.3 FTIR ................................................................................276 8.2.2.4 Birefringence...................................................................276 8.2.2.5 DMTA .............................................................................277 8.2.2.6 Permeation.......................................................................278

Table of Contents ix
8.3 Results and discussion ...............................................................................279 8.3.1 FTIR results.................................................................................279 8.3.2 Orientation results .......................................................................281
8.3.2.1 Background .....................................................................282 8.3.2.2 Hermans’ orientation function results .............................283 8.3.2.3 Comparison between λ and f values ...............................285
8.3.3 Density results .............................................................................287 8.3.3.1 Isotropic samples.............................................................287 8.3.3.2 Anisotropic samples ........................................................288
8.3.4 DMTA results..............................................................................291 8.3.5 Permeation results .......................................................................294
8.3.5.1 Isotropic samples.............................................................295 8.3.5.1.1 Determination of the gas transport
coefficients (P, D, S) .....................................295 8.3.5.1.2 Determination of the gas transport
activation energies (EP, ED, û+S)..................297 8.3.5.2 Anisotropic samples ........................................................299
8.3.5.2.1 Determination of the gas transport coefficients (P, D, S) .....................................299
8.3.5.2.2 Determination of the gas transport activation energies (EP, ED��û+S)..................306
8.3.6 Orientation and physical aging....................................................309
8.4 Conclusions................................................................................................314 8.5 References..................................................................................................315
Chapter 9 – Summary and recommendations for future work ........... 318
9.1 Summary of the results ..............................................................................318
9.2 Recommendations for future work ............................................................322
9.3 References..................................................................................................329 Vita ..................................................................................................................................333

List of Figures Chapter 1 Figure 1.1: Trends reported in the literature for polymers with different structures. As
the free volume content increases, P and D increase, and EP and ED decrease ........................................................................................................................3 Figure 1.2: Schematic showing that two specimens can have the same free volume
content, but completely different distributions. For instance, a volume of 21cm3 can be represented by 1 hole of 21cm3, or by 7 holes of 3cm3
each ................................................................................................................3 Figure 1.3: Puzzle showing the strategy adopted in this research to solve the research
objective.........................................................................................................4 Chapter 2 Figure 2.1: Schematic of the sorption apparatus ............................................................22 Figure 2.2: The DMS model is a combination of the Henry's law and the Langmuir
isotherm........................................................................................................25 Figure 2.3: C versus p for the DMS model ....................................................................26 Figure 2.4: Schematic of the integral method (pf>pp) ....................................................29 Figure 2.5: Profile obtained by permeation....................................................................29 Figure 2.6: Volume of thickness dx considered in the mass balance.............................30 Figure 2.7: Plot of Qt versus t showing the steady state part and the time lag θ ............33 Chapter 3 Figure 3.1: Schematic of property X (V, H, S) as a function of temperature showing the
non-equilibrium excess free volume present in glassy polymers ................43 Figure 3.2: Schematic showing the various values of the Hermans’ orientation function
f. The value of f varies from 1 (parallel orientation to the uniaxial direction) to 0 (random) to –0.5 (perpendicular). MD and TD stand for the machine

List of Figures xi
and the transverse directions, respectively. The lines at f = -0.5 and f = 1 correspond to fully oriented polymer chains. ..............................................63
Chapter 4 Figure 4.1: Chemical structure of bisphenol-A polycarbonate ......................................81 Figure 4.2: 3-dim simulation of a portion of the bisphenol-A polycarbonate chain. The
simulation was obtained using the ChemWindow Spectroscopy software ......................................................................................................................81 Figure 4.3: Summary of the film processing steps .........................................................84 Figure 4.4: Schematic of the action taken to give the same thermal history to all the
compression-molded polymeric films. The cooling rate was typically chosen as 40oC/min. The room temperature was maintained at 30oC. 15min were assumed to be sufficient to remove thermal history ....................................86
Figure 4.5: Schematic of the integral permeation method (left). pf is the feed pressure, pp the permeate pressure, and l the thickness of the membrane. The profile obtained while running permeation experiments is shown on the right side of the figure..................................................................................................87
Figure 4.6: Schematic of the permeation apparatus .......................................................89 Figure 4.7: Schematic of the permeation cell .................................................................90 Figure 4.8: Cut view of the permeation cell ...................................................................91 Figure 4.9: Limit of linear viscoelasticity in polycarbonate as measured by using the
DMTA in the transient tensile mode at 27oC. The strain rate was chosen as 50 s-1 .............................................................................................................95
Figure 4.10: Schematic of the density gradient column. The heavy and light solutions were prepared by mixing sodium bromide salt and distilled water. The column itself was placed in a water bath maintained at 18oC......................96
Figure 4.11: Calibration curve for the linear density gradient column at 18oC using three glass balls of well-known densities..............................................................99
Figure 4.12: Schematic of what is observed while doing birefringence experiments. The schematics represent what is observed for a reference sample (left), an isotropic sample (middle), and an anisotropic sample (right). The aspect of the polymer chains is sketched at the top...................................................100
Figure 4.13: Schematic of the ATR apparatus. The polymer with a refractive index n2 was placed on a ZnSe ATR crystal with a refractive index n1. A piece of rubber was placed between the polymer and a hard metal plate. Some stress was applied on the metal plate to ensure good contact between the polymer and the ATR crystal. The incident beam entered the ATR crystal from one side and was totally reflected in the center of the crystal...........................103
Figure 4.14: Penetration depth dp of ATR as a function of the angle of incidence θ for different wavenumbers. The critical angle was calculated to be 40.92o. The refractive indices of the ZnSe ATR crystal and the polycarbonate were taken as 2.42 and 1.585, respectively ..................................................................103
Figure 4.15: Permeation response at 35oC as a function of the permeation time for the Aldrich polymer cooled at 40oC/min. The kinetic diameters (in Å) of the

List of Figures xii
gases of interest (He, O2, and N2) are given into brackets. Two measurements are plotted to show the reproducibility ..............................104
Figure 4.16: Plot of Qt versus t showing the steady state part and the time lag θ ..........106 Figure 4.17: ln (slope/T) as a function of 1/RT for He. The slope corresponds to the
activation energy for permeation and was determined in this case to be 14351 J/mol (R = -0.99997, SD = 0.00288). The Aldrich polymer was cooled at 40oC/min. The permeation temperatures were chosen as 35, 55, 65, and 80oC .....................................................................................................109
Figure 4.18: -ln(6θ) as a function of 1/RT for O2. The slope corresponds to the activation energy for diffusion and was determined in this case to be 32284 J/mol (R = -0.99899, SD = 0.03715). The Aldrich polymer was cooled at 40oC/min
....................................................................................................................110 Figure 4.19: ln ((slope/T)*(6θ)) as a function of 1/RT for O2. The slope corresponds to
the enthalpy of sorption and was determined in this case to be equal to -16683 J/mol (R = 0.99584, SD = 0.03912). The Aldrich polymer was cooled at 40oC/min ................................................................................................112
Figure 4.20: Selectivity as a function of temperature for the different gas pairs. The selectivity was calculated by dividing the average slopes of the permeation response of the two gases of interest at steady state. The temperatures were 35, 55, 65, and 80oC. The Aldrich polymer was cooled at 40oC/min........114
Figure 4.21: ln slope as a function of 1/RT for He. The slope corresponds to the apparent activation energy and was determined in this case to be 17086 J/mol (R = -0.99997, SD = 0.00355). The Aldrich polymer was cooled at 40oC/min
....................................................................................................................115 Figure 4.22: ln selectivity as a function of 1/RT for the He/N2 gas pair. The selectivity
was calculated by dividing the average slopes of the permeation response of the two gases at steady state. The slope corresponds to the difference in apparent activation energies between N2 and He and was determined to be equal to 6022 J/mol (R = 0.99964, SD = 0.00415)....................................115
Figure 4.23: Apparent activation energy as a function of the kinetic diameter. The kinetic diameters of He, O2, and N2 are reported as 2.6, 3.46, and 3.64Å, respectively [45-48] ...................................................................................116
Chapter 5 Figure 5.1: Densities of the two polymers selected in this study. The densities were
measured at 18oC using a density gradient column ...................................125 Figure 5.2: Densities of the two polymers selected in this study as a function of the
fractional free volume calculated from Bondi’s method. The densities were measured at 18oC using a density gradient column ...................................126
Figure 5.3: Loss modulus as a function of temperature for the polymers studied in this research. Both polymers were heated at 165oC for 15min and cooled at 40oC/min prior to DMTA experiments, unless indicated. The DMTA conditions were the following: frequency = 1Hz, strain = 0.025%, initial temperature = 25oC, heating rate = 2oC/min, static force = 22g. The

List of Figures xiii
maximum of the loss modulus was taken as the glass transition temperature. ....................................................................................................................128
Figure 5.4: Loss modulus of the Aldrich polycarbonate as a function of temperature for different frequencies (0.5, 3, and 10Hz). The DMTA conditions were the following: strain = 0.025%, heating rate = 1oC/min, static force = 40g, clamp force = 10cNm, initial temperature = 25oC.....................................129
Figure 5.5: ln frequency versus (1/RT*) (see Figure 5.4 for experimental details). T* was determined from the maximum of the E” peak. The slope corresponded to -∆Ha, ∆Ha being the frequency activation energy ................................129
Figure 5.6: Storage modulus E’ of the Aldrich polycarbonate as a function of temperature for eight different frequencies (namely 0.5, 0.75, 1, 3, 5, 10, 14, and 18Hz). The DMTA conditions were the followings: strain = 0.0125%, soak time = 240s, data collected every 1oC, initial temperature = 140oC, static force = 2g..........................................................................................133
Figure 5.7: Storage modulus E’ of the Aldrich polycarbonate as a function of frequency for different temperatures (see Figure 5.6 for experimental details) .........133
Figure 5.8: Master curves of the Aldrich polymer based on E’, E”, and D”. The reference temperature was chosen as 154oC..............................................134
Figure 5.9: (1/(log aT)) versus (1/(T-Tref)) for the Aldrich polycarbonate. The reference temperature was chosen as 154oC. Linear regression analysis led to values of 12.32 and 48.04 for C1
o and C2o, respectively (R = -0.99973, SD =
0.02281) .....................................................................................................135 Figure 5.10: Non-linear regression for the Aldrich polymer using the Levenberg-
Marquardt algorithm. The initial fitting values were taken as the “universal” constants, namely 17.4 and 51.6K. The curvefit was typically successfully progressed in four rounds. The values obtained for C1
o and C2o were given
as 11.74 and 43.55, respectively (χ2 = 0.00422). The reference temperature was chosen as 154oC..................................................................................136
Figure 5.11: Non-linear regression for the GE polymer using the Levenberg-Marquardt algorithm. The initial fitting values were taken as the “universal” constants, namely 17.4 and 51.6K. The curvefit was typically successfully progressed in four rounds. The values obtained for C1
o and C2o were then given as
15.86 and 76.15, respectively (χ2 = 0.01056). The reference temperature was chosen as 158oC..................................................................................137
Figure 5.12: ln aT versus 1/T for the Aldrich polymer. The apparent activation energy for viscoelastic relaxation can be calculated at each temperature by taking the tangent of the slope at that particular temperature, and by dividing it by the gas constant R. The reference temperature was chosen as 154oC .............140
Figure 5.13: Permeability coefficients of the Aldrich and the GE polymers. The permeation experiments were performed at 35oC. The applied pressures were maintained at 2.5atm for He, and 3.9atm for O2 and N2 ...................144
Figure 5.14: Diffusion and solubility coefficients of N2 for the Aldrich and the GE polymers. The permeation experiments were performed at 35oC. The applied pressure was maintained at 3.9atm................................................145

List of Figures xiv
Figure 5.15: Diffusion and solubility coefficients of O2 for the Aldrich and the GE polymers. The permeation experiments were performed at 35oC. The applied pressure was maintained at 3.9atm................................................145
Figure 5.16: EP of the two polymers of interest for He, O2, and N2. The permeation experiments were successively performed at 35, 55, 65, and 80oC. The applied pressures were maintained at 2.5atm for He, and 3.9atm for O2 and N2 ...............................................................................................................147
Figure 5.17: ED of the two polymers of interest for O2 and N2. The permeation experiments were successively performed at 35, 55, 65, and 80oC. The applied pressure was maintained at 3.9atm for O2 and N2.........................147
Figure 5.18: û+V� RI� WKH� WZR� SRO\PHUV� RI� LQWHUHVW� IRU� 22 and N2. The permeation experiments were performed at 35, 55, 65, and 80oC. The applied pressure was maintained at 3.9atm for O2 and N2....................................................148
Figure 5.19: ED versus zg for the two polymers selected in this study and for N2 .........148 Chapter 6 Figure 6.1: Schematic of the temperature program. The polycarbonate films were
heated from room temperature (30oC) to 165oC at a heating rate of 40oC/min, kept at 165oC for 15min to remove thermal history, and cooled with the internal fan oven at several controlled rates to room temperature
....................................................................................................................158 Figure 6.2: Temperature measured inside the oven for a programmed cooling rate of
0.5oC/min. The samples were heated at 165oC for 15min and cooling was monitored with time. The cooling rate was found to be a linear function of time ............................................................................................................159
Figure 6.3: Temperature measured inside the oven for a programmed cooling rate of 10oC/min. The samples were heated at 165oC for 15min and cooling was monitored with time. The cooling rate was found to be a linear function of time ............................................................................................................160
Figure 6.4: Temperature measured inside the oven for a programmed cooling rate of 40oC/min. The samples were heated at 165oC for 15min and cooling was monitored with time. The cooling rate was found to decay exponentially with time. The initial drop indicated by the line was determined to be 43.8oC/min, instead of the 40oC/min expected for the chosen cooling rate. The error on the reading was 1oC ..............................................................160
Figure 6.5: Density as a function of the cooling rate (note that the x-axis is not a continuous axis). The densities were measured at 18oC using a linear density gradient column .........................................................................................163
Figure 6.6: Loss modulus E” as a function of temperature for the samples cooled at different cooling rates. The DMTA conditions were the following: frequency = 1Hz, strain = 0.025%, heating rate = 2oC/min, static force = 33g, clamp force = 10cNm, initial temperature = 25oC.............................165
Figure 6.7: Glass transition temperature Tg (oC) versus rate of cooling (oC/min) (note that the x-axis is not a continuous axis). The Tg was determined from the maximum of the loss modulus E” peak. The DMTA conditions were the

List of Figures xv
following: frequency = 1Hz, strain = 0.025%, heating rate = 2oC/min, static force = 33g, clamp force = 10cNm, initial temperature = 25oC ................165
Figure 6.8: Typical schematic showing the influence of the rate of cooling r on the value of the Tg (r1>r2). The results are obtained by cooling the polymer from the rubbery to the glassy state. The Tg appears to be lower for the lower cooling rate.................................................................................................167
Figure 6.9: Normalized loss modulus E” traces. The traces of Figure 6.6 were normalized to read unity at Tg (see Figure 6.6 for experimental details). The dotted lines correspond to various values of the loss modulus..................169
Figure 6.10: Breadth of the normalized loss modulus peak in oC as a function of the cooling rate for different values of E” (note that the x-axis is not a continuous axis). See Figure 6.6 for experimental details .........................170
Figure 6.11: Value of the normalized loss modulus as a function of the cooling rate for different temperatures at or below Tg (note that the x-axis is not a continuous axis). The error on the reading was negligible. The Tg’s of the samples cooled at 0.5oC/min, 10oC/min, 40oC/min, and by the external fan were taken as 153.57oC, 153.41oC, 153.32oC, and 152.79oC, respectively....................................................................................................................170
Figure 6.12: Normalized E” as a function of Tg ± T (oC) for different cooling rates showing the asymmetry of the loss modulus peak (see Figure 6.6 for experimental details) ..................................................................................171
Figure 6.13: Glass transition temperature Tg versus density. The Tg was obtained from DMTA measurements. The density was determined at 18oC using a linear density gradient column.............................................................................173
Figure 6.14: Breadth of the E” peak as a function of density for various E” values. The DMTA traces were normalized to read unity at Tg (see previous figures for details). The densities were measured at 18oC using a linear density gradient column. The breadth was observed to be directly related to the density. Only one linear regression is shown on the figure for clarity, but the same behaviors were observed for all the E” values...........................................174
Figure 6.15: Breadth of the E” peak as a function of Tg for various E” values. The DMTA traces were normalized to read unity at Tg (see previous figures for details). The Tg was determined from the maximum of the loss modulus E” . ....................................................................................................................174
Figure 6.16: Permeability coefficient P for He, O2, and N2 as a function of the cooling rate (note that the x-axis is not a continuous axis). The permeation experiments were performed at 35oC. The applied pressures were fixed at about 2.5atm for He, and 3.9atm for O2 and N2.........................................176
Figure 6.17: Diffusion coefficient D and solubility coefficient S for O2 as a function of the cooling rate (note that the x-axis is not a continuous axis). The permeation experiments were performed at 35oC. The applied pressure was fixed at about 3.9atm for O2.......................................................................177
Figure 6.18: Diffusion coefficient D and solubility coefficient S for N2 as a function of the cooling rate (note that the x-axis is not a continuous axis). The permeation experiments were performed at 35oC. The applied pressure was fixed at about 3.9atm for N2.......................................................................178

List of Figures xvi
Figure 6.19: Schematic of the diffusion activated jumps ...............................................179
Figure 6.20: Schematic of the relaxation time distribution ............................................181
Figure 6.21: % change in permeability coefficient for He (note that the x-axis is not a continuous axis). The data obtained for a cooling rate of 0.5oC/min were taken for reference. A positive percent change corresponds to an increase in the coefficient, a negative one to a decrease..............................................185
Figure 6.22: % change in permeability, diffusion, and solubility coefficients for O2 (note that the x-axis is not a continuous axis). The data obtained for a cooling rate of 0.5oC/min were taken for reference. A positive percent change corresponds to an increase in the coefficient, a negative one to a decrease....................................................................................................................186
Figure 6.23: % change in permeability, diffusion, and solubility coefficients for N2 (note that the x-axis is not a continuous axis). The data obtained for a cooling rate of 0.5oC/min were taken for reference. A positive percent change corresponds to an increase in the coefficient, a negative one to a decrease....................................................................................................................186
Figure 6.24: Chemical structure of polycarbonate divided into chemical groups..........194 Figure 6.25: FFV at 18oC as a function of the cooling rate (note that the x-axis is not a
continuous axis). The FFV was calculated from both the Bondi and the Park & Paul methods..........................................................................................195
Figure 6.26: FFV at 18oC as a function of the cooling rate (note that the x-axis is not a continuous axis). The FFV was calculated from Bondi’s method.............196
Figure 6.27: FFV at 18oC as a function of the cooling rate (note that the x-axis is not a continuous axis). The FFV was calculated from the Park & Paul method for N2 ...............................................................................................................196
Figure 6.28: FFV at 18oC as a function of the cooling rate (note that the x-axis is not a continuous axis). The FFV was calculated from the Park & Paul method for O2 ...............................................................................................................197
Figure 6.29: FFV at 18oC as a function of the cooling rate (note that the x-axis is not a continuous axis). The FFV was calculated from the Park & Paul method for He...............................................................................................................197
Figure 6.30: Diffusion coefficient D (cm2/s) as a function of the fractional free volume FFV (%). Diffusion results were obtained at 35oC. The density values were corrected to obtain FFV at 35oC as well ....................................................200
Figure 6.31: Plots of ln D versus (1/FFV) for O2 (left) and N2 (right). Data were taken at 35oC............................................................................................................203
Figure 6.32: EP as a function of the cooling rate for He, O2, and N2 (note that the x-axis is not a continuous axis). The applied pressures were fixed at about 2.5atm for He, and 3.9atm for both O2 and N2. Permeation experiments were consecutively performed on the same membranes at 35, 55, 65, and 80oC. Aging was found to be negligible at those temperatures within the timeframe of the experiments ....................................................................206
Figure 6.33: ED as a function of the cooling rate for O2 and N2 (note that the x-axis is not a continuous axis). The applied pressure was fixed at about 3.9atm for both O2 and N2. Permeation experiments were consecutively performed on the

List of Figures xvii
same membranes at 35, 55, 65, and 80oC. Aging was found to be negligible at those temperatures within the timeframe of the experiments ................206
Figure 6.34: û+V�DV�D�IXQFWLRQ�RI�WKH�FRROLQJ�UDWH�IRU�O2 and N2 (note that the x-axis is not a continuous axis). The applied pressure was fixed at about 3.9atm for both O2 and N2. Permeation experiments were consecutively performed on the same membranes at 35, 55, 65, and 80oC. Aging was found to be negligible at those temperatures within the timeframe of the experiments .....
....................................................................................................................207 Figure 6.35: % change in EP for He (note that the x-axis is not a continuous axis). The
data obtained for a cooling rate of 0.5oC/min were taken for reference ....207 Figure 6.36: % change in EP, ED��DQG�û+V�IRU�22 (note that the x-axis is not a continuous
axis). The data obtained for a cooling rate of 0.5oC/min were taken for reference.....................................................................................................208
Figure 6.37: % change in EP, ED��DQG�û+V�IRU�12 (note that the x-axis is not a continuous axis). The data obtained for a cooling rate of 0.5oC/min were taken for reference.....................................................................................................208
Figure 6.38: Preexponential factor Po as a function of the cooling rate (note that the x-axis is not a continuous axis)......................................................................209
Figure 6.39: Preexponential factor Do as a function of the cooling rate (note that the x-axis is not a continuous axis)......................................................................210
Figure 6.40: Preexponential factor Do as a function of the cooling rate (note that the x-axis is not a continuous axis)......................................................................210
Figure 6.41: Preexponential factor So as a function of the cooling rate (note that the x-axis is not a continuous axis)......................................................................211
Figure 6.42: ln Do versus ED for O2. The data points have been obtained at different cooling rates ...............................................................................................214
Figure 6.43: ED as a function of the square of the kinetic diameter of the gas penetrant. Knowledge of the slope and the intercept provides a rough estimation of the average distance between chains. The average distance between chains was calculated by taking the square root of (-intercept/slope). The values of the slopes were (7513.3, 6077.5, 11859.2, and 28985.9 J/(mol.Å2)) and the values of the intercepts were (-59511.2, -42530.0, -112380.1, and -315118.8 J/mol) for the samples cooled at 0.5oC/min, 10oC/min, 40oC/min, and by the external fan, respectively ...........................................................................217
Chapter 7 Figure 7.1: Schematic of the preparation of the samples for permeation experiments.
The cooling and heating rates were typically chosen as 40oC/min, except for the following. The cooling rates from 165oC to 30oC were chosen as 0.5oC/min, 10oC/min, or 40oC/min. Another cooling rate in excess of 40oC/min was also achieved by blowing air inside the oven with an external fan ..............................................................................................................232
Figure 7.2: Density as a function of the aging time for a sample cooled at 40oC/min and aged at 120oC. The densities were measured at 18oC using a linear density gradient column .........................................................................................237

List of Figures xviii
Figure 7.3: Effect of aging at 118oC on the loss modulus of polycarbonate. The DMTA conditions were the following: frequency = 1Hz, strain = 0.004%, initial temperature = 25oC, heating rate = 2oC/min, torque = 10cNm. Samples were tested in the DMTA in a random order ......................................................240
Figure 7.4: Change in the Tg (left axis) and in the breath of the loss modulus of polycarbonate at 109 dyn/cm2 (right axis) as a function of annealing at 118oC. The Tg was taken as the maximum of the glass transition. The DMTA conditions were the following: frequency = 1Hz, strain = 0.004%, initial temperature = 25oC, heating rate = 2oC/min, torque = 10cNm .......241
Figure 7.5: Change in the magnitude of the loss modulus as a function of annealing at 118oC for different temperatures (namely Tg, Tg-3
oC, and Tg-5oC). The
DMTA conditions were the following: frequency = 1Hz, strain = 0.004%, initial temperature = 25oC, heating rate = 2oC/min, torque = 10cNm. The Tg was taken as the maximum of the glass transition.....................................241
Figure 7.6: Loss modulus traces showing memory effects in polycarbonate as the temperature is increased from 118oC to 127oC. The DMTA conditions were the following: frequency = 1Hz, strain = 0.004%, initial temperature = 25oC, heating rate = 2oC/min, torque = 10cNm...................................................243
Figure 7.7: Change in tan δ as a function of annealing time at 80oC and 120oC. The sample was initially cooled at 40oC/min. The DMTA conditions were the following: strain = 0.025%, frequency = 5Hz, torque = 10cNm, static force = 40g ..........................................................................................................244
Figure 7.8: Effect of frequency on the DMTA traces. The DMTA conditions were the following: strain = 0.025%, initial temperature = 25oC, heating rate = 1oC/min, torque = 10cNm..........................................................................245
Figure 7.9: tan δ as a function of the annealing time te for the samples cooled at different cooling rates. The annealing temperature Te was chosen as 120oC. The DMTA conditions were the following: frequency = 3Hz, strain = 0.025%, data points collected every 10s....................................................246
Figure 7.10: Permeation profile as a function of the permeation time. The permeation experiments were carried out at 35oC. The difference in profile between a fresh membrane (cooling rate from 165oC =40oC/min) and a membrane annealed at 120oC for 70h40 is clearly seen. The profile was averaged for each gas at each condition. The effect of annealing appeared to be greater for N2. The applied pressures were chosen as 3.9atm for He, and 2.5atm for both O2 and N2 ...........................................................................................248
Figure 7.11: Percentage of the permeance change as a function of annealing time at 120oC for the gases studied in this research. The permeation slopes were obtained at 35oC and averaged. As apparent from the figure, the permeation slope was reduced with annealing time .....................................................249
Figure 7.12: Percentage of the permeance change as a function of the kinetic diameter of the penetrant gas in Å for various annealing times at 120oC. The permeation slopes were obtained at 35oC and averaged. The greater the kinetic diameter, the greater the change at long annealing times ..........................................250

List of Figures xix
Figure 7.13: Percentage of diffusion coefficient D change as a function of annealing time at 120oC for the gases studied in this research. The permeation slopes were obtained at 35oC and averaged for each gas ..............................................251
Figure 7.14: Percentage of solubility coefficient S change as a function of annealing time at 120oC for the gases studied in this research. The permeation slopes were obtained at 35oC and averaged for each gas ..............................................252
Figure 7.15: Percent in permeance change as a function of the cooling rate for N2 (note that the x-axis is not a continuous axis). The samples had been annealed at 120oC for 10h. The permeation experiments were carried out at 35oC. The applied pressure was taken as 3.9atm for N2 .............................................253
Figure 7.16: Percent in diffusion coefficient change as a function of the cooling rate for the various gases of interest (note that the x-axis is not a continuous axis). The samples had been annealed at 120oC for 10h. The permeation experiments were carried out at 35oC ........................................................254
Figure 7.17: Percent in solubility coefficient change as a function of the cooling rate for the various gases of interest (note that the x-axis is not a continuous axis). The samples had been annealed at 120oC for 10h. The permeation experiments were carried out at 35oC ........................................................254
Figure 7.18:. Schematic of the aging process. With aging the size distribution of the cavities may become narrower and of a size close to that of the N2 gas molecule. The grey matrix corresponds to the polycarbonate, the green spheres to the gas molecules, and the white spheres to the free volume ...256
Figure 7.19: EP as a function of annealing time at 120oC for the gases studied in this research. The permeation experiments were carried out at 35, 40, 45, and 55oC. At te = 2h, permeation experiments were carried out for N2 only
....................................................................................................................262 Figure 7.20: ED as a function of annealing time at 120oC for the gases studied in this
research. The permeation experiments were carried out at 35, 40, 45, and 55oC. At te = 2h, permeation experiments were carried out for N2 only
....................................................................................................................262 Figure 7.21: û+V�DV�D� IXQFWLRQ�RI�DQQHDOLQJ� WLPH�DW����
oC for the gases studied in this research. The permeation experiments were carried out at 35, 40, 45, and 55oC. At te = 2h, permeation experiments were carried out for N2 only
....................................................................................................................263 Chapter 8 Figure 8.1: Schematic of the stretcher..........................................................................275 Figure 8.2: Schematic of the stretching process...........................................................275 Figure 8.3: Schematic of the samples prepared for stretching and resulting appearance
after drawing. Before stretching, lines were drawn every 5mm. The distance between those lines after stretching provided information about the draw ratio λ (=l/lo). Circles drawn on the specimen prior to drawing became ellipsoidal with stretching ..........................................................................276

List of Figures xx
Figure 8.4: Location of the five birefringence measurements taken on the membrane. The area of the membrane was about 18.10 cm2. MD and TD stand for the machine and the transverse directions, respectively ..................................277
Figure 8.5: Spectral changes induced with crystallization as observed by ATR for several absorption bands of polycarbonate (ZnSe crystal, 50o, no polarizer). The critical angle of incidence was calculated to be 40.92o. The refractive indices of the ZnSe ATR crystal and the polycarbonate were taken as 2.42 and 1.585, respectively ..............................................................................281
Figure 8.6: Comparison of the draw ratio λ and the Hermans’ orientation function f. The samples were stretched at 160oC ........................................................286
Figure 8.7: Comparison of the draw ratio λ and the Hermans’ orientation function f. The samples were stretched at 180oC ........................................................286
Figure 8.8: Density as a function of Tstretch for isotropic samples. The densities were measured at 18oC in a linear density gradient column...............................287
Figure 8.9: Density as a function of the Hermans’ orientation function f. The stretching temperature was 160oC ..............................................................................288
Figure 8.10: Density as a function of the Hermans’ orientation function f. The stretching temperature was 180oC. The density of the sample characterized by a f value of 0.07567 could not be taken since vacuum grease was covering the membrane...................................................................................................289
Figure 8.11: Density of unstretched and stretched samples. The stretching temperature was 130oC. It should be pointed out that the stretched sample was not taken from the membrane used in permeation experiments since the membrane was destroyed by oil while attempting to measure birefringence (see above). Nevertheless, the same experimental conditions were repeated in order to generate the same sample...........................................................................289
Figure 8.12: Schematic of the DMTA set-ups. Iso, MD, and TD stand for isotropic, machine direction, and transverse direction, respectively. The chains were drawn as perfectly oriented in order to emphasize the orientation direction. Nevertheless one has to keep in mind that the Hermans’ orientation function of the polycarbonate films was very low (about 0.2) and therefore the polymer chains should be only slightly oriented. ......................................292
Figure 8.13: Storage modulus of isotropic and anisotropic polycarbonate (Lexan) as a function of temperature. The stretching temperature was set at 160oC. The Hermans’ orientation function of the oriented sample was determined from birefringence measurements to be 0.2172. The DMTA traces of the oriented sample were performed in both the machine (MD) and the transverse (TD) directions. The DMTA conditions were the following: frequency = 1Hz, strain = 0.025%, initial temperature = 25oC, heating rate = 2oC/min, static force = determined at room temperature by dynamic frequency sweep test (strain control), torque = 10 cNm ..............................................................293
Figure 8.14: Loss modulus of isotropic and anisotropic polycarbonate (Lexan) as a function of temperature. The stretching temperature was set at 160oC. The Hermans’ orientation function of the oriented sample was determined from birefringence measurements to be 0.2172. The DMTA traces of the oriented sample were performed in both the machine (MD) and the transverse (TD)

List of Figures xxi
directions. The DMTA conditions were the following: frequency = 1Hz, strain = 0.025%, initial temperature = 25oC, heating rate = 2oC/min, static force = determined at room temperature by dynamic frequency sweep test (strain control), torque = 10 cNm ..............................................................294
Figure 8.15: Permeability coefficient P as a function of Tstretch for isotropic samples. Permeation experiments were performed at 35oC .....................................296
Figure 8.16: Diffusion coefficient D as a function of Tstretch for isotropic samples .......296 Figure 8.17: Solubility coefficient S as a function of Tstretch for isotropic samples........297 Figure 8.18: EP as a function of Tstretch for isotropic samples.........................................298 Figure 8.19: ED as a function of Tstretch for isotropic samples ........................................298 Figure 8.20: û+V�DV�D�IXQFWLRQ�RI�7stretch for isotropic samples......................................299 Figure 8.21: Permeability coefficient P as a function of the Hermans’ orientation
function f. The stretching temperature was 160oC. Results are plotted for the three gases studied in this research. Permeation experiments were performed at 35oC........................................................................................................301
Figure 8.22: Permeability coefficient P as a function of the Hermans’ orientation function f. The stretching temperature was 180oC. Results are plotted for the three gases studied in this research. Permeation experiments were performed at 35oC........................................................................................................302
Figure 8.23: Permeability coefficient P of an unstretched versus a stretched sample. The stretching temperature was 130oC. Results are plotted for the three gases studied in this research. Permeation experiments were performed at 35oC....................................................................................................................302
Figure 8.24: Diffusion coefficient D as a function of the Hermans’ orientation function f. The stretching temperature was 160oC. Results have been obtained for O2 and N2 only ................................................................................................303
Figure 8.25: Diffusion coefficient D as a function of the Hermans’ orientation function f. The stretching temperature was 180oC. Results have been obtained for O2 and N2 only ................................................................................................304
Figure 8.26: Diffusion coefficient D of an unstretched versus a stretched sample. The stretching temperature was 130oC. Results have been obtained for O2 and N2 only ............................................................................................................304
Figure 8.27: Solubility coefficient S as a function of the Hermans’ orientation function f. The stretching temperature was 160oC. Results have been obtained for O2 and N2 only ................................................................................................305
Figure 8.28: Solubility coefficient S as a function of the Hermans’ orientation function f. The stretching temperature was 180oC. Results have been obtained for O2 and N2 only ................................................................................................305
Figure 8.29: Solubility coefficient S of an unstretched versus a stretched sample. The stretching temperature was 130oC. Results have been obtained for O2 and N2 only ............................................................................................................306
Figure 8.30: EP as a function of the Hermans’ orientation function f. The stretching temperature was 160oC. Results are plotted for the three gases studied in this research ...............................................................................................307

List of Figures xxii
Figure 8.31: ED (left) and û+V��ULJKW��DV�D�IXQFWLRQ�RI�WKH�+HUPDQV¶�RULHQWDWLRQ�IXQFWLRQ�
f. The stretching temperature was 160oC. Results have been obtained for O2 and N2 only ................................................................................................307
Figure 8.32: EP as a function of the Hermans’ orientation function f. The stretching temperature was 180oC. Results are plotted for the three gases studied in this research ...............................................................................................308
Figure 8.33: ED��OHIW��DQG�û+V��ULJKW��DV�D�IXQFWLRQ�RI�WKH�+HUPDQV¶�RULHQWDWLRQ�IXQFWLRQ�
f. The stretching temperature was 180oC. Results have been obtained for O2 and N2 only ................................................................................................308
Figure 8.34: EP of isotropic and anisotropic samples. The stretching temperature was 130oC. Results are plotted for the three gases studied in this research......309
Figure 8.35: ED� �OHIW�� DQG� û+V� �ULJKW�� RI� LVRWURSLF� DQG� DQLVRWURSLF� VDPSOHV�� 7KH�
stretching temperature was 130oC. Results have been obtained for O2 and N2 only ............................................................................................................309
Figure 8.36: Storage modulus of isotropic and anisotropic polycarbonate (Lexan) as a function of temperature. As expected, the storage modulus at room temperature was greater in the oriented sample than in the isotropic one. Deorientation of the anisotropic samples is clearly seen on the figure, as the storage modulus dropped around the stretching temperature and reached the level of that of the isotropic sample. The fact that the drop of E’ occurred around Tstretch is believed to be a coincidence rather than a general rule. Indeed, this drop should depend on the heating rate for instance, and a higher heating rate should show a drop at higher temperatures. The stretching temperature was set at 126oC, the stretching rate was 15 turns/min. The DMTA trace of the oriented sample was performed in the machine direction. The draw ratio is indicated into brackets. The thicknesses of the fresh and the stretched samples were 150µm and 90µm, respectively. The DMTA conditions were the following: frequency = 1Hz, strain = 0.025%, initial temperature = 25oC, heating rate = 2oC/min, static force = 40g, torque = 10 cNm ................................................................................311
Figure 8.37: Loss modulus of isotropic and anisotropic polycarbonate (Lexan) as a function of temperature (see Figure 8.36 for experimental details). The loss modulus trace indicated that energy was dissipated in the material with deorientation of the chains (see previous figure), suggesting that shrinkage was taking place in the anisotropic samples during the measurements. The Tg of the stretched sample (MD direction) was higher by about 4oC ........311
Figure 8.38: Schematic showing the relaxation of oriented polymer chains .................312 Figure 8.39: Storage modulus E’ of isotropic and anisotropic polycarbonate (Lexan) as a
function of temperature. No direct evidence of deorientation of the polymer chains could be noticed. The stretching was done at room temperature (27oC), the stretching rate was 7 turns/min. The draw ratio of the oriented samples are indicated into brackets. DMTA measurements were performed in both the machine (MD) and the transverse (TD) directions. The DMTA conditions were the following: frequency = 1Hz, strain = 0.025%, initial temperature = 25oC, heating rate = 2oC/min, torque = 10 cNm.................313

List of Figures xxiii
Figure 8.40: Loss modulus E” of isotropic and anisotropic polycarbonate (Lexan) as a function of temperature. The samples were stretched at room temperature (see Figure 8.39 for experimental details). New relaxations between 50 and 120oC appeared on the traces with orientation ..........................................313
Figure 8.41: Tan δ of isotropic and anisotropic polycarbonate (Lexan) as a function of temperature. The samples were stretched at room temperature (see Figure 8.39 for experimental details) ....................................................................314

List of Tables Chapter 4 Table 4.1: GPC results of the various polycarbonates used in this study. The weight
average molecular weight Mw, the number average molecular weight Mn, the polydispersity index PI (=Mw/Mn), and the radius of gyration <Rgn> are reported in the table......................................................................................83
Chapter 5 Table 5.1: Summary of the free volume results. C1
o and C2o were obtained from the
Levenberg-Marquardt algorithm. The values of the viscoelastic parameters C1 and C2 were calculated from the Tg value determined from DMTA measurements. The errors were given in the text.......................................142
Table 5.2: Summary of the physical properties obtained in this study .......................149 Table 5.3: Summary of the gas transport results obtained in this study......................150 Chapter 6 Table 6.1: Permeability coefficients at 35oC. The applied pressures were 2.5atm for He,
and 3.9atm for O2 and N2 ...........................................................................187 Table 6.2: Diffusion coefficients at 35oC. The applied pressures were 2.5atm for He,
and 3.9atm for O2 and N2 ...........................................................................187 Table 6.3: Solubility coefficients at 35oC. The applied pressures were 2.5atm for He,
and 3.9atm for O2 and N2 ...........................................................................188 Table 6.4: Comparison of the results of the present work with those reported in the
literature. The results obtained at a cooling rate of 40oC/min in this work are reported in the table. Permeability coefficients are given in barrer ...........188
Table 6.5: Comparison of the results of the present work with those reported in the literature. The results obtained at a cooling rate of 40oC/min in this work are reported in the table. Diffusion coefficients are given in (cm2/s), solubility

List of Tables xxv
coefficients in (cm3@STP/cm3.cmHg). Please note that solubility coefficients given in the literature were determined from sorption experiments ................................................................................................188
Table 6.6: Empirical factors as given by Park and Paul [69]. The Van der Waals volumes Vw were reported from Van Krevelen [94]..................................194
Table 6.7: Group contribution calculations obtained from the two methods selected in this study ....................................................................................................195
Table 6.8: EP and Po values obtained in this work ......................................................212 Table 6.9: ED and Do values obtained in this work .....................................................212 Table 6.10: û+s and So values obtained in this work....................................................212 Table 6.11: From [75] ...................................................................................................213 Table 6.12: Average distances between chains for the various cooling rates of interest.
The errors were far from being negligible. In the case of the sample cooled by the fan, taking extreme points on the error bars of ED for instance led to average distances ranging from 1.1Å to 10.3Å..........................................217
Chapter 7 Table 7.1: Comparison of the methods commonly found in the literature to study aging
compared to the one chosen in this research ..............................................228 Table 7.2: Tg as determined by DMTA experiments on the fresh samples (taken from
Chapter 6). The cooling rates are given in oC/min.....................................236 Chapter 8 Table 8.1: Orientation results giving the Hermans’ orientation function f in the five
different selected areas. Results are given as a function of the stretching temperature (Tstretch), and the number of turns per second in a given time (x t/s for x s). The membrane was typically found to be more oriented in the middle than on the sides. f was also on average higher in the MD direction than in the TD direction .............................................................................284

Chapter 1
Introduction
1.1. Motivation and objectives
Polymers come into contact with gases in several applications such as packaging,
polymer processing, production of foam, protective coatings, contact lenses, sensors, gas
separations using non-porous polymeric membranes, etc [1-4]. Therefore there is a need
to understand gas transport through polymers. For instance, polymers used for carbonated
beverages should be capable of keeping carbon dioxide inside the bottle and at the same
time be permeable to oxygen. While both high permeability and high permselectivity are
necessary for polymeric membranes used in gas separations, an enhancement of one of
the parameters commonly results in a decrease in the other parameter, and vice-versa.
The chemical structure / permeation properties are not straightforward and the
development of a suitable glassy polymeric membrane for a given application is still, to a
large extent, empirical. Once the gas transport phenomenon is better understood,
predictive tools may be further developed to select or create appropriate polymers.
Gas transport properties are defined by three transport coefficients, which are the
permeability, solubility, and diffusion coefficients. The permeability coefficient P
indicates the rate at which a permeant traverses a membrane. It corresponds to the
product of the solubility coefficient and the diffusion coefficient. The solubility
coefficient S is a measure of the amount of gas sorbed by the membrane when

Chapter 1 - Introduction 2
equilibrated with a given pressure of gas at a particular temperature. It is a
thermodynamic parameter that is believed to be dependent on the amount of free volume,
on the condensability of the penetrant, and on the degree to which the permeant interacts
with the polymeric matrix. The diffusion coefficient D indicates how fast a penetrant is
transported through the membrane. It is a kinetic parameter, which is related to the
polymer chain mobility or flexibility and to that of the permeant. D is also believed to
relate to the free volume content, as apparent from the correlations showing an increase in
the diffusion coefficient with an increase in the free volume content [5-10].
Emphasis is usually placed on developing new materials for gas separation
applications. Structure-property relationships are studied for those new materials.
However, the trends seen for a family of polymers may be different for a particular
polymer with different thermal histories. Therefore, studies have to be conducted in order
to understand how the gas transport properties are affected by morphology, free volume,
orientation, thermal processing history, degree of crystallization, types of crystallites,
annealing, composition, defects, cross-linking, temperature, molecular weight, molecular
weight distribution, etc. Gas transport is expected to be highly complicated by the
presence of the crystalline domains, which add a tortuosity factor to the gas diffusion
process. As a consequence, this study will be focused on the amorphous state only.
Gas transport through amorphous glassy polymers is commonly explained from
the free volume concept point of view [4-9, 11-16]. The free volume present in polymers
can be visualized as dynamic microvoids or holes, with a distribution of sizes and shapes,
dispersed inside the polymeric matrix. One would expect that as the free volume content
increases, the permeability and the diffusion coefficients increase, and that the activation
energies of permeation and diffusion decrease. Actually, this trend summarized in Figure
1.1 has been verified in the literature for amorphous glassy polymers with different
structures [10, 11]. Nevertheless, with some deeper thinking, one may also wonder
whether or not gas transport through amorphous glassy polymers is directly related to the
amount of free volume for a particular polymer at given conditions. Indeed, two samples
of the same polymer may possess the same free volume content, but completely different
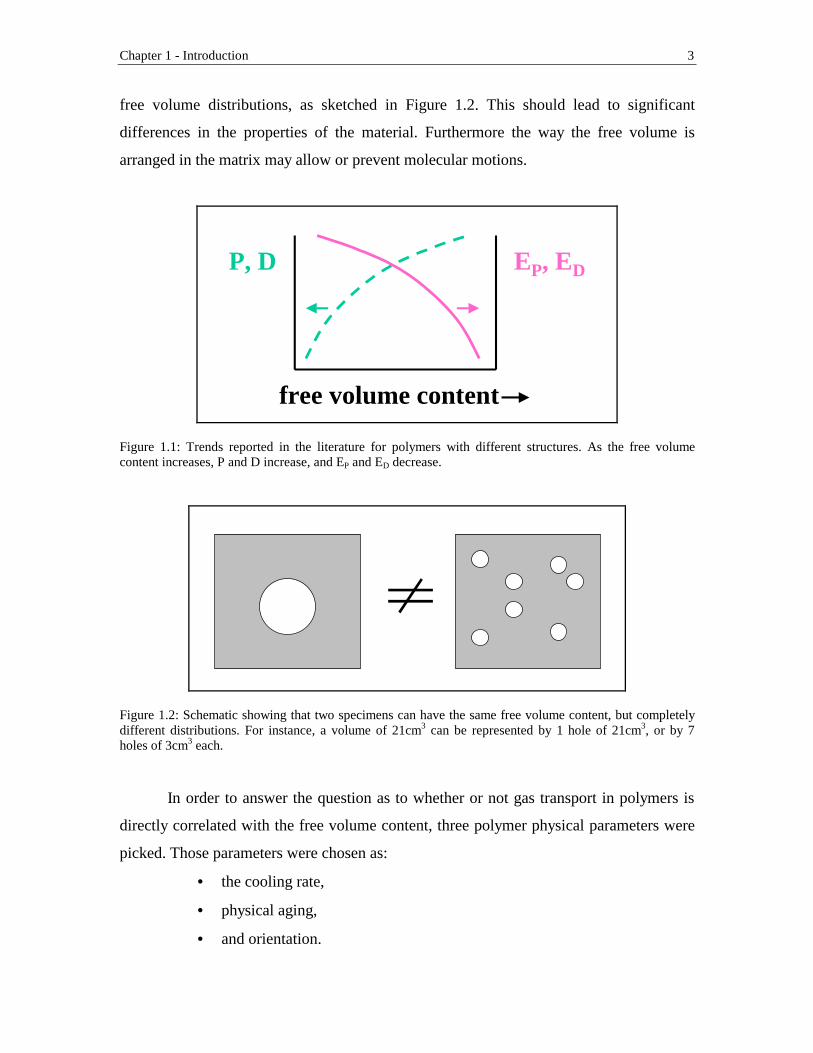
Chapter 1 - Introduction 3
free volume distributions, as sketched in Figure 1.2. This should lead to significant
differences in the properties of the material. Furthermore the way the free volume is
arranged in the matrix may allow or prevent molecular motions.
P, D EP, ED
free volume content
Figure 1.1: Trends reported in the literature for polymers with different structures. As the free volume content increases, P and D increase, and EP and ED decrease.
Figure 1.2: Schematic showing that two specimens can have the same free volume content, but completely different distributions. For instance, a volume of 21cm3 can be represented by 1 hole of 21cm3, or by 7 holes of 3cm3 each.
In order to answer the question as to whether or not gas transport in polymers is
directly correlated with the free volume content, three polymer physical parameters were
picked. Those parameters were chosen as:
• the cooling rate,
• physical aging,
• and orientation.

Chapter 1 - Introduction 4
The above parameters should affect the free volume content and its distribution, and
hopefully provide an answer to the central question of this research, which is to
understand the molecular mechanism of gas transport through amorphous glassy
polymers (see Figure 1.3). The same phenomena should indeed govern gas transport in
different types of samples (freshly processed / physically aged / oriented).
From the polymer film applications point of view, it is important to understand the
molecular aspects of polymer physical aging and orientation. This can be achieved by
using inert gases with different kinetic diameters in order to probe the free volume of
polymers.
As the focus of this research project is on the amorphous state, a polymer which
does not readily crystallize under normal conditions and under hydrostatic pressure, and
which does not show any signs of strain-induced crystallization had to be selected. A
commercial 34,000g/mol weight average molecular weight of bisphenol-A polycarbonate
was chosen in this research. In addition, polycarbonate is a polymer of major importance
because of its transparency, toughness, thermal stability, and low birefringence. It has
found applications in optical data storage, plastic bottles, and is used in electric,
automotive, and architectural industries.
gas transport and free volume:
is there a direct correlation?
coolingrate
orientation
physicalaging
Figure 1.3: Puzzle showing the strategy adopted in this research to solve the research objective.

Chapter 1 - Introduction 5
1.2. Proposal
Specifically, here are the questions that tried to be answered in this research work:
1. What is the effect of the free volume on gas transport in freshly processed polycarbonate?
The transport of gas molecules through dense polymers is believed to be due to
the thermal motion of the polymer chains facilitated by the presence of free volume in the
material. This free volume originates from imperfect packing in the material. One would
expect that the greater the amount of free volume in a freshly processed polymer, the
more permeable is the material, and the lower are the activation energies. Nevertheless
this trend commonly observed for the transport of gas molecules through various glassy
polymer families or classes [10, 11] has to be confirmed for the gas transport process
through a particular polymer with different amounts of free volume. Although the
diffusion coefficient should really indicate a measure of the polymer chain mobility, it is
often related to the free volume content of the materials [4, 11, 13-15]. Theories have
been developed to relate the increase in the diffusion coefficient to the increase in the free
volume content [5-9]. Nevertheless the experimental results originated from studies
carried out on polymer families and need to be confirmed for a particular polymer at
given conditions. The two parameters that are the diffusion coefficient and the free
volume may not be directly correlated. The free volume content and its distribution in
freshly processed polycarbonate can be varied by changing the cooling rate from the
liquid state for instance.
2. What is the effect of physical aging on gas transport?
The excess free volume trapped in glassy polymers is at the origin of the non-
equilibrium nature of the glassy state. The time-dependent structural changes affect any
property that is a function of molecular mobility [17-27]. The behavior of polymeric
materials with time is an important parameter to consider for future industrial

Chapter 1 - Introduction 6
applications. Polymeric membranes used for gas separation for instance should have a
long durability, otherwise the process may not be economically better than other
separation processes.
The effects of physical aging on the gas transport properties have been reported in
the literature [28-35]. The gas transport parameters (P, D, and S) were generally observed
to decrease with aging, and the difference was attributed to the loss of free volume with
annealing. However, most of the published data were complicated by several factors:
conditioning, samples used as-received or cast from solution, plasticization induced by
carbon dioxide, and sorption experiments themselves. New studies free of the above
factors should be conducted in order to confirm the trends reported in the literature.
Determining how the relative permeability coefficients between two gases, or the
permselectivity, is affected by aging is crucial in food packaging or gas separation for
instance, as one gas may be desired and another one not. Ideally, the separation properties
of polymer films should not change with time in order to insure good durability of the
polymer films.
However, there still remains some unanswered questions, such as which cavity
sizes are more likely to be affected by the aging phenomena. Contradictions can be found
in the literature about the changes in the cavity sizes of polycarbonate with aging.
According to small angle X-ray scattering (SAXS) results [36], although the amount of
free volume in polycarbonate decreases with aging at sub-Tg annealing temperatures
below the glass transition range, the average free volume hole size increases. In contrast,
positron annihilation lifetime spectroscopy (PALS) studies of physical aging found that
on aging at temperatures below the glass transition range, the holes in polycarbonate did
not decrease in size but in number [37-42]. Similar conclusions were reached by studying
physical aging in polycarbonate with photochromic probes [43].
Probing the free volume with gas molecules of different sizes can give
information on the structural scale of changes occurring during physical aging. Gas
permeation can be used as a tool to probe the free volume of polymeric materials. Gas
molecules with different kinetic diameters can be used to access the size of the
microvoids.

Chapter 1 - Introduction 7
3. What is the effect of orientation on gas transport?
Commercial polymeric films are often oriented to some extent due to the
processing techniques. There is therefore a need to investigate the influence of molecular
orientation of amorphous glassy polymers on gas transport.
The literature is relatively sparse on the effect of molecular orientation on the gas
transport properties of amorphous glassy polymers. The few papers [44-48] dealing with
this subject are most of the time complicated by the presence of strain-induced
crystallinity in the polymeric samples. The various results suggest that the influence of
orientation on the gas transport parameters is rather complex. Especially, a polymer that
does not show any signs of strain-induced crystallization has to be selected in order to
isolate the effect of the amorphous orientation only. Moreover, gases that do not induce
any plasticization effects have to be chosen.
When aging studies are conducted on uniaxially oriented amorphous glassy
polymers, volume relaxation is enhanced by one order of magnitude in both cold- and
hot-drawn samples, despite of the much higher density [49-55]. These results suggest that
the concept of free volume commonly used to provide a physical picture of physical
aging [18] may not be adequate. According to the free volume theory, a higher density
should result in a lower mobility, and thus in a lower aging rate. Instead, enhancement of
physical aging is observed in oriented polymers. Another order parameter, such as the
distribution of free volume, or degree of short-range structural order, as well as the shape
of the holes, or even the polymer chain dynamics, may be also important in determining
the mechanical properties of glassy materials.
The effects of orientation on polymer physical aging and the corresponding gas
transport properties of polymers have not been examined in the literature. Using gas
transport to probe the free volume of polymers should provide information on how
physical aging is affected by orientation from a molecular point of view.

Chapter 1 - Introduction 8
1.3. Outline
The dissertation has been written as a collection of chapters which deal with the
research objectives previously stated.
The first chapters provide a critical background about the subjects treated in the
research work. Chapter 2 offers a background on gas transport. The transport parameters
are explained, and the influence of the polymer structure on gas transport is discussed.
Gas sorption and permeation experiments are also presented. In Chapter 3, backgrounds
about physical aging and orientation are first given, before discussing the work that has
been reported in the literature about gas transport and physical aging, and gas transport
and orientation, respectively.
The experimental details are provided in Chapter 4.
The research results are then presented and discussed in the following chapters.
Pertinent literature reviews are provided in those chapters whenever needed. Note that the
use of “we” will then be seen throughout those chapters since the chapters dealing with
experimental results do correspond to manuscripts. Chapter 5 tries to answer the question
of whether or not the gas transport of gas molecules through polymers is directly related
to the amount of free volume by comparing two commercial grades of polycarbonates
obtained from two different suppliers. Chapter 6 deals with the effect of the cooling rate
on the gas transport properties of polycarbonate. Chapter 7 investigates how physical
aging in polycarbonate is revealed by gas transport measurements. The influence of the
cooling rate on the physical aging rate is also discussed. The effect of orientation on the
transport of gas molecules through amorphous glassy bisphenol-A polycarbonate is
reported in Chapter 8.
Finally, the results obtained in this research are summarized in the last chapter
and suggestions are given for future research work.

Chapter 1 - Introduction 9
1.4. References
1. X. Wang and H. G. Spencer, Polymer Membranes for Use in Food Processing, TRIP, 5, 2, 38 (1997).
2. W. J. Koros and R. T. Chern, Separation of Gaseous Mixtures using Polymer Membranes, Handbook of Separation Process Technology, edit. R. W. Rousseau, (1987).
3. K. Ghosal and B. D. Freeman, Gas Separation Using Polymer Membranes: An Overview, Polymer for Advanced Technologies, 5, 673-697 (1994).
4. D. R. Paul, Yuri P. Yampol’skii, editors, Polymeric gas separation membranes, CRC Press, Boca Raton, 1994.
5. J. L. Duda and J. M. Zielinski, Free-Volume Theory, Plastics Engineering, 32, 143 (1996).
6. M. H. Cohen and D. Turnbull, J. Chem. Phys., 31, 1164 (1959). 7. J. S. Vrentas and J. L. Duda, J. Polym. Sci., 15, 403 (1977). 8. J. S. Vrentas and J. L. Duda, J. Polym. Sci., 15, 417 (1977). 9. H. Fujita, Fortschr. Hochpolym. Forsch., 3, 1 (1961). 10. Y. Yampolskii, S. Shishatskii, A. Alentiev, K. Loza, Correlations with and
prediction of activation energies of gas permeation and diffusion in glassy polymers, Journal of Membrane Science, 148, 59-69 (1998).
11. J. Y. Park, D. R. Paul, Correlation and prediction of gas permeability in glassy polymer membrane materials via a modified free volume based group contribution method, Journal of Membrane Science, 125, 23-39 (1997).
12. W. M. Lee, Selection of barrier materials from molecular structure, Polym. Eng. Sci., 20, 65-69 (1980).
13. Y. Kobayashi, K. Haraya, S. Hattori, Polymer, 35, 925-928 (1994). 14. S. Trohalaki, L. C. DeBolt, J. E. Mark, H. L. Frisch, Macromolecules, 23, 813-
816 (1990). 15. Y. Maeda and D. R. Paul, Effect of AntiPlasticization on Gas Sorption and
Transport. III. Free Volume Interpretation, Journal of Polymer Science: Part B: Polymer Physics, 25, 1005 (1987).
16. A. Thran, G. Kroll, F. Faupel, Correlation between fractional free volume and diffusivity of gas molecules in glassy polymers, Journal of Polymer Science: Part B: Polymer Physics, 37, 3344-3358 (1999).
17. J. M. Hutchinson, Physical aging of polymers, Prog. Polym. Sci. , 20, 703 (1995). 18. L. C. E. Struik, Physical aging in amorphous polymers and other materials,
Elsevier, New York, 1978. 19. M. R. Tant and G. L. Wilkes, An overview of the nonequilibrium behavior of
polymer glasses, Polymer Engineering and Science, 21, 14, 874 (1981). 20. J. M. Hutchinson, Relaxation processes and physical aging, in The Physics of
Glassy Polymers, edited by R. N. Haward and R. J. Young, Chapman & Hall, London, 1997.
21. R. P. Chartoff, Thermoplastic polymers, in Thermal characterization of polymeric materials, E. A. Turi, edt, Academic Press, NY, 548-573 (1997).

Chapter 1 - Introduction 10
22. L. C. E. Struik, Aging, Physical, Encyclopedia of Polymer Science and Engineering, vol 1, 595-611, Wiley, NY (1985).
23. J. M. O'Reilly, Review of structure and mobility in amorphous polymers, CRC critical reviews in solid state and materials sciences, 13, 3, 259-277 (1987).
24. J. Mijovic, L. Nicolais, A. D’Amore, J. M. Kenny, Principal features of structural relaxation in glassy polymers- A review, Polymer Enginering and Science, 34, 5, 381 (1994).
25. S, Matsuoka, Free volume, excess entropy and mechanical behavior of polymeric glasses, Polymer Engineering and Science, mid-october, 21, 14, 907-921 (1981).
26. J.-C. Bauwens, Physical aging: relation between free volume and plastic deformation, in Failure of plastics, W. Brostow and R. D. Corneliussen, edts, Hanser Publishers, Munich (1986).
27. L. C. E. Struik, Physical aging: influence on the deformation behavior of amorphous polymers, in Failure of plastics, W. Brostow and R. D. Corneliussen, edts, Hanser Publishers, Munich (1986).
28. H. Hachisuka, H. Takizawa, T. Tsujita, A. Takizawa, T. Kinoshita, gas transport properties in polycarbonate films with various unrelaxed volumes, Polymer, 32, 13, 2383 (1991).
29. A. H. Chan and D. R. Paul, Effect of sub-Tg annealing on CO2 sorption in polycarbonate, Polymer Enginering and Science, 20, 1, 87 (1980).
30. H. Hachisuka, Y. Tsujita, A. Takizawa, T. Kinoshita, Gas transport properties of annealed polyimide films, Journal of Polymer Science: Part B: Polymer Physics, 29, 11 (1991).
31. K. Toi, T. Ito, I. Ikemoto, Effect of aging and conditioning on the gas transport of poly(vinyl acetate), Journal of Polymer Science: Polymer Letters Edition, 23, 525-529 (1985).
32. K. Nagai, T. Nakagawa, Effects of aging on the gas permeability and solubility in poly(1-trimethylsilyl-1-propyne) membranes synthetized with various catalysts, Journal of Membrane Science, 105, 261-272 (1995).
33. Von K.-H. Illers, Einfluss der thermischen Vorgeschichte auf die Eigenschaften von Polyvinylchlorid, Die Makromolekulare Chemie, 127, 3032, 1-33 (1969).
34. T. Nakagawa, T. Watanabe, M. Mori, K. Nagai, Aging phenomena of gas permeability of poly[1-(tri-methylsilyl)-1-pripyne] and its blend polymer, Polym. Mater. Sci. Eng., 77, 249 (1997).
35. H. Hachisuka, K. Kito, Y. Tsujita, A. Takizawa, T. Kinoshita, O2 and N2 gas permselectivity of alternating copoly(vinylidene cyanide-vinyl acetate), Journal of Applied Polymer Science, 35, 1333 (1988).
36. J. J. Curro and R.-J. Roe, Isothermal relaxation of specific volume and density fluctuation in poly(methyl methacrylate) and polycarbonate, Polymer, 25, 1424 (1984).
37. A. J. Hill, I. M. Katz and P. L. Jones, Isothermal volume relaxation in aged polycarbonate measured by positron annihilation lifetime spectroscopy, Polymer Enginering and Science, 30, 13, 762 (1990).
38. T. C. Sandreczki, X. Hong, and Y. C. Jean, Sub-glass-transition-temperature annealing of polycarbonate studied by positron annihilation spectroscopy, Macromolecules, 29, 4015-4018 (1996).

Chapter 1 - Introduction 11
39. A. J. Hill, C. M. Agrawal, Positron lifetime spectroscopy characterization of thermal history effects on polycarbonate, Journal of Materials Science, 25, 5036-5042 (1990).
40. J. E. Kluin, H. Moaddel, M. Y. Ruan, Z. Yu, A. M. Jamieson, R. Simha, J. D. McGervey, Probe spectroscopy, free volume concepts, and physical aging of polymer glasses, in Structure-property relations in polymers: spectroscopy and performance, ACS, 236, 535-555 (1993).
41. T. C. Sandreczki, X. Homg, and Y. C. Jean, Sub-glass-transition temperature annealing of polycarbonate studied by positron annihilation spectroscopy, Macromolecules, 29, 4015-4018 (1996).
42. J. E. Kluin, Z. Yu, S. Vleeshouwers, J. D. McGervey, A. M. Jamieson, R. Simha, Temperature and time dependence of free volume in bisphenol A polycarbonate studied by positron lifetime spectroscopy, Macromolecules, 25, 19, 5089 (1992).
43. J. S. Royal and J. M. Torkelson, Photochromic and fluorescent probe studies in glassy polymer matrices. 5. Effects of physical aging on bisphenol-A polycarbonates and poly(vinyl acetate) as sensed by a size distribution of photochronic probes, Macromolecules, 25, 4792 (1992).
44. L. H. Wang, R. S. Porter, On the CO2 permeation of uniaxially drawn polymers, Journal of Polymer Science: Polymer Physics Edition, 22, 1645-1653 (1984).
45. M. D. Shelby, G. L. Wilkes, M. R. Tant, J. Zawada, T. J. Bastow and A. J. Hill, Amorphous orientation in glassy polycarbonate, ACS, Polymeric Materials Science and Engineering, Conference Proceedings, San Francisco, Spring 1997, 76, 485-6.
46. T. L. Smith and R. E. Adam, Effect of tensile deformations on gas transport in glassy polymer films, Polymer, 22, 299-304 (1981).
47. N. Yu. Muzovskaya and A. Ya. Malkin, Influence of orientation on the diffusion characteristics of polycarbonate, Polymer Science USSR, 27, 12, 2950-2954 (1985).
48. M. J. El-Hibri and D. R. Paul, Effects of uniaxaial drawing and heat-treatment on gas sorption and transport in PVC, Journal of Applied Polymer Science, 30, 3649-3678 (1985).
49. J. Bartos, J. Muller, J. H. Wendorff, Physical ageing of isotropic and anisotropic polycarbonate, Polymer, 31, 1678 (1990).
50. M. D. Shelby and G. L. Wilkes, Thermodynamic characterization of the oriented state of bisphenol A polycarbonate as it pertains to enhanced physical aging, Journal of Polymer Science: Part B: Polymer Physics, 36, 2111 (1998).
51. R. Pixa, B. Grisoni, T. Gay, and D. Froelich, Influence of deformation on physical aging of polycarbonate- 2 - Volume recovery near ambient temperature, Polymer Bulletin, 16, 381-387 (1986).
52. M.-S. S. Wu, Intrinsic birefringence of amorphous poly(bisphenol-A carbonate), Journal of Applied Polymer Science, 32, 3263-3275 (1986).
53. M. D. Shelby and G. L. Wilkes, The effect of molecular orientation on the physical ageing of amorphous polymers - dilatometric and mechanical creep behaviour, Polymer, 39, 26, 6767-6779 (1998).

Chapter 1 - Introduction 12
54. J. Muller, J. H. Wendorff, Thermal density- Fluctuations in rejuvenated and aged polycarbonate, Journal of Polymer Science: Part C: Polymer Letters, 26, 421 (1988).
55. J.-J. Pesce and G. B. McKenna, Prediction of the subyield extension and compression responses of glassy polycarbonate from torsional measurements, J. Rheol., 41, 5, 929-942 (1997).

Chapter 2
Background on gas transport
2.1. Introduction Several books or reviews are available in the literature about gas transport in
polymers [1-38]. This chapter serves as a brief background concerning gas transport. The
reader is encouraged to consult the references listed above for more insight into the
subject. The first section gives an introduction to the topic of gas transport and explains
the signification of the transport parameters, namely the permeability, the solubility, and
the diffusion coefficients. The second section discusses the influence of the polymer
structure on gas transport. The following section is devoted to gas sorption in amorphous
polymers and mentions briefly the models found in the literature. Finally, permeation
experiments are presented and the time-lag method commonly used in the literature to
determine the gas transport coefficients is detailed.
2.2. Transport parameters
Three transport coefficients are commonly used to define gas transport, namely the
permeability, the solubility, and the diffusion coefficients. The three following
subsections present the characteristics of each of those parameters.
Chapter 2. Background on gas transport 14
2.2.1. The permeability coefficient P
The permeability coefficient P indicates the rate at which a permeant traverses a
membrane. It is therefore the critical parameter that researchers are trying to improve
whenever they are involved in the design of new materials. The permeability coefficient
is the product of a thermodynamic parameter, the solubility coefficient, and a kinetic
parameter, the diffusion coefficient. Those coefficients will be discussed in the following
subsections.
For a component i, the permeability coefficient P is given as follows:
iii S DP = Eq (2.1)
where Pi, Di, and Si stand for the permeability, the diffusion, and the solubility
coefficients of component i, respectively. The permeability is often expressed in barrers,
1 barrer is equal to 10-10 [email protected]/cm2.s.cmHg. The value of the permeability
coefficient P depends on operating conditions, such as temperature, pressure, and
composition, as well as on structural features of the polymeric material. P is mainly
dominated by the diffusion coefficient since variations in D are greater than those in S
[39-41].
The permeability coefficient P varies differently with pressure depending on the
nature of the gas and that of the polymer. The permeability of permanent gases such as
H2, He, N2 and O2 in rubbery or glassy polymeric membranes is not really affected by a
variation in pressure, as long as the pressure remains in a reasonable range (typically
about 10atm). In a study involving polycarbonate for instance, P was found to remain
constant in a pressure range of 3atm to 10atm (the pressure refers to the pressure applied
on one side of the membrane in permeation experiments) [42]. The permeability of other
gases in glassy polymers decreases with pressure, while it increases in rubbery polymers.
A plasticizing behavior is observed sometimes for the permeation of carbon dioxide
(CO2) in glassy polymers [43-63]. The permeability generally decreases as the permeant
size increases. P, D, and S are independent of pressure (in the low pressure range where
Henry’s Law applies) at a given temperature for permanent gases, which have only weak

Chapter 2. Background on gas transport 15
interactions with a polymer. However, the permeation rate increases for gases that induce
swelling and plasticization. The lower the density, or the higher the free volume, the
higher is the permeability. Crosslinking, crystallinity and orientation decrease P, and
consequently only amorphous thermoplastics polymers are used for gas separation.
P increases with temperature and can be represented by an Arrhenius-type
relationship:
−
=RT
E exp PP P
o Eq (2.2)
with Po = So Do (So and Do will be defined later), and EP = ∆HS + ED where EP is the
activation energy of permeation. The quantities ∆HS and ED will be defined in subsequent
subsections as well.
2.2.2. The solubility coefficient S
The solubility coefficient S, also referred sometimes to as the sorption coefficient,
is a measure of the amount of gas sorbed by the membrane. S is a thermodynamics factor
related to the specific interactions between the gas molecules and the polymer. S
increases with the penetrant condensability (evaluated from the critical temperature, the
boiling point, and the Lennard-Jones potential force constant), the permeant size (because
of the increase in boiling points), the polymer free volume (within a given family of
polymers), the free volume distribution, the polymer/gas interactions and the distribution
of the electron density in the polymer matrix. The polymer free volume, which reflects
how opened the matrix is, can be determined by the group contribution method [64, 65].
The stronger the interactions between a gas and the functional groups of a polymer, the
greater is the solubility. Therefore CO2 which has a quadrupole moment will be very
soluble in polar polymers.

Chapter 2. Background on gas transport 16
The solubility coefficient S is defined as:
f
CS= Eq (2.3)
where C is the equilibrium concentration of the gas in the polymer in
(cm3gas@STP/cm3
polymer) and f is the fugacity in cmHg. S can be expressed in
(cm3@STP/cm3polymer.cmHg). The fugacity of a component i is:
p y f iii ϕ= Eq (2.4)
where p is the pressure in cmHg, yi is the composition and ϕi is the fugacity coefficient.
Therefore, pi = yi p is the partial pressure of penetrant at the surface of the polymer
(assuming an ideal gas). S is independent of pressure as long as Henry’s Law applies (in
the low pressure range C is directly proportional to the applied pressure).
S decreases with temperature and follows a Van’t Hoff type relationship
expressed as:
−=
RT
û+V exp SS o Eq (2.5)
with ∆HS = ∆Hcond + ∆Hmix. ∆HS is the enthalpy of sorption or the partial molar heat of
solution, ∆Hcond is the enthalpy of condensation of the gas, and ∆Hmix is the partial molar
heat of mixing between the gas and the polymer. For weak interactions, ∆Hmix is positive
and can be calculated from the following equation:
( ) 22
2211mix 3 // Vû+ −= Eq (2.6)
where V1 is the partial molar volume of the gas, ϕ2 is the volume fraction of the polymer,
and δ1 and δ2 are the solubility parameters of the gas and the polymer, respectively.
∆Hcond can be considered as negligible for permanent gases which are well above their
critical temperature (i.e. H2, He, N2, and O2). For those gases, ∆HS is positive and
therefore S increases with temperature. This is due to the fact that the gas/polymer
interactions are weak. However for condensable gases such as CO2, SO2, NH3 and
hydrocarbons, ∆Hcond is negative and large. Since ∆HS is negative, S decreases with
temperature. Indeed, as the temperature increases, the penetrants become less
condensable.

Chapter 2. Background on gas transport 17
2.2.3. The diffusion coefficient D
The diffusion or diffusivity coefficient D indicates how fast a penetrant is
transported through the membrane. It is a measure of the mobility of the gas molecule
within the polymer and therefore a kinetic factor related to polymer-penetrant dynamics
and expressed in cm2/s. It is also commonly correlated with the overall free volume
content. D is influenced by the penetrant size and shape, the polymer free volume, the
segmental mobility and the rigidity of the polymer chains. It decreases dramatically as the
size of the penetrant increases. The size is not however very critical for rubbery
polymers. Since rubbery membranes are not very selective, they are generally not utilized
for gas separations. The shape of the gas molecule is an important parameter as well.
Indeed, spherical molecules do not diffuse as fast as flattened, linear, oblong or elongated
molecules. D can be considered as independent of gas concentration for a simple gas, i.e.
where the interactions with the polymer are weak. However, it cannot be considered as a
constant for plasticized systems or for organic vapors.
For non-plasticizing systems the diffusion coefficient increases as the temperature
increases and follows the Arrhenius-type relationship given as:
−
=RT
E exp DD D
o Eq (2.7)
where Do is the preexponential factor, and ED is the activation energy of diffusion. ED
decreases as the volume fraction of gas increases, while it increases as the permeant size
increases.
The diffusion coefficient is related to the chain mobility, and therefore is believed
to be determined in part by the size of the free volume of the polymer. The
thermodynamic diffusion coefficient has been related to the polymer fractional free
volume (FFV) using the Doolittle-type relation [66]:

Chapter 2. Background on gas transport 18
−=
FFV
B exp DD 0 Eq (2.8)
where D0 and B are constants characteristic of the system. D0 is equal to (R T Af) where
Af depends on the size and the shape of the gas molecule. B is an indication of the
minimum local free volume necessary to allow a displacement. As the fractional free
volume decreases, D decreases.
The fractional free volume is evaluated from the expression:
−
=V
VVFFV 0 Eq (2.9)
where V is the observed polymer specific volume at a given temperature (which can be
obtained from the inverse of the density) and Vo (= 1.3 VW) is the occupied volume of 1g
of the amorphous polymer at 0K. VW, the Van der Waals volume of a repeating unit, can
be calculated from Bondi’s group contribution method [64, 65]. Thus ( )0VV − is the free
volume.
In the case of plasticization, an empirical relationship has been found for systems
which obey Henry’s Law (usually when the concentration of sorbed gas is small):
( ) ( )C � exp DC D 0= Eq (2.10)
where � is a plasticizing parameter depending on the system at a given temperature and
Do is the diffusion coefficient at zero concentration
When Henry’s Law cannot be applied anymore because of the strength of the
gas/polymer interactions, we have:
( ) ( )BA exp DC D 0= Eq (2.11)
where A is a temperature dependent parameter and B depends on concentration, volume
fraction or activity.
2.3. Influence of the polymer structure on gas transport
The relationship between the chemical structure and the permeation properties are
not straightforward and the development of a suitable glassy polymeric membrane for a

Chapter 2. Background on gas transport 19
given application is still to a large extent empirical. Sometimes a minor change in the
chemical structure affects the gas transport properties tremendously. Nevertheless, some
trends can be distinguished.
2.3.1. Free volume
While considering gas transport data obtained on polymers with various
structures, it has been shown that the greater the free volume content or the fractional free
volume (FFV), the greater the permeability coefficient P. A linear relationship between ln
P and (FFV)-1 has been reported [40, 41, 67-74]. Similar trends have been reported for the
diffusion coefficient [7, 39, 67, 70, 72, 75-79]. In general, polymers characterized by a
high free volume content have high gas solubility coefficients. Nevertheless, the
dependence of the free volume on the permeability coefficient has been shown to be
problematic for polymers with fluorinated groups [80] or polar substituents [70]. It has
been suggested that the diffusion coefficient in polyimides may correlate better with the
cohesive energy density [72]. Deviations have also been encountered for materials
containing polar groups [70].
2.3.2. Others
The effect of chemical structural variations in various glassy polymers on gas
transport has been investigated in many studies [71, 72, 79, 81-83]. In addition to the free
volume content (related to the chain packing) the gas transport parameters have been
shown to be influenced by the chain rigidity (or flexibility), the segmental mobility, the
interchain distance, and the chain interactions. In order to separate the effects of each
parameter from one another, studies have focused on the effects of systematic variations
in the structure of a given material [40, 70, 71, 73, 81-83]. For instance, the introduction
of bulky alkyl substituents opens up the polymer matrix and results in a greater
permeability coefficient [81]. Introduction of n-alkyl side groups on a polymer backbone
has been shown to increase the side-chain flexibility, to increase the free volume, and

Chapter 2. Background on gas transport 20
thus the permeability coefficient P [82]. A greater P value has even been observed for
branched alkyl chains [82]. However sometimes increasing the side-chain length leads to
a better packing and thus to a lower permeability [71]. The substitution of –C(CH3)2-
groups by –C(CF3)2- groups in the backbone of poly(aryl ether ketone) (PEK) resulted in
a higher Tg and thus in a decreased chain mobility due to the hindered molecular rotations
brought up by the large fluorine atoms [40]. The increase in free volume resulted in
increased permeability, diffusion, and solubility coefficients. Adding a second –C(CF3)2-
group further increased the permeability coefficient. A more attractive interaction of the
gas molecules with the –C(CF3)2- groups was also believed to be responsible for the
enhanced solubility coefficient. In addition, the interactions between the gas and the
polymer play also a major role in gas transport. Hydrogen bonding for instance, result in
a denser material with restricted segmental motion. Hence lower gas permeability and
diffusion coefficients are obtained when a particular group is replaced by another one that
can form hydrogen bonds [72, 81]. Polarity also tends to lower the permeability
coefficient [70, 73, 83]. The same holds true when the interchain interaction is enhanced
due to the substitution of one group by another capable of inducing ionic bonds [81].
Nevertheless the permselectivity is then increased.
For gas separation applications a polymer should have both high permeability and
high permselectvity. In reality however an increase in permeability results in a decrease
in permselectivity, and vice-versa. This “trade-off” relationship is shown in the literature
[11, 84]. In order to achieve good membrane performance the polymer should ideally
possess two particular characteristics: a high fractional free volume and a narrow free
volume distribution. Some exceptions have however been noticed and increases in both
permeability and permselectivity have been reported. This is the case for instance for a
polymer with bulky substituents and with groups capable of strong intermolecular
interactions [81]. Polynorbornenes with aliphatic pendant groups, hence a stiff backbone
with flexible side chains, also showed a reversed trade-off [71]. The substitution of –
C(CH3)2- groups by –C(CF3)2- groups in the backbone of poly(aryl ether ketone) (PEK)
shows a simultaneous increase in permselectivity and permeability [40]. The substitution
of a longer oligo (phenylene sulfone) segment in the polymer backbone of 6FDA-

Chapter 2. Background on gas transport 21
poly(phenylene sulfone imide) has been found to decrease both the gas permeability and
the permselectivity [85].
In conclusion, high permeability values are likely to be achieved in polymers with
a large excess free volume, rigid polymer chains, and low intermolecular interactions.
2.4. Gas sorption in amorphous polymers
2.4.1. Introduction
As explained above, the term “sorption” refers to as the amount of gas molecules
that have permeated into a polymer. The objective of this section is to outline the
different sorption models presented in the literature. However one has to be aware that a
gas molecule can be sorbed by different modes of sorption during an experiment, due to
change in concentration, temperature, swelling, and time.
Sorption experiments are usually carried out in pressure decay sorption apparatus
[86]. The apparatus allows measurements of the gas uptake inside a polymer as a function
of pressure. Briefly, the set-up involves two closed volumes V1 and V2 connected by a
valve, as sketched in Figure 2.1. A polymer is placed in V1 and degased. Then some gas
is injected in V2, the valve between V1 and V2 is opened and closed rapidly, and the
decrease in pressure in V1 due to the absorption of the gas by the polymer is monitored
with time until equilibrium. The procedure is continued by increasing the pressure in V2,
etc.

Chapter 2. Background on gas transport 22
V2
V1
polycarbonate films
Pt1 Pt2 gas
vacuum
pressuregauge
Figure 2.1: Schematic of the sorption apparatus.
The equilibrium concentration of a gas in a polymer is given by the following
relation (assuming an ideal gas mixture):
p S p Sf SC ≅== ϕ Eq (2.12)
where S is the sorption or the solubility coefficient, ϕ is the fugacity coefficient and f is
the fugacity. S can be a function of temperature, pressure or concentration, but it is
usually taken as a constant at a given temperature. ϕ = 1 only for ideal gases (gases at
low pressures), however no significant differences have been observed at high pressures,
at least for single gases. C decreases with temperature. It also depends on the nature of
the gas. In polycarbonate for instance, C is about 16 times greater in CO2 than in N2 for
an applied pressure of 0.5 MPa [87].
Several models have been presented in the literature to explain the mechanism of
gas transport through non-porous glassy amorphous polymers. The reader can refer to the
book written by Paul and Yampol'skii [7] for a deeper insight into the theory behind each
model and their limitations. The free volume model [88, 89] applies strictly to rubbery
materials. Macroscopic and lattice theories have been derived for glassy polymers [90-

Chapter 2. Background on gas transport 23
93]. Because of its simplicity, the dual mode sorption (DMS) model [94] remains the
model the most used by far in the literature. Therefore only the DMS theory is briefly
presented in the present section.
2.4.2. The Dual Mode Sorption (DMS) model
The dual mode sorption (DMS) model is commonly used in the literature to
characterize sorption in amorphous glassy polymers. The DMS model consists of a
combination of both the Henry's Law and the Langmuir-type sorption. Those two
particular behaviors are reviewed in the following subsections before discussing the DMS
model itself.
2.4.2.1. The Henry’s Law (rubbery polymers)
When the specific interactions between the polymer and the gas molecules
themselves are weak compared to the polymer/polymer interactions, the system behaves
ideally and Henry’s Law is obeyed. Assuming that the solubility coefficient S is constant
at a given temperature and that the fugacity and the pressure are equivalent, the
equilibrium concentration C of the gas (in cm3@STP/cm3polymer) in a rubbery polymer is
given by the Henry’s Law:
C = kD p Eq (2.13)
where p is the pressure and kD is the Henry’s Law dissolution constant. The constant kD is
equivalent to the solubility coefficient S in this case. The concentration of the gas within
the polymer is believed to be sufficiently low to obey Henry’s Law. This behavior is
observed for sorption in rubbery polymers at low pressures (<105 Pa).
The permeability is independent of pressure, and is expressed as:
D k� D= Eq (2.14)
where D is the diffusion coefficient (taken as a constant).

Chapter 2. Background on gas transport 24
2.4.2.2. The Langmuir-type sorption
When polymers contain dispersed porous particles such as carbon black or silica
gel, or when dyes are sorbed by polymers containing polar groups, a Langmuir-type
sorption can be observed at low pressure. The gas molecules are believed to be sorbed in
the microvoids of the polymers. The concentration C is given by:
p b1
p b 'CC H
+= Eq (2.15)
where p is the equilibrium pressure in cmHg, CH’ is the hole saturation constant in
(cm3@STP/cm3) and b is the hole affinity constant in cmHg-1.
2.4.2.3. The DMS model
Unlike what is observed in rubbery polymers, the equilibrium concentration of a
gas in a glassy polymer is not directly proportional to the applied pressure. Indeed, it has
been observed experimentally that the sorption isotherm is linear only at low and high
pressure, while the intermediate range is concave to the pressure axis. An empirical
model, referred to as the dual mode sorption (DMS) model [94] bases its theory on the
excess free volume present in glassy polymers. This excess free volume, which is related
to the difference relative to the thermal expansion coefficient of a rubber, is at the origin
of the non-equilibrium nature of glassy polymers. Indeed, glassy polymers tend to
decrease their excess free volume with time. This phenomenon, known as physical aging,
lasts an extremely long time since the polymer below Tg does not have sufficient thermal
energy to attain equilibrium rapidly. Some discussion about physical aging is provided in
Chapter 3.
The DMS model assumes the existence of two kinds of free volume or holes (or
two modes) which are always in equilibrium: the Henry mode in continuous chain matrix
and the Langmuir mode in the microvoids of the excess free volume. The two types of
sorption associated with those two modes are sometimes referred to as ordinary
dissolution and hole-filling, respectively. Therefore the DMS model is a combination of

Chapter 2. Background on gas transport 25
the Henry’s Law and the Langmuir isotherm, as sketched in Figure 2.2. The Henry sites
in the dense packing region are smaller whereas the Langmuir sites, which correspond to
the packing defects, are larger and more variable in size. Those Langmuir sites arise
because of the restricted chain mobility in a glassy material; some holes remain frozen
into the material. The original model assumed that the penetrant sorbed in the Langmuir
sites were completely immobilized and did not contribute to the diffusive flux. However
this given model was modified later and postulates now that the penetrants sorbed under
both the Henry and the Langmuir modes are mobile. This model is known as the dual
mobility or the partial immobilization model, opposed to the original immobilization
model.
Henry Langmuir DMS
C
p
CC
pp
Figure 2.2: The DMS model is a combination of the Henry's law and the Langmuir isotherm
In the absence of strong interactions between the gas and the polymer that may
induce plasticization or swelling, the total concentration of the gas in the polymer (in
cm3@STP/cm3) is given by the sum of the concentration by normal dissolution and the
concentration by hole filling (assuming equivalence between pressure and fugacity):
p b1
p b 'Cp kCCC H
DHD ++=+= Eq (2.16)
where the subscript D stands for dissolved and refers to the Henry mode, while H stands
for holes and refers to the Langmuir mode. p is the equilibrium pressure in cmHg, kD is
the Henry’s law dissolution constant in (cm3@STP/cmHg.cm3), CH’ is the hole saturation
constant in (cm3@STP/cm3) and b is the hole affinity constant in cmHg-1.
At low pressure, (bp < < 1) and Eq (2.16) reduces to:

Chapter 2. Background on gas transport 26
( )p b 'CkC HD += Eq (2.17)
The sorbed gas concentration is thus directly proportional to the applied pressure.
At high pressure, (b p > > 1), the Langmuir sites are saturated, and Eq (2.16) reduces to:
'Cp kC HD += Eq (2.18)
The dual-mode parameters kD, CH’ and b can be determined as follows. The plot of
concentration versus pressure can be obtained experimentally by sorption experiments.
The values of kD, CH’ and b can be obtained by graphical interpolation, as shown in
Figure 2.3. Another kind of graphical interpolation is sometimes found in the literature.
Since C is obtained experimentally and kD can be determined from the slope at high
pressure, ( )pkCC DH −= can be plotted versus pressure. From Eq (2.16),
+
=
'C
p
b 'C
1
C
p
HHH
Eq (2.19)
The plot of (p/CH) versus pressure shows a straight line whose intercept is (1/CH’b) and
whose slope is (1/CH’). However the most accurate way to get the parameters is to do a
nonlinear regression instead of an extrapolation [87]. Indeed, the true equilibrium is not
generally reached at the end of the experiment. The Marquart algorithm for linear least
squares is generally used at this purpose.
C
CH’
slope=kD
slope=(kD+CH’b)
p
Figure 2.3: C versus p for the DMS model

Chapter 2. Background on gas transport 27
The DMS model presents an excellent agreement between theory and experiment
for glassy polymers up to 20-30 atm for several gases. It is the model the most used in the
literature by far. The model seems even applicable for the sorption of vapors through
rubbery polymers containing adsorptive fillers.
However, no direct experimental evidence of the two different sorption modes has
been observed. Several attempts have been made to confirm the validity of the DMS
model and thus the existence of two environments, namely the Henry and the Langmuir
modes. However evidence of two different holes has not clearly been confirmed so far.
The use of NMR led to conflicting conclusions. The 13CO2 NMR results obtained by Cain
et al [95] are consistent with the concept of two sorption sites (although no evidence of
their existence has been shown) whereas Sefcik and Schaefer [96] believed that two
different types of sorption sites did not exist. FTIR has been used by several researchers.
Higuchi and Nakagawa [97] did not observe two distinct peaks for CO2 in a glassy
PMMA polymer, suggesting that if indeed the two modes exist, the two modes are similar
in the spectroscopic measurements. Murata et al [98] observed two types of desorption,
referred to as rapid and slow.
Several comments can be made about the DMS model. The DMS model is only
an empirical model, which has been developed without physical interpretation. It is
basically a fitting procedure which involves three adjustable parameters kD, CH’ and b.
The values of those parameters depend strongly on the initial curvefitting guess used in a
particular algorithm, as well as on the pressure range. The parameters have to be
determined for each penetrant at each temperature since no correlations with the
properties of the gas or the polymer have been found. No prediction is therefore possible.
Furthermore, those parameters have to be different in sorption and in desorption since
hysteresis is sometimes observed while doing sorption experiments. The relaxation time
of the polymer chains, or physical aging, is not taken into account. The structure and the
morphology of the polymer is not considered either. Actually the DMS model assumes
that the structure of the polymer remains constant during the experiment, regardless of
the duration of the experiment or the pressure used. One complication also arises due to
the fact that the polymer is usually conditioned prior to experiments. This procedure may
induce irreversible changes inside the polymeric matrix. Comparison with other physical

Chapter 2. Background on gas transport 28
properties is therefore impossible. Finally, the existence of two different sorption modes
for a given polymer is quite difficult to understand on a physical basis. Indeed, it means
that there are two distinct populations of gas molecules. The model does not take into
consideration the distribution of the holes. It assumes that the expression of the gas
concentration is the same near the surface as in the bulk.
2.5. Permeation experiments
Gas permeation through non-porous homogeneous polymeric membranes occurs
by the well-known solution-diffusion model [94] suggested by Sir Thomas Graham in
1866. The permeation is believed to occur in three stages, which are
sorption/diffusion/desorption. The sorption or solution of gas molecules occurs at the
upstream side of the membrane. Because of the concentration gradient, the molecules
diffuse across the membrane before finally desorbing on the downstream side of the
membrane.
The permeation integral method [13, 99] has been widely used to analyze
permeation of a gas through a membrane. A schematic of the experimental set-up for the
integral method is given in Figure 2.4. Briefly, a membrane separates a gas at pressure pf
from a closed volume. The system is initially degased by use of a high vacuum. At t = 0,
the pressure of the feed or the upstream increases from 0 to pf. This pressure remains
constant throughout the entire experiment. As the gas permeates through the membrane
because of the concentration gradient, the pressure in the closed volume pp will rise. The
pressure in the permeate or downstream side is monitored with time, as shown in Figure
2.5.

Chapter 2. Background on gas transport 29
membrane
pf pp
x 0 l
Figure 2.4: Schematic of the integral method (pf > pp).
t (s)
Qt
(cm3@STP)
Figure 2.5: Profile obtained by permeation.
Since the thickness of the membrane is very small compared to its surface area (130µm
versus 13.36cm2, respectively, thus corresponding to a ratio of diameter/length of about
317), the flux of gas can be considered a unidirectional and perpendicular to the
membrane plane surface. A mass balance can be written on a small volume of thickness
dx located at some arbitrary position x, as shown in Figure 2.6. The general expression is:
in + production = out + accumulation + consumption Eq (2.20)
Since production = consumption = 0, we have:
gas accumulation = (in at x) - (out at (x + dx)) Eq (2.21)

Chapter 2. Background on gas transport 30
Neglecting the convection at the top and the bottom of the membrane, the mass balance
in the layer is:
[ ] dxxx JA JA Cdx A t +−=
∂∂
Eq (2.22)
where J is the flux, A is the area, C is the concentration and t is the time.
Dividing by the volume of the layer, one obtains:
[ ]xdxx JJdx
1
t
C −−= +∂∂
Eq (2.23)
From the definition of the derivative when dx ≅ 0,
−=
x
J
t
C
∂∂
∂∂
Eq (2.24)
If the appropriate initial and boundary conditions are known, the differential equation can
be solved and the concentration profile of the gas within the polymeric membrane can be
obtained.
J(x) J(x+dx)
dx
Figure 2.6: Volume of thickness dx considered in the mass balance.
The molecular diffusion of a gas through a membrane is given by the Fick’s first law of
diffusion (provided that no exceptions occur, such as crystallization or case II diffusion):

Chapter 2. Background on gas transport 31
∂∂−=x
C D(C)J Eq (2.25)
where J is the flux in (cm3@STP/cm2 s), D is the mutual diffusion coefficient in cm2/s, C
is the concentration of the gas in the polymer in (cm3@STP/cm3) and x is the distance in
cm. For weak interactive gases, D can be assumed to be independent of concentration.
The Fick’s second law of diffusion can be obtained from Eq (2.24) and Eq (2.25)
(assuming a concentration-independent diffusion coefficient D).
∂∂=
∂∂
2
2
x
C D
t
C Eq (2.26)
The time-lag method [1] is the method commonly used in the literature to get the
values of the diffusion and the solubility coefficients. It is based on the Henry's Law
given previously. Although the Henry’s Law is strictly verified for rubbery polymers
only, estimation of the transport parameters can still be made for glassy polymers at low
pressures. The concentration of the gas within the polymer is believed to be sufficiently
low to obey Henry’s Law. The time lag method is based on the following initial and
boundary conditions:
t < 0 0 ≤ x ≤ l C = 0 Eq (2.27)
t ≥ 0 x = 0 C = C2 = a constant Eq (2.28)
t ≥ 0 x = l C = 0 Eq (2.29)
The concentration profile of the gas within the polymeric membrane can therefore be
solved, given the above equations and Eq (2.26).
Unfortunately, the experimental set-up does not allow researchers to monitor directly the
concentration profile within the membrane. The permeation integral method measures the
increase in pressure in the closed volume. The flux at the end of the membrane and the
pressure in the closed volume can be easily related because of the high velocity of gases.
The delay between the exit of the gas at the end of the membrane and the reading on the
pressure transducer is obviously considered as negligible.

Chapter 2. Background on gas transport 32
The flux J in (cm3@STP/cm2 s) at x = l is equal to (Qt / A t) where Qt is the volume of the
gas that has permeated in cm3@STP, A is the area of the membrane in cm2, t is the time
in s and l is the thickness of the membrane in cm. STP stands for standard temperature
and pressure conditions (0°C and 1 atm). The volume of the gas that has permeated in a
closed volume Vd (in cm3) at time t is therefore given by:
( ) dtJAQ lx
t
0
t =∫= Eq (2.30)
The amount of the gas at STP conditions which has permeated in the closed volume can
be calculated from Eq (2.30) and compared to the experimental value obtained from the
reading of the pressure transducer.
When Eq (2.26) is solved, given Eq (2.27), Eq (2.28) and Eq (2.29), and that the solution
is entered into Eq (2.30), we obtain [1, 100]:
−−−+
= ∑
∞
=1n2
22
2
n
222t l
t�Dnexp1
n
1)(
�
2
l
DtlCQ Eq (2.31)
One can notice by doing computations that if ∑∞
=
−1n
2
n
2 n
1)(
�
2 is approximated by (-1/6), as
what is usually done in the literature [8, 101-103], Qt differs slightly from zero at t=0.
At sufficient long time, Eq (2.31) reduces to:
( )
−≅
−
+= ∑
∞
= 6D
lt
l
DC
n
1
D
l
�
2t
l
DCQ
22
1n2
n2
22
t Eq (2.32)
The plot of Qt versus t will thus be linear at sufficient long time as shown in Figure 2.7
and the slope is equal to (DC2/l). The time lag θ which is equal to (l2/6D) can be
calculated from the intercept of Qt with the time-axis. We have:
6�
lD
2
= Eq (2.33)
While doing experiments, one can notice that Qt is not necessarily exactly zero at t = 0.
The plot has to be corrected for this unaccuracy.

Chapter 2. Background on gas transport 33
θt
Qt
steadystate diffusion(constant slope)
Figure 2.7: Plot of Qt versus t showing the steady state part and the time lag θ.
If the Henry’s Law is verified,
fD2 p kC = Eq (2.34)
where pf is the pressure of the feed. From Eq (2.32), Eq (2.14) and Eq (2.34), we obtain
−=
6D
lt
l
PpQ
2f
t Eq (2.35)
Since the plot is linear at a sufficiently long time, the permeation rate is constant.
slope = t
Qt
∂∂
= constant = l
Ppf = JA Eq (2.36)
And
∂∂
=t
Q
p
lP t
f
Eq (2.37)
Finally the solubility is:
D
PkS D == Eq (2.38)
The time lag method [1] provides usually a good approximation of the transport
parameters. However, this method is based on the assumption that the pressure in the
closed volume remains negligible throughout the entire permeation process. This
assumption can be satisfied in the early part of the experiment only. Indeed, even with a

Chapter 2. Background on gas transport 34
large closed volume and a slowly permeating gas, this assumption cannot be valid as
equilibrium on both sides of the membrane is being achieved, since as the gas permeates
through the membrane the pressure in the closed volume will rise. The time lag solution
shows that the permeation rate will keep increasing indefinitely (hence the expression
steady state), which cannot be true for a closed volume since the pressure will reach a
limit when equilibrium will be attained on both sides of the membrane. The procedure to
obtain the gas transport coefficients in case of a non-negligible building-up pressure in
the closed volume has been detailed elsewhere [104]. Nevertheless, it was confirmed
from computer simulations that for the maximum pressure allowed in the closed volume
in this research project the concentration at x=l could be assumed to be negligible.
2.6. References
1. J. Crank, The Mathematics of Diffusion, second edition, Oxford Science Publications, 1975.
2. J. Comyn, editor, Polymer Permeability, Elsevier Applied Science, London, 1985. 3. W. R. Vieth, Diffusion In and Through Polymers: Principles and Applications,
Hanser, New York, 1991. 4. W. J. Koros and R. T. Chern, Separation of Gaseous Mixtures using Polymer
Membranes, Handbook of Separation Process Technology, edit. R. W. Rousseau, (1987).
5. W. J. Koros and G. K. Fleming, Membrane-based Gas Separation, Journal of Membrane Science, 83, 1-80, (1993).
6. K. Ghosal and B. D. Freeman, Gas Separation Using Polymer Membranes: An Overview, Polymer for Advanced Technologies, 5, 673-697 (1994).
7. D. R. Paul, Yuri P. Yampol’skii, editors, Polymeric gas separation membranes, CRC Press, Boca Raton, 1994.
8. J. Crank and G. S. Park (editors), Diffusion in Polymers, Academic Press, 1968. 9. R. E. Kesting and A. K. Fritzsche, Polymeric Gas Separation Membranes, John
Wiley & Sons, Inc.,1993. 10. V. Stannett, The Transport of Gases in Synthetic Polymeric Membranes- an
Historic Perspective, Journal of Membrane Science, 3, 97 (1978). 11. S. A. Stern, Polymers for Gas Separations: the Next Decade, Journal of
Membrane Science, 94, 1 (1994). 12. I. Blume, E. Smit, M. Wessling and C. A. Smolders, Diffusion Through Rubbery
and Glassy Polymer Membranes, Die Makromolekulare Chemie. Macromolecular Symposia, 45, 237 (1991).
13. R. M. Felder, Estimation of Gas Transport Coefficients from Differential Permeation, Integral Permeation, and Sorption Rate Data, Journal of Membrane Science, 3, 15 (1978).

Chapter 2. Background on gas transport 35
14. H. L. Frisch, Sorption and Transport in Glassy Polymers - A Review, Polymer Engineering and Science, 20, 1, 2 (1980).
15. W. J. Koros, Y. H. Ma and T. Shimidzu, Terminology for membranes and membrane processes, Journal of Membrane Science, 120, 149 (1996).
16. H. C. Silvis, Recent Advances in Polymers for Barrier Applications, TRIP, 5, 3, 75 (1997).
17. T. deV. Naylor, Permeation Properties, Comprehensive Polymer Science, edit. S. G. Allen and J. C. Bevington, Pergamon Press, New York.
18. B. Freeman and I. Pinnau, Separation of Gases using Solubility-selective Polymers, TRIP, 5, 5, 167 (1997).
19. X. Wang and H. G. Spencer, Polymer Membranes for Use in Food Processing, TRIP, 5, 2, 38 (1997).
20. W. R. Vieth, Membrane Systems: Analysis and Design: applications in biotechnology, biomedicine, and polymer science, Oxford University Press, 1988.
21. R.W. Baker, E. L. Cussler, W. Eykamb, W. J. Koros, R. L. Riley and H. Strathmann, Membrane Separation Systems: Recent Development and Future Directions, Noyes Data Corporation, Park Ridge, NJ, 1991.
22. J. G. A. Bitter, Transport Mechanisms in Membrane Separation Processes, Plenum Chemical Engineering Series, Plenum Press, New York, 1991.
23. R. D. Noble and S. A. Stern (editors), Membrane Separations Technology: Principles and Applications, Elsevier, 1995.
24. Starzak, M. E., The physical chemistry of membranes, Academic press, Orlando, 1984.
25. P. Neogi, editor, Diffusion in Polymers, Marcel Dekker, Inc., New York, 1996. 26. W. J. Koros, editor, Barrier Polymers and Structures, ACS Symposium Series, vol.
423, American Chemical Society, Washington D.C., 1990. 27. T. Matsuura, Synthetic Membranes and Membrane Separation Processes, CRC
press Inc.,1994. 28. K. W. Boddeker, editor, The early History of Membrane Science: Selected papers,
Journal of Membrane Science, 100, 1 (1995). 29. R. M. Felder and G. S. Huvard, Permeation, Diffusion, and Sorption of Gases and
Vapors, Methods of Experimental Physics, 16c, Chapter 17, Academic Press, NY (1980).
30. W. J. Koros and M. W. Hellums, Transport Properties, Encyclopedia of Polymer Science and Engineering, 2nd Edition, H. F. Mark, N. M. Bikales, C. G. Overberger, G. Mendes, Eds., John Wiley and Sons, New York, Supplement volume, 1989.
31. R. Rautenbach and R. Albrecht, Membrane Processes, John Wiley and Sons, New York, 1989.
32. R. E. Kesting, Synthetic polymeric membranes, 2nd ed., Wiley, New York, 1985. 33. N. Toshima, Ed., Polymers for gas separation, VCH, Deerfield Beach, FL, 1992. 34. M. Mulder, Basic principles of membrane technology, Kluwer Academic,
Dordrecht, 1991. 35. Y. Osada and T. Nakagawa, Eds., Membrane science and technology, Marcel
Dekker, New York, 1992.

Chapter 2. Background on gas transport 36
36. H. L. Frisch, Fundamentals of Membrane Transport, Polymer Journal, 23, 5, 445-456 (1991).
37. E. L. Cussler, Diffusion: mass transfer in fluid systems, Cambridge University Press, NY, 1984.
Also Second Edition, Cambridge University Press, NY, 1997. 38. H. Odani, T. Uyeda, Theories of sorption and transport in polymer membranes,
Polymer Journal, 23, 5, 467 (1991). 39. Y. Maeda and D. R. Paul, Effect of AntiPlasticization on Gas Sorption and
Transport. III. Free Volume Interpretation, Journal of Polymer Science: Part B: Polymer Physics, 25, 1005 (1987).
40. J. M. Mohr, D. R. Paul, G. L. Tullos, and P. E. Cassidy, Gas transport properties of a series of poly(ether ketone) polymers, Polymer, 32, 13, 2387-2394 (1991).
41. J. S. McHattie, W. J. Koros and D. R. Paul, Gas transport properties of polysulphones: 1. Role of symmetry of methyl group placement on bisphenol rings, Polymer, 32, 5, 840-850 (1991).
42. L. M. Costello and W. J. Koros, Temperature Dependence of Gas Sorption and Transport Properties in Polymers: Measurements and Applications, Industrial Engineering Chemical Research, 31, 2708 (1992).
43. A. Bos, I. G. M. Punt, M. Wessling, H. Strathmann, CO2-induced plasticization phenomena in glassy polymers, Journal of Membrane Science, 155, 67-78 (1999).
44. J. S. Chiou, J. W. Barlow and D. R. Paul, Plasticization of Glassy Polymers by CO2, Journal of Applied Polymer Science, 30, 2633 (1985).
45. R. G. Wissinger and M. E. Paulaitis, Glass Transitions in Polymer/CO2 Mixtures at Elevated Pressures, Journal of Polymer Science, Part B: Polymer Physics, 29, 5, 631 (1991).
46. E. S. Sanders, Penetrant-induced plasticization and gas permeation in glassy polymers, Journal of Membrane Science, 37, 63-80 (1988).
47. M. Wessling, S. Schoeman, Th. Van den Boomgaard, C. A. Smolders, Plasticization of gas separation membranes, Gas Sep. Purif., 5, 222-228 (1991).
48. Y. P. Handa, S. Lampron, M. L. O’Neill, On the plasticization of poly(2,6-dimethyl phenylene oxide) by CO2, J. Polym. Sci., Polym. Phys. Ed., 32, 2549-2553 (1994).
49. W.-C. Wang, E. J. Kramer, W. G. Sachse, Effects of high –pressure CO2 on the glass transition temperature and mechanical properties of polystyrene, J. Polym. Sci., Polym. Phys. Ed., 20, 1371-1384 (1982).
50. J. R. Fried, H.-C. Liu, C. Zhang, Effect of sorbed carbon dioxide on the dynamic mechanical properties of glassy polymers, J. Polym. Sci., Polym. Part C, 27, 385-392 (1989).
51. T. S. Chow, Molecular interpretation of the glass transition temperature of polymerdiluent systems, Macromolecules, 13, 362-364 (1980).
52. M. Wessling, Z. Borneman, Th. Van den Boomgaard, C. A. Smolders, Carbon dioxide foaming of glassy polymers, J. Appl. Polym. Sci., 53, 1497-1512 (1994).
53. H. Hachisuka, T. Sato, T. Imai, Y. Tsujita, A. Takizawa, T. Kinoshita, Glass transition temperature of glassy polymers plasticized by CO2 gas, Polymer Journal, 22, 1, 77 (1990).

Chapter 2. Background on gas transport 37
54. J.-S. Wang, Y. Kamiya, Y. Naito, Effects of CO2 conditioning on sorption, dilation, and transport properties of polysulfone, Journal of Polymer Science: Part B: Polymer Physics, 36, 1695 (1998).
55. K. Tanaka, M. Ito, H. Kita, K. Okamoto, Y. Ito, The effects of CO2-conditioning of polymers on positron annihilation and gas permeation properties, Bull. Chem. Soc. Jpn., 68, 3011-3017 (1995).
56. G. K. Fleming and W. J. Koros, Dilation of Polymers by Sorption of Carbon Dioxide at Elevated Pressures. 1. Silicone Rubber and Unconditioned Polycarbonate, Macromolecules, 19, 2285 (1986).
57. G. K. Fleming and W. J. Koros, Carbon Dioxide Conditioning Effects on Sorption and Volume Dilation Behavior for bisphenol A - Polycarbonate, Macromolecules, 23, 1353 (1990).
58. A. G. Wonders and D. R. Paul, Effects of CO2 Exposure History on Sorption and transport in Polycarbonate, Journal of Membrane Science, 5, 63 (1979).
59. S. M. Jordan, W. J. Koros, J. K. Beasley, Characterization of CO2-induced conditioning of polycarbonate films using penetrants with different solubilities, Journal of Membrane Science, 43, 103-120 (1989).
60. D. S. Pope, G. K. Fleming, W. J. Koros, Effect of various exposure histories on sorption and dilation in a family of polycarbonates, Macromolecules, 23, 2988 (1990).
61. W. R. Vieth, L. H. Dao, and H. Pedersen, Non-equilibrium microstructural and transport characteristics of glassy poly(ethylene terephthalate), Journal of Membrane Science, 60, 41-62 (1991).
62. 3��*RWWKDUGW��$��*U&JHU��+��J��%ULRQ��5��3ODHWVFKNH��DQG�5��.LUFKKHLP��9ROXPH�
change of glassy polymers by sorption of small molecules and its relation to the intermolecular space, Macromolecules, 30, 8058-8065 (1997).
63. S.-H. Chen, S.-L. Huang, K.-C. Yu, J.-Y. Lai, M.-T. Liang, Effect of CO2 treated polycarbonate membranes on gas transport and sorption properties, Journal of Membrane Science, 172, 105-112 (2000).
64. A. Bondi, Physical properties of molecular crystals, liquids, and glasses, Wiley, New York, 1968.
65. D. W. Van Krevelen, Properties of Polymers, Their correlation with chemical structure; their numerical estimation and prediction from additive group contributions, Third Ed, Elsevier, NY, 1990.
66. H. Fujita, Fortschr. Hochpolym. Forsch., 3, 1 (1961). 67. J. Y. Park, D. R. Paul, Correlation and prediction of gas permeability in glassy
polymer membrane materials via a modified free volume based group contribution method, Journal of Membrane Science, 125, 23-39 (1997).
68. Y. Yampolskii, S. Shishatskii, A. Alentiev, K. Loza, Correlations with and prediction of activation energies of gas permeation and diffusion in glassy polymers, Journal of Membrane Science, 148, 59-69 (1998).
69. W. M. Lee, Selection of barrier materials from molecular structure, Polym. Eng. Sci., 20, 65-69 (1980).
70. J. S. McHattie, W. J. Koros and D. R. Paul, Effect of isopropylidene replacement on gas transport properties of polycarbonates, Journal of Polymer Science: Part B: Polymer Physics, 29, 731-746 (1991).

Chapter 2. Background on gas transport 38
71. K. D. Dorkenoo, P. H. Pfromm. M. E. Rezac, Gas transport properties of a series of high Tg polynorbornenes with aliphatic pendant groups, Journal of Polymer Science: Part B: Polymer Physics, 36, 797-803 (1998).
72. K. Toi, H. Suzuki, I. Ikemoto, T. Ito, and T. Kasai, Permeation and sorption for oxygen and nitrogen into polyimide membranes, Journal of Polymer Science: Part B: Polymer Physics, 33, 777-784 (1995).
73. H.-J. Kim and S.-I. Hong, The transport properties of CO2 and CH4 for brominated polysulfone membrane, Korean Journal of Chemical Engineering, 16, 3, 343-350 (1999).
74. E. R. Hensema, A. P. Boom, Gas separation membranes from tailor-made polymers, 409-419 ( ).
75. A. Thran, G. Kroll, F. Faupel, Correlation between fractional free volume and diffusivity of gas molecules in glassy polymers, Journal of Polymer Science: Part B: Polymer Physics, 37, 3344-3358 (1999).
76. Y. C. Jean, J.-P. Yuan, J. Liu, Q. Deng, and H. Yang, Correlations between gas permeation and free-volume hole properties probed by positron annihilation spectroscopy, Journal of Polymer Science: Part B: Polymer Physics, 33, 2365-2371 (1995).
77. Y. Kobayashi, K. Haraya, S. Hattori, Polymer, 35, 925-928 (1994). 78. S. Trohalaki, L. C. DeBolt, J. E. Mark, H. L. Frisch, Macromolecules, 23, 813-
816 (1990). 79. I. Kresse, A. Usenko, J. Springer, V. Privalko, Gas transport properties of soluble
poly(amide imide)s, Journal of Polymer Science: Part B: Polymer Physics, 37, 2183-2193 (1999).
80. M. W. Hellums, W. J. Koros, G. R. Husk and D. R. Paul, Fluorinated polycarbonates for gas separation applications, Journal of Membrane Science, 46, 93 (1989).
81. Z. Wang, T. Chen, J. Xu, Novel poly(aryl ether ketone)s containing various pendant groups. II. Gas-transport properties, Journal of Applied Polymer Science, 1725-1732 (1997).
82. A. C. Savoca, A. D. Surnamer, and C.-F. Tien, Gas transport in poly(silylpropynes): The chemical structure point of view, Macromolecules, 26, 23, 6211-6216 (1993).
83. J. M. Mohr and D. R. Paul, Comparison of gas permeation in vinyl and vinylidene polymers, Journal of Applied Polymer Science, 42, 1711-1720 (1991).
84. L. M. Robeson, Correlation of Separation Factor versus Permeability for Polymeric Membranes, Journal of Membrane Science, 62, 165 (1991).
85. Z.-K. Xu, M. Böhning, J. Springer, F. P. Glatz, R. Mülhaupt, Gas transport properties of soluble poly(phenylene sulfone imide)s, Journal of Polymer Science: Part B: Polymer Physics, 35, 1855-1868 (1997).
86. W. J. Koros and D. R. Paul, Design considerations for Measurement for Gas Sorption in Polymers by Pressure Decay, Journal of Polymer Science: Polymer Physics Edition, 14, 1903 (1976).
87. W. J. Koros, D. R. Paul and A. A. Rocha, Carbon Dioxide Sorption and Transport in Polycarbonate, Journal of Polymer Science, Polymer Physics Edition, 14, 687 (1976).

Chapter 2. Background on gas transport 39
88. J. L. Duda and J. M. Zielinski, Free-Volume Theory, Plastics Engineering, 32, 143 (1996).
89. J. M. Zielinski and j. L. Duda, Solvent Diffusion in Polymeric Systems, Plastics Engineering, 33, 35 (1996).
90. F. Doghieri and G. C. Sarti, Nonequilibrium lattice Fluids: A Predictive Model for the Solubility in Glassy Polymers, Macromolecules, 29, 24, 7885 (1996).
91. R. M. Conforti, T. A. Barbari, P. Vinalchand, and M. D. Donohue, A lattice-based activity coefficient model for gas sorption in glassy polymers, Macromolecules, 24, 3388-3394 (1991).
92. G. Glenn Lipscomb, Unified thermodynamics analysis of sorption in rubbery and glassy materials, AIChE Journal, 36, 10, 1505 (1990).
93. D. Boudouris, C. Panayiotou, On the solubility of gas molecules in glassy polymers and the nonequilibrium approach, Macromolecules, 31, 7915-7920 (1998).
94. W. R. Vieth, J. M. Howell and J. H. Hsieh, Dual Sorption Theory: Review Paper, Journal of Membrane Science, 1, 177-220 (1976).
95. E. J. Cain, W. Y. Wen, A. A. Jones, P. T. Inglefield, B. J. Cauley and J. T. Bendler, A Dual Mode Interpretation of Spin Relaxation for 13CO2 Sorbed in Polycarbonate, Journal of Polymer Science: Part B: Polymer Physics, 29, 1009 (1991).
96. M. D. Sefcik and J. Schaefer, Solid-state carbon-13 NMR evidence for gas-polymer interactions in the carbon dioxide-polyvinyl chloride system, Journal of Polymer Science: Polymer Physics Edition, 21, 7, 1055-62 (1983).
97. A. Higuchi and T. Nakagawa, Infrared Spectroscopic studies of CO2 Sorbed in Glassy and Rubbery Polymeric membranes, Journal of Polymer Science: Part B: Polymer Physics, 32, 1, 149 (1994).
98. K. Murata, S. Ogawa, E. Watanabe, Y. Hayashi, S. Yamashita, FT-IR measurements of some greenhouse gases in thin film of poly(methyl methacrylate), Vibrational Spectroscopy, 13, 235 (1997).
99. D. G. Pye, H. H. Hoehn and M. Panar, Measurement of Gas Permeability of Polymers. I. Permeabilities in Constant Volume / Variable Pressure Apparatus, Journal of Applied Science, 20, 1921 (1976).
100. R. D. Seigle and R. W. Coughlin, Errors in Diffusivity as Deduced from Permeation Experiments using Time Lag Technique, Journal of Applied Polymer Science, 14, 3145 (1970).
101. D. R. Paul and A. T. DiBenedetto, Diffusion in Amorphous Polymers, Journal of Polymer Science: Part C, 10, 17 (1965).
102. F. Vasak and Z. Broz, A method for determination of Gas Diffusion and Solubility coefficients in Poly(vinlytrimethylsilane) using a personal computer, Journal of Membrane Science, 83, 265 (1993).
103. J. B. Alexopoulos, J. A. Barrie and D. Machin, The Time Lag for the Diffusion of Gas Mixtures, Polymer, 10, 4, 265 (1969).
104. Christelle M. Laot, Understanding gas transport in physically aged, oriented and pressure densified amorphous glassy bisphenol-A polycarbonate, PhD preliminary examination thesis, Virginia Polytechnic Institute and State University, VA, USA, December 17, 1999.
Chapter 3
Literature review on physical aging and orientation, and
their effects on the gas transport properties
3.1. Introduction
Backgrounds about physical aging and orientation are given in the first two
sections of this chapter. Reviews of the pertinent literature concerning gas transport and
physical aging, and gas transport and orientation, respectively, are then provided.
3.2. Physical aging
The excess free volume trapped in glassy polymers is at the origin of the non-
equilibrium nature of the glassy state. The trapped volume can be visualized as dynamic
microvoids or holes, with a distribution of sizes and shapes, dispersed inside the
polymeric matrix. The size of the holes is on the order of Å. Glassy polymers tend to
decrease their excess free volume with time by undergoing further chain packing. This
phenomenon is referred to as physical aging or structural relaxation. Several reviews
address this topic in the literature [1-12]. Obviously, the relaxation towards equilibrium is
a self-retarding process, which takes an extremely long time since polymers below their
glass transition temperature Tg do not have sufficient thermal energy to attain equilibrium

Chapter 3. Literature review on physical aging and orientation, and their effects on the gas transport properties 41
rapidly. The adjective "physical" is added to distinguish this particular aging
phenomenon from other types of aging (chemical, biological, etc). Physical aging does
not modify the structure of the polymers permanently; reversible changes in properties
are always possible. The aging process is common to all glasses, and it can also be
observed above Tg for semi-crystalline materials and polymers with fillers. Note though
that no “true” physical aging should be possible above Tg if the glass transition peak (as
seen in DMTA experiments for instance) is fully relaxed. Physical aging is generally
monitored at constant temperature as a function of the logarithm of sub-Tg annealing
time, although it could also be characterized by following changes with pressure or
volume.
This section is dedicated to physical aging. Origin and typical aspects of physical
aging are reviewed in the first subsection. Macrostructural and microstructural properties
are discussed and compared in the second subsection. What one does know about
physical aging and what remains to be solved is then mentioned. A short paragraph on the
physical aging of polycarbonate is finally given.
3.2.1. Origin and typical aspects
3.2.1.1. Origin
Physical aging has been explained based on the same principles used to
understand the glass transition temperature. The non-equilibrium nature of the glassy
state has been attributed to the presence of free volume dispersed inside the polymeric
matrix.
Physical aging can be understood by looking at
Figure 3.1. The polymer in the liquid state is in equilibrium. However, as it is
cooled down below Tg at a constant cooling rate, properties such as specific volume,
enthalpy, and entropy deviate away from the equilibrium liquidus line. The polymer now
possesses some excess thermodynamic quantities. The extent of the deviation from
equilibrium depends on the rate of cooling. Indeed, Tg is not a true second order
transition. It is a second order phase transition as defined by Ehrenfest [13] in the sense

Chapter 3. Literature review on physical aging and orientation, and their effects on the gas transport properties 42
that the first derivatives of the Gibbs free energy (the specific volume V, the enthalpy H,
and the entropy S) are continuous at Tg, whereas the second derivatives (the heat capacity
Cp, the isobaric coefficient of thermal expansion α, and the isothermal compressibility β)
are discontinuous at Tg. However Tg is only a pseudo second order phase transition due to
the fact that the glass is not a stable phase. Tg is a time-dependent quantity: the greater the
cooling rate, the higher the value of Tg [14-22]. The Tg is actually defined as the
temperature at which the free volume, or rather the mobility, is high enough to allow
long-range cooperative motions of the molecules. The α-relaxation results from motions
of the large segments of the polymer backbone. Actually, concerning the pseudo second
order phase transition of the glass transition temperature, it is worth pointing out also that
in volume relaxation measurements the Tg appears to be a second order transition in
cooling but a first order transition in heating [20].
As the polymer is annealed at a temperature Te below Tg, values of V, H, and S decrease
gradually towards equilibrium and the property reaches a value Xg after some time t at Te
(see
Figure 3.1). If enough time is allowed, the property may eventually reach the equilibrium
liquid line. The rate towards equilibrium depends on the proximity of the sub-Tg
annealing temperature Te to Tg, as well as on chemical and structural factors. The greater
the supercooling, the longer is the timescale of the relaxation process because of the
reduced mobility. The lower the amount of free volume or configurational entropy, or the
higher the coupling of the relaxation, the greater is the value of the relaxation time, and
the slower the aging rate. Changes in the physical properties of the polymers have been
found to depend on the value of Te as well as on the aging time te.
When the aged polymer is heated back, it overshoots the equilibrium line at a temperature
Tf referred to as the fictive temperature (see
Figure 3.1). Tf may not be the same for all properties. Obviously, the longer the annealing
time, the greater the difference between Tf and Tg. Initially, Tg and Tf are similar, and at
equilibrium, Tf and Te would be the same. The overshoot comes from the difference
between the rates of cooling and heating. As a sample is quenched rapidly from above Tg
and annealed for some time, the sample can be considered as slow cooled. Therefore,

Chapter 3. Literature review on physical aging and orientation, and their effects on the gas transport properties 43
when it is heated back there is a difference between slow cool and fast heat resulting in
an overshoot.
Tg Temperature
property X (V, H, S)
GLASS RUBBER
Te Tf
Xg
Non-equilibrium excess free volume
0
t
∞ equilibriu
m line
Figure 3.1: Schematic of property X (V, H, S) as a function of temperature showing the non-equilibrium excess free volume present in glassy polymers.
Physical aging is commonly studied at a given temperature and changes are
monitored with time. The time-dependent structural changes affect any property that is a
function of molecular mobility and especially the mechanical properties of the materials
[1-11]. Yield stress, stiffness, deflection temperature, flexural and tensile strength, and
elastic modulus are increased with sub-Tg annealing. Ductility, toughness, fracture
energy, strain at break, and creep and stress relaxation rates are decreased. A transition
from ductile behavior to brittle fracture is also observed with aging. The impact strength
of amorphous polymers shows a discontinuity after some critical aging time. Aging has
also a significant effect on the physical and thermal properties of polymers, such as
density, refractive index, glass transition temperature, permeability, dielectric constant,
specific volume, dimensions, etc. The enthalpy is also reduced since the endotherm area
observed in DSC experiments is increased with aging.

Chapter 3. Literature review on physical aging and orientation, and their effects on the gas transport properties 44
Physical aging is generally explained based on the free volume concept outlined
by Struik [1]. Below Tg the remaining free volume allows local motions and therefore
conformational rearrangements. The molecules can oscillate between a limited number of
conformations with minimum energy. With time, the free volume content contained in a
glassy polymeric matrix decreases. The free volume concept is very useful in the sense
that it gives a physical picture of the relaxation process. The concept originates from the
work of Doolittle [23], who used it to describe the variation of the viscosity of liquids
above Tg. Several theories, such as the one leading to the Williams, Landel, and Ferry
(WLF) equation [24], have been based on the free volume idea. Although those theories
should work strictly above the glass transition temperature Tg, they have been shown to
be still useful in a range close to Tg. The glass transition temperature should not be
explained based on the structure of the polymer since the same phenomenon is also
observed in glassy metals, and low molecular weight or inorganic glassy materials.
Nevertheless, the definition of the free volume is not that precise, and actually
different definitions can be found in the literature. The most common definition is that of
fractional free volume, f, evaluated from the expression:
V
V
V
VVf fo =
−= Eq (3.1)
where V is the actual volume and Vo is the occupied volume. Thus Vf is the dynamic free
volume or the excess space unoccupied by the molecules. It arises from the random
arrangement of the molecules. The variation of the free volume with temperature has also
been investigated. Above Tg, the following expression was suggested by Fox and Flory
[25]:
f = 0.025 + ∆α (T - Tg) Eq (3.2)
where ∆α is the difference between the thermal expansion coefficient above Tg and
below Tg. Below Tg the fractional free volume is believed to remain constant and equal to
0.025.
However, the free volume concept remains fairly simple and is not enough to
completely explain physical aging. Specimens of the same glassy polymer can have the
same density, and therefore the same free volume, but still not the same thermal history,

Chapter 3. Literature review on physical aging and orientation, and their effects on the gas transport properties 45
and thus not necessarily the same properties. When a polymer that has been aged at a
temperature Te is heated to a higher temperature than Te, but still below Tg, deaging
effects are visible. In the early times, the polymer eliminates some of its thermal history,
and then starts aging over again. That polymeric samples show memory effects has been
studied extensively by Kovacs [26, 27]. The fact that the samples seem to remember their
previous thermal histories is attributed to the existence of a distribution of relaxation
times. Using a single relaxation time to model the aging phenomena is therefore
completely inadequate. Furthermore, the relaxation is also characterized by a non-
linearity, as discussed later in the subsection dealing with volume relaxation.
3.2.1.2. Typical aspects
The typical aspects of physical aging have been outlined by Struik [1]. They are
summarized below.
• Aging in amorphous polymer glasses occurs between the highest secondary transition
temperature (Tβ) and Tg. For instance, the temperature range for polycarbonate is
between -100oC and 150oC. Some researchers believe that the temperature range in
which physical aging occurs is much smaller, however this may be due to the
differences in the sensitivities of the techniques used to monitor aging.
• Aging is a reversible phenomenon. Indeed, previous histories can be erased by
heating the sample above Tg or by rejuvenating it.
• Aging primarily affects relaxation times τ. τ increases with the aging time te.
• The aging time is the dominant aging parameter. Indeed, the retardation time τ is
given as follows:
( )ege T Tk t2 −= Eq (3.3)
The difference between Tg and Te cannot be that large, and therefore te happens to be
the parameter to manipulate. The Arrhenius-type thermal activation used for instance
for secondary relaxations does not apply to aging studies. Sometimes aging effects
appear stronger at lower temperature than at higher temperature.

Chapter 3. Literature review on physical aging and orientation, and their effects on the gas transport properties 46
• The WLF superposition concepts apply to physical aging at constant temperature for
a limited range below Tg. The WLF time-temperature superposition on unaged
materials is carried out by following changes in the material at different temperatures.
However here the rate of aging depends on the aging temperature Te. When a polymer
is aged at Te, the shapes of the resulting curves are the same. Time-aging time
superposition is achieved by shifting curves both horizontally and vertically with
respect to a reference time. The shift rate µ is however defined only with respect to
horizontal shifting. Consequently, we have:
edlogt
dloga� = Eq (3.4)
where a is the WLF shift factor. The shift rate µ is generally very close to 1 just
below Tg for amorphous polymers in the linear viscoelastic range. However the
quantitative analysis is complicated by the fact that vertical shifts are generally
performed. Furthermore, one has to be aware that this time-aging time superposition
is based on the assumption that the relaxation strength remains constant and that the
relaxation time distribution keeps the same shape on aging, which is not necessarily
true. Actually, the data are sometimes impossible to superpose.
• Mechanical stresses have a strong effect on aging. Applying a stress before, during,
and after aging leads to an acceleration of the aging, a retardation, and a deaging
effect, respectively [5].
3.2.2. Macrostructural and microstructural properties
Physical aging can be observed macroscopically by studying volume or enthalpy
relaxation, as well as microscopically by spectroscopic or scattering techniques. The
methods used in both cases and the results relevant to physical aging are summarized in
the following subsections.

Chapter 3. Literature review on physical aging and orientation, and their effects on the gas transport properties 47
3.2.2.1. Macrostructural relaxation
Changes in bulk properties have been investigated by several techniques, such as
dilatometry, differential scanning calorimetry (DSC), creep, stress relaxation, dynamic
mechanical analysis (DMA), tensile testing, and dielectric constant. Experimental results
obtained by the first four methods can be extensively found in the literature.
3.2.2.1.1. Volume relaxation
Volume relaxation is assessed by dilatometry. Although dilatometers provide
excellent data, the number of studies is rather limited because of the lack of commercial
equipment. The specific volume is measured as a function of temperature at a constant
heating rate. As a polymer is annealed at a temperature Te, its volume decreases as well
as the value of its glass transition temperature Tg. The specific volume is observed to
decrease linearly with the logarithm of annealing time.
The relative departure from equilibrium is given by:
∞
∞−=
V
VV/V Eq (3.5)
where V is the volume and V∞ is the equilibrium volume at constant temperature. δV is
usually plotted as a function of log(t-ti) where ti is the initial time.
The volume relaxation rate βV is expressed as:
( ) ( )ii
VV ttdlog
dV
V
1
ttdlog
d/�
−−≈
−−= Eq (3.6)
The value of βV has to be obtained at sufficient long aging times to ensure that the delay
before the inflection slope has indeed been reached.
The essential features of the structural relaxation, i.e. the distribution of relaxation times
and the non-linearity of the response are clearly observed by dilatometry. The distribution
of relaxation times is reflected by the memory effects, as studied extensively by Kovacs
[26, 27]. The non-linearity of the relaxation is observed while studying the kinetics of

Chapter 3. Literature review on physical aging and orientation, and their effects on the gas transport properties 48
isothermal recovery for a sample that is heated or cooled from a particular temperature.
Although the magnitude of the temperature departure is the same for both expansion and
contraction experiments (but of opposite signs), response curves are asymmetrical [27].
The equilibrium appears to be approached more rapidly by contraction (∆T < 0) than by
expansion (∆T > 0). In addition, the relaxation is much slower than the exponential
because of the two features of the relaxation, which are its distribution and its non-
linearity.
The shape of the curves of the volume relaxation rates versus temperature are different
for each polymer [22]. Usually the relaxation rate increases with temperature up to below
Tg and then drops significantly. The maximum relaxation rate values obtained just below
Tg differ also from one polymer to another. However in the case of PMMA two lower
maxima are observed near the secondary transition temperatures [22].
The effective relaxation time is given by:
dt
d/
/
1
2
1 V
Veff
−= Eq (3.7)
A phenomenon referred to as the τeff paradox is sometimes mentioned in the literature. It
is explained as follows. Indication of the temperature at which the relaxation time at
equilibrium has been achieved is not sufficient; the path taken to equilibrium also affects
the value of τeff at equilibrium. This paradox is a serious problem for the concepts
outlined in the literature aimed at describing the glassy state. So far, only the coupling
model [28] has been successful in describing the τeff paradox. The mathematical models
will not be outlined in this literature review. The reader can refer to some excellent
review if interested [4].
3.2.2.1.2. Enthalpy relaxation
Numerous differential scanning calorimetry (DSC) studies related to aging are
available in the literature [29-42]. The experimental apparatus is simple to use and DSC
equipment is easily found in research laboratories. A polymeric sample and a reference

Chapter 3. Literature review on physical aging and orientation, and their effects on the gas transport properties 49
material are heated at a constant rate, the difference in the electrical power needed for
each is calculated, and the specific heat is given as a function of temperature. The
enthalpy recovery (or enthalpy relaxation) is obtained by integrating the DSC scan. When
a polymer has been aged at Te well below Tg, its DSC scan shows an endothermal peak
around Tg. This overshoot peak increases in magnitude with te and the position of the
maximum Tmax shifts to higher temperatures. Furthermore, the higher the annealing
temperature, the higher is the value of Tmax at the same annealing time. It has been
demonstrated that Tmax increases linearly with Te and with log te. As expected from free
volume concepts, the glass transition temperature increases with annealing time.
The distribution of relaxation times can be observed by the presence of an overshoot peak
in the DSC scan, however enthalpy relaxation studies do not show the non-linearity
aspect of the behavior, as do volume relaxation studies (see above).
The excess enthalpy δH is given by:
∞−= HH/ tH Eq (3.8)
where Ht is the enthalpy at some time t and H∞ is the equilibrium enthalpy. δH has been
shown to be linearly dependent on log te. In order to get the value of H∞, samples have to
be scanned until no further change can be noticed in DSC traces. Obviously, the higher
the annealing temperature, the faster the achievement of the equilibrium.
The enthalpy relaxation rate βH is expressed as:
dlogt
d/� H
H −= Eq (3.9)
The experimental error is quite large for δH, at least much larger than for δV. In order to
eliminate errors due to sample-to-sample variation, instrumental baseline and calibration
drift, and differences in location of the sample within the DSC cell, the following
procedure has to be done. Aged samples which have been scanned and are therefore in
the liquid state, and thus in equilibrium, have to be rapidly cooled and reheated one more
time. The two scans are superimposed and the difference in the areas under the two
curves can be evaluated.
Moreover, since DSC uses a heating scan mode, the history of the sample becomes quite
complex, since additional aging is occurring during the measurement. Indeed, the thermal

Chapter 3. Literature review on physical aging and orientation, and their effects on the gas transport properties 50
cycle consists of three steps: cooling rate from the melt, annealing time at constant
temperature, and heating rate. If the sample is prepared outside the DSC apparatus, the
history is even more complex since some time at room temperature is also involved. Sub-
and upper-Tg peaks are sometimes observed when specimens are reheated immediately
after a quench [31]. DSC traces carry out contributions from both enthalpy and volume.
Modulated or oscillating DSC (referred to as MDSC) has been recently applied to study
the aging process [43]. The advantage of this new technique is that the non-reversing and
the reversing components can be separated. The former component indicates the enthalpy
relaxation endotherm, whereas the latter gives the step change in Cp at Tg.
3.2.2.1.3. Mechanical and dielectric responses
The changes seen in the fundamental thermodynamic quantities are also reflected
in the mechanical properties. Creep and stress relaxation tests are commonly carried out
to study physical aging. Shift factors can easily be obtained from those two types of tests.
Tensile testing also shows that the modulus and the yield point are increased with
annealing [2, 44]. The yield stress and the drawing stress have been reported to increase
linearly with log aging time [44]. Dielectric studies carried out on polycarbonate [45]
showed that a new peak appeared at short aging time. The magnitude of the β-relaxation
was found to decrease with aging [45, 46].
3.2.2.1.4. Conclusions
Structural relaxation occurring in the glassy state can be characterized by
dilatometry, DSC, and mechanical and dielectric responses.
Physical aging is accompanied by decreases in volume and enthalpy. Although
the responses given by dilatometry and DSC follow a similar trend, the physical aging
rates are not identical in their magnitudes and vary also from one polymer to another.
There is no simple correction factor that can account for the difference. The rate of the
volume relaxation is generally considered to be greater than the one for enthalpy
relaxation [4, 47]. Furthermore, the time scale for volume relaxation is shorter than that

Chapter 3. Literature review on physical aging and orientation, and their effects on the gas transport properties 51
for enthalpy relaxation. Equilibrium is indeed generally achieved faster in dilatometry
than in DSC. In a careful study, Plazek and co-workers [48] have nevertheless concluded
that for polystyrene the time for recovery of enthalpy and volume is the same, but the rate
of recovery of the volume is faster. Molecular motions do not always contribute to a
change in volume. Since the rates of volume and enthalpy relaxations are not equal, the
thermodynamic description of the glassy state may require more than one additional
parameter in addition to temperature and pressure. Mechanical measurements may be
more correlated to one type of relaxation than another. Yield stress data for polycarbonate
for instance follow enthalpy relaxation better than volume relaxation [33]. Mechanical
response tends to reach equilibrium before the volume [49].
3.2.2.2. Microstructural aspects
Bulk properties are rather interesting in characterizing physical aging and
distribution of relaxation times, however they do not give any insight about the nature of
the processes taking place at the molecular level. However, the macroscopic properties
can be interpreted only if the microscopic-scale phenomena are understood. Other
techniques have to be used to probe mobility on a molecular scale and to investigate the
molecular reorganizations taking place in the system with sub-Tg annealing. Those
techniques are reviewed in the next section.
3.2.2.2.1. Electron spin resonance (ESR)
ESR measures the motion of nitroxide radicals. Both spin probes or spin labels
(radical covalently bonded to the polymer) can be used. Radicals have been shown to be
sensitive to their local environment as they diffuse into polymers. Aging is characterized
by following the change in T50G. T50G refers to the temperature at which an abrupt change
is observed for 50G. Although the results so far have been more qualitative than
quantitative, ESR has the potential to reveal the existence of the distribution of free
volume [50].

Chapter 3. Literature review on physical aging and orientation, and their effects on the gas transport properties 52
3.2.2.2.2. Fluorescence spectroscopy
Fluorescence spectroscopy seems to provide the most valuable results for aging
studies, although the literature remains relatively sparse on the subject. While probing the
structure of the polymer with fluorescent molecules, an increase in fluorescence intensity
is attributed to a reduction in molecular mobility. Fluorescence spectroscopy has been
able to examine a distribution of free volume as well as to observe memory effects [51].
However the most interesting feature of these fluorescence studies is that the relative
departure from equilibrium δF is similar to that of enthalpy relaxation. As for volume and
enthalpy relaxations, δF has also been shown to increase linearly with log te [52].
3.2.2.2.3. Positron annihilation
Positron annihilation lifetime spectroscopy (PALS) has been proven to be an
effective tool in studying the free volume between different polymeric materials. It is at
the moment the only technique believed to give an indication of the free volume directly.
For a more comprehensive review of the subject, one can consult several reviews in the
literature [16, 53-55]. Nevertheless a number of limitations are also associated with
PALS. Briefly, PALS has been shown to measure both the free volume and the free
volume distribution. Please note that this free volume is referred to as holes in the
literature concerning PALS. PALS can probe spherical holes of about 0.5Å to 10Å,
having a lifetime of at least 10-9s. Three annihilation processes are possible for the
positron (the antiparticle of the electron), each decay mode having its own characteristic
lifetime (referred to as τ1, τ2, and τ3). The area under each of the three decay curves
provides information about three intensities called I1, I2, and I3. The lifetime τ3 is
proportional to the average hole size, whereas the relative intensity I3 provides a measure
of the concentration or number of holes. Therefore, with the knowledge of those two
quantities it is possible to calculate the hole size distribution. The fractional free volume
for polycarbonate has been given as the product of τ3, I3, and a constant C (with C =
0.0018%-1ns-1 for polycarbonate [53, 55-58]). Changes in τ3 and I3 are however very

Chapter 3. Literature review on physical aging and orientation, and their effects on the gas transport properties 53
limited when studying aging compared to changes observed between various polymer
structures.
PALS studies on physical aging have reached the following conclusions. It has
been found that on aging at temperatures below the glass transition range, the free
volume holes in polycarbonate do not decrease in size but rather in number [54, 59-63].
Indeed, τ3 was reported to remain relatively constant with aging whereas I3 was
significantly reduced. Therefore, the free volume decreased with aging, although the
average hole size remained unaffected by aging. It should be pointed out, however, that
PALS results were specific to the polymer and cannot be generalized.
Nevertheless the PALS data are prone to problems while studying the physical
aging phenomenon. Indeed, it has been shown that radiation effects from the source can
also induce a reduction in intensity [4, 53, 63]. The longer the positron exposure time, the
more is the reduction in intensity. Since PALS requires a minimum exposure time of 0.5h
to get enough data to generate a smooth decay curve convertible to a mathematical
expression, short aging time cannot be studied with the PALS technique because of the
changes induced during the data collection. However, charging effects were determined
not to be significant for polycarbonate when sensitive spectrometers were used [63, 64].
The results found in the literature are sometimes very misleading since they are plotted
on a linear scale instead of a logarithmic one [54, 59, 61, 63, 65]. Anomalies in the PALS
fitting procedure have also been pointed out [63].
PALS remains a static measure of the free volume. Although PALS gives the hole
size directly, it cannot provide information on the mobility of this free volume.
In addition to PALS which measures the time of emission, two other techniques
based on positron annihilation are also available. Those techniques are angular
correlation of annihilation radiation (ACAR) and Doppler broadening spectroscopy
(DBS). Energies of positron annihilation are obtained by the former technique, momenta
by the latter one. ACAR can provide information about the geometry of the holes [66].

Chapter 3. Literature review on physical aging and orientation, and their effects on the gas transport properties 54
3.2.2.2.4. Photochromic probes and labels
UV-vis spectroscopy can detect the changes between the absorption spectra of
reversible trans and cis-isomers of chromophores. Those changes appear in
chromophores when there is sufficient molecular mobility. The free volume environment
can thus be probed as a function of aging. It has been reported by photochromic probes
that aging was due to a rapid reduction in the fraction of sites with large free volume [67-
69]. The results were however incompatible with volume relaxation results by about one
order of magnitude.
3.2.2.2.5. Infrared and Raman spectroscopies
Molecular motions can be characterized by infrared spectroscopy (IR). The
effects of annealing and aging on the IR spectra of polycarbonate have been investigated.
Conformational rearrangements were found to take place with annealing. The population
of low energy trans-trans conformations increased while the trans-cis ones decreased
[70]. In contrast, infrared data collected on amorphous PET showed a drive towards a
more random structure. Annealing was accompanied by changes from a trans to a gauche
conformation [71]. The structural rearrangements observed with annealing seemed
therefore to depend on the polymer. One has to realize however that those conformational
changes may not always induce a change in volume and thus a densification. Infrared
studies by Heymans [70] have also shown that rejuvenation (or deaging of the glass) by
cold-drawing induces an increase in the trans-cis conformation.
Raman difference spectroscopy has been used by Stolarski et al [72, 73] to
demonstrate intermolecular cooperative motion in polycarbonate. Frequency shifts in
aged samples due to conformational changes were observed to take place within the
material with aging. Therefore, aging seemed to result from the drive towards a low
energy conformation of the polymer chains.

Chapter 3. Literature review on physical aging and orientation, and their effects on the gas transport properties 55
3.2.2.2.6. Other methods
Several NMR studies using different techniques have shown that some low
energy motions are present with aging [74-79].
The effects of physical aging on the gas transport properties will be reported in a
separate subsection.
Small angle X-ray scattering (SAXS) measures density fluctuations inside
polymers and thus the nonuniform distribution of local free volume. Unfortunately SAXS
remains a static measure of the free volume. The local free volume distribution in
polycarbonate is known to be quite broad. Quite surprisingly, changes occurring in the
thermal density fluctuations of isotropic polycarbonate with aging appear only in a
limited range around Tg (from 130 to 147oC) [80]. This is observed independently of the
aging time and the aging temperature. No changes could be detected at lower temperature
where volume and enthalpy are considerably reduced. Unfortunately bulk properties yield
information about an average free volume. Curro and Roe [80] suggested two possible
explanations. The first one is that the timescale for changes in density fluctuations was
much longer than that of volume or enthalpy relaxations. However this seems rather
unlikely. The second explanation is that the average size of a free volume hole increased
with aging while the free volume still decreased. The change in the density fluctuation is
function of both the size of the holes and the free volume fraction and can be modeled.
Based on the mathematical expression, if the density fluctuation remained constant, the
size of the hole had to increase with aging.
3.2.2.3. Conclusions
Based on the previous discussions, it is rather clear that the phenomena observed
macroscopically and the ones taking place at the molecular level are quite different.
Changes in bulk properties are measured for all glassy polymers. The response is
therefore universal. Nevertheless, the rates of the relaxations observed by dilatometry and
DSC are not similar. No explanation has been found so far. The enthalpy may be more
connected to the microscopic scale than one tends to believe. Changes observed at the

Chapter 3. Literature review on physical aging and orientation, and their effects on the gas transport properties 56
molecular level cannot be considered as universal anymore. They seem to depend on the
chemical structure of the polymer of interest.
3.2.3. Physical aging: what is known and what remains to be known
3.2.3.1. What is known
The physical aging phenomenon results from a driving force towards equilibrium.
The free volume concept alone is not sufficient to explain physical aging. Indeed,
two specimens of the same glassy polymer can have the same density and therefore the
same free volume content, but still not the same thermal history and thus not necessarily
the same properties. It has also been shown that an identical amount of aged volumetric
departure from equilibrium cannot correspond to the same conformational structure
because of the occurrence of crossing phenomena [81]. Properties may become controlled
by the free volume content as the polymers approach the glass transition region [82].
The polymer chains have to reorganize themselves with time or to change their
conformations in order to reach the equilibrium state.
Cooperativity concepts are likely to come into play in any physical aging picture.
However those concepts may be needed only for longer-range motions, or at higher
thermal energy levels. Localized motions and their dynamics seem to have an importance
as well.
Any theory that intends to explain or model the aging process should be able to
explain the time-dependent properties, the memory effects, the non-linearity, the
asymmetry, and the τeff paradox.

Chapter 3. Literature review on physical aging and orientation, and their effects on the gas transport properties 57
3.2.3.2. What remains to be known
There remain several unanswered questions concerning physical aging.
The temperature range over which physical aging occurs is still a controversial
subject. Struik [1] postulated that aging is taking place between Tβ and Tg. However there
is a body of evidence that showed that this should also occur at lower temperatures than
Tβ [22, 81].
The use of different techniques leads to different physical aging rates. There
appears to be no simple correlation between the volume and the enthalpy relaxation rates
of various polymers [4, 44]. The rate for volume relaxation is generally considered to be
greater than the one for enthalpy relaxation [4, 47]. In a careful study, Plazek and co-
workers [48] have concluded that for polystyrene the time for recovery of enthalpy and
volume is the same, but the rate of recovery of the volume is faster. The shift factors of
creep and enthalpy relaxations have also been found to differ [44]. The factors that
influence the rates (and possibly the timescales) of physical aging remain to be found.
Also, the correlations (if any) between on one side the volume and the enthalpy
relaxations and on the other side mechanical properties such as creep and stress
relaxations (that are believed to reflect the structural motions) should be investigated.
The nature and the dynamics of the microscopic molecular changes and their
effects on the longer-range cooperative motions that lead to changes in the macroscopic
properties are not fully understood.
The details of the molecular reorganizations need to be known.
The crossing phenomenon observed by dilatometry at temperatures below Tβ or
slightly above in atactic polystyrenes remains to be explained [81]. The kinetic theories
that postulate the existence of an extrapolated equilibrium state and the convergence of
the volumetric departure from equilibrium with time, hence the total free volume

Chapter 3. Literature review on physical aging and orientation, and their effects on the gas transport properties 58
dependence of the volume recovery, are unable to do so. The experimental results show
that the volumetric relative departure from equilibrium does not converge with time.
Instead, when the atactic polystyrene samples are quenched from various temperatures
above Tg to the aging temperature, the response of the greater temperature crosses with
time other curves obtained at lower temperatures of quenching.
Orientation has been shown to increase the density of polycarbonate [83-88] and
hence reduce the free volume content. The value of the glass transition temperature Tg
has also been found to increase with stretching [85, 87]. However when aging studies are
conducted on uniaxially oriented amorphous glassy polymers, volume relaxation is
enhanced by one order of magnitude in both cold and hot drawn samples despite the
much higher density [83-86, 89-91]. Quite surprisingly, the creep aging rates were found
to be reduced with orientation, in spite of the increase in the volume recovery [86].
Actually it should be pointed out that some researchers believed at the time of their
publications that free volume was increased as a result of the cold-drawing process [83,
90, 92, 93].
Furthermore, enhanced physical aging has also been observed on pressure-
densified amorphous polystyrene samples [94]. The samples were densified by applying a
given pressure above Tg and by releasing it afterwards at room temperature.
Addition of low molecular weight additives in polycarbonate also resulted in a
densification of the material and an acceleration of the volume recovery [95]. However in
this particular case, the increased mobility was attributed to antiplasticization effects. The
free volume theory cannot account for the plasticization of polar polymers by water either
[96]. Although the density increases with water, the Tg decreases, in contradiction with
the free volume theory. It has been postulated that water breaks intermolecular hydrogen
bonds leading to a greater chain mobility.
The results outlined above suggest that the concept of free volume commonly
used to provide a physical picture of physical aging may not be adequate. According to
the free volume theory [1] a higher density should result in a lower mobility, and thus a
lower aging rate. Instead, enhancement of physical aging has been observed in oriented
and pressure densified polymers.

Chapter 3. Literature review on physical aging and orientation, and their effects on the gas transport properties 59
One could postulate that the nature of aging is different in the linear and the non-
linear viscoelastic ranges. Nevertheless, a study by Costa et al [97] on completely
amorphous 100% cis PTBA pointed out the importance of the microstructure. In this
particular study, it was observed that packing was accelerated with aging in the higher
density samples.
There must be another order parameter which could be used to determine the
mechanical properties of glassy materials. The distribution of free volume, the degree of
short-range structural order, or the shape of the free volume holes as well as polymer
chain dynamics, may be also important in determining the mechanical and physical
properties of glassy materials. It has been known for a long time that knowledge of the
free volume alone does not allow prediction of the future behavior of the polymers. For
instance, two polymers can have the same density, but completely different properties
because of a difference in the free volume distribution. One sample could have been
prepared under elevated pressures, while another oriented, yet another isothermally aged,
etc. The memory effects studies by Kovacs [26] are also a manifestation of this fact.
Based on evidence found in the literature, such as rejuvenation studies (aging was found
not to be erased by deformation, in contradiction with the free volume theory) [98-100]
or SAXS data on anisotropic samples [83, 90], local ordering is likely to be a very
important parameter in determining the physical aging rate of oriented polymers,
especially at temperatures below the glass transition region. The width of the free volume
distribution of polycarbonate was observed by SAXS to increase with cold-drawing and
to decrease with further annealing [83, 90]. Thermal density fluctuations of undrawn
samples on the other hand have been shown to remain constant with aging, independently
of the aging time and aging temperature [80, 90]. Cold-drawing was believed to generate
cavities on the small-scale side of the distribution, which relaxed first with aging [83]. It
was observed that density fluctuations in hot-drawn specimens were similar to those of
isotropic samples [90]. A more random structure was observed by SAXS in pressure
densified polymers [94]. Rejuvenation studies of McKenna and co-workers by torsional
deformation [99], creep [100], and stress relaxation [98] have pointed out the invalidity
of the free volume theory. For instance, it was observed that aging was not erased by
deformation [100]. Struik [1] believes that some free volume is created whenever there is

Chapter 3. Literature review on physical aging and orientation, and their effects on the gas transport properties 60
a deformation, regardless of whether it is a tensile, a compressive, or a shear deformation.
This would explain rejuvenation or deaging of the glass under high stresses. Struik [101]
has attempted to justify the data of McKenna and co-workers (mentioned above) from his
view point. However results obtained by Van Dilk [102] have not found an explanation
so far by the defender of the free volume concepts. The volume was found by Van Dilk to
decrease linearly in uniaxial compression. Furthermore, as suggested by Song and Roe
[94], the Tg may not be an iso-free volume state, but a state of iso-relaxation time,
depending not only on the amount of free volume, but also on the state of local packing
of segments. In fact, the concept of an iso-free volume Tg has been shown to be
inconsistent with isochoric results [103].
The cavity sizes affected by physical aging are not well-established. Contradictions
can be found in the literature for polycarbonate for instance. The average hole size is said
to decrease with time [104], to increase [80], or to remain unaffected by aging [54, 59-63,
105].
Finally, it is worth pointing out the results of a study by Wimberger-Friedl and de
Bruin [95]. The researchers measured the density of isotropic polycarbonate at room
temperature over a very long aging time period of as much as seven years. The resolution
of the density gradient column was maintained at about 4×10⁵ g/cm3. Quite surprisingly,
the change in specific volume was found to be accelerated after a period of about six
months at room temperature. The slope increased by at least one order of magnitude. The
results indicated that the mobility of the system could not be completely attributed to the
free volume. It seems therefore impossible to predict long-term behavior from short-time
tests. Furthermore, it also means that equilibrium could possibly be reached at some finite
time. Note that the findings of Wimberger-Friedl and de Bruin [95] have been confirmed
in a recent publication by Robertson and Wilkes using a dilatometer [106]. Polycarbonate
did present a change in its volume relaxation rate after about six months at room
temperature, whereas atactic polystyrene did not. The fact that polycarbonate is capable
of crystallizing, whereas atactic polystyrene is not, was pointed out by the researchers.
Nevertheless, no signs of crystallinity were found on the polycarbonate samples.

Chapter 3. Literature review on physical aging and orientation, and their effects on the gas transport properties 61
3.2.4. Physical aging of polycarbonate
Polycarbonate is often considered as a reference polymer. It should therefore
behave like the other polymers. However, polycarbonate presents some particularities.
For example, it is difficult to crystallize under normal conditions [107-109], no strain-
induced crystallization occurs, aging accelerates at room temperature after a period of
about six months [95], the entanglement molecular weight is rather low (about 4,800
g/mol [110]), the maximum shift rate is rather high (about 1.2 [1]), and the characteristic
ratio C∞ is very low (about 2.4).
At (Tg-15oC) the volume relaxation rate of polycarbonate (PC) is given as about
8x10⁻⁴ per decade and that of the enthalpy relaxation rate as about 0.6 J-1g per decade [4].
The relaxation rates are therefore much higher than those of PMMA for instance
measured at (Tg-15oC) as well (4x10⁻⁴and 0.4 J-1g per decade, respectively) [4]. Although
PVC and PS showed similar volume relaxation rates than the volume relaxation rate of
PC, they do possess higher enthalpy relaxation rates [4]. At (Tg-20oC) the creep and the
enthalpy relaxation shift rates of PC were found to differ (µ=0.87 and µH=0.49,
respectively) [44]. This suggests that mechanical responses age faster than does the
enthalpy (assuming that the theoretical models are correct). The relaxation time spectra
may also be different in both cases.
Using photochromic probes it has been determined that all the cavity sizes in PC
decreased equally with physical aging [105]. In contrast, a rapid reduction in the amount
of large free volume sites in PS and PMMA has been observed by the same technique,
therefore indicating a system-dependent relationship [67, 68, 111].
All typical polymers should behave similarly with aging at a macroscopic level. If
there is any difference between two polymers, this has to occur at the microscopic level
due to changes in the chemical structure.

Chapter 3. Literature review on physical aging and orientation, and their effects on the gas transport properties 62
3.3. Orientation
As a sample is stretched uniaxially, the chains orient themselves in the draw
direction. The degree of orientation increases as the temperature decreases (at constant
strain rate) and as the strain rate increases (at constant temperature) [112]. This degree is
quantified in the literature by two quantities: the draw ratio λ and the Hermans’
orientation function f.
The draw ratio λ is defined as follows:
=
0l
l� Eq (3.10)
where l represents the length after the stretch and lo the initial length before stretching.
The draw ratio is related to the strain ε by the following relationship:
01� += Eq (3.11)
The Hermans’ orientation function f is defined as follows:
2
1�cos 3f
2 −= Eq (3.12)
The angle θ represents the angle between the reference axis and the polymer chain axis.
The value of f varies from +1 to 0 to -0.5 for orientation that are respectively parallel,
random and perpendicular to the uniaxial direction. A schematic is provided in Figure
3.2.

Chapter 3. Literature review on physical aging and orientation, and their effects on the gas transport properties 63
MD
TD
f = 1
f = 0
f = -0.5
Figure 3.2: Schematic showing the various values of the Hermans’ orientation function f. The value of f varies from 1 (parallel orientation to the uniaxial direction) to 0 (random) to –0.5 (perpendicular). MD and TD stand for the machine and the transverse directions, respectively. The lines at f = -0.5 and f = 1 correspond to fully oriented polymer chains.
Various techniques such as electron microscopy, sonic velocity, small-angle
neutron scattering, birefringence, X-ray scattering and linear dichroism are capable of
measuring the orientation of molecular chains and structures. The reader can refer to a
review by Wilkes [113] for further insight on the use of various techniques in
determining molecular orientation in polymers. Linear dichroism and birefringence are
the most common techniques used to study orientation in polycarbonate [66, 84-87, 114-
117]. A characteristic of infrared dichroism is that it gives information on the orientation
of very localized parts of a molecular chain. The birefringence method provides only
information about an average orientation of the molecules.
3.4. Physical aging and gas transport
The effects of physical aging on the gas transport properties of various polymers
have been reported in the literature [118-126]. The gas transport parameters, namely the
permeability coefficient P, the diffusion coefficient D, and the solubility coefficient S,
were observed to decrease with aging time. Most of the data were analyzed in terms of
the dual mode sorption model (DMS) presented in Chapter 2. CH' has been shown to be

Chapter 3. Literature review on physical aging and orientation, and their effects on the gas transport properties 64
the only parameter dependent on aging [119]. CH' has been reported to be directly related
to the enthalpy of the material [119]. However the variations observed seem rather large
to draw conclusions. Moreover, the limitations of the DMS model have been given in
Chapter 2.
The vast majority of published data about physical aging and gas transport should
be looked at very carefully. Most of the published data was obtained on conditioned
samples, i.e. samples that had been exposed for some time to the highest pressure to be
used in the experiment. The applied pressures were typically in the order of 20 to 30atm.
The conditioning process enabled researchers to obtain reproducible data, unfortunately it
may have induced irreversible structural changes inside the polymer as well [57, 127-
132]. The penetrant could have induced some morphological changes by conformational
rearrangements and consequently changed the free volume distribution. An hysteresis
between sorption and desorption is typically observed for CO2. Exposure of
polycarbonate to high pressures of CO2 was reported from positron annihilation lifetime
spectroscopy (PALS) measurements to increase not only the hole content but the average
hole size as well, indicating a broader hole size distribution [57]. After deaging, the
samples could not recover the same characteristics they had before exposure. In addition,
the conditioning time is not clearly reported in the literature, and therefore it seems
difficult to compare data obtained by different research groups for the same polymer/gas
system. The state of the sample should depend on the exposure time as well as on the
resting time before characterizing the samples. Furthermore, exposure of a polymer to
hydrostatic pressure may accelerate the rate of aging after releasing of the pressure [5].
Polymer films are also commonly used as as-received or cast from solution. The majority
of published data from the membrane community has been obtained on as-received
samples. Results may be complicated by the orientational state of the polymer since
commercial films are very often oriented to some extent. The thermal history needs to be
better controlled as this affects the properties tremendously. Solvents can also induce
orientation [133] or even crystallize the polymers [134]. Carbon dioxide is generally used
to study aging effects; however the fact that the gas induces plasticization [127-132, 135-
151] may complicate the analysis. It has been shown that the Tg in bisphenol-A

Chapter 3. Literature review on physical aging and orientation, and their effects on the gas transport properties 65
polycarbonate for instance can drop by as much as 50oC for a CO2 absorbed mass
fraction of 0.05 [150]. Exposure to CO2 has been observed to reverse the effect of sub-Tg
annealing in polycarbonate [150, 151]. CO2 in the gas state is even capable of inducing
crystallization in some polymers [152]. Finally, the aging results reported in the literature
were in general based on gas sorption rather than gas permeation experiments. Gas
sorption experiments measure the amount of gas sorbed in a polymer as a function of
pressure. Each data point is obtained at pseudo-equilibrium and this may take a few days
to collect one data point. A sorption experiment can easily take more than a month to be
completed [153], and therefore the polymer cannot be assumed to remain the same
throughout the experiment because of aging effects.
Acceleration of aging has been reported to take place in thin membranes [154-
156]. For films of sub-micron thickness, the lower the thickness, the greater is the loss in
permeability with sub-Tg annealing, and the better is the selectivity between two gases.
One may also point out that the fact that the membranes were cast from solution onto a
glass plate may have induced some orientation. And this orientation may have
accelerated aging (see above). Two mechanisms of free volume loss have been suggested
by McCaig et al [157] for the sub-micron thickness films: a thickness dependent free
volume diffusion to the film surface and a thickness independent lattice contraction. In
addition, the glass transition of sub-micron thickness films has also been shown to
depend nonlinearly on the thickness [158]. The lower the thickness, the lower is the Tg.
This thickness dependent Tg has been used to predict the acceleration of aging in thin
films [159]. The aging rate determined from gas transport measurements were also shown
to be different at the surface and in the bulk [160]. The gas transport physical aging rate
in sub-micron thickness films has been shown to be significantly reduced by crosslinking
the polymer [161].
New gas transport studies free of the complications listed above should be
conducted in order to confirm the trends reported in the literature.

Chapter 3. Literature review on physical aging and orientation, and their effects on the gas transport properties 66
3.5. Orientation and gas transport
The morphology of the polymer is expected to highly affect the gas transport
properties. Nevertheless, little is known about the importance of molecular orientation on
the gas transport properties of amorphous glasses. The few papers dealing with this
subject are sometimes complicated by the presence of strain-induced crystallinity in the
polymeric samples. The few studies dealing with orientation and gas transport are
reviewed below.
The effect of uniaxial orientation on the gas transport properties of poly(vinyl
chloride) (PVC) was investigated by El-Hibri and Paul [162]. This study remains the
most complete in the field of gas transport and orientation. The permeability coefficient
of He and Ar were found to decrease with orientation. Quite interestingly, when the
permeability coefficient was plotted as a function of the drawing temperature, a strong
change in slope was noticed at about (Tg + 15oC), for a draw ratio of 3. In contrast, the
curve corresponding to a draw ratio of 1, i.e. to the isotropic sample, decreased
monotonically with the drawing temperature. Unfortunately the gas transport results were
presented for a single draw ratio λ of 1 and 3. It would have been better to present those
as a function of a particular Hermans’ orientation function f since the relation between λ
and f is not always linear [85]. Furthermore it is not clear whether the draw ratios of 3
obtained at various temperatures, both below and above Tg, correspond to the same
Hermans’ orientation function. Actually, the crosshead speed below Tg corresponded to
25% of the value of the speed above Tg. This change in crosshead speed is likely to
change the value of f. The observed birefringence was reported as a function of the
drawing temperature for the draw ratio of 3, although no change in slope was observed at
Tg. Since the observed birefringence is not always equal to the orientational birefringence
(especially below Tg where distortional birefringence cannot be neglected [84]), the
correlations between observed birefringence and gas transport can yield erroneous
results. At a stretching temperature of (Tg + 25oC), the gas transport parameters were
given as a function of the birefringence. The permeability coefficient was found to
decrease almost linearly as a function of the birefringence for He, Ar, and N2. A change

Chapter 3. Literature review on physical aging and orientation, and their effects on the gas transport properties 67
in slope was observed at a birefringence value of about 4×10⁻³ for both the diffusion and
the solubility coefficients of Ar and N2 (determination of those of He were impossible).
The solubility coefficient decreased initially with birefringence and remained constant
after this particular value of about 4×10⁻³ for the birefringence, whereas the decrease in
the diffusion coefficient was accelerated after this particular value. Quite interestingly,
the density was observed to remain constant throughout the whole birefringence range,
indicating that the gas transport parameters may not be directly related to the amount of
free volume. However mention of the presence of crystallinity in the commercial PVC
samples raises some doubts about the conclusions of this publication. The researchers
actually showed that annealing the PVC above Tg generated some secondary
crystallization. The effect of crystallinity on gas transport properties is well-documented
[163-167]. The crystals are impermeable to the gas molecules and therefore gas
molecules have to travel around them. Relationships have been determined between the
gas transport parameters and the crystallinity. The solubility coefficient S is reduced with
crystallinity as follows:
( )caaa X1 SX SS −== Eq (3.13)
where Xc is the fraction of crystallinity, Xa the amorphous fraction, and Sa the solubility
coefficient of the amorphous material. The diffusion coefficient does not decrease
proportionally to the decrease of the amorphous fraction. The change in the diffusion
coefficient D is given by:
2
DD a= Eq (3.14)
where Da is the diffusion coefficient in the amorphous polymer and τ is the tortuosity
factor. τ depends on the degree of crystallinity, and on the size, shape, and distribution of
the crystallites as well. El-Hibri and Paul [162] determined that the secondary
crystallization rate of PVC was maximal at a drawing temperature of (Tg + 25oC).
Similarly, the diffusion coefficient of isotropic PVC was observed to present a minimum
at the same drawing temperature. The solubility coefficient presented a maximum at the
same point. It seems, therefore, that their gas parameter results obtained for isotropic

Chapter 3. Literature review on physical aging and orientation, and their effects on the gas transport properties 68
samples at least (that were given the same thermal treatment as the anisotropic samples)
were highly complicated by the presence of crystallinity.
Wang and Porter [163] investigated the CO2 permeation of uniaxially hot-drawn
atactic polystyrene (PS) samples. No crystallinity was apparently detected in the samples
after drawing. The permeability and the diffusion coefficients were found to decrease
with drawing, while the solubility coefficient remained constant. The decrease in the
diffusion coefficient was attributed to the restriction in diffusion generated by orientation.
However the fact that CO2 plasticizes polymers [127-132, 135-151] complicates the
results. The Tg and the density were nevertheless found to remain unaffected by drawing,
in agreement with the solubility results. Therefore, the free volume in PS seems to remain
constant with drawing.
Shelby and co-workers [168] investigated the room temperature oxygen
permeability of hot-drawn polycarbonate films (Tstretch = 160oC). It was observed that the
permeability first increased up to a draw ratio of about 1.25, and then decreased linearly
with the draw ratio. Quite interestingly, the density was found to present a minimum at
the same critical point. The maximum in the permeability was attributed to an increase in
free volume initially with stretching.
Smith and Adam [169] studied the permeability coefficient of nitrogen through
polycarbonate. The polymer was directly stretched inside the permeation apparatus and
measurements were taken as a function of the strain. At 128oC, i.e. about 22oC below Tg,
the permeability coefficient increased with stretching, but the response could be separated
into two parts. At strain levels under 3%, the increase in the permeability coefficient was
attributed to an increase in free volume, whereas above 3% (the upper experimental limit
being 5%), the increase was assigned to crazing. The gas transport behavior of a cold-
drawn polyimide film was studied as well by the same researchers. The behavior
appeared as extremely complex since the response was completely different at 72oC
compared to 125oC (both temperatures being much lower than the Tg of polyimide). The
gas used in this study concerning polyimide was chosen as CO2 and not N2. The

Chapter 3. Literature review on physical aging and orientation, and their effects on the gas transport properties 69
permeability coefficient was found to increase with strain at 72oC. However at 125oC, it
first increased, and at about 2% started to decrease almost linearly with the strain. A
change in the microstructure of the polyimide was believed to be responsible for the
changes. Since no physical tests were performed, it is rather difficult to explain the data.
Muzovskaya and Malkin [170] reported that the diffusion coefficient of oxygen in
polycarbonate increased with uniaxial orientation, and decreased in compression.
Unfortunately, no reference was given in the publication [170] and no trace of such data
could be found in the literature.
Barker et al [171] observed a linear relationship between the logarithm of the
preexponential factor for diffusion Do and a well-established function involving the draw
ratio taken from the rubber elasticity theory. The relationship was verified using various
gases in a series of poly(alkyl methacrylates) stretched uniaxially above Tg and quenched
immediately after drawing. It should be noted that the permeation experiments were
performed at temperatures below Tg. The Do value is likely to be different above Tg,
though.
The various results discussed above suggest that the influence of orientation on
the gas transport parameters is rather complex. Further studies need to be conducted.
Especially, a polymer that does not show any signs of strain-induced crystallization has to
be selected in order to isolate the effect of the amorphous orientation only. Moreover,
gases that do not induce any plasticization effects have to be chosen, in order to isolate
free volume changes due only to orientation.
Chapter 3. Literature review on physical aging and orientation, and their effects on the gas transport properties 70
3.6. References
1. L. C. E. Struik, Physical aging in amorphous polymers and other materials, Elsevier, New York, 1978.
2. M. R. Tant and G. L. Wilkes, An overview of the nonequilibrium behavior of polymer glasses, Polymer Engineering and Science, 21, 14, 874 (1981).
3. J. M. Hutchinson, Relaxation processes and physical aging, in The Physics of Glassy Polymers, edited by R. N. Haward and R. J. Young, Chapman & Hall, London, 1997.
4. J. M. Hutchinson, Physical aging of polymers, Prog. Polym. Sci. , 20, 703 (1995). 5. R. P. Chartoff, Thermoplastic polymers, in Thermal characterization of polymeric
materials, E. A. Turi, edt, Academic Press, NY, 548-573 (1997). 6. L. C. E. Struik, Aging, Physical, Encyclopedia of Polymer Science and
Engineering, vol 1, 595-611, Wiley, NY (1985). 7. J. M. O'Reilly, Review of structure and mobility in amorphous polymers, CRC
critical reviews in solid state and materials sciences, 13, 3, 259-277 (1987). 8. J. Mijovic, L. Nicolais, A. D’Amore, J. M. Kenny, Principal features of structural
relaxation in glassy polymers- A review, Polymer Enginering and Science, 34, 5, 381 (1994).
9. S, Matsuoka, Free volume, excess entropy and mechanical behavior of polymeric glasses, Polymer Engineering and Science, mid-october, 21, 14, 907-921 (1981).
10. J.-C. Bauwens, Physical aging: relation between free volume and plastic deformation, in Failure of plastics, W. Brostow and R. D. Corneliussen, edts, Hanser Publishers, Munich (1986).
11. L. C. E. Struik, Physical aging: influence on the deformation behavior of amorphous polymers, in Failure of plastics, W. Brostow and R. D. Corneliussen, edts, Hanser Publishers, Munich (1986).
12. R. A. Pethrick, Physical aging – an old problem revisited, TRIP, 1, 8, 226-227 (1993).
13. P. Ehrenfest, Leiden Comm. Suppl., 756 (1933). 14. Dr. Hervé Marand, lecture notes. 15. B.–S. Hsu, S.-H. Kwan, Directional anisotropy of dielectric β-relaxation in
oriented poly(ethylene terephthalate), Journal of Polymer Science: Polymer Physics Edition, 14, 1591 (1976).
16. D. M. Bigg, A review of positron annihilation lifetime spectroscopy as applied to the physical aging of polymers, Polymer Enginering and Science, 36, 6, 737 (1996).
17. W. J. Davis and R. A. Pethrick, Investigation of physical ageing in polymethylmethacrylate using positron annihilation, dielectric relaxation and dynamic mechanical thermal analysis, Polymer, 39, 2, 255 (1998).
18. A. J. Kovacs, J. J. Aklonis, J. M. Hutchinson, and A. R. Ramos, Isobaric volume and enthalpy recovery of glasses. II. A transparent multiparameter theory, Journal of Polymer Science: Polymer Physics Edition, 17, 1097-1162 (1979).
19. J. M. Hutchinson, J. J. Aklonis, and A. J. Kovacs, A new phenomenological approach to volume recovery in glasses, Polymer preprints, 16, 2, 94-99 (1975).

Chapter 3. Literature review on physical aging and orientation, and their effects on the gas transport properties 71
20. A. J. Kovacs, A multiparameter approach for structural recovery of glasses and its implication for their physical properties, in Structure and mobility in molecular and atomic glasses, edited by J. M. O’Reilly and M. Goldstein, Annals of the New York Academy of Sciences, 371, 38-66 (1981).
21. H. Hachisuka, H. Takizawa, Y. Tsujita, A. Takizawa, and T. Kinoshita, Gas transport properties in polycarbonate films with various unrelaxed volumes, Polymer, 32, 13, 2382-2386 (1991).
22. R. Greiner and F. R. Schwarzl, Thermal contraction and volume relaxation of amorphous polymers, Rheologica Acta, 23, 378-395 (1984).
23. A. K. Doolittle, Studies in Newtonian flow - II - The dependence of the viscosity of liquids on free-space, Journal of Applied Physics, 22, 12, 1471-1475 (1951).
24. M. L. Williams, R. F. Landel and J. D. Ferry, J. Am. Chem. Soci., 77, 3701 (1955).
25. T. G. Fox and P. J. Flory, J. Appl. Phys., 21, 581 (1950). 26. A. J. Kovacs, Transition vitreuse dans les polymères amorphes- Etude
phénomenologique, Fortschr. Hochpolym.- Forsch., 394-507 (1963). 27. J. J. Aklonis and A. J. Kovacs, A new look at the glass transition, 267- ( ). 28. R. W. Rendell, K. L. Ngai, G. R. Fung and J. J. Aklonis, Macromolecules, 20,
1070-1083 (1987). 29. I. M. Hodge, Enthalpy relaxation and recovery in amorphous materials, Journal of
non-crystalline solids, 169, 211 (1994). 30. J. H. Wendorff, Enthalpy relaxation and thermal density fluctuations, Journal of
Polymer Science: Polymer Letters Edition, 17, 765 (1979). 31. M. Ruddy and J. M. Hutchinson, Multiple peaks in differential scanning
calorimetry of polymer glasses, Polymer communications, 29, 132 (1988). 32. C. Bauwens-Crowet and J.-C. Bauwens, Annealing of polycarbonate below the
glass transition:quantitative interpretation of the effect on yield stress and differential scanning calorimetry measurements, Polymer, 23, 1599 (1982).
33. C. Bauwens-Crowet, J. C. Bauwens, Annealing of polycarbonate below the glass transition temperature up to equilibrium: a quantitative interpretation of enthalpy relaxation, Polymer, 27, 709 (1986).
34. R.-J. Roe, S. K. Lo and R. P. Chartoff, The enthalpy relaxation of poly(vinyl chloride) annealed below the glass transition temperature, Polym. Prepr., Am. Chem. Soc., Div. Polym. Chem., 17(2), 167 (1976).
35. C. B. McGowan, D. Y. Kim and R. B. Blumstein, Kinetics of enthalpy relaxation upon physical aging in glassy main-chain nematic polymers, Macromolecules, 25, 4658-4664 (1992).
36. A. R. Berens, I. M. Hodge, Effects of annealing and prior history on enthalpy relaxation in glassy polymers -1- Experimental study on poly(vinyl chloride), Macromolecules, 15, 756-761 (1982).
37. I. M. Hodge and A. R. Berens, Effects of annealing and prior history on enthalpy relaxation in glassy polymers -2- Mathematical modeling, Macromolecules, 15, 762-770 (1982).
38. I. M. Hodge and G. S. Huvard, Effects of annealing and prior history on enthalpy relaxation in glassy polymers -3- Experimental and modeling studies of polystyrene, Macromolecules, 16, 371-375 (1983).

Chapter 3. Literature review on physical aging and orientation, and their effects on the gas transport properties 72
39. J. J. Tribone, J. M. O'Reilly, and J. Greener, Analysis of enthalpy relaxation in poly(methyl methacrylate): effects of tacticity, deuteration, and thermal history, Macromolecules, 19, 1732-1739 (1986).
40. J. M. O'Reilly and I. M. Hodge, Effects of heating rate on enthalpy recovery in polystyrene, Journal of non-crystalline solids, 131-133, 451-456 (1991).
41. A. Agrawal, Effect of temperature and molecular weight on enthalpy relaxation in polystyrene, Journal of Polymer Science: Part B: Polymer Physics, 27, 1449-1461 (1989).
42. I. M. Hodge, Effects of annealing and prior history on enthalpy relaxation in glassy polymers - 4 - Comparison of five polymers, Macromolecules, 16, 898-902 (1983).
43. K. Takahara, H. Saito, T. Inoue, Physical aging in poly(methyl methacrylate) glass: densification via density fluctuation, Polymer, 40, 3729-3733 (1999).
44. J. M. Hutchinson, S. Smith, B. Horne, and G. M. Gourlay, Physical aging of polycarbonate: enthalpy relaxation, creep response, and yielding behavior, Macromolecules, 32, 5046-5061 (1999).
45. L. Guerdoux, E. Marchal, Physical ageing of PMMA and polycarbonate in the region of secondary relaxation, Polymer, 22, 1199 (1981).
46. H. Higuchi, Z. Yu, A. M. Jamieson, R. Simha, and J. D. McGervey, Thermal history and temperature dependence of viscoelastic properties of polymer glasses: relation to free volume quantities, Journal of Polymer Science: Part B: Polymer Physics, 33, 2295-2305 (1995).
47. J. M. G. Cowie, S. Harris, and I. J. McEwen, Physical aging in poly(vinyl acetate) 2- Relative rates of volume and enthalpy relaxation, Macromolecules, 31, 2611-2615 (1998).
48. S. L. Simon, D. J. Plazek, B. J. Harper, and T. Holden, The rates of volume and enthalpy aging do not seem to be the same. Following on polystyrene, PSME Preprints, 76, 334 (1997).
49. G. B. McKenna, Y. Leterrier, C. R. Schultheisz, Polym. Eng. Sci., 35, 403 (1995). 50. G. G. Cameron, I. S. Miles, A. T. Bullock, Br. Polym. J., 119, 129-134 (1987). 51. J. S. Royal, J. M. Torkelson, Macromolecules, 25, 1705-1710 (1992). 52. J. S. Royal, J. M. Torkelson, Macromolecules, 26, 5331-5335 (1993). 53. R. A. Pethrick, Positron annihilation – a probe for nanoscale voids and free
volume? Progress in Polymer Science, 22, 1-47 (1997). 54. J. E. Kluin, H. Moaddel, M. Y. Ruan, Z. Yu, A. M. Jamieson, R. Simha, J. D.
McGervey, Probe spectroscopy, free volume concepts, and physical aging of polymer glasses, in Structure-property relations in polymers: spectroscopy and performance, ACS, 236, 535-555 (1993).
55. G. P. Simon, The use of positron annihilation lifetime spectroscopy in probing free volume of multicomponent polymeric systems, TRIP, 5, 12, 394 (1997).
56. Y. C. Jean, J.-P. Yuan, J. Liu, Q. Deng, and H. Yang, Correlations between gas permeation and free-volume hole properties probed by positron annihilation spectroscopy, Journal of Polymer Science: Part B: Polymer Physics, 33, 2365-2371 (1995).
57. Y. C. Jean, X. Hong, J. Liu, C. M. Huang, H. Cao, C. Y. Chung, G. H. Dai, K. L. Cheng, H. Yang, High sensitivity of positron annihilation lifetime to time and

Chapter 3. Literature review on physical aging and orientation, and their effects on the gas transport properties 73
pressure effects in gas-exposed polymers, Journal of Radioanalytical and Nuclear Chemistry, Articles, 210, 2, 513-524 (1996).
58. X. Hong, Y. C. Jean, H. Yang, S. S. Jordan, W. J. Koros, Free-volume hole properties of gas-exposed polycarbonate studied by positron annihilation lifetime spectroscopy, Macromolecules, 29, 7859-7864 (1996).
59. A. J. Hill, I. M. Katz and P. L. Jones, Isothermal volume relaxation in aged polycarbonate measured by positron annihilation lifetime spectroscopy, Polymer Enginering and Science, 30, 13, 762 (1990).
60. T. C. Sandreczki, X. Hong, and Y. C. Jean, Sub-glass-transition-temperature annealing of polycarbonate studied by positron annihilation spectroscopy, Macromolecules, 29, 4015-4018 (1996).
61. A. J. Hill, C. M. Agrawal, Positron lifetime spectroscopy characterization of thermal history effects on polycarbonate, Journal of Materials Science, 25, 5036-5042 (1990).
62. T. C. Sandreczki, X. Homg, and Y. C. Jean, Sub-glass-transition temperature annealing of polycarbonate studied by positron annihilation spectroscopy, Macromolecules, 29, 4015-4018 (1996).
63. J. E. Kluin, Z. Yu, S. Vleeshouwers, J. D. McGervey, A. M. Jamieson, R. Simha, Temperature and time dependence of free volume in bisphenol A polycarbonate studied by positron lifetime spectroscopy, Macromolecules, 25, 19, 5089 (1992).
64. W. J. Davis and R. A. Pethrick, Positron annihilation studies of physical ageing in polycarbonate, Eur. Polym. J., 34, 12, 1747-1754 (1998).
65. A. J. Hill, K. J. Heater, C. M. Agrawai, The effects of physical aging in polycarbonate, Journal of Polymer Science: Part B: Polymer Physics, 28, 387 (1990).
66. Y. C. Jean, Y. Rhee, Y. Lou, D. Shelby, G. L. Wilkes, Anisotropy of hole structures in oriented polycarbonate probed by two-dimensional angular correlation of annihilation radiation, Journal of Polymer Science: Part B: Polymer Physics, 34, 2979-2985 (1996).
67. J. G. Victor and J. M. Torkelson, Macromolecules, 20, 2241-2250 (1987). 68. J. G. Victor and J. M. Torkelson, Macromolecules, 21, 3490-3497 (1988). 69. J. S. Royal and J. M. Torkelson, Macromolecules, 25, 4792-4796 (1992). 70. N. Heymans, FTIR investigation of structural modification of polycarbonate
during thermodynamical treatments, Polymer, 38, 14, 3435 (1997). 71. R. S. Moore, K. K. O'Loane and J. C. Shearer, Fourier transform infrared
characterization of conformational changes in amorphous poly(ethylene terephthalate) during volume recovery, Polymer Engineering and Science, 21, 14, 903 (1981).
72. V. Stolarski, A. Letton, E. Nour, J. Laane, Conformational changes and physical aging in bisphenol-A polycarbonate; origins of mechanical properties, ANTEC’94, 2077 (1994).
73. V. Stolarski, A. Letton, S. N. Lee, J. Laane, Conformational changes and physical aging in bisphenol-A polycarbonate; origins of mechanical properties, Polym. Mater. Sci. Eng., 71, 479-480 (1994).
74. J. Schaefer, E. O. Stejskal, R. A. McKay, W. T. Dixon, Macromolecules, 17, 1479 (1984).

Chapter 3. Literature review on physical aging and orientation, and their effects on the gas transport properties 74
75. M. P. Henrichs, M. Linder, et al., Macromolecules, 17, 2412 (1984). 76. M. P. Henrichs, V. A. Nicely, Macromolecules, 24, 2506 (1991). 77. J. Y. Iho, A. F. Yee, Macromolecules, 24, 1905 (1991). 78. M. P. Henrichs, V. A. Nicely, Macromolecules, 23, 3193 (1990). 79. M. P. Henrichs, H. R. Luss, R. P. Scaringe, Macromolecules, 22, 2731 (1989). 80. J. J. Curro and R.-J. Roe, Isothermal relaxation of specific volume and density
fluctuation in poly(methyl methacrylate) and polycarbonate, Polymer, 25, 1424 (1984).
81. H. H. D. Lee and F. J. Mc Garry, Some previously unexpected phenomena of volume recovery, J. Macromol. Sci. – Phys., B30, 3, 185-200 (1991).
82. H. Higuchi, A. M. Jamieson, and R. Simha, Free volume quantities and viscoelasticity of polymer glasses, Journal of Polymer Science: Part B: Polymer Physics, 34, 1423-1426 (1996).
83. J. Bartos, J. Muller, J. H. Wendorff, Physical ageing of isotropic and anisotropic polycarbonate, Polymer, 31, 1678 (1990).
84. M.-S. S. Wu, Intrinsic birefringence of amorphous poly(bisphenol-A carbonate), Journal of Applied Polymer Science, 32, 3263-3275 (1986).
85. M. D. Shelby and G. L. Wilkes, Thermodynamic characterization of the oriented state of bisphenol A polycarbonate as it pertains to enhanced physical aging, Journal of Polymer Science: Part B: Polymer Physics, 36, 2111 (1998).
86. M. D. Shelby and G. L. Wilkes, The effect of molecular orientation on the physical ageing of amorphous polymers - dilatometric and mechanical creep behaviour, Polymer, 39, 26, 6767-6779 (1998).
87. E. Ito, T. Hatakeyama, Studies of the amorphous region of polymers- II - Relationship between change of structure and glass-transition temperature in polycarbonate, Journal of Polymer Science: Polymer Physics Edition, 13, 2313-2320 (1975).
88. E. Ito, K. Sawamura and S. Saito, Effects of drawing on molecular motions in polycarbonate, Colloid & Polymer Sci., 253, 480-484 (1975).
89. R. Pixa, B. Grisoni, T. Gay, and D. Froelich, Influence of deformation on physical aging of polycarbonate- 2 - Volume recovery near ambient temperature, Polymer Bulletin, 16, 381-387 (1986).
90. J. Muller, J. H. Wendorff, Thermal density- Fluctuations in rejuvenated and aged polycarbonate, Journal of Polymer Science: Part C: Polymer Letters, 26, 421 (1988).
91. J.-J. Pesce and G. B. McKenna, Prediction of the subyield extension and compression responses of glassy polycarbonate from torsional measurements, J. Rheol., 41, 5, 929-942 (1997).
92. G. Yianakopoulos, J. Vanderschueren, and J. Niezette, Effect of mechanical deformations on thermally stimulated currents in polymers. 1. Uniaxially cold-drawn polycarboante, Proceedings of the 6th International Symposium on electrets (ISE 6), Oxford, England, 131-136 (1988).
93. G. Yianakopoulos, J. Vanderschueren, and J. Niezette, Sub-Tg relaxation in cold-drawn polymers. Thermally-stimulated-current methods, IEEE Transactions on electrical insulation, 24, 3, 429-438 (1989).

Chapter 3. Literature review on physical aging and orientation, and their effects on the gas transport properties 75
94. H. H. Song and R.-J. Roe, Structural change accompanying volume change in amorphous polystyrene as studied by small and intermediate angle X-ray scattering, Macromolecules, 20, 2723-2732 (1987).
95. R. Wimberger-Friedl and J. G. de Bruin, The very long-term volume recovery of polycarbonate: is self-retardation finite? Macromolecules, 29, 4992-4997 (1996).
96. J. J. Aklonis, W. J. MacKnight, M. Shen, Introduction to polymer viscoelasticity, Wiley-Interscience, NY, 1972.
J. J. Aklonis and W. J. MacKnight, Introduction to polymer viscoelasticity, 2nd edition, John Wiley & Sons, NY, 1983.
97. G. Costa, S. Chikhaoui, A. Turturro, L. Carpaneto, Physical ageing phenomena in poly(tert-butylacetylene): influence of the microstructure, Macromol. Chem. Phys., 198, 239-249 (1997).
98. D. M. Colucci, P. A. O'Connell, G. B. McKenna, Stress relaxation experiments in polycarbonate: a comparison of volume changes for two commercial grades, Polymer Engineering and Science, 37, 9, 1469 (1997).
99. M. M. Santore, R. S. Duran, G. B. McKenna, Volume recovery in epoxy glasses subjected to torsional deformations: the question of rejuvenation, Polymer, 32, 13, 2377 (1991).
100. A. Lee and G. B. McKenna, The physical ageing response of an epoxy glass subjected to large stresses, Polymer, 31, 423-430 (1990).
101. L. C. E. struik, On the rejuvenation of physically aged polymers by mechanical deformation, Polymer, 38, 16, 4053-4057 (1997).
102. D. J. Van Dijk, Thesis, Technical University, Delft, 1980. 103. D. M. Colucci, G. B. McKenna, J. J. Filliben, A. Lee, D. B. Curliss, K. B.
Bowman, J. D. Russell, Isochoric and isobaric glass formation: similarities and differences, Journal of Polymer Science: Physics Edition, 1561-1573 (1997).
104. L. B. Liu, D. Gidley, A. F. Yee, Effect of cyclic stress on structural changes in polycarbonate as probed by positron annihilation lifetime spectroscopy , Journal of Polymer Science: Part B: Polymer Physics, 30, 231 (1992).
105. J. S. Royal and J. M. Torkelson, Photochromic and fluorescent probe studies in glassy polymer matrices. 5. Effects of physical aging on bisphenol-A polycarbonates and poly(vinyl acetate) as sensed by a size distribution of photochronic probes, Macromolecules, 25, 4792 (1992).
106. C. G. Robertson and G. L. Wilkes, Long-term volume relaxation of bisphenol A polycarbonate and atactic polystyrene, Macromolecules, 33, 3954-3955 (2000).
107. A. Siegmann and P. H. Geil, J. Macromol. Sci. Phys., B4, 239 (1970). 108. A. Siegmann and P. H. Geil, J. Macromol. Sci. Phys., B4, 273 (1970). 109. A. Alizadeh, S. Sohn, J. Quinn, H. Marand, L. C. Shank, H. Darrell Iler, Influence
of structural and topological constraints on the crystallization and melting behavior of polymers: 3. Bisphenol A Polycarbonate, Macromolecules, 34, 4066-4078 (2001).
110. Richard P. Wool, Polymer Interfaces- Structure and Strength, Hanser Publishers, 1995.
111. H. L. Hampsch, J. Yang, G. K. Wong, and J. M. Torkelson, Dopant orientation dynamics in doped second-order nonlinear optical amorphous polymers. 2. Effects of physical aging on poled films, Macromolecules, 23, 3648-3654 (1990).

Chapter 3. Literature review on physical aging and orientation, and their effects on the gas transport properties 76
112. L. C. E. Struik, Internal stresses, dimensional instabilities and molecular orientations in plastics, John Wiley and Sons, New York, 1990.
113. G. L. Wilkes, Rheooptical properties, in Encyclopedia of Science and Engineering, 14 (1984).
114. E. Ito, K. Sawamura and S. Saito, Effects of drawing on molecular motions in polycarbonate, Colloid & Polymer Sci., 253, 480-484 (1975).
115. R. Song, Q. Fan, Polycarbonate films in the state of high global chain orientation but nearly random segmental orientation, European Polymer Journal, 36, 1463-1470 (2000).
116. A. C. Lunn and I. V. Yannas, Chain-backbone motion in glassy polycarbonate studied by polarized infrared spectroscopy, Journal of Polymer Science: Polymer Physics Edition, 10, 2189-2208 (1972).
117. L. Lundberg and J.-F. Jansson, Anisotropic creep behaviour of oriented polycarbonate, Polymer, 35, 10, 2084-2089 (1994).
118. H. Hachisuka, H. Takizawa, T. Tsujita, A. Takizawa, T. Kinoshita, gas transport properties in polycarbonate films with various unrelaxed volumes, Polymer, 32, 13, 2383 (1991).
119. A. H. Chan and D. R. Paul, Effect of sub-Tg annealing on CO2 sorption in polycarbonate, Polymer Enginering and Science, 20, 1, 87 (1980).
120. H. Hachisuka, Y. Tsujita, A. Takizawa, T. Kinoshita, Gas transport properties of annealed polyimide films, Journal of Polymer Science: Part B: Polymer Physics, 29, 11 (1991).
121. K. Toi, T. Ito, I. Ikemoto, Effect of aging and conditioning on the gas transport of poly(vinyl acetate), Journal of Polymer Science: Polymer Letters Edition, 23, 525-529 (1985).
122. K. Nagai, T. Nakagawa, Effects of aging on the gas permeability and solubility in poly(1-trimethylsilyl-1-propyne) membranes synthetized with various catalysts, Journal of Membrane Science, 105, 261-272 (1995).
123. Von K.-H. Illers, Einfluss der thermischen Vorgeschichte auf die Eigenschaften von Polyvinylchlorid, Die Makromolekulare Chemie, 127, 3032, 1-33 (1969).
124. T. Nakagawa, T. Watanabe, M. Mori, K. Nagai, Aging phenomena of gas permeability of poly[1-(tri-methylsilyl)-1-pripyne] and its blend polymer, Polym. Mater. Sci. Eng., 77, 249 (1997).
125. H. Hachisuka, K. Kito, Y. Tsujita, A. Takizawa, T. Kinoshita, O2 and N2 gas permselectivity of alternating copoly(vinylidene cyanide-vinyl acetate), Journal of Applied Polymer Science, 35, 1333 (1988).
126. T. L. Smith and R. E. Adam, Effect of tensile deformations on gas transport in glassy polymer films, Polymer, 22, 299-304 (1981).
127. S. M. Jordan, W. J. Koros, J. K. Beasley, Characterization of CO2-induced conditioning of polycarbonate films using penetrants with different solubilities, Journal of Membrane Science, 43, 103-120 (1989).
128. D. S. Pope, G. K. Fleming, W. J. Koros, Effect of various exposure histories on sorption and dilation in a family of polycarbonates, Macromolecules, 23, 2988 (1990).

Chapter 3. Literature review on physical aging and orientation, and their effects on the gas transport properties 77
129. W. R. Vieth, L. H. Dao, and H. Pedersen, Non-equilibrium microstructural and transport characteristics of glassy poly(ethylene terephthalate), Journal of Membrane Science, 60, 41-62 (1991).
130. A. G. Wonders and D. R. Paul, Effects of CO2 Exposure History on Sorption and transport in Polycarbonate, Journal of Membrane Science, 5, 63 (1979).
131. G. K. Fleming and W. J. Koros, Carbon Dioxide Conditioning Effects on Sorption and Volume Dilation Behavior for bisphenol A - Polycarbonate, Macromolecules, 23, 1353 (1990).
132. K. Tanaka, M. Ito, H. Kita, K. Okamoto, Y. Ito, The effects of CO2-conditioning of polymers on positron annihilation and gas permeation properties, Bull. Chem. Soc. Jpn., 68, 3011-3017 (1995).
133. Dr. G. L. Wilkes, lecture notes. 134. J. Dybal, P. Schmidt, J. Baldrian and J. Kratochvil, Ordered structures in
polycarbonate studied by infrared and raman spectroscopy, wide-angle X-ray scattering, and differential scanning calorimetry, Macromolecules, 31, 6611-6619 (1998).
135. A. Bos, I. G. M. Punt, M. Wessling, H. Strathmann, CO2-induced plasticization phenomena in glassy polymers, Journal of Membrane Science, 155, 67-78 (1999).
136. J. S. Chiou, J. W. Barlow and D. R. Paul, Plasticization of Glassy Polymers by CO2, Journal of Applied Polymer Science, 30, 2633 (1985).
137. R. G. Wissinger and M. E. Paulaitis, Glass Transitions in Polymer/CO2 Mixtures at Elevated Pressures, Journal of Polymer Science, Part B: Polymer Physics, 29, 5, 631 (1991).
138. E. S. Sanders, Penetrant-induced plasticization and gas permeation in glassy polymers, Journal of Membrane Science, 37, 63-80 (1988).
139. M. Wessling, S. Schoeman, Th. Van den Boomgaard, C. A. Smolders, Plasticization of gas separation membranes, Gas Sep. Purif., 5, 222-228 (1991).
140. Y. P. Handa, S. Lampron, M. L. O’Neill, On the plasticization of poly(2,6-dimethyl phenylene oxide) by CO2, J. Polym. Sci., Polym. Phys. Ed., 32, 2549-2553 (1994).
141. W.-C. Wang, E. J. Kramer, W. G. Sachse, Effects of high –pressure CO2 on the glass transition temperature and mechanical properties of polystyrene, J. Polym. Sci., Polym. Phys. Ed., 20, 1371-1384 (1982).
142. J. R. Fried, H.-C. Liu, C. Zhang, Effect of sorbed carbon dioxide on the dynamic mechanical properties of glassy polymers, J. Polym. Sci., Polym. Part C, 27, 385-392 (1989).
143. T. S. Chow, Molecular interpretation of the glass transition temperature of polymerdiluent systems, Macromolecules, 13, 362-364 (1980).
144. M. Wessling, Z. Borneman, Th. Van den Boomgaard, C. A. Smolders, Carbon dioxide foaming of glassy polymers, J. Appl. Polym. Sci., 53, 1497-1512 (1994).
145. H. Hachisuka, T. Sato, T. Imai, Y. Tsujita, A. Takizawa, T. Kinoshita, Glass transition temperature of glassy polymers plasticized by CO2 gas, Polymer Journal, 22, 1, 77 (1990).
146. J.-S. Wang, Y. Kamiya, Y. Naito, Effects of CO2 conditioning on sorption, dilation, and transport properties of polysulfone, Journal of Polymer Science: Part B: Polymer Physics, 36, 1695 (1998).
Chapter 3. Literature review on physical aging and orientation, and their effects on the gas transport properties 78
147. G. K. Fleming and W. J. Koros, Dilation of Polymers by Sorption of Carbon Dioxide at Elevated Pressures. 1. Silicone Rubber and Unconditioned Polycarbonate, Macromolecules, 19, 2285 (1986).
148. 3��*RWWKDUGW��$��*U&JHU��+��J��%ULRQ��5��3ODHWVFKNH��DQG�5��.LUFKKHLP��9ROXPH�
change of glassy polymers by sorption of small molecules and its relation to the intermolecular space, Macromolecules, 30, 8058-8065 (1997).
149. S.-H. Chen, S.-L. Huang, K.-C. Yu, J.-Y. Lai, M.-T. Liang, Effect of CO2 treated polycarbonate membranes on gas transport and sorption properties, Journal of Membrane Science, 172, 105-112 (2000).
150. B. G. Risch and G. L. Wilkes, Effects of physical aging and carbon dioxide absorption in bisphenol-A polycarbonate, Journal of Applied Polymer Science, 56, 1511 (1995).
151. A. H. Chan and D. R. Paul, Influence of history on the gas sorption, thermal, and mechanical properties of glassy polycarbonate, Journal of Applied Polymer Science, 24, 1539-1550 (1979).
152. J. S. Chiou, J. W. Barlow and D. R. Paul, Polymer Crystallization Induced by sorption of CO2 Gas, Journal of applied Polymer Science, 30, 3911 (1985).
153. Christelle M. Laot, Understanding gas transport in physically aged, oriented and pressure densified amorphous glassy bisphenol-A polycarbonate, PhD preliminary examination thesis, Virginia Polytechnic Institute and State University, VA, USA, December 17, 1999.
154. P. H. Pfromm and W. J. Koros, Accelerated physical ageing of thin glassy polymer films evidence from gas transport measurements, Polymer, 36, 12, 2379 (1995).
155. P. H. Pfromm and W. J. Koros, Accelerated physical ageing of thin glassy polymer films, Polym. Mater. Sci. Eng., 71, 401 (1994).
156. M. S. McCaig, D. R. Paul, Effect of film thickness on the changes in gas permeability of a glassy polyarylate due to physical aging. Part I. Experimental observations, Polymer, 41, 629-637 (2000).
157. M. S. McCaig, D. R. Paul, J. W. Barlow, Effect of film thickness on the changes in gas permeability of a glassy polyarylate due to physical aging. Part II. Mathematical model, Polymer, 41, 639-648 (2000).
158. J. L. Keddie, R.A.L. Jones, R. A. Cory, Europhys. Lett., 27, 59 (1994). 159. K. D. Dorkenoo and P. H. Pfromm, Experimental evidence and theoretical
analysis of physical aging in thin and thick amorphous glassy polymer films, Journal of Polymer Science: Part B: Polymer Physics, 37, 2239-2251 (1999).
160. K. Nagai, A. Higuchi, T. Nakagawa, Gas permeability and stability of poly(1-trimethylsilyl-1-propyne-co-1-phenyl-1-propyne) membranes, Journal of Polymer Science: Part B: Polymer Physics, 33, 289-298 (1995).
161. M. S. McCaig, D. R. Paul, Effect of UV crosslinking and physical aging on the gas permeability of thin glassy polyarylate films, Polymer, 40, 7209-7225 (1999).
162. M. J. El-Hibri and D. R. Paul, Effects of uniaxaial drawing and heat-treatment on gas sorption and transport in PVC, Journal of Applied Polymer Science, 30, 3649-3678 (1985).
163. L. H. Wang, R. S. Porter, On the CO2 permeation of uniaxially drawn polymers, Journal of Polymer Science: Polymer Physics Edition, 22, 1645-1653 (1984).
Chapter 3. Literature review on physical aging and orientation, and their effects on the gas transport properties 79
164. N. Kurosa, Sen’i Gakkaishi, 35, T-413 (1979). 165. W. J. Koros and D. R. Paul, J. Polym. Sci., A-2, 16, 2171 (1978). 166. S. W. Lasoski, Jr., and W. H. Cobbs, J. Polym. Sci., 36, 21 (1959). 167. N. E. Schlotter and P. Y. Furlan, A review of small molecule diffusion in
polyolefins, Polymer, 33, 16, 3323 (1992). 168. M. D. Shelby, G. L. Wilkes, M. R. Tant, J. Zawada, T. J. Bastow and A. J. Hill,
Amorphous orientation in glassy polycarbonate, ACS, Polymeric Materials Science and Engineering, Conference Proceedings, San Francisco, Spring 1997, 76, 485-6.
169. T. L. Smith and R. E. Adam, Effect of tensile deformations on gas transport in glassy polymer films, Polymer, 22, 299-304 (1981).
170. N. Yu. Muzovskaya and A. Ya. Malkin, Influence of orientation on the diffusion characteristics of polycarbonate, Polymer Science USSR, 27, 12, 2950-2954 (1985).
171. R. E. Barker, Jr., R. C. Tsai, R. A. Willency, Entropy correlation theory and diffusion measurements for oriented polymers, Journal of Polymer Science: Polymer Symposium, 63, 109-129 (1978).

Chapter 4
Experimental details
4.1. Introduction
This chapter provides a description of the materials and the instrumental methods
used in this research. Details concerning the gas permeation data analysis are also
provided. Calculations that need to be carried out to determine the gas transport
parameters (P, D, and S) and the activation energies (EP, ED, and ∆Hs) are given.
4.2. The materials
As mentioned previously in Chapter 1, bisphenol-A polycarbonate was chosen in
this research project due to its difficulty to crystallize under normal conditions and during
stretching. This research does indeed focus on the amorphous solid state only.
Furthermore, another feature of polycarbonate is that the main and secondary relaxations
are well-separated in the dynamic thermal response, which makes aging easier to follow
experimentally.
This particular section deals with the materials used in this research, their chemical
characterization, and the film processing.

Chapter 4 - Experimental details 81
4.2.1. The polycarbonate
The chemical structure of bisphenol-A polycarbonate (PC) is given in Figure 4.1.
A 3-d simulation of a portion of the polymer chain is also shown in Figure 4.2.
C
CH3CH3
O O
C
OO
C
O O
n
Figure 4.1: Chemical structure of bisphenol-A polycarbonate.
Figure 4.2: 3-dim simulation of a portion of the bisphenol-A polycarbonate chain. The simulation was obtained using the ChemWindow Spectroscopy software.
Bisphenol-A polycarbonate was ordered from two different suppliers.
Polycarbonate pellets were purchased from Aldrich Chemical Company, Inc.,
Milwaukee, WI (catalog # 18,162-5, lot # 02409KN). The weight average molecular
weight Mw was listed as 64,000 g/mol. Lexan 8010-112DC polycarbonate sheets were
also obtained from General Electric GE Plastics. The molecular weight was unknown at
the time of purchase. Two different thicknesses were ordered for the sheets, namely 7 mil
and 30 mil. The sheets of a particular thickness were all coming from the same lot.
However, a sheet of 7 mil from another lot was used in the first study of this research
dealing with the effect of the free volume on the gas transport properties (Chapter 5). The

Chapter 4 - Experimental details 82
glass transition temperatures (Tg) of the Aldrich and the GE polycarbonates were given
by the suppliers as 149oC and 150oC, respectively, as obtained by DSC from the second
heating scan at a heating rate of 10oC/min. The density was given as 1.2 g/cm3 at 20oC
and the refractive index nD20 as 1.585 in both cases.
The experimental data obtained in this research will mainly be based on the
polymer purchased from Aldrich since this particular polymer is expected to contain less
additives, if any, than the other polycarbonate.
4.2.2. Gel Permeation Chromatography (GPC)
Molecular weights, polydispersity indices, Mark-Houwink-Sakurada constants
and radius of gyration of the polycarbonates used in this research were determined by Gel
Permeation Chromatography (GPC). The data were obtained by Dr. Q. Ji and Dr. Y. Kim
in the Chemistry Department of Virginia Tech.
A polycarbonate sample of about 30mg was dissolved in chloroform and a 100µL
sample with a nominal concentration of about 3mg/mL was injected in the column having
an elution solvent of chloroform with a flow rate of 1mL/min. The inlet pressure was
maintained at 89.16kPa. The chromatograph was an Alliance Waters 2690 separations
module equipped with HR 0.5+2+3+4 columns. The chromatograph possessed two types
of detectors: an external refractometer and a Viscotek Model T60A viscometer. The
molecular weights were determined based on those two detectors. At least two samples
were run for each type of polycarbonate to ensure reproducibility in the measurements.
The response in mV as a function of the retention volume in mL was obtained. The
molecular weights were directly obtained by the instrument by comparing the data to
adequate calibration curves. The reproducibility in Mw was found to be 5%.
The weight average molecular weight Mw, number average molecular weight Mn,
polydispersity index PI (Mw/Mn), and radius of gyration <Rgn> of the various polymers
used in this research are reported in Table 4.1. The Aldrich polycarbonate happens to
have a much lower molecular weight than expected. As mentioned in the last subsection,
Mw was listed in the Aldrich catalog as being about 64,000 g/mol. However, Mw was
determined by GPC in this research to be about 34,000 g/mol. The experimental value

Chapter 4 - Experimental details 83
was confirmed by the company later on following our comment. The number average
molecular weights Mn between the Aldrich and the GE polycarbonates differ by only
1.95%. The free volume is expected to relate to Mn more than to Mw, Mw being more
appropriate to follow properties such as creep.
supplier Mn Mw PI <Rgn> commentsAldrich 15,400 g/mol 34,000 g/mol 2,21 43.6 A
GE 15,700 g/mol 37,800 g/mol 2,41 45.2 A used in the free volume studies, 7 mil thicknessGE 20,900 g/mol 43,700 g/mol 2,09 52.0 A 7 mil thicknessGE 19,400 g/mol 43,700 g/mol 2,25 50.8 A 30 mil thickness
Table 4.1: GPC results of the various polycarbonates used in this study. The weight average molecular weight Mw, the number average molecular weight Mn, the polydispersity index PI (=Mw / Mn), and the radius of gyration <Rgn> are reported in the table.
4.2.3. Polycarbonate film preparation from pellets
Polycarbonate pellets were processed as described below in order to make a
bubble free polymer film. A summary of the film processing is given in Figure 4.3. Films
were compression molded in order to avoid the use of any solvent. Polycarbonate does
not crystallize easily from the pure melt [1-3], but it does when exposed to solvent vapors
or liquids [4-11] or nucleating agents [12, 13]. Furthermore, polymer films become
oriented to some extent in the plane when cast from solution. The nature of the solvent
has a critical influence on the final film orientation [14].
The pellets were first dried in a vacuum oven at 150oC (≈Tg) for 24h before
processing. A Carver laboratory hot press was set at the maximum possible temperature,
270oC (close to the melting point of polycarbonate, Tm, given as 267oC). Nitrogen gas
was provided in the box containing the hot press to avoid any degradation of the polymer
by oxidation at the processing temperature. Dried polycarbonate pellets were put on
Kapton® polyimide sheets, sandwiched between flat metal plates, and the resulting mold
was placed in the hot press. The amount of polymeric material deposed on the Kapton®
sheets was measured in order to obtain films of about the same thickness. Several steps
were taken in order to produce the final polycarbonate film. The same processing
conditions (temperature, time, pressure) were maintained throughout this research project

Chapter 4 - Experimental details 84
to ensure reproducibility in the sample preparation. The first step consisted of putting the
two parts of the hot press in contact with the mold. Contact was ensured when the applied
pressure increased slightly on the gauge. After contact, the pressure came back rapidly to
zero because of the melting of the pellets. A waiting time of 1 min was allowed for the
polymer to reach thermal equilibrium. The second step was critical to get rid of the air
bubbles in the film. 3.5 metric tons were applied and released continuously for at least
1min 30s. The third step consisted of maintaining a pressure of 3.5 metric tons for 1 min.
The final step was similar to the second step, except that it did last only 30s. The mold
was removed from the hot press and quenched by blowing air. Results from DMTA
experiments suggested that quenching the samples in ice-water (0oC) or liquid nitrogen (-
196oC) induced some extra relaxations inside the polycarbonate matrix. An extra
shoulder around 90oC was easily distinguishable on the DMTA traces of the samples
quenched in ice-water. It is actually well-known that the β-relaxation peak of
polycarbonate (which occurs at about –100oC) is highly sensitive to water as investigated
by the dielectric method [15]. A relaxation was also noticed by DMTA experiments at
about room temperature for the samples quenched in liquid nitrogen. This observation
has actually been reported in the literature [16]. Based on the above observations, only air
quenching was considered in this research.
The polymeric films made by compression molding were kept in a dessicator at
all times to avoid any water moisture uptake.
Pellets dried at 150oC under vacuum for 24h
Defined quantity placed between Kapton® sheets and metal plates
Compression moldingProcessing conditions well-defined (270oC, time, pressure)
Film quenched by blowing air
Bubble free film kept in a dessicator at room temperature
Figure 4.3: Summary of the film processing steps.

Chapter 4 - Experimental details 85
The thicknesses of the films were measured with a micrometer from Fowler,
Japan (Model # 52-222-001) with a precision of 0.0001 inch. The thicknesses were
typically varying from about 100 to about 200µm depending on the experiment.
Results of DMTA experiments suggested that the films processed by hot press
had variable properties. This was attributed to the cooling rate from the melt. Indeed, the
mold had to be taken to the air pipe in the laboratory for air quenching and obviously this
time could not be exactly reproducible. It was therefore necessary to give the same
thermal history to all the films. A schematic of the action taken to solve this problem is
given in Figure 4.4. Prior to experiments, polymeric samples were put between Kapton®
sheets of thickness 125µm and copper metal plates of thickness 0.11mm. The metal
plates were suspended in the center of a gas chromatograph (GC) oven 8000 VEGA
Series from Fisons Instruments S.p.A., Rodano, Italy (Serial # 260456). The GC oven
was equipped with an internal fan and therefore heat transfer was assumed to be excellent
on both sides of the metal plates sandwiching the polymer. The oven temperature could
be controlled within 1oC by the operator, although the overall accuracy was given by the
manufacturer as 0.1oC. The samples were heated in the GC oven from room temperature
to 165oC at a heating rate of 40oC/min, kept at 165oC for 15min to remove thermal
history and eliminate possible orientation, and cooled within the oven at a programmed
rate of typically 40oC/min to room temperature. The room temperature was maintained at
30oC. The cooling rate of the polymer may have been different from that of the oven. No
thermocouple was available to directly measure the temperature of the polymer with
time. However the procedure remained similar from one sample to another and thus
reproducible. The films were then used immediately.

Chapter 4 - Experimental details 86
Film placed between Kapton® sheets and copper metal platesand suspended in the center of a fan-equipped oven
To remove thermal historyTo control the cooling rate (typical cooling rate: 40oC/min)
Film used immediately
Roomtemperature
165oC 15 min
40o C
/min Cooling rate
Figure 4.4: Schematic of the action taken to give the same thermal history to all the compression-molded polymeric films. The cooling rate was typically chosen as 40oC/min. The room temperature was maintained at 30oC. 15min were assumed to be sufficient to remove thermal history.
4.3. The instrumental methods
The following subsections describe the experimental techniques used in this
research and the experimental conditions chosen to generate data.
The first subsection focuses on the permeation technique used to obtain gas
transport measurements. The gas apparatus was built in the laboratory supervised by Dr.
Eva Marand in the Chemical Engineering Department at Virginia Tech.
The remaining subsections present the techniques used to measure the physical
properties of the polymers. The techniques involved in this research were dynamic
mechanical thermal analysis (DMTA), density, birefringence, and Fourier transform
infrared spectroscopy (FTIR).

Chapter 4 - Experimental details 87
4.3.1. Permeation
Permeation experiments were carried out using the permeation integral method
[17, 18].
A schematic of the permeation process is given in Figure 4.5. Briefly, a
membrane separates a closed volume from another volume, both volumes being initially
degassed. At some time t=0, the pressure on the side not in contact with the closed
volume increases from zero to a constant particular pressure pf, pf standing for feed
pressure. The pressure of the feed or the upstream remains constant throughout the
experiment. As the gas permeates through the membrane because of the concentration
gradient [19], the pressure in the closed volume does rise with time. This pressure is
referred to as pp for permeation pressure. The pressure in the permeate or downstream
side is being monitored with time by the computer until steady state conditions are
achieved. The reader should have in mind that the steady state conditions do not
correspond to equilibrium, as seen sometimes in the literature [20]. Steady state
conditions do correspond to the time at which the slope of pressure versus time becomes
linear. The curve of pressure versus time becomes linear at sufficient long times, and as
long as the pressure in the closed volume remains negligible. This point will be proven
later in this chapter. The slope is directly related to the permeability.
l
pf pp(t)
time (s)
pressure(V)
0
Figure 4.5: Schematic of the integral permeation method (left). pf is the feed pressure, pp the permeate pressure, and l the thickness of the membrane. The profile obtained while running permeation experiments is shown on the right side of the figure.

Chapter 4 - Experimental details 88
The closed volume permeation apparatus present in our laboratory has been
described in an earlier publication [20]. This set-up has nevertheless been taken apart and
completely rebuilt since then to allow a better computer control, to improve heat transfer,
and to decrease the vacuum leaks significantly. An up-to-date schematic of the
permeation set-up is given in Figure 4.6. The pressures of the gas cylinders were
controlled by pressure regulators. Those pressure regulators remained untouched during
this whole research project to ensure reproducibility in the feed pressure. The valves were
solenoid or pneumatic block valves activated by air, at a pressure of at least 80 psia. Two
pressure transducers were involved in the permeation apparatus to convert the pressure
into electrical energy. The pressure transducer on the feed side was purchased from
Senso-metrics, Inc., California (Model # SP974D). It was capable of measuring pressures
ranging from 0 to 500 psia. This pressure transducer was calibrated to read 1V for 100
psia. The pressure transducer used to measure pressure on the permeate side of the
membrane was a MKS Baratron pressure transducer from MKS Instruments, Andover,
MA (Model # 121AA-00100B, Serial # 95139111A). The pressure range was 0 to 100
torr, the resolution being of 0.1% of full scale. This particular highly sensitive pressure
transducer had to be calibrated by the manufactor each year. The output was ranging
from 0 to 10 V, thus 1 V corresponded to 1 cmHg. While running experiments, the
pressure transducer had to be protected from deadly over-range pressure. If the voltage
became greater than 8V, such as what happened during membrane breakage, the
computer protected the pressure transducer. The membrane cell that will be described
below was placed in a programmable gas chromatograph oven 6000 VEGA Series from
Carlo Erba Strumentazione, Milan, Italy (Serial # 258591) equipped with an internal fan.
The oven temperature was controlled within 0.1oC. The temperature inside the oven was
monitored by two additional thermocouples. All the tubbings involved in the permeation
apparatus were in stainless steel. A coil was made in the oven to make sure that the gas
was at the correct temperature while entering the membrane cell. A vacuum as low as 1
mtorr could be achieved by a two stage vane vacuum pump from Alcatel Corp., France
(Model # 1101006401). The oil was changed at least every three months. An external
vacuum gauge from Televac, Pennsylvania (Model # B2A-1-REC-C) was added to the

Chapter 4 - Experimental details 89
set-up to monitor the vacuum process. The data acquisition cards for the valves, the
thermocouples, the vacuum gauge and the pressure transducers were interfaced with a
486DX computer using a graphical interface programming software called Labtech from
Laboratory Technologies Corporation, MA. The experimental data were therefore
collected on-line.
He
O2
N2
permeationcell
GC oven
vacuum pump
pressure transducer
vacuumgauge
thermocouplegas
cylinder
valve
Figure 4.6: Schematic of the permeation apparatus.
Schematics of the permeation cell are provided in Figure 4.7 and Figure 4.8. This
permeation cell made out of brass was based on a design provided by the Dow Chemical
Company. The permeation cell consisted of two parts, an upper part and a lower part, as
seen in Figure 4.7. The polymer was placed between those two parts. The cell was
designed for films of about 125µm thickness. Two Viton o-rings were used to seal the
cell. No extra vacuum grease was needed. Stainless steel porous fritted discs were used to

Chapter 4 - Experimental details 90
support the membrane. The permeation area was estimated to be 13.36cm2 based on the
permeation cell dimensions. A polycarbonate film circle of diameter 4.8cm was cut and
its thickness was measured with a micrometer from Fowler, Japan (Model # 52-222-001),
with a precision of 0.0001 inch (with 1 inch = 2.54 cm). Values of the thickness were
taken at five different area of the membrane, namely the center, top, bottom, left, and
right. The polycarbonate membrane was placed inside the permeation cell and the cell
was closed by tighting the four screws of Figure 4.7 in diagonal using a torque of 70 inch
pounds on each screw.
The volume of the permeation closed volume was determined by using the ideal
gas law applied to several separate volumes. Since the pressure was very low, no
compressibility factor correction was needed. The permeate closed volume was found to
be equal to 19.72 ± 0.25 cm3. The closed volume corresponded to the volume of the cell
and the tubbings on the permeation side of the membrane. The inherent leak rate of the
permeation set-up on the permeate side was found to be 1 mtorr/hr, as measured over a
period of 10 days [21]. Four days were nevertheless necessary to observe any leak rate,
and therefore no correction was made to the experimental data to account for leaks. Since
the cell and the tubbings were in stainless steel, adsorption of gas to the walls was
assumed as negligible.
permeate
feed
fritted disc
o-ring
thermocouple
Figure 4.7: Schematic of the permeation cell.

Chapter 4 - Experimental details 91
permeate
feed
o-ring
membrane
fritted disc
Figure 4.8: Cut view of the permeation cell.
Permeation experiments were carried out at 35oC using three different gases,
namely He, O2, and N2, in that given sequence. Those gases were expected to interact
only weakly with the polymer, through dispersive or Van der Waals-type interactions.
Carbon dioxide CO2 was not considered in this research in order to avoid any
complications arising from plasticization effects [22-44]. The permeation behavior would
be time and pressure dependent indeed. The kinetic diameters of helium He, oxygen O2,
and nitrogen N2 are reported as 2.6Å, 3.46Å, and 3.64Å, respectively [45-48]. The kinetic
diameter is defined as the smallest diameter zeolite window which allows the gas
molecule to enter a zeolite cavity. It gives a good idea of the size of the small gas
molecules for gas transport properties [49, 50]. The free volume present in glassy
polymers can be probed by using gases of different kinetic diameters. The amount of free
volume is assumed to remain constant during the timescale of the permeation
experiments, as well as the overall free volume distribution. Freshly processed polymers
in the glassy state (below Tg) have not reached their equilibrium conformations.
Eventually they do gain adequate mobility by thermal motions to reduce their excess free
volume with time. Obviously the timescale of the polymer relaxation process is very long
compared to that of the permeation process. Some researchers refer to this as a

Chapter 4 - Experimental details 92
pseudoequilibrium phenomena [51]. Although the size and shape of individual
microvoids may fluctuate during the permeation experiments due to the thermal motion
of the polymer chains, the total amount and distribution of free volume is assumed to
remain constant within the timescale of the permeation experiments. Because of the small
kinetic diameters of the gas molecules and since the amount of gas sorbed by the polymer
remains very low, the polymeric matrix is assumed not to be modified by the gas
molecules. The purities of the gases used in this research were the following: 99% for He
and N2, and 99.996% for O2. Each gas was passed through a molecular sieve prior to
reaching the permeation apparatus itself in order to remove any water or oil. The applied
pressures were fixed at about 2.5 atm for He, and 3.9 atm for O2 and N2. The applied
pressures remained virtually constant during the whole duration of this research thanks to
blocked pressure regulators. The applied pressures were low enough to assume that the
structure of the polymer was not modified from the gas pressure. Any force convection
(that would enhance the value of the diffusion coefficient by allowing cooperative
movements to take place in the polymeric matrix) could be neglected in this work since
the pressures remained in the pressure range where Henry’s Law applies for
polycarbonate. Indeed, Koros and co-workers [48] determined for instance that the curve
of C (the equilibrium concentration of the gas in the polymer) versus pressure was linear
up to 11atm for N2 and at least up to 20atm for He in polycarbonate at 35oC. The pressure
of He was the most sensitive to a change in temperature in the laboratory. The applied
pressure varied within 1%. The permeation experiments were programmed on the
computer. The upper voltage limits were fixed as 0.3V for He, and 0.4V for both O2 and
N2. Those limits were determined based on the permeation profile of polycarbonate.
Steady state conditions were fully reached for the thicknesses and the applied pressures
considered in this research project. Data points were collected as follows for He and O2:
every 0.1s for the first 60s, then every 1s for 600s, and finally every 10s. The program
stopped by itself once the upper voltage limit was reached. Data points for N2 were
collected as follows: every 0.1s for 10s, then every 1s for 10s, and finally every 20s until
the end. Three measurements were taken for each gas at each temperature to ensure
reproducibility and to calculate the error involved in the permeation results. The
membrane was initially degassed for 2h. The pressure typically reached under 5 mtorr

Chapter 4 - Experimental details 93
after that time. The degassing times between runs were usually 30min for He, 90min for
O2, and 90min for N2, unless indicated in the experimental sections of each chapters. The
membrane was degassed for 90min each time before changing the nature of the gas. The
total cycle consisting of the permeation of the gases themselves and the degassing times
took about 16h at 35oC. Since the same cycle was programmed each time on the
computer, the data could easily be compared. Permeation experiments were also carried
out on the same membrane at higher temperatures, right after the experiment at 35oC in
order to determine the temperature dependent activation energies. Aging was found to be
negligible at those temperatures within the timeframe of the experiments. Indeed, no
significant change in density could be detected. In addition, the resulting data points did
fit really well on the Arrhenius plots. The membrane cell remained untouched between
temperature jumps. The membrane was degassed for about 4 hours before collecting data
at a new temperature. About 1h 30min was needed for the gas permeation set-up to reach
thermal equilibrium after a change in temperature. In order to verify that the results were
repeatable, another polymer film was tested for isotropic fresh polycarbonates. It was
verified that the data points did fit on the error bars previously measured.
4.3.2. Dynamic Mechanical Thermal Analysis (DMTA)
Dynamic mechanical thermal analysis (DMTA) was used to characterize the glass
transition temperature Tg, the molecular motions, and the viscoelastic properties of the
polycarbonates used in this research. In those experiments, a small-amplitude sinusoidal
strain is applied to the material. A static force is applied in addition to the dynamic force.
As the material is perturbed in a cyclic manner, a portion of the energy is stored and
another is dissipated. The storage modulus E’ measures the ability of the material to store
energy elastically, whereas the loss modulus E” measures its ability to dissipate energy or
loose heat. The ratio between each quantity is called the loss tangent tan δ, δ being the
phase angle between the in-phase and the out-of-phase components. Therefore,
E'
E"/tan = Eq (4.1)

Chapter 4 - Experimental details 94
The Tg corresponds to the temperature at which the polymer chains can move globally, in
other words move together and possess intermolecular cooperative motions. The Tg was
taken as the maximum of the loss modulus E” peak. Data reported in the literature are
usually taken from the maximum of tan δ. The maximum of the E” peak was considered
to be more appropriate than that of tan δ to estimate Tg since the maximum of E”
corresponds to the softening point. Actually, it corresponds to the initial drop of the
storage modulus from the glassy state into the glass transition region. In the glass
transition region E’ drops from about 109Pa to about 106Pa.
The dynamic mechanical experiments were carried out in the tensile mode under
atmospheric air. GPC analysis suggested that samples were not degraded by oxidation
during the timeframe of the experiments. The machine was a Rheometric Scientific
DMTA IV from Rheometric Scientific, Piscataway, NJ. It was interfaced with a Pentium
computer running a Rheometric Scientific software. The apparatus was monthly
calibrated, and a daily check was performed to ensure accurate calibration.
Polycarbonate samples were cut in a rectangular shape using a perfectly
rectangular home-made mold. The dimensions of the samples were typically 25*4mm.
The dimensions were obtained with a micrometer from Mitutoyo Corp., Japan (Model #
CD-6”CS, Serial # 0008517) with a precision of 0.01mm. The edges of the samples were
polished with some sand paper if needed to ensure reproducibility between samples. A
ratio of 3 between height and width was verified while doing DMTA experiments, as
recommended by the manufactor to minimize sample edge effects. The gap between the
grips of the tensile apparatus was set as 12mm. The thickness of the samples was
assumed to be thin enough to avoid gradients of temperature in the samples while
measuring dynamic properties. The position of the thermocouple remained unchanged
between runs to ensure comparison between samples. A small variation in the position of
the thermocouple could indeed affect the value of the maximum of the E” peak by as
much as 5oC. The thermocouple was forming a 45o angle with the horizontal, and was
about 5 mm from the sample. The temperature inside the DMTA apparatus was
controlled within 0.1oC.
The dynamic strain was chosen in the linear viscoelastic response range. As an
amorphous glassy polymer is stretched, nonlinear viscoelasticity is gradually observed

Chapter 4 - Experimental details 95
for a strain above 0.2%, as seen in Figure 4.9. The dynamic strain was typically chosen as
0.025%.
Different types of tests were performed in this research. Those tests were:
dynamic temperature ramp, dynamic frequency-temperature sweep, dynamic
frequency/temperature sweep, dynamic frequency sweep, dynamic strain sweep, dynamic
time sweep, and transient stress strain. The parameters chosen for the various DMTA
experiments will be given in each chapter depending on the tests performed at that time.
0.0 0.1 0.2 0.3 0.4 0.5 0.6 0.70.00
2.50x10⁶
5.00x10⁶
7.50x10⁶
1.00x10⁷
1.25x10⁷
stre
ss (
Pa)
strain (%)
Figure 4.9: Limit of linear viscoelasticity in polycarbonate as measured by using the DMTA in the transient tensile mode at 27oC. The strain rate was chosen as 50 s-1.
4.3.3. Density
The densities were measured at 18oC in a linear density gradient column made out
of sodium bromide salt and distilled water.
A schematic of the density gradient column is given in Figure 4.10. A linear
density gradient column can be prepared by mixing a heavy and a light solution, such as
aqueous solutions of sodium bromide. The light solution is mixed to ensure homogeneity
in the solution going to the column. Once the valves are opened, the liquid goes into the

Chapter 4 - Experimental details 96
column because of the hydrostatic pressure solely. The light solution goes into the
column first. It goes up in the column tube once the liquid of higher density is introduced
in the bottom of the column, and a density gradient is thereafter created with time, the
solution at the bottom of the tube having a higher density than the one at the top. Care
was taken to avoid touching the tube of the column as this would mix the solution and
destroy the density gradient.
heavy light
Figure 4.10: Schematic of the density gradient column. The heavy and light solutions were prepared by mixing sodium bromide salt and distilled water. The column itself was placed in a water bath maintained at 18oC.
The volume of the column was about 1.6 liter and its height about 1m. The
reading on the column ranged from 0 to 70, 0 being at the bottom of the column. The
column was placed in a water bath to better control the temperature. The temperature was
maintained at 18oC. Direct exposure to the sun was avoided by closing the blinds in the
laboratory since light could degrade the polymer. All the valves, tubbings, and containers
were made out of glass. The connections between them were made by simply using
vacuum grease. The glassware was thoroughfully cleaned and dried using acetone and
compressed air prior to use.
The column was set-up for the various types of amorphous polycarbonate samples
used in this research. Some of those samples were for instance physically aged or

Chapter 4 - Experimental details 97
oriented. Orientation was assumed to affect the densities the most, and therefore the
density range of interest was based on oriented samples. According to the literature, the
density for hot-drawn oriented amorphous polycarbonate ranges from 1.197 to 1.202
g/cm3 [52-57]. Unfortunately, only three calibrated glass balls of well-known densities
were available in the laboratory to cover this particular density range. It was decided to
use at least five balls for accuracy reasons. Using five balls expanded the density range
from 1.1808 to 1.2200 g/cm3, and decreased the resolution of the column as well at the
same time. The difference between the extreme densities ∆d was equal to 0.0392 g/cm3.
A light and a heavy solutions of sodium bromide salt and distilled water were prepared.
The sodium bromide NaBr salt was purchased from Aldrich Chemical Company, Inc.,
Milwaukee, WI (catalog # 22,034-5, lot # 00808TN). Its density was given as 3.203
g/cm3. The salt was kept in a dessicator from the time of purchase until use to avoid water
moisture uptake. The water was distilled water for high performance liquid
chromatography grade (HPLC) with a density of 1 g/cm3. The density of the light
solution was determined by substracting 0.2×∆d to 1.1808 g/cm3, and that of the heavy
solution by adding 0.3×∆d to 1.2200 g/cm3. Thus the densities of the desired light and the
heavy solutions were calculated to be 1.1730 g/cm3 and 1.2318 g/cm3, respectively. The
mass of NaBr salt per 1000 cm3 of water was given by the following equation: (mass of
NaBr / 1000cm3 H2O) = -639.782 -39.393×ρ +679.805×ρ2, where ρ is the density of the
solution [58]. The real density was lower than the calculated density because of the
excess volume of mixing. One liter of each type of solution was prepared by stirring the
salt with the water until complete dissolution. The mass of NaBr for the light solution
was 249.31g, and that for the heavy one was 343.12g. The solutions remained untouched
for one day to let any air bubbles rise to the surface. Big air bubbles could indeed threaten
the construction of the density gradient column. The solutions were placed in the two
containers shown in Figure 4.10. The two valves were opened and the liquid started going
into the column. The flow rate could be controlled by turning the valve located between
the light solution container and the column itself. The rate of filling was monitored with
time. The optimum was calculated to be around 2min to go from one division to another
[58], the distance between two divisions being equal to 0.2 on the reading. The rate of
filling was initially determined to be around 1min 30sec / division; it was equal to 2min

Chapter 4 - Experimental details 98
30sec / division after 3h 30sec, and 4min 30sec / division after 11h 30min. Once the
column was filled with the liquid, the glass tube placed inside the column for filling was
slowly removed and glass balls of calibrated densities were dropped inside the column.
The balls were wetted by the remaining of the heavy solution before dropping them in the
column. The calibrated balls stopped at different levels or heights of the column
depending on their respective densities. Out of the five balls, two of them were actually at
the top and at the bottom of the column. However three balls were well dispersed inside
the column. One day was allowed for equilibrium before reading. A calibration curve was
built, as shown in Figure 4.11. A linear regression was performed on the experimental
data points. From the knowledge of the height of a sample in the column, it was possible
to determine the density from the calibration curve. The theoretical accuracy of the
column was calculated to be 0.00005 g/cm3. Polycarbonate samples were cut in different
shapes in order to distinguish them. The surface areas were typically in the order of 0.12
cm2. At least two specimens were prepared for each kind of samples to verify
reproducibility. The specimens were wetted by the remaining of the heavy solution
before dropping them in the column. At least 12h were waited before reading to ensure
equilibrium. The calibration curve was rebuilt before reading data each time as the
column may not be completely stable, especially because of the deterioration of the
density gradient due to the introduction of samples. The variation in temperature was
considered as negligible. The rate of evaporation was assumed as negligible as well. It
was assumed that the liquid did not interact with the polycarbonate samples during the
short period of time the samples were left inside the column. Swelling of the samples by
water was assumed to be negligible.

Chapter 4 - Experimental details 99
1.190 1.195 1.200 1.205 1.2100
10
20
30
40
50
T = 18oC
Linear Regression Y = A + B * X
A = 2514.08692 (+/-) 79.29259B = -2071.33436 (+/-) 66.06085
R = -0.99949, SD = 0.96251N = 3, P = 0.0203
heig
ht (
arbi
trar
y un
its)
density (g/cm 3)
Figure 4.11: Calibration curve for the linear density gradient column at 18oC using three glass balls of well-known densities.
4.3.4. Birefringence
The average degree of orientation was determined from birefringence
measurements. For oriented systems in principle the birefringence represents the
difference in refractive index in the parallel and the perpendicular directions. The
birefringence was measured on the transparent polycarbonate specimens by use of a
Babinet compensator that consisted of two wedges in quartz perpendicular to each other.
The light beam reached the compensator after transmission through the sample. A
schematic of what is observed while doing birefringence experiments is drawn in Figure
4.12. Initially no sample was placed in the light beam and the reference line was put
between the two marks appearing on the screen. The corresponding value was read on the
scale for reference, which corresponded to a phase angle of zero. When an isotropic
sample was placed in the light beam, no changes were observed and the birefringence
was therefore equal to zero. The optically anisotropic sample was placed in the light
beam. As seen in Figure 4.12, the reference line was not located between the two marks
anymore, indicating a nonzero birefringence. The thickness of the calibrated quartz

Chapter 4 - Experimental details 100
material was adjusted to compensate the optical retardation induced by the orientated
sample. By moving the wedges, it was possible to induce a negative phase shift to
compensate for the phase shift created by the oriented sample. The lines were moved
down to place the reference line between the two marks again and the corresponding
value was read again.
reference ∆ = 0 ∆ ≠ 0
Figure 4.12: Schematic of what is observed while doing birefringence experiments. The schematics represent what is observed for a reference sample (left), an isotropic sample (middle), and an anisotropic sample (right). The aspect of the polymer chains is sketched at the top.
The error on the measurement was estimated to be 0.05 (the scale was ranging
from about –11 to 37). The polycarbonate samples were always introduced in the beam
path with the machine direction placed horizontally for consistency in the measurements.
The membrane was taped to a support having a hole in the middle and placed in front of
the compensator. The membrane was taped to the support in five different ways so that
orientation could be determined in the center of the membrane, at the top, bottom, right,
and left. Three measurements were taken and averaged for each position. The thickness
was determined for those five areas as well using a micrometer from Fowler, Japan
(Model # 52-222-001) with a precision of 0.0001 inch (with 1 inch = 2.54 cm). The
experiments were carried out at room temperature (23oC).

Chapter 4 - Experimental details 101
The birefringence ∆, which represents the difference in refractive index in the
parallel and the perpendicular directions (n″ - n⊥), was calculated from the following
relationship:
( )
×−=−
thickness
104.103*referencesampleû
3
Eq (4.2)
The difference between sample and reference corresponded to the phase shift induced by
orientation. The thickness had to be taken in mil (1 mil = 1/1000 inch, with 1 inch =
2.54cm). The measured or total birefringence ∆ corresponds to the sum of three distinct
types of birefringence [59, 60]. We have:
∆ = ∆f + ∆d + ∆form Eq (4.3)
where ∆f is the orientation birefringence, ∆d is the distortional birefringence, and ∆form is
the form birefringence. Since the samples contained a single phase, no correction was
required for ∆form. ∆d was found to be negligible for fresh samples, and assumed to be
negligible as well for hot-drawn samples because of the large-scale segmental motions
above Tg.
4.3.5. Fourier Transform Infrared Spectroscopy (FTIR)
In order to verify the absence of strain-induced crystallization, FTIR spectra were
collected on a BIO-RAD FTS-40A spectrometer purchased from Bio-Rad Laboratories,
Inc. The spectrometer was equipped with a liquid nitrogen cooled mercury-cadmium-
telluride or MCT detector. The compartment of the spectrometer was continuously gas
purged in order to minimize the amount of water vapor and carbon dioxide within the
compartment. The spectrometer was connected to a Pentium II computer running a Bio-
Rad Laboratories software. The resolution was chosen as 4 cm-1 and the spectrum
consisted of an average of 64 scans. No polarizer was used in this work.
Some absorption bands of the spectra collected in the transmission mode using
KBr crystals saturated since polycarbonate absorbed strongly in the IR. Furthermore, the
tight contact with KBr has also been shown to modify the molecular structure of
polycarbonate [11]. Spectra were therefore collected in the ATR (attenuated total

Chapter 4 - Experimental details 102
reflectance) mode using a zinc selenide ZnSe hemisphere crystal from Harrick Scientific
Corporation, Ossining, NY, with a refractive index of 2.42. A schematic of the apparatus
is provided in Figure 4.13. A SeagullTM ATR attachment from Harrick Scientific
Corporation was used to sample one specific area of the polymer. The angle of incidence
was chosen as 50o based on the calculated critical angle of incidence of 40.92o. Details of
the ATR technique have already been reported in previous publications [61, 62]. Briefly,
the ATR-FTIR technique provides information about the changes taking place at the
surface of the material and not in the bulk. The limitation of the ATR technique is that a
good contact is necessary between the crystal and the sample, especially right in the
center in the case of a hemisphere apparatus. Using a rubber piece allowed, nevertheless,
high enough absorbance. Furthermore, it was rather difficult to have a reproducible
crystal/sample contact with the ATR technique. In the ATR experiment, the higher the
wavenumber, the smaller is the value of the absorbance. This comes from the fact that,
for a given angle of incidence, as the wavenumber increases, the penetration depth
decreases, as illustrated in Figure 4.14. This characteristic makes it possible to study
surfaces at different depths by simply changing the angle of incidence. However the
penetration depth measured by the ATR technique still remains in the order of a few
microns.

Chapter 4 - Experimental details 103
θ
incident beam
reflected beam
ATRcrystal
polymer
n1
n2
rubber
stress
Figure 4.13: Schematic of the ATR apparatus. The polymer with a refractive index n2 was placed on a ZnSe ATR crystal with a refractive index n1. A piece of rubber was placed between the polymer and a hard metal plate. Some stress was applied on the metal plate to ensure good contact between the polymer and the ATR crystal. The incident beam entered the ATR crystal from one side and was totally reflected in the center of the crystal.
40 45 50 55 60 65 700
2
4
6
8
decreasing thewavenumber
Wavenumber
(in cm-1)
4000 3000 2000 1000 500
dp (
µ m)
angle ( o)
Figure 4.14: Penetration depth dp of ATR as a function of the angle of incidence θ for different wavenumbers. The critical angle was calculated to be 40.92o. The refractive indices of the ZnSe ATR crystal and the polycarbonate were taken as 2.42 and 1.585, respectively.

Chapter 4 - Experimental details 104
4.4. Analysis of the gas permeation data
This subsection provides details about the gas permeation data analysis.
Calculations that need to be carried out to determine the gas transport parameters (P, D,
and S) and the activation energies (EP, ED, and ∆Hs) are given here.
4.4.1. The gas permeation data
Gas permeation data were typically reproducible within 1%. As shown in Figure
4.15, the larger the kinetic diameter, the lower the permeation for the same applied
pressure. Only two measurements are shown on Figure 4.15 for each gas to ensure clarity
in the figure, but three measurements were actually taken and averaged for analysis.
0 1000 2000 3000 4000
0.0
0.1
0.2
0.3
0.4
35oC, 2.5atm (He) , 3.9atm (O2,N
2)
d(A)
N2 (3.64)
O2 (3.46)He (2.6)
resp
onse
(V
)
permeation time (s)
Figure 4.15: Permeation response at 35oC as a function of the permeation time for the Aldrich polymer cooled at 40oC/min. The kinetic diameters (in Å) of the gases of interest (He, O2, and N2) are given into brackets. Two measurements are plotted to show the reproducibility.

Chapter 4 - Experimental details 105
4.4.2. Determination of the gas transport coefficients (P, D, S)
The molecular diffusion of a gas through a membrane is given by the Fick’s first
law of diffusion [63]. Since the thickness of the membrane is very small compared to its
surface area, the flux of the gas can be considered as unidirectional and perpendicular to
the membrane plane surface. Assuming that the diffusion coefficient D is independent of
concentration (because of noninteractive gases), we can employ Fick’s second law of
diffusion [63] to model the experiment:
∂∂=
∂∂
2
2
x
C D
t
C
Eq (4.4)
where C is the concentration of the gas in the polymer in (cm3@STP/cm3), D is the
mutual diffusion coefficient in cm2/s, t is the time, and x is the distance in cm.
The initial and boundary conditions are given as follows:
t < 0 0 ≤ x ≤ l C = 0 Eq (4.5)
t ≥ 0 x = 0 C = C2 = a constant Eq (4.6)
t ≥ 0 x = l C = 0 Eq (4.7)
When Eq (4.4) is solved, given Eq (4.5), Eq (4.6) and Eq (4.7), the solution is [63, 64]:
−−−+
= ∑
∞
=1n2
22
2
n
222t l
t�Dnexp1
n
1)(
�
2
l
DtlCQ Eq (4.8)
where Qt is the volume of the gas that has permeated through the membrane in
cm3@STP.
At sufficient long time, Eq (4.8) reduces to:
( )
−≅
−
+= ∑
∞
= 6Dl
tl
DC
n1
Dl
�
2t
l
DCQ
22
1n2
n2
22
t Eq (4.9)
The plot of Qt versus t will thus be linear at sufficient long time as shown in Figure 4.16
and the time lag θ which is equal to (l2/6D) can be calculated from the intercept of the
slope with the time-axis. Please note that the plot will remain linear with time only as
long as the concentration at x = l remains negligible. The boundary condition at x=l given
in Eq (4.7) has been verified to be negligible in the present research. Computer
simulations with a time-dependent concentration at x=l [65] did not show any significant

Chapter 4 - Experimental details 106
differences for the maximum pressure allowed on the permeate side of the membrane in
the present research project. While doing experiments, Qt was not exactly zero at t = 0.
The experimental data were corrected to read zero for the vacuum at initial time.
However the vacuum was excellent, and therefore the correction did not modify the
results significantly.
θt
Qt
steadystate diffusion(constant slope)
Figure 4.16: Plot of Qt versus t showing the steady state part and the time lag θ.
The diffusion coefficient D can be calculated easily provided that the thickness (in cm) is
known. D in (cm2/s) can be calculated from the value of the time-lag θ in s. We have:
=
6�
lD
2
Eq (4.10)
The time-lag method [63] is commonly used in the literature to determine the gas
transport parameters, the permeability, diffusion, and solubility coefficients. The time-lag
approach is based on the Henry's Law given by C = kD p where C is the equilibrium
concentration, p is the pressure and kD is the Henry’s Law dissolution constant. Although
the Henry’s model is strictly obeyed for rubbery polymers only, estimation of the
transport parameters can still be made for glassy polymers at low pressures. Assuming P
= kD D, and C2 = kD pf where pf is the pressure of the feed, Eq (4.9) becomes:

Chapter 4 - Experimental details 107
−=
6D
lt
l
PpQ
2f
t Eq (4.11)
At sufficient long time, the slope is constant and equal to (Ppf/l) or (∂Qt/∂t). Finally,
=
t
Q
p
lP t
f ∂∂
Eq (4.12)
In the present research, the permeability P in (cm3STP.cm/cm2.s.cmHg) was given by:
( )( )
=
T RA p
V vl slopeP
f
d Eq (4.13)
where the slope at steady state conditions was expressed in (cmHg/s), l was the thickness
in cm, v was the molar volume of the gas at STP conditions (for an ideal gas, this is equal
to 22414.1 cm3@STP/mol), Vd was the permeate volume in cm3 (19.72 cm3), pf was the
applied pressure in cmHg (to multiply the pressure in psia by (76/14.696) to get it in
cmHg; 1 atm = 14.696 psia = 76 cmHg), A was the permeation area in cm2 (13.36 cm2),
R was the gas constant (6235.6 cmHg.cm3/mol.K), and T was the temperature in K. The
values of the molar volumes v in (cm3@STP/mol) were calculated for the various gases
of interest from thermodynamics relationships [66]. The compressibility factors were
accounted for in the gas law. The values of v were estimated to be equal to 22434
cm3@STP/mol for He, 22397 cm3@STP/mol for O2, and 22402 cm3@STP/mol for N2.
The permeability coefficient is often expressed in barrers, with 1 barrer = 10-10
([email protected] /cm2.s.cmHg).
The solubility coefficient S corresponds to the ratio of the permeability coefficient P
divided by the diffusion coefficient D. We have:
=
D
PS Eq (4.14)
The solubility coefficient S is expressed in (cm3@STP/cm3polymer.cmHg). Therefore S can
be obtained from permeation experiments, and does not require sorption experiments. As
was explained into more details in Chapter 3, sorption experiments are complicated by
several factors such as conditioning, plasticization, and aging. Permeation data may
therefore be more reliable than sorption data.

Chapter 4 - Experimental details 108
The gas transport properties (P, D, S) can therefore be calculated from Eq (4.13), Eq
(4.10), and Eq (4.14). Nevertheless, knowledge of the thickness was necessary. The films
processed by hot press did not possess a complete uniform thickness. The average
thickness was calculated as follows: (1/6) × ((2 × center) + left + right + top + bottom).
The positions refer to the parts of the membrane where the thicknesses were measured.
A study by Shishatskii et al [67] has been published in the literature about the effects of
the film thickness on the gas transport. The thicknesses were ranging from 5 to 150µm. It
was found that the lower the film thickness, the higher the density, the lower the diffusion
coefficient, and the higher the solubility coefficient. The permeability coefficient was
found to remain unaffected by the film thickness. However, the data were obtained on
PVTMS and PTMSNB films cast from hydrocarbon solutions on stretched cellophane
films. Films prepared from solvents are well-known to be oriented to some extent [59],
even though the solvent has almost been totally removed. Solvents are even capable of
inducing crystallinity in polymers [4]. The absence of crystallinity was not verified by
Shishatskii et al [67] in their work. Assuming that the samples were still amorphous,
studies should have been conducted to determine the level of orientation of the samples.
Orientation is expected to highly affect the gas transport parameters. A difference in
orientation between the surface and the bulk could also be distinguished.
The effect of the film thickness was investigated in the present study. Gas transport
parameters were determined on polycarbonate samples of 50µm and 200µm. Both films
were processed in a similar way, the cooling rate chosen as 40oC/min. The values of P, D,
and S were found to be reproducible within 5%, and within the error bars. Therefore the
gas transport properties do not seem to be affected by the thickness. Nevertheless,
whenever a particular study was conducted, films of approximately the same thicknesses
were used.

Chapter 4 - Experimental details 109
4.4.3. Determination of the gas transport activation energies (EP, ED, ∆HS)
The permeation, diffusion, and solubility of non-interacting gas molecules in
glassy polymers can be considered to be activated processes which can be described by
Arrhenius-type equations [68-70].
Thus we have:
−
=RT
E exp PP P
o Eq (4.15)
And from Eq(4.13): RT
E
lvV
ARpPln
T
slopeln p
d
fo −
=
Eq (4.16)
Where EP is the activation energy for permeation and Po the pre-exponential factor, both
of them being independent of temperature in a given temperature range far from thermal
transitions. Ep can be easily determined by plotting ln(slope/T) versus (1/RT), as shown
in Figure 4.17 for He.
0.00034 0.00036 0.00038 0.00040
-11.8
-11.6
-11.4
-11.2
-11.0
-10.8
HeE
p = 14351 J/mol
ln (
slop
e/T
)
1 / RT (mol J -1)
Figure 4.17: ln (slope/T) as a function of 1/RT for He. The slope corresponds to the activation energy for permeation and was determined in this case to be 14351 J/mol (R = -0.99997, SD = 0.00288). The Aldrich polymer was cooled at 40oC/min. The permeation temperatures were chosen as 35, 55, 65, and 80oC.

Chapter 4 - Experimental details 110
Similarly for the diffusion coefficient,
−
=RT
E exp DD D
o Eq (4.17)
where ED is the activation energy of diffusion.
Thus from Eq (4.10) and Eq (4.17) we get: ( )
−
=−
RT
E
l
Dln6�ln D
2o Eq (4.18)
The curve obtained for O2 is shown in Figure 4.18. Obviously, the greater the kinetic
diameter of the penetrant molecule, the greater the value of the activation energy for
diffusion.
0.00034 0.00035 0.00036 0.00037 0.00038 0.00039-6.5
-6.0
-5.5
-5.0
-4.5
O2
ED = 32284 J/mol
-ln (
6θ )
(1/RT) (mol J -1)
Figure 4.18: -ln(6θ) as a function of 1/RT for O2. The slope corresponds to the activation energy for diffusion and was determined in this case to be 32284 J/mol (R = -0.99899, SD = 0.03715). The Aldrich polymer was cooled at 40oC/min.
As for the other two gas transport coefficients, the solubility coefficient S follows a Van’t
Hoff expression, ∆Hs being the enthalpy of sorption. Nevertheless, as the temperature
increases, the solubility coefficient decreases since the penetrant becomes less
condensable.
We have:
−
=
−
=RT
û+exp
R
û6exp
RT
û*expS SSs Eq (4.19)

Chapter 4 - Experimental details 111
where ∆GS is the Gibbs free energy for sorption.
And
∆−
=RT
H exp SS s
o Eq (4.20)
Equating Eq (4.14) and Eq (4.20) we obtain:
RT
HlnSlnDlnPlnS s
o
∆−=−= Eq (4.21)
From Eq (4.13), RT
HlnSlnD
ARp
lvVln
T
slopeln s
of
d ∆−=−
+
Eq (4.22)
Equivalent to RT
HlnSlnl-
l
Dln
ARp
lvVln
T
slopeln s
o2
2f
d ∆−=
−
+
Eq (4.23)
RT
HlnS
ARlp
lvVln
D
lln
T
slopeln s
o2f
d2 ∆
−=
+
+
Eq (4.24)
Finally: ( )RT
H
lvV
ARlpSln6�
T
slopeln
D
l
T
slopeln s
d
2fo
2 ∆−
=
×
=
×
Eq (4.25)
The product term on the left hand side corresponds to the expressions used to determine
the previous activation energies EP and ED. The curve obtained for O2 is shown in Figure
4.19.

Chapter 4 - Experimental details 112
0.00034 0.00035 0.00036 0.00037 0.00038 0.00039-8.0
-7.8
-7.6
-7.4
-7.2
-7.0
O2
dHs = -16683 J/mol
ln (
(slo
pe/T
)*(6
θ))
(1/RT) (J-1 mol)
Figure 4.19: ln ((slope/T)*(6θ)) as a function of 1/RT for O2. The slope corresponds to the enthalpy of sorption and was determined in this case to be equal to -16683 J/mol (R = 0.99584, SD = 0.03912). The Aldrich polymer was cooled at 40oC/min.
The activation energies EP, ED and ∆Hs could be determined without knowing the value
of the membrane thickness, and therefore limit the errors in the analysis. Knowledge of
only the permeation slope and the time lag were thus sufficient to obtain the activation
energies. The activation energies were verified to be independent of the thickness
experimentally as well. The activation energies listed above were determined by plotting
the appropriate y-axis as a function of (1/RT). One should have (∆Hs = EP – ED) but
slight differences may occur due to the errors induced by the linear regressions. The
activation energy of diffusion and the enthalpy of sorption for O2 and N2 only were
determined from the time lag method. The time lag could not be observed for He due to
rapid permeation.
The preexponential factors Po, Do, and So were determined from the values of the
intercepts in Eq (4.16), Eq (4.18), and Eq (4.25). Knowledge of the value of the thickness
was necessary.

Chapter 4 - Experimental details 113
From Eq (4.16),
−=
d
f#1o lvV
ARplninterceptlnP Eq (4.26)
From Eq (4.18), ( )l2lninterceptlnD #2o += Eq (4.27)
From Eq (4.25),
−=
d
f#3o vV
ARlplninterceptlnS Eq (4.28)
4.4.4. Others
The selectivity between two gases could be obtained by dividing the average
slopes of the permeation responses of the two gases at steady state. Therefore the analysis
did not involve any mathematical model for sorption, limiting errors. The greater the
difference in kinetic diameters, the higher the selectivity between the gases. As seen in
Figure 4.20, the selectivity for a given gas pair decreases with temperature since the
polymeric matrix becomes more opened. By increasing the temperature, the polymer
chains have more thermal motion, more free volume, or maybe a broader distribution of
gap sizes, and thus a lower selectivity.

Chapter 4 - Experimental details 114
0
5
10
15
20
25
30
T
O2/N2He/N2He/O2
T (oC) 35 55 65 80se
lect
ivity
Figure 4.20: Selectivity as a function of temperature for the different gas pairs. The selectivity was calculated by dividing the average slopes of the permeation response of the two gases of interest at steady state. The temperatures were 35, 55, 65, and 80oC. The Aldrich polymer was cooled at 40oC/min.
As illustrated in Figure 4.21 using He as an example, the permeation slope itself
presented an Arrhenius relationship with temperature. The fact that the data points fell on
a straight line also confirmed the idea that aging was negligible at those temperatures.
The slope corresponded to what is called an apparent activation energy EPapparent.
Therefore the logarithm of the selectivity between gas A and gas B should be linear as a
function of 1/RT. The resulting slope was equal to the difference in apparent activation
energies between gas B and gas A. An example is shown in Figure 4.22 for the He/N2 gas
pair. Obviously, as the kinetic diameter of the penetrant increased, the apparent activation
energy increased, as shown in Figure 4.23.

Chapter 4 - Experimental details 115
0.00034 0.00036 0.00038 0.00040-6.2
-6.0
-5.8
-5.6
-5.4
-5.2
-5.0
EPapparent
= 17086 J/mol
Heln (
slop
e)
1 / RT (mol J -1)
Figure 4.21: ln slope as a function of 1/RT for He. The slope corresponds to the apparent activation energy and was determined in this case to be 17086 J/mol (R = -0.99997, SD = 0.00355). The Aldrich polymer was cooled at 40oC/min.
0.00034 0.00036 0.00038 0.000402.8
2.9
3.0
3.1
EpapparentN2
- EpapparentHe
= 6022 J/molln (
sele
ctiv
ity H
e/N
2)
1/RT (mol J -1)
Figure 4.22: ln selectivity as a function of 1/RT for the He/N2 gas pair. The selectivity was calculated by dividing the average slopes of the permeation response of the two gases at steady state. The slope corresponds to the difference in apparent activation energies between N2 and He and was determined to be equal to 6022 J/mol (R = 0.99964, SD = 0.00415).

Chapter 4 - Experimental details 116
2.6 2.8 3.0 3.2 3.4 3.6 3.816000
18000
20000
22000
24000
EP
appa
rent
in
J/m
ol
kinetic diameter (A)
Figure 4.23: Apparent activation energy as a function of the kinetic diameter. The kinetic diameters of He, O2, and N2 are reported as 2.6, 3.46, and 3.64Å, respectively [45-48].
4.5. Conclusions
Bisphenol-A polycarbonate has been selected for this research due to the fact that
crystallinity is unlikely to occur under normal conditions and on stretching. The
suppliers, molecular weights, and preparation of the samples have been provided in this
chapter. The experimental techniques involved in this research have also been presented.
The technique used to measure gas transport, namely permeation experiment, was treated
into details. The other techniques used to measure the physical properties of the polymers
were also presented. Those techniques were dynamic mechanical thermal analysis
(DMTA), density, birefringence, and FTIR spectroscopy. Finally, details have been
provided concerning the gas permeation data analysis. Calculations needed to access the
gas transport coefficients as well as the gas transport activation energies were given.

Chapter 4 - Experimental details 117
4.6. References
1. A. Siegmann and P. H. Geil, J. Macromol. Sci. Phys., B4, 239 (1970). 2. A. Siegmann and P. H. Geil, J. Macromol. Sci. Phys., B4, 273 (1970). 3. A. Alizadeh, S. Sohn, J. Quinn, H. Marand, L. C. Shank, H. Darrell Iler, Influence
of structural and topological constraints on the crystallization and melting behavior of polymers: 3. Bisphenol A Polycarbonate, Macromolecules, 34, 4066-4078 (2001).
4. E. Laredo, M. Grimau, A. Muller, A. Bello and n. Suarez, Influence of aging and crystallinity on the molecular motions in bisphenol-a polycarbonate, Journal of Polymer Science: Part B: Polymer Physics, 34, 2863 (1996).
5. Polycarbonates, Ullmann’s Encyclopedia of Industril Chemistry, vol A21, 207 (1992).
6. R. P. Kambour, F. E. Karasz, and J. H. Danne, J. Polym. Sci., A-2, 4, 327 (1966). 7. E. Turka and W. Benechi, J. Appl. Polym. Sci., 23, 3489 (1979). 8. R. A. Ware, S. Tirtowidjojo, and C. Cohen, J. Appl. Polym. Sci., 26, 2975 (1981). 9. J. P. Mercier, G. Groeninckx, and M. Lesne, J. Polym. Sci., Part C, 16, 2059
(1967). 10. R. Legras and J. P. Mercier, J. Polym. Sci., Polym. Phys. Ed., 15, 1283 (1977). 11. J. Dybal, P. Schmidt, J. Baldrian and J. Kratochvil, Ordered structures in
polycarbonate studied by infrared and raman spectroscopy, wide-angle X-ray scattering, and differential scanning calorimetry, Macromolecules, 31, 6611-6619 (1998).
12. F. Gallez, R. Legras, and J. P. Mercier, Polym. Eng. Sci., 16, 276 (1976). 13. R. Legras, J. P. Mercier, and E. Nield, Nature, 304, 432 (1983). 14. Dr. G. L. Wilkes, lecture notes. 15. E. Ito, K. Sawamura and S. Saito, Effects of drawing on molecular motions in
polycarbonate, Colloid & Polymer Sci., 253, 480-484 (1975). 16. C. Bauwens-Crowet, J.-C. Bauwens, The relationship between the effect of
thermal pre-treatment and the viscoelastic behaviour of polycarbonate in the glassy state, Journal of materials science, 14, 1817-1826 (1979).
17. R. M. Felder, Estimation of Gas Transport Coefficients from Differential Permeation, Integral Permeation, and Sorption Rate Data, Journal of Membrane Science, 3, 15 (1978).
18. D. G. Pye, H. H. Hoehn and M. Panar, Measurement of Gas Permeability of Polymers. I. Permeabilities in Constant Volume / Variable Pressure Apparatus, Journal of Applied Science, 20, 1921 (1976).
19. T. Graham, Philos. Mag., 32, 401 (1866). 20. S. S. Dhingra, Eva Marand, Mixed Gas Transport Study Through Polymeric
Membranes, Journal of Membrane Science, 141, 45 (1998). 21. Christopher J. Cornelius, Physical and Gas Permeation Properties of a Series of
Novel Hybrid Inorganic-Organic Composites Based on a Synthesized Fluorinated Polyimide, PhD Dissertation, Virginia Polytechnic Institute and State University, VA, USA, July 6, 2000.

Chapter 4 - Experimental details 118
22. A. Bos, I. G. M. Punt, M. Wessling, H. Strathmann, CO2-induced plasticization phenomena in glassy polymers, Journal of Membrane Science, 155, 67-78 (1999).
23. J. S. Chiou, J. W. Barlow and D. R. Paul, Plasticization of Glassy Polymers by CO2, Journal of Applied Polymer Science, 30, 2633 (1985).
24. R. G. Wissinger and M. E. Paulaitis, Glass Transitions in Polymer/CO2 Mixtures at Elevated Pressures, Journal of Polymer Science, Part B: Polymer Physics, 29, 5, 631 (1991).
25. E. S. Sanders, Penetrant-induced plasticization and gas permeation in glassy polymers, Journal of Membrane Science, 37, 63-80 (1988).
26. M. Wessling, S. Schoeman, Th. Van den Boomgaard, C. A. Smolders, Plasticization of gas separation membranes, Gas Sep. Purif., 5, 222-228 (1991).
27. Y. P. Handa, S. Lampron, M. L. O’Neill, On the plasticization of poly(2,6-dimethyl phenylene oxide) by CO2, J. Polym. Sci., Polym. Phys. Ed., 32, 2549-2553 (1994).
28. W.-C. Wang, E. J. Kramer, W. G. Sachse, Effects of high –pressure CO2 on the glass transition temperature and mechanical properties of polystyrene, J. Polym. Sci., Polym. Phys. Ed., 20, 1371-1384 (1982).
29. J. R. Fried, H.-C. Liu, C. Zhang, Effect of sorbed carbon dioxide on the dynamic mechanical properties of glassy polymers, J. Polym. Sci., Polym. Part C, 27, 385-392 (1989).
30. T. S. Chow, Molecular interpretation of the glass transition temperature of polymerdiluent systems, Macromolecules, 13, 362-364 (1980).
31. M. Wessling, Z. Borneman, Th. Van den Boomgaard, C. A. Smolders, Carbon dioxide foaming of glassy polymers, J. Appl. Polym. Sci., 53, 1497-1512 (1994).
32. H. Hachisuka, T. Sato, T. Imai, Y. Tsujita, A. Takizawa, T. Kinoshita, Glass transition temperature of glassy polymers plasticized by CO2 gas, Polymer Journal, 22, 1, 77 (1990).
33. J.-S. Wang, Y. Kamiya, Y. Naito, Effects of CO2 conditioning on sorption, dilation, and transport properties of polysulfone, Journal of Polymer Science: Part B: Polymer Physics, 36, 1695 (1998).
34. K. Tanaka, M. Ito, H. Kita, K. Okamoto, Y. Ito, The effects of CO2-conditioning of polymers on positron annihilation and gas permeation properties, Bull. Chem. Soc. Jpn., 68, 3011-3017 (1995).
35. G. K. Fleming and W. J. Koros, Dilation of Polymers by Sorption of Carbon Dioxide at Elevated Pressures. 1. Silicone Rubber and Unconditioned Polycarbonate, Macromolecules, 19, 2285 (1986).
36. G. K. Fleming and W. J. Koros, Carbon Dioxide Conditioning Effects on Sorption and Volume Dilation Behavior for bisphenol A - Polycarbonate, Macromolecules, 23, 1353 (1990).
37. A. G. Wonders and D. R. Paul, Effects of CO2 Exposure History on Sorption and transport in Polycarbonate, Journal of Membrane Science, 5, 63 (1979).
38. S. M. Jordan, W. J. Koros, J. K. Beasley, Characterization of CO2-induced conditioning of polycarbonate films using penetrants with different solubilities, Journal of Membrane Science, 43, 103-120 (1989).

Chapter 4 - Experimental details 119
39. D. S. Pope, G. K. Fleming, W. J. Koros, Effect of various exposure histories on sorption and dilation in a family of polycarbonates, Macromolecules, 23, 2988 (1990).
40. W. R. Vieth, L. H. Dao, and H. Pedersen, Non-equilibrium microstructural and transport characteristics of glassy poly(ethylene terephthalate), Journal of Membrane Science, 60, 41-62 (1991).
41. 3��*RWWKDUGW��$��*U&JHU��+��J��%ULRQ��5��3ODHWVFKNH��DQG�5��.LUFKKHLP��9ROXPH�
change of glassy polymers by sorption of small molecules and its relation to the intermolecular space, Macromolecules, 30, 8058-8065 (1997).
42. S.-H. Chen, S.-L. Huang, K.-C. Yu, J.-Y. Lai, M.-T. Liang, Effect of CO2 treated polycarbonate membranes on gas transport and sorption properties, Journal of Membrane Science, 172, 105-112 (2000).
43. B. G. Risch and G. L. Wilkes, Effects of physical aging and carbon dioxide absorption in bisphenol-A polycarbonate, Journal of Applied Polymer Science, 56, 1511 (1995).
44. A. H. Chan and D. R. Paul, Influence of history on the gas sorption, thermal, and mechanical properties of glassy polycarbonate, Journal of Applied Polymer Science, 24, 1539-1550 (1979).
45. W. J. Koros and G. K. Fleming, Membrane-based Gas Separation, Journal of Membrane Science, 83, 1-80, (1993).
46. W. J. Koros and M. W. Hellums, Transport Properties, Encyclopedia of Polymer Science and Engineering, 2nd Edition, H. F. Mark, N. M. Bikales, C. G. Overberger, G. Mendes, Eds., John Wiley and Sons, New York, Supplement volume, 1989.
47. D. W. Breck, Zeolite molecular sieves, John Wiley & Sons, Inc., New York, 1974.
48. W. J. Koros, A. H. Chan and D. R. Paul, Sorption and Transport of Various Gases in Polycarbonate, Journal of Membrane Science, 2, 165 (1977).
49. D. W. Van Krevelen, Properties of Polymers, Their correlation with chemical structure; their numerical estimation and prediction from additive group contributions, Third Ed, Elsevier, NY, 1990.
50. D. R. Paul, Yuri P. Yampol’skii, editors, Polymeric gas separation membranes, CRC Press, Boca Raton, 1994. 51. F. Doghieri and G. C. Sarti, Nonequilibrium lattice Fluids: A Predictive Model for
the Solubility in Glassy Polymers, Macromolecules, 29, 24, 7885 (1996). 52. M. D. Shelby and G. L. Wilkes, The effect of molecular orientation on the
physical ageing of amorphous polymers - dilatometric and mechanical creep behaviour, Polymer, 39, 26, 6767-6779 (1998).
53. M. D. Shelby and G. L. Wilkes, Thermodynamic characterization of the oriented state of bisphenol A polycarbonate as it pertains to enhanced physical aging, Journal of Polymer Science: Part B: Polymer Physics, 36, 2111 (1998).
54. E. Ito, K. Sawamura and S. Saito, Effects of drawing on molecular motions in polycarbonate, Colloid & Polymer Sci., 253, 480-484 (1975).
55. Y. C. Jean, Y. Rhee, Y. Lou, D. Shelby, G. L. Wilkes, Anisotropy of hole structures in oriented polycarbonate probed by two-dimensional angular

Chapter 4 - Experimental details 120
correlation of annihilation radiation, Journal of Polymer Science: Part B: Polymer Physics, 34, 2979-2985 (1996).
56. M. D. Shelby, G. L. Wilkes, M. R. Tant, J. Zawada, T. J. Bastow and A. J. Hill, Amorphous orientation in glassy polycarbonate, ACS, Polymeric Materials Science and Engineering, Conference Proceedings, San Francisco, Spring 1997, 76, 485-6.
57. M.-S. S. Wu, Intrinsic birefringence of amorphous poly(bisphenol-A carbonate), Journal of Applied Polymer Science, 32, 3263-3275 (1986).
58. Dr. Azar Alizadeh, personal communication. 59. G. L. Wilkes, Rheooptical properties, in Encyclopedia of Science and
Engineering, 14 (1984). 60. I. M. Ward, Structure and Properties of Oriented Polymers, Wiley, New York,
1975. 61. Christelle M. Laot, Eva Marand and Hideko T. Oyama, Spectroscopic
Characterization of Molecular Interdiffusion at a Poly(vinyl pyrrolidone)/Vinyl ester Interface, Polymer, 40, 1095-1108 (1999).
62. Christelle M. Laot, Spectroscopic Characterization of Molecular Interdiffusion at a Poly(vinyl pyrrolidone)/Vinyl ester Interface, Master of Science Thesis, Virginia Polytechnic Institute and State University, VA, USA, August 25, 1997 (thesis available on-line at http://scholar.lib.vt.edu/theses/available/etd-73197-10251/).
63. J. Crank, The Mathematics of Diffusion, second edition, Oxford Science Publications, 1975.
64. R. D. Seigle and R. W. Coughlin, Errors in Diffusivity as Deduced from Permeation Experiments using Time Lag Technique, Journal of Applied Polymer Science, 14, 3145 (1970).
65. Christelle M. Laot, Understanding gas transport in physically aged, oriented and pressure densified amorphous glassy bisphenol-A polycarbonate, PhD preliminary examination thesis, Virginia Polytechnic Institute and State University, VA, USA, December 17, 1999.
66. J. M. Prausnitz, R. N. Lichtenthaler, E. G. de Azevedo, Molecular thermodynamics of fluid-phase equilibria, 2nd Edition, PTR Prentice Hall, Englewood Cliffs, New Jersey, 1985.
67. A. M. Shishatskii, Y. P. Yampol’skii and K. V. Peinemann, Effects of Film Thickness on Density and Gas Permeation Parameters of Glassy Polymers, Journal of Membrane Science, 112, 275 (1996).
68. R. M. Barrer, Trans. Faraday Soc., 35, 644 (1939). 69. V. T. Stannett, Simple gases, Diffusion in Polymers, Wiley, New York, 1971. 70. G. J. Van Amerongen, Diffusion in elastomers, Rubber. Chem. Technol., 37, 5,
1065 (1964).

Chapter 5
Is the transport of gas molecules through polymers directly related
to the amount of free volume?
5.1. Introduction
One would expect that the greater the amount of free volume in a freshly
processed polymer, the more permeable the material, and the lower the activation energy
for permeation. Nevertheless, although this trend has been observed for the transport of
gas molecules through various polymer structures [1, 2], the literature is relatively sparse
on the role of the free volume in gas transport through a particular amorphous glassy
polymer as a function of processing conditions. It should however be pointed out that in
studies dealing with various polymer structures, the free volume amount was calculated
from group contribution methods [3, 4], and never measured. The relationship between
the polymer free volume and/or polymer chain dynamics and the gas transport properties
needs to be understood for any given polymer. Knowledge of this relationship is
necessary to further fundamental research as well as to optimize polymers in industrial
applications.
Two different amorphous glassy bisphenol-A polycarbonates with different free
volume contents will be compared. The amount of free volume will be characterized from

Chapter 5 - Is the transport of gas molecules through polymers directly related to the amount of free volume? 122
time-temperature superposition concepts. The influence of the free volume on the gas
transport properties will be examined.
5.2. Experimental details
The following subsections briefly review the materials and the instrumental
methods. The complete experimental details have been provided in Chapter 4.
5.2.1. The materials
Bisphenol-A polycarbonate was ordered from two different suppliers.
Polycarbonate pellets were ordered from Aldrich. The weight average molecular weight
MW was determined by GPC to be about 34,000 g/mol, and the polydispersity index
about 2.2. Lexan 8010 polycarbonate sheets were ordered from General Electric (GE).
Lexan was chosen in this research because of the number of studies in the literature based
on this particular polymer grade. The weight average molecular weight was determined
by GPC to be 38,000 g/mol and the polydispersity 2.4. The density was given by the
suppliers as 1.2 g/cm3 at 20oC in both cases.
Polymeric films of the Aldrich polymer were prepared as outlined in Chapter 4.
The sheets provided by GE and referred to as Lexan were dried at room temperature for
one day in a vacuum oven. The polymeric films were kept in a dessicator at all time to
avoid any water moisture uptake.
The films were put between Kapton® sheets and copper metal plates. The metal
plates were suspended in the center of an internal fan gas chromatograph oven 8000
VEGA Series to improve heat transfer on both sides. The samples were heated in the GC
oven from room temperature to 165oC at a heating rate of 40oC/min, kept at 165oC for
15min to remove thermal history, and cooled within the oven at a programmed rate of
40oC/min to room temperature. The room temperature was about 30oC. The polymer
films were then used immediately.

Chapter 5 - Is the transport of gas molecules through polymers directly related to the amount of free volume? 123
The thicknesses of the sheets were about 190µm.
5.2.2. The instrumental methods
Density measurements, dynamic mechanical thermal analysis (DMTA)
experiments, and gas permeation experiments were carried out in this study.
The densities were measured at 18oC in a density gradient column made out of
sodium bromide salt and distilled water. The theoretical accuracy of the column was
about 5×10⁻⁵ g/cm3. At least three samples of each type of polycarbonate were dropped in
the column to verify reproducibility.
The dynamic mechanical experiments were carried out in the tensile mode.
Different types of tests were selected for this study. The conditions are given below.
The dynamic frequency-temperature sweep mode was chosen to generate data to
build the master curves. A torque of 15cNm was used on each clamp. Optimization of the
dynamic experimental conditions was performed initially to ensure reproducibility of the
results [5]. The soak time was found to be the most critical parameter. The soak time
corresponds to the time the sample is left at a particular temperature before recording data
points. Enough time (at least 5min at 50oC [6], less at higher temperatures) has to be
allowed for temperature equilibrium, but the time should not be too long because of
possible aging. The dependence of the data on the soak time was found to depend on the
temperature increments as well. Dynamic mechanical measurements were collected as a
function of temperature using eight different frequencies, namely 0.5, 0.75, 1, 3, 5, 10,
14, and 18Hz. The initial temperature was chosen as 140oC; the final temperature
corresponded to the temperature at which measurements were not possible because the
sample softened. A waiting time of about 5min at 140oC was chosen prior to starting the
dynamic experiments themselves to ensure thermal equilibrium. Although the heat
conductivity of polymers is rather low, it has nevertheless been established in the
literature [6] that for an amorphous plastic sample of 200µm thick, 5 min at 50oC in air
are sufficient for a flat sheet to reach thermal equilibrium. The strain level was

Chapter 5 - Is the transport of gas molecules through polymers directly related to the amount of free volume? 124
determined by dynamic strain sweep. The strain level was chosen within the range of
linear viscoelasticity and for a corresponding force of about 10g. In our experiments, the
strain was set at 0.0125%. The optimized conditions were the following: the temperature
steps were chosen as 2oC and the soak time as 240s. The static force was determined at
155oC by dynamic frequency sweep test (strain control). The static force corresponding
to the thickness of the samples was set as 2g.
Dynamic temperature ramp experiments were carried out with the following
conditions. A torque of 10cNm was used on each clamp nut. The frequency was chosen
as 1Hz, the heating rate as 2oC/min, the initial temperature as 25oC, the strain as 0.025%,
and the static force as 22g.
Dynamic frequency/temperature sweep tests were carried out with the following
conditions. A torque of 10cNm was used on each clamp. The frequencies were chosen as
0.5, 3, and 10Hz. The heating rate was 1oC/min, the initial temperature 25oC, the final
temperature 175oC, the strain 0.025%, and the static force 40g.
Permeation experiments were carried out using the permeation integral method
described in Chapter 4. The experiments were performed at 35oC using three different
inert gases, namely He, O2, and N2, in that given sequence. The applied pressures were
fixed at about 2.5 atm for He, and 3.9 atm for O2 and N2. Three measurements were taken
for each gas to ensure reproducibility and to calculate the error involved in the
permeation results. Permeation experiments were also carried out on the same membrane
at 55, 65, and 80oC, right after the experiment at 35oC in order to determine the
temperature dependent activation energies. Aging was found to be negligible at those
temperatures within the timeframe of the experiments.
5.3. Results and discussion
Density, DMTA, and gas permeation results are presented and discussed in the
following subsections.

Chapter 5 - Is the transport of gas molecules through polymers directly related to the amount of free volume? 125
5.3.1. Density results
The densities of the two polymers are shown in Figure 5.1. Although the density
of the Aldrich polymer seems lower, the error bars nevertheless suggest that the densities
are quite similar. The errors on those measurements came from the fact that some
samples could have possibly been stuck to other samples or could have been attracted to
the walls of the density column.
The fractional free volume (FFV) was calculated from Bondi’s method [3, 4]. The
details of the group contribution calculations will be detailed in Chapter 6. Please note
that in this case FFV is allowed to vary below Tg, in contrast with the free volume
defined in viscoelastic theories which is fixed below Tg (see later in this chapter).
Although the Aldrich polymer appears to possess more free volume than the polymer
purchased from GE, the differences are within experimental errors (see Figure 5.2).
1.1962
1.1964
1.1966
18oC
GEAldrich
dens
ity (
g/cm
3 )
Figure 5.1: Densities of the two polymers selected in this study. The densities were measured at 18oC using a density gradient column.

Chapter 5 - Is the transport of gas molecules through polymers directly related to the amount of free volume? 126
16.59 16.60 16.611.1962
1.1964
1.1966
18oC
Aldrich
dens
ity (
g/cm
3 )
FFV (%)
GE
Figure 5.2: Densities of the two polymers selected in this study as a function of the fractional free volume calculated from Bondi’s method. The densities were measured at 18oC using a density gradient column.
5.3.2. DMTA results
Dynamic mechanical thermal analysis (DMTA) experiments gave information on
the glass transition temperature Tg and the frequency activation energy. The amount of
free volume contained in the polymers at Tg could be estimated from time-temperature
superposition concepts. Finally, the most probable number of molecular segments which
must relax simultaneously for relaxation to occur could also be calculated from fragility
concepts.
5.3.2.1. Tg
The glass transition temperature Tg was taken as the maximum of the loss
modulus E” peak, as illustrated in Figure 5.3. The Tg’s of the Aldrich and the GE
polycarbonates were estimated to be 153.3oC and 154.6oC, respectively. As one can see
from Figure 5.3, the DMTA measurements were quite reproducible for each
polycarbonate. Please note that no extra-relaxations could be distinguished on the DMTA

Chapter 5 - Is the transport of gas molecules through polymers directly related to the amount of free volume? 127
traces at temperatures between the room temperature and the glass transition region. The
Tg of the Lexan as received (used without any treatment once received from the supplier)
was lower than that of the Lexan prepared as given in the experimental section of this
chapter, probably because of the presence of moisture inside the polymeric matrix that
may have plasticized the polymer.
The fact that the Tg of the Aldrich polymer is lower than that of the GE polymer
should imply that the Aldrich polymer contained a greater amount of free volume. Since
the Tg corresponds to the temperature at which the polymer chains can move globally, a
greater free volume amount should imply a lower Tg [7, 8], as the polymer is heated from
the glassy state to the rubbery state. Since the critical entanglement molecular weight Me
of polycarbonate is given as 4,800 g/mol [9], and since the molecular weights are high
enough to be in the asymptotic part of the curve of Tg versus molecular weight, the
difference in Tg between both types of polycarbonate is not believed to originate from the
difference in the molecular weights of the materials. It is well established that [10, 11]:
n gg M
CTT −= ∞ Eq (5.1)
where C is a constant and Tg∞ corresponds to the Tg at an infinite molecular weight. If the
value of Mn is high enough though, the value of the Tg should barely be affected by an
increase in Mn. Also, the weight average molecular weights of the Aldrich and the GE
polymers were determined to be 34,000g/mol and 38,000g/mol, respectively, thus
corresponding to a number of repeat units in excess of 130. Note that for monodisperse
samples of polycarbonate the Tg has actually been found to be directly correlated with
Mw rather than with (Mn)-1, Mw ranging from about 4,000g/mol to 55,000g/mol [12]. The
difference in the values of the glass transition temperatures between the Aldrich and the
GE polymers (about 1.3oC) may be due to the presence of additives inside the polymeric
matrices, or to the slight differences in the polydispersity indices.

Chapter 5 - Is the transport of gas molecules through polymers directly related to the amount of free volume? 128
150 152 154 1561E8
153.3oC 154.6oC
Aldrich Aldrich GE (as received, no treatment) GE GE
E''
(Pa)
T (oC)
Figure 5.3: Loss modulus as a function of temperature for the polymers studied in this research. Both polymers were heated at 165oC for 15min and cooled at 40oC/min prior to DMTA experiments, unless indicated. The DMTA conditions were the following: frequency = 1Hz, strain = 0.025%, initial temperature = 25oC, heating rate = 2oC/min, static force = 22g. The maximum of the loss modulus was taken as the glass transition temperature.
5.3.2.2. Frequency activation energy
The activation energy for frequency was also determined for both polymers. We
have:
−=
RT
û+Dexp � � o Eq (5.2)
where γ is the frequency and ∆Ha is the activation enthalpy.
DMTA traces were collected as a function of temperature for three different
frequencies, as shown in Figure 5.4. T* (equal to Tg in this case since Tg was taken by us
as the maximum of E”) was obtained from the maximum of E”, and the natural logarithm
of the frequency was plotted as a function of (1/RT*). In a limited temperature range, the
data points fit on a straight line for the α-relaxation, as shown in Figure 5.5 (Note that
this line is strictly linear for the β-relaxation only [13]). The slope corresponded to -∆Ha.
No real difference could be distinguished between the two polymers studied in this

Chapter 5 - Is the transport of gas molecules through polymers directly related to the amount of free volume? 129
chapter. The activation energy ∆Ha was determined to be 1.06×10⁶ J/mol for the Aldrich
polycarbonate, and 1.02×10⁶ J/mol for the GE polymer.
25 50 75 100 125 150
1E7
1E8
0.025%, 1oC/min
0.5Hz 3Hz 10Hz
E''(
Pa)
T(oC)
Figure 5.4: Loss modulus of the Aldrich polycarbonate as a function of temperature for different frequencies (0.5, 3, and 10Hz). The DMTA conditions were the following: strain = 0.025%, heating rate = 1oC/min, static force = 40g, clamp force = 10cNm, initial temperature = 25oC.
0.000280 0.000282 0.000284-1
0
1
2
δHa = 1.0209 E6 J/mol
Aldrich Lexan
δHa = 1.0565 E6 J/mol
ln fr
eque
ncy
(1/RT*) in mol/J
Figure 5.5: ln frequency versus (1/RT*) (see Figure 5.4 for experimental details). T* was determined from the maximum of the E” peak. The slope corresponded to -∆Ha, ∆Ha being the frequency activation energy.

Chapter 5 - Is the transport of gas molecules through polymers directly related to the amount of free volume? 130
5.3.2.3. WLF parameters and fragility concepts
5.3.2.3.1. WLF parameters
The amount of free volume present in a polymer can be determined using the
time-temperature superposition concepts developed by Williams, Landel, and Ferry
(referred to as WLF) [14]. Although the viscoelastic parameters are usually obtained
from creep or stress relaxation experiments [13, 15, 16], they can also be assessed using
dynamic frequency temperature sweep.
The WLF equation [14] that supposes that the glass transition temperature Tg is an
iso-free volume state and that the system possesses a single relaxation mechanism (same
activation energy shared by all the relaxation modes represented in the relaxation time
spectrum) is given by:
( )( )g2
g1T TTC
TTCa log
−+−−
= Eq (5.3)
with ( )( ) gg
T t
t
T�
T�a == Eq (5.4)
=
g1 f 2.303
BC Eq (5.5)
=
f
g2
.
fC Eq (5.6)
The viscoelastic constants or WLF parameters C1 and C2 are not universal but depend on
the polymer. Originally, C1 and C2 were believed to be constant, and equal to 17.4 and
51.6K, respectively. However the non-universality of those constants has been
demonstrated later on [11]. C1 is nevertheless rather constant for all systems, but C2 can
vary widely. For example, while considering seven various polymers C1 ranges from 8.6
to 19.8 whereas C2 ranges from 14.2 to 200.4 [17]. The value of the glass transition
temperature is usually taken from volumetric, or calorimetric measurements obtained at a
heating rate of 10oC/min [18]. In this research the Tg was determined from DMTA
temperature ramp measurements. Please note that the WLF equation Eq (5.3) assumes
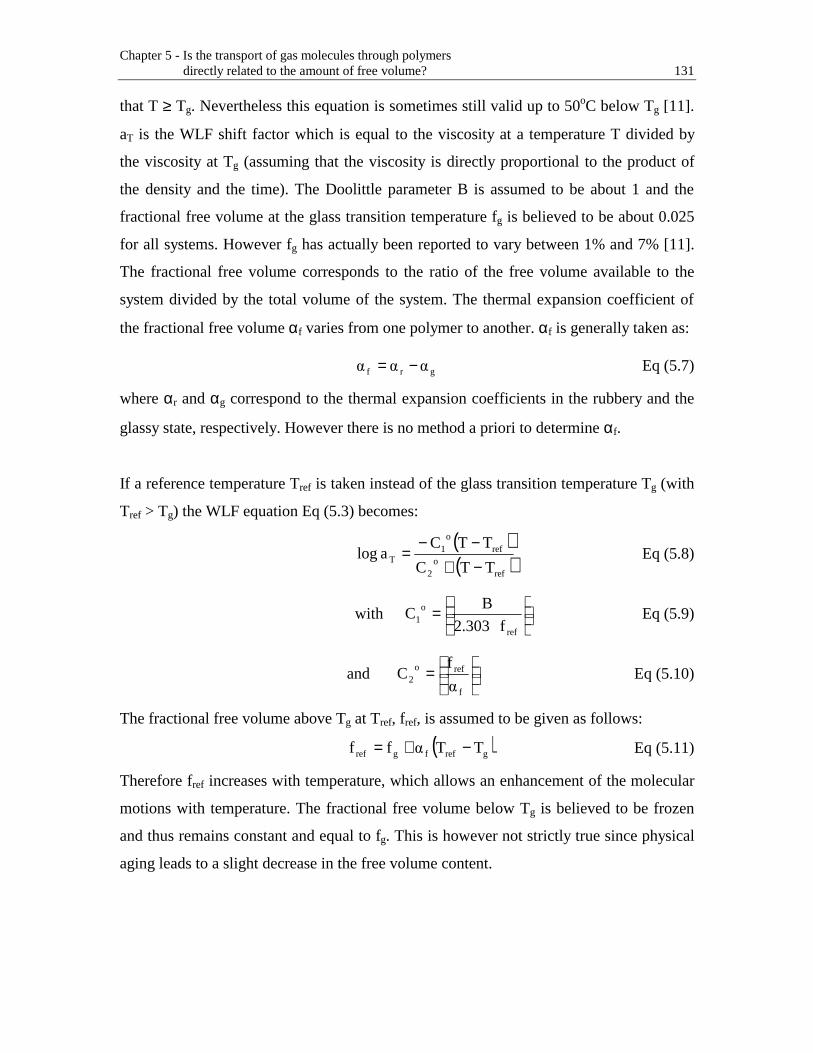
Chapter 5 - Is the transport of gas molecules through polymers directly related to the amount of free volume? 131
that T ≥ Tg. Nevertheless this equation is sometimes still valid up to 50oC below Tg [11].
aT is the WLF shift factor which is equal to the viscosity at a temperature T divided by
the viscosity at Tg (assuming that the viscosity is directly proportional to the product of
the density and the time). The Doolittle parameter B is assumed to be about 1 and the
fractional free volume at the glass transition temperature fg is believed to be about 0.025
for all systems. However fg has actually been reported to vary between 1% and 7% [11].
The fractional free volume corresponds to the ratio of the free volume available to the
system divided by the total volume of the system. The thermal expansion coefficient of
the fractional free volume αf varies from one polymer to another. αf is generally taken as:
grf ... −= Eq (5.7)
where αr and αg correspond to the thermal expansion coefficients in the rubbery and the
glassy state, respectively. However there is no method a priori to determine αf.
If a reference temperature Tref is taken instead of the glass transition temperature Tg (with
Tref > Tg) the WLF equation Eq (5.3) becomes:
( )( )ref
o2
refo
1T
TTC
TTCa log
−+−−
= Eq (5.8)
with
=
ref
o1 f 2.303
BC Eq (5.9)
and
=
f
refo2
.
fC Eq (5.10)
The fractional free volume above Tg at Tref, fref, is assumed to be given as follows:
( )greffgref TT.ff −+= Eq (5.11)
Therefore fref increases with temperature, which allows an enhancement of the molecular
motions with temperature. The fractional free volume below Tg is believed to be frozen
and thus remains constant and equal to fg. This is however not strictly true since physical
aging leads to a slight decrease in the free volume content.

Chapter 5 - Is the transport of gas molecules through polymers directly related to the amount of free volume? 132
Thus ( )gref2
21o1 TTC
CCC
−+= or
2
o2
o1
1 C
CCC = Eq (5.12)
And ( )gref2o
2 TTCC −+= or refgo
22 TTCC −+= Eq (5.13)
In order to generate a master curve, data were collected as a function of
temperature using eight different frequencies with just one sample. Using only one
sample reduced the error involved in the measurements since the geometry and the
thermal history remained exactly the same. As an example, the storage modulus data E’
for the Aldrich polymer are displayed in Figure 5.6. The DMTA traces were plotted back
as a function of the logarithm of the frequency for different temperatures, as shown in
Figure 5.7 for the storage modulus E’. The master curves illustrated in Figure 5.8 for a
reference temperature Tref of 154oC were generated by moving the curves horizontally
around the curve obtained at Tref. The reference temperature Tref was calculated by taking
the middle of the experimental temperature range. The curves adjacent to Tref were
moved first by common computer softwares, and then the other curves were moved until
the data points met. The tan δ data points were manipulated initially. Further
manipulations were made simultaneously on the storage modulus E’, the loss modulus E''
and the compliance modulus D''. Manipulating the three moduli simultaneously was
necessary to generate consistent results. The viscoelastic parameters obtained with either
one of the curves should be identical. Additional vertical shifting did not generate a
smoother master curve than simple horizontal shifting and therefore vertical shifting was
not performed in this study.

Chapter 5 - Is the transport of gas molecules through polymers directly related to the amount of free volume? 133
140 145 150 155 160 165 170
1E7
1E8
1E9
increasing the frequency Frequency (Hz)
18 14 10 5 3 1 0.75 0.5
E' (
Pa)
T (oC)
Figure 5.6: Storage modulus E’ of the Aldrich polycarbonate as a function of temperature for eight different frequencies (namely 0.5, 0.75, 1, 3, 5, 10, 14, and 18Hz). The DMTA conditions were the followings: strain = 0.0125%, soak time = 240s, data collected every 1oC, initial temperature = 140oC, static force = 2g.
1 10
1E7
1E8
1E9
T
T (oC)
140 142 144 146 148 150 152 154 156 158 160 162 164 166 168
E' (
Pa)
log f
Figure 5.7: Storage modulus E’ of the Aldrich polycarbonate as a function of frequency for different temperatures (see Figure 5.6 for experimental details).

Chapter 5 - Is the transport of gas molecules through polymers directly related to the amount of free volume? 134
10-4
10-3
10-2
10-1
100
101
102
103
104
105
106
107
106
107
108
109
E''
(Pa)
Tref
= 154oC
E' (
Pa)
log fref
= log (f aT)
10-11
10-10
10-9
10-8
10-7
D''
E''
E'
D'' (P
a)
Figure 5.8: Master curves of the Aldrich polymer based on E’, E”, and D”. The reference temperature was chosen as 154oC.
The shift factor aT was calculated based on the reference temperature of 154oC.
The shift factor basically indicated by how much each curve has to be multiplied at a
given temperature to reach the curve at Tref. For a frequency f we have:
( )f logf loga log refT −= Eq (5.14)
log fref is the new value of log f at Tref (after the horizontal shift of all the curves). log f is
the initial value (now observed only at Tref). log aT was calculated for each temperature.
At Tref, aT = 1 and log aT = 0. Below Tref log aT is positive, and above Tref log aT is
negative.
Data obtained at temperatures much lower than the glass transition temperature Tg
are not always considered in the literature for further analysis because of the curvature
observed at those temperatures (see Figure 5.8). The free volume concepts on which the
WLF equation is based are valid only in the glass transition range and above. This has
been confirmed by experiments on polycarbonate [19, 20]. Therefore all the data points
obtained in the glassy state should not be considered for analysis. Moreover, the building
of the master curve assumes no undergoing changes such as physical aging.

Chapter 5 - Is the transport of gas molecules through polymers directly related to the amount of free volume? 135
The WLF equation Eq (5.8) can be rearranged to give:
( ) o1ref
o1
o2
T C
1
TTC
C
a log
1 −−
−= Eq (5.15)
Thus a plot of (1 / log aT) versus (1 / (T-Tref)) has a slope of (-C2o / C1
o) and an intercept
with the y-axis at (-1/C1o). The linear regression obtained with the experimental data
points collected in this study for the Aldrich polymer is shown in Figure 5.9. The values
obtained for C1o and C2
o are equal to 12.32 ± 1.00 and 48.04 ± 0.33 K, respectively.
However doing a non-linear curvefit led to “better” results. The results obtained
with the Levenberg-Marquardt algorithm are displayed in Figure 5.10. The initial fitting
values were taken as the “universal” constants, namely 17.4 and 51.6K. The curvefit was
typically successfully progressed in four rounds. The values obtained for C1o and C2
o
were given as 11.74 ± 0.50 and 43.55 ± 1.58 K, respectively. C1 and C2 were calculated
from Eq (5.12) and Eq (5.13) to be 11.93 and 42.85K, respectively. The value of the Tg
was taken from the DMTA measurements. Using Eq (5.5) and Eq (5.6), the value of fg
was calculated as 0.036 and that of αf as 8.5*10-4 oC-1.
-0.5 0.0 0.5
-2
0
2
Tref
= 154oC
C1
0 = 12.32
C2
0 = 48.04 K
1 / (
log
aT)
1 / (T-Tref
)
Figure 5.9: (1/(log aT)) versus (1/(T-Tref)) for the Aldrich polycarbonate. The reference temperature was chosen as 154oC. Linear regression analysis led to values of 12.32 and 48.04 for C1
o and C2o, respectively
(R = -0.99973, SD = 0.02281).

Chapter 5 - Is the transport of gas molecules through polymers directly related to the amount of free volume? 136
-15 -10 -5 0 5 10 15-4
-2
0
2
4
6
Model: WLFChi^2 = 0.004
C1o = 11.74 ± 0.50
C2o = 43.55 ± 1.58
Tref
= 154oC
log
aT
T - Tref
Figure 5.10: Non-linear regression for the Aldrich polymer using the Levenberg-Marquardt algorithm. The initial fitting values were taken as the “universal” constants, namely 17.4 and 51.6K. The curvefit was typically successfully progressed in four rounds. The values obtained for C1
o and C2o were given as 11.74
and 43.55, respectively (χ2 = 0.00422). The reference temperature was chosen as 154oC.
Similar analysis was performed on the polymer purchased from GE. In this
particular case the reference temperature was set at 158oC. The final non-linear
regression is shown in Figure 5.11. The values obtained for C1o and C2
o were given as
15.86 ± 1.06 and 76.15 ± 4.44 K, respectively. C1 and C2 were equal to 16.60 and
72.75K, respectively. The value of fg was equal to 0.026 and that of αf to 3.6*10-4 oC-1.

Chapter 5 - Is the transport of gas molecules through polymers directly related to the amount of free volume? 137
-20 -10 0 10 20
-2
0
2
4
6
Model: WLFChi^2 = 0.011
C1o= 15.86 ± 1.06
C2o= 76.15 ± 4.44
Tref
= 158oC
log
aT
T - Tref
Figure 5.11: Non-linear regression for the GE polymer using the Levenberg-Marquardt algorithm. The initial fitting values were taken as the “universal” constants, namely 17.4 and 51.6K. The curvefit was typically successfully progressed in four rounds. The values obtained for C1
o and C2o were given as 15.86
and 76.15, respectively (χ2 = 0.01056). The reference temperature was chosen as 158oC.
5.3.2.3.2. Fragility concepts
The most probable number of molecular segments which must relax
simultaneously or cooperatively for relaxation to occur can be calculated from the
fragility concepts developed by Angell [21-23]. A correlation may exist between the
measure of cooperativity, z, and the gas transport properties.
The apparent activation energy for viscoelastic relaxation Ea can be calculated at
each temperature by taking the tangent of the slope of ln aT versus 1/T, as illustrated in
Figure 5.12 on the experimental data. The slope (d(lnaT)/d(1/T)) corresponds to Ea/R.
R
E
T
1d
aln d aT =
Eq (5.16)
Ea can also be calculated from the differentiation of the WLF equation Eq (5.3).
Calculations leads to:

Chapter 5 - Is the transport of gas molecules through polymers directly related to the amount of free volume? 138
( ) ( )
−
=−+
=−+
=2
o
212
refo
2
2o2
o1
2g2
212
a
T
T1
1C2.303RC
TTC
RTC2.303C
TTC
ln10CCRTE
Eq (5.17)
where To (=Tg–C2) is the Vogel temperature, which corresponds to the true
thermodynamic second order transition temperature, if it exists. To is also equal to T2, the
Gibbs-DiMarzio transition temperature [24]. Please note that T should be greater than Tg
since this assumption was part of the WLF derivation.
At the glass transition temperature Tg we have:
2
2g1
Tgat a C
T2.303RCE = Eq (5.18)
Ea at Tg was calculated for both polymers. The value came out as 9.69×10⁵ J/mol for the
Aldrich polymer, and 7.99×10⁵ J/mol for the GE polymer.
Please note that:
( )
=
=
=
T
Td
a log dT R 2.303
T
1d
a log dln10 R
T
1d
aln dRE
g
Tg
TTa Eq (5.19)
Comparing Eq (5.19) for T=Tg and Eq (5.18) leads to:
2
g1
Tgat
g
T
C
T C
T
Td
a log d=
Eq (5.20)
The left hand side term of Eq (5.20) provides a measure of the fragility of the polymer m,
m being a dimensionless parameter.
Thus we have:
g
Tgat a
Tgat
g
T
T R 2.303
E
T
Td
a log dm =
= Eq (5.21)

Chapter 5 - Is the transport of gas molecules through polymers directly related to the amount of free volume? 139
The fragility concept developed by Angell [21-23] gives a measure of the increase in the
most probable segmental relaxation time with a decrease in temperature in the vicinity of
Tg. The larger the m value, and thus the greater the fragility, the steeper is the slope of log
aT versus (Tg/T), the greater is the temperature sensitivity, the greater is the rate at which
the degree of cooperativity varies with a decrease in temperature, and the greater is the
degree of intermolecular coupling. The glassy state is well-known to possess indeed a
high degree of intermolecular cooperativity [25]. The fragility values m were calculated
for the Aldrich and the GE polymers. m were found to be equal to 118.7 and 97.6,
respectively. The fragility results suggest that the Aldrich polymer has a more
cooperative behavior and does possess a broader relaxation time distribution. Note that
the fragility values have been reported in the literature to be dependent on the
experimental technique. In a study involving twenty-three various polymers, Huang and
McKenna [17] showed that the dynamic fragility m and the thermodynamic fragility
(Cpl/Cp
g) (ratio of the heat capacities in the liquid and in the glassy states) tend to be
inversely correlated.
At high temperatures (for T>>To in Eq (5.17)), the Vogel energy is:
21 C C R 2.303 E = Eq (5.22)
E corresponds to the activation energy of noncooperative intramolecular bond rotation,
also referred to as ∆µ* by Matsuoka [26].
The ratio of Ea divided by ∆µ* corresponds to z, the most probable number of molecular
segments or “beads” which must relax simultaneously or move cooperatively for
relaxation to occur. Cooperative interactions are possible only within a group, the system
being divided into several groups of particles.
2
o
aa
T
T1
1
E
E
*û�
Ez
−
=== Eq (5.23)
And at Tg 2
2
gg C
Tz
= Eq (5.24)

Chapter 5 - Is the transport of gas molecules through polymers directly related to the amount of free volume? 140
From Eq (5.24), one can see that z decreases with an increase in temperature (T being
greater than Tg). In this study, zg was found to be greater for the Aldrich polymer than for
the GE polymer (99.04 versus 34.57, respectively).
0.00225 0.00230 0.00235 0.00240 0.00245-10
-5
0
5
10
15
Tref
= 154oC
Ea/R
ln a
T
1 / T (K-1)
Figure 5.12: ln aT versus 1/T for the Aldrich polymer. The apparent activation energy for viscoelastic relaxation can be calculated at each temperature by taking the tangent of the slope at that particular temperature, and by dividing it by the gas constant R. The reference temperature was chosen as 154oC.
5.3.2.3.3. Summary
The viscoelastic results obtained for both polymers are summarized in Table 5.1.
The values of C1 and C2 are the same order of magnitude as the values reported in
the literature. For instance, the values of C1 and C2 for polycarbonate have been
determined, respectively, to be 17.9 and 52.3K [27], 13.8 and 89.4K [28], 12.2 and 52.0K
[17], 13.4 and 47.3K [29], 10.2 and 73.3K [30], and 9.9 and 91.0K [31]. Ideally the C1
values should be the same for the two types of polycarbonate since C1 should be a
material parameter [10]. The reference temperature at which both C1 values are the same
should be readjusted for in this work. Nevertheless, C2 has been shown to depend highly
on the technique used to measure the WLF parameters. For instance, C1 and C2 were
determined by torsional relaxation response to be 49.7 and 174.6K for polycarbonate

Chapter 5 - Is the transport of gas molecules through polymers directly related to the amount of free volume? 141
aged until equilibrium [32]. In addition, a transition from a WLF to an Arrhenius-type
behavior has been observed as the glass transition of polycarbonate is being approached
[32].
As expected from the free volume theory [7, 8], the polymer with the highest
glass transition temperature Tg was found to contain a lower free volume amount. The
amounts of free volume between the two polymers studied in this research differed by as
much as 27%. The fractional free volume at Tg (fg) was determined to be 2.6% for the GE
polymer, in excellent agreement with the theoretical value of 2.5% predicted by Fox and
Flory [11]. fg was found to be 3.6% for the Aldrich polymer. Because fg has been
reported to vary between 1 and 7% [11], the results are in a probable range. The
difference in the amounts of free volume between the two polycarbonates of interest in
this research is unlikely to originate from the differences in molecular weight which are
very slight. As a reminder, the number average molecular weights Mn of the Aldrich and
the GE polymers were determined by GPC to be 15,400 g/mol and 15,700 g/mol,
respectively. As stated earlier, the difference may be due to the presence of additives in
the polymers, or to the slight differences in the polydispersity indices.
The value of the thermal expansion coefficient of the fractional free volume αf for
the GE polymer is in excellent agreement with the literature. For instance, the αf value
for polycarbonate has been reported to have the following values: 3.9×10⁻⁴ oC-1 [33],
2.8×10⁻⁴ oC-1 [33], 4.2×10⁻⁴ oC-1 [27], or 3.7×10⁻⁴ oC-1 [34]. Although the value of αf for
the Aldrich polymer seems a bit high compared to published values, it is the right order
of magnitude.
The values of m and zg are not too far from the ones published in the literature.
While investigating a series of six polymers, Bartos and Kristiak determined that m
varied between 46 and 137 [35]. The value of m was shown to range between 23 and 214
while considering twenty-three various polymers [17]. Especially, for polycarbonate m
has been reported to be 120 [36], or 132 [17]. A value of 80 [36] has been given for zg for
polycarbonate. Nevertheless it seems rather strange that the polycarbonate with the lower
Tg possesses a higher zg. Indeed, one would expect that as the size of the cooperative
domain increases, the material is less mobile, hence it becomes more difficult for the
polymer chains to undergo large-scale motions, and the Tg should therefore be observed

Chapter 5 - Is the transport of gas molecules through polymers directly related to the amount of free volume? 142
at a higher temperature. The problem may originate from the fact that the Tg in this study
was taken from the Tg value determined by the DMTA experiment in the heating mode. It
would have been better to obtain the Tg while cooling the material from the melt,
however such a procedure is not possible in the DMTA apparatus. The respective Tg
values may have been inversed; this would affect in turn the values of C2 and zg.
Although the difference in the Tg values we measured by DMTA was evaluated to be
about 1oC, the difference may actually be greater; the breadth of the Tg peak may also
vary. The difference in the polydispersity indices between both materials estimated to be
about 9% is actually very significant. This should influence the Tg values, especially if
the Tg scales with the inverse of the weight average molecular weight MW, and not with
the number average molecular weight Mn, as recently suggested in the literature [12]. The
C2 value may be influenced by the presence of additives in the polymeric matrix, or may
even be highly sensitive to the curvefitting procedure. The difference in the zg values
could also be explained by an incorrect choice of the reference temperature used to
calculate C2, and therefore zg.
Aldrich GE
Tref 154oC 158oC
C1o 11.74 15.86
error on C1o 0.50 1.06
C2o 43.55 K 76.15 K
error on C2o 1.58 K 4.44 K
Tg (DMTA) 153.3oC 154.6oC
C1 11.9 16.6
C2 42.8 K 72.7 K
fg 0.036 0.026
αf 8.5×10⁻⁴ oC-1 3.6×10⁻⁴ oC-1
Ea (Tg) 9.7×10⁵ J/mol 8.0×10⁵ J/mol m 119 98
zg 99 35
Table 5.1: Summary of the free volume results. C1o and C2
o were obtained from the Levenberg-Marquardt algorithm. The values of the viscoelastic parameters C1 and C2 were calculated from the Tg value determined from DMTA measurements. The errors were given in the text.

Chapter 5 - Is the transport of gas molecules through polymers directly related to the amount of free volume? 143
5.3.3. Permeation results
The gas transport coefficients, namely the permeability coefficient P, the diffusion
coefficient D, and the solubility coefficient S were evaluated for the two polymers
investigated in this chapter. Corresponding activation energies were also determined. The
results are compared and discussed in this subsection.
5.3.3.1. Determination of the gas transport coefficients (P,D,S)
The gas transport results determined at 35oC are shown in Figure 5.13, Figure
5.14 and Figure 5.15. The permeability coefficients tend to be the same for both
polymers, within experimental errors. The nitrogen (N2) diffusion coefficient appears to
be lower in the Aldrich polymer, in contrast to the N2 solubility coefficient S, which is
greater in the Aldrich polymer. The difference in the experimental results is believed to
be significant. The oxygen (O2) diffusion and solubility coefficients appear to be the
same in both types of polymers.
The previous DMTA results suggest that the Aldrich polymer does possess a
greater amount of free volume. The similar permeability results between the Aldrich and
the GE polymers suggest that P is not directly related to the free volume amount, in
contrast to the literature concerning gas transport through various polymer families or
classes [1, 2]. However one has to keep in mind that P corresponds to the product of S
and D. It seems reasonable that S should be greater for the Aldrich polymer since S is
related to the amount of free volume and this amount of free volume is greater for the
Aldrich polycarbonate (see above). On the other hand, the diffusion coefficient is related
to the mobility of the polymer chains. The fact that an increase in the free volume content
does not result in an increase in the diffusion coefficient is in contradiction with free
volume theories applied to gas diffusion [37-41].
As seen previously, the Aldrich polymer has been found to have the higher
fragility or the higher probable number of segments which must move cooperatively for
relaxation to occur, making it possibly more difficult for activated diffusion to take place.

Chapter 5 - Is the transport of gas molecules through polymers directly related to the amount of free volume? 144
The Aldrich polymer maybe more stiff locally than the GE polymer, despite of the
greater overall free volume content. Nevertheless the diffusion phenomenon may not be a
cooperative phenomenon as the diffusion process is likely to involve only a few segments
at a time, and explanations based on fragility concepts may not be totally correct.
0
5
10
15
GEAldrich
35oC
He O
2
N2
P (
barr
ers)
Figure 5.13: Permeability coefficients of the Aldrich and the GE polymers. The permeation experiments were performed at 35oC. The applied pressures were maintained at 2.5atm for He, and 3.9atm for O2 and N2.

Chapter 5 - Is the transport of gas molecules through polymers directly related to the amount of free volume? 145
2,0x10⁻⁸
2,2x10⁻⁸
2,4x10⁻⁸
GEAldrich
N2
35oC
D (
cm2 /s
)
1,6x10⁻³
1,8x10⁻³
2,0x10⁻³
S (cm
3@S
TP
/cm3polym
er .cmH
g)
Figure 5.14: Diffusion and solubility coefficients of N2 for the Aldrich and the GE polymers. The permeation experiments were performed at 35oC. The applied pressure was maintained at 3.9atm.
6,0x10⁻⁸
7,0x10⁻⁸
8,0x10⁻⁸
GEAldrich
O2
35oC
D (
cm2 /s
)
2,2x10⁻³
2,4x10⁻³
2,6x10⁻³
2,8x10⁻³
3,0x10⁻³
S (cm
3@S
TP
/cm3polym
er .cmH
g)
Figure 5.15:. Diffusion and solubility coefficients of O2 for the Aldrich and the GE polymers. The permeation experiments were performed at 35oC. The applied pressure was maintained at 3.9atm.

Chapter 5 - Is the transport of gas molecules through polymers directly related to the amount of free volume? 146
5.3.3.2. Determination of the gas transport activation energies (EP, ED, ∆HS)
The gas transport activation energies were determined for both polymers in order
to investigate how the amount of free volume affects those quantities. Activation energy
results obtained for both polymers are shown from Figure 5.16 to Figure 5.18. The
activation energy of permeation EP seems rather constant for both polymers, except for
He for which the GE polycarbonate has a slightly higher activation energy. The activation
energy of diffusion ED and the enthalpy of sorption ∆HS seem higher for the Aldrich
polymer. The trends are believed to be significant for N2.
One would expect that activation energies would be lower for the Aldrich
polymer since it has been found to possess a higher free volume content. This trend
commonly found in the literature has actually been verified by Yampolskii and co-
workers [2] using a database involving various amorphous glassy polymers. However,
the data presented here show an opposite trend.
One may think that activation energies may be related to the number of segments
which must move cooperatively for relaxation to occur. This number is referred to as zg at
Tg. Cooperativity is necessary for relaxation to take place. Since the Aldrich polymer was
characterized by a greater fragility m and a greater zg value (zg was determined to be
about 99 for the Aldrich polymer versus to about 35 for the GE polymer), it may take
more energy to relax the chains and unable diffusion to occur, despite of the greater free
volume content. As shown in Figure 5.19, the greater the value of zg, the greater is the
activation energy of diffusion. However the zg values are estimated at Tg whereas gas
transport measurements are taken about 115oC below Tg. It seems therefore unlikely that
activation energies can be fully explained from fragility concepts, although some degree
of cooperativity is necessary to permit diffusion even at room temperature.

Chapter 5 - Is the transport of gas molecules through polymers directly related to the amount of free volume? 147
14000
15000
16000
20000
21000
GEAldrich
He O2
N2
EP
(J/m
ol)
Figure 5.16: EP of the two polymers of interest for He, O2, and N2. The permeation experiments were successively performed at 35, 55, 65, and 80oC. The applied pressures were maintained at 2.5atm for He, and 3.9atm for O2 and N2.
30000
40000
50000
GEAldrich
O2
N2
ED
(J/m
ol)
Figure 5.17: ED of the two polymers of interest for O2 and N2. The permeation experiments were successively performed at 35, 55, 65, and 80oC. The applied pressure was maintained at 3.9atm for O2 and N2.

Chapter 5 - Is the transport of gas molecules through polymers directly related to the amount of free volume? 148
-10000
-20000
-30000
GEAldrich
O2
N2
∆H
s (
J/m
ol)
Figure 5.18: ∆Hs of the two polymers of interest for O2 and N2. The permeation experiments were performed at 35, 55, 65, and 80oC. The applied pressure was maintained at 3.9atm for O2 and N2.
30 60 9030000
40000
50000
zg
N2
GE
Aldrich
ED
(J/m
ol)
Figure 5.19: ED versus zg for the two polymers selected in this study and for N2.

Chapter 5 - Is the transport of gas molecules through polymers directly related to the amount of free volume? 149
5.4. Conclusions
The results obtained in this study dealing with the relationship between the
amount of free volume and the gas transport properties are summarized in Table 5.2 and
Table 5.3. Two different polycarbonates of about the same molecular weights were
ordered from two different suppliers: Aldrich and General Electric (GE). The Aldrich
polycarbonate was characterized by a greater free volume content as determined from
density and Tg values, as well as from time-temperature superposition concepts. Despite
of this higher free volume content, the Aldrich polymer was found to have permeability
coefficients similar to those of the GE polymer. The solubility coefficient was higher in
the Aldrich polymer and the diffusion coefficient was found to be lower for the Aldrich
polycarbonate. Gas transport activation energies were determined for both polymers. The
activation energy of diffusion was found to be greater for the polymer containing the
greatest amount of free volume. An explanation based on cooperativity concepts, or on a
higher number of segments which have to move cooperatively for relaxation to occur,
seems to work in interpreting the diffusion coefficients and the activation energies of
diffusion, even though at room temperature the process most likely involves localized
segments of the polymer chains.
Aldrich GE
ρ 1.19638 g/cm3 1.19644 g/cm3
Tg (DMTA) 153.3oC 154.6oC
Mn 15,400 g/mol 15,700 g/mol
PI 2.2 2.4
∆Ha 1.06×10⁶ J/mol 1.02×10⁶ J/mol
fg 0.036 0.026
Ea (at Tg) 9.7×10⁵ J/mol 8.0×10⁵ J/mol
m 119 98
zg 99 35
Table 5.2: Summary of the physical properties obtained in this study.

Chapter 5 - Is the transport of gas molecules through polymers directly related to the amount of free volume? 150
PHe Aldrich = GE
PO2 Aldrich = GE
PN2 Aldrich = GE
DO2 Aldrich = GE
DN2 Aldrich < GE
SO2 Aldrich = GE
SN2 Aldrich > GE
EPHe Aldrich < GE
EPO2 Aldrich = GE
EPN2 Aldrich = GE
EDO2 Aldrich = GE
EDN2 Aldrich > GE
dHsO2 Aldrich = GE
dHsN2 Aldrich > GE
Table 5.3: Summary of the gas transport results obtained in this study.
However, the most important conclusion of this study suggests that the transport
of gas molecules through polymers may not be directly related to the amount of free
volume. The free volume concept has been extremely popular in the literature to explain
gas transport through polymers [1, 2, 37-43]. The same concept was also used to explain
gas transport activation energies [2]. It was reported that the greater the free volume
content in polymer families or classes, the greater the values of the gas transport
coefficients and the lower the gas transport activation energies. This study shows that the
solubility coefficient may be the only parameter directly linked with the amount of free
volume contained in the polymer. The diffusion coefficient and the activation energies
for diffusion do not appear to be directly related to this free volume content, in contrast to
theories found in the literature [2, 37-41], but rather to the local stiffness of the polymer
segments. P was not found to be enhanced in the greater free volume content material, in
contrast to the literature [1, 2].
The fact that gas transport and free volume may not be directly related has
actually been recently suggested by Pekarski and co-workers [44], who has demonstrated

Chapter 5 - Is the transport of gas molecules through polymers directly related to the amount of free volume? 151
that the diffusion coefficient of carbon dioxide (CO2) in polycarbonate was lower in a
conditioned sample (thus possessing a greater amount of free volume) than in an aged
one. Similarly, the activation energy of diffusion was found to be lower in the aged
sample. The results were attributed to a difference in the free volume distribution.
Nevertheless, the gas transport results presented in this study are complicated by
the fact that additives may be present in the polycarbonates. Chemicals are indeed
commonly added to polymers to improve the flow viscosity and processing behavior, to
enhance some target properties, to increase softness and flexibility, or to decrease the
final cost of the product. Additives can be of different types: plasticizers, fillers, carbon
fibers, lubricants, fame retardants, antioxidants, antistatics, UV stabilizers, etc.
Plasticizers for instance do decrease the Tg value and allow the polymer to absorb more
energy. Plasticizers also modify the interactions between the gas and the polymer [45],
thus eventually influencing the solubility coefficient. In a study involving stress
relaxation experiments, Colucci and co-workers [46] reported dramatically different
behaviors between two grades of bisphenol-A polycarbonates obtained from different
suppliers. The volume change measurements performed in both uniaxial tension and
compression showed that the mechanical responses of the two polymers were extremely
different. This observation suggests that some polycarbonates may have more molecular
mobility than others. The nature and quantity of the additives are likely to differ from one
supplier to another. The additives contained in the polycarbonates may act at low
temperature, or also broaden the relaxation time distribution. End groups may also be
different. Moreover, although the number average molecular weights Mn of the polymers
selected in this research were about the same (the difference was only about 2%), the
difference in polydispersity indices PI (of about 9%) may affect the free volume
distribution, and thereafter the gas transport properties. Actually, an increase of the value
of the Tg with a narrowness of the molecular weight distribution has been reported in the
literature [47, 48]. In the present research, we did observe a greater Tg value for the
higher polydispersity index material.
In order to carefully evaluate the effect of the free volume on the gas transport
properties, it is therefore necessary to use exactly the same polymer throughout the study.

Chapter 5 - Is the transport of gas molecules through polymers directly related to the amount of free volume? 152
The amount of free volume present in a particular glassy polymer can be modified by
changing the cooling rate from the melt for instance. This will be done in the next chapter
dealing with the effect of the cooling rate on the gas transport properties of
polycarbonate.
5.5. References
1. J. Y. Park, D. R. Paul, Correlation and prediction of gas permeability in glassy polymer membrane materials via a modified free volume based group contribution method, Journal of Membrane Science, 125, 23-39 (1997).
2. Y. Yampolskii, S. Shishatskii, A. Alentiev, K. Loza, Correlations with and prediction of activation energies of gas permeation and diffusion in glassy polymers, Journal of Membrane Science, 148, 59-69 (1998).
3. A. Bondi, Physical properties of molecular crystals, liquids, and glasses, Wiley, New York, 1968.
4. D. W. Van Krevelen, Properties of Polymers, Their correlation with chemical structure; their numerical estimation and prediction from additive group contributions, Third Ed, Elsevier, NY, 1990.
5. Christelle M. Laot, Understanding gas transport in physically aged, oriented and pressure densified amorphous glassy bisphenol-A polycarbonate, PhD preliminary examination thesis, Virginia Polytechnic Institute and State University, VA, USA, December 17, 1999.
6. S. Hawley, Conditioning, in R. Brown, editor, Handbook of polymer testing – Physical methods, Marcel Dekker, Inc., New York, 141-156, 1999.
7. T. G. Fox and P. J. Flory, J. Am. Chem. Soc., 70, 2384 (1948). 8. T. G. Fox and P. J. Flory, J. Appl. Phys., 21, 581 (1950). 9. Richard P. Wool, Polymer Interfaces- Structure and Strength, Hanser Publishers,
1995. 10. Dr. Hervé Marand, lecture notes. 11. L. H. Sperling, Introduction to physical polymer science, Second edition, John
Wiley and Sons, 1992. 12. Seungman Sohn, Crystallization behavior of bisphenol-A polycarbonate: effects
of crystallization time, temperature, and molar mass, PhD Dissertation, Virginia Polytechnic Institute and State University, VA, USA, April, 2000.
13. J. J. Aklonis, W. J. MacKnight, M. Shen, Introduction to polymer viscoelasticity, Wiley-Interscience, NY, 1972.
J. J. Aklonis and W. J. MacKnight, Introduction to polymer viscoelasticity, 2nd edition, John Wiley & Sons, NY, 1983.
14. M. L. Williams, R. F. Landel and J. D. Ferry, J. Am. Chem. Soci., 77, 3701 (1955).
15. I. M. Ward, Mechanical properties of solid polymers, Wiley-Interscience, NY, 1971. 2nd Edition, 1983.

Chapter 5 - Is the transport of gas molecules through polymers directly related to the amount of free volume? 153
16. J. D. Ferry, Viscoelastic properties of polymers, 3rd edition, John Wiley & Sons, Inc., New York, 1980.
17. D. Huang and G. B. McKenna, New insights into the fragility dilemna in liquids, Journal of Chemical Physics, 114, 13, 5621-5630 (2001).
18. M. Connolly, F. Karasz, M. Trimmer, Viscoelastic and dielectric relaxation behavior of substituted poly(p-phenylenes), Macromolecules, 28, 1872-1881 (1995).
19. H. Higuchi, Z. Yu, A. M. Jamieson, R. Simha, J. D. McGervey, Thermal history and temperature dependence of viscoelastic properties of polymer glasses: relation to free volume quantities, Journal of Polymer Science: Part B: Polymer Physics, 33, 2295-2305 (1995).
20. H. Higuchi, A. M. Jamieson and R. Simha, Free volume quantities and viscoelasticity of polymer glasses, Journal of Polymer Science: Part B: Polymer Physics, 34, 1423-1426 (1996).
21. C. A. Angell, Science, 267, 1924 (1995). 22. C. A. Angell, Journal of Non-Crystalline Solids, 131-133, 13 (1991). 23. C. A. Angell, J. Res. Natl. Inst. Stand. Technol., 102, 2, 171 (1997). 24. J. H. Gibbs and E. A. DiMarzio, J. Chem. Phys., 28, 3, 373 (1958). 25. J. Greener, Relaxation phenomena in polymers: a snapshot, PMSE News,
Summer’93, 26-27. 26. S. Matsuoka, Relaxation phenomena in polymers, Hanser Publishers, NY, 1992. 27. R. O. E. Greiner, J. Kaschta, Prediction and calculation of the shear creep
behavior of amorphous polymers under progressive physical aging in multiphase reactor and polymerization system hydrodynamics, Houston, Tex.: Gulf Pub., p 683-709 (1996).
28. M. Mours and H. H. Winter, Viscoelasticity of polymers during heating/cooling sweeps, Ind. Eng. Chem. Res., 34, 3217-3222 (1995).
29. J. P. Mercier, G. Groenincks, Rheol. Acta, 8, 516 (1969). 30. C. D. Han, K. Y. Lee, and N. C. Wheeler, Plasticating single-crew extrusion of
amorphous polymers: development of a mathematical model and comparison with experiment, Polymer Engineering and Science, 36, 10, 1360-1376 (1996).
31. P. J. Mercier, J. J. Aklonis, M. Litt, A. V. Tobolsky, Viscoelastic behavior of the polycarbonate of bisphenol-A, J. Appl. Polym. Sci., 9, 447-459 (1965)
32. P. A. O'Connell and G. B. McKenna, Arrhenius-type temperature dependence of the segmental relaxation below Tg, Journal of Chemical Physics, 110, 22, 11054-11060 (1999).
33. T. L. Smith and R. E. Adam, Effect of tensile deformations on gas transport in glassy polymer films, Polymer, 22, 299-304 (1981).
34. D. M. Colucci, G. B. McKenna, in Structure and Dynamics of Glasses and Glass Formers, C. A. Angell editor, J. Res. Natl. Inst. Stand. Technol., 102, 2, 171 (1997).
35. J. Bartos and J. Kristiak, Free volume aspects of the strong-fragile classification of polymer liquids, Journal of non-crystalline solids, 235-237, 293-295 (1998).
36. D. J. Plazek and K. L. Ngai, Macromolecules, 24, 1222 (1991). 37. J. L. Duda and J. M. Zielinski, Free-Volume Theory, Plastics Engineering, 32,
143 (1996).

Chapter 5 - Is the transport of gas molecules through polymers directly related to the amount of free volume? 154
38. M. H. Cohen and D. Turnbull, J. Chem. Phys., 31, 1164 (1959). 39. J. S. Vrentas and J. L. Duda, J. Polym. Sci., 15, 403 (1977). 40. J. S. Vrentas and J. L. Duda, J. Polym. Sci., 15, 417 (1977). 41. H. Fujita, Fortschr. Hochpolym. Forsch., 3, 1 (1961). 42. W. M. Lee, Selection of barrier materials from molecular structure, Polym. Eng.
Sci., 20, 65-69 (1980). 43. E. R. Hensema, M. H. V. Mulder and C. A. Smolders, On the Mechanism of Gas
Transport in Rigid Polymer Membranes, Journal of Applied Polymer Science, 49, 2081 (1993).
44. P. Pekarski, J. Hampe, I Böhm, H.-G. Brion, and R. Kirchheim, Effect of aging and conditioning on diffusion and sorption of small molecules in polymer glasses, Macromolecules, 33, 2192-2199 (2000).
45. W. R. Vieth, L. H. Dao, and H. Pedersen, Non-equilibrium microstructural and transport characteristics of glassy poly(ethylene terephthalate), Journal of Membrane Science, 60, 41-62 (1991).
46. D. M. Colucci, P. A. O'Connell, G. B. McKenna, Stress relaxation experiments in polycarbonate: a comparison of volume changes for two commercial grades, Polymer Engineering and Science, 37, 9, 1469 (1997).
47. J. J. Curro and R.-J. Roe, Isothermal relaxation of specific volume and density fluctuation in poly(methyl methacrylate) and polycarbonate, Polymer, 25, 1424 (1984).
48. R.-J. Roe and J. J. Curro, Small-angle X-ray scattering study of density fluctuation in polystyrene annealed below the glass transition temperature, Macromolecules, 16, 428 (1983).

Chapter 6
Effect of the cooling rate on the gas transport properties
of polycarbonate
6.1. Introduction
Only a few studies have dealt with the influence of the cooling rate on the gas
transport properties of amorphous glassy polymers [1, 2]. In a study concerning
polycarbonate and the influence of quenching [1], it was observed that the solubility was
enhanced in a quenched film compared to a slowly cooled film. Nevertheless, some
polycarbonate samples were quenched in ice-water. Polycarbonate is very sensitive to
water [3] and the properties may have been greatly affected by the presence of water.
Furthermore, these studies relied on gas sorption experiments using carbon dioxide CO2
as the penetrant. However such types of sorption experiments do possess several
limitations. CO2 is indeed well-known to plasticize glassy polymers by decreasing the
value of the glass transition temperature Tg and by dilating the polymer chains [4-26].
The permeability coefficient P first decreases with the applied pressure, however above
the plasticization pressure (the minimum of the curve of P versus pressure), P starts to
increase. The permeation rate is accelerated and the selectivity reduced. CO2 in the gas
state is even capable of inducing crystallization in some polymers [27]. Furthermore,
samples used in sorption experiments are very often conditioned initially prior to
experiments. This conditioning, which consists of exposing the samples to the highest

Chapter 6 - Effect of the cooling rate on the gas transport properties of polycarbonate 156
pressure that will be used in the sorption experiments, may modify the polymers in an
irreversible manner [16, 18-22]. It should be noted at this point that the majority of
studies published by the membrane community have actually been carried out on as-
received or conditioned polymers. The preparation of the samples should be better
controlled. Moreover, a period of sometimes two months for CO2 is necessary to obtain a
sorption curve [28]. This comes from the fact that sorption data have to be taken at
equilibrium. Therefore, the material has time to age during the sorption experiment, and
its properties may be greatly affected by physical aging and change from the beginning of
the experiment to the end. The applied pressures are also rather high in sorption
experiments (up to about 20 to 30atm). Because of all the reasons cited above,
permeation experiments seem more accurate to generate gas transport data.
The cooling rate from the rubbery state to the glassy state should be regarded as
an important processing parameter since it is expected to affect the amount of free
volume present in the polymeric materials and its size and shape distribution. The reason
for this is that the glassy state corresponds to a non-equilibrium state. Physical aging, that
has been explained in Chapter 3, is its most obvious manifestation. The greater the
cooling rate from a particular temperature above Tg, the greater is the amount of free
volume trapped inside the polymeric matrix as the polymer undergoes a transition from
the rubbery to the glassy state with cooling.
The transport of gas molecules through amorphous glassy polymers is generally
believed to relate to the amount of free volume present in the polymeric material [29-33].
In light of the results reported in Chapter 5, knowledge of the free volume content alone
may not be sufficient to predict the gas transport properties. Not only the free volume
content but also its distribution may be an important parameter in describing the gas
transport phenomenon. A recent study by Nagel et al [34] suggested that the permeation
is determined not only by the amount of free volume, but also by the distribution of free
volume. Yet again, the study involved different types of glassy and rubbery polymers
instead of a particular polymer. Similarly, in a study involving a family of substituted
polycarbonates, Banerjee and Lipscomb [35] pointed out that the free volume distribution
may be extremely important in sorption and permeation. The variations in the heats of

Chapter 6 - Effect of the cooling rate on the gas transport properties of polycarbonate 157
sorption of CO2 in the various polymers were believed to give an indication about the
weighted average of the free volume distribution since they did not correlate with the free
volume content.
Knowledge of the relationship between the permeability and the cooling rate is of
fundamental importance to various industrial applications. By selecting the cooling rate
of the polymer, it could maybe be possible to control the performance of the polymeric
materials.
6.2. Experimental details
The following subsections mention briefly the materials and the instrumental
methods. The complete experimental details have been provided in Chapter 4. The reader
should refer to this particular chapter for deeper understanding of the materials and the
instrumental methods used in this research.
6.2.1. The materials
Bisphenol-A polycarbonate (BPA-PC) pellets with a weight average molecular
weight of 34,000g/mol were purchased from Aldrich, Milwaukee, WI. The pellets were
processed as detailed in Chapter 4. The thicknesses of the resulting polycarbonate films
were about 130µm. The films were kept in a dessicator at all times to avoid any water
moisture uptake.
Prior to experiments, the polymeric films were put between Kapton® sheets and
copper metal plates. The metal plates were suspended in the center of the internal fan GC
oven described in Chapter 4. The samples were heated in the GC oven from room
temperature (30oC) to 165oC at a heating rate of 40oC/min, kept at 165oC for 15min to
remove thermal history, and cooled within the GC oven at several controlled rates to
room temperature (30oC). A schematic of the temperature program is provided in Figure
6.1. It was determined that 15min were sufficient to remove thermal history. Room
temperature was assumed to be low enough (Tg–120oC) to freeze-in the material during

Chapter 6 - Effect of the cooling rate on the gas transport properties of polycarbonate 158
the timeframe of the experiments. It has actually been reported in the literature that
quenching polycarbonate from a given temperature above Tg to either 0oC or –94oC did
not affect properties such as solubility, density, or volume relaxation [1].
Roomtemperature
165oC 15 min
40o C/
min Coolingrate
Figure 6.1: Schematic of the temperature program. The polycarbonate films were heated from room temperature (30oC) to 165oC at a heating rate of 40oC/min, kept at 165oC for 15min to remove thermal history, and cooled with the internal fan oven at several controlled rates to room temperature.
The cooling rates possible with the GC oven ranged from 0.5oC/min to 40oC/min.
The programmed cooling rates were therefore chosen as 0.5oC/min, 10oC/min, and
40oC/min. It was observed that the GC oven did not always cool linearly with time. The
responses observed for the various chosen cooling rates are given from Figure 6.2 to
Figure 6.4. The rate of cooling was linear with time for a cooling rate of 10oC/min and
below only. At a cooling rate of 40oC/min, the temperature profile decayed exponentially
with time. Although the cooling rates did not always decrease linearly with time as
programmed, the experimental data were reproducible for a given cooling rate. The
cooling rate of the polymer may have been different from that of the oven, especially at
high cooling rates. No thermocouple was available to directly measure the temperature of
the polymer itself.
The system consisting of the polymer sandwiched between the Kapton® sheets
and the metal plates was also cooled by opening the door of the GC oven and by blowing
air immediately inside the oven with an external fan. The power of the fan, which was
controlled by a variable autotransformer, was set at the maximum power. The polymer
was believed to cool faster than when cooled by the internal fan located inside the GC
oven. The cooling rate was in excess of 40oC/min. Although precautions were taken to

Chapter 6 - Effect of the cooling rate on the gas transport properties of polycarbonate 159
have reproducibility between samples, it is obvious that samples cooled by the fan cannot
be as reproducible as samples cooled inside the oven.
The polymer films were used immediately once taken out of the GC oven.
0 50 100 150 200 250
25
50
75
100
125
150
175
slope = 0.50oC/min
T (
o C)
time (min)
Figure 6.2: Temperature measured inside the oven for a programmed cooling rate of 0.5oC/min. The samples were heated at 165oC for 15min and cooling was monitored with time. The cooling rate was found to be a linear function of time.

Chapter 6 - Effect of the cooling rate on the gas transport properties of polycarbonate 160
0 150 300 450 600 750 900
25
50
75
100
125
150
175
slope = 0.17oC/s = 10.1
oC/min
T (
o C)
time (s)
Figure 6.3: Temperature measured inside the oven for a programmed cooling rate of 10oC/min. The samples were heated at 165oC for 15min and cooling was monitored with time. The cooling rate was found to be a linear function of time.
0 200 400 600 800 1000 120020
40
60
80
100
120
140
160
180
slope =0.73oC/s = 43.8
oC/min
T (
o C)
time (s)
Figure 6.4: Temperature measured inside the oven for a programmed cooling rate of 40oC/min. The samples were heated at 165oC for 15min and cooling was monitored with time. The cooling rate was found to decay exponentially with time. The initial drop indicated by the line was determined to be 43.8oC/min, instead of the 40oC/min expected for the chosen cooling rate. The error on the reading was 1oC.

Chapter 6 - Effect of the cooling rate on the gas transport properties of polycarbonate 161
6.2.2. The instrumental methods
The density was obtained at 18oC using a linear density gradient column made of
an aqueous solution of sodium bromide as described in Chapter 4. The theoretical
resolution of the column was about 5×10⁻⁵ g/cm3. At least three samples for each cooling
rate were dropped in the column to verify reproducibility.
The dynamic mechanical experiments were carried out in the tensile mode as
described in Chapter 4. Dynamic temperature ramp experiments were carried out with the
following conditions. A torque of 10cNm was used on each clamp. The frequency was
chosen as 1Hz, the heating rate as 2oC/min, the initial temperature as 25oC, the strain as
0.025%, and the static force as 33g. The static force was optimized by running dynamic
frequency sweep test (strain control) at room temperature. Forgetting to enter this static
force in the DMTA parameters engenders some extra relaxations in the DMTA traces.
The tensile test may compress instead of pulling. For each cooling rate treatment, at least
two samples were run in the DMTA to verify reproducibility. The test stopped by itself at
about 7oC above Tg.
Permeation experiments were carried out using the permeation integral method
described in Chapter 4. The experiments were performed using three different gases,
namely He, O2, and N2, in that given sequence. The applied pressures were fixed at about
2.5 atm for He, and 3.9 atm for O2 and N2. Three measurements were taken for each gas
to ensure reproducibility and to calculate the error involved in the permeation results.
Please note that the degassing time between consecutive nitrogen runs were chosen as
120 min, and not 90min as given in Chapter 4. Permeation experiments were
consecutively performed on the same membrane at 35, 55, 65, and 80oC in order to
determine the activation energies for gas transport. Aging was found to be negligible at
those temperatures within the timeframe of the experiments. Indeed, no significant
change in density or in the DMTA traces could be observed. In order to verify that the
results were repeatable, another polymer film was also tested. It was verified that the data
points did fit on the error bar previously measured.

Chapter 6 - Effect of the cooling rate on the gas transport properties of polycarbonate 162
6.3. Results and discussion
Density, DMTA, and gas permeation results are presented and discussed in the
following subsections.
6.3.1. Density results
The densities of the polycarbonate samples cooled with different cooling rates
were obtained at 18oC using a linear density gradient column. The experimental results
are given in Figure 6.5. As expected, the greater is the cooling rate, thus the greater is the
amount of free volume trapped inside the polymeric matrix as the polymer undergoes a
transition from the rubbery to the glassy state, the lower is the density. The fact that the
density of quenched samples is lower than that of as-received samples is well-
documented in the literature for various polymers [36].
The density values of Figure 6.5 also indicate that no crystallization took place
inside the material since the density values are too low for this to have happened [37].
Since the thicknesses of the polycarbonate films were rather small (about 130µm),
we do not expect the occurrence of a density distribution between the skin and the core of
the material. The presence of such a density distribution in thicker samples has been
shown to be caused by cooling stresses [38].
The difference in the density values with the cooling rate are in agreement with
the literature. Wimberger-Friedl and de Bruin [39] studied the specific volume of
polycarbonate at different cooling rates. The experimental results were obtained in a
density gradient column filled with a K2CO3 water solution at 23oC. Since specific
volume and density are inversely related, one can easily calculate the density at the
different cooling rates obtained in the cited study. The densities ranged from about
1.1902 g/cm3 for a polycarbonate sample cooled at 0.1oC/min to about 1.1887 g/cm3 for a
sample cooled at 80oC/min. Therefore the density difference between the two cooling
rates was about 0.0015 g/cm3. However if one considers the cooling rates at 1oC/min and

Chapter 6 - Effect of the cooling rate on the gas transport properties of polycarbonate 163
10oC/min, the difference becomes around 0.00057 g/cm3. With the cooling rates selected
in the present research, the difference is about 0.00065 g/cm3 between the cooling rate of
0.5oC/min and that obtained by cooling with the fan, therefore in reasonable agreement
with the work cited above. In another study, Wimberger-Friedl and co-workers [38]
determined a linear relationship between the density of polycarbonate and the logarithmic
cooling rate. The slope showing a decrease in density with an increase in the cooling rate
was evaluated to be 3.4x10⁻⁴ (g.cm-3/oC.min-1). It is not possible to evaluate the density as
a function of the cooling rate in this study since it has been observed that at a cooling rate
of 40oC/min for instance the cooling rate was not constant with time.
1.1960
1.1962
1.1964
1.1966
1.1968
1.1970
1.1972
free volume
18oC
10 40 fan0.5
dens
ity (
g/cm
3)
cooling rate ( oC/min)
Figure 6.5: Density as a function of the cooling rate (note that the x-axis is not a continuous axis). The densities were measured at 18oC using a linear density gradient column.
6.3.2. DMTA results
The glass transition temperature Tg was determined from dynamic temperature
ramp measurements. The DMTA traces are shown in Figure 6.6. Because the glassy state
is not a stable phase, the Tg is not a true second order phase transition. The glass

Chapter 6 - Effect of the cooling rate on the gas transport properties of polycarbonate 164
transition temperature is a rate dependent phenomenon, and its value should be a function
of the cooling rate. As seen in Figure 6.7, the slower the cooling rate, the higher is the
value of the glass transition temperature Tg. The Tg corresponds to the temperature at
which the polymer chains can move globally. It gives an idea of the chain flexibility. As
the cooling rate decreases, the amount of free volume available for the polymer chains to
move decreases, and therefore the Tg is observed at higher temperature when heated from
room temperature to above Tg. A good definition of Tg has been given by Bicerano [40].
It reads as follows: “We can define Tg as the temperature at which the forces holding the
distinct components of an amorphous solid together are overcome, so that these
components become able to undergo large-scale viscous flow, limited mainly by the
inherent resistance of each component to such flow” [40]. Cooperativity concepts may
also be used to explain the glass transition temperature values. As a sample has been
cooled slowly, the amount of free volume may not be sufficient to allow rearrangements
easily and the number of conformers needed for relaxation to occur may be increased.
Those conformers should move together simultaneously for cooperative relaxation to take
place. Matsuoka and Hale have indeed shown that the Tg scales with the logarithm of the
average molecular weight of the conformers [41].
The value of the Tg was not found to be a linear function of the cooling rate. The
results were complicated by the fact that the experimental oven cooling rate may not have
been exactly equal to the cooling rate of the polymer, as mentioned previously.
Furthermore, the experimental oven cooling rate was not always a linear function of time
(see above). Kovacs [42, 43] determined that the Tg and the cooling rate q are linked as
follows:
1�
qûOQ
(q)û7
(q)TT
g
go
−=>>
Eq (6.1)
where To is the starting temperature and θ is a material constant. However in this case the
Tg was determined from cooling the polymer from the rubbery to the glassy state, and not
by heating the glassy samples. This point will be addressed later on.

Chapter 6 - Effect of the cooling rate on the gas transport properties of polycarbonate 165
140 145 150 155
1E8
1Hz, 0.025%, 2oC/min
Cooling rate external fan
40oC/min
10oC/min
0.5oC/min
E''
(Pa)
T(oC)
Figure 6.6: Loss modulus E” as a function of temperature for the samples cooled at different cooling rates. The DMTA conditions were the following: frequency = 1Hz, strain = 0.025%, heating rate = 2oC/min, static force = 33g, clamp force = 10cNm, initial temperature = 25oC.
0.5 10 40 fan
152.6
152.8
153.0
153.2
153.4
153.6
Tg
(o C)
cooling rate ( oC/min)
Figure 6.7: Glass transition temperature Tg (oC) versus rate of cooling (oC/min) (note that the x-axis is not a
continuous axis). The Tg was determined from the maximum of the loss modulus E” peak. The DMTA conditions were the following: frequency = 1Hz, strain = 0.025%, heating rate = 2oC/min, static force = 33g, clamp force = 10cNm, initial temperature = 25oC.

Chapter 6 - Effect of the cooling rate on the gas transport properties of polycarbonate 166
The literature reports that when a polymer is cooled from the rubbery state to the
glassy state, the Tg is lower for the lower cooling rate, as sketched in Figure 6.8 [42, 44-
50]. The position of the Tβ peak has also been shown to be affected by the cooling rate
[50]. As the cooling rate is varied by a factor of 10 the Tg is shifted by about 3oC and the
Tβ by about 6 to 7oC [50].
Gibbs and DiMarzio [51] postulate the existence of a true second order
thermodynamic transition below which the entropy remains zero. At equilibrium, the
value of the true Tg, referred to as T2, is given by:
2g2 CTT −= Eq (6.2)
At T2, only the lowest conformational energy state is allowed. C2 is the WLF parameter
defined in Chapter 5. C2 should be constant for a given polymer since the parameters
should be determined above Tg, thus in the equilibrium state. Since C2 is positive, it is
clear from Eq (6.2) that T2 is lower than the observed Tg and thus that Tg should decrease
with a decrease in free volume.
The fact that in the present study the Tg possesses the highest value for the lowest
cooling rate, hence for the sample closer to the equilibrium state, seems to be in
contradiction with the thermodynamic theory of the glass transition temperature
mentioned above. While heating a polymer from the glass (hence rather than by cooling it
from the liquid state), it seems nevertheless reasonable that the Tg should be higher for
the lower cooling rate, as seen in this study (see Figure 6.7), and reported also in the
literature [52]. The polymer had more time to cool down from the liquid state and thus to
decrease the amount of free volume trapped inside the polymeric matrix. Since the Tg
corresponds to the temperature at which the polymer chains can move globally, a lower
free volume content should imply a higher Tg, as predicted from the free volume theory.
Fox and Flory [53, 54] postulate that Tg corresponds to a critical free volume below
which not enough room is available for molecular conformational changes. Although this
model has been shown not to be verified under isochoric conditions, it is still valid under
isobaric conditions [55]. Similarly, it is well-established for instance that when a polymer
is cooled under pressure, the higher the applied pressure, the higher is the density, thus
the lower is the amount of free volume in the material, and the higher is the Tg [55, 56-
58]. Finally, if one has some doubts about the free volume theory of the glass transition

Chapter 6 - Effect of the cooling rate on the gas transport properties of polycarbonate 167
temperature, the results obtained by heating the polymer may also suggest that the
polymer cooled slower aged faster. Indeed since the glassy state is a non-equilibrium
state, aging takes place during the DMTA measurement. This point will be commented
further in Chapter 7.
It is well-established that the behavior of samples is different in heating and in
cooling. An hysteresis is observed in volume relaxation measurements for instance [59].
The discrepancies between Tg values obtained by heating and by cooling the polymer has
several consequences. In the frame of this research, one of them is that results showing
some trends between the Tg and gas transport should be looked at with scrutiny since the
Tg is usually determined by heating the polymer. In publications based on literature
databases this is even more critical since some researchers may determine the Tg on
heating, and others on cooling.
T
V
Tg (2) Tg (1)
r1
r2
Figure 6.8: Typical schematic showing the influence of the rate of cooling r on the value of the Tg (r1>r2). The results are obtained by cooling the polymer from the rubbery to the glassy state. The Tg appears to be lower for the lower cooling rate.
The loss modulus E” traces were normalized to read unity at Tg, as illustrated in
Figure 6.9. The traces were normalized in order to correct for the geometry factor. In
addition, if a particular polymer sample is run at three different frequencies in the DMTA
apparatus, as what as been done for instance in Chapter 5 to determine the activation
energy for frequency, the magnitude of the E” peak is modified for each frequency. The
higher the frequency, the greater is the shift to higher temperatures, and the lower is the

Chapter 6 - Effect of the cooling rate on the gas transport properties of polycarbonate 168
magnitude of E” (see Chapter 5). Nevertheless, the density remains constant from one
DMTA trace to another since only one sample is tested to generate those data. If one
normalizes the three E” traces to read unity at Tg, the same breadth is observed in the
glass transition range for a chosen value of E”. This breadth can be characteristic of a
given free volume amount and distribution.
The breadth of the normalized loss modulus peak was determined for several
values of the loss modulus, and for the different cooling rates selected in this research.
The results are given in Figure 6.10. As obvious from the figure, as the cooling rate
decreased, the breadth of the loss modulus decreased. This observation is in agreement
with the literature [60]. As suggested by Matsuoka [61], a decrease in the breadth of the
loss modulus peak may be attributed to a narrowing of the distribution of relaxation
times. This decrease corresponds to a lower degree of intermolecular cooperative motion,
or to a lower coupling. A large loss modulus peak breadth may correspond to a broader
distribution of free volume sizes. A study by Takahara, Saito, and Inoue [62] pointed out
a relationship between the width of the glass transition temperature and the degree of
density fluctuations. The value of Tg was determined by oscillating-DSC and the density
fluctuations by light scattering. Although the study focused on PMMA and physical
aging, it was reported that the width of the Tg increased when the density fluctuations
increased. The width of the Tg in DSC experiments is likely to correspond to the breadth
of the Tg peak in DMTA traces. Therefore, the greater the cooling rate, the greater is the
breadth of the E” peak, and possibly the greater is the size distribution of free volume.
Similarly, the value of the normalized E” was determined at different
temperatures, and for the different cooling rates. As seen in Figure 6.11, the value of the
normalized loss modulus decreased with temperature, and the decrease occurred faster for
the lower cooling rate. Results obtained right below and right above the glass transition
temperature were not identical, as shown in Figure 6.12. This came from the fact that the
loss modulus peak was not symmetrical. The value of E” decreased faster above than
below Tg. Moreover, the difference between the cooling rate curves seemed to disappear
above Tg, probably due to the fact that the polymer had reached conformational
equilibrium.

Chapter 6 - Effect of the cooling rate on the gas transport properties of polycarbonate 169
The DMTA curves were too noisy at about room temperature to distinguish any
forms of local motions at that particular temperature. The β-transition (at about –100oC)
was not characterized either.
140 145 150 155 160
0.1
1
1Hz, 0.025%, 2oC/min
Cooling rate
0.5oC/min
10oC/min
40oC/min
external fan
norm
aliz
ed E
''
T(oC)
Figure 6.9: Normalized loss modulus E” traces. The traces of Figure 6.6 were normalized to read unity at Tg (see Figure 6.6 for experimental details). The dotted lines correspond to various values of the loss modulus.

Chapter 6 - Effect of the cooling rate on the gas transport properties of polycarbonate 170
0.5 10 40 fan
0
5
10
15
error bar
Value of the normalized loss modulus 0.2 0.3 0.4 0.6 0.8 1
brea
dth
of n
orm
aliz
ed E
'' (
o C)
cooling rate ( oC/min)
Figure 6.10: Breadth of the normalized loss modulus peak in oC as a function of the cooling rate for different values of E” (note that the x-axis is not a continuous axis). See Figure 6.6 for experimental details.
0.5 10 40 fan0.00
0.25
0.50
0.75
1.00
T(oC) T
g
Tg-2
Tg-3
Tg-4
Tg-5
Tg-7
Tg-10
Tg-15
valu
e of
nor
mal
ized
E''
cooling rate ( oC/min)
Figure 6.11: Value of the normalized loss modulus as a function of the cooling rate for different temperatures at or below Tg (note that the x-axis is not a continuous axis). The error on the reading was negligible. The Tg’s of the samples cooled at 0.5oC/min, 10oC/min, 40oC/min, and by the external fan were taken as 153.57oC, 153.41oC, 153.32oC, and 152.79oC, respectively.

Chapter 6 - Effect of the cooling rate on the gas transport properties of polycarbonate 171
-6 -4 -2 0 2 4 60.0
0.2
0.4
0.6
0.8
1.0
Tg
Cooling rate
0.5oC/min
10oC/min
40oC/min external fan
Nor
mal
ized
E''
valu
e
Tg +/- T (oC)
Figure 6.12: Normalized E” as a function of Tg ± T (oC) for different cooling rates showing the asymmetry of the loss modulus peak (see Figure 6.6 for experimental details).
6.3.3. Density / DMTA results
The Tg obtained on heating the polymer from the glassy to the rubbery state was
plotted as a function of the density to determine whether or not there was a linear
relationship between those two properties. Recall, the value of the Tg may be explained
from free volume concepts (see above). As seen in Figure 6.13, the Tg and the density are
not linearly related. Since the density is expected to be related to the amount of free
volume contained in the polymeric matrix, the value of the Tg should be explained
differently. Inconsistencies in the behaviors of the Tg and the density have been reported
in the literature for oriented samples [63, 64]. More details will be given in Chapter 8.
The Tg value may take into account the distribution of free volume as well, as
suggested by Song and Roe [65]. Actually, the idea of an iso-free volume Tg has been
shown to be inconsistent with isochoric results [55]. The behavior of polycarbonate under
both isobaric (constant pressure) and isochoric (constant volume) conditions was
examined by Colucci, McKenna, and co-workers [55]. Please note that measurements
were taken from the rubbery state to the glassy state, and that the rate of cooling was the

Chapter 6 - Effect of the cooling rate on the gas transport properties of polycarbonate 172
same in both types of experiments. A glass transition temperature was shown to exist
under both sets of conditions. Indeed, a change in the slope of either the volume or the
pressure versus temperature was observed, this change in slope being more pronounced
in the isobaric case. After appropriate adjustment, it was shown that the Tg values were
the same in both the isobaric and isochoric conditions, as well as the rubbery responses,
but the glassy responses were different. The Fox and Flory theory [53, 54] postulating the
existence of an iso-free volume Tg was finally investigated by the researchers. An iso-free
volume Tg means that the amount of free volume is constant at Tg, independently of the
pressure (for isobaric conditions) or the volume (for isochoric conditions). Tg corresponds
to a critical free volume below which not enough room is available for molecular
conformational changes. The free volume Vf was observed to be constant as a function of
temperature below Tg and then to increase with temperature in both cases. Nevertheless,
in the case of isobaric experiments, Vf was not found to have the same values below Tg
for each volumes, thus contradicting the idea of an iso-free volume Tg. The Prigogine
Defay ratio has also been observed to differ from unity in several cases [55, 65].
The definition of the glass transition temperature Tg remains still ambiguous
nowadays. Three major theories can be found in the literature to define this Tg : the free
volume theory, the thermodynamic theory, and the kinetic theories [66]. However none
of them really stands apart and a full understanding of the Tg remains still an area of
active research.
Reporting a single value for Tg may not be sufficient. Indeed, the Tg may be better
defined by a range (from xxoC to xxoC). This range should however be different while
using different techniques. The transition zone is sometimes only 30oC by DSC, and
about 100oC by DMTA [67]. The transition range is usually wider for DMTA. Values
obtained for Tg by DSC and DMTA are also different since the principles on which the
techniques are based are different. DSC measures the change in heat capacity whereas
DMTA measures the transition associated with cooperative chain motion. Similarly, Tg
values obtained by the dielectric and the DMTA methods differ since those methods do
probe a different length scale, although they both measure the relaxation mechanism
(dielectric: monomer unit, DMTA: 5 to 10 repeat units) [68].

Chapter 6 - Effect of the cooling rate on the gas transport properties of polycarbonate 173
1.1962 1.1964 1.1966 1.1968 1.1970
152.6
152.8
153.0
153.2
153.4
153.6
Tg (
oC
)
density at 18oC (g/cm
3)
Figure 6.13: Glass transition temperature Tg versus density. The Tg was obtained from DMTA measurements. The density was determined at 18oC using a linear density gradient column.
Published data seem to suggest that the breadth of the DMTA peak may be related
to the distribution of free volume [62]. Instead, it has been found in this study that the
breadth of the loss modulus E” DMTA peak is directly correlated with the density, as
seen in Figure 6.14. Only one linear regression is shown in Figure 6.14 for clarity, but the
same behavior was observed for all the E” values. Obviously, since the density and the Tg
are not linearly correlated, neither are the E” breadth and the Tg (see Figure 6.15).
Therefore it appears from this study that the breadth of the E” peak is directly correlated
with the density, and thus with the amount of free volume.
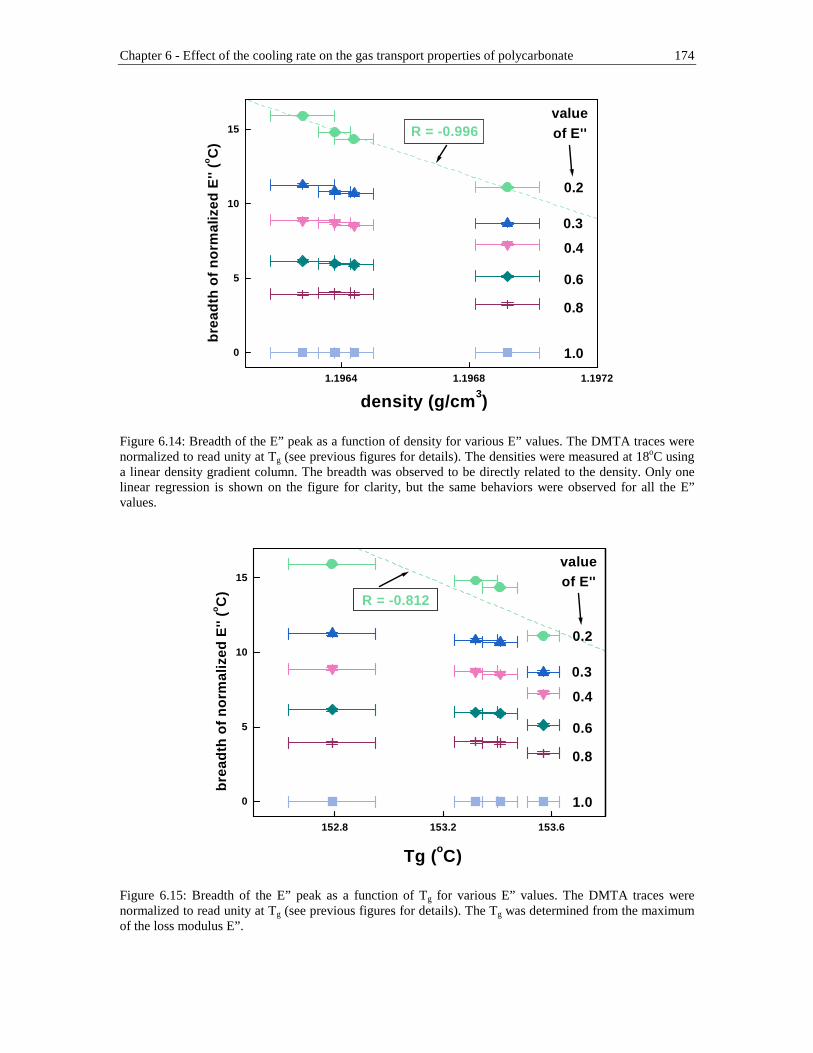
Chapter 6 - Effect of the cooling rate on the gas transport properties of polycarbonate 174
0
5
10
15
1.1964 1.1968 1.1972
R = -0.996valueof E''
0.3
1.0
0.8
0.6
0.4
0.2
density (g/cm 3)
brea
dth
of n
orm
aliz
ed E
'' (
oC
)
Figure 6.14: Breadth of the E” peak as a function of density for various E” values. The DMTA traces were normalized to read unity at Tg (see previous figures for details). The densities were measured at 18oC using a linear density gradient column. The breadth was observed to be directly related to the density. Only one linear regression is shown on the figure for clarity, but the same behaviors were observed for all the E” values.
0
5
10
15
152.8 153.2 153.6
valueof E''
0.3
1.0
0.8
0.6
0.4
0.2
Tg (oC)
brea
dth
of n
orm
aliz
ed E
'' (
oC
)
R = -0.812
Figure 6.15: Breadth of the E” peak as a function of Tg for various E” values. The DMTA traces were normalized to read unity at Tg (see previous figures for details). The Tg was determined from the maximum of the loss modulus E”.

Chapter 6 - Effect of the cooling rate on the gas transport properties of polycarbonate 175
6.3.4. Permeation results
The gas transport parameter and activation energy results are presented in this
subsection. The influence of the cooling rate is examined. Applicability of the free
volume theory is also investigated based on the experimental data obtained in this study.
Finally, the gas transport data are used to estimate the average distances between polymer
chains.
6.3.4.1. Determination of the gas transport coefficients (P,D,S)
The gas transport coefficients were determined as a function of the cooling rate.
One would expect that if the free volume amount in the material increases, the
permeability P will also increase [69, 70]. However, as seen in Figure 6.16, this is not the
case for polycarbonate. P remains relatively constant with the cooling rate. The free
volume present in polymers is commonly believed to allow molecular motions, to
enhance the diffusional jumps, and to increase the permeability [69]. This study points
out that the permeability coefficient should not be directly related to the Tg or the overall
free volume content, as what is commonly done in the literature [69, 70]. On the other
hand, the lower the kinetic diameter of the penetrant gas molecule, the greater is the
permeability. The kinetic diameters of He, O2, and N2 are reported as 2.6 Å, 3.46 Å, and
3.64 Å, respectively [71-74].
The selectivity αAB (as defined by Eq (6.3)) between two gases A and B remains
therefore constant with the cooling rate. Please note that in this research the applied
pressure was lower for He compared to O2 and N2 because of the rapidity of the He
permeation. However studies in the literature have demonstrated that P in polycarbonate
is independent of pressure, at least up to 10 atm [75]. Therefore the selectivity is not
expected to change much at a lower He applied pressure.

Chapter 6 - Effect of the cooling rate on the gas transport properties of polycarbonate 176
=
B
AAB P
P. Eq (6.3)
The main objective of the membrane community is to create new materials having
a high permselectivity. Unfortunately, an increase in permeability is generally
accompanied by a decrease in selectivity. This ultimate property is expected to be
reached by creating materials with a narrow free volume distribution. The average free
volume size should be lower than the size of the undesirable gas molecule [76]. Regions
of high free volume are believed to decrease the selectivity. The experimental data
obtained in this study suggest that the amount of free volume may not be a critical
parameter to look at in order to achieve a high permselectivity. The free volume
distribution may instead be the parameter to control.
0
5
10
15
35oC
0.5 10 40 fan
He O
2
N2
P (
barr
ers)
cooling rate ( oC/min)
Figure 6.16: Permeability coefficient P for He, O2, and N2 as a function of the cooling rate (note that the x-axis is not a continuous axis). The permeation experiments were performed at 35oC. The applied pressures were fixed at about 2.5atm for He, and 3.9atm for O2 and N2.
The effects of the cooling rate on D and S were evaluated. The analysis was not
possible for helium due to the short time lag (and thus large error) observed for that
particular gas. The experimental results are shown in Figure 6.17 and Figure 6.18.

Chapter 6 - Effect of the cooling rate on the gas transport properties of polycarbonate 177
Although P remained unchanged with an increase in the cooling rate (see Figure 6.16), D
and S appear to be significantly affected by the cooling rate, especially for the greater
kinetic diameter gas molecule (see Figure 6.18). However the trends seen for D and S are
inversely related. The greater the cooling rate, the greater is the solubility coefficient S,
and the lower is the diffusion coefficient D. The error bars for each gas reflect the
accuracy between three successive gas transport measurements on the same membrane,
and another measurement on another membrane in addition. They are therefore not
underestimated. The changes seen for N2 were reproducible and significant.
6,0x10⁻⁸
7,0x10⁻⁸
8,0x10⁻⁸
9,0x10⁻⁸ O
2
35oC
0.5 10 40 fan
D (
cm2 /s
)
cooling rate ( oC/min)
2,2x10⁻³
2,4x10⁻³
2,6x10⁻³
2,8x10⁻³
3,0x10⁻³
S (cm
3@S
TP
/cm3polym
er .cmH
g)
Figure 6.17: Diffusion coefficient D and solubility coefficient S for O2 as a function of the cooling rate (note that the x-axis is not a continuous axis). The permeation experiments were performed at 35oC. The applied pressure was fixed at about 3.9atm for O2.

Chapter 6 - Effect of the cooling rate on the gas transport properties of polycarbonate 178
2,0x10⁻⁸
2,5x10⁻⁸
3,0x10⁻⁸
3,5x10⁻⁸
4,0x10⁻⁸
35oC, N
2
0.5 10 40 fan
D
D (
cm2 /s
)
cooling rate ( oC/min)
1,0x10⁻³
1,2x10⁻³
1,4x10⁻³
1,6x10⁻³
S (cm
3@S
TP
/cm3polym
er .cmH
g)
S
Figure 6.18: Diffusion coefficient D and solubility coefficient S for N2 as a function of the cooling rate (note that the x-axis is not a continuous axis). The permeation experiments were performed at 35oC. The applied pressure was fixed at about 3.9atm for N2.
On one hand, the solubility coefficient S relates to the amount of free volume
present in the material. If a particular polymeric material increases its overall free volume
content, S should show a greater value for a given penetrant since the material can sorb
more gas molecules. This fact is observed in Figure 6.18. The faster the cooling rate, and
thus the greater the amount of free volume trapped inside the polymeric matrix, the
greater is the solubility.
In this study, S appears to be greater for O2 than for N2. The free volume
contained in the polymeric matrix and accessible for sorption decreases with the kinetic
diameter of the gas molecule [77]. However the degree to which the penetrant interacts
with the polymeric matrix plays also an important role for sorption. The greater the
interactions between the gas and the polymer, the more soluble the gas into the polymer.
In addition, usually S increases with the permeant size because of the increase in boiling
points. Nevertheless, the solubility coefficient of O2 in polycarbonate is greater than that
of N2 despite of the lower kinetic diameter. Our results are in agreement with the
literature [75].

Chapter 6 - Effect of the cooling rate on the gas transport properties of polycarbonate 179
On the other hand, D surprisingly decreases with the cooling rate. As expected
though, the smaller the kinetic diameter of the gas molecule, the greater is the value of D
since a small molecule should be able to go through a polymer more rapidly. The
decrease in D with an increase in the free volume content cannot be justified employing
free volume arguments.
It is first of all important to understand how small molecule diffusion eventually
occurs in polymer glasses. Gases diffuse from one polymer cavity to an adjacent one by
activated jumps (see Figure 6.19). Since polymer chains move constantly due to thermal
motions, a temporary channel can open for a short period of time (of about a few hundred
picoseconds [78]) and allow a gas molecule to go to a nearby cavity through this large
enough transient gap. In this new cavity, the gas molecule will have to wait for another
opportunity to jump to the next cavity, etc. Some researchers visualize this as cages
formed by four polymer chains [30]. Obviously, at low permeation temperatures the gas
molecule stays longer in a cavity since the polymer does not have enough thermal energy
for rapid molecular motions and thus to create large enough gaps in the polymeric matrix
rapidly. The diffusional process of small molecules through glassy polymers should
involve only a few local polymeric segments, or a low level of cooperativity. The total
amount of free volume present in the polymeric matrix may not be a critical parameter.
Diffusive jumps should be dependent on the nature and/or composition of the polymer, its
molecular weight and molecular weight distribution, its topology and morphology, the
penetrant size, and the interactions between the polymer and the penetrant. Moreover, the
distribution, possibly the shape of the free volume, as well as the dynamics of the
polymer chains may also affect the diffusional jumps.
No diffusive jump Penetrant jump
Figure 6.19: Schematic of the diffusion activated jumps.

Chapter 6 - Effect of the cooling rate on the gas transport properties of polycarbonate 180
Motions can be classified into several types depending on their scale: they can
either be local motions, segmental motions, or even reptation. The mobility depends also
obviously on temperature. The greater the temperature, the greater the length of the
movable portion of the polymer chain. Because of those molecular motions the
conformation of the polymer chain is capable of changing with time. And all types of
motions should contribute to the relaxation process.
Kovacs and co-workers [42] and Tool [79] have shown that a distribution of relaxation
times must exist in polymers, and that each particular relaxation time actually constitutes
a unique parameter for the glass transition phenomena. Since the polymer chains are
characterized by many modes of molecular motions, a distribution of relaxation times is
necessary. If a polymeric sample is cooled slowly, the fast processes with short relaxation
times are fully relaxed. The relaxation time distribution spectrum is truncated [42, 43], as
shown in Figure 6.20.
A paper by Araki et al [60] reported the dynamic mechanical behavior of polycarbonate
samples with different thermal histories. It was shown that a sample cooled slowly from
260oC to room temperature at a cooling rate of 0.7oC/min presented a different loss
modulus E” curve than a sample directly quenched to room temperature. Indeed, the
values of E” and tan δ were much higher for the sample quenched while measured as a
function of temperature. The curves of the quenched and the slowly cooled samples
merged at around Tg though. This suggested to Araki and co-workers that the sample that
has been quenched possessed a larger amount of unrelaxed segments. Those segments
subsequently relaxed during the DMTA measurement. Please note that the samples were
less than 0.1mm thick and hence a skin-core distribution can be assumed as negligible.
The above conclusions tend to confirm the fact that local or segmental parts are more
relaxed in a slowly cooled sample.
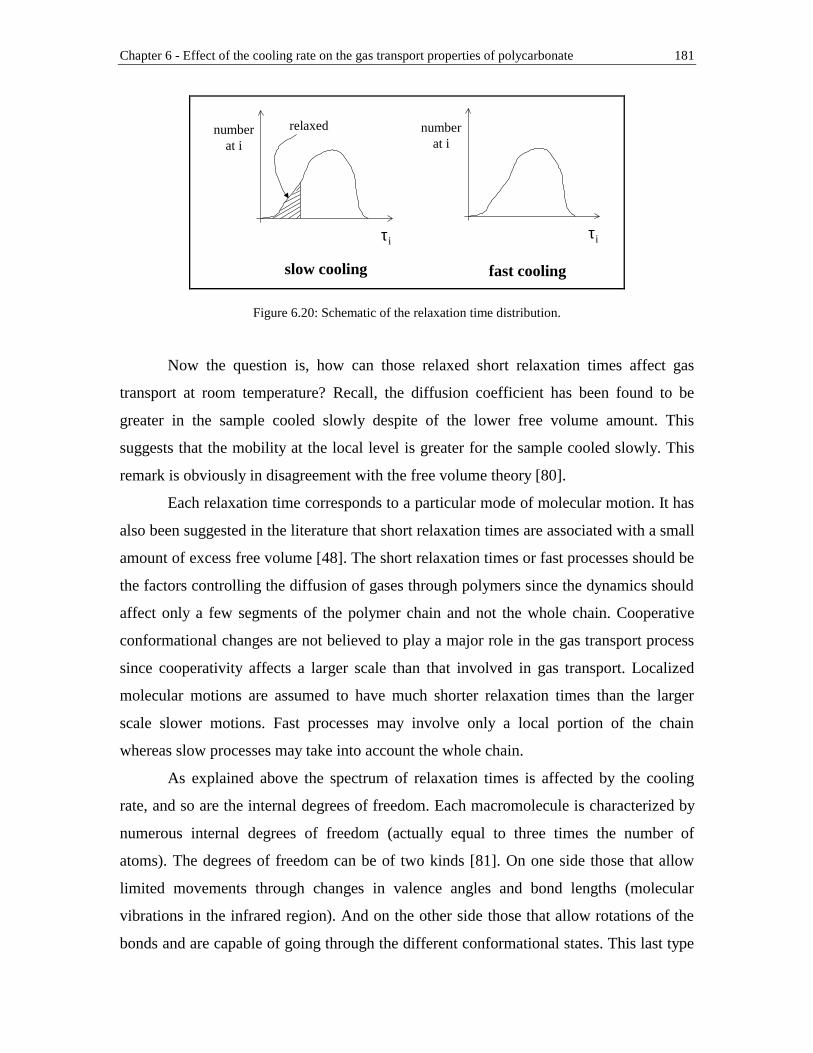
Chapter 6 - Effect of the cooling rate on the gas transport properties of polycarbonate 181
τi
numberat i
τi
numberat i
relaxed
slow cooling fast cooling
Figure 6.20: Schematic of the relaxation time distribution.
Now the question is, how can those relaxed short relaxation times affect gas
transport at room temperature? Recall, the diffusion coefficient has been found to be
greater in the sample cooled slowly despite of the lower free volume amount. This
suggests that the mobility at the local level is greater for the sample cooled slowly. This
remark is obviously in disagreement with the free volume theory [80].
Each relaxation time corresponds to a particular mode of molecular motion. It has
also been suggested in the literature that short relaxation times are associated with a small
amount of excess free volume [48]. The short relaxation times or fast processes should be
the factors controlling the diffusion of gases through polymers since the dynamics should
affect only a few segments of the polymer chain and not the whole chain. Cooperative
conformational changes are not believed to play a major role in the gas transport process
since cooperativity affects a larger scale than that involved in gas transport. Localized
molecular motions are assumed to have much shorter relaxation times than the larger
scale slower motions. Fast processes may involve only a local portion of the chain
whereas slow processes may take into account the whole chain.
As explained above the spectrum of relaxation times is affected by the cooling
rate, and so are the internal degrees of freedom. Each macromolecule is characterized by
numerous internal degrees of freedom (actually equal to three times the number of
atoms). The degrees of freedom can be of two kinds [81]. On one side those that allow
limited movements through changes in valence angles and bond lengths (molecular
vibrations in the infrared region). And on the other side those that allow rotations of the
bonds and are capable of going through the different conformational states. This last type

Chapter 6 - Effect of the cooling rate on the gas transport properties of polycarbonate 182
is the only one of concern here. As a polymer is cooled slowly from the liquid state, the
segments may be able to reach their equilibrium conformation, and therefore loose some
degrees of freedom. In this case the equilibrium conformation would be the trans-trans
conformation. It is well-established for instance that on slow cooling certain polymers
(isotactic mainly) can form crystals. The chains adopt a trans-trans conformation.
In amorphous polycarbonate one can find two main conformations: the trans-trans
and the trans-cis conformations. The molecule should be in either one of those
conformational states most of the time, and vibrate around the energy minimum. Of
course, intermediate conformations can also be found in polycarbonate. It has been
shown for instance that with sub-Tg annealing (the annealing temperature being in the
vicinity of Tg) the population of trans-trans conformers increases whereas that of trans-cis
conformers decreases [82, 83]. Nevertheless, aging at room temperature does not show
such conformational rearrangements but rather a narrowing of the distribution of
conformations around the trans-cis and the trans-trans conformations, hence by extremely
local rearrangements around the local minima [83]. Closer local packing of the polymer
chains occurs in the trans-trans conformation. Some local parallel alignment of
neighboring chain segments may also take place, although this idea is still controversial.
The trans-trans conformation is also known to be more stable. As the temperature
increases however the trans-cis conformations become favored [82, 84].
If the above remarks are applied to our experimental results, this would mean that
the sample that has been cooled slowly may contain more trans-trans conformations, as
the polymer has more time to reach the low energy conformation. However, how can this
closer local packing enhance the diffusion process?
Not only the static but also the dynamics of the polymer chains is an important
factor in the gas transport process. The dynamics may actually be important in explaining
even the glass transition, as suggested by Angell [85]. Nevertheless, some caution about
this have been given elsewhere [86]. Segmental motions are necessary in order to allow
the gas molecules to jump from cavities to cavities. The amount of cavities as well as the
ease with which a gas molecule jumps from one cavity to another is an important factor.
The vibrations or fluctuations allow a local rearrangement of the conformations, which
may facilitate the gas transport phenomenon. The thermal energy is dissipated with time

Chapter 6 - Effect of the cooling rate on the gas transport properties of polycarbonate 183
as the molecules change their conformations. Computer simulations provide information
on the evolution of the molecular conformations with time on a length scale of a few
bonds [87]. The lifetime of the channels facilitating the jumping process from one cavity
to another has been shown from computer simulation studies to have an effect on the
value of the diffusion coefficient [88]. The longer the channel lifetime, the greater is the
tendency of the molecule to go back to the previous cavity through this channel instead of
jumping to the next cavity separated by a higher energy barrier, hence slowing down the
diffusion process. Less activated energy is believed to be necessary for a molecule to
move along the chain [89]. Nevertheless the molecules have to jump across chains as
well due to entanglements.
Our experimental results suggest that a gas molecule goes faster through a
polymer possessing a greater amount of trans-trans conformations. The fluctuations or
redistributions of the polymer glass caused by thermal motions may be greater in that
case. The polymer chains may be capable of fluctuating more around the lowest energy
state position, the trans-trans conformation, despite of the lower overall free volume,
hence facilitating the gas diffusion process. We postulate therefore that the dynamics of
the polymer chains are more rapid in the trans-trans conformation.
A recent publication reporting molecular modeling in polypropylene has shown
the influence of the dynamic conformation [90]. When the polymer torsional degrees of
freedom are allowed to exist during the event, this affects significantly the energy
barriers. On one hand the energy selectivity of O2 and N2 is reduced by four orders of
magnitude as the polymer is allowed to have different degrees of freedom, or to change
its conformations during the timescale of the calculations. On the other hand the entropic
selectivity remains rather unchanged. The ratio of the diffusion coefficients of A and B
(A and B being the components of a gas mixture) can be calculated from transition state
theory to correspond to:
)kT
û8exp( )
k
û6exp(
D
D BA,BA,
B
A−
= Eq (6.4)
where k is the Boltzmann constant and ∆SA,B and ∆UA,B are the differences in entropy and
energy barriers, respectively. The first term corresponds to the entropic selectivity and the
second term to the energetic selectivity.
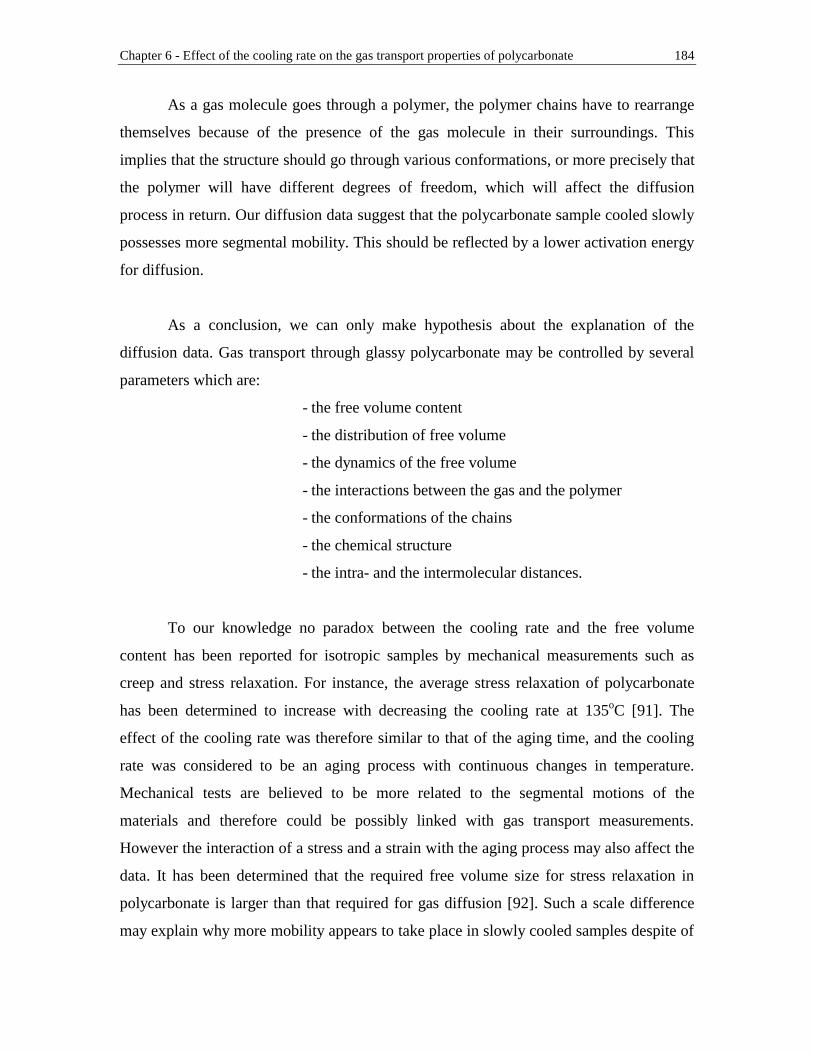
Chapter 6 - Effect of the cooling rate on the gas transport properties of polycarbonate 184
As a gas molecule goes through a polymer, the polymer chains have to rearrange
themselves because of the presence of the gas molecule in their surroundings. This
implies that the structure should go through various conformations, or more precisely that
the polymer will have different degrees of freedom, which will affect the diffusion
process in return. Our diffusion data suggest that the polycarbonate sample cooled slowly
possesses more segmental mobility. This should be reflected by a lower activation energy
for diffusion.
As a conclusion, we can only make hypothesis about the explanation of the
diffusion data. Gas transport through glassy polycarbonate may be controlled by several
parameters which are:
- the free volume content
- the distribution of free volume
- the dynamics of the free volume
- the interactions between the gas and the polymer
- the conformations of the chains
- the chemical structure
- the intra- and the intermolecular distances.
To our knowledge no paradox between the cooling rate and the free volume
content has been reported for isotropic samples by mechanical measurements such as
creep and stress relaxation. For instance, the average stress relaxation of polycarbonate
has been determined to increase with decreasing the cooling rate at 135oC [91]. The
effect of the cooling rate was therefore similar to that of the aging time, and the cooling
rate was considered to be an aging process with continuous changes in temperature.
Mechanical tests are believed to be more related to the segmental motions of the
materials and therefore could be possibly linked with gas transport measurements.
However the interaction of a stress and a strain with the aging process may also affect the
data. It has been determined that the required free volume size for stress relaxation in
polycarbonate is larger than that required for gas diffusion [92]. Such a scale difference
may explain why more mobility appears to take place in slowly cooled samples despite of

Chapter 6 - Effect of the cooling rate on the gas transport properties of polycarbonate 185
the lower free volume content by gas transport measurements and not in mechanical tests.
Cavities of given sizes may be needed for stress relaxation to take place.
The change in percent of the gas transport coefficients has been plotted as a
function of the cooling rate for a specific gas. The plots are shown from Figure 6.21 to
Figure 6.23. The trends are clearly significant for N2. The permeability coefficient
appears to remain constant within the experimental errors, whereas the diffusion
coefficient decreases and the solubility coefficient increases with the cooling rate.
0.5 10 40 fan-4
-2
0
2
4
6
8
10
He P
% c
hang
e in
coe
ffici
ent
cooling rate ( oC/min)
Figure 6.21: % change in permeability coefficient for He (note that the x-axis is not a continuous axis). The data obtained for a cooling rate of 0.5oC/min were taken for reference. A positive percent change corresponds to an increase in the coefficient, a negative one to a decrease.

Chapter 6 - Effect of the cooling rate on the gas transport properties of polycarbonate 186
0.5 10 40 fan
-15
-10
-5
0
5
10
15
20O
2
P D S
% c
hang
e in
coe
ffici
ent
cooling rate ( oC/min)
Figure 6.22: % change in permeability, diffusion, and solubility coefficients for O2 (note that the x-axis is not a continuous axis). The data obtained for a cooling rate of 0.5oC/min were taken for reference. A positive percent change corresponds to an increase in the coefficient, a negative one to a decrease.
0.5 10 40 fan
-30
-20
-10
0
10
20
30
40 N2
P D S
% c
hang
e in
coe
ffici
ent
cooling rate ( oC/min)
Figure 6.23: % change in permeability, diffusion, and solubility coefficients for N2 (note that the x-axis is not a continuous axis). The data obtained for a cooling rate of 0.5oC/min were taken for reference. A positive percent change corresponds to an increase in the coefficient, a negative one to a decrease.

Chapter 6 - Effect of the cooling rate on the gas transport properties of polycarbonate 187
The complete permeation data are recapitulated in Table 6.1 through Table 6.3 .
The permselectivities appear to remain constant with a change in the cooling rate, as
mentioned previously. The diffusion selectivity between O2 and N2 increases with the
cooling rate. In contrast, the solubility selectivity decreases with the cooling rate. As a
polymer is cooled faster, it possesses a greater overall free volume amount, as well as
probably bigger cavities. Therefore it becomes more difficult to separate gas molecules
based on their sizes, at least based on sorption effects. The fact that the diffusion
selectivity is higher in the high content free volume material may be a result of the
differences in the local chain dynamics.
The value of the permeability coefficient P in polycarbonate is in agreement with
the literature, as seen in Table 6.4. The value of the applied pressure in this work is not
always the same as in the literature, however Costello and Koros [75] observed that P in
polycarbonate was almost independent of the applied pressure, at least up to 10 atm.
Again, the values of S and D are consistent with the literature for polycarbonate, as seen
in Table 6.5.
cooling rate PHe / PO2 PHe / PN2 PO2 / PN2
0.5oC/min 14.1 (+/-) 0.35 1.89 (+/-) 0.05 0.39 (+/-) 0.01 7.5 36.2 4.810oC/min 14.6 (+/-) 0.73 1.99 (+/-) 0.10 0.41 (+/-) 0.02 7.3 35.6 4.940oC/min 14.31 (+/-) 0.36 1.92 (+/-) 0.05 0.38 (+/-) 0.01 7.5 37.7 5.1
fan 14.08 (+/-) 0.35 1.91 (+/-) 0.05 0.39 (+/-) 0.01 7.4 36.1 4.9
PHe (barrer) PO2 (barrer) PN2 (barrer)
Table 6.1: Permeability coefficients at 35oC. The applied pressures were 2.5atm for He, and 3.9atm for O2 and N2.
cooling rate DO2 / DN2
0.5oC/min 7.70E-08 (+/-) 3.85E-09 3.52E-08 (+/-) 1.76E-09 2.210oC/min 8.16E-08 (+/-) 8.30E-09 3.40E-08 (+/-) 3.40E-09 2.440oC/min 8.09E-08 (+/-) 4.05E-09 3.19E-08 (+/-) 1.60E-09 2.5
fan 6.97E-08 (+/-) 3.49E-09 2.62E-08 (+/-) 1.31E-09 2.7
DO2 (cm2/s) DN2 (cm2/s)
Table 6.2: Diffusion coefficients at 35oC. The applied pressures were 2.5atm for He, and 3.9atm for O2 and N2.

Chapter 6 - Effect of the cooling rate on the gas transport properties of polycarbonate 188
cooling rate SO2 / SN2
0.5oC/min 2.9E-03 (+/-) 7.3E-05 1.3E-03 (+/-) 3.3E-05 2.210oC/min 2.9E-03 (+/-) 1.4E-04 1.5E-03 (+/-) 7.0E-05 2.040oC/min 2.8E-03 (+/-) 7.0E-05 1.4E-03 (+/-) 3.6E-05 2.0
fan 3.3E-03 (+/-) 8.1E-05 1.8E-03 (+/-) 4.5E-05 1.8
SO2 (cm3@STP/cm3.cmHg) SN2 (cm3@STP/cm3.cmHg)
Table 6.3: Solubility coefficients at 35oC. The applied pressures were 2.5atm for He, and 3.9atm for O2 and N2.
PHe PO2 PN2 reference conditions
14.31 1.92 0.38 this work 35oC, 2.5atm for He, 3.9atm for O2 and N2
11 2 0.3 75 35oC, 5atm13 1.6 0.36 95 35oC, 2atm15 1.48 0.29 124 35oC
14.5 0.28 74 35oC, 2atm
Table 6.4: Comparison of the results of the present work with those reported in the literature. The results obtained at a cooling rate of 40oC/min in this work are reported in the table. Permeability coefficients are given in barrer.
DO2 DN2 SO2 SN2 reference conditions
8.09E-08 3.19E-08 2.8E-03 1.4E-03 this work 35oC, 2.5atm for He, 3.9atm for O2 and N2
2.60E-03 1.60E-03 75 35oC5.80E-08 2.80E-08 717.90E-08 2.80E-03 95 35oC, 2atm4.11E-08 1.59E-08 105 data listed in a database5.10E-08 1.64E-08 125 35oC, 1atm
Table 6.5: Comparison of the results of the present work with those reported in the literature. The results obtained at a cooling rate of 40oC/min in this work are reported in the table. Diffusion coefficients are given in (cm2/s), solubility coefficients in (cm3@STP/cm3.cmHg). Please note that solubility coefficients given in the literature were determined from sorption experiments.
6.3.4.2. Fractional free volume (FFV) calculations
The vast majority of the models developed by researchers to explain gas transport
in glassy polymers is based on the concept of free volume [29-33]. The fractional free
volume (FFV) is defined as follows:

Chapter 6 - Effect of the cooling rate on the gas transport properties of polycarbonate 189
! V1V
V1
V
VV
V
V FFV o
oof −=
−=
−=
= Eq (6.5)
where V is the polymer specific volume (=1/ρ, where ρ stands for density), Vf is the
average hole free volume (=(V-Vo)), and Vo is the specific volume occupied by the
polymer molecules. The fractional free volume FFV can thus be estimated from the
knowledge of the experimental density and that of the occupied volume.
The most common approach used by the gas transport community to determine
the occupied volume Vo is based on Bondi’s group contribution method [93]. The
polymer repeat unit is separated into chemical groups, and each chemical group i is
attributed a given value for the Van der Waals volume VW. The values of VWs have been
estimated by Bondi for specific chemical groups [93], and reported by Van Krevelen
[94]. Multiplying the sum of those VWs by a universal empirical factor of 1.3 gives an
estimate of Vo. The empirical factor has been estimated by Bondi based on the packing
densities of molecular crystals at 0K, and the value of 1.3 is assumed to apply to all types
of chemical groups. Therefore we have:
( ) i
n
1iWo V 1.3V ∑
=
= Eq (6.6)
And from Eq (6.5) we get: ( ) Wi
n
1iW V ! 1.3-1 V ! 1.3- 1 FFV =
= ∑
=
Eq (6.7)
Please note that the fractional free volume given above is different from the one
estimated from viscoelastic measurements in Chapter 5 since the definitions are different
in both cases. In Chapter 5, the fractional free volume was determined at Tg, hence the
name fg. The WLF theory (see Chapter 5) assumes that the fractional free volume keeps a
constant value below Tg, and is therefore fixed as fg. Nevertheless, in the equations given
above, FFV is allowed to change below Tg since it is based on the density value. The
definitions and evaluations of the fractional free volume are indeed the major limitation
of free volume theories.
A new evaluation method for glassy polymers with rigid backbones suggested by
Park and Paul [69] appears to improve considerably the estimation of the occupied
volume. This method is still based on a group contribution method, but now a different

Chapter 6 - Effect of the cooling rate on the gas transport properties of polycarbonate 190
occupied volume is calculated for each penetrant gas. The researchers think that each
type of gas molecule may not probe the same occupied volume and therefore a gas-
dependent factor may be needed in the calculation of Vo. Using different occupied
volumes for each gas means that the free volume a gas can probe will be different for
each gas. This fact seems physically acceptable since the same amount of free volume
may not be accessible to all the gases [77]. Indeed, a small kinetic diameter molecule
should be able to access more cavities in the polymer. However, we believe that the free
volume quantity should be characteristic of a polymer only. In the method of Park and
Paul the occupied volume is defined as follows:
( ) ( ) i
n
1iWijjo V� V ∑
=
= Eq (6.8)
where i refers to the chemical group and j to the gas of interest. γij have been determined
by Park and Paul from a database of experimental data and tabulated [69]. The FFV can
be calculated for each gas j of interest. We have:
( )
−=
V
VV FFV jo Eq (6.9)
The two methods outlined above will be applied in this research to determine the
fractional free volumes present in the various glassy polycarbonate samples.
The polycarbonate repeat unit was divided into specific chemical groups as shown
in Figure 6.24. Four chemical groups were distinguished, one of them being repeated
twice. The empirical factors needed to estimate the occupied volume Vo are reported in
Table 6.6. It appears from Table 6.6 that the values of γij do not differ that much from 1.3
(the universal value of Bondi) for polycarbonate. However they do change greatly for
other chemical groups [69]. The occupied volumes Vo (in cm3/molRU where the subscript
RU stands for repeat unit) were calculated from Eq (6.6) and Eq (6.8). From the
knowledge of the molecular weight and the number of repeat units it was possible to
obtain Vo in (cm3/g). We have:

Chapter 6 - Effect of the cooling rate on the gas transport properties of polycarbonate 191
×=
g/mol in PCofweight molecular
unitsrepeat ofnumber )/mol(cmV/g)(cmV RU
3o
3o Eq (6.10)
The molecular weight of the polycarbonate used in this research was evaluated to be
34,000 g/mol. Since the molecular weight of a polycarbonate repeat unit (C16H14O3) is
254 g/mol, the number of repeat units is about 134 repeat units. Eq (6.10) is actually
equivalent to:
×=
g/mol inunit repeat ofweight molecular
1)/mol(cmV/g)(cmV RU
3o
3o Eq (6.11)
The above equation is better in the sense that it does not require knowledge of the
molecular weight.
The occupied volume results are given in Table 6.7. The value of Vo predicted
from Bondi’s method was equal to 0.697 cm3/g. Assuming a density of 1.2 g/cm3 for
polycarbonate, Eq (6.5) leads to a fractional free volume FFV of 16.4%. This value is in
excellent agreement with the one calculated by Koros and co-workers [21, 95] for
polycarbonate (ρ = 1.2 g/cm3, FFV = 0.164). Shelby and co-workers [96] calculated FFV
to be about 16.84% for polycarbonate (ρ = 1.1982 g/cm3, T = 23oC). Unfortunately, the
intermediate group contribution calculations in these two papers were not reported; only
the final result was given. One would expect that the theoretical calculations based on the
same theory should predict the same answers. According to our calculations, the value of
FFV in the paper of Shelby and co-workers [96] for instance should be equal to 16.49%.
A recent paper by Bos et al [4] does report intermediate calculations. For example, Vo (in
cm3/mol) was listed as 177.1, exactly the same as the value determined in the present
study (see Table 6.7). A density of 1.209 g/cm3 corresponded to a FFV of 15.8%, in
agreement with our calculations. The molecular weight of the repeat unit was taken as
254.3 g/mol. Pope et al [21] did report the values of the Van der Waals volume and the
occupied volume for polycarbonate as well. Their results are consistent with ours. A
study by Colucci, McKenna, and co-workers [55] reported an experimental value of the
occupied volume of polycarbonate Vo at 0K. Vo was obtained from extrapolating the
rubbery PVT surface to the absolute zero. Vo was determined to be 0.6506 ± 0.02 cm3/g,
therefore about 7% lower than the one calculated from the Bondi’s method.

Chapter 6 - Effect of the cooling rate on the gas transport properties of polycarbonate 192
But the value of 16.4% for FFV calculated in this research for ρ = 1.2 g/cm3 is not
in agreement with the one determined by Jean et al [97] using positron annihilation
lifetime spectroscopy (PALS). The researchers mentioned as well that their FFV value
(6.23%) was 2.1 smaller than the one calculated by Hellums et al [95] from group
contribution methods. The fractional free volume was determined from PALS
measurements, given a model treating the holes of the free volume as perfect spheres.
The validity of the assumption of spherical holes for bisphenol-A polycarbonate has been
shown elsewhere [98]. Jean et al [97] attributed the rather large difference in FFV
compared to the work of Hellums et al [95] to the various definitions and assumptions
behind the free volume concept. In another paper by Jean et al [99], FFV was estimated
from PALS measurements to be around 4.2% for polycarbonate, i.e. more than 30%
lower than their other published data for polycarbonate. It seems therefore that FFV
determined from PALS is not that reproducible. However what is important to note for
our purposes is that there is not a complete equivalence between the FFV calculated from
the Bondi’s group contribution method and the measurements from PALS. Since the
PALS measure can probe a smaller scale than gas molecules (see above), it would be
reasonable to expect that FFV would be greater for PALS. However, this is not the case.
The fractional free volume FFV was determined from the two methods detailed
previously using Eq (6.7) and Eq (6.9), and by using the experimental densities recorded
at 18oC. The results are shown in Figure 6.25 as a function of the cooling rate. The results
for each particular method are plotted in Figure 6.26 through Figure 6.29. The fractional
free volume increases lightly with the cooling rate, which makes sense, as explained
previously. FFV calculated from Bondi’s method is greater than the one calculated from
the method of Park & Paul. Nevertheless, the method of Park & Paul seems rather
suspicious. Indeed, FFV is greater for the gas possessing the greater kinetic diameter.
One would think that the free volume accessible to a small size gas molecule should be
greater than the one accessible to a big gas molecule [77, 100]. In addition, one has to
keep in mind that the evaluation method of Park and Paul was based on a database
containing 102 different polymers. The researchers modified the parameters given by
Bondi in order to observe better linear regressions between the gas transport parameters
and FFV, hence calculating a gas-dependent FFV. We believe however that FFV should

Chapter 6 - Effect of the cooling rate on the gas transport properties of polycarbonate 193
be a fixed quantity characteristic of a given polymer. As a consequence, only the Bondi’s
method will be kept for further calculations requiring the value of FFV.
Equations have also been provided by research groups to predict the density from
group contribution methods. Van Krevelen [94] suggested that:
( ) i
n
1iW V �V ∑
=
= Eq (6.12)
with β = 1.55 at 25oC for glassy polymers. Park and Paul [69] proposed that the β
parameter (a packing factor) depends on the chemical group.
( ) i
n
1iWi V � V ∑
=
= Eq (6.13)
The β parameter appeared to differ greatly from 1.55 for several chemical groups. Its
value is listed in Table 6.6 for the groups of interest in this research work. The calculated
and experimental densities were reported to agree really well for the 102 different
polymers contained in the database of Park & Paul [69].
The density of polycarbonate was predicted using Eq (6.12) and Eq (6.13), and
results are provided in Table 6.7. The density came out as 1.203 g/cm3 and 1.221 g/cm3
for the first and second methods, respectively. Therefore, Eq (6.12) seems to predict the
density more accurately than Eq (6.13) (the density of polycarbonate is about 1.2 g/cm3).
Although the density prediction method of Park & Paul [69] seems rather accurate for
polymer families, the error in the case of polycarbonate is nevertheless equal to 2.1×10⁻²
g/cm3, assuming a real density of 1.2 g/cm3. However both equations have serious
limitations, especially when a particular polymer is selected. Indeed, the prediction
methods are based on the chemical structure of the polymer only. The methods do not
take into account the position of the chemical structures in the polymer. Please note that
the group contribution methods apply only to polymers for which additivity rules are
verified. This means that each group contributes to the same extent to the final property.
This is not verified in the case of hydrogen bonding for instance. Moreover, the
prediction methods cannot predict changes in density for a same polymer. However, a
polymer does change its density with time for instance (this observation will be reported
in Chapter 7 dealing with physical aging). As we saw at the beginning of this chapter, the

Chapter 6 - Effect of the cooling rate on the gas transport properties of polycarbonate 194
density is even affected by the cooling rate. The density should be affected by the
molecular weight as well, as long as the molecular weight remains at low values.
Furthermore, no dependence of the temperature or the pressure on the density is taken
into account by the models.
C
CH3CH3
O O
C
O
Figure 6.24: Chemical structure of polycarbonate divided into chemical groups.
number in polycarbonate Group VW (cm3/molRU) β γ(He) γ(O2) γ(N2)
1 30.7 1.54 1.25 1.30 1.32
2 43.3 1.58 1.36 1.28 1.28
1 18.9 1.27 1.29 1.52 1.40
C
CH3CH3
O O
C
O
Table 6.6: Empirical factors as given by Park and Paul [69]. The Van der Waals volumes Vw were reported from Van Krevelen [94].

Chapter 6 - Effect of the cooling rate on the gas transport properties of polycarbonate 195
Bondi Park & Paulsum(VW) (cm3/molRU) 136.20
Vo (cm3/molRU) 177.06
Vo(He) (cm3/molRU) 180.53
Vo(O2) (cm3/molRU) 179.49
Vo(N2) (cm3/molRU) 177.83
Vo (cm3/g) 0.697
Vo(He) (cm3/g) 0.711
Vo(O2) (cm3/g) 0.707
Vo(N2) (cm3/g) 0.700
Vpredicted (cm3/molRU) 211.11 208.11
ρpredicted (g/cm3) 1.203 1.221
METHOD
Table 6.7: Group contribution calculations obtained from the two methods selected in this study.
0.5 10 40 fan
15.0
15.5
16.0
16.5
Bondi Park & Paul He O
2 N
2
FF
V (
%)
cooling rate ( oC/min)
Figure 6.25: FFV at 18oC as a function of the cooling rate (note that the x-axis is not a continuous axis). The FFV was calculated from both the Bondi and the Park & Paul methods.

Chapter 6 - Effect of the cooling rate on the gas transport properties of polycarbonate 196
0.5 10 40 fan16,55
16,60
16,65
Bondi
FF
V (
%)
cooling rate ( oC/min)
Figure 6.26: FFV at 18oC as a function of the cooling rate (note that the x-axis is not a continuous axis). The FFV was calculated from Bondi’s method.
0.5 10 40 fan16,15
16,20
16,25
16,30
Park & Paul N2
FF
V (
%)
cooling rate ( oC/min)
Figure 6.27: FFV at 18oC as a function of the cooling rate (note that the x-axis is not a continuous axis). The FFV was calculated from the Park & Paul method for N2.

Chapter 6 - Effect of the cooling rate on the gas transport properties of polycarbonate 197
0.5 10 40 fan15,40
15,45
15,50
Park & Paul O2
FF
V (
%)
cooling rate ( oC/min)
Figure 6.28: FFV at 18oC as a function of the cooling rate (note that the x-axis is not a continuous axis). The FFV was calculated from the Park & Paul method for O2.
0.5 10 40 fan14,90
14,95
15,00
Park & Paul He
FF
V (
%)
cooling rate ( oC/min)
Figure 6.29: FFV at 18oC as a function of the cooling rate (note that the x-axis is not a continuous axis). The FFV was calculated from the Park & Paul method for He.

Chapter 6 - Effect of the cooling rate on the gas transport properties of polycarbonate 198
6.3.4.3. Analysis of the permeation data in terms of the predicted FFV
The diffusion coefficient D was plotted as a function of the fractional free volume
FFV. The resulting plot is shown in Figure 6.30. D and FFV appear not to be directly
correlated. The fact that the diffusion of a small gas molecule is lower in the material
possessing the higher amount of free volume is in contradiction with the free volume
theory for diffusion originally proposed by Cohen and Turnbull [30]. This theory
assumes that the diffusion is determined by the amount of microvoids since the penetrant
mobility occurs by diffusion jumps inside those microvoids. One has to keep in mind that
free volume theories are usually developed for temperatures close to or above the glass
transition temperature. The free volume theories may not be applicable in the glassy state.
The free volume theory in the glassy state may become valid only for bigger size
penetrant molecules where more polymeric units are involved in the diffusion process,
the diffusion being more cooperative.
The free volume has been nevertheless shown to affect greatly the diffusion
coefficients of glassy polymers [69, 101-104]. A paper by Thran et al [105] investigated
the relationship between the diffusion coefficient of gases and the fractional free volume
determined from Bondi’s method. The study was based only on experimental results
available in the literature, and this for various amorphous glassy polymers. The diffusion
coefficient was reported to increase with an increase in fractional free volume. However
the data appear to be quite scattered to really draw solid accurate conclusions. The
difference in the preparation of the samples from one study to another complicates
obviously the results. Furthermore, the estimation of the fractional free volume from the
group contribution method of Van Krevelen [94] may not have always been calculated
the same way. Dividing the polymer into chemical groups is indeed rather subjective.
In a study by Jean et al [97], the fractional free volume was determined from
PALS measurements. The study involved four polycarbonate-based materials, namely
bisphenol-A polycarbonate (PC), tetramethyl bisphenol-A polycarbonate (TMPC),
hexafluorobisphenol-A polycarbonate (6FPC), and tetramethylhexafluorobisphenol-A
polycarbonate (TM6FPC). Again, it was found that the diffusion coefficient increased
with the fractional free volume. Nevertheless, D and not ln D was plotted as a function of

Chapter 6 - Effect of the cooling rate on the gas transport properties of polycarbonate 199
the fractional free volume (FFV). It is therefore impossible to say if whether or not a
linear relationship was observed between ln D and (1/FFV), as predicted from the free
volume theory applied to the diffusion of gases in polymers [33]. In addition, the results
should be looked at with scrutiny. Indeed, the authors of the study did not measure gas
transport themselves. They just used values found in the literature for the same polymers.
One knows that the preparation of the samples is extremely important and therefore it is
not clear if whether or not the samples used in PALS experiments were prepared in
exactly the same way as those reported in the literature for gas transport measurements.
Furthermore, the temperature at which the gas and density measurements were performed
is not reported in the paper. Gas transport properties are commonly reported at 35oC,
whereas density data are obtained around 20oC. No mention of a correction factor is
given. The temperature at which the PALS experiments were performed is not even
given. It was found by Jean et al [97] that the fractional free volume determined from
PALS was directly proportional to the fractional free volume estimated from group
contribution methods, the former being smaller by a factor of 2.1, as already mentioned
previously. The results based on additive group contributions were taken from the work
of Koros et al [95, 106-107]. Since Jean et al [97] found a linear relationship between the
fractional free volume determined by PALS and the one calculated by Koros et al for the
four same various polymers, it means that the proportionality factor is independent of the
nature of the polymer. The proportionality factor could maybe be due to the differences
in scales or timeframes while probing the free volume. If PALS does indeed probe the
polymer free volume, and assuming that the assumptions and calculations behind the
PALS technique are correct, the group contribution method seems a reasonable method to
evaluate the amount of free volume, or rather to determine the changes in free volume
from one polymer sample to another. Moreover, Jean et al [97] noticed that the densities
of the four polymers did not correlate with the fractional free volume. As mentioned
above, the difference may be due to the preparation of the samples, or to the fact that the
densities (taken from the literature) were not determined at the same temperature.
However we can observe also that the specific volumes of PC and TMPC were probably
inverted. Indeed, the specific volume of polycarbonate PC was reported as 0.923 cm3/g,
which corresponds to a density of 1.08 g/cm3 for PC! The diffusion coefficient was found

Chapter 6 - Effect of the cooling rate on the gas transport properties of polycarbonate 200
to increase with the fractional free volume, with the mean free volume hole radius, and
with the broadening of the free volume distribution. This result is in contradiction with
the present research project. The free volume theory may grossly apply to different
polymer structures, but may not discern the subtle differences of a given polymer at
different thermal histories.
A contradiction between the free volume content and the gas transport properties
has also been reported by Kim et al [108]. Miscible blends and random copolymers of
bisphenol-A and tetramethyl bisphenol-A polycarbonates of the same chemical
composition were compared. Although the copolymers were characterized by a greater
free volume content they showed reduced gas transport properties. The results were
explained in terms of the local chain motions. It was suggested that the slight difference
in the free volume contents between both types of polymers could be of secondary
importance compared to the local chain dynamics.
16.66 16.68 16.70 16.722.0x10-8
4.0x10⁻⁸
6.0x10⁻⁸
8.0x10⁻⁸
1.0x10⁻⁷
O2
D (
cm2 /s
)
FFV (%)
35oC
N2
Figure 6.30: Diffusion coefficient D (cm2/s) as a function of the fractional free volume FFV (%). Diffusion results were obtained at 35oC. The density values were corrected to obtain FFV at 35oC as well.
The simplified free volume theory applied to gas transport (similar to the Doolittle
equation for the treatment of the viscosity of polymers above Tg mentioned in Chapter 5)

Chapter 6 - Effect of the cooling rate on the gas transport properties of polycarbonate 201
expresses the diffusion coefficient D as a function of the fractional free volume FFV as
follows [33]:
−=
FFV
Bexp AD Eq (6.14)
where A and B are constant for a particular gas. A is a function of the size and shape of
the gas molecule; B relates to the critical polymer cavity size needed to do a diffusive
jump. If the free volume theory is verified, a plot of ln D versus (1/FFV) should be linear,
with a slope of (-B) and an intercept of ln A.
In the literature it is not quite clear if whether or not diffusion coefficients and
densities are taken at the same temperature. However we believe that the diffusion
coefficient and the density have to be taken at the same temperature. Since our diffusion
values have been obtained at 35oC, and our density data at 18oC, we need to evaluate the
density at 35oC. From the conservation of mass, we have:
=
C35
C18C18C35
o
oo
o
V
V!! Eq (6.15)
where ρi is the density and Vi the volume of the material.
But C18)-(35C18C35 ooo dVVV += Eq (6.16)
The volumetric coefficient of expansion α (in K-1) is given by the following expression:
PT
V
V
1.
∂∂= Eq (6.17)
Therefore ( )GC18C18GC18C35. 171VV 18)(35 .VV oooo +=−+= Eq (6.18)
where αG stands for the thermal expansion coefficient in the glassy state.
Finally
+
=G
C18C35
. 171
!!
o
o Eq (6.19)
From the literature, it was found that αG = 70×10-6 K-1 for polycarbonate for temperatures
ranging between 28 and 80oC [109]. The experimental density values were determined at
18oC using a density gradient column. Obviously, the density decreases with an increase
in temperature. As the temperature increases, the polymeric system is dilated, the amount
of free volume increases, and thus the density decreases. Please note that αf determined
in Chapter 5 (with αf = 8.5×10⁻⁴ K-1 for a cooling rate of 40oC/min) does not correspond

Chapter 6 - Effect of the cooling rate on the gas transport properties of polycarbonate 202
to αG. Indeed, αf ≈ (αR - αG) represents the difference between the thermal expansion
coefficients in the rubbery and the glassy states, respectively, assuming that αG remains
constant.
Plots of ln D versus (1/FFV) for O2 and N2 are shown in Figure 6.31. The
fractional free volume FFV was calculated at 35oC using Bondi’s method only since the
method of Park & Paul does not seem to always make physical sense (see above). As
seen in Figure 6.31, the data points do not fall on a straight line. Therefore, the free
volume theory does not apply to our system. Whenever the free volume theory applied to
gas transport is verified in the literature, various gases in various glassy polymers are
considered. The theory may be applicable to polymer families (or to polymers with
various chemical structures) but not to a particular polymer at various processing
conditions. Moreover, FFV calculated from group contribution methods is based on the
bulk density, which is a macroscopic quantity. The calculations do not take into account
the distribution and topology of the free volume. Nevertheless one can always wonder
whether or not the method selected to calculate FFV is correct. Furthermore, the total
amount of free volume may not be accessible to gas transport. Researchers use the
concept of interstitial free volume to refer to this inaccessible free volume [29]. In a study
involving average stress relaxation times and free volume, it was also determined that the
Doolittle equation was not applicable to glassy polycarbonate [110]. The Doolittle
equation was found to become valid for polycarbonate only above 135oC, thus in the
transition region where properties are governed by the free volume content.
Similarly, the free volume theory was applied to the solubility and the
permeability coefficients. While considering the permeation data of various gases in
various typical polymers, Park & Paul [69] determined for instance the values of the
constants A and B applied to permeation. Lee [111] observed that ln P was proportional
to (Vf)-1 for various polymers. Polymers with fluorinated groups should not be however
considered in the analysis since their permeability has been shown not to correlate with
the density [95]. Plots were generated based on the experimental results obtained in this
research and again the logarithms of the coefficients did not appear to be linear with the
inverse of the fractional free volume. As mentioned previously, FFV for polycarbonate
determined from group contribution methods has been found to correspond (by a

Chapter 6 - Effect of the cooling rate on the gas transport properties of polycarbonate 203
proportionality factor) to the free volume determined from PALS measurements [97].
Since there is no linear relationship between ln P and (FFV)-1, it means that ln P would
not correlated with measurements from PALS either for a particular polymer.
5.98 5.99 6.00-16.6
-16.5
-16.4
-16.3
-16.2
-16.1
35oC
O2
ln D
(cm
2 /s)
(1 / FFV)5.98 5.99 6.00
-17.5
-17.4
-17.3
-17.2
-17.1
N2
35oCln D
(cm
2 /s)
(1 / FFV)
Figure 6.31: Plots of ln D versus (1/FFV) for O2 (left) and N2 (right). Data were taken at 35oC.
Although the free volume theory applied to gas transport is given by Eq (6.14),
one can always remark that the Doolittle equation [112, 113] is given as follows:
−= 1
FFV
1 Bexp A� Eq (6.20)
where η is the viscosity , and A and B are constant (but different from the constants given
in Eq (6.14)). FFV is still defined as (Vf /V) where V is the total volume of the system
and Vf the free volume available to the system.
Therefore the following modified equation could also be investigated to relate the
diffusion coefficient D to FFV:
−= 1
FFV
1 Bexp AD Eq (6.21)
But again, a linear relationship should be observed between ln D and (1/FFV)-1, which is
not the case.

Chapter 6 - Effect of the cooling rate on the gas transport properties of polycarbonate 204
6.3.4.4. Determination of the gas transport activation energies (EP, ED, ∆Hs) and the preexponential factors (Po, Do, So)
The gas transport activation energies and the corresponding preexponential
factors were determined for the polymers cooled at different cooling rates by running
successive permeation experiments at 35, 55, 65, and 80oC. Obviously, the higher the
temperature, the higher the permeability, but the lower the selectivity between two gases.
6.3.4.4.1. The gas transport activation energies (EP, ED, ∆Hs)
The activation energies of permeation EP, diffusion ED, and the enthalpy of
sorption ∆Hs results are shown from Figure 6.32 to Figure 6.34. These results were
obtained without entering the value of the thickness in the calculations. The calculation
details have been provided in Chapter 4. Since the estimation of the thickness is not
needed to determine the various activation energies, errors are extremely small and based
mainly on the linear regressions performed on four data points. The coefficient of
correlation R reported for the linear regressions was generally found to be greater than
0.999. In the worst case, R was found to be about 0.95.
As expected, the greater the kinetic diameter of the gas molecule, the greater the
activation energies. Larger cavities are indeed necessary for the diffusion of larger gas
molecules and hence the activation energies will be larger to create channels for the
diffusion of bigger molecules. It was impossible to calculate ED and ∆Hs for helium due
to the small time lag value. Even though the difference between the kinetic diameters of
O2 and N2 is rather small (about 0.18Å), the two diatomic gas molecules differ by other
factors. For instance, the nitrogen gas molecule is longer and needs to rotate much more
around itself to go through a molecular channel [114]. This should result in a lower
diffusion coefficient for N2. The polarizabilities of the gases (which indicate how easily
the molecule electrons can be displaced by an electric field) differ also between the gases
of interest in this research work. The polarizability of He is given as 0.20×10⁻²⁴cm3, that
of O2 as 1.58×10⁻²⁴cm3, and that of N2 as 1.74×10⁻²⁴cm3 [115].
Higher free volume inside the polymeric material should dictate lower activation
energies. This trend has actually been verified by Yampolskii et al [70] using a data base

Chapter 6 - Effect of the cooling rate on the gas transport properties of polycarbonate 205
involving various amorphous glassy polymers. The changes in the polymer structures
were responsible for the changes in free volume. However the change of free volume for
a given polymer as a function of thermal history for instance was not reported. Quite
surprisingly, the activation energies and cooling rate show an opposite correlation in the
present study involving polycarbonate. Indeed, as seen from Figure 6.32 to Figure 6.34,
the activation energies are greater for the samples cooled by the fan (high free volume)
than for the sample cooled extremely slowly (low free volume). The greater the cooling
rate, the greater is the activation energy for nitrogen. The oxygen molecule is too small to
be sensitive to the cooling rates. The activation energy changes in percent as a function of
the cooling rate for a specific gas are shown from Figure 6.35 to Figure 6.37. The great
influence of N2 on the activation energies appears clearly in Figure 6.37.
It is possible that the activation energies may be more related to the level of
conformational energy than to the overall free volume content. If a polymer has more
time to cool down to room temperature from above Tg, the chains pack more closely and
have more time to relax. The polymer chains may attain the most stable chain
conformation, and a lower energy conformation, or a lower Gibbs free energy for the
system. If the temperature increases for instance, it takes less energy to respond, expand
or dilate the polymer chains surrounding the gas molecule, and therefore enable the gas
molecule to jump into another cavity. The activation energy of diffusion corresponds
indeed to the energy necessary to open a diffusion path.
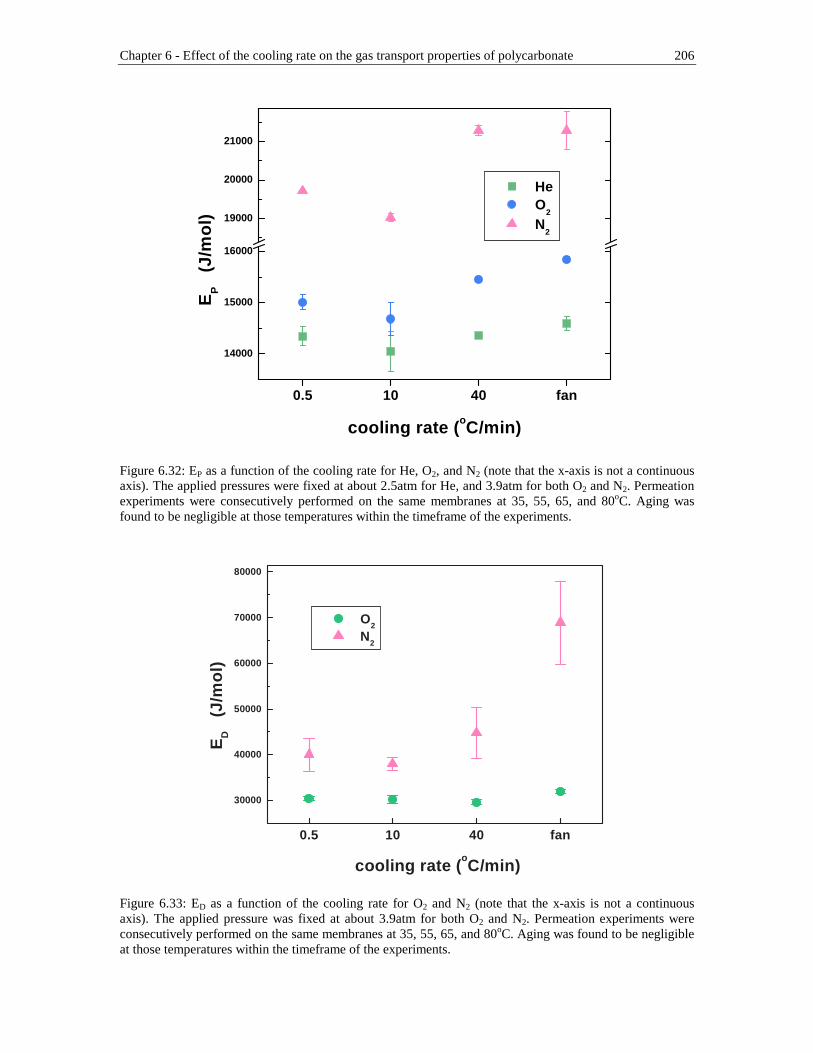
Chapter 6 - Effect of the cooling rate on the gas transport properties of polycarbonate 206
0.5 10 40 fan
14000
15000
16000
19000
20000
21000
He O
2
N2
EP
(J/m
ol)
cooling rate ( oC/min)
Figure 6.32: EP as a function of the cooling rate for He, O2, and N2 (note that the x-axis is not a continuous axis). The applied pressures were fixed at about 2.5atm for He, and 3.9atm for both O2 and N2. Permeation experiments were consecutively performed on the same membranes at 35, 55, 65, and 80oC. Aging was found to be negligible at those temperatures within the timeframe of the experiments.
0.5 10 40 fan
30000
40000
50000
60000
70000
80000
O2
N2
ED
(J/m
ol)
cooling rate (oC/min)
Figure 6.33: ED as a function of the cooling rate for O2 and N2 (note that the x-axis is not a continuous axis). The applied pressure was fixed at about 3.9atm for both O2 and N2. Permeation experiments were consecutively performed on the same membranes at 35, 55, 65, and 80oC. Aging was found to be negligible at those temperatures within the timeframe of the experiments.

Chapter 6 - Effect of the cooling rate on the gas transport properties of polycarbonate 207
0.5 10 40 fan-60000
-50000
-40000
-30000
-20000
-10000
0
O2
N2
∆H
s (
J/m
ol)
cooling rate (oC/min)
Figure 6.34: ∆Hs as a function of the cooling rate for O2 and N2 (note that the x-axis is not a continuous axis). The applied pressure was fixed at about 3.9atm for both O2 and N2. Permeation experiments were consecutively performed on the same membranes at 35, 55, 65, and 80oC. Aging was found to be negligible at those temperatures within the timeframe of the experiments.
0.5 10 40 fan-6
-4
-2
0
2
4 He
EP
% c
hang
e
cooling rate ( oC/min)
Figure 6.35: % change in EP for He (note that the x-axis is not a continuous axis). The data obtained for a cooling rate of 0.5oC/min were taken for reference.

Chapter 6 - Effect of the cooling rate on the gas transport properties of polycarbonate 208
0.5 10 40 fan-15
-10
-5
0
5
10
O2
EP
ED
∆HS
% c
hang
e
cooling rate ( oC/min)
Figure 6.36: % change in EP, ED, and ∆Hs for O2 (note that the x-axis is not a continuous axis). The data obtained for a cooling rate of 0.5oC/min were taken for reference.
0.5 10 40 fan
0
50
100
150
200
N2
EP
ED
∆HS
% c
hang
e
cooling rate ( oC/min)
Figure 6.37: % change in EP, ED, and ∆Hs for N2 (note that the x-axis is not a continuous axis). The data obtained for a cooling rate of 0.5oC/min were taken for reference.

Chapter 6 - Effect of the cooling rate on the gas transport properties of polycarbonate 209
6.3.4.4.2. The preexponential factors (Po, Do, So)
The preexponential factors Po, Do, and So were determined as explained in
Chapter 4. As stated at that time, the constants were not determined from both the values
of (P, D, S) at a given temperature and from the values of the activation energies, but
rather from appropriate intercepts. The reader should refer to Chapter 4 for further
understanding. Unlike the procedure used for obtaining the values of the activation
energies, knowledge of the thickness and the feed pressure was necessary.
The results are shown from Figure 6.38 to Figure 6.41. As seen in Figure 6.39, the
error on Do was extremely big for N2. This was caused by the linear regression performed
on the sample cooled with the fan. An absolute correlation factor of only 0.98 was
obtained. Therefore Figure 6.40 shows the dependence of Do on the cooling rate for O2
only. Trends cannot be easily distinguished as a function of the cooling rate for the
preexponential factors.
0
1000
2000
3000
4000
0.5 10 40 fan
He O
2
N2
Po
(bar
rers
)
cooling rate ( oC/min)
Figure 6.38: Preexponential factor Po as a function of the cooling rate (note that the x-axis is not a continuous axis).

Chapter 6 - Effect of the cooling rate on the gas transport properties of polycarbonate 210
-300000
-200000
-100000
0
100000
200000
300000
0.5 10 40 fan
O2
N2
Do
(cm
2 /s)
cooling rate ( oC/min)
Figure 6.39: Preexponential factor Do as a function of the cooling rate (note that the x-axis is not a continuous axis).
0.000
0.005
0.010
0.015
0.020
0.025
0.5 10 40 fan
O2
Do
(cm
2 /s)
cooling rate ( oC/min)
Figure 6.40: Preexponential factor Do as a function of the cooling rate (note that the x-axis is not a continuous axis).

Chapter 6 - Effect of the cooling rate on the gas transport properties of polycarbonate 211
0.0
2.0x10⁻⁶
4.0x10⁻⁶
6.0x10⁻⁶
8.0x10⁻⁶
1.0x10⁻⁵
1.2x10⁻⁵
0.5 10 40 fan
O2
N2
So
(cm
3 @S
TP
/cm
3 poly
mer
.cm
Hg)
cooling rate ( oC/min)
Figure 6.41: Preexponential factor So as a function of the cooling rate (note that the x-axis is not a continuous axis).
6.3.4.4.3. Summary of the permeation results
Activation energies and preexponential factors found in this research work are
recapitulated in Table 6.8 through Table 6.10. Table 6.11 reports the values obtained by
Costello and Koros for amorphous glassy bisphenol-A polycarbonate [75]. The literature
values have been modified in order to have the same units as the ones used in this
research. The orders of magnitude of the activation energies obtained by the researchers
are in good agreement with this work. Obviously, the preexponential factors are more
difficult to compare. The S and P results of Costello and Koros were obtained from
sorption and permeation experiments, respectively, and the D results were calculated
from the P=DS equation. It would have been interesting to estimate S as well from
permeation experiments (as what has been done in this research work), to evaluate the
activation energy, and to compare with the direct sorption data. The polycarbonate
selected by Costello and Koros was purchased from General Electric. The Lexan sheets
were used as-received. Such commercial extruded sheets may be highly oriented.
Moreover, moisture may have complicated the results. In a later publication [116],

Chapter 6 - Effect of the cooling rate on the gas transport properties of polycarbonate 212
Costello and Koros did mention however that birefringence measurements on the as-
received films showed no evidence of orientation.
cooling rate penetrant EP (kJ/mol) error (+/-) Po (barrer) error (+/-)
0.5oC/min He 14.3 0.2 3.8E+03 2.6E+02O2 15.0 0.1 6.6E+02 3.6E+01N2 19.7 0.0 8.6E+02 6.2E+00
10oC/min He 14.1 0.4 3.5E+03 5.3E+02O2 14.7 0.3 6.1E+02 7.6E+01N2 19.0 0.1 6.9E+02 2.6E+01
40oC/min He 14.4 0.0 3.9E+03 6.4E+01O2 15.5 0.0 8.0E+02 1.2E+01N2 21.3 0.1 1.6E+03 7.6E+01
fan He 14.6 0.1 4.2E+03 2.0E+02O2 15.8 0.1 9.3E+02 2.2E+01N2 21.3 0.5 1.6E+03 3.2E+02
Table 6.8: EP and Po values obtained in this work.
cooling rate penetrant ED (kJ/mol) error (+/-) Do (cm2/s) error (+/-)0.5oC/min O2 30.4 0.5 1.1E-02 2.1E-03
N2 40.0 3.610oC/min O2 30.2 0.8 1.1E-02 3.7E-03
N2 38.0 1.440oC/min O2 29.6 0.6 8.3E-03 1.9E-03
N2 44.7 5.6
fan O2 31.9 0.5 1.8E-02 3.3E-03N2 68.9 9.1
Table 6.9: ED and Do values obtained in this work.
cooling rate penetrant ∆Hs (kJ/mol) error (+/-) So (cm3@STP/cm3.cmHg) error (+/-)0.5oC/min O2 -15,4 0,5 6,0E-06 1,2E-06
N2 -20,3 3,6 4,3E-07 1,2E-0610oC/min O2 -15,5 0,8 5,7E-06 2,0E-06
N2 -19,0 1,3 7,6E-07 4,5E-0740oC/min O2 -14,1 0,5 9,6E-06 2,0E-06
N2 -23,5 5,7 1,4E-07 9,9E-07
fan O2 -16,1 0,5 5,2E-06 1,1E-06
N2 -47,7 9,0 1,5E-11 3,8E-10
Table 6.10: ∆Hs and So values obtained in this work.

Chapter 6 - Effect of the cooling rate on the gas transport properties of polycarbonate 213
penetrant EP (kJ/mol) Po (barrer) ED (kJ/mol) Do (cm2/s) ∆Hs (kJ/mol) So (cm3@STP/cm3.cmHg)He 17.6 +/- 0.4 1,1E+04 28.4 +/- 3.3 0,14 -10.5 +/- 2.9 7,8E-06O2 19.6 +/- 0.8 3,4E+03 30.5 +/- 1.7 0,0096 -10.9 +/- 0.8 3,6E-05
N2 25.1 +/- 0.8 5,3E+03 40.5 +/- 2.1 0,13 -15.5 +/- 1.3 4,2E-06
Table 6.11: From [75].
6.3.4.5. Verification of the relationship between ED and Do
The Zener’s theory [117] was also considered in the evaluation of our data. This
theory, originally developed for metals, stipulates that there is a linear relationship
between the logarithm of the preexponential factor for diffusion Do and the activation
energy of diffusion ED. The Zener’s theory was derived assuming that the free enthalpy
of diffusion was mainly controlled by the additional elastic distortion arising from a
movement of the particle from its equilibrium position into the saddle point
configuration, which corresponds to a strained polymeric matrix. We have:
ba E Dln Do += Eq (6.22)
If such a relationship is verified for our experimental data, this would further confirm that
our values of Do and ED are correct.
To our knowledge, this theory has been verified in the literature for the diffusion of
various gases in a given polymer only [118, 119]. In the present research, data for only
one gas (O2) are available, but the polymer is prepared in four different ways, the
parameter being the cooling rate. lnDo was plotted as a function of ED for O2 only since
the error in Do for N2 was too big, as mentioned previously. The data points of Figure
6.42 fall onto a straight line, thus verifying Eq (6.22). The slope was found to be equal to
3.28×10⁻⁴ mol/J. Van Krevelen [94] reported the value of the slope determined using
diffusion data of several gas molecules in several glassy polymers. The slope came out as
1.2×10⁻⁴ mol/kJ. Nevertheless, the slope was obtained from a plot having a y-axis of log
Do (m2/s). Therefore the slope has to be multiplied by (ln 10) to compare it with ours.
This gives a slope of 2.76×10⁻⁴ mol/kJ, or 2.76×10⁻⁷ mol/J. The slope value given by Van
Krevelen was found to be independent of the type of the polymer [94]. However this
value is not verified here, when different thermal histories are considered instead of
different gases.

Chapter 6 - Effect of the cooling rate on the gas transport properties of polycarbonate 214
Quite interestingly, it was also observed that lnPo linearly correlated with EP for
the three gases selected in this research. The slopes were determined to be 3.56×10⁻⁴
mol/J, 3.83×10⁻⁴ mol/J, and 3.61×10⁻⁴ mol/J, for He, O2, and N2, respectively. Similarly, a
linear relationship was found between lnSo and dHs for O2 and N2. The resulting slopes
were found to be 3.27×10⁻⁴ mol/J and 3.77×10⁻⁴ mol/J for O2 and N2, respectively. The
fact that a Zener-type relationship applies to the permeability and the solubility results
may indicate that the error bars on the experimental data points are too big to draw
confident conclusions.
29000 30000 31000 32000-5.5
-5.0
-4.5
-4.0
-3.5
O2
intercept = -14.48049 +/- 0.74876slope = 3.2822E-4 +/- 2.45092E-5 (mol/J)
ln D
o (
cm2 /s
)
ED (J/mol)
Figure 6.42: ln Do versus ED for O2. The data points have been obtained at different cooling rates.
Assuming that the free volume theory is valid, combining Eq (6.16) and Eq (6.14)
leads to:
−+=
FFV
B A ln
RT
E Dln D
o Eq (6.23)
Since we saw above that there is a linear relationship between ln Do and ED, the intercept
(lnA–(B/FFV)) has to be constant. This is however impossible since density and thus
(FFV) depends on thermal history. Moreover, how can we choose a temperature for the
slope since Do and ED are fixed in a given temperature range? The free volume theory

Chapter 6 - Effect of the cooling rate on the gas transport properties of polycarbonate 215
does not seem to be consistent with the experimental data for Do and ED. Eq (6.23) could
apply to the diffusion of various gases in a given polymer at a particular temperature.
However FFV could be dependent on the nature of the gas [77]. Therefore this point still
does not validate the free volume theory.
6.3.4.6. Determination of the average distances between polymer chains
In order to validate the values of the activation energy of diffusion ED (as a
reminder, ED was found to be greater for a high free volume material, in contradiction
with expectations written in the literature), the average distance between chains was
calculated for each cooling rate. The Brandt’s Model [120] was used to relate the
activation energy of diffusion ED to the average interchain separation.
ED is well-known to be directly proportional to the kinetic diameter squared d2 of
the penetrant [94, 119, 121, 122]. Meares [121] suggested that ED was proportional to the
cohesive energy density (CED) of the polymer.
( )CED � N d � 4
1E o
2D
= Eq (6.24)
where d is the collision diameter of a diffusant molecule (which can be taken as the
kinetic diameter of the gas), λ is the penetrant jump length, No is the Avogadro’s number,
and CED is equal to (ρ Ecoh), where Ecoh is the molar cohesion energy. This equation
predicts that ED increases with the kinetic diameter of the gas, as verified experimentally.
The Brandt’s model [120] assumes the existence of a finite average distance
between chains in the equilibrium state. We have:
( ) 2iDi d slopeintercept E += Eq (6.25)
where i stands for a gas i. The average distance between chains can be calculated by
taking the square root of (-intercept/slope) [120].
As shown in Figure 6.43, ED was plotted versus the square of the kinetic diameter
of the gas, and a linear regression was performed. Since ED was obtained only for O2 and
N2, the linear regression was based on two data points only for each cooling rate.

Chapter 6 - Effect of the cooling rate on the gas transport properties of polycarbonate 216
Obviously, the errors were far from being negligible. Nevertheless, a trend can still be
distinguished. As seen in Table 6.12, the greater the cooling rate, the greater the average
distance between chains. As expected, chains are further apart for the sample cooled
really fast. The average interchain separations given in Table 6.12 happen to be on the
same order of magnitude than the kinetic diameters of the gas molecules. Recall, the
kinetic diameters of He, O2, and N2 are reported as 2.6 Å, 3.46 Å, and 3.64 Å,
respectively [71-74]. This result is expected since the diffusion is restricted and believed
to be controlled by the thermal motions of the polymer chains (activated jump motion).
The fact that the average distance between chains increases with the cooling rate
may induce a decrease in the Van der Waals forces. Such a decrease could explain why
the Tg is lower for the highest cooling rate since the forces that need to be overcome for
the material to become rubbery are lower.
The wide-angle X-ray diffraction (WAXD) d-spacing has been determined to be
about 5.1 or 5.2Å for polycarbonate [23, 95], about 2Å more than the average distance
between chains given in Table 6.12. The d-spacing of amorphous polymers is believed to
indicate the intersegmental distance between polymer chains. Note that the term
“correlation length” should be used instead since the word “d-spacing” refers to
crystalline materials. The fractional free volume determined from group contribution
methods and the average distance between chains as calculated above may give a better
estimate of the openness of the polymeric matrix than the correlation length. While
studying polymers with bulky ring substituents, it has for instance been shown that the
correlation lengths, that indicate the distance between chain centers, overestimate the
amount of free volume [95]. However there is no evidence that the correlation length
corresponds to the space necessary for gas molecules to go through the polymer. A recent
study concerning 6FDA-based polyimide [123] suggests indeed that gas permeability in
glassy polymers may not be related to the correlation lengths.

Chapter 6 - Effect of the cooling rate on the gas transport properties of polycarbonate 217
12.00 12.25 12.50 12.75 13.00 13.25
30000
40000
50000
60000
70000
80000
Cooling rate
0.5oC/min
10oC/min
40oC/min external fan
ED (
J/m
ol)
kinetic diameter^2 (A^2)
Figure 6.43: ED as a function of the square of the kinetic diameter of the gas penetrant. Knowledge of the slope and the intercept provides a rough estimation of the average distance between chains. The average distance between chains was calculated by taking the square root of (-intercept/slope). The values of the slopes were (7513.3, 6077.5, 11859.2, and 28985.9 J/(mol.Å2)) and the values of the intercepts were (-59511.2, -42530.0, -112380.1, and -315118.8 J/mol) for the samples cooled at 0.5oC/min, 10oC/min, 40oC/min, and by the external fan, respectively.
cooling rate distance (A)0.5oC/min 2.810oC/min 2.640oC/min 3.1
external fan 3.3
Table 6.12: Average distances between chains for the various cooling rates of interest. The errors were far from being negligible. In the case of the sample cooled by the fan, taking extreme points on the error bars of ED for instance led to average distances ranging from 1.1Å to 10.3Å.
6.4. Conclusions
The ultimate objectives of the present study were to examine the relationships
between the free volume contained in a polymeric matrix and the gas transport properties.
The free volume content was changed by selecting various cooling rates. A particular

Chapter 6 - Effect of the cooling rate on the gas transport properties of polycarbonate 218
grade of bisphenol-A polycarbonate was chosen, and physical properties and gas
transport parameters were determined as a function of the cooling rate.
On one hand, the physical properties of polycarbonate were found to be greatly
affected by the time given to the polymer to cool down from 15oC above the glass
transition temperature Tg to room temperature. The greater the cooling rate, the greater is
the amount of free volume trapped into the polymeric matrix, the lower is the density, the
lower is the Tg, and the greater is the breadth of the loss modulus E”. No linear
relationship was observed between the density and the Tg values. It was nevertheless
determined that the breadth of E” was linearly correlated with the density.
On the other hand, the permeability coefficients through the polymer were not
observed to be affected by the cooling rate. Although the diffusion coefficient and the
solubility coefficient were found to be dependent on the cooling rate, their combined
effects canceled out, and the permeability coefficient appeared to remain constant with an
increase in free volume for all the gases studied, in contradiction with common
expectations. The free volume present in polymers is commonly believed to allow
molecular motions, to enhance the diffusional jumps, and to increase the permeability.
This study points out that the permeability coefficient should not be directly related to the
Tg or the free volume, as what is commonly done in the literature [69, 70]. However the
solubility coefficient can be related to the free volume and its distribution. The free
volume theory was not verified in this study however, indicating that the diffusion
coefficient is not directly related to the free volume content, in contrast to the literature
[29-33, 69, 101-105]. The increase in the diffusion coefficient with a decrease in the
cooling rate, and thus with a decrease in the free volume amount, may be caused by the
conformations and dynamics of the polymer segments. Quite surprisingly, the activation
energies for gas transport were found to be greater for the samples with a higher amount
of free volume. The results presented here are therefore in contradiction with what is
usually written in the literature [70]. The behavior was explained in terms of the energy
state of the polymer and the resulting relaxation times. The activation energies and
corresponding preexponential factors were observed to verify well-established
relationships, thus validating the experimental data. The average distance between chains
was also determined from the knowledge of the activation energy for diffusion. As

Chapter 6 - Effect of the cooling rate on the gas transport properties of polycarbonate 219
expected, it was estimated that the chains were further apart for the sample with the
higher cooling rate.
The gas transport results obtained in this study are in agreement with the ones
obtained in Chapter 5. The free volume theory of diffusion may grossly apply to different
polymer structures with different overall free volume contents but may not discern the
subtle differences of a given polymer at different thermal histories. We postulate that the
local chain dynamics are crucial for the gas transport process.
Furthermore, this study shows that the cooling rate is not an important polymer
processing parameter, if one is interested in the permeability of freshly processed
amorphous bisphenol-A polycarbonate only (used as a functional specialty polymer).
Indeed P remains unaffected by the time given to the polymer to reach room temperature.
However the cooling rate affects other properties such as density and Tg, and may affect
the behavior of the polymer with time.
6.5. References
1. H. Hachisuka, H. Takizawa, T. Tsujita, A. Takizawa, T. Kinoshita, gas transport properties in polycarbonate films with various unrelaxed volumes, Polymer, 32, 13, 2383 (1991).
2. H. Hachisuka, Y. Tsujita, A. Takizawa, T. Kinoshita, Gas transport properties of annealed polyimide films, Journal of Polymer Science: Part B: Polymer Physics, 29, 11 (1991).
3. E. Ito, K. Sawamura and S. Saito, Effects of drawing on molecular motions in polycarbonate, Colloid & Polymer Sci., 253, 480-484 (1975).
4. A. Bos, I. G. M. Punt, M. Wessling, H. Strathmann, CO2-induced plasticization phenomena in glassy polymers, Journal of Membrane Science, 155, 67-78 (1999).
5. J. S. Chiou, J. W. Barlow and D. R. Paul, Plasticization of Glassy Polymers by CO2, Journal of Applied Polymer Science, 30, 2633 (1985).
6. R. G. Wissinger and M. E. Paulaitis, Glass Transitions in Polymer/CO2 Mixtures at Elevated Pressures, Journal of Polymer Science, Part B: Polymer Physics, 29, 5, 631 (1991).
7. E. S. Sanders, Penetrant-induced plasticization and gas permeation in glassy polymers, Journal of Membrane Science, 37, 63-80 (1988).
8. M. Wessling, S. Schoeman, Th. Van den Boomgaard, C. A. Smolders, Plasticization of gas separation membranes, Gas Sep. Purif., 5, 222-228 (1991).

Chapter 6 - Effect of the cooling rate on the gas transport properties of polycarbonate 220
9. Y. P. Handa, S. Lampron, M. L. O’Neill, On the plasticization of poly(2,6-dimethyl phenylene oxide) by CO2, J. Polym. Sci., Polym. Phys. Ed., 32, 2549-2553 (1994).
10. W.-C. Wang, E. J. Kramer, W. G. Sachse, Effects of high –pressure CO2 on the glass transition temperature and mechanical properties of polystyrene, J. Polym. Sci., Polym. Phys. Ed., 20, 1371-1384 (1982).
11. J. R. Fried, H.-C. Liu, C. Zhang, Effect of sorbed carbon dioxide on the dynamic mechanical properties of glassy polymers, J. Polym. Sci., Polym. Part C, 27, 385-392 (1989).
12. T. S. Chow, Molecular interpretation of the glass transition temperature of polymerdiluent systems, Macromolecules, 13, 362-364 (1980).
13. M. Wessling, Z. Borneman, Th. Van den Boomgaard, C. A. Smolders, Carbon dioxide foaming of glassy polymers, J. Appl. Polym. Sci., 53, 1497-1512 (1994).
14. H. Hachisuka, T. Sato, T. Imai, Y. Tsujita, A. Takizawa, T. Kinoshita, Glass transition temperature of glassy polymers plasticized by CO2 gas, Polymer Journal, 22, 1, 77 (1990).
15. J.-S. Wang, Y. Kamiya, Y. Naito, Effects of CO2 conditioning on sorption, dilation, and transport properties of polysulfone, Journal of Polymer Science: Part B: Polymer Physics, 36, 1695 (1998).
16. K. Tanaka, M. Ito, H. Kita, K. Okamoto, Y. Ito, The effects of CO2-conditioning of polymers on positron annihilation and gas permeation properties, Bull. Chem. Soc. Jpn., 68, 3011-3017 (1995).
17. G. K. Fleming and W. J. Koros, Dilation of Polymers by Sorption of Carbon Dioxide at Elevated Pressures. 1. Silicone Rubber and Unconditioned Polycarbonate, Macromolecules, 19, 2285 (1986).
18. G. K. Fleming and W. J. Koros, Carbon Dioxide Conditioning Effects on Sorption and Volume Dilation Behavior for bisphenol A - Polycarbonate, Macromolecules, 23, 1353 (1990).
19. A. G. Wonders and D. R. Paul, Effects of CO2 Exposure History on Sorption and transport in Polycarbonate, Journal of Membrane Science, 5, 63 (1979).
20. S. M. Jordan, W. J. Koros, J. K. Beasley, Characterization of CO2-induced conditioning of polycarbonate films using penetrants with different solubilities, Journal of Membrane Science, 43, 103-120 (1989).
21. D. S. Pope, G. K. Fleming, W. J. Koros, Effect of various exposure histories on sorption and dilation in a family of polycarbonates, Macromolecules, 23, 2988 (1990).
22. W. R. Vieth, L. H. Dao, and H. Pedersen, Non-equilibrium microstructural and transport characteristics of glassy poly(ethylene terephthalate), Journal of Membrane Science, 60, 41-62 (1991).
23. 3��*RWWKDUGW��$��*U&JHU��+��J��%ULRQ��5��3ODHWVFKNH��DQG�5��.LUFKKHLP��9ROXPH�
change of glassy polymers by sorption of small molecules and its relation to the intermolecular space, Macromolecules, 30, 8058-8065 (1997).
24. S.-H. Chen, S.-L. Huang, K.-C. Yu, J.-Y. Lai, M.-T. Liang, Effect of CO2 treated polycarbonate membranes on gas transport and sorption properties, Journal of Membrane Science, 172, 105-112 (2000).

Chapter 6 - Effect of the cooling rate on the gas transport properties of polycarbonate 221
25. B. G. Risch and G. L. Wilkes, Effects of physical aging and carbon dioxide absorption in bisphenol-A polycarbonate, Journal of Applied Polymer Science, 56, 1511 (1995).
26. A. H. Chan and D. R. Paul, Influence of history on the gas sorption, thermal, and mechanical properties of glassy polycarbonate, Journal of Applied Polymer Science, 24, 1539-1550 (1979).
27. J. S. Chiou, J. W. Barlow and D. R. Paul, Polymer Crystallization Induced by sorption of CO2 Gas, Journal of applied Polymer Science, 30, 3911 (1985).
28. Christelle M. Laot, Understanding gas transport in physically aged, oriented and pressure densified amorphous glassy bisphenol-A polycarbonate, PhD preliminary examination thesis, Virginia Polytechnic Institute and State University, VA, USA, December 17, 1999.
29. J. L. Duda and J. M. Zielinski, Free-Volume Theory, Plastics Engineering, 32, 143 (1996).
30. M. H. Cohen and D. Turnbull, J. Chem. Phys., 31, 1164 (1959). 31. J. S. Vrentas and J. L. Duda, J. Polym. Sci., 15, 403 (1977). 32. J. S. Vrentas and J. L. Duda, J. Polym. Sci., 15, 417 (1977). 33. H. Fujita, Fortschr. Hochpolym. Forsch., 3, 1 (1961). 34. &�� 1DJHO�� (�� 6FKPLGWNH�� .�� *&QWKHU-Schade, D. Hofmann, D. Fritsch, T.
Strunskus, and F. Faupel, Free volume distributions in glassy polymer membranes: comparison between molecular modeling and experiments, Macromolecules, 33, 2242-2248 (2000).
35. T. Banerjee and G. G. Lipscomb, Calorimetric probes of carbon dioxide sorption in bisphenol-A based polymers, Polymer, 38, 23, 5807 (1997).
36. U. Kriesten and J. M. Hutchinson, On the use of a density gradient column to monitor the physical ageing of polystyrene, Polymer, 33, 22, 4875-4877 (1992).
37. Seungman Sohn, personal communication. 38. R. Wimberger-Friedl, G. Prast, A. V. Kurstjens, and J. G. de Bruin, Measurement
of the density distributions in quenched polycarbonate specimens by a quantitative Schlieren optical technique, Journal of Polymer Science: Part B: Polymer Physics, 30, 83-90 (1992).
39. R. Wimberger-Friedl and J. G. de Bruin, The very long-term volume recovery of polycarbonate: is self-retardation finite? Macromolecules, 29, 4992-4997 (1996).
40. J. Bicerano, editor, Prediction of polymer properties, 2nd edition, revised and expanded, Marcel Dekker, Inc., New York, 1996.
41. S. Matsuoka, A. Hale, Cooperative relaxation processes in polymers, Journal of Applied Polymer Science, 77-93 (1997).
42. A. J. Kovacs, J. J. Aklonis, J. M. Hutchinson, and A. R. Ramos, Isobaric volume and enthalpy recovery of glasses. II. A transparent multiparameter theory, Journal of Polymer Science: Polymer Physics Edition, 17, 1097-1162 (1979).
43. A. J. Kovacs, A multiparameter approach for structural recovery of glasses and its implication for their physical properties, in Structure and mobility in molecular and atomic glasses, edited by J. M. O’Reilly and M. Goldstein, Annals of the New York Academy of Sciences, 371, 38-66 (1981).
44. Dr. Hervé Marand, lecture notes.
Chapter 6 - Effect of the cooling rate on the gas transport properties of polycarbonate 222
45. B.–S. Hsu, S.-H. Kwan, Directional anisotropy of dielectric β-relaxation in oriented poly(ethylene terephthalate), Journal of Polymer Science: Polymer Physics Edition, 14, 1591 (1976).
46. D. M. Bigg, A review of positron annihilation lifetime spectroscopy as applied to the physical aging of polymers, Polymer Enginering and Science, 36, 6, 737 (1996).
47. W. J. Davis and R. A. Pethrick, Investigation of physical ageing in polymethylmethacrylate using positron annihilation, dielectric relaxation and dynamic mechanical thermal analysis, Polymer, 39, 2, 255 (1998).
48. J. M. Hutchinson, J. J. Aklonis, and A. J. Kovacs, A new phenomenological approach to volume recovery in glasses, Polymer preprints, 16, 2, 94-99 (1975).
49. H. Hachisuka, H. Takizawa, Y. Tsujita, A. Takizawa, and T. Kinoshita, Gas transport properties in polycarbonate films with various unrelaxed volumes, Polymer, 32, 13, 2382-2386 (1991).
50. R. Greiner and F. R. Schwarzl, Thermal contraction and volume relaxation of amorphous polymers, Rheologica Acta, 23, 378-395 (1984).
51. J. H. Gibbs and E. A. DiMarzio, J. Chem. Phys., 28, 3, 373 (1958). 52. J. M. Hutchinson, S. Smith, B. Horne, and G. M. Gourlay, Physical aging of
polycarbonate: enthalpy relaxation, creep response, and yielding behavior, Macromolecules, 32, 5046-5061 (1999).
53. T. G. Fox and P. J. Flory, J. Am. Chem. Soc., 70, 2384 (1948). 54. T. G. Fox and P. J. Flory, J. Appl. Phys., 21, 581 (1950). 55. D. M. Colucci, G. B. McKenna, J. J. Filliben, A. Lee, D. B. Curliss, K. B.
Bowman, J. D. Russell, Isochoric and isobaric glass formation: similarities and differences, Journal of Polymer Science: Physics Edition, 1561-1573 (1997).
56. P. Zoller, A study of the pressure-volume-temperature relationships of four related amorphous polymers: polycarbonate, polyarylate, phenoxy, and polysulfone, Journal of Polymer Science: Polymer Physics Edition, 20, 1453-1464 (1982).
57. J. A. Schouten, J. Scholten, N. Nelissen, and E. Nies, Influence of pressure on the thermal properties of polystyrene, Polymer Communications, 32, 14, 421-422 (1991).
58. A. Weitz, B. Wunderlich, Thermal analysis and dilatometry of glasses formed under elevated pressure, Journal of Polymer Science: Polymer Physics Edition, 12, 2473-2491 (1974).
59. J. J. Aklonis and A. J. Kovacs, A new look at the glass transition, 267- ( ). 60. O. Araki, M. Horie, T. Masuda, Physical aging of polycarbonate investigated by
dynamic viscoelasticity, Journal of Polymer Science: Part B: Polymer Physics, 39, 337-341 (2001).
61. S. Matsuoka, Relaxation phenomena in polymers, Hanser Publishers, NY, 1992. 62. K. Takahara, H. Saito, T. Inoue, Physical aging in poly(methyl methacrylate)
glass: densification via density fluctuation, Polymer, 40, 3729-3733 (1999). 63. M. D. Shelby and G. L. Wilkes, Thermodynamic characterization of the oriented
state of bisphenol A polycarbonate as it pertains to enhanced physical aging, Journal of Polymer Science: Part B: Polymer Physics, 36, 2111 (1998).
Chapter 6 - Effect of the cooling rate on the gas transport properties of polycarbonate 223
64. E. Ito, T. Hatakeyama, Studies of the amorphous region of polymers- II - Relationship between change of structure and glass-transition temperature in polycarbonate, Journal of Polymer Science: Polymer Physics Edition, 13, 2313-2320 (1975).
65. H. H. Song and R.-J. Roe, Structural change accompanying volume change in amorphous polystyrene as studied by small and intermediate angle X-ray scattering, Macromolecules, 20, 2723-2732 (1987).
66. L. H. Sperling, Introduction to physical polymer science, Second edition, John Wiley and Sons, 1992.
67. Dr. G. L. Wilkes, lecture notes. 68. Dr. T. Ward, lecture notes. 69. J. Y. Park, D. R. Paul, Correlation and prediction of gas permeability in glassy
polymer membrane materials via a modified free volume based group contribution method, Journal of Membrane Science, 125, 23-39 (1997).
70. Y. Yampolskii, S. Shishatskii, A. Alentiev, K. Loza, Correlations with and prediction of activation energies of gas permeation and diffusion in glassy polymers, Journal of Membrane Science, 148, 59-69 (1998).
71. W. J. Koros and G. K. Fleming, Membrane-based Gas Separation, Journal of Membrane Science, 83, 1-80, (1993).
72. W. J. Koros and M. W. Hellums, Transport Properties, Encyclopedia of Polymer Science and Engineering, 2nd Edition, H. F. Mark, N. M. Bikales, C. G. Overberger, G. Mendes, Eds., John Wiley and Sons, New York, Supplement volume, 1989.
73. D. W. Breck, Zeolite molecular sieves, John Wiley & Sons, Inc., New York, 1974.
74. W. J. Koros, A. H. Chan and D. R. Paul, Sorption and Transport of Various Gases in Polycarbonate, Journal of Membrane Science, 2, 165 (1977).
75. L. M. Costello and W. J. Koros, Temperature Dependence of Gas Sorption and Transport Properties in Polymers: Measurements and Applications, Industrial Engineering Chemical Research, 31, 2708 (1992).
76. S. A. Stern, Y. Mi, H. Yamamoto, A. K. St. Clair, J. Polym. Sci., Polym. Phys. Ed., 27, 1887 (1989).
77. V. M. Shah, S. A. Stern and P. J. Ludovice, Estimation of the Free Volume in Polymers by Means of a Monte Carlo Technique, Macromolecules, 22, 4660 (1989).
78. D. Hofman, J. Ulbrich, D. Fritsch, D. Paul, Molecular modelling simulation of gas transport in amorphous polyimide and poly(amide imide) membrane materials, Polymer, 37, 21, 4773-4785 (1996).
79. A. Q. Tool, J. Am. Ceram. Soci., 31, 177-186 (1948). 80. L. C. E. Struik, Physical aging in amorphous polymers and other materials,
Elsevier, New York, 1978. 81. G. Strobl, The physics of polymers, Concepts for understanding their structures
and behavior, Springer, NY, 1996. 82. J. Lu, Y. Wang, and D. Chen, Infrared spectroscopic and modulated differential
scanning calorimetry study of physical aging in bisphenol-A polycarbonate, Polymer Journal, 32, 7, 610-615 (2000).

Chapter 6 - Effect of the cooling rate on the gas transport properties of polycarbonate 224
83. N. Heymans, FTIR investigation of structural modification of polycarbonate during thermodynamical treatments, Polymer, 38, 14, 3435 (1997).
84. N. Heymans and B. Dequenne, Relationship between conformation and enthalpy or volume relaxation in polycarbonate, Polymer, 42, 5337-5342 (2001).
85. C. A. Angell, The old problems of glass and the glass transition, and the many new twists, Proc. Natl. Acad. Sci., 92, 6675-6682 (1995).
86. C. M. Roland, P. G. Santangelo, and K. L. Ngai, The application of the energy landscape model to polymers, Journal of Chemical Physics, 111, 12, 5593-5598 (1999).
87. Computational modeling of polymers, edited by Jozef Bicerano, Marcel Dekker, Inc., NY, 1992.
88. D. Hofmann, L. Fritz, J. Ulbrich, and D. Paul, Molecular modelling of amorphous membrane polymers, Polymer, 38, 25, 6145-6155 (1997).
89. E. Tocci, D. Hofmann, D. Paul, N. Russo, E. Drioli, A molecular simulation study on gas diffusion in a dense poly(ether-ether-ketone) membrane, Polymer, 42, 521-533 (2001).
90. P. S. Rallabandi, A. P. Thompson, and D. M. Ford, A molecular modeling study of entropic and energetic selectivities in air separation with glassy polymers, Macromolecules, 33, 3142-3152 (2000).
91. H. Higuchi, Z. Yu, A. M. Jamieson, R. Simha, and J. D. McGervey, Thermal history and temperature dependence of viscoelastic properties of polymer glasses: relation to free volume quantities, Journal of Polymer Science: Part B: Polymer Physics, 33, 2295-2305 (1995).
92. H. Higuchi, A. M. Jamieson, and R. Simha, Free volume quantities and viscoelasticity of polymer glasses, Journal of Polymer Science: Part B: Polymer Physics, 34, 1423-1426 (1996).
93. A. Bondi, Physical properties of molecular crystals, liquids, and glasses, Wiley, New York, 1968.
94. D. W. Van Krevelen, Properties of Polymers, Their correlation with chemical structure; their numerical estimation and prediction from additive group contributions, Third Ed, Elsevier, NY, 1990.
95. M. W. Hellums, W. J. Koros, G. R. Husk and D. R. Paul, Fluorinated polycarbonates for gas separation applications, Journal of Membrane Science, 46, 93 (1989).
96. M. D. Shelby, G. L. Wilkes, M. R. Tant, J. Zawada, T. J. Bastow and A. J. Hill, Amorphous orientation in glassy polycarbonate, ACS, Polymeric Materials Science and Engineering, Conference Proceedings, San Francisco, Spring 1997, 76, 485-6.
97. Y. C. Jean, J.-P. Yuan, J. Liu, Q. Deng, and H. Yang, Correlations between gas permeation and free-volume hole properties probed by positron annihilation spectroscopy, Journal of Polymer Science: Part B: Polymer Physics, 33, 2365-2371 (1995).
98. S. Arizzi, P. H. Mott, U. W. Suter, J. Polym. Sci., Part B, Polym. Phys., 30, 415-426 (1992).
99. Y. C. Jean, Y. Rhee, Y. Lou, D. Shelby, G. L. Wilkes, Anisotropy of hole structures in oriented polycarbonate probed by two-dimensional angular

Chapter 6 - Effect of the cooling rate on the gas transport properties of polycarbonate 225
correlation of annihilation radiation, Journal of Polymer Science: Part B: Polymer Physics, 34, 2979-2985 (1996).
100. R. H. Gee and R. H. Boyd, Small penetrant diffusion in polybutadiene: a molecular dynamics simulation study, Polymer, 36, 1435 (1995).
101. D. R. Paul, Yuri P. Yampol’skii, editors, Polymeric gas separation membranes, CRC Press, Boca Raton, 1994. 102. Y. Kobayashi, K. Haraya, S. Hattori, Polymer, 35, 925-928 (1994). 103. S. Trohalaki, L. C. DeBolt, J. E. Mark, H. L. Frisch, Macromolecules, 23, 813-
816 (1990). 104. Y. Maeda and D. R. Paul, Effect of AntiPlasticization on Gas Sorption and
Transport. III. Free Volume Interpretation, Journal of Polymer Science: Part B: Polymer Physics, 25, 1005 (1987).
105. A. Thran, G. Kroll, F. Faupel, Correlation between fractional free volume and diffusivity of gas molecules in glassy polymers, Journal of Polymer Science: Part B: Polymer Physics, 37, 3344-3358 (1999).
106. W. J. Koros, M. R. Coleman, and D. R. B. Walker, Ann. Rev. Mater. Sci., 22, 47 (1992).
107. W. J. Koros, G. K. Fleming, S. M. Jordon, T. H. Kim, and H. H. Hoehn, Prog. Polym. Sci., 13, 339 (1988).
108. C. K. Kim, M. Aguilar-Vega, and D. R. Paul, Dynamic mechanical and gas transport properties of blends and random copolymers of bisphenol-A polycarbonate and tetramethyl bisphenol-A polycarbonate, Journal of Polymer Science: Part B: Polymer Physics, 30, 1131-1142 (1992).
109. Polycarbonates, Ullmann’s Encyclopedia of Industril Chemistry, vol A21, 207 (1992).
110. H. Higuchi, A. M. Jamieson and R. Simha, Free volume quantities and viscoelasticity of polymer glasses, Journal of Polymer Science: Part B: Polymer Physics, 34, 1423-1426 (1996).
111. W. M. Lee, Selection of barrier materials from molecular structure, Polym. Eng. Sci., 20, 65-69 (1980).
112. A. K. Doolittle, J. Appl. Phys., 22, 1031 (1951). 113. A. K. Doolittle, J. Appl. Phys., 22, 12, 1471 (1951). 114. A. Singh, and W. J. Koros, Significance of Entropic Selesctivity for Advanced
Gas Separation Membranes, Ind. Eng. Chem. Res., 35, 1231, (1996). 115. Handbook of chemistry & physics, 80th edition, D. R. Lide, editor, CRC Press,
NY, 1999. 116. L. M. Costello and W. J. Koros, Comparison of Pure and Mixed Gas CO2 and
CH4 Permeabilities in Polycarbonate: Effect of Temperature, Ind. Eng. Chem. Res., 32, 2277 (1993).
117. C. Zener, J. Appl. Phys., 22, 372 91951). 118. M. Pönitsch and R. Kirchheim, Relation between prefactor and activation energy
for the diffusion of atoms and small molecules in polymers, Scripta Materialia, 34, 9, 1479-1482 (1996).
119. B. P. Tikhomirov, H. B. Hopfenberg, V. Stannett and J. L. Williams, Makromol. Chem., 118, 177 (1968).
120. W. W. Brandt, J. Phys. Chem., 63, 1080 (1959).

Chapter 6 - Effect of the cooling rate on the gas transport properties of polycarbonate 226
121. P. Meares, Diffusion of gases through polyvinyl acetate, J. Am. Chem. Soc., 76, 3415 (1954).
122. V. Teplyakov, P. Meares, Correlation aspects of the selective gas permeability of polymeric materials and membranes, Gas Sep. Purif., 4, 65 (1990).
123. A. Shimazu, T. Miyazaki, K. Ikeda, Interpretation of d-spacing determined by wide angle X-ray scattering in 6FDA-based polyimide by molecular modeling, Journal of Membrane Science, 166, 113-118 (2000).
124. N. Muruganandam, W. J. Koros and D. R. Paul, J. Polym. Sci., Polym. Phys. Ed., 25, 1999 (1987).
125. N. Muruganandam and D. R. Paul, Journal of Membrane Science, 34, 185 (1987).

Chapter 7
Physical aging in amorphous glassy bisphenol-A polycarbonate as revealed
by gas transport measurements
7.1. Introduction
Glassy polymers tend to decrease their excess free volume with time by
undergoing further chain packing, without crystallization. This phenomenon is referred to
as physical aging or structural relaxation. A background has been provided in Chapter 3.
Below the glass transition temperature Tg, some free volume still remains allowing local
motions and therefore conformational rearrangements. The molecules can oscillate
between a limited number of conformations with minimum energy [1-3]. Obviously, the
relaxation towards equilibrium takes an extremely long time since polymers below their
glass transition temperature do not have sufficient thermal energy to attain equilibrium
rapidly.
The effects of physical aging on the gas transport properties have been reported in
Chapter 3. The gas transport parameters that are the permeability coefficient P, the
diffusion coefficient D and the solubility coefficient S were generally observed to
decrease with aging. The decrease in the gas transport properties was attributed to the
loss of free volume with sub-Tg annealing. However most of the published data were
complicated by several factors, such as conditioning, samples used as-received or cast

Chapter 7 - Physical aging in amorphous glassy bisphenol-A polycarbonate as revealed by gas transport measurements 228
from solution, plasticization induced by carbon dioxide, or sorption experiments
themselves. The reader should consult Chapter 3 for more details. New studies free of the
above complications should be conducted in order to confirm the trends reported in the
literature. We do expect that permeation experiments are more accurate than sorption
experiments (whose problems have been mentioned in Chapter 3) and can be used as a
tool to investigate the process happening at the molecular level with physical aging. Inert
gases with different kinetic diameters will be used to probe the free volume of polymers.
The same membrane will be used twice to make it possible to compare data within a
limited error range. A recapitulation of the procedure selected in this project is shown in
Table 7.1 and compared with the literature.
Literature This project
processing solvent cast hot presspreparation conditioning no conditioning
gas CO2 inert gases
membrane different membranes same membrane used twiceapparatus sorption permeation
Table 7.1: Comparison of the methods commonly found in the literature to study aging compared to the one chosen in this research.
As pointed out in Chapter 3, there still remain several unanswered questions about
physical aging, such as which cavity sizes are more likely to be affected by the aging
phenomena. According to Curro and Roe [4], thermal density fluctuations in
polycarbonate on isothermal sub-Tg annealing were observed by small-angle X-ray
scattering (SAXS) measurements in a narrow range from about 130oC to 147oC only.
Although other properties such as specific volume or density did not change much in that
limited temperature interval, they did change significantly at lower temperatures. SAXS
data were collected for up to 200min for each annealing temperature. A model was
developed by the researchers to interpret the density fluctuations in terms of the free
volume concept. The conclusions indicated that although the amount of free volume
decreased with aging at sub-Tg annealing temperatures below the glass transition range,
the average free volume hole size increased with aging. An increase in the average hole
size was attributed to two possible factors: either a coalescence of the cavities or an

Chapter 7 - Physical aging in amorphous glassy bisphenol-A polycarbonate as revealed by gas transport measurements 229
elimination of the small cavities, with the larger ones remaining unchanged. Wendorff [5]
could not observe any changes in the electron density fluctuations of polycarbonate
annealed at 124oC for up to 1000h either. Different conclusions were obtained by
positron annihilation lifetime spectroscopy (PALS). It was found that on aging at
temperatures below the glass transition range, the holes in polycarbonate did not really
decrease in size but in number [6-11]. Indeed, τ3 was reported to remain pretty much
constant with aging whereas I3 was significantly reduced. Therefore, the free volume was
reduced with aging as similarly concluded from the SAXS results, but the average hole
size remained unaffected by aging. Nevertheless, the existence of a distribution of τ3
lifetimes and thus hole sizes has been suggested [11]. Similarly, all the cavities in
polycarbonate were reported to decrease equally with physical aging by photochromic
probes [12]. The average cavity size was suggested to remain constant. A PALS study on
polycarbonate has nevertheless shown that the average hole size was reduced with
physical aging at 120oC [13]. The SAXS, PALS, and photochromic probe results showed
therefore that below the glass transition region the average hole sizes in polycarbonate
probed by those three techniques do not appear to be similarly affected by aging. The
different behaviors may be caused by the range of hole sizes probed by each technique.
Nevertheless, the data should be looked at with scrutiny since several complications arise
in the analysis, such as assumption of spherical cavities and radiation effects for PALS,
etc (see Chapter 3 for details).
Furthermore, differences between PALS or SAXS results and gas transport
properties can also be noticed. At the glass transition temperature Tg of polycarbonate, a
change in the slope of τ3 versus temperature is noticed by PALS measurements [10, 11]
and a change in the slope of the X-ray intensity I(0) versus temperature is seen by SAXS
measurements (I(0) was obtained by extrapolation of the observed intensity I(s) to s→0,
with s = 2sinθ/λ) [4]. Nevertheless no change in the slope of the permeability coefficient
P versus temperature is noticed at Tg for polycarbonate using various gases [14]. The
curve was observed to increase gradually at the Tg, in contrast with mechanical or
thermal properties that vary non-linearly in the transition region.

Chapter 7 - Physical aging in amorphous glassy bisphenol-A polycarbonate as revealed by gas transport measurements 230
Probing the free volume with gas molecules of different sizes can give
information on the size of the microvoids and on the structural scale of changes occurring
during physical aging. Gas permeation can be used as a tool to probe the free volume of
polymeric materials on a microscopic level since the diffusion and the solubility
coefficients themselves can be evaluated from permeation results.
Emphasis will be placed in this study on the sub-Tg annealing at the annealing
temperature of 120oC. Polymeric films are usually used for practical applications in the
glassy state and not in the glass transition range where properties such as the storage
modulus E’ decrease tremendously. No drop in E’ can already be seen at 120oC on the
DMTA curve. The effects of physical aging should be clearly visible at 120oC. In
addition, the effect of the cooling rate on the physical aging rate will also be examined,
since this may affect the aging rate in an unexpected way. As the permeability coefficient
corresponds to the product of the diffusion D and the solubility S coefficients, the
combined effects of D and S may not result in common trends seen for physical
properties most likely directly linked with the free volume content.
The first section of this chapter gives the experimental details. The results are
presented and discussed in the second section.
7.2. Experimental details
The following subsections mention briefly the materials and the instrumental
methods. The complete experimental details have been provided in Chapter 4. The reader
should refer to this particular chapter for deeper understanding of the materials and the
instrumental methods used in this research.
7.2.1. The materials
Bisphenol-A polycarbonate (BPA-PC) pellets were purchased from Aldrich. The
density was given as 1.2 g/cm3 at 20oC, the refractive index nD20 as 1.585, and the glass

Chapter 7 - Physical aging in amorphous glassy bisphenol-A polycarbonate as revealed by gas transport measurements 231
transition temperature Tg as 150oC. The weight average molecular weight Mw was
determined by GPC to be about 34,000 g/mol, and the polydispersity index about 2.2.
Sheets originating from the Aldrich pellets were compression-molded. The
polymeric sheets were kept in a dessicator at all time to avoid any water moisture uptake.
Prior to experiments, polymeric sheets were put between Kapton® sheets and copper
metal plates, and suspended in the center of an internal fan oven. The samples were
heated in the oven from room temperature (30oC) to 165oC at a heating rate of 40oC/min,
kept at 165oC for 15min to remove thermal history, and cooled within the oven at a
controlled rate of typically 40oC/min to room temperature (30oC). While studying the
influence of the cooling rate on the physical aging rate, the samples were cooled from
165oC at the following controlled rates: 0.5oC/min, 10oC/min, and 40oC/min. The system
consisting of the polymer sandwiched between the Kapton® sheets and the metal plates
was also cooled by opening the door of the oven and by blowing air immediately inside
the oven with an external fan. The cooling rate was in excess of 40oC/min. The polymer
films were used immediately once taken from the oven.
The thicknesses of the sheets were about 130µm.
Samples to be used for permeation experiments were treated as follows.
Permeation was performed at 35oC on the polycarbonate films described above, and thus
freshly processed. Once the permeation data had been collected, the films were put back
between the Kapton® sheets and the copper metal plates, together with the remaining
samples to be used for density measurements, and the metal plates were suspended in the
center of the internal fan oven. The “remaining samples” refer to the fresh polycarbonate
samples that were left at room temperature in a dessicator while the membranes were
studied by permeation experiments at 35oC. The samples were heated in the internal fan
oven from room temperature (30oC) to the sub-Tg annealing temperature Te at a heating
rate of 40oC/min, kept at Te for a defined annealing time te, and cooled within the oven at
a cooling rate of 40oC/min to room temperature (30oC). Permeation was performed
immediately at 35oC on the aged films. A schematic of the temperature program is given
in Figure 7.1. As mentioned previously, since the thickness is crucial in permeation
experiments, the same membrane was used twice in permeation experiments: once as the

Chapter 7 - Physical aging in amorphous glassy bisphenol-A polycarbonate as revealed by gas transport measurements 232
sample described in the beginning of this subsection and then as the aged sample. This
procedure made it possible to compare data within a limited error range. The error was
believed to be lower than the one introduced if two films are used. It is indeed rather
difficult to generate films of identical thicknesses and perfectly flat by hot press. It is
assumed that the low applied pressures used in permeation experiments do not modify the
structure of the polymer. No change in thickness could be detected after sub-Tg
annealing.
30oC
165oC 15 min
teTe
Typicalheating and cooling rates = 40oC/min
35oCpermeation
35oCpermeation
Variable
cooling
rate
Figure 7.1: Schematic of the preparation of the samples for permeation experiments. The cooling and heating rates were typically chosen as 40oC/min, except for the following. The cooling rates from 165oC to 30oC were chosen as 0.5oC/min, 10oC/min, or 40oC/min. Another cooling rate in excess of 40oC/min was also achieved by blowing air inside the oven with an external fan.
Please note that it was not possible to heat the fresh samples from room
temperature to 165oC at a heating rate of 40oC/min, leave them at 165oC for 15min, cool
them at a controlled rate to Te, leave them at Te for te, cool them to room temperature,
perform permeation experiments at 35oC on them, heat the samples back above Tg to
remove thermal history, and finally perform permeation at 35oC again after this. Indeed,
the shapes and the thicknesses of the films changed between the aged samples and the
fresh samples because of the softening taking place in the polymeric matrix above Tg.
And such a change is crucial in permeation experiments. The change in the permeation
profile with aging needs to be determined in the present study. And for this to be done,
Chapter 7 - Physical aging in amorphous glassy bisphenol-A polycarbonate as revealed by gas transport measurements 233
the change in thickness needs to be negligible with aging. Since the thickness is crucial in
permeation studies, the option given above could not be considered.
Because the aged samples could not be refreshed for permeation experiments, we
are aware that memory effects may come into play into our experimental data [15].
7.2.2. The instrumental methods
The densities were obtained at 18oC using a linear density gradient column made
of an aqueous solution of sodium bromide. The theoretical resolution of the column was
about 5×10⁻⁵ g/cm3. At least three samples of the same thermal history were dropped in
the column to verify reproducibility.
In order to look for any conformational changes, FTIR spectra were collected in
the ATR (attenuated total reflectance) mode using a zinc selenide ZnSe crystal.
The dynamic mechanical experiments were carried out in the tensile mode. While
studying physical aging effects however, no calibration check was performed on the
DMTA apparatus before collecting all the data for the set of samples. This ensured that
the DMTA internal parameters remained unchanged between sample runs.
Dynamic temperature ramp experiments were carried out with the following
conditions. A torque of 10cNm was used on each clamp. The frequency was chosen as
1Hz, the heating rate as 2oC/min, and the initial temperature as 25oC. The static force was
optimized at room temperature by dynamic frequency sweep test (strain control). The
strain was chosen as 0.025%, unless indicated. In the aging experiments, an extremely
low strain level of 0.004% was selected in order to avoid any structural rearrangements
that may occur at a higher strain level and hence destroy aging. The data were
reproducible within 0.3%.
Dynamic time sweep tests performed on samples cooled at different rates required
preliminary data. The static force was determined at the chosen annealing temperature Te
by dynamic frequency sweep test (strain control). The strain was chosen as 0.025%. The
sample was left for 5min at Te before starting the test itself in order to reach the desired

Chapter 7 - Physical aging in amorphous glassy bisphenol-A polycarbonate as revealed by gas transport measurements 234
annealing temperature Te indeed. The resulting force at 3Hz was recorded for further
testing. Once the previous test was finished, the gap between the grips was put back to
12mm without opening the compartment of the DMTA in order to maintain the
temperature at Te. Dynamic time sweep experiments were immediately carried out with
the following conditions. A torque of 15cNm was used on each clamp. The frequency
was chosen as 3Hz, the strain as 0.025%, the static force as determined above, and the
temperature as the annealing temperature Te. Data were collected every 10s for 20h. It
was determined by GPC that the samples did not degrade after this time at Te. No change
in color was noticed on the samples either. The time needed between both DMTA tests
given above was evaluated to be 5min. For each cooling rate treatment, at least two
samples were run in the DMTA to verify reproducibility.
Dynamic time sweep experiments were performed at various temperatures for samples
cooled at 40oC/min. 5min were allowed prior to testing for temperature equilibrium. The
strain was chosen as 0.025%, and the frequency was fixed at 5Hz.
Dynamic time sweep experiments were also carried out in order to possibly determine the
aging shift rate. The experiments were performed on a fresh sample at a given annealing
temperature as a function of the logarithm of the annealing time for several frequencies.
About 6 minutes were allowed prior to testing to ensure temperature equilibrium. The
analysis was similar as the one used to build master curves of a fresh polymer (see
Chapter 5 for details). The data were plotted back as a function of the logarithm of the
frequency for different annealing times. A reference annealing time was selected and the
curves were moved horizontally around the particular reference curve. While conducting
isothermal DMTA experiments, the storage modulus increased with aging time, whereas
the loss modulus decreased. The decrease in E” originated from the absorption of heat by
the sample, as what is measured in DSC experiments. The polycarbonate samples were
not found to be degraded under atmospheric pressure by GPC measurements for the
annealing times chosen in the time sweep experiments.
Permeation experiments were carried out at 35oC using He, O2, and N2, in that
given sequence. The applied pressures were kept constant at about 2.5atm for He and
about 3.9atm for both O2 and N2. Three measurements were taken for each gas to ensure

Chapter 7 - Physical aging in amorphous glassy bisphenol-A polycarbonate as revealed by gas transport measurements 235
reproducibility and to calculate the error involved in the permeation results. Permeation
experiments were carried out twice on the same membrane (fresh and aged) in order to
evaluate the percent change with aging within a limited error range. Once permeation
data were obtained on the fresh sample, the membrane was degassed for a few hours
before putting it in the oven for sub-Tg annealing. This ensured that the gas trapped inside
the polymeric matrix did not interfere with the typical aging process. While collecting
data a second time on the aged polymer, the membrane was placed exactly at the same
position it was before in the permeation cell in order to avoid permeating gas molecules
through the possibly present vacuum grease. Permeation experiments were also carried
out on the same aged membrane at 40, 45, and 55oC, right after the experiment at 35oC in
order to determine the activation energy for permeation. Deaging was assumed to be
negligible at those temperatures within the timeframe of the experiments.
7.3. Results and discussion
Physical aging was investigated with time at a sub-Tg annealing temperature Te of
120oC on samples cooled at 40oC/min. In addition, data obtained after a fixed annealing
time for polycarbonate samples cooled at different cooling rates are also discussed.
Physical aging was characterized by measuring bulk properties as well as by
probing the molecular level with gases using gas permeation experiments.
7.3.1. Annealing temperature determination
Samples cooled at 40oC/min were chosen to be aged at sub-Tg annealing
temperature Te of 120oC. Therefore, Te corresponded to a temperature of (Tg – 33.3oC),
as calculated from the glass transition temperature of 153.3oC reported in Chapter 6.
The value of Te needed to be adjusted for samples cooled at different rates. We
have:
CxxTT oge −= Eq (7.1)

Chapter 7 - Physical aging in amorphous glassy bisphenol-A polycarbonate as revealed by gas transport measurements 236
where xx is a fixed number. The Tg values of the various samples are recapitulated in
Table 7.2. Those numbers were extracted from the work presented in Chapter 6.
Unfortunately, the gas chromatograph (GC) oven used to control the cooling rate could
be programmed with 1oC resolution only. As a consequence, a common temperature of
120oC was chosen for Te for all the samples of this research despite of the slight
differences in their Tg’s. The maximum Tg difference between samples was of about
0.8oC.
cooling rate Tg (oC)0.5 153.5710 153.4140 153.32fan 152.79
Table 7.2: Tg as determined by DMTA experiments on the fresh samples (data taken from Chapter 6). The cooling rates are given in oC/min.
7.3.2. Density results
Changes in density with aging time were clearly observed at 120oC (see Figure
7.2). The density was found to increase linearly with the logarithm of aging time, in
agreement with the literature [16-26]. The loss in the amount of free volume was thus
linear with log te. The densification rate was evaluated to be around 0.00034 g/cm3 for
one decade for our samples cooled at 40oC/min. For comparison, the densification rates
evaluated from specific volume data [27] can be estimated to be about 0 g/cm3, 0.000177
g/cm3, and 0.00035 g/cm3per decade for polycarbonate samples cooled at 1oC/min,
10oC/min, and 80oC/min, respectively. Our results are therefore in “fair” agreement with
the literature.
Furthermore, although the fresh polycarbonate samples were left at room
temperature in a dessicator during about 16h before aging while other samples were in
the permeation apparatus (see details in the experimental section), no deaging effects can
be seen on the density data of Figure 7.2, at least in the timeframe selected here.
Furthermore it is well-known that aging occurs very slowly in polycarbonate at room
temperature, at least for aging periods under six months [27].
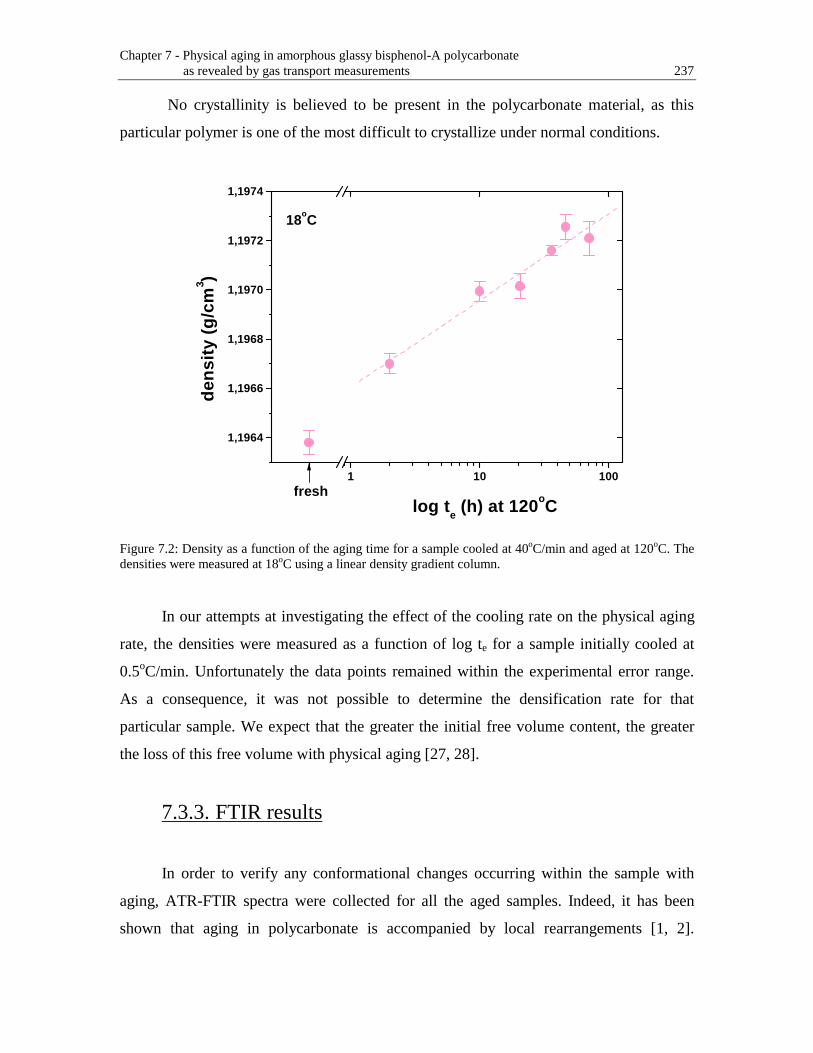
Chapter 7 - Physical aging in amorphous glassy bisphenol-A polycarbonate as revealed by gas transport measurements 237
No crystallinity is believed to be present in the polycarbonate material, as this
particular polymer is one of the most difficult to crystallize under normal conditions.
1 10 100
1,1964
1,1966
1,1968
1,1970
1,1972
1,1974
fresh
18oC
dens
ity (
g/cm
3 )
log te (h) at 120 oC
Figure 7.2: Density as a function of the aging time for a sample cooled at 40oC/min and aged at 120oC. The densities were measured at 18oC using a linear density gradient column.
In our attempts at investigating the effect of the cooling rate on the physical aging
rate, the densities were measured as a function of log te for a sample initially cooled at
0.5oC/min. Unfortunately the data points remained within the experimental error range.
As a consequence, it was not possible to determine the densification rate for that
particular sample. We expect that the greater the initial free volume content, the greater
the loss of this free volume with physical aging [27, 28].
7.3.3. FTIR results
In order to verify any conformational changes occurring within the sample with
aging, ATR-FTIR spectra were collected for all the aged samples. Indeed, it has been
shown that aging in polycarbonate is accompanied by local rearrangements [1, 2].

Chapter 7 - Physical aging in amorphous glassy bisphenol-A polycarbonate as revealed by gas transport measurements 238
However no detectable changes could be noticed in this research in the peaks of interests.
The fact that the contact pressure changed from one sample to another with the ATR
technique induced some complications in comparing the intensity of the absorption
bands. In addition since the spectra were not taken in situ as a function of aging but
directly on aged samples instead it was more difficult to detect any conformational
changes. It was not possible to collect spectra in the transmission mode due to the strong
absorption of polycarbonate in the infrared range.
7.3.4. DMTA results
7.3.4.1. Physical aging characterization
Dynamic mechanical analysis provides information about molecular motions and
morphology [29-31]. It has been shown in the literature that the intensity and the position
of the β-relaxation for polycarbonate does not depend on the free volume and is not
affected by aging [17, 32-34]. Therefore only the α-relaxation has been investigated in
this research. The α-relaxation results from motions of the large segments of the polymer
backbone whereas the β,γ,etc-relaxations are attributed to local motions. Polycarbonate
does not exhibit any coupling between the β- and the α-relaxations. At room temperature
the secondary relaxation is complete, while the α-relaxation does not contribute yet; there
are no overlap between the two peaks. Actually one of the unique features of bisphenol-A
polycarbonate is that its main and secondary relaxations are well separated in the thermal
response. This makes aging easier to follow.
Although the effects of aging have been reported to be difficult to observe with
DMTA because of the elevated frequencies involved in the experiments, aging of
polycarbonate could be characterized in this research using DMTA. An extremely low
strain level of 0.004% was selected in order to avoid any structural rearrangements that
may occur at a higher strain level and hence destroy aging. Aging was followed closely
as a function of the aging time at constant temperature. DMTA experiments were

Chapter 7 - Physical aging in amorphous glassy bisphenol-A polycarbonate as revealed by gas transport measurements 239
performed at random on the aged samples. The DMTA traces happened to be more
sensitive to the loss modulus E'' than to the storage modulus E', and therefore only E'' is
shown in this study. E' is related to the mechanical energy stored per cycle whereas E'' is
related to the energy dissipated or converted to heat through viscous dissipation. Figure
7.3 shows the data obtained at an annealing temperature of 118oC. Please note that a sub-
Tg annealing temperature of 118oC was chosen instead of 120oC, because this was the
temperature used in the preliminary studies. Unfortunately the DMTA apparatus did not
function anymore later on. As seen in Figure 7.3, the width of the E'' peak decreased with
aging and the E'' peak shifted to higher temperatures, hence indicating a greater value of
the glass transition temperature Tg. These observations can be attributed to the decrease
in the amount of the free volume with aging, as suggested from the Fox and Flory theory
[35, 36]. Some confusion may here arise as one visualizes the typical specific volume /
temperature curve drawn in Chapter 3. The fictive temperature reduces its value with sub-
Tg annealing time. However here the observed Tg is seen to increase with aging.
Problems of similar nature have been explained in Chapter 6 while discussing how the Tg
value changes as the value is obtained on cooling or on heating.
The aging rates seemed to go through a maximum between 27h and 53h of aging.
A sufficient amount of thermal energy may be needed to allow further conformational
changes or cooperative motions. The change in the breath of the E'' peak at 109 dyn/cm2
is shown in Figure 7.4 as a function of log annealing time, along with the Tg values. The
slope of the breadth of E” as a function of log te became strictly linear after 27h at 118oC.
However the fact that the breadth did not appear to be linear below 27h may be due to the
fact that the DMTA traces were not normalized. At long aging times the E” peak was
quite steep and therefore the breadth did not vary much from one fixed value of E” to
another close one. However at lower aging times a slight change in the value of E” may
affect the value of the breadth tremendously. From conclusions reached in Chapter 6, the
breadth of the loss modulus E” peak obtained on heating may be an indication of the
amount of free volume contained in the polymer, and therefore a linear decrease in this
breadth should be observed with aging, as the density increases linearly with log (aging
time) (see above). The observed Tg increased with aging, in agreement with published
results [6, 37-41]. Nevertheless, this increase in Tg was not observed to be linear with log

Chapter 7 - Physical aging in amorphous glassy bisphenol-A polycarbonate as revealed by gas transport measurements 240
te. This observation was actually expected from the results seen in previous chapters,
which placed emphasis on showing that Tg and density were not directly correlated.
Please note that the value of the Tg for the fresh polycarbonate differed from the one
reported in Chapters 5 and 6 because of a slight change in the position of the DMTA
thermocouple. Furthermore, the strain level selected in aging studies was more than six
times lower than the one used in Chapters 5 and 6 (0.004% versus 0.025%). The
magnitude of the modulus was found to decrease with annealing time, as shown in Figure
7.5.
140 145 150 155
1E8
1E9
1 Hz, 2oC/min, 0.004%
aging
te = 0 ----------------------
Te = 118oC te = 6h30 te = 27h te = 53h te = 97h20E
'' (d
yn/c
m2 )
T (oC)
Figure 7.3: Effect of aging at 118oC on the loss modulus of polycarbonate. The DMTA conditions were the following: frequency = 1Hz, strain = 0.004%, initial temperature = 25oC, heating rate = 2oC/min, torque = 10cNm. Samples were tested in the DMTA in a random order.

Chapter 7 - Physical aging in amorphous glassy bisphenol-A polycarbonate as revealed by gas transport measurements 241
1 10 100146
147
148
149
150
fresh
Tg
(o C
)
te(h) at 118 oC
6
8
10
12
Breath of E
'' at 109 dyn/cm
2 ( oC)
Figure 7.4: Change in the Tg (left axis) and in the breath of the loss modulus of polycarbonate at 109 dyn/cm2 (right axis) as a function of annealing at 118oC. The Tg was taken as the maximum of the glass transition. The DMTA conditions were the following: frequency = 1Hz, strain = 0.004%, initial temperature = 25oC, heating rate = 2oC/min, torque = 10cNm.
1 10 100
1E9
fresh
Tg
Tg-3
oC
Tg-5
oC
E''
(dyn
/cm
2 )
Figure 7.5: Change in the magnitude of the loss modulus as a function of annealing at 118oC for different temperatures (namely Tg, Tg-3
oC, and Tg-5oC). The DMTA conditions were the following: frequency =
1Hz, strain = 0.004%, initial temperature = 25oC, heating rate = 2oC/min, torque = 10cNm. The Tg was taken as the maximum of the glass transition.

Chapter 7 - Physical aging in amorphous glassy bisphenol-A polycarbonate as revealed by gas transport measurements 242
Aging studies were carried out at 140oC as well. However in this case no change
in the temperature ramp DMTA traces could be observed. The fresh sample and the
sample annealed at 140oC for up to 329h gave the same response. Other curves were
collected between 1h and 329h and the same response was obtained. Therefore, aging
performed in the neighborhood of Tg did not seem to show any changes with aging time,
probably because the temperature was too high. Schultheisz and McKenna have actually
shown that no aging was detectable above 137oC with stress relaxation experiments [42].
7.3.4.2. Memory effects characterization
In order to see if memory effects could be observed by DMTA, and therefore
prove that the aging phenomenon was indeed the phenomenon observed by DMTA in the
previous figures, the temperature in the aging oven was increased from 118oC to 127oC
after 97h20 at 118oC. The new aging temperature was therefore still below Tg but above
the previous aging temperature. DMTA measurements were collected on samples aged
for various times at 127oC. As seen in Figure 7.6, the width of the α-relaxation peak first
increased at short aging times, and the Tg decreased as well. This corresponded to the
memory effects extensively studied by Kovacs [15]. Matsuoka [43] explained deaging
effects by noting that they are related to the distribution of domain sizes. Since the
polymer possesses a wide distribution of relaxation times, smaller domains with rapid
relaxation times have already densified and reached equilibrium after some time at a
particular aging temperature, while larger domains with slower relaxation times are still
progressing towards equilibrium. Therefore as the temperature is increased to a
temperature greater than the previous annealing temperature but still below Tg, the
domains with short relaxation times that are in or near equilibrium have to expand
because of the increase in temperature. Since those domains have rapid relaxation times,
their response can be clearly seen only at initial times (as observed in Figure 7.6) since
they reach equilibrium faster. The domains with longer relaxation times keep densifying
towards the equilibrium value. As seen in Figure 7.6, the process of deaging took a rather
long time, even at those elevated temperatures, since the Tg decreased up to 22h30. Aging
started over again between 22h30 and 46h30 at 127oC. The slope seemed to change

Chapter 7 - Physical aging in amorphous glassy bisphenol-A polycarbonate as revealed by gas transport measurements 243
though at the new aging temperature, as observed by comparing the data at 4h30 and
46h30, as if the path to reach to equilibrium was different.
140 145 1501E8
1E9
1 Hz, 2oC/min, 0.004%
Te = 118oC te = 97h20
Then Te = 127 oC te = 4h30 te = 22h30 te = 46h30 te = 166h30E
'' (d
yn/c
m2 )
T (oC)
Figure 7.6: Loss modulus traces showing memory effects in polycarbonate as the temperature is increased from 118oC to 127oC. The DMTA conditions were the following: frequency = 1Hz, strain = 0.004%, initial temperature = 25oC, heating rate = 2oC/min, torque = 10cNm.
7.3.4.3. Isothermal experiments
Whenever a constant heating scan mode is used, interpretation of the aging results
becomes complicated because of the interaction of this heating scan with the aging
process. The structure of the sample may change, especially at temperatures close to the
Tg. In order to access the aging behavior at different temperatures within the glassy state,
isothermal DMTA experiments were carried out at 120oC and 80oC. As expected, fresh
polycarbonate samples were determined to age faster at 120oC than at 80oC (see Figure
7.7). Quite interestingly, the decrease in tan δ with annealing time was observed to be
linear with log te for the temperature of 80oC only. The linearity of tan δ with log te has
been reported elsewhere [44]. The increase in tan δ at short aging time for Te = 120oC
was attributed to internal stresses. The samples were put between the grips of the DMTA

Chapter 7 - Physical aging in amorphous glassy bisphenol-A polycarbonate as revealed by gas transport measurements 244
apparatus at room temperature, they were heated to Te relatively fast and left at Te for a
few minutes before starting the test itself. Since the samples were constrained between
the grips, it is possible that 20min may be needed for the polymer to relax at Te.
100 1000 100000.000
0.002
0.004
0.006
80oC
120oC
tan
δ
log te (s)
Figure 7.7: Change in tan δ as a function of annealing time at 80oC and 120oC. The sample was initially cooled at 40oC/min. The DMTA conditions were the following: strain = 0.025%, frequency = 5Hz, torque = 10cNm, static force = 40g.
Attempts were made to determine the aging shift rate at 120oC by isothermal
DMTA experiments. The shift rate is given as the ratio of the derivative of the logarithm
of the shift factor divided by the derivative of the logarithm of the annealing time
(assuming that the relaxation time distribution does not change in shape during aging).
The master curves [45, 46] can be built by using several frequencies. By increasing the
frequency, the sample has less time to respond, and therefore an increase in frequency is
similar to a decrease in temperature, as illustrated in Figure 7.8. As the frequency
increased, the Tg was observed at a higher temperature. Moreover, the intensity of E”
decreased, the peak broadened, and the slope of E’ decreased. Unfortunately, the shifting
procedure was not successful. It was indeed impossible to superimpose the various
curves. Vertical shifts did not significantly improve the master curve. The problem may
have come from the fact that the DMTA equipment did not allow us to run several

Chapter 7 - Physical aging in amorphous glassy bisphenol-A polycarbonate as revealed by gas transport measurements 245
frequencies at a time on the same sample. Unlike the dynamic frequency-temperature
sweep experiments analyzed in Chapter 5, several samples had to be run in the aging
studies one after another in order to gather all the needed information to build the master
curve. This may have generated some errors due to the slight differences in sample
dimensions. Moreover, it was observed that the values of the loss modulus E” became
negative at frequencies higher than 10Hz, attributed to the limitations of the DMTA
equipment itself.
130 140 150 1601E7
1E8
1E9
frequency increasing
frequency increasing
0.5 Hz E' E'' 3 Hz E' E'' 10 Hz E' E''E
' or
E''
(Pa)
Temperature ( oC)
Figure 7.8: Effect of frequency on the DMTA traces. The DMTA conditions were the following: strain = 0.025%, initial temperature = 25oC, heating rate = 1oC/min, torque = 10cNm.
Isothermal DMTA experiments were performed at 120oC as a function of the
annealing time for the samples cooled at different rates and hence representing different
histories. Obviously, the thermal cycle was different from the one used for permeation or
density measurements since it was controlled by the DMTA apparatus itself and not by
the internal fan oven, as used to prepare the other aged samples. The freshly processed
samples were directly aged at 120oC without waiting at room temperature for a period of
16h (as what was done for samples to be used in density measurements in order to allow
comparison with samples used in permeation). The resulting DMTA traces of tan δ are

Chapter 7 - Physical aging in amorphous glassy bisphenol-A polycarbonate as revealed by gas transport measurements 246
provided in Figure 7.9. It appeared that the samples cooled faster and thus containing the
greatest amount of free volume aged faster. Moreover, one observed that the behavior
became linear with the logarithm of the annealing time te for the slow-cooled sample
only. Recall, a linear decrease in the tan δ response was observed at an annealing
temperature of 80oC but not at 120oC for the sample cooled at 40oC/min. Therefore it
seems that aging of a 40oC/min-cooled sample at low temperatures in the glassy state
reflects aging of the slow-cooled sample at higher temperatures. The initial increase in
tan δ observed on Figure 7.9 at annealing times under 0.3h could be attributed to internal
stresses as discussed previously.
0.1 1 10
0.000
0.002
0.004
0.006
Te = 120
oC
Cooling rate
0.5oC/min
10oC/min
40oC/min fan
tan
δ
log te (h)
Figure 7.9: tan δ as a function of the annealing time te for the samples cooled at different cooling rates. The annealing temperature Te was chosen as 120oC. The DMTA conditions were the following: frequency = 3Hz, strain = 0.025%, data points collected every 10s.
7.3.5. Permeation results
The following sections report how the gas transport coefficients are affected by
aging for a sample cooled at a fixed rate, as well as for samples cooled at different rates

Chapter 7 - Physical aging in amorphous glassy bisphenol-A polycarbonate as revealed by gas transport measurements 247
and evaluated after a given sub-Tg annealing time. The experimental results are then
discussed. Changes in activation energies are also reported.
7.3.5.1. Physical aging characterization
Information about the amount of free volume and its size distribution can be
assessed in permeation experiments by using inert gases. As explained in the
experimental section of this chapter, permeation profiles were obtained twice on the same
membrane: once on the freshly processed polycarbonate and then on the aged one. This
procedure allowed us to investigate the effects of aging within a limited error range. No
change in thickness could be detected with sub-Tg annealing. As seen in Figure 7.10, the
permeation profiles were observed to be affected with physical aging. After 70h40 at
120oC the slopes decreased with aging, but this decrease depended on the nature of the
gas. The experimental permeation profile of N2 dropped more than those of He and O2.
Please note that although the decrease for N2 appeared to be much greater in Figure 7.10
than that of the other gases, this is not strictly true since the x-axis was not the same for
each gas. To our knowledge those results are the first ones to show how the experimental
permeation profile is really affected by aging. Data published in the literature obtained
with a permeation apparatus usually report values of the permeability coefficient directly.
However, such data were obtained within a greater error margin.

Chapter 7 - Physical aging in amorphous glassy bisphenol-A polycarbonate as revealed by gas transport measurements 248
0 2000 4000 6000 8000
0.0
0.2
0.4
He
O2
N2
annealing
Fresh He O
2 N
2
Aged (120 oC for 70h40) He O
2 N
2perm
eatio
n re
spon
se (
V)
permeation time (s)
Figure 7.10: Permeation profile as a function of the permeation time. The permeation experiments were carried out at 35oC. The difference in profile between a fresh membrane (cooling rate from 165oC = 40oC/min) and a membrane annealed at 120oC for 70h40 is clearly seen. The profile was averaged for each gas at each condition. The effect of annealing appeared to be greater for N2. The applied pressures were chosen as 3.9atm for He, and 2.5atm for both O2 and N2.
7.3.5.2. Aging results as a function of time
The percent (%) change in the slope of the experimental permeation profile was
determined by comparing the responses of the freshly processed (cooling rate from 165oC
= 40oC/min) and the aged samples for each aging time te at the given sub-Tg annealing
temperature of Te = 120oC. The % in the permeation profile slope change as a function of
aging at 120oC is shown in Figure 7.11. The slope was found to decrease for the three
gases used in this research. Furthermore, the greater the kinetic diameter of the gas, the
greater the decrease in the permeation profile slope. However this does not necessarily
mean that the larger free volume holes are eliminated first during physical aging since the
permeation process is a more complex phenomena. The % permeance change did not
appear to decrease linearly with log te though. This may reflect the conformational
changes taking place within the polymeric matrix with aging [2]. If one removes the first
data points up to te = 10h, the rest of the data could be fitted on a linear line though. The
behavior observed at short aging times could be either due to some deaging effects or to

Chapter 7 - Physical aging in amorphous glassy bisphenol-A polycarbonate as revealed by gas transport measurements 249
some induction period (acquisition of enough energy to move the chains at a local level).
However no deaging effects were observed by density measurements. Indeed, the density
was not observed to decrease at short aging times and then increase with further times.
Instead, the density was found to increase linearly with log te, even though the samples
were left for a couple of hours at room temperature before aging at 120oC while the other
samples were tested in the permeation apparatus. This seems to indicate that deaging may
not have taken place in the samples, at least at the macroscopic level. The % profile slope
change is shown as a function of the kinetic diameter in Figure 7.12.
1 10 100-12
-10
-8
-6
-4
-2
0
te = 0
Te = 120
oC
He O
2
N2
% p
erm
eanc
e ch
ange
te (h)
Figure 7.11: Percentage of the permeance change as a function of annealing time at 120oC for the gases studied in this research. The permeation slopes were obtained at 35oC and averaged. As apparent from the figure, the permeation slope was reduced with annealing time.

Chapter 7 - Physical aging in amorphous glassy bisphenol-A polycarbonate as revealed by gas transport measurements 250
2,5 3,0 3,5
-12
-10
-8
-6
-4
-2
0
aging
O2 N
2He
te = 0
Te = 120oC te = 2h te = 5h te = 10h te = 20h54 te = 36h10 te = 70h40
% p
erm
eanc
e ch
ange
kinetic diameter of the gas (A)
Figure 7.12: Percentage of the permeance change as a function of the kinetic diameter of the penetrant gas in Å for various annealing times at 120oC. The permeation slopes were obtained at 35oC and averaged. The greater the kinetic diameter, the greater the change at long annealing times.
The % change in the permeability coefficient P was calculated for each aging time
te at 120oC. Obviously the results in terms of % corresponded exactly to the ones shown
above for the permeation profile slope since P and the experimental permeation profile
slope are directly correlated (see Chapter 4 for details). What is important to note for
practical applications is that the permselectivity is highly affected by aging. The
permeability coefficient of bigger gas molecules is more reduced by aging than those of
smaller size molecules.
The effects of aging on the diffusion and the solubility coefficients are shown in
Figure 7.13 and Figure 7.14, respectively.
The diffusion coefficient appears to decrease with aging for both O2 and N2. This
observation is in agreement with the literature. Nevertheless, an increase in the diffusion
coefficient with aging can also be distinguished at shorter aging times. This fact will be
discussed later on. The data points suggest that the solubility coefficient may increase
with the logarithm of sub-Tg annealing time. This is not expected since the density
actually increased with aging time, hence indicating a loss of free volume. Since we did

Chapter 7 - Physical aging in amorphous glassy bisphenol-A polycarbonate as revealed by gas transport measurements 251
not change the temperature of the permeation experiments or the interactions between the
gas and the polymer, changes in the solubility coefficient S can only be attributed to
changes in free volume. At this point we think that the increase in the solubility
coefficient S is attributed to a change in the free volume distribution on aging.
1 10 100
-15
-10
-5
0
5
10
te = 0
O2
N2
% D
cha
nge
te (h)
Figure 7.13: Percentage of diffusion coefficient D change as a function of annealing time at 120oC for the gases studied in this research. The permeation slopes were obtained at 35oC and averaged for each gas.

Chapter 7 - Physical aging in amorphous glassy bisphenol-A polycarbonate as revealed by gas transport measurements 252
1 10 100-15
-10
-5
0
5
10
te = 0
O2
N2
% S
cha
nge
te (h)
Figure 7.14: Percentage of solubility coefficient S change as a function of annealing time at 120oC for the gases studied in this research. The permeation slopes were obtained at 35oC and averaged for each gas.
7.3.5.3. Cooling rate / aging results
Polycarbonate samples cooled at different rates and hence with different histories
were aged at Te = 120oC for te = 10h. The change in the permeation profile slope is
shown as a function of the cooling rate in Figure 7.15 for N2. The experimental
permeation profile slopes were found to decrease with 10h of aging at 120oC for all four
samples. Recall, the permeation slope is directly related to the permeability coefficient P.
Therefore the above results mean that the permeability coefficient decreased with aging
as well for the cooling rates selected in this study. In contrast with previous properties
such as density and tan δ showing that the sample containing the greatest amount of free
volume aged faster, Figure 7.15 shows that the permeation of the sample containing an
initial greater free volume content was less affected by aging than the other samples
containing a lower initial free volume content. The permeation of N2 in the sample cooled
by the fan did not actually appear to be affected at all by 10h of aging at 120oC. In
general, the greater the kinetic diameter, the greater the slope decrease.

Chapter 7 - Physical aging in amorphous glassy bisphenol-A polycarbonate as revealed by gas transport measurements 253
-10
-8
-6
-4
-2
0
Te = 120oC, t
e = 10h
fan40100.5
N2
% p
erm
eanc
e ch
ange
cooling rate ( oC/min)
Figure 7.15: Percent in permeance change as a function of the cooling rate for N2 (note that the x-axis is not a continuous axis). The samples had been annealed at 120oC for 10h. The permeation experiments were carried out at 35oC. The applied pressure was taken as 3.9atm for N2.
The responses observed for the diffusion D and the solubility S coefficients of O2
and N2 are shown in Figure 7.16 and Figure 7.17. As mentioned previously, it was not
possible to evaluate D and S for He due to the short value of the time-lag. The diffusion
coefficients of O2 and N2 were found to be increased after 10h at 120oC for the sample
cooled by the fan. However the other three samples did show a decrease in D after the
same time at 120oC. The slower the cooling rate, the greater is the decrease in D. Also,
the diffusion coefficient was found to decrease much more for N2 than for O2. The
solubility coefficient S is expected to relate to the free volume content. The decrease in S
should therefore be highly affected by the initial amount of free volume. And indeed, S
decreased the most for the high free volume material (see Figure 7.17). The behaviors of
O2 and N2 appeared to be quite different though since S was found to increase for some
samples for N2, in contrast with O2 that always probed a decrease in S. S was found to
increase for N2 in samples cooled from 0.5oC/min to 40oC/min (about 6.5% increase for
N2 in the sample cooled at 0.5oC/min after 10h at 120oC).

Chapter 7 - Physical aging in amorphous glassy bisphenol-A polycarbonate as revealed by gas transport measurements 254
-20
-10
0
10
te = 0
Te = 120
oC, t
e = 10h
fan40100.5
O2
N2
% D
cha
nge
cooling rate ( oC/min)
Figure 7.16: Percent in diffusion coefficient change as a function of the cooling rate for the various gases of interest (note that the x-axis is not a continuous axis). The samples had been annealed at 120oC for 10h. The permeation experiments were carried out at 35oC.
-10
-5
0
5
10
te = 0
Te = 120
oC, t
e = 10h
fan40100.5
O2
N2
% S
cha
nge
cooling rate ( oC/min)
Figure 7.17: Percent in solubility coefficient change as a function of the cooling rate for the various gases of interest (note that the x-axis is not a continuous axis). The samples had been annealed at 120oC for 10h. The permeation experiments were carried out at 35oC.

Chapter 7 - Physical aging in amorphous glassy bisphenol-A polycarbonate as revealed by gas transport measurements 255
7.3.5.4. Permeation data discussion
Diffusion and solubility coefficients of O2 and N2 can provide information on the
structural rearrangements and scales taking place in polycarbonate with physical aging.
The average hole size has been determined by two-dimensional angular correlation of
annihilation radiation (2D-ACAR) to be about 2.9Å for polycarbonate [47], thus outside
the range between the size of O2 (3.46Å) and N2 (3.64Å). Nevertheless, the gas
permeation data shown above presented dramatically different behaviors for O2 and N2.
The solubility coefficient S of O2 decreased overall with aging, but the decrease
appeared to remain at rather constant level with aging time (see Figure 7.14). Whereas
the solubility coefficient of N2 showed a decrease at shorter aging times and then actually
tended to increase with aging time after some particular point (see Figure 7.14).
Similarly, the cooling rate / aging studies showed that as the cooling rate decreased, the
solubility coefficient of N2 increased for the same fixed annealing time (see Figure 7.17).
Recall, the solubility coefficient S has been shown to be related to the amount of free
volume (see Chapters 5 and 6).
The fact that the solubility coefficient S of N2 tends to show an increase with
physical aging despite of the decrease in free volume (as seen from the density values)
may reflect the dynamics of the redistribution of free volume and the shape of the free
volume voids. With aging, the size distribution of the cavities may become narrower and
of a size close (but greater) to that of the N2 gas molecule. A rapid reduction in the
amount of larger free volume sites is likely to occur with aging in order to account for the
decrease in the concentration of microvoids. The density has indeed been found to
increase with aging (see Figure 7.2) with (dρ / dlogte) = constant, indicating a loss in the
free volume amount with time. Since the solubility coefficient of O2 appears to remain
rather constant with aging time and that of N2 increases, this seems to indicate that cavity
sizes larger than the size of the N2 gas molecule have to decrease tremendously with
aging time to compensate for the reduction in free volume. The bigger cavities may
decrease in size whereas the small ones may group together to form bigger cavities (new
large cavities could indeed be formed by cavity coalescence). A possible schematic of the

Chapter 7 - Physical aging in amorphous glassy bisphenol-A polycarbonate as revealed by gas transport measurements 256
aging process is provided in Figure 7.18. Spherical cavities are drawn to represent the
fresh sample, but actually the cavities should have a distribution of sizes and shapes. One
needs to be cautious in interpreting the solubility data though, since the data points only
suggest that the solubility coefficient may increase with aging time; the trends remains
ambiguous.
aging
N2 gas molecule
polymer cavities
Figure 7.18:. Schematic of the aging process. With aging the size distribution of the cavities may become narrower and of a size close to that of the N2 gas molecule. The grey matrix corresponds to the polycarbonate, the green spheres to the gas molecules, and the white spheres to the free volume.
On the other hand, the diffusion coefficients of both O2 and N2 decreased with
aging time (see Figure 7.13). Nevertheless, an increase at shorter aging time was also
observed. The cooling rate/aging studies showed that the diffusion coefficient of N2 was
much more reduced than that of O2 in slower cooled samples (see Figure 7.16). An
increase in diffusion coefficients was also seen in the sample cooled by the fan.
The fresh sample cooled at 40oC/min may initially contain conformations of the
trans-trans and trans-cis types. It has been shown in the literature that with sub-Tg
annealing in polycarbonate the population of trans-trans conformers increases whereas
that of trans-cis conformers decreases [1, 48]. And from the conclusions reached in
Chapter 6, it seems that the polymer chains in the trans-trans conformation can vibrate at
a greater frequency than those in the trans-cis conformation (at least in the freshly
40oC/min-cooled samples, and also possibly in the initial stages of aging), hence creating

Chapter 7 - Physical aging in amorphous glassy bisphenol-A polycarbonate as revealed by gas transport measurements 257
fluctuations large enough to allow the passage of a gas molecule from one cavity to
another and resulting in a greater diffusion coefficient. The degrees of freedom associated
with the trans-trans conformations may be lost with further sub-Tg annealing. An increase
in relaxation times is indeed observed with physical aging [17]. This would induce a
reduction in segmental mobility and thus in the diffusion coefficient, as seen here.
As far as the cooling rate / aging studies are concerned, the slowly cooled sample
was already mainly in the lowest energy conformation, namely the trans-trans
conformation. As the sample is annealed, more and more degrees of freedom or
fluctuations within a limited range around the minimum are lost, hence resulting in a
reduced diffusion coefficient. The polymer chains may even become capable of lying
parallel to one another on a local level and decrease this distance with time. If indeed
bigger cavities are formed with sub-Tg annealing as suggested above, this would mean
that the distance between the chains keeps decreasing with time, and may even become
too narrow to allow large kinetic diameter gas molecules (such as N2) to go through the
polymer rapidly. This high concentration of locally oriented chains (corresponding to
local density fluctuations) could possibly act as an obstacle for the gas molecule, which
would have to contour the obstacles, and therefore increase the diffusion path length by a
tortuosity factor, as seen in the diffusion process through semi-crystalline polymers. The
aging phenomenon would resemble a crystallization process, but on a greater length
scale. In contrast, the sample cooled by the fan may increase the population of trans-trans
conformers at early aging times. Again, from the conclusions reached in Chapter 6, this
would imply an enhanced diffusion coefficient. This could explain the enhanced diffusion
coefficient seen after 10h at 120oC.
Please note that in the case of deaging effects the diffusion coefficient would be
expected to decrease and not to increase. Therefore this reinforces the idea that the first
data points of Figure 7.13 and Figure 7.16 could not be attributed to deaging effects. No
deaging effects could be seen either on the density measurements.
The fact that P appeared to decrease with aging for all the gases (see Figure 7.11)
even though the behaviors of D and S were opposite is attributed to the fact that D has a

Chapter 7 - Physical aging in amorphous glassy bisphenol-A polycarbonate as revealed by gas transport measurements 258
greater influence on P than S [49-51]. And indeed, the quantitative absolute decreases in
D appeared to be greater than those in S (see Figure 7.13 and Figure 7.14).
Quite interestingly, the permeability coefficient was found to decrease more after
10h at 120oC for the sample initially cooled at 0.5oC/min than for the one initially cooled
by the fan, despite of the lower free volume content in the slowly cooled sample. In
contrast, properties directly related to the free volume content, such as density or
isothermal DMTA measurements actually showed a greater aging rate in the sample
containing the greatest amount of free volume (see above). This observation proves that
once again the permeability coefficient should not be directly correlated with the free
volume content of the material, as already discussed in Chapters 5 and 6. The fact that the
permeability coefficient shows a different behavior than properties more related to the
macroscopic level (such as density) should be considered for future industrial
applications. The difference may originate in part from cooperativity concepts. Although
the gas transport process is not believed to require cooperativity but rather extremely
local rearrangements, other properties may require cooperative motions. And a greater
decrease in the free volume content is likely to necessitate an enhanced number of
segments to relax together, hence a greater cooperativity. A minimum free volume
content may indeed be needed to enable cooperative motions to take place.
To summarize, the gas permeation results suggest that with sub-Tg annealing the
polymer chains may rearrange their conformations and thereafter loose progressively
their degrees of freedom. The size distribution of the cavities may also become narrower
and of a size close to that of the N2 gas molecule.
The above conclusions are in agreement with the results of Neki and Geil [52] on
the physical aging of polycarbonate. The researchers reported that the surface of
polycarbonate initially appeared by electron micrographs to have various cavity sizes and
shapes. With aging in the glassy state those cavities were becoming well-defined and
with similar sizes. However the question remained if this phenomenon was actually
taking place with aging or if the results were artifacts of the etching process used by the
researchers.

Chapter 7 - Physical aging in amorphous glassy bisphenol-A polycarbonate as revealed by gas transport measurements 259
The possibility that bigger cavities are formed with aging in polycarbonate would
agree with the conclusions of Curro and Roe using small-angle X-ray scattering (SAXS)
[4]. The fact that SAXS results indicated an increase in the average free volume hole size
of polycarbonate with sub-Tg annealing time [4], and positron annihilation lifetime
spectroscopy (PALS) and photochromic probe results a constant free volume hole size
with aging [6-12] may be caused by the differences in the probing ranges of the
techniques. The average hole size in one technique may represent a different value than
the average in another one. And therefore the behavior may appear as different depending
on where the average is located. In this research for instance, if the initial average size
corresponds to the size of N2 (3.64Å), the average size may appear as constant with
aging. Whereas an initial average size of about 3Å would appear to become increased
with aging time. Finally, giving an average is always discutable since it does not reflect
the distribution.
If the bigger cavities are indeed disappearing first with sub-Tg annealing in order
to account for the densification process, this may in part elucidate why enthalpy and
volume relaxation rates are different [16, 53]. It has been established that the domain
sizes for volume relaxation are greater than those for enthalpy relaxation, based on the
difference in activation energies [54]. Only cavity sizes above a critical size may
contribute to volume relaxation. Therefore, at some particular aging time the bigger
cavities may have all disappear and no change in volume can be easily observed by non-
sensitive enough dilatometers. Nevertheless, some molecular motions can keep
contributing to the enthalpy relaxation.
The fact that published data concerning physical aging have shown a decrease in
the sorption properties of the polymer with aging, thus in contrast with the N2 data shown
in this work, may be caused by the conditions chosen by the researchers. The problems
associated with the sorption process have been discussed in Chapter 3.
The fact that the samples cooled slowly and thus containing the lowest amount of
free volume show a greater decrease in the permeability coefficient with sub-Tg annealing
seems somehow similar to the “mobility paradox” observed for annealed oriented
samples [55, 56]. Shelby and co-workers [57] have distinguished two types of trends as
hot-drawn polycarbonate is aged below Tg. On one hand, the properties related to the α-

Chapter 7 - Physical aging in amorphous glassy bisphenol-A polycarbonate as revealed by gas transport measurements 260
type of motions (such as creep aging rate and Tg) are observed to become less mobile
with aging time compared to those of isotropic samples. On the other hand the properties
related to the β-type of motions (such as volume relaxation rate) show a greater mobility
with aging time. As a recall, the α and the β relaxations have different origins. The α-
relaxation occurring around Tg corresponds to long-range or large scale motions and is a
cooperative phenomenon involving several polymer segments. Whereas the β-relaxation
corresponds only to localized motions which may involve the repeat unit of
polycarbonate only. Moreover the β-relaxation can be described by an Arrhenius-type
equation, but the α-relaxation not [58]. The density of uniaxially hot-drawn
polycarbonate was found to increase with stretching, hence indicating a lower free
volume content [55, 56]. The fact that a property can show a greater mobility with aging
for oriented materials is rather unexpected since usually one associates a greater physical
aging rate with a greater free volume content, and thus a greater mobility. Solid state 1H-
NMR and dynamic mechanical measurements (DMA) were used by the researchers to
probe the motions of the polymer chains [57]. The mobility paradox was explained in
terms of the increased size of the cooperative domains associated with the α-relaxation
with stretching versus the increased number of localized relaxing segments caused by the
larger ellipsoidal holes created from the orientation process and which provide additional
space for the samples to relax (then linked with the β-relaxation). Quite interestingly, the
volume relaxation rates were not found to be a function of the degree of orientation, but
instead on whether the samples had been stretched or not [57]. It has been shown in the
literature that the timescale of conformational rearrangements is similar to that of
volumetric relaxation for isotropic polycarbonate [59]. However the timescale of
enthalpy relaxation was found to be greater for the same samples [59]. A modification of
the interchain interactions without a change in population with sub-Tg annealing has been
suggested in order to explain the greater timescale of the enthalpic relaxation [59]. The
important fact here is that conformational rearrangements and volumetric relaxation are
linked. If one applies this conclusion to the results obtained by Shelby and co-workers
[57], this suggests that the conformation of the polycarbonate chains changes only as the
sample is initially stretched. Another unexpected behavior has been reported in the
literature [60]. When polycarbonate samples are aged for 50min at 20.3oC and for about

Chapter 7 - Physical aging in amorphous glassy bisphenol-A polycarbonate as revealed by gas transport measurements 261
100min at 22.5oC, the stress relaxation occurs more rapidly at the lower temperature at
the point at which both samples possess the same overall free volume content.
7.3.5.5. Activation energies
In order to confirm recent data published in the literature showing a decrease in
the activation energy of diffusion with aging for polycarbonate [61], gas transport
activation energies were determined at 120oC for the samples aged as a function of time.
The permeation temperatures were taken in a narrow temperature window in order to
avoid aging and/or deaging, although such a reduced temperature range may have
increased the errors associated with the gas transport properties. Gas transport activation
energies are shown below from Figure 7.19 to Figure 7.21. Please note that the results
obtained for the fresh membrane were obtained by permeating gases at 35oC only once.
In contrast, aged membranes were run twice at 35oC (fresh + aged).
The activation energy of permeation EP appeared to remain relatively constant
with aging for the three gases selected (see Figure 7.19). Obviously, the greater the
kinetic diameter of the gas molecules, the greater the activation energy. ED and ∆Hs
appeared to remain constant with aging for O2, but changed tremendously for N2 (see
Figure 7.20 and Figure 7.21). A possible explanation for the increase in ED is that the
increase in the relaxation times with aging [17] requires more energy to dilate the chains
and enable the diffusion process to take place. It is well-established indeed that physical
aging involves relaxation processes. Explanations based on the free volume content alone
[62] seem indeed invalid in light of the results presented in Chapters 5 and 6.
The fact that ED increased with aging time is in contradiction with the recent
published results of Pekarski and co-workers on the physical aging of polycarbonate [61].
ED was found to be lower in an aged sample than in a conditioned one. As explained in
Chapter 3, caution is however needed in interpreting the sorption results obtained with
carbon dioxide. In addition, only two data points were obtained by the researchers (aged
versus conditioned). More data points should have been collected to be able to identify a
significant trend.

Chapter 7 - Physical aging in amorphous glassy bisphenol-A polycarbonate as revealed by gas transport measurements 262
1 10 100
15000
20000
25000
fresh
He O
2
N2
EP (
J/m
ol)
log te (h)
Figure 7.19: EP as a function of annealing time at 120oC for the gases studied in this research. The permeation experiments were carried out at 35, 40, 45, and 55oC. At te = 2h, permeation experiments were carried out for N2 only.
1 10 100
30000
40000
50000
60000
fresh
O2
N2
ED (
J/m
ol)
log te (h)
Figure 7.20: ED as a function of annealing time at 120oC for the gases studied in this research. The permeation experiments were carried out at 35, 40, 45, and 55oC. At te = 2h, permeation experiments were carried out for N2 only.

Chapter 7 - Physical aging in amorphous glassy bisphenol-A polycarbonate as revealed by gas transport measurements 263
1 10 100
-40000
-30000
-20000
-10000
fresh
O2
N2∆
Hs
(J/m
ol)
log te (h)
Figure 7.21: ∆Hs as a function of annealing time at 120oC for the gases studied in this research. The permeation experiments were carried out at 35, 40, 45, and 55oC. At te = 2h, permeation experiments were carried out for N2 only.
7.3.5.6. Other
Attempts were made to observe memory effects by gas permeation measurements.
As seen previously from DMTA results, when a polymer is heated to a temperature
greater than Te but still below Tg, the polymer deages first before aging with further time.
These memory effects have been attributed to the distribution of relaxation times [43].
The slope of the permeation profile is expected to decrease at Te until equilibrium. Once
the temperature is increased to a temperature above Te but still below Tg, the permeation
slope may first increase at short aging times, and then decrease again with further aging.
Moreover, it has been shown in the literature that temperature jump studies are
characterized by a nonlinear response [15]. The response observed by a +∆T jump is
indeed different from the one seen by a -∆T jump (see Chapter 3 for more details). A
nonlinear response could also be observed in permeation experiments. The % slope
change should be plotted as a function of time for positive and negative changes in
temperature (the y-axis would be at te = 0 with negative and positive x-axis). Taking

Chapter 7 - Physical aging in amorphous glassy bisphenol-A polycarbonate as revealed by gas transport measurements 264
different temperatures should also affect the response. It has indeed been shown in the
literature that the path to equilibrium is different depending on the temperature [15].
Unfortunately, the permeation experiments were unsuccessful. The membranes were
refreshed after aging in order to simplify the thermal history, but changes in thickness
made comparisons between samples impossible.
7.4. Conclusions
This study was concerned with the effect of physical aging on the gas transport
properties. Polycarbonate samples with a well-defined thermal history were aged at
120oC and the gas transport properties were evaluated as a function of aging time. In
addition, the effect of the cooling rate on the physical aging process was examined after
10h at 120oC. The use of gas permeation has been proven to be a versatile tool in
providing a deeper fundamental understanding of the aging phenomena. This study
showed that the permeability coefficient of molecules, the size of N2, was more affected
by aging that that of smaller size molecules. The diffusion coefficients of both O2 and N2
were observed to initially increase at short aging times and to decrease with further sub-
Tg annealing. In contrast, the solubility coefficient of N2 (and that of O2 as well but to a
smaller extent) was observed to increase with further aging time. Properties directly
related to the free volume content of the polymers, such as density and DMTA
measurements, were observed to age faster when the initial content of free volume in the
materials was high. In contrast, the permeability coefficient was observed to be reduced
the most with aging for polycarbonate samples possessing an initial lower free volume
amount. Actually, the permeability coefficient of a sample cooled in excess of 40oC/min
appeared to be almost unaffected by aging after 10h at 120oC. However the diffusion and
the solubility coefficients were highly affected by aging for this particular sample. The
trends seen in aging / cooling rate studies were similar to those observed for samples
studied as a function of time, i.e. a decrease in the diffusion coefficient and an increase in
the solubility coefficient as the initial free volume content is reduced.
The gas transport results suggest that on sub-Tg annealing the polycarbonate
chains may adopt the trans-trans conformation (possibly fluctuating more rapidly than the

Chapter 7 - Physical aging in amorphous glassy bisphenol-A polycarbonate as revealed by gas transport measurements 265
trans-cis conformation around the minima) and loose progressively their degrees of
freedom. The free volume distribution may become narrower and favor the formation of
cavities of a size similar (but greater) to that of the N2 gas molecule. The increase in the
activation energy of diffusion with aging time was explained in terms of the increase in
the relaxation times.
For practical purposes, this study points out that gas transport properties are
affected by physical aging in a different way than for instance the density. The greater the
initial free volume amount in polycarbonate, the greater is the densification rate, but the
lower is the decrease in the permeability coefficient with aging time. This observation
proves that the permeability coefficient should not be directly correlated with the free
volume content of the material, but rather with the molecular chain dynamics. This also
suggests that the various “static” models of gas diffusion in polymers are inappropriate.
7.5. References
1. N. Heymans, FTIR investigation of structural modification of polycarbonate during thermodynamical treatments, Polymer, 38, 14, 3435 (1997).
2. V. Stolarski, A. Letton, S. N. Lee, J. Laane, Conformational changes and physical aging in bisphenol-A polycarbonate; origins of mechanical properties, Polym. Mater. Sci. Eng., 71, 479-480 (1994).
3. V. Stolarski, A. Letton, E. Nour, J. Laane, Conformational changes and physical aging in bisphenol-A polycarbonate; origins of mechanical properties, ANTEC’94, 2077 (1994).
4. J. J. Curro and R.-J. Roe, Isothermal relaxation of specific volume and density fluctuation in poly(methyl methacrylate) and polycarbonate, Polymer, 25, 1424 (1984).
5. J. H. Wendorff, J. Polym. Sci., Polym. Lett. Ed., 17, 765 (1979). 6. A. J. Hill, I. M. Katz and P. L. Jones, Isothermal volume relaxation in aged
polycarbonate measured by positron annihilation lifetime spectroscopy, Polymer Enginering and Science, 30, 13, 762 (1990).
7. T. C. Sandreczki, X. Hong, and Y. C. Jean, Sub-glass-transition-temperature annealing of polycarbonate studied by positron annihilation spectroscopy, Macromolecules, 29, 4015-4018 (1996).
8. A. J. Hill, C. M. Agrawal, Positron lifetime spectroscopy characterization of thermal history effects on polycarbonate, Journal of Materials Science, 25, 5036-5042 (1990).
9. J. E. Kluin, H. Moaddel, M. Y. Ruan, Z. Yu, A. M. Jamieson, R. Simha, J. D. McGervey, Probe spectroscopy, free volume concepts, and physical aging of

Chapter 7 - Physical aging in amorphous glassy bisphenol-A polycarbonate as revealed by gas transport measurements 266
polymer glasses, in Structure-property relations in polymers: spectroscopy and performance, ACS, 236, 535-555 (1993).
10. T. C. Sandreczki, X. Homg, and Y. C. Jean, Sub-glass-transition temperature annealing of polycarbonate studied by positron annihilation spectroscopy, Macromolecules, 29, 4015-4018 (1996).
11. J. E. Kluin, Z. Yu, S. Vleeshouwers, J. D. McGervey, A. M. Jamieson, R. Simha, Temperature and time dependence of free volume in bisphenol A polycarbonate studied by positron lifetime spectroscopy, Macromolecules, 25, 19, 5089 (1992).
12. J. S. Royal and J. M. Torkelson, Photochromic and fluorescent probe studies in glassy polymer matrices. 5. Effects of physical aging on bisphenol-A polycarbonates and poly(vinyl acetate) as sensed by a size distribution of photochronic probes, Macromolecules, 25, 4792 (1992).
13. L. B. Liu, D. Gidley, A. F. Yee, Effect of cyclic stress on structural changes in polycarbonate as probed by positron annihilation lifetime spectroscopy , Journal of Polymer Science: Part B: Polymer Physics, 30, 231 (1992).
14. L. M. Costello and W. J. Koros, Temperature Dependence of Gas Sorption and Transport Properties in Polymers: Measurements and Applications, Industrial Engineering Chemical Research, 31, 2708 (1992).
15. A. J. Kovacs, Transition vitreuse dans les polymeres amorphes- Etude phenomenologique, Fortschr. Hochpolym.- Forsch., 394-507 (1963).
16. J. M. Hutchinson, Physical aging of polymers, Prog. Polym. Sci. , 20, 703 (1995). 17. L. C. E. Struik, Physical aging in amorphous polymers and other materials,
Elsevier, New York, 1978. 18. M. R. Tant and G. L. Wilkes, An overview of the nonequilibrium behavior of
polymer glasses, Polymer Engineering and Science, 21, 14, 874 (1981). 19. J. M. Hutchinson, Relaxation processes and physical aging, in The Physics of
Glassy Polymers, edited by R. N. Haward and R. J. Young, Chapman & Hall, London, 1997.
20. R. P. Chartoff, Thermoplastic polymers, in Thermal characterization of polymeric materials, E. A. Turi, edt, Academic Press, NY, 548-573 (1997).
21. L. C. E. Struik, Aging, Physical, Encyclopedia of Polymer Science and Engineering, vol 1, 595-611, Wiley, NY (1985).
22. J. M. O'Reilly, Review of structure and mobility in amorphous polymers, CRC critical reviews in solid state and materials sciences, 13, 3, 259-277 (1987).
23. J. Mijovic, L. Nicolais, A. D’Amore, J. M. Kenny, Principal features of structural relaxation in glassy polymers- A review, Polymer Enginering and Science, 34, 5, 381 (1994).
24. S, Matsuoka, Free volume, excess entropy and mechanical behavior of polymeric glasses, Polymer Engineering and Science, mid-october, 21, 14, 907-921 (1981).
25. J.-C. Bauwens, Physical aging: relation between free volume and plastic deformation, in Failure of plastics, W. Brostow and R. D. Corneliussen, edts, Hanser Publishers, Munich (1986).
26. L. C. E. Struik, Physical aging: influence on the deformation behavior of amorphous polymers, in Failure of plastics, W. Brostow and R. D. Corneliussen, edts, Hanser Publishers, Munich (1986).

Chapter 7 - Physical aging in amorphous glassy bisphenol-A polycarbonate as revealed by gas transport measurements 267
27. R. Wimberger-Friedl and J. G. de Bruin, The very long-term volume recovery of polycarbonate: is self-retardation finite? Macromolecules, 29, 4992-4997 (1996).
28. U. Kriesten and J. M. Hutchinson, On the use of a density gradient column to monitor the physical ageing of polystyrene, Polymer, 33, 22, 4875-4877 (1992).
29. T. Murayama, Dynamic mechanical analysis of polymeric materials, Elsevier, NY, 1978.
30. Edith A. Turi, Editor, Thermal characterization of polymeric materials, Academic Press, New York, 1981. 2nd Edition, vol 1, 1997.
31. G. L. Wilkes, Polymers, Mechanical behavior, Encyclopedia of physical science and technology, vol 11, 61-84.
32. M. Trznadel, T. Pakula, M. Kryszewski, Polymer, 29, 619 (1988). 33. C. Bauwens-Crowet, J. C. Bauwens, Polymer, 24, 921 (1983). 34. A. F. Yee and S. A. Smith, Macromolecules, 14, 54-64 (1981). 35. T. G. Fox and P. J. Flory, J. Am. Chem. Soc., 70, 2384 (1948). 36. T. G. Fox and P. J. Flory, J. Appl. Phys., 21, 581 (1950). 37. A. H. Chan and D. R. Paul, Effect of sub-Tg annealing on CO2 sorption in
polycarbonate, Polymer Enginering and Science, 20, 1, 87 (1980). 38. A. J. Hill, K. J. Heater, C. M. Agrawai, The effects of physical aging in
polycarbonate, Journal of Polymer Science: Part B: Polymer Physics, 28, 387 (1990).
39. H. Hachisuka, Y. Tsujita, A. Takizawa, T. Kinoshita, CO2 properties and enthalpy relaxation in alternating copoly(vinylidene cyanide-vinyl acetate)s, Polymer, 29, 2050 (1988).
40. R. A. Pethrick, Physical aging – an old problem revisited, TRIP, 1, 8, 226-227 (1993).
41. T. W. Cheng, H. Heskkula, and D. R. Paul, Thermal aging of impact-modified polycarbonate, Journal of Applied Polymer Science, 45, 531-551 (1992).
42. C. R. Schultheisz and G. B. McKenna, Volume recovery and physical aging in glassy polycarbonate following temperature jumps, Polymeric materials science and engineering, ACS, 76, 221 (1997).
43. S. Matsuoka, Relaxation phenomena in polymers, Hanser Publishers, NY, 1992. 44. W. J. Davis and R. A. Pethrick, Investigation of physical ageing in
polymethylmethacrylate using positron annihilation, dielectric relaxation and dynamic mechanical thermal analysis, Polymer, 39, 2, 255 (1998).
45. M. L. Cerrada and G. B. McKenna, Physical aging of amorphous PEN: isothermal, isochronal and isostructural results, Macromolecules, 33, 3065-3076 (2000).
46. M. M. Santore, R. S. Duran, G. B. McKenna, Volume recovery in epoxy glasses subjected to torsional deformations: the question of rejuvenation, Polymer, 32, 13, 2377 (1991).
47. Y. C. Jean, Y. Rhee, Y. Lou, D. Shelby, G. L. Wilkes, Anisotropy of hole structures in oriented polycarbonate probed by two-dimensional angular correlation of annihilation radiation, Journal of Polymer Science: Part B: Polymer Physics, 34, 2979-2985 (1996).
Chapter 7 - Physical aging in amorphous glassy bisphenol-A polycarbonate as revealed by gas transport measurements 268
48. J. Lu, Y. Wang, and D. Chen, Infrared spectroscopic and modulated differential scanning calorimetry study of physical aging in bisphenol-A polycarbonate, Polymer Journal, 32, 7, 610-615 (2000).
49. Y. Maeda and D. R. Paul, Effect of AntiPlasticization on Gas Sorption and Transport. III. Free Volume Interpretation, Journal of Polymer Science: Part B: Polymer Physics, 25, 1005 (1987).
50. J. M. Mohr, D. R. Paul, G. L. Tullos, and P. E. Cassidy, Gas transport properties of a series of poly(ether ketone) polymers, Polymer, 32, 13, 2387-2394 (1991).
51. J. S. McHattie, W. J. Koros and D. R. Paul, Gas transport properties of polysulphones: 1. Role of symmetry of methyl group placement on bisphenol rings, Polymer, 32, 5, 840-850 (1991).
52. K. Neki and P. H. Geil, Morphology – Property studies of amorphous polycarbonate, J. Macromol. Sci.- Phys., B8(1-2), 295-341 (1973).
53. S. L. Simon, D. J. Plazek, B. J. Harper, and T. Holden, Physical aging of polystyrene: volume and enthalpy recovery, PSME Preprints, 76, 334 (1997).
54. T. S.-K. Lo, M. S. Thesis, University of Cincinnati, Cincinnati, OH (1978). 55. M. D. Shelby and G. L. Wilkes, Thermodynamic characterization of the oriented
state of bisphenol A polycarbonate as it pertains to enhanced physical aging, Journal of Polymer Science: Part B: Polymer Physics, 36, 2111 (1998).
56. M. D. Shelby and G. L. Wilkes, The effect of molecular orientation on the physical ageing of amorphous polymers - dilatometric and mechanical creep behaviour, Polymer, 39, 26, 6767-6779 (1998).
57. M. D. Shelby, A. J. Hill, M. I. Burgar, G. L. Wilkes, The effects of molecular orientation on the physical aging and mobility of polycarbonate – solid state NMR and dynamic mechanical analysis, Journal of Polymer Science: Part B: Polymer Physics, 39, 32-46 (2001).
58. J. J. Aklonis, W. J. MacKnight, M. Shen, Introduction to polymer viscoelasticity, Wiley-Interscience, NY, 1972.
J. J. Aklonis and W. J. MacKnight, Introduction to polymer viscoelasticity, 2nd edition, John Wiley & Sons, NY, 1983.
59. N. Heymans and B. Dequenne, Relationship between conformation and enthalpy or volume relaxation in polycarbonate, Polymer, 42, 5337-5342 (2001).
60. H. Higuchi, Z. Yu, A. M. Jamieson, R. Simha, and J. D. McGervey, Thermal history and temperature dependence of viscoelastic properties of polymer glasses: relation to free volume quantities, Journal of Polymer Science: Part B: Polymer Physics, 33, 2295-2305 (1995).
61. P. Pekarski, J. Hampe, I Böhm, H.-G. Brion, and R. Kirchheim, Effect of aging and conditioning on diffusion and sorption of small molecules in polymer glasses, Macromolecules, 33, 2192-2199 (2000).
62. Y. Yampolskii, S. Shishatskii, A. Alentiev, K. Loza, Correlations with and prediction of activation energies of gas permeation and diffusion in glassy polymers, Journal of Membrane Science, 148, 59-69 (1998).

Chapter 8
Effect of orientation on the transport of gas molecules
through amorphous glassy bisphenol-A polycarbonate
8.1. Introduction
Knowledge of the effect of orientation on gas transport is more than necessary
since commercial films are always oriented to some degree. Such knowledge would make
it possible to optimize the properties of the polymeric materials. A literature review
concerning orientation and gas transport has been provided in Chapter 3. The few results
reported in the literature suggest that the influence of orientation on the gas transport
parameters is rather complex. Since the permeability coefficient is the product of a
solubility and a diffusion coefficients, the contribution of orientation on both parameters
has to be evaluated separately. As a sample is stretched uniaxially, the polymer chains
orient themselves in the draw direction and the sample becomes anisotropic. Two-
dimensional angular correlation of annihilation radiation (2D-ACAR) has been used to
give information on the structure of the microvoids dispersed inside a polycarbonate
matrix [1]. The hole structure has been shown to become ellipsoidal with uniaxial
orientation, whereas it was spherical in unoriented samples. The radius of the sphere was
determined to be about 2.9 Å, whereas the radii of the ellipsoid axis were 2.3 Å and 3.8

Chapter 8 - Effect of orientation on the transport of gas molecules through amorphous glassy bisphenol-A polycarbonate 270
Å. The corresponding Herman’s orientation function was 0.2. Changes in the shape of the
microvoids may affect the diffusion coefficient. We expect that the diffusion coefficient
will be affected by the orientation process, because of the orientational and
conformational changes of the polymer chains induced by drawing.
This study is aimed at providing some information on the effect of orientation on
the gas transport parameters. Polycarbonate will be stretched both below and above Tg.
The resulting orientation is referred to as cold-drawing and hot-drawing, respectively.
Hot-drawing is simpler in the sense that it avoids complications arising from residual
stresses. Stretching a polymer below Tg slightly changes the intermolecular distances
between bond angles and lengths of the polymer backbone. The bond angles are slightly
increased because of the restricted rotations between bonds. Some level of distortional
birefringence can be observed [2]. The stretching temperatures were chosen as 130oC
(cold-drawing), and 160oC and 180oC (hot-drawing), which are in the vicinity of the Tg of
polycarbonate, which is about 150oC. The temperature of 160oC was selected in this
study because some orientation studies have already been carried out at that particular
temperature [1-4]. This should allow us to compare our results with those published
elsewhere. The temperature of 180oC was chosen in order to possibly achieve the global
orientation–local random (GOLR) state in the amorphous polycarbonate. This particular
state corresponds to a high global chain orientation but to a nearly random local
segmental orientation. The GOLR state of polycarbonate has been shown to exist at
temperatures of about 20 to 30oC above Tg [5], and had a corresponding birefringence on
the order of 10-4. Song and Fan [5] observed that although some properties of the
polycarbonate samples such as birefringence, linear dichroism, and X-ray diffraction
pattern were nearly isotropic at the GOLR state, other properties such as thermal
expansion, solvent-swelling, and stress-strain behavior showed strong anisotropic
behaviors. The difference in the property behaviors was attributed to the difference in the
relaxation rates of the oriented chains versus the local polymer units. It would be
interesting to determine whether or not gas transport properties are affected by this
GOLR state and to compare the gas transport results with other physical properties. Since
gas transport should affect only a local portion of the polymer chains, if there is any

Chapter 8 - Effect of orientation on the transport of gas molecules through amorphous glassy bisphenol-A polycarbonate 271
difference between the sample in the GOLR state and an isotropic sample, the difference
could be possibly attributed to conformational changes.
To our knowledge, the effects of orientation on polymer physical aging and the
corresponding gas transport properties of polymers have not been examined in the
literature. Using gas transport should provide information on how physical aging is
affected by orientation from a molecular point of view. Indeed, as discussed in Chapter 3,
inconsistencies in the free volume theory have been reported for uniaxially oriented
amorphous glassy polymers subjected to aging [2-4, 6-9].
8.2. Experimental details
The following subsections mention briefly the materials and the instrumental
methods used in this study. The complete experimental details have been provided in
Chapter 4. The reader should refer to this particular chapter for deeper understanding of
the materials and the instrumental methods used in this research.
8.2.1. The materials
Lexan 8010 bisphenol-A polycarbonate sheets were ordered from General
Electric (GE). The weight average molecular weight Mw was determined by GPC to be
about 43,700 g/mol and the polydispersity index about 2.1. The glass transition
temperature was given as 150oC by the supplier, as obtained by DSC from the second
heating scan at a heating rate of 10oC/min. The density was given as 1.2 g/cm3 at 20oC.
The molecular weight was believed to be high enough to prevent crystallization from
happening because of the entanglement effects. Please note that it was not possible to
process polycarbonate films from pellets by hot press in this study. Films processed by
compression molding were not flat through the whole surface area of the hot plates and
this difference in thickness affected the film during stretching. Moreover, the surface area
of the hot press was not large enough to make stretched films for further permeation

Chapter 8 - Effect of orientation on the transport of gas molecules through amorphous glassy bisphenol-A polycarbonate 272
experiments. The permeation set-up required indeed bubble-free polymeric circles of
diameter 4.8cm.
The polymeric sheets were kept in a dessicator at all time after purchase in order
to avoid any more water moisture uptake. Prior to experiments, the polymeric sheets were
dried at room temperature for one day in a vacuum oven. It was not recommended to heat
the GE polycarbonate at higher temperatures for a prolonged time because of the possible
reaction of the polymeric components. Indeed, Lexan can react easily at high temperature
to give rise to “fries rearrangement”, involving the formation of small branches [10].
Following drying the sheets were put between Kapton® sheets and copper metal plates, as
explained in Chapter 4. The metal plates were suspended in the center of a circulating air
gas chromatograph (GC) oven to improve heat transfer on both sides of the plates. The
samples were heated in the GC oven from room temperature to 165oC at a heating rate of
40oC/min, kept at 165oC for 15min to remove thermal history and possible orientation,
and cooled within the oven at a controlled rate of 40oC/min to room temperature. The
room temperature was about 30oC. The polymer films were used immediately.
The thicknesses of the initial sheets (before stretching) were about 190µm.
8.2.2. The instrumental methods
Stretching, density, FTIR, birefringence, DMTA, and permeation conditions are
presented below.
8.2.2.1. Stretching
A stretcher was built in the Physics Department of Virginia Tech based on the
design of the one used in Dr. Wilkes’ lab in the Chemical Engineering Department at
Virginia Tech. A schematic of the stretcher used in this research is provided in Figure
8.1. The stretched surface area required for permeation experiments necessitated very
large samples, which could not be stretched with commercially available Instron
equipment on campus.

Chapter 8 - Effect of orientation on the transport of gas molecules through amorphous glassy bisphenol-A polycarbonate 273
The stretcher was placed in an oven insulated by aluminium metal plates to limit
heat loss. A thermocouple was attached to the system to read the temperature inside the
oven near the grips of the stretcher. The oven was heated to the desired stretching
temperature. The heating process of the system consisting of the stretcher and the oven
took at least one hour, but usually the oven was heated overnight to allow the temperature
to reach equilibrium. The temperature gradient inside the oven at the grips level was
found to be negligible. As written before, the stretching temperatures in this study were
chosen as 130oC (cold-drawing), and 160oC and 180oC (hot-drawing). Some films
stretched at other temperatures than the ones given above will also however be shown in
the section dealing with the DMTA results.
Polycarbonate samples were cut into rectangular shapes. The samples had to be at
least 10cm long, but the width could vary. Nevertheless the wider the width, the more
difficult the stretching process. Furthermore, whitening of the material in the transverse
direction was observed on stretched samples with a large width. This whitening was not
however attributed to strain-induced crystallization, but rather to a change in refractive
index with void formation [11]. An approximate length to width ratio was determined to
avoid loosing transparency at all time. A ratio of three between the length and the width
was verified for the samples. Lines were drawn on the polycarbonate samples with
waterproof ink every 5mm. The distance between these lines after stretching provided
information about the draw ratio.
The stretching was performed as follows. Once the temperature in the oven had
been established, the stretcher was taken out of the oven and the film was rapidly placed
between the two grips. The stretcher was then put back in the oven. Ten minutes were
allowed for temperature equilibrium of the system, and stretching was performed for
about one minute at a constant overhead speed. This overhead speed (in turns/min) varied
from one sample to another in order to achieve various draw ratios. Obviously, the
stretching was performed without opening the oven and thus without disturbing the
temperature inside the oven. Please note that the stretching rate was not constant since the
initial length lo was changing throughout the stretching. Indeed, if one calculates the draw

Chapter 8 - Effect of orientation on the transport of gas molecules through amorphous glassy bisphenol-A polycarbonate 274
ratio, which corresponds to the ratio of the length at some time divided by lo, lo changes
its value for each time increment ∆t. The stretching rate corresponded actually to an
exponential decay. When undrawn isotropic samples were to be studied, samples were
left for eleven minutes inside the oven. This ensured that the same thermal treatment was
given to unoriented samples. This time was believed to be small enough to avoid any
form of aging (in the case of cold-drawing) or crystallization (in the case of hot-drawing)
in the unstretched polycarbonate film. A drill and a variable autotransformer were
initially used to control the speed at which the samples were stretched uniaxially.
However the speed could not be controlled uniformly. As a consequence, it was decided
to turn the stretcher by hand at a uniform rate. As soon as the stretching was completed,
the thermocouple and the metal plates were removed, the stretcher was taken out of the
oven, and the specimen was immediately cooled by blowing air to freeze-in orientation.
The cooling rate was maintained constant and was evaluated to be in excess of 50oC/min,
in agreement with values reported in the literature for a typical fan [12]. It should be
pointed out that oriented samples may have cooled faster than isotropic ones because of
the reduced thickness. No correction was considered in this study to account for the
differences in the cooling rates. The time needed after stretching and before cooling was
evaluated to be about five seconds. This corresponded to the time needed to remove the
parts attached to the oven, to put the stretcher on the laboratory bench, and to start the
fan. This time was assumed to be short enough to prevent the polymer chains from
completely relaxing. Cooling was performed for at least five minutes on the specimen
under constant stress. The film was finally removed from the apparatus. A schematic of
the stretching process is shown in Figure 8.2. The appearance of the films before and
after stretching is sketched in Figure 8.3. The distance between the lines after stretching
provided information about the draw ratio. Circles drawn on the specimen prior to
drawing became ellipsoidal after stretching.

Chapter 8 - Effect of orientation on the transport of gas molecules through amorphous glassy bisphenol-A polycarbonate 275
Figure 8.1: Schematic of the stretcher.
oven &stretcherat Tstretch
freshsample
1 minat constant
overhead speed
10 min
11 min
Sampleremovedfrom thestretcher
controlledcooling rate
Figure 8.2: Schematic of the stretching process.

Chapter 8 - Effect of orientation on the transport of gas molecules through amorphous glassy bisphenol-A polycarbonate 276
lol
Figure 8.3: Schematic of the samples prepared for stretching and resulting appearance after drawing. Before stretching, lines were drawn every 5mm. The distance between those lines after stretching provided information about the draw ratio λ (=l/lo). Circles drawn on the specimen prior to drawing became ellipsoidal with stretching.
8.2.2.2. Density
The densities were measured at 18oC in a linear density gradient column made of
an aqueous solution of sodium bromide. The theoretical resolution of the column was
about 5×10⁻⁵ g/cm3. The values of the densities gave indication about the presence or lack
of crystallinity in the bulk samples.
8.2.2.3. FTIR
In order to verify the absence of strain-induced crystallization at the surface, FTIR
spectra were collected in the ATR (attenuated total reflectance) mode using a zinc
selenide ZnSe crystal.
8.2.2.4. Birefringence
The average degree of orientation was determined from a birefringence apparatus
using a Babinet compensator. The sample was always introduced in the beam path with

Chapter 8 - Effect of orientation on the transport of gas molecules through amorphous glassy bisphenol-A polycarbonate 277
the machine direction placed horizontally for consistency in the measurements. The
birefringence ∆ was determined in the center of the membrane, at the top, bottom, right,
and left, as seen in Figure 8.4. Three measurements were taken and averaged for each of
the five positions. The measurements were taken at 23oC.
∆4 TD
MD
∆1 ∆2
∆5
∆3
Figure 8.4: Location of the five birefringence measurements taken on the membrane. The area of the membrane was about 18.10 cm2. MD and TD stand for the machine and the transverse directions, respectively.
8.2.2.5. DMTA
The dynamic mechanical experiments were carried out in the tensile mode. The
location of the sample cut for DMTA experiments was clearly written down on the
schematic shown in Figure 8.3 for further estimation of the draw ratio.
Dynamic temperature ramp experiments were performed with the following
conditions. A torque of 10 cNm was used on each clamp. The frequency was chosen as
1Hz, the heating rate as 2oC/min, the initial temperature as 25oC, the strain as 0.025%,
and the static force as 40g. The static force was determined at room temperature by
dynamic frequency sweep test (strain control). The strain level was assumed to be low
enough to not interfere with the strain induced by orientation and to avoid any structural
breakdowns.
Chapter 8 - Effect of orientation on the transport of gas molecules through amorphous glassy bisphenol-A polycarbonate 278
8.2.2.6. Permeation
The polycarbonate samples were prepared as follows for permeation experiments.
A circle of diameter 4.8cm was cut on the center of the stretched polymer films. The
central part of the film was believed to be more uniaxially oriented than the sides or the
extremities. The location of the circle was clearly indicated on the schematic provided in
Figure 8.3 for further calculation of the draw ratio.
Samples to be used in the permeation apparatus were originally masked off to
reduce the permeation area and thus improve the accuracy in the value of the draw ratio.
A circle of about 14mm diameter was cut from the central part of the stretched film. Its
location was clearly indicated on the schematic provided in Figure 8.3 for estimation of
the draw ratio. Its thickness was also recorded. An aluminium foil circle of 4.8cm
diameter was cut, folded in twice, and a semi-circle of 4mm radius was drawn on it, and
cut. Thereafter, the aluminium foil circle presented a hole of 8mm diameter in its center.
Some glue was applied on the edges of the hole, the polymer was put into contact with
the glued contour, and both surfaces were hold together for about 15 seconds. The glue
was a Duro quick gel / No-run super glue equipped with a small pipe. Complete drying
took about 5 minutes. While doing permeation experiments, the side with the glue visible
was exposed to the gas feed. Unfortunately, the permeation experiments did not always
work on such masked samples, mainly because of the glueing procedure. Using
aluminium foil also introduced additional problems. The presence of small wrinkles on
the aluminium created leaks in the permeation set-up. Furthermore, the pressure
transducers were not sensitive enough to the reduced permeate stream. Indeed, no time-
lag could be observed on either unoriented or oriented specimens. The permeation profile
appeared to be linear with time. Decreasing the permeation volume was impossible since
the volume was already minimized and originated mainly from the inside of the pressure
transducer itself, and increasing the feed pressure could modify the polymer and possibly
destroy the pressure transducers in case of leaks. The polymeric samples could not
therefore be prepared this way, rather as explained in the previous paragraph. The surface
area of the membrane had to be taken as about 18.10 cm2. Obviously, the degree of
orientation could not be assumed to remain constant all over the area.

Chapter 8 - Effect of orientation on the transport of gas molecules through amorphous glassy bisphenol-A polycarbonate 279
Permeation experiments were carried out at 35oC using He, O2, and N2, in that
given sequence. The applied pressures were fixed at about 2.5 atm for He, and 3.9 atm for
O2 and N2. Three measurements were taken for each gas to ensure reproducibility and to
calculate the error involved in the permeation results. Please note that the degassing time
between N2 runs was fixed at 120min in this particular study, and not 90min as reported
in Chapter 4. Permeation experiments were also carried out on the same membrane at
several temperatures, right after the experiment at 35oC, in order to determine the
temperature dependent activation energies. Those temperatures were chosen as 45oC and
55oC for the samples stretched at 130oC and 160oC. Temperatures of 40, 45, and 55oC
were selected for the samples stretched at 180oC. Aging was found to be negligible at
those temperatures within the timeframe of the experiments. It was assumed that
deorientation and shrinkage did not have time to take place within the timeframe of the
permeation experiments.
8.3. Results and discussion
8.3.1. FTIR results
Comparisons of spectra of amorphous and semi-crystalline samples are shown in
Figure 8.5. The semi-crystalline samples were supplied by Dr. Marand’s lab in the
Chemistry Department of Virginia Tech. Although these samples possessed a lower
molecular weight than the polycarbonate selected in the current research, this was not
expected to affect the wavenumbers of the amorphous bands. The crystallinities of the
two semi-crystalline samples were determined to be 5% and 18% [13]. The spectra
shown in Figure 8.5 could not, however, be compared quantitatively since the contact
was different for each sample. However changes in the peak assignments were easily
visible. The peak assignments of polycarbonate can be found in the literature [14, 15]. As
expected, there were more trans-trans contributions (1767cm-1, 1594cm-1, 1252cm-1) with
crystallinity than trans-cis contributions (1785cm-1, 1604cm-1, 1223cm-1), indicating that
ordering was taking place within the material. Trans-trans and trans-cis refer to the

Chapter 8 - Effect of orientation on the transport of gas molecules through amorphous glassy bisphenol-A polycarbonate 280
conformation of the carbonate group. The band around 1785 cm-1 was assigned to the
vibration of the carbonyl group C=O, the band at 1604 cm-1 to the C-C aromatic in-plane,
and the band at 1223 cm-1 to the C-O-C antisymmetric [14].
No signs of strain-induced crystallization at the surface could be detected by
FTIR-ATR spectroscopy on any of the samples stretched in this work. Crystallinity in
polycarbonate is actually reported to be very difficult to achieve, at least under normal
stretching conditions. Wu [2] could not detect any signs of strain-induced crystallization
in cold and hot-drawn polycarbonate samples using experimental techniques such as
DSC, X-ray diffraction, and FTIR spectroscopy. Since the ATR technique provided
information about the absence of crystallization at the surface only, density
measurements were carried out as well.

Chapter 8 - Effect of orientation on the transport of gas molecules through amorphous glassy bisphenol-A polycarbonate 281
3000 2950 2900 2850
0.00
0.02
amorphous Xc = 5% Xc = 18%
abso
rban
ce
wavenumber (cm-1)
1800 1750 1700
0.0
0.2
abso
rba
nce
wavenumber (cm-1)
1420 1400 1380 1360
0.00
0.02
abso
rba
nce
wavenumber (cm-1)
1200 1100
0.0
0.2
0.4
abso
rban
ce
wavenumber (cm-1)
1020 1000 980
0.2
abso
rban
ce
wavenumber (cm-1)
850 800 750 700
0.2
abso
rban
ce
wavenumber (cm-1)
Figure 8.5: Spectral changes induced with crystallization as observed by ATR for several absorption bands of polycarbonate (ZnSe crystal, 50o, no polarizer). The critical angle of incidence was calculated to be 40.92o. The refractive indices of the ZnSe ATR crystal and the polycarbonate were taken as 2.42 and 1.585, respectively.
8.3.2. Orientation results
The degree of orientation in the polycarbonate films was defined by calculating
the draw ratio λ and the Hermans’ orientation function f. The general definition of those
quantities has been given in Chapter 3. Nevertheless a background is provided here about

Chapter 8 - Effect of orientation on the transport of gas molecules through amorphous glassy bisphenol-A polycarbonate 282
the calculation of f from the birefringence technique. The values obtained for f in this
study are provided. Finally, λ and f values are compared.
8.3.2.1. Background
Due to the high absorption of polycarbonate in the infrared range and fairly thick
samples, it was not possible in this study to determine orientation by FTIR transmission
techniques. The 1364cm-1 and 2971 cm-1 peaks used in other studies involving
polycarbonate [2, 5, 16-18] saturated in the IR range. FTIR-ATR spectroscopy was not
used to look at the surface orientation since the contact is a serious limitation of the
technique. Therefore the level of orientation was assessed from birefringence
measurements. One has to keep in mind that the birefringence method provides only
information about an average orientation of the molecules.
The Hermans’ orientation function f measured by birefringence is given by the following
relation:
= o
f
û
ûf Eq (8.1)
where ∆f is the orientational birefringence and ∆o the intrinsic birefringence. The intrinsic
birefringence ∆o corresponds to the birefringence of a perfectly oriented polymer. ∆o was
taken as 0.16, as reported by Shelby and Wilkes on hot-drawn polycarbonate by
combining birefringence and sonic modulus results [3]. The theoretical value of the
intrinsic birefringence ∆o of polycarbonate has been calculated from the bond
polarizabilities of the polycarbonate repeat unit to be 0.207 [19]. An experimental value
of 0.236 was found by Biangardi [20] using WAXS. Unfortunately, Biangardi calculated
the value of ∆o by fitting data obtained while stretching polycarbonate both below and
above Tg. As stated earlier, distortional birefringence cannot be neglected below Tg [2].
Wu [2] determined ∆o to be equal to 0.192 for polycarbonate. The value was obtained
from birefringence and linear dichroism measurements. The total birefringence of hot-
drawn samples (shown to be due to orientational effects only) was plotted as a function of

Chapter 8 - Effect of orientation on the transport of gas molecules through amorphous glassy bisphenol-A polycarbonate 283
f (determined from linear dichroism) and the resulting slope corresponded to the intrinsic
birefringence.
8.3.2.2. Hermans’ orientation function results
The Hermans’ orientation function was calculated for the anisotropic samples. As
mentioned in Chapter 4, it was found that the measured birefringence ∆ of hot-drawn
samples was equal to the orientational birefringence ∆f in this study. Experimental
birefringences were taken at five different selected areas for each polymer film, as
explained in the experimental section of this chapter. An average value of f was
calculated for each polymer film by taking the average of the five Hermans’ orientation
functions.
The orientation results are summarized in Table 8.1. The values of f may appear
as being rather low, but amorphous polymer chains cannot be oriented that much by hot-
drawing. Furthermore, the presence of entanglements restricts the alignment of the
chains. The entanglements remain intact with stretching. However, when one chain is
stretched, at least another one moves too because they are connected through those
entanglements. The presence of entanglements limits the motion of the polymer chains. f
was observed to be greater at 160oC than at 180oC. Indeed, thermal motions become more
rapid at higher temperatures and “destroy” the orientation. Also, it was observed that the
membranes were typically more stretched in the middle than on the sides. This may have
originated from an unhomogeneous pressure near the grips. The orientation function f
was also on average higher in the MD direction than in the TD direction.
The values of f at 160oC are consistent with those reported in the literature from
birefringence measurements [1-4]. However they are about two times greater than the
values determined by linear dichroism by Lundberg and Jansson [17]. However, one has
to keep in mind that linear dichroism measures the orientation of a particular structure of
the molecular chain, in contrast to birefringence that gives an indication of the average
orientation. Moreover, although the stretching temperature is the same, results from the
literature cannot be strictly compared because of differences in stretching and cooling
procedures, molecular weights, suppliers, intrinsic birefringence values, etc.

Chapter 8 - Effect of orientation on the transport of gas molecules through amorphous glassy bisphenol-A polycarbonate 284
The values of f at 180oC are about ten times greater than those observed in the
GOLR state of polycarbonate at about the same strain levels [5]. Therefore this particular
state was not achieved in this work.
The birefringence of the cold-drawn sample (Tstretch = 130oC) could not be
determined by use of the Babinet compensator. This was initially attributed to turbidity.
However with the use of a microscope, it was noticed that crazing was taking place
within the material. Some silicon oil was put on the surface of the sample to facilitate the
measurement by avoiding scattering. Unfortunately, measurements were still not
possible. Had it been possible to measure the birefringence of the cold-drawn
polycarbonate samples, the value of the birefringence could have been corrected for
deformation or distortional birefringence ∆d. This particular type of birefringence (which
can be observed in isotropic materials as well), arises from a change in packing caused by
an external deformation. Distortions of bond angles and/or bond lengths from equilibrium
are indeed observed in materials containing residual stresses. This can be observed for
instance in materials quenched from the rubbery state. The skin and the core may be
cooled at different rates and the resulting thermal gradient may generate residual stresses.
∆d is usually in the order of 10-4 [21]. However ∆d cannot be neglected in cold-drawn
polymer films. In the case of cold-drawn polycarbonate, ∆d has been shown to represent
about 25% of the intrinsic birefringence [2].
center averagef1 f2 f3 f4 f5 f
2t/5s for 19s 0.26196 0.16890 0.24081 0.20364 0.21070 0.21720
2t/5s for 38s 0.25544 0.23712 0.25383 0.23439 0.22185 0.24053
2t/5s for 56s 0.13673 0.13129 0.13301 0.11735 0.11715 0.12711
1t/5s for 75s 0.08708 0.06607 0.08019 0.06740 0.07761 0.07567
2t/5s for 38s 0.11160 0.08333 0.08703 0.07348 0.08893 0.08887
2t/5s for 75s 0.03993 0.03250 0.04234 0.01667 0.01870 0.03003
3t/5s for 25s 0.10097 0.07819 0.08724 0.07867 0.07770 0.08456
Tst
retc
h =
180
o C
MD TD
Tst
retc
h =
160
o C
Table 8.1: Orientation results giving the Hermans’ orientation function f in the five different selected areas. Results are given as a function of the stretching temperature (Tstretch), and the number of turns per second in a given time (x t/s for x s). The membrane was typically found to be more oriented in the middle than on the sides. f was also on average higher in the MD direction than in the TD direction.

Chapter 8 - Effect of orientation on the transport of gas molecules through amorphous glassy bisphenol-A polycarbonate 285
8.3.2.3. Comparison between λ and f values
No simple correlation existed between the draw ratio λ and the Hermans’
orientation function f in this study, as indicated from the results given in Figure 8.6 and
Figure 8.7. The calculated draw ratio and the Hermans’ orientation function do not give
the same values for the orientation; trends are not even respected. The stretching time
seems to play an important role since chains are likely to relax at long stretching times.
The fact that λ and f are not linearly correlated is in agreement with the literature [3].
Since the Hermans’ orientation function characterizes the level of orientation
much more accurately than the draw ratio, the results of characterization studies will be
reported from now on as a function of f and not λ.
It has been shown in the literature that data obtained at different stretching rates
do fit on a same line while plotted as a function of f [2]. Therefore experimental data can
be plotted as a function of f even though the stretching rates were different.
Data reported in the literature are sometimes given as a function of the draw ratio
[18, 22-26]. Such data make comparisons difficult between research groups since
knowledge of the draw ratio alone is not sufficient to characterize the degree of
orientation in polymeric materials. Giving the draw ratio should make sense within the
same film though.

Chapter 8 - Effect of orientation on the transport of gas molecules through amorphous glassy bisphenol-A polycarbonate 286
0.0
0.5
1.0
1.5
2.0
2.5
3.0
2t/5s for 56s
2t/5s for 38s
2t/5s for 19s
Tstretch = 160oC λ
f (x10)
Figure 8.6: Comparison of the draw ratio λ and the Hermans’ orientation function f. The samples were stretched at 160oC.
0
1
2
3
4
5
6
2t/5s for 75s
3t/5s for 25s
1t/5s for 75s
2t/5s for 38s
Tstretch
= 180oC
λ f (x50)
Figure 8.7: Comparison of the draw ratio λ and the Hermans’ orientation function f. The samples were stretched at 180oC.

Chapter 8 - Effect of orientation on the transport of gas molecules through amorphous glassy bisphenol-A polycarbonate 287
8.3.3. Density results
8.3.3.1. Isotropic samples
The densities of the isotropic samples are shown in Figure 8.8 for the various
stretching temperatures chosen in this study. In this case, the samples were not stretched
though, but just left in the stretcher inside the oven for the same amount of time as
stretched samples in order to remove any thermal effects. The density was found to
decrease with the stretching temperature (or here the term of oven temperature should be
used instead). As the temperature increases, it is well-established that the specific volume
increases, as measured by dilatometric measurements [27, 28]. And therefore the density
decreases since density and specific volume are inversely related. If polymeric samples
are quenched by blowing air at the same cooling rates but from different starting
temperatures, the material cooled from the highest temperature will contain the greatest
overall free volume content and hence the lowest density. This is what is observed in this
study.
1.1966
1.1967
1.1968
1.1969
160 180130
f = 0
dens
ity (
g/cm
3 )
Tstretch
(oC)
Figure 8.8: Density as a function of Tstretch for isotropic samples. The densities were measured at 18oC in a linear density gradient column.

Chapter 8 - Effect of orientation on the transport of gas molecules through amorphous glassy bisphenol-A polycarbonate 288
8.3.3.2. Anisotropic samples
Densities were determined for the stretched samples. Results are shown in Figure
8.9 through Figure 8.11. The densities were found to remain constant with stretching for
hot-drawn samples whereas the density did increase for cold-drawn samples. The fact
that the densities of hot-drawn polycarbonates remained at values similar to those of the
undrawn samples seems reasonable. Indeed, hot-drawing is generally considered to be a
constant volume process, as assumed from the Poisson’s ratio value of 0.5, corresponding
to a nearly incompressible process. On the other hand, drawing below Tg is not a constant
volume deformation and is typically characterized by a Poisson’ s ratio of 0.33. The
densities of hot-drawn polycarbonate were too low for crystallinity to have occurred with
orientation [13].
0,0 0,1 0,2 0,31,1966
1,1968
1,1970
1,1972
Tstretch
= 160oC
dens
ity (
g/cm
3 )
f
Figure 8.9: Density as a function of the Hermans’ orientation function f. The stretching temperature was 160oC.

Chapter 8 - Effect of orientation on the transport of gas molecules through amorphous glassy bisphenol-A polycarbonate 289
0,00 0,02 0,04 0,06 0,08 0,10
1,1965
1,1966
1,1967
1,1968 Tstretch
= 180oC
dens
ity (
g/cm
3 )
f
Figure 8.10: Density as a function of the Hermans’ orientation function f. The stretching temperature was 180oC. The density of the sample characterized by a f value of 0.07567 could not be taken since vacuum grease was covering the membrane.
1,197
1,198
1,199
Tstretch
= 130oC
stretchedunstretched
dens
ity (
g/cm
3 )
Figure 8.11: Density of unstretched and stretched samples. The stretching temperature was 130oC. It should be pointed out that the stretched sample was not taken from the membrane used in permeation experiments since the membrane was destroyed by oil while attempting to measure birefringence (see above). Nevertheless, the same experimental conditions were repeated in order to generate the same sample.
Chapter 8 - Effect of orientation on the transport of gas molecules through amorphous glassy bisphenol-A polycarbonate 290
The experimental results are supported by the work of Wu. Wu [2] reported that
any changes in the density of polycarbonate with stretching were highly dependent on the
stretching temperature. In fact, the researchers did not observe any significant changes in
the density of hot-drawn polycarbonate, whereas the density was slightly higher in cold-
drawn samples. The resolution of the density gradient column was 5×10⁻⁴ g/cm3. The
increase in the density with cold-drawing can be attributed to the bond distortions, that
may allow better packing of the polymer chains and thus give a higher density.
An increase in the density of polycarbonate with cold-drawing has been reported
by Bartos et al [6]. Polycarbonate was stretched at room temperature and an increase in
density of about 0.3% was observed compared to that of the isotropic sample. Quite
interestingly, the Tg was not found to be influenced by drawing. A densification in cold-
drawn polycarbonate was also reported by Pixa et al [7], although not quantified.
Interestingly, Shelby and co-workers [1, 3, 4] observed an increase in the density
of hot-drawn polycarbonate samples with stretching. The density was found to increase
almost linearly with the orientation function [3, 4]. A slight decrease in the density at a
low f value was reported. The density increased from about 1.1982 g/cm3 for an undrawn
sample to about 1.1994 g/cm3 for a sample with a f value of 0.2. The stretching
temperature was set as 160oC. Unfortunately the time given for temperature equilibrium
of the samples in the oven was not mentioned and it is not clear whether or not the
samples had reached the desired temperature of 160oC at the time of drawing. Also, it
was not specified whether the anisotropic samples did undergo exactly the same thermal
treatment as the isotropic samples. The time left at 160oC is indeed given for the isotropic
samples, but not for the anisotropic ones [1]. The Tg (determined from DSC
measurements) was also observed to increase slightly with f [3]. An orientation function
of about 0.15 corresponded to an increase in Tg of about 0.8oC compared to the isotropic
sample. The fact that the density went through a minimum at a f value of about 0.03 and
the changes in Tg suggest that density and Tg are not directly correlated for oriented
samples. This point has already been discussed in Chapter 6 for isotropic samples.
In another study by Ito et al [22] the density of hot-drawn polycarbonate samples
was also found to increase with the draw ratio. The samples were stretched at 170oC at
constant speed to various draw ratios ranging from 1 to about 3. The resulting densities

Chapter 8 - Effect of orientation on the transport of gas molecules through amorphous glassy bisphenol-A polycarbonate 291
increased from about 1.193 to about 1.202 g/cm3, which is quite a significant change. The
stretching and the cooling procedures were not defined in the work of Ito et al [22],
although those factors are highly significant. The researchers observed that the frequency
of the maximum in the β-relaxation peak reached a minimum at a draw ratio of about 2.
In another publication published at about the same time by Ito and co-workers again [18],
an increase in density with the draw ratio was again observed for hot-drawn
polycarbonate samples. Although the samples and their preparations and stretching
procedures appear to be the same in both publications [18, 22], the density in the second
paper ranged from about 1.192 to 1.194 g/cm3 only, and not from about 1.193 to about
1.202 g/cm3 anymore (see above). In both cases, the densities were obtained by the same
technique. The difference in the temperature at which the densities were obtained (25oC
versus 30oC) is unlikely to explain the density differences between both publications.
Please note that the resolution of the flotation method was not given, and error bars were
not reported either. Quite interestingly, the Tg of polycarbonate determined from DSC
measurements was observed to go through a maximum at a draw ratio of about 2 [18]. In
contrast, the density values did not present any particular point at the same draw ratio of
2. Since density and free volume are assumed to be directly correlated, such a difference
in the behavior of Tg seems to suggest that density and Tg are two distinct quantities, not
linearly correlated with one another. This point has been raised in Chapter 6. Please note
that using draw ratios in the above publication instead of the Hermans’ orientation
function is not expected to be a limitation while comparing density and Tg since the
measurements should have been done on the same films. Of course, better determination
of the degree of orientation should have been done in order to determine if a critical point
was still observed for the Tg for instance.
8.3.4. DMTA results
DMTA experiments were performed on the stretched membranes after permeation
data and birefringence measurements had been collected. Stretched samples to be used in
the DMTA apparatus were cut in the machine direction (MD) as well as in the transverse
direction (TD). Samples that had been inside the oven but not stretched were denoted as

Chapter 8 - Effect of orientation on the transport of gas molecules through amorphous glassy bisphenol-A polycarbonate 292
isotropic. The draw ratio was determined for each sample. A schematic of the DMTA set-
up is provided in Figure 8.12.
iso TDMD
Figure 8.12: Schematic of the DMTA set-ups. Iso, MD, and TD stand for isotropic, machine direction, and transverse direction, respectively. The chains were drawn as perfectly oriented in order to emphasize the orientation direction. Nevertheless one has to keep in mind that the Hermans’ orientation function of the polycarbonate films was very low (about 0.2) and therefore the polymer chains should be only slightly oriented.
The glass transition temperature varied as TgTD ≤ Tgiso < TgMD, where TD, iso, and
MD stand for transverse direction, isotropic, and machine direction, respectively. The
maximum difference between TgMD and Tgiso was about 3.5oC for Tstretch = 130oC, 2.5oC
for Tstretch = 160oC, and 0.7oC for Tstretch = 180oC. Also, typically E’TD ≤ E’iso < E’MD, in
agreement with stress-strain curves commonly seen in the literature for ductile semi-
crystalline polymers [29]. However, the α’ peak appearing at around 80oC on the loss
modulus E” trace of oriented samples and believed to originate from the local orientation
of chain segments [3, 23, 24, 30] could not be clearly distinguished on our DMTA traces
due to a scatter of the data. The fact that the Tg’s were affected by hot-drawing and that
the densities were not (see above) suggests that those two quantities may not be directly
related. This point has already been raised in Chapter 6.
An example of the DMTA traces is shown in Figure 8.13 and Figure 8.14 for
Tstretch = 160oC, and f = 0 and 0.2172. Traces obtained at other Hermans’ orientation
functions and other stretching temperatures were rather similar.

Chapter 8 - Effect of orientation on the transport of gas molecules through amorphous glassy bisphenol-A polycarbonate 293
50 100 150
1E9T
stretch = 160
oC
f = 0 f = 0.2172 (MD) f = 0.2172 (TD)
E'(P
a)
T (oC)
Figure 8.13: Storage modulus of isotropic and anisotropic polycarbonate (Lexan) as a function of temperature. The stretching temperature was set at 160oC. The Hermans’ orientation function of the oriented sample was determined from birefringence measurements to be 0.2172. The DMTA traces of the oriented sample were performed in both the machine (MD) and the transverse (TD) directions. The DMTA conditions were the following: frequency = 1Hz, strain = 0.025%, initial temperature = 25oC, heating rate = 2oC/min, static force = determined at room temperature by dynamic frequency sweep test (strain control), torque = 10 cNm.

Chapter 8 - Effect of orientation on the transport of gas molecules through amorphous glassy bisphenol-A polycarbonate 294
140 150 160
1E8
Tstretch
= 160oC
f = 0 f = 0.2172 (MD) f = 0.2172 (TD)
E''(
Pa)
T (oC)
Figure 8.14: Loss modulus of isotropic and anisotropic polycarbonate (Lexan) as a function of temperature. The stretching temperature was set at 160oC. The Hermans’ orientation function of the oriented sample was determined from birefringence measurements to be 0.2172. The DMTA traces of the oriented sample were performed in both the machine (MD) and the transverse (TD) directions. The DMTA conditions were the following: frequency = 1Hz, strain = 0.025%, initial temperature = 25oC, heating rate = 2oC/min, static force = determined at room temperature by dynamic frequency sweep test (strain control), torque = 10 cNm.
8.3.5. Permeation results
In the absence of crystallinity, the densities of polycarbonate were not observed to
change significantly for hot-drawn samples, whereas the density increased in the cold-
drawn sample. Interestingly, the Tg values were found to increase in the machine
direction for both hot- and cold-drawn samples compared to those of isotropic samples.
As a consequence, we would expect to see changes in the gas transport properties with
hot-drawing. Gas transport coefficients and activation energies are reported below for
both isotropic and anisotropic samples.

Chapter 8 - Effect of orientation on the transport of gas molecules through amorphous glassy bisphenol-A polycarbonate 295
8.3.5.1. Isotropic samples
8.3.5.1.1. Determination of the gas transport coefficients (P,D,S)
Gas transport coefficients were plotted as a function of the oven temperature for
isotropic samples. Results are provided in Figure 8.15 through Figure 8.17. Again, these
samples were not oriented, but just left at a given temperature for a fixed time. In
addition, the experimental data were obtained at 35oC, and not at the temperatures written
on the figures. The dynamic free volume was frozen. Data can be compared since the
condensability of the gas in the polymer does not have to be corrected for temperature.
The density was found to decrease with the temperature for isotropic samples,
indicating an increase in the overall free volume content with a greater oven temperature.
An increase in free volume should correspond to an increase in solubility coefficients.
However here the solubility coefficient is observed to slightly increase for O2 and to
decrease for N2 (see Figure 8.17). A possible explanation is that the redistribution of free
volume with an increase in temperature may favor smaller molecular cavities than the
size of the N2 molecule (kinetic diameter = 3.64Å). This conclusion would be in
contradiction with PALS data that have shown that the hole size and concentration
increase with temperature for polycarbonate [31-35]. On the other hand, the diffusion
coefficient of O2 appeared to remain constant with temperature. An increase in D was
nevertheless observed with temperature for N2. As suggested above, the free volume may
have been more uniformly redistributed inside the polymeric matrix as the temperature
was higher, enabling molecular motions to take place more easily due to the decrease in
the local stiffness. The permeability coefficient was observed to remain relatively
constant with the temperature for N2. However, as the size of the gas molecule decreases,
P was found to increase with the temperature.

Chapter 8 - Effect of orientation on the transport of gas molecules through amorphous glassy bisphenol-A polycarbonate 296
0
4
8
12
16
He O
2
N2
160 180130
f = 0P
(ba
rrer
s)
Tstretch
(oC)
Figure 8.15: Permeability coefficient P as a function of Tstretch for isotropic samples. Permeation experiments were performed at 35oC.
2.0x10⁻⁸
4.0x10⁻⁸
6.0x10⁻⁸
8.0x10⁻⁸
O2
N2
160 180130
f = 0
D (
cm2 /s
)
Tstretch
(oC)
Figure 8.16: Diffusion coefficient D as a function of Tstretch for isotropic samples.

Chapter 8 - Effect of orientation on the transport of gas molecules through amorphous glassy bisphenol-A polycarbonate 297
1.0x10⁻³
2.0x10⁻³
3.0x10⁻³
O2
N2
160 180130
f = 0
S (
cm3 @
ST
P/c
m3 po
lym
er.c
mH
g)
Tstretch
(oC)
Figure 8.17: Solubility coefficient S as a function of Tstretch for isotropic samples.
8.3.5.1.2. Determination of the gas transport activation energies (EP, ED, ∆Hs)
Activation energy data obtained on isotropic samples are presented in Figure 8.18
through Figure 8.20. Gas transport activation energies do not seem to be affected by the
annealing at elevated temperatures for smaller size gas molecules (He and O2). However,
ED decreases and ∆Hs increases significantly for N2 as the temperature of the oven
increased.
The data suggest that the energy needed for diffusion to occur in polycarbonate is
reduced with the temperature at which cooling started, and this for larger size molecules.
The relaxation times are being reduced with an increase in temperature, resulting in a
decrease in ED. The decrease in the local stiffness makes it easier for activated diffusion
to take place.

Chapter 8 - Effect of orientation on the transport of gas molecules through amorphous glassy bisphenol-A polycarbonate 298
12000
16000
20000
24000 He O
2
N2
160 180130
f = 0
EP (
J/m
ol)
Tstretch
(oC)
Figure 8.18: EP as a function of Tstretch for isotropic samples.
10000
20000
30000
40000
50000 O
2
N2
160 180130
f = 0
ED (
J/m
ol)
Tstretch
(oC)
Figure 8.19: ED as a function of Tstretch for isotropic samples.

Chapter 8 - Effect of orientation on the transport of gas molecules through amorphous glassy bisphenol-A polycarbonate 299
-30000
-20000
-10000
0
10000
O2
N2
160 180130
f = 0
∆Hs
(J/m
ol)
Tstretch
(oC)
Figure 8.20: ∆Hs as a function of Tstretch for isotropic samples.
8.3.5.2. Anisotropic samples
8.3.5.2.1. Determination of the gas transport coefficients (P,D,S)
The gas transport coefficients P, D, and S were calculated as a function of the
Hermans’ orientation function f for hot-drawn samples. Since it was impossible to
determine f for cold-drawn samples (see previous remarks), the results of the cold-drawn
samples were just given as stretched or unstretched. The degree of orientation did not
change before and after the gas transport measurements. Since the thickness of the
samples changed as the samples were stretched, the permeation slope could not be
compared before and after stretching. Instead the permeability was calculated directly.
The error bars reflect the precision of the thickness measurements.
The permeability coefficient P results are reported from Figure 8.21 to Figure 8.23.
P seems to remain constant with stretching for both cold- and hot-drawn samples. What is
rather interesting for practical applications is that the permselectivity appears to remain
constant with stretching. One has to keep in mind that the permeation experiments were

Chapter 8 - Effect of orientation on the transport of gas molecules through amorphous glassy bisphenol-A polycarbonate 300
performed perpendicularly to the polymer chain orientation. Still, the fact that orientation
does not seem to affect the permeability coefficient is rather unexpected. Even though the
f values are not that high, orientation effects should still be there. Stretching is expected
to affect the distribution of free volume to some extent. It has actually been shown in the
literature that cold-drawing increased the width of the free volume distribution of
polycarbonate when the drawing was performed at room temperature [6, 8]. However, the
thermal density fluctuations were observed to remain at values similar to those of
undrawn samples when the drawing was performed at temperatures of 90oC and 120oC,
thus still in the glassy state [8]. Therefore at the temperatures selected in this study the
density fluctuations can be expected to remain unaffected by drawing. In addition, the
densities were found to be unaffected by hot-drawing. Therefore, it seems possible that
the permselectivities remain constant with drawing at the experimental stretching
temperatures.
Discussing the effect of cold-drawing on gas transport may be more complex. In
the present research work, crazing was observed to take place in the cold-drawn sample
(see above). A study by Muzovskaya and Malkin [36] revealed that CO2 transport in
polycarbonate films was complicated by the fact that two different transfer mechanisms
occurred in the cold-drawn films. Indeed, one needed to separate the orientation effects
from the crazing effects. This crazing phenomenon has also been pointed out for the
permeation of nitrogen in cold-drawn polycarbonate above a particular strain level [37].
As a film is being uniaxially oriented, microdefects or cracks may appear in the film to
various extents. It has been shown that cracks appear when the viscoelasticity becomes
clearly non-linear [38]. Those micropores are expected to appear under large
deformations, i.e. mainly with cold-drawing. The presence of crazing could enhance the
transport rate. Nevertheless, a study by Smith and Adam [37] did not notice a real change
in the slope of the permeability coefficient P versus stretching for polycarbonate. P was
said to increase with stretching at 128oC because of two reasons: the increase in free
volume first and crazing itself. The transport of gas molecules through films with crazing
could also maybe be considered as gas transport through porous and not through dense
material after some critical point. The gas transport results are therefore complicated. In

Chapter 8 - Effect of orientation on the transport of gas molecules through amorphous glassy bisphenol-A polycarbonate 301
this study however a time-lag could still be distinguished in permeation experiments, thus
indicating that no pores were present in the cold-drawn material.
0.0 0.1 0.2 0.30
4
8
12
16
Tstretch
= 160oC
He O
2
N2
P (
barr
ers)
f
Figure 8.21: Permeability coefficient P as a function of the Hermans’ orientation function f. The stretching temperature was 160oC. Results are plotted for the three gases studied in this research. Permeation experiments were performed at 35oC.

Chapter 8 - Effect of orientation on the transport of gas molecules through amorphous glassy bisphenol-A polycarbonate 302
0.00 0.02 0.04 0.06 0.08 0.100
4
8
12
16
Tstretch
= 180oC
He O
2
N2
P (
barr
ers)
f
Figure 8.22: Permeability coefficient P as a function of the Hermans’ orientation function f. The stretching temperature was 180oC. Results are plotted for the three gases studied in this research. Permeation experiments were performed at 35oC.
0
2
4
6
8
10
12
14
Tstretch
= 130oC
stretchedunstretched
He O
2
N2
P (
barr
ers)
Figure 8.23: Permeability coefficient P of an unstretched versus a stretched sample. The stretching temperature was 130oC. Results are plotted for the three gases studied in this research. Permeation experiments were performed at 35oC.

Chapter 8 - Effect of orientation on the transport of gas molecules through amorphous glassy bisphenol-A polycarbonate 303
The diffusion coefficient results are presented in Figure 8.24 through Figure 8.26.
Again, no real trends can be distinguished with cold- and hot-drawing for the diffusion
coefficient. Permeation experiments were performed perpendicularly to the polymer
chain orientation. We believe that if the permeation experiments could have been
performed in the direction parallel to the alignment of the polymer chains and not
perpendicularly to them, the diffusion coefficient would have been affected by
orientation. The Tg’s showed for instance a strong difference between the machine and the
transverse directions. The Tg’s of the isotropic sample and that of the stretched sample
tested in the TD direction had similar values, whereas the Tg of the stretched sample
tested in the MD direction was greater.
The solubility coefficient results are presented in Figure 8.27 through Figure 8.29.
Again, the changes induced by drawing do not appear to be statistically significant.
0.0 0.1 0.2 0.3
4.0x10⁻⁸
6.0x10⁻⁸
8.0x10⁻⁸
1.0x10⁻⁷
Tstretch
= 160oC
O2
N2
D (
cm2 /s
)
f
Figure 8.24: Diffusion coefficient D as a function of the Hermans’ orientation function f. The stretching temperature was 160oC. Results have been obtained for O2 and N2 only.

Chapter 8 - Effect of orientation on the transport of gas molecules through amorphous glassy bisphenol-A polycarbonate 304
0.00 0.02 0.04 0.06 0.08 0.102.0x10
-8
4.0x10⁻⁸
6.0x10⁻⁸
8.0x10⁻⁸
1.0x10⁻⁷
Tstretch
= 180oC O
2
N2
D (
cm2 /s
)
f
Figure 8.25: Diffusion coefficient D as a function of the Hermans’ orientation function f. The stretching temperature was 180oC. Results have been obtained for O2 and N2 only.
2.0x10⁻⁸
3.0x10⁻⁸
4.0x10⁻⁸
5.0x10⁻⁸
6.0x10⁻⁸
7.0x10⁻⁸
8.0x10⁻⁸
Tstretch
= 130oC
stretchedunstretched
O2
N2
D (
cm2 /s
)
Figure 8.26: Diffusion coefficient D of an unstretched versus a stretched sample. The stretching temperature was 130oC. Results have been obtained for O2 and N2 only.

Chapter 8 - Effect of orientation on the transport of gas molecules through amorphous glassy bisphenol-A polycarbonate 305
0.0 0.1 0.2 0.31.0x10
-3
1.5x10⁻³
2.0x10⁻³
2.5x10⁻³
3.0x10⁻³
Tstretch
= 160oC
O2
N2
S (
cm3 @
ST
P/c
m3 po
lym
er.c
mH
g)
f
Figure 8.27: Solubility coefficient S as a function of the Hermans’ orientation function f. The stretching temperature was 160oC. Results have been obtained for O2 and N2 only.
0.00 0.02 0.04 0.06 0.08 0.10
1.0x10⁻³
1.5x10⁻³
2.0x10⁻³
2.5x10⁻³
3.0x10⁻³
Tstretch
= 180oC
O2
N2
S (
cm3 @
ST
P/c
m3 po
lym
er.c
mH
g)
f
Figure 8.28: Solubility coefficient S as a function of the Hermans’ orientation function f. The stretching temperature was 180oC. Results have been obtained for O2 and N2 only.

Chapter 8 - Effect of orientation on the transport of gas molecules through amorphous glassy bisphenol-A polycarbonate 306
1,0x10⁻³
2,0x10⁻³
3,0x10⁻³
Tstretch
= 130oC
stretchedunstretched
O2
N2
S (
cm3 @
ST
P/c
m3 po
lym
er.c
mH
g)
Figure 8.29: Solubility coefficient S of an unstretched versus a stretched sample. The stretching temperature was 130oC. Results have been obtained for O2 and N2 only.
8.3.5.2.2. Determination of the gas transport activation energies (EP, ED, ∆Hs)
Results of activation energy calculations are shown from Figure 8.30 to Figure
8.35. The activation energy data appear to be too scattered to draw conclusions, because
the error bars are large. The estimation of the error was mainly based on the linear
regressions. The errors may have come from the fact that the permeation temperatures
were too close to one another to really measure significant changes in the gas transport
parameters. The permeation temperatures were chosen as 35, 40, 45, and 55oC. The fact
that the errors for the isotropic samples are on the same order of magnitude as the errors
for the anisotropic samples supports this idea. Orientation is likely to increase the
polymer relaxation times and make it more difficult for the gas molecules to move
through the chains.

Chapter 8 - Effect of orientation on the transport of gas molecules through amorphous glassy bisphenol-A polycarbonate 307
0.00 0.05 0.10 0.15 0.20 0.2512000
14000
16000
18000
20000
22000
Tstretch
= 160oC
He O
2
N2
EP
(J/m
ol)
f
Figure 8.30: EP as a function of the Hermans’ orientation function f. The stretching temperature was 160oC. Results are plotted for the three gases studied in this research.
0.00 0.05 0.10 0.15 0.20 0.2520000
30000
40000
50000
60000
70000
80000
Tstretch
= 160oC
O2
N2
ED
(J/m
ol)
f
0,00 0,05 0,10 0,15 0,20 0,25
-60000
-50000
-40000
-30000
-20000
-10000
Tstretch
= 160oC
O2
N2
∆H
s (
J/m
ol)
f
Figure 8.31: ED (left) and ∆Hs (right) as a function of the Hermans’ orientation function f. The stretching temperature was 160oC. Results have been obtained for O2 and N2 only.

Chapter 8 - Effect of orientation on the transport of gas molecules through amorphous glassy bisphenol-A polycarbonate 308
0.00 0.02 0.04 0.06 0.08 0.1012000
14000
16000
18000
20000
22000
Tstretch
= 180oC
He O
2
N2
EP
(J/m
ol)
f
Figure 8.32: EP as a function of the Hermans’ orientation function f. The stretching temperature was 180oC. Results are plotted for the three gases studied in this research.
0.00 0.02 0.04 0.06 0.08 0.10
20000
30000
40000
50000
60000
70000
80000
Tstretch
= 180oC
O2
N2
ED
(J/m
ol)
f
0,00 0,02 0,04 0,06 0,08 0,10
-60000
-40000
-20000
0
Tstretch
= 180oC
O2
N2∆
Hs
(J/
mol
)
f
Figure 8.33: ED (left) and ∆Hs (right) as a function of the Hermans’ orientation function f. The stretching temperature was 180oC. Results have been obtained for O2 and N2 only.

Chapter 8 - Effect of orientation on the transport of gas molecules through amorphous glassy bisphenol-A polycarbonate 309
0
5000
10000
15000
20000
N2
O2
He
Tstretch
= 130oC isotropic
anisotropic
EP
(J/m
ol)
Figure 8.34: EP of isotropic and anisotropic samples. The stretching temperature was 130oC. Results are plotted for the three gases studied in this research.
0
10000
20000
30000
40000
50000
60000
N2
O2
Tstretch
= 130oC
isotropic anisotropic
ED
(J/m
ol)
0
-10000
-20000
-30000
-40000
O2 N
2
Tstretch = 130oC
isotropic anisotropic
dHS
(J/m
ol)
Figure 8.35: ED (left) and ∆Hs (right) of isotropic and anisotropic samples. The stretching temperature was 130oC. Results have been obtained for O2 and N2 only.
8.3.6. Orientation and physical aging
The experimental data given in this chapter do not show a change in density with
stretching above Tg. The literature is actually divided concerning this increase in density
with hot-drawing in polycarbonate, as discussed previously. As a consequence it is
impossible to link the aging rate with the free volume content and its distribution

Chapter 8 - Effect of orientation on the transport of gas molecules through amorphous glassy bisphenol-A polycarbonate 310
contained in the materials since the density (and thus the free volume content) do not
appear to be affected by orientation. In addition, the gas transport data concerning freshly
oriented samples were too scattered to really distinguish any trends.
Furthermore, annealing oriented samples is a rather complicated process since the
material can relax during the experiments. As seen in Figure 8.36 and Figure 8.37,
deorientation of the polymer chains in samples cold-drawn at 126oC occurs during the
DMTA experiments, as well as shrinkage of the samples. The appearance of new
relaxations can be attributed to orientational stresses. Orientational stresses in plastics can
be attributed to several factors. Four of them have been listed by Struik [39]: volume
relaxation, thermal stresses due to rapid inhomogeneous cooling, shrinkage of the
material after removing of the stress, and orientation of the polymer chains. Since the
DMTA uses a constant heating scan, the thermal history can be quite complicated.
Isothermal DMTA experiments would actually be easier to interpret. Still, the results of
Figure 8.36 and Figure 8.37 point out that aging measurements, would they be DMTA or
not, should be rather difficult to carry out on oriented samples. A fixed value cannot be
given to characterize the orientation of the polymer chains since this orientation is likely
to change during the measurement. Furthermore, as the sample shrinks the density may
increase as well. And the relaxation time needed to accomplish a particular
rearrangement and disorient the chains (as sketched in Figure 8.38) decreases as the
temperature is increased. The timescale of the measurement is an important parameter to
consider. The Deborah number De, which represents the ratio of the relaxation time
divided by the observation time, should be ideally high. The timescale needed for a
change in conformation has to be large compared to the duration of the test.

Chapter 8 - Effect of orientation on the transport of gas molecules through amorphous glassy bisphenol-A polycarbonate 311
50 100 1501E8
1E9
1Hz, 0.025%, 2oC/min
126
Tstretch
= 126oC
isotropic MD (2.42)
E' (
Pa)
T (oC)
Figure 8.36: Storage modulus of isotropic and anisotropic polycarbonate (Lexan) as a function of temperature. As expected, the storage modulus at room temperature was greater in the oriented sample than in the isotropic one. Deorientation of the anisotropic samples is clearly seen on the figure, as the storage modulus dropped around the stretching temperature and reached the level of that of the isotropic sample. The fact that the drop of E’ occurred around Tstretch is believed to be a coincidence rather than a general rule. Indeed, this drop should depend on the heating rate for instance, and a higher heating rate should show a drop at higher temperatures. The stretching temperature was set at 126oC, the stretching rate was 15 turns/min. The DMTA trace of the oriented sample was performed in the machine direction. The draw ratio is indicated into brackets. The thicknesses of the fresh and the stretched samples were 150µm and 90µm, respectively. The DMTA conditions were the following: frequency = 1Hz, strain = 0.025%, initial temperature = 25oC, heating rate = 2oC/min, static force = 40g, torque = 10 cNm.
140 150 160
1E8
154.5oC 158.8oC
E''
(Pa)
T (oC)
50 100 150
1E7
1E8
1E9
1Hz, 0.025%, 2oC/min
126
Tstretch
= 126oC
isotropic MD (2.42)
E''
(Pa)
T (oC)
Figure 8.37: Loss modulus of isotropic and anisotropic polycarbonate (Lexan) as a function of temperature (see Figure 8.36 for experimental details). The loss modulus trace indicated that energy was dissipated in the material with deorientation of the chains (see previous figure), suggesting that shrinkage was taking place in the anisotropic samples during the measurements. The Tg of the stretched sample (MD direction) was higher by about 4oC.

Chapter 8 - Effect of orientation on the transport of gas molecules through amorphous glassy bisphenol-A polycarbonate 312
orientation no orientation
τdisorientation
Figure 8.38: Schematic showing the relaxation of oriented polymer chains.
Data published on the enhancement of volume relaxation for oriented materials
have sometimes been obtained on samples stretched at room temperature and annealed at
room temperature or at higher temperatures. This is for instance the case in the work of
Pixa et al [7] or Müller, Wendorff et al [6, 8], who focused their studies on cold-drawn
polycarbonate. Obviously, such data are rather complicated to interpret since shrinkage is
more than likely to occur with time. DMTA responses of polycarbonate stretched at room
temperature are shown in Figure 8.39 through Figure 8.41 for reference. A study by Lunn
and Yannas [16] has pointed out that the temperature at which the polycarbonate films
were stretched had a profound influence on the relaxation rate during sub-Tg annealing.
The higher the stretching temperature, the higher the temperature at which relaxation
takes place. The orientation function was observed to decrease with annealing time, at
any annealing temperature up to the Tg value. Obviously, the decrease in the orientation
function became more pronounced close to the Tg for hot-drawn samples.

Chapter 8 - Effect of orientation on the transport of gas molecules through amorphous glassy bisphenol-A polycarbonate 313
25 50 75 100 125 150 1751E7
1E8
1E9
Tstretch
= 27oC
isotropic MD (1.75) TD (1.75)
E' (
Pa)
T (oC)
Figure 8.39: Storage modulus E’ of isotropic and anisotropic polycarbonate (Lexan) as a function of temperature. No direct evidence of deorientation of the polymer chains could be noticed. The stretching was done at room temperature (27oC), the stretching rate was 7 turns/min. The draw ratio of the oriented samples are indicated into brackets. DMTA measurements were performed in both the machine (MD) and the transverse (TD) directions. The DMTA conditions were the following: frequency = 1Hz, strain = 0.025%, initial temperature = 25oC, heating rate = 2oC/min, torque = 10 cNm.
25 50 75 100 125 150 1751E7
1E8
Tstretch
= 27oC
isotropic MD (1.75) TD (1.75)
E''
(Pa)
T (oC)
Figure 8.40: Loss modulus E” of isotropic and anisotropic polycarbonate (Lexan) as a function of temperature. The samples were stretched at room temperature (see Figure 8.39 for experimental details). New relaxations between 50 and 120oC appeared on the traces with orientation.

Chapter 8 - Effect of orientation on the transport of gas molecules through amorphous glassy bisphenol-A polycarbonate 314
25 50 75 100 125
0.02
0.04
0.06
Tstretch
= 27oC
isotropic MD (1.75) TD (1.75)
tan
δ
T (oC)
145 150 155 160 165 170
0.5
1.0
1.5
2.0
2.5
Tstretch
= 27oC
isotropic MD (1.75) TD (1.75)
tan
δ
T (oC)
Figure 8.41: Tan δ of isotropic and anisotropic polycarbonate (Lexan) as a function of temperature. The samples were stretched at room temperature (see Figure 8.39 for experimental details).
8.4. Conclusions
The objectives of this study were to investigate the effect of amorphous
orientation on the gas transport properties of polycarbonate. Both hot- and cold-drawing
were performed on polycarbonate samples. The permeation data on a cold-drawn sample
was complicated by the fact that crazing was present in the oriented material. Orientation
studies on hot-drawn polycarbonate samples did not appear to affect the gas transport
properties. The gas transport coefficients seemed to remain unaffected by hot-drawing,
hence indicating a constant permselectivity with stretching. Please note that no change in
density was noticed with hot-drawing either. We expect that the gas results would have
been affected by orientation though if permeation experiments could have been
performed in the direction parallel to the alignment of the polymer chains, and not
perpendicularly to them.
Studies investigating the physical aging of oriented samples were not carried out
since the density of polycarbonate was not found to be affected by hot-drawing.
Therefore, it was impossible to link the aging rate with the free volume content. In
addition, studying the physical aging of oriented samples appears to be rather complex
since deorientation and shrinkage have been shown in this study to take place during sub-
Tg annealing.

Chapter 8 - Effect of orientation on the transport of gas molecules through amorphous glassy bisphenol-A polycarbonate 315
8.5. References
1. Y. C. Jean, Y. Rhee, Y. Lou, D. Shelby, G. L. Wilkes, Anisotropy of hole
structures in oriented polycarbonate probed by two-dimensional angular correlation of annihilation radiation, Journal of Polymer Science: Part B: Polymer Physics, 34, 2979-2985 (1996).
2. M.-S. S. Wu, Intrinsic birefringence of amorphous poly(bisphenol-A carbonate), Journal of Applied Polymer Science, 32, 3263-3275 (1986).
3. M. D. Shelby and G. L. Wilkes, Thermodynamic characterization of the oriented state of bisphenol A polycarbonate as it pertains to enhanced physical aging, Journal of Polymer Science: Part B: Polymer Physics, 36, 2111 (1998).
4. M. D. Shelby and G. L. Wilkes, The effect of molecular orientation on the physical ageing of amorphous polymers - dilatometric and mechanical creep behaviour, Polymer, 39, 26, 6767-6779 (1998).
5. R. Song, Q. Fan, Polycarbonate films in the state of high global chain orientation but nearly random segmental orientation, European Polymer Journal, 36, 1463-1470 (2000).
6. J. Bartos, J. Muller, J. H. Wendorff, Physical ageing of isotropic and anisotropic polycarbonate, Polymer, 31, 1678 (1990).
7. R. Pixa, B. Grisoni, T. Gay, and D. Froelich, Influence of deformation on physical aging of polycarbonate- 2 - Volume recovery near ambient temperature, Polymer Bulletin, 16, 381-387 (1986).
8. J. Muller, J. H. Wendorff, Thermal density- Fluctuations in rejuvenated and aged polycarbonate, Journal of Polymer Science: Part C: Polymer Letters, 26, 421 (1988).
9. J.-J. Pesce and G. B. McKenna, Prediction of the subyield extension and compression responses of glassy polycarbonate from torsional measurements, J. Rheol., 41, 5, 929-942 (1997).
10. Dr. Georgiev, GE Plastics, personal communication. 11. G. L. Wilkes, Polymers, Mechanical Behavior, in Encyclopedia of physical
science and technology, vol II, 61-84, ( ). 12. M. J. El-Hibri and D. R. Paul, Effects of uniaxaial drawing and heat-treatment on
gas sorption and transport in PVC, Journal of Applied Polymer Science, 30, 3649-3678 (1985).
13. Seungman Sohn, personal communication. 14. N. Heymans, FTIR investigation of structural modification of polycarbonate
during thermodynamical treatments, Polymer, 38, 14, 3435 (1997). 15. J. Dybal, P. Schmidt, J. Baldrian and J. Kratochvil, Ordered structures in
polycarbonate studied by infrared and raman spectroscopy, wide-angle X-ray scattering, and differential scanning calorimetry, Macromolecules, 31, 6611-6619 (1998).
16. A. C. Lunn and I. V. Yannas, Chain-backbone motion in glassy polycarbonate studied by polarized infrared spectroscopy, Journal of Polymer Science: Polymer Physics Edition, 10, 2189-2208 (1972).

Chapter 8 - Effect of orientation on the transport of gas molecules through amorphous glassy bisphenol-A polycarbonate 316
17. L. Lundberg and J.-F. Jansson, Anisotropic creep behaviour of oriented polycarbonate, Polymer, 35, 10, 2084-2089 (1994).
18. E. Ito, T. Hatakeyama, Studies of the amorphous region of polymers- II - Relationship between change of structure and glass-transition temperature in polycarbonate, Journal of Polymer Science: Polymer Physics Edition, 13, 2313-2320 (1975).
19. B. von Falkai, G. Spilgies, and H. J. Biangardi, Angew. Makromol. Chem., 108, 41 (1982).
20. H. J. Biangardi, Makromol. Chem., 183, 1785 (1982). 21. Dr. G. L. Wilkes, lecture notes. 22. E. Ito, K. Sawamura and S. Saito, Effects of drawing on molecular motions in
polycarbonate, Colloid & Polymer Sci., 253, 480-484 (1975). 23. G. Yianakopoulos, J. Vanderschueren, and J. Niezette, Effect of mechanical
deformations on thermally stimulated currents in polymers. 1. Uniaxially cold-drawn polycarboante, Proceedings of the 6th International Symposium on electrets (ISE 6), Oxford, England, 131-136 (1988).
24. G. Yianakopoulos, J. Vanderschueren, and J. Niezette, Sub-Tg relaxation in cold-drawn polymers. Thermally-stimulated-current methods, IEEE Transactions on electrical insulation, 24, 3, 429-438 (1989).
25. L. H. Wang, R. S. Porter, On the CO2 permeation of uniaxially drawn polymers, Journal of Polymer Science: Polymer Physics Edition, 22, 1645-1653 (1984).
26. M. D. Shelby, G. L. Wilkes, M. R. Tant, J. Zawada, T. J. Bastow and A. J. Hill, Amorphous orientation in glassy polycarbonate, ACS, Polymeric Materials Science and Engineering, Conference Proceedings, San Francisco, Spring 1997, 76, 485-6.
27. D. M. Colucci, G. B. McKenna, J. J. Filliben, A. Lee, D. B. Curliss, K. B. Bowman, J. D. Russell, Isochoric and isobaric glass formation: similarities and differences, Journal of Polymer Science: Physics Edition, 1561-1573 (1997).
28. L. H. Sperling, Introduction to physical polymer science, Second edition, John Wiley and Sons, 1992.
29. Dr. T. Ward, lecture notes. 30. L. Lundberg and J.-F. Jansson, Influence of physical ageing on the non-linear
viscoelasticity of polycarbonate, Polymer, 37, 8, 1311 (1996). 31. T. C. Sandreczki, X. Homg, and Y. C. Jean, Sub-glass-transition temperature
annealing of polycarbonate studied by positron annihilation spectroscopy, Macromolecules, 29, 4015-4018 (1996).
32. J. E. Kluin, Z. Yu, S. Vleeshouwers, J. D. McGervey, A. M. Jamieson, R. Simha, Temperature and time dependence of free volume in bisphenol A polycarbonate studied by positron lifetime spectroscopy, Macromolecules, 25, 19, 5089 (1992).
33. A. J. Hill, C. M. Agrawal, Positron lifetime spectroscopy characterization of thermal history effects on polycarbonate, Journal of Materials Science, 25, 5036-5042 (1990).
34. J. E. Kluin, H. Moaddel, M. Y. Ruan, Z. Yu, A. M. Jamieson, R. Simha, J. D. McGervey, Probe spectroscopy, free volume concepts, and physical aging of polymer glasses, in Structure-property relations in polymers: spectroscopy and performance, ACS, 236, 535-555 (1993).

Chapter 8 - Effect of orientation on the transport of gas molecules through amorphous glassy bisphenol-A polycarbonate 317
35. J. Bohlen and R. Kirchheim, Macroscopic volume changes versus changes of free volume as determined by positron annihilation spectroscopy for polycarbonate and polystyrene, Macromolecules, 34, 4210-4215 (2001).
36. N. Yu. Muzovskaya and A. Ya. Malkin, Influence of orientation on the diffusion characteristics of polycarbonate, Polymer Science USSR, 27, 12, 2950-2954 (1985).
37. T. L. Smith and R. E. Adam, Effect of tensile deformations on gas transport in glassy polymer films, Polymer, 22, 299-304 (1981).
38. G. Menges and F. Schmidt, Plast. Polym., 38, 13 (1970). 39. L. C. E. Struik, Internal stresses, dimensional instabilities and molecular
orientations in plastics, John Wiley and Sons, New York, 1990.

Chapter 9
Summary and recommendations for future work
9.1. Summary of the results
The objective of this work was to understand the molecular mechanism of gas
transport in amorphous glassy polymers. Especially, one question that tried to be
answered in this work was: is the gas transport process directly correlated with the overall
free volume content of amorphous glassy polycarbonate? In order to understand the
nature of the gas transport, three different conditions (cooling rate, physical aging, and
orientation) were selected in order to manipulate the free volume.
To begin, the amount of free volume present in polycarbonate was modified by
varying the cooling rate. The greater the cooling rate, the lower was the density, hence
the greater was the amount of free volume trapped in the polymeric matrix as the material
underwent a transition from the rubbery to the glassy state. An increase in the free
volume amount induced by the cooling procedure resulted in an increase in the solubility
coefficient and in a decrease in the diffusion coefficient. Although the diffusion
coefficient D and the solubility coefficient S were found to be dependent on the cooling
rate, their combined effects canceled out, and the permeability coefficient P (which
corresponds to the product of D and S) appeared to remain constant. The relative
constancy of P with an increase in free volume for all the gases studied was in

Chapter 9. Summary and recommendations for future work 319
contradiction with common expectations. The free volume arguments, however, seem to
hold well when comparing polymers of different structures with gross differences in free
volume [1, 2]. The data obtained in this research did not uphold the free volume
arguments used to explain diffusion coefficients in polymers [1-14]. Contrary to the
Doolittle equation, a decrease in the diffusion coefficient with an increase in the free
volume content was experimentally observed. The free volume theory may grossly apply
to different polymer structures, but may not discern the subtle differences of a given
polymer at different thermal histories. Furthermore, the activation energy of diffusion
was found to be greater for the fast cooled samples possessing the greater free volume
content, indicating that the free volume concepts alone cannot explain the gas transport
mechanism.
The previous results show that the free volume concepts do not apply to gas
transport. In order to explain the gas transport process, one can manipulate the processing
parameters. The free volume content for instance can be changed by aging polymers. As
the polycarbonate cooled under well-defined conditions was aged at 120oC, its density
increased linearly with the logarithm of time. Quite interestingly, the changes seen in the
density values with sub-Tg annealing had the same order of magnitude as those observed
in the cooling rate studies summarized above. Therefore if the permeability coefficient is
indeed related to the free volume content as postulated in the literature [1, 2], the
permeability coefficient should have been affected the same way in the cooling rate as in
the aging studies. However, no changes in the values of the permeability coefficients
were observed in the cooling rate studies involving fresh samples, while the permeability
coefficient of a sample cooled at a fixed rate was reduced with sub-Tg annealing. The
decrease in the permeability coefficient with physical aging was consistent with the
literature. The permeability of the larger size gas molecules decreased at a faster rate than
that of the smaller size gas molecules, reflecting possible changes in the free volume
distribution or changes in molecular chain dynamics. On one hand, the diffusion
coefficient of N2 was observed to be enhanced at short aging times and to decrease with
further sub-Tg annealing. On the other hand, the solubility coefficient of N2 tended to
increase with aging time, but the data points were too scattered to draw conclusions.

Chapter 9. Summary and recommendations for future work 320
Changes in the diffusion and solubility coefficients of O2 with aging time were however
rather small. The activation energy of diffusion of N2 was determined to increase with
aging time, in contrast with the recent literature [15].
Polycarbonate samples were also cooled at different rates and aged for 10h at
120oC. The greater the initial cooling rate, i.e. the greater the initial amount of free
volume in the materials, the greater was the decrease in tan δ with sub-Tg annealing time.
A greater densification rate has also been reported in the literature for samples containing
initially a greater amount of free volume [16, 17]. If the permeability coefficient is indeed
related to the amount of free volume, as commonly stated in the literature, the
permeability coefficient should have decreased the most for the rapidly-cooled sample.
However, this was not what was observed experimentally. The permeability coefficient
decreased the most for the sample containing initially a lowest free volume content,
despite of the lower densification rate. Again, this observation demonstrated that free
volume and permeation cannot be directly correlated. Sample containing initially a lower
free volume content, corresponding to extended aging time, demonstrated a significantly
reduced diffusion coefficient, whereas an enhanced solubility coefficient was observed
for N2. This seems to suggest that the free volume distribution may become narrower
with sub-Tg annealing and favor the formation of cavities of a size equal or slightly
greater than that of the nitrogen N2 gas molecule (3.64Å). We postulate that this process
occurs when the smaller size cavities group together to form larger size cavities. A
reduction in the amount of larger free volume sites is likely to occur with aging in order
to account for the increase in density. Alternatively, fast cooling rates may lead to highly
restricted conformations, which limit segmental mobility and lower the rate of diffusion.
Further aging can reduce the segmental mobility, but much more slowly than in relaxed
systems.
The results obtained in the cooling and in the aging studies, apparently in
contradiction with one another, lead us to believe that other mechanisms control diffusion
besides the free volume content. The experimental results were explained in terms of the
conformational rearrangements and the dynamics of the local motions. With slower
cooling or at initial aging times the population of trans-trans conformations may increase,

Chapter 9. Summary and recommendations for future work 321
eventually facilitating the temporary opening of the molecular channels, and enhancing
the diffusion process. With further annealing the degrees of freedom may be
progressively lost. The closing and opening of gaps should depend on the stiffness of the
local segments. This process may take a longer time for polymers which have been
physically aged, and affects most the gases with greater kinetic diameters. A minimum
amount of free volume may be necessary for segmental motions to take place. The
increase in the polymer relaxation times with physical aging [18] is believed to hinder the
local chain motions. The importance of the chain dynamics in the gas transport
phenomenon has actually been pointed out in a recent theoretical paper [19]. By allowing
the polymer degrees of freedom in polypropylene the diffusion coefficient could be
enhanced by as much as four orders of magnitude.
Since the temperature of the permeation experiments or the interactions between
the gas and the polymer remained constant, any changes in the solubility coefficient
could only be attributed to a redistribution of the free volume.
Unfortunately we were not able to see any influence of orientation on the gas
transport properties. The data points were too scattered to draw confident conclusions.
The experimental conditions could not be controlled as well as in the cooling and
physical aging studies. The degree of orientation was not found to be constant all over the
large area necessary for permeation measurements. In addition, the fact that permeation
experiments were performed perpendicularly to the orientation of the chains and not
along the orientation axis limited the sensitivity of transport properties to the orientation.
Overall, the density remained constant with hot-drawing, and so did the permeability
coefficient. Due to experimental problems encountered while attempting the
measurements the orientation / physical aging studies were not completed. It was also
noticed that such a study would be very complex, since deorientation and shrinkage may
take place during sub-Tg annealing.

Chapter 9. Summary and recommendations for future work 322
9.2. Recommendations for future work
1 - We have succeeded in answering the following questions that were opened:
- The free volume concepts alone cannot explain the gas transport mechanism.
- The data points suggest that all the cavity sizes in polycarbonate do not appear to
be affected equally by the aging process.
- The activation energy of diffusion increases with aging time.
In this research work, the free volume amount was changed by varying the cooling
rate or the physical aging time. Another way to change the amount of free volume inside
the amorphous polycarbonate material would be to vary the molecular weight. This
would represent one more parameter, which can verify that the relationship between the
free volume content and the gas transport properties does not hold true. The lower the
molecular weight, the greater is the number of chain ends, the greater is the number of
defects, and thus the higher is the amount of free volume inside the material [20, 21].
Imperfect packing is indeed believed to be concentrated near the chain ends that are more
mobile than the other polymer segments. The Tg and the density are expected to decrease
with a decrease in molecular weight [22, 23]. Studies have to be carried out to evaluate
the effect of the molecular weight on the gas transport properties of various polymers
since the literature remains relatively sparse on the subject. It would be interesting to
study molecular weights in a range covering both below and above the entanglement
molecular weight Me. Lin [24] has indeed shown that three characteristic slopes can be
distinguished in the plots of Tg versus molecular weight. The intercepting points were
found at Me and at about 8 Me. The study was performed on nearly monodisperse
samples of polystyrene and polybutadiene. One needs to verify if any characteristic
slopes are seen for polycarbonate as well, and if so, if the gas transport parameters do
exhibit a change in slope at those particular molecular weights. For example, the
entanglement molecular weight of polycarbonate has been determined to be 4,800 g/mol
[25]. Of course, while studying the influence of the polycarbonate molecular weight on
the gas transport properties, the polydispersity index of the various molecular weights

Chapter 9. Summary and recommendations for future work 323
could be exactly the same since the polydispersity index should affect the properties
tremendously. The standard deviation in molecular weight should be mentioned as well
for statistical reasons. Indeed, monodisperse polymers for instance do not always have a
standard deviation of zero [22]. At an ideal polydispersity of 1 (as what is observed in
nature for proteins, nucleic acids, and some polysaccharides, although molecular forces
play an important role [26]), the Tg of polycarbonate is expected to be higher than for a
polycarbonate with an economical grade having a typical polydispersity index of about 2.
An increase in the value of the Tg with a narrowness of the molecular weight distribution
has actually been reported in the literature [27, 28].
The permeability coefficient of freshly processed polycarbonate appeared to be
unaffected by the cooling rate. Such a fact suggests that the processing conditions (such
as the cooling rate) may not need to be optimized. Although bisphenol-A polycarbonate
is commonly taken as a reference in the polymer field, it does present some particularities
(those particularities have been discussed in Chapter 3). Polycarbonate may actually be a
special polymer, not to be generalized or compared with other systems. Further studies
have to be conducted to determine whether or not the permeability coefficient remains
constant with the cooling rate for other linear amorphous polymers as well. It would also
be interesting to change the polymer topology (branches, crosslinks) or the chemical
composition (copolymers, blends) while investigating the cooling rate / gas transport
relationship. Although the cooling rate may not be a critical parameter for polycarbonate,
it should affect the microphase separation in block copolymers that form domains on
cooling for instance. Although the chemical structure and the overall free volume content
may be constant, a change in morphology occurring with cooling is likely to affect the
values of the permeability coefficient. Such an observation would confirm the fact that
the free volume concept alone is not sufficient to fully explain the gas transport
phenomenon.
The data presented in the current work involving orientation and gas transport do
not show clear trends. The main problem encountered in the study dealing with
orientation was that the surface area of the film was too large to maintain a constant level

Chapter 9. Summary and recommendations for future work 324
of orientation throughout the whole permeation area. A much smaller permeation area
should be probed in order to reduce the error in the degree of orientation and in the
thickness determinations, and therefore improve the resolution of the gas transport
properties. The permeation cell should be modified accordingly. A more sensitive
pressure transducer with a lower closed volume should have been used in the permeation
apparatus. In addition, the samples should be stretched and cooled directly after
stretching inside an internal-fan oven. Moreover, since the gas transport properties of
isotropic samples were found to depend on the cooling rate, the cooling rate of oriented
samples should be readjusted for each sample depending on the thickness since thinner
samples cool faster. Once the experimental conditions have been improved, studies
should determine how the physical aging rate of polycarbonate is affected by orientation.
Indeed, data presented in the literature have reported an enhanced aging rate for oriented
samples, despite of the lower free volume content [29-35].
The results of orientation studies obtained on a particular polymer are unlikely to
be generalized to other polymers. Properties such as density and birefringence taken at
the same draw ratio have been shown to highly depend on the nature of the amorphous
polymer, as reported in a study comparing polycarbonate and PET [36]. It would have
been however better to report the results as a function of the Hermans’ orientation
function rather than as a function of the draw ratio. It is well known, nevertheless, that all
the molecular groups do not orient themselves to the same extent [37-40]. And therefore
the effect of orientation on the gas transport properties of amorphous polymers may also
depend on the structure of the polymer. This remains to be proven.
Further studies dealing with orientation could be carried out. If one could orient
the polymer chains parallel to the gas transport direction, clear changes in the gas
transport properties may be observed with orientation. The gas molecules may be capable
in this case of moving preferentially along the polymer chains. Such a process should
require less energy. As a consequence the diffusion coefficient is expected to be
increased in those studies while compared with diffusion results obtained with polymer
chains oriented perpendicularly to the gas transport direction. Results of biaxial
orientation could be compared with those concerning uniaxial orientation. It is well-

Chapter 9. Summary and recommendations for future work 325
established that the physical properties are not affected identically with those two
procedures [41].
2 – Other important aspects arise that remain to be answered.
For instance, how are the sizes and the shapes of the free volume cavities affected
by the aging process? In the physical aging studies the solubility coefficient of N2 had a
tendency to increase with aging time, whereas that of O2 remained relatively constant for
the same period. However the overall density was observed to increase with aging time in
the same observation period, hence indicated a loss of free volume with aging. The
experimental data suggest that the solubility coefficient of N2 was enhanced with aging
time, despite of the overall decrease in the free volume content. The results are believed
to reflect the dynamics of the redistribution of free volume, and the size and shape of the
free volume voids. One explanation would be that large cavities are formed by cavity
coalescence (in order to explain the increase in the solubility coefficient of N2), whereas
the free volume sites larger than the size of the N2 gas molecule and those smaller than
the size of the O2 gas molecule may decrease with aging time. Since the density increases
with aging time, the solubility coefficient of N2 is unlikely to continuously increase with
aging time as well. SN2 may remain constant or even decrease after a particular time. In
order to have a better picture of the aging process after prolonged times, one should study
what happens ultimately to the solubility of N2 (assuming that no crystals develop in the
material). Moreover, in order to understand what happens to the redistribution of free
volume with time, the polymeric matrix should be probed with gases having a greater
kinetic diameter than that of the nitrogen N2 gas molecule (kinetic diameter of 3.64Å).
Possible candidates include methane CH4 (kinetic diameter of 3.8Å), ethane C2H6 (3.9Å),
xenon Xe (3.96Å), or propane C3H8 (4.3Å). The larger free volume sites may either keep
increasing in size or be divided into smaller cavities. On one hand, one would expect that
it would be more difficult to maintain large free volume pockets in the material. On the
other hand, the physical aging process may apparent itself to the crystallization process.
Indeed, the polymer chains adopt the trans-trans conformation with aging [42, 43] and
decrease progressively their degrees of freedom, since the diffusion coefficient of N2 was

Chapter 9. Summary and recommendations for future work 326
clearly reduced with aging time. This could correspond to the pre-stages of the
crystallization phenomenon. In semi-crystalline polymers, such as polyolefins with
different types and contents of branches, the defects become concentrated in the
amorphous regions as the polymer crystallizes. The question as to whether or not the
physical aging process resembles the early stages of the crystallization phenomenon
remains opened. Knowledge of the redistribution of the free volume sizes and shapes
with aging time is important since it may explain the behavior of mechanical properties
with aging time, such as the ductile/brittle transition in impact testing for instance.
To our knowledge, only a few papers have dealt with physical aging and the
influence of the cooling rate in general. It is necessary to carry out more extensive
studies. Our work has shown that the permeability coefficient decreased more for the
slowly-cooled sample despite of the lower densification rate. Experiments such as
dilatometry, creep or stress relaxation could show opposite behaviors, as observed in
aging studies of anisotropic materials [29-35].
The effects of temperature jumps on the gas transport properties should be
investigated since changes in temperature can happen industrially on aged samples. The
memory effects discovered by Kovacs [44] may also be discernable in permeation
experiments.
Physical aging studies could be carried out both below and within the glass
transition region for polycarbonate since the SAXS electron density fluctuations were
observed to have two different behaviors in those two zones [27]. The free volume
distribution could be affected differently depending on whether the aging is performed
outside or within the glass transition region.
Furthermore, aging could affect the gas transport properties in a temperature
range where other properties such as the density seem invariant. This remains to be
proven.
It would also be interesting to determine how pressure densified samples are
affected by physical aging. Acceleration of physical aging has been reported in the
literature for pressure-densified samples [45]. A reduced local ordering or more
Chapter 9. Summary and recommendations for future work 327
disordered state was noticed by SAXS measurements on additive-free polystyrene
samples densified by application of pressure above Tg and its release at room
temperature. Despite of the much higher density those samples appeared to have a greater
segmental mobility. Enhancement of the aging of the gas transport properties could be
possibly observed for pressure-densified samples.
Physically aged instead of fresh polymers could be stretched and the resulting
changes in gas transport examined. Knowledge of the effect of stretching on aged
samples is important in food packaging for instance since polymeric films are sometimes
stored for months before use. Aging could be erased by applying a stress after aging [46].
Since the permeation properties are of commercial interest mainly at room
temperature, one needs to have an estimate of the time it takes to see a change in the
permeability coefficient. Aging studies are usually carried out at elevated temperatures
(but still in the glassy state) in order to predict how the material is going to behave with
time at much lower temperatures by extrapolation of the data. However, the densification
rate of polycarbonate has been found to increase tremendously after an aging period of
about six months at room temperature [16]. Studies need to be carried out to evaluate
how (and if) the gas transport parameters are affected by aging at room temperature after
about six months. By comparing the permeation results with the density results, any
difference between the two would prove once again that there is no direct correlation
between the free volume content and the gas transport properties. The absence of
crystallinity would have to be verified though.
In order to reproduce the conditions found in industry, aging should also be
performed under hydrolytic conditions in order to determine how the performances of the
polymeric membranes are affected. Humidity has indeed been shown to highly affect the
mechanical properties of polycarbonate [47]. Hydrolytic chain scissions have also been
found to occur in polycarbonate [48]. The effect of sunlight on aging could also maybe be
investigated if membranes are directly exposed to sunlight.

Chapter 9. Summary and recommendations for future work 328
Studies need to be carried out to investigate the effects of polymer additives
(nature, content, distribution) on the gas transport properties, as this may influence the
interactions between the polymeric matrix and the gas molecules [49], and hence affect
the solubility coefficient and consequently the overall permeability coefficient. The
influence of soluble additives such as plasticizers should be radically different from that
of non-soluble ones such as fillers.
3 – The nature of the gas transport process in polymers remains so far opened and arises directly from our work.
Since knowledge of the free volume content alone is not sufficient to predict the
gas transport properties, one needs to examine all the factors that may influence the gas
transport phenomenon. Those factors could be the followings:
- the free volume content
- the free volume distribution
- the polymer chain dynamics
- the polymer chain conformations
- the intra- and the intermolecular distances between polymer chains
- the interactions between the gas and the polymer
- the polymer chemical structure
- the polymer molecular weight and molecular weight distribution
While considering a particular polymer, the polymer local chain dynamics or the
local mobility of the polymer chains are likely to be the key factor in predicting the gas
transport properties. This suggests to us that dynamic rather than static models should be
considered. Computer simulations should be carried out to estimate how the gas transport
properties are affected as the conformations of the chains vary, and/or as the polymer
degrees of freedom are progressively lost. Nevertheless such simulations are restricted so
far by the algorithm chosen to model the transport phenomemon, as well as by the time
increments.

Chapter 9. Summary and recommendations for future work 329
Finally, this research work emphasized the fact that free volume and gas transport
properties may not be directly correlated. Nevertheless several studies have shown that
this relationship is verified when various polymer structures are considered (see Chapter
2 for details). The overall free volume content is calculated from group contribution
methods for the various chemical structures and the resulting gas transport coefficients
appear to be correlated to this free volume content. However the data points (plotted on a
logarithmic scale) tend to be too scattered to draw confident conclusions. In addition, the
correlation remains problematic for polymers containing fluorinated groups or polar
constituents.
A sufficient amount of free volume may be necessary to allow local motions to
take place. We expect that local motions, rather than the free volume content, may be
better correlated with the gas properties when one considers various polymer structures.
Some literature-based research could be done to verify if the gas transport properties
correlate better with the β-relaxation than with the free volume amount calculated from
group contribution methods for instance.
Our work has set the basis for the above questions. It could be expected to guide
the way for future research directions.
9.3. References
1. J. Y. Park, D. R. Paul, Correlation and prediction of gas permeability in glassy polymer membrane materials via a modified free volume based group contribution method, Journal of Membrane Science, 125, 23-39 (1997).
2. Y. Yampolskii, S. Shishatskii, A. Alentiev, K. Loza, Correlations with and prediction of activation energies of gas permeation and diffusion in glassy polymers, Journal of Membrane Science, 148, 59-69 (1998).
3. M. H. Cohen and D. Turnbull, J. Chem. Phys., 31, 1164 (1959). 4. J. S. Vrentas and J. L. Duda, J. Polym. Sci., 15, 403 (1977). 5. J. S. Vrentas and J. L. Duda, J. Polym. Sci., 15, 417 (1977). 6. J. L. Duda and J. M. Zielinski, Free-Volume Theory, Plastics Engineering, 32,
143 (1996). 7. H. Fujita, Fortschr. Hochpolym. Forsch., 3, 1 (1961). 8. W. M. Lee, Selection of barrier materials from molecular structure, Polym. Eng.
Sci., 20, 65-69 (1980).

Chapter 9. Summary and recommendations for future work 330
9. E. R. Hensema, M. H. V. Mulder and C. A. Smolders, On the Mechanism of Gas Transport in Rigid Polymer Membranes, Journal of Applied Polymer Science, 49, 2081 (1993).
10. D. R. Paul, Yuri P. Yampol’skii, editors, Polymeric gas separation membranes, CRC Press, Boca Raton, 1994. 11. Y. Kobayashi, K. Haraya, S. Hattori, Polymer, 35, 925-928 (1994). 12. S. Trohalaki, L. C. DeBolt, J. E. Mark, H. L. Frisch, Macromolecules, 23, 813-
816 (1990). 13. Y. Maeda and D. R. Paul, Effect of AntiPlasticization on Gas Sorption and
Transport. III. Free Volume Interpretation, Journal of Polymer Science: Part B: Polymer Physics, 25, 1005 (1987).
14. A. Thran, G. Kroll, F. Faupel, Correlation between fractional free volume and diffusivity of gas molecules in glassy polymers, Journal of Polymer Science: Part B: Polymer Physics, 37, 3344-3358 (1999).
15. P. Pekarski, J. Hampe, I Böhm, H.-G. Brion, and R. Kirchheim, Effect of aging and conditioning on diffusion and sorption of small molecules in polymer glasses, Macromolecules, 33, 2192-2199 (2000).
16. R. Wimberger-Friedl and J. G. de Bruin, The very long-term volume recovery of polycarbonate: is self-retardation finite? Macromolecules, 29, 4992-4997 (1996).
17. U. Kriesten and J. M. Hutchinson, On the use of a density gradient column to monitor the physical ageing of polystyrene, Polymer, 33, 22, 4875-4877 (1992).
18. L. C. E. Struik, Physical aging in amorphous polymers and other materials, Elsevier, New York, 1978.
19. P. S. Rallabandi, A. P. Thompson, and D. M. Ford, A molecular modeling study of entropic and energic selectivities in air separation with glassy polymers, Macromolecules, 33, 3142-3152 (2000).
20. M. Hedenqvist, A. Angelstok, L. Edsberg, P. T. Larsson and U. Q. Gedde, Diffusion of Small - Molecule Penetrants in Polyethylene: Free Volume and Morphology, Polymer, 37, #14, 2887 (1996).
21. W. C. Yu, C. S. P. Sung, R. E. Robertson, Macromolecules, 21, 355 (1988). 22. Dr. Hervé Marand, lecture notes. 23. L. H. Sperling, Introduction to physical polymer science, Second edition, John
Wiley and Sons, 1992. 24. Y.-H. Lin, Entanglement and the molecular weight dependence of polymer glass
transition temperature, Macromolecules,23, 5292-5294 (1990). 25. Richard P. Wool, Polymer Interfaces- Structure and Strength, Hanser Publishers,
1995. 26. H. S. Chan and K. A. Dill, The protein folding problem, Physics Today, 24-32,
February (1993). 27. J. J. Curro and R.-J. Roe, Isothermal relaxation of specific volume and density
fluctuation in poly(methyl methacrylate) and polycarbonate, Polymer, 25, 1424 (1984).
28. R.-J. Roe and J. J. Curro, Small-angle X-ray scattering study of density fluctuation in polystyrene annealed below the glass transition temperature, Macromolecules, 16, 428 (1983).

Chapter 9. Summary and recommendations for future work 331
29. J. Bartos, J. Muller, J. H. Wendorff, Physical ageing of isotropic and anisotropic polycarbonate, Polymer, 31, 1678 (1990).
30. M. D. Shelby and G. L. Wilkes, Thermodynamic characterization of the oriented state of bisphenol A polycarbonate as it pertains to enhanced physical aging, Journal of Polymer Science: Part B: Polymer Physics, 36, 2111 (1998).
31. R. Pixa, B. Grisoni, T. Gay, and D. Froelich, Influence of deformation on physical aging of polycarbonate- 2 - Volume recovery near ambient temperature, Polymer Bulletin, 16, 381-387 (1986).
32. M.-S. S. Wu, Intrinsic birefringence of amorphous poly(bisphenol-A carbonate), Journal of Applied Polymer Science, 32, 3263-3275 (1986).
33. M. D. Shelby and G. L. Wilkes, The effect of molecular orientation on the physical ageing of amorphous polymers - dilatometric and mechanical creep behaviour, Polymer, 39, 26, 6767-6779 (1998).
34. J. Muller, J. H. Wendorff, Thermal density- Fluctuations in rejuvenated and aged polycarbonate, Journal of Polymer Science: Part C: Polymer Letters, 26, 421 (1988).
35. J.-J. Pesce and G. B. McKenna, Prediction of the subyield extension and compression responses of glassy polycarbonate from torsional measurements, J. Rheol., 41, 5, 929-942 (1997).
36. E. Ito, K. Sawamura and S. Saito, Effects of drawing on molecular motions in polycarbonate, Colloid & Polymer Sci., 253, 480-484 (1975).
37. A. Ameri, S. Ekgasit, C. Hendann, S. Michel, P. Wu, S. Okretic, F. Pfeifer, I. Zebger and H. W. Siesler, Towards a better understanding of segmental mobility in polymers under external perturbations: time-resolved FTIR studies, ACS, Polymeric Materials Science and Engineering, Conference Proceedings, San Francisco, Spring 1997, 76, 191-2.
38. E. Ito, T. Hatakeyama, Studies of the amorphous region of polymers- II - Relationship between change of structure and glass-transition temperature in polycarbonate, Journal of Polymer Science: Polymer Physics Edition, 13, 2313-2320 (1975).
39. A. C. Lunn and I. V. Yannas, Chain-backbone motion in glassy polycarbonate studied by polarized infrared spectroscopy, Journal of Polymer Science: Polymer Physics Edition, 10, 2189-2208 (1972).
40. U. S. Despande, G. Thyagarajan, Indian J. Pure Appl. Phys., 20, 846 (1982). 41. Dr. G. L. Wilkes, lecture notes. 42. J. Lu, Y. Wang, and D. Chen, Infrared spectroscopic and modulated differential
scanning calorimetry study of physical aging in bisphenol-A polycarbonate, Polymer Journal, 32, 7, 610-615 (2000).
43. N. Heymans, FTIR investigation of structural modification of polycarbonate during thermodynamical treatments, Polymer, 38, 14, 3435 (1997).
44. A. J. Kovacs, Transition vitreuse dans les polymeres amorphes- Etude phenomenologique, Fortschr. Hochpolym.- Forsch., 394-507 (1963).
45. H. H. Song and R.-J. Roe, Structural change accompanying volume change in amorphous polystyrene as studied by small and intermediate angle X-ray scattering, Macromolecules, 20, 2723-2732 (1987).

Chapter 9. Summary and recommendations for future work 332
46. R. P. Chartoff, Thermoplastic polymers, in Thermal characterization of polymeric materials, E. A. Turi, edt, Academic Press, NY, 548-573 (1997).
47. C.-H. Wang, The effect of humidity and temperature on mechanical properties of PC and PC/ABS, ANTEC’95, 1946 (1995).
48. I. Ghorbel, F. Thominette, P. Spiteri, J. Verdu, Hydrolytic aging of polycarbonate. I-physical aspects, Journal of Applied Polymer Science, 55, 163 (1995).
49. W. R. Vieth, L. H. Dao, and H. Pedersen, Non-equilibrium microstructural and transport characteristics of glassy poly(ethylene terephthalate), Journal of Membrane Science, 60, 41-62 (1991).

Vita
Christelle Marie Laot was born on April 4, 1973, in Provins, France. She grew up in the Celtic region of France, in rural Brittany. She was raised with French as her mother tongue rather than Breton as was common for previous generations. Christelle graduated from high school in 1991 with a Baccalauréat in Mathematics and Physics. She then entered the five-year engineering program at UTC Compiègne in the north-east of Paris, France.
As an undergraduate student, Christelle spent most of her summer vacations working for various companies, mainly in the food industry. Besides her studies, she volunteered for two years to teach Mathematics to children living in poor neighborhoods where French was not the primary language. She also went to Russia for a short period of time thanks to an exchange program with her Engineering School. While working on a six-month European confidential research project (Fall 1994) in R&D for Sicof Inc., France, she got involved in measuring the properties of conductive polymeric coatings. Finally, she was selected by her Engineering School among fourth year students to complete her fifth and last year of her undergraduate education as an exchange student in the United States. She participated in the UTC- VPI&SU exchange program and enrolled in August 1995 in the Master of Science program in Chemical Engineering at Virginia Tech, USA.
After Christelle had successfully defended her Master of Science degree in August 1997, she started to work towards her PhD degree in Chemical Engineering at Virginia Tech with a specialization in polymer science and engineering. She received her Diplôme d’Ingénieur UTC in Process Engineering in November 1997. In July 2000, she left the United States to finish writing her dissertation in Europe. She briefly came back in April 2001 to give her required departmental seminar.
Christelle has been employed since May 2001 as a research scientist at Bayer AG (Leverkusen, Germany) in the Polymer Physics Group.