gasb 75 schedule - group life insurance plan - 2018€¦ · system group life insurance (gli) plan,...
TRANSCRIPT

VIRGINIA RETIREMENT SYSTEM GROUP LIFE INSURANCE PLAN
GASB No. 75 Schedules
With Independent Auditor’s Report Thereon
For the Fiscal Year Ended June 30, 2017 With Select Comparative Information for the Fiscal Year Ended June 30, 2016

Page 2 of 87
Table of Contents
Independent Auditor’s Report………………………………………………………………………………………3 VRS Group Life Insurance Plan – Schedule of Employer Allocations………..……………………………………….………………………….6 VRS Group Life Insurance Plan – Schedule of Net GLI OPEB Liability and Total GLI OPEB Expense ......………………………29 VRS Group Life Insurance Plan – Schedule of Deferred Outflows and Deferred Inflows
of Resources by Employer……………………………………………………………………………..….52 VRS Group Life Insurance Plan – Notes to GASB No. 75 Schedules…………………………………………………………………………….75
Page 3 of 87
September 5, 2018 Board of Trustees Virginia Retirement System 1200 E. Main Street Richmond, VA 23219
INDEPENDENT AUDITOR’S REPORT
Report on the Schedules
We have audited the accompanying schedule of employer allocations of the Virginia Retirement System Group Life Insurance (GLI) Plan, as of and for the years ended June 30, 2017 and June 30, 2016, and the related notes. We have also audited the total for all employers, of the columns titled net GLI OPEB liability as of and for the years ended June 30, 2017, and June 30, 2016, and total GLI OPEB expense as of and for the year ended June 30, 2017, included in the accompanying schedule of net GLI OPEB liability and total GLI OPEB expense of the Virginia Retirement System Group Life Insurance Plan, and the related notes. In addition, we have audited the total for all employers of the columns titled total deferred outflows of resources and total deferred inflows of resources included in the accompanying schedule of deferred outflows and deferred inflows of resources by employer of the Virginia Retirement System Group Life Insurance Plan, as of and for the year ended June 30, 2017, and the related notes.
Management's Responsibility for the Schedule
The Virginia Retirement System’s management is responsible for the preparation and fair presentation of these schedules in accordance with accounting principles generally accepted in the United States of America; this includes the design, implementation, and maintenance of internal control relevant to the preparation and fair presentation of the schedules that are free from material misstatement, whether due to fraud or error.
Auditor's Responsibility
Our responsibility is to express opinions on the schedule of employer allocations and the columns titled net GLI OPEB liability, total GLI OPEB liability, total deferred outflows of resources, and total deferred inflows of resources (specified column totals) included in the schedule of net GLI OPEB liability
www.apa.virginia.gov | (804) 225-3350 | [email protected]
Page 4 of 87
and total GLI OPEB expense and the schedule of deferred outflows and deferred inflows of resources by employer based on our audit. We conducted our audit in accordance with auditing standards generally accepted in the United States of America. Those standards require that we plan and perform the audit to obtain reasonable assurance about whether the schedule of employer allocations and specified column totals included in the schedule of net GLI OPEB liability and total GLI OPEB expense and the schedule of deferred outflows and deferred inflows of resources by employer are free from material misstatement.
An audit involves performing procedures to obtain audit evidence about the amounts and disclosures in the schedule of employer allocations and the specified column totals included in the schedule of net GLI OPEB liability and total GLI OPEB expense and the schedule of deferred outflows and deferred inflows of resources by employer. The procedures selected depend on the auditor's judgment, including the assessment of the risks of material misstatement of the schedule of employer allocations and the specified column totals included in the schedule of net GLI OPEB liability and total GLI OPEB expense and the schedule of deferred outflows and deferred inflows of resources by employer, whether due to fraud or error. In making those risk assessments, the auditor considers internal control relevant to the entity's preparation and fair presentation of the schedule of employer allocations and the specified column totals included in the schedule of net GLI OPEB liability and total GLI OPEB expense and the schedule of deferred outflows and deferred inflows of resources by employer in order to design audit procedures that are appropriate in the circumstances, but not for the purpose of expressing an opinion on the effectiveness of the entity's internal control. Accordingly, we express no such opinion. An audit also includes evaluating the appropriateness of accounting policies used and the reasonableness of significant accounting estimates made by the Virginia Retirement System management, as well as evaluating the overall presentation of the schedule of employer allocations and the specified column totals included in the schedule of net GLI OPEB liability and total GLI OPEB expense and the schedule of deferred outflows and deferred inflows of resources by employer.
We believe that the audit evidence we have obtained is sufficient and appropriate to provide a
basis for our audit opinions.
Opinions
In our opinion, the schedules referred to above present fairly, in all material respects, the employer allocations and the net GLI OPEB liability as of and for the years ended June 30, 2017, and June 30, 2016, and total deferred outflows of resources, total deferred inflows of resources, and total GLI OPEB expense as of and for the year ended June 30, 2017, for the total of all participating employers for the Virginia Retirement System Group Life Insurance Plan in accordance with accounting principles generally accepted in the United States of America.
Other Matter
We have audited, in accordance with auditing standards generally accepted in the United States of America and the standards applicable to financial audits contained in Government Auditing Standards, issued by the Comptroller General of the United States, the financial statements of the Virginia

Page 5 of 87
Retirement System as of and for the year ended June 30, 2017, and our report thereon, dated December 15, 2017, expressed an unmodified opinion on those financial statements. Restriction on Use
Our report is intended solely for the information and use of the Virginia Retirement System management, the Virginia Retirement System Board of Trustees, the Commonwealth Joint Legislative Audit and Review Commission, and the Virginia Retirement System Group Life Insurance Plan employers and their auditors, and is not intended to be and should not be used by anyone other than these specified parties.
AUDITOR OF PUBLIC ACCOUNTS
ZLB/clj

Page 6 of 87
Virginia Retirement System VRS Group Life Insurance Plan
Schedule of Employer Allocations – Page 1 of 23 For the Fiscal Year Ended June 30, 2017 and 2016
Employer EmployerEmployer Employer Allocation Employer Allocation
Code Employer Contributions Percentage Contributions PercentageState:
1XXXX Judicial Retirement System Employees 319,781$ 0.37074% 348,401$ 0.36323%2XXXX State Police Officers' Retirement System Employees 550,573 0.63830% 581,249 0.60600%35885 Fort Monroe Federal Area Development Authority 6,197 0.00718% 6,631 0.00691%3XXXX All Other State Agency Employees 23,918,292 27.72927% 26,353,420 27.47554%7XXXX Virginia Law Officers' Retirement System Employees 1,665,165 1.93045% 1,798,946 1.87553%
Sub-total State 26,460,008$ 30.67594% 29,088,647$ 30.32721%Teachers:
40100 Accomack County School Board 124,847$ 0.14474% 141,249$ 0.14726%40101 Albemarle County Schools 411,696 0.47729% 461,605 0.48126%40102 Alleghany County School Board 56,883 0.06595% 60,848 0.06344%40103 Amelia County School Board 39,593 0.04590% 44,954 0.04687%40104 Amherst County School Board 113,237 0.13128% 120,420 0.12555%40105 Appomattox County School Board 49,446 0.05732% 57,109 0.05954%40106 Arlington Public Schools 1,314,583 1.52404% 1,502,503 1.56648%40107 Augusta County School Board 265,599 0.30792% 301,205 0.31403%40108 Bath County School Board 21,934 0.02543% 24,100 0.02513%40109 Bedford County School Board 230,972 0.26777% 250,959 0.26165%40110 Bland County School Board 17,769 0.02060% 20,160 0.02102%40111 Botetourt County Schools 126,095 0.14619% 139,985 0.14595%40112 Brunswick County Public Schools 45,560 0.05282% 50,324 0.05247%40113 Buchanan County School Board 70,557 0.08180% 73,850 0.07699%40114 Buckingham County School Board 51,359 0.05954% 55,482 0.05785%40115 Campbell County School Board 179,945 0.20862% 194,956 0.20326%40116 Caroline County School Board 94,520 0.10958% 107,398 0.11197%40117 Carroll County School Board 97,624 0.11318% 112,124 0.11690%40118 Charles City County School Board 21,580 0.02502% 24,237 0.02527%40119 Charlotte County School Board 53,116 0.06158% 57,732 0.06019%40120 Chesterfield County School Board 1,334,121 1.54669% 1,512,309 1.57670%40121 Clarke County School Board 56,000 0.06492% 62,315 0.06497%40122 Craig County School Board 16,860 0.01955% 18,166 0.01894%
June 30, 2016 June 30, 2017

Page 7 of 87
Virginia Retirement System VRS Group Life Insurance Plan
Schedule of Employer Allocations – Page 2 of 23 For the Fiscal Year Ended June 30, 2017 and 2016
Employer EmployerEmployer Employer Allocation Employer Allocation
Code Employer Contributions Percentage Contributions Percentage40123 Culpeper County School Board 202,293 0.23452% 225,960 0.23558%40124 Cumberland County School Board 37,367 0.04332% 41,859 0.04364%40125 Dickenson County School Board 51,176 0.05933% 50,100 0.05223%40126 Dinwiddie County School Board 106,676 0.12367% 121,362 0.12653%40128 Essex County Public Schools 39,200 0.04545% 42,237 0.04403%40129 Fairfax County School Board 6,598,925 7.65036% 7,482,781 7.80137%40130 Fauquier County School Board 346,512 0.40172% 380,267 0.39646%40131 Floyd County School Board 48,911 0.05671% 52,933 0.05519%40132 Fluvanna County Public Schools 112,226 0.13011% 123,022 0.12826%40133 Franklin County Public Schools 188,419 0.21844% 214,115 0.22323%40134 Frederick County School Board 404,271 0.46869% 445,640 0.46462%40135 Giles County Schools 57,184 0.06630% 63,118 0.06581%40136 Gloucester County School Board 135,989 0.15766% 156,616 0.16329%40137 Goochland County School Board 69,090 0.08010% 77,355 0.08065%40138 Grayson County School Board 40,406 0.04685% 46,294 0.04826%40139 Greene County Public Schools 79,854 0.09258% 89,378 0.09318%40140 Greensville County School Board 58,824 0.06820% 64,816 0.06758%40141 Halifax County School Board 135,692 0.15731% 145,653 0.15185%40142 Hanover County School Board 464,059 0.53800% 520,280 0.54244%40143 Henrico County School Board 1,219,796 1.41415% 1,357,662 1.41547%40144 Henry County Public Schools 168,768 0.19566% 188,849 0.19689%40145 Highland County Public Schools 8,577 0.00995% 9,939 0.01036%40146 Isle of Wight County Schools 136,004 0.15767% 150,730 0.15715%40148 King George County School Board 97,351 0.11286% 118,335 0.12337%40149 King & Queen County School Board 20,469 0.02373% 23,180 0.02417%40150 King William County School Board 55,887 0.06479% 61,448 0.06406%40151 Lancaster County Public Schools 35,704 0.04139% 40,138 0.04185%40152 Lee County School Board 85,537 0.09917% 95,746 0.09982%40153 Loudoun County School Board 2,433,288 2.82099% 2,821,840 2.94199%40154 Louisa County Public Schools 126,744 0.14694% 140,770 0.14677%40155 Lunenburg County School Board 39,510 0.04581% 39,677 0.04137%
June 30, 2016 June 30, 2017

Page 8 of 87
Virginia Retirement System VRS Group Life Insurance Plan
Schedule of Employer Allocations – Page 3 of 23 For the Fiscal Year Ended June 30, 2017 and 2016
Employer EmployerEmployer Employer Allocation Employer Allocation
Code Employer Contributions Percentage Contributions Percentage40156 Madison County School Board 45,745 0.05303% 52,223 0.05445%40157 Mathews County School Board 30,698 0.03559% 34,179 0.03564%40158 Mecklenburg County School Board 106,617 0.12361% 115,459 0.12038%40159 Middlesex County School Board 34,494 0.03999% 38,253 0.03988%40160 Montgomery County School Board 227,529 0.26378% 258,038 0.26902%40162 Nelson County Public Schools 54,167 0.06280% 59,046 0.06156%40163 New Kent County School Board 72,061 0.08354% 81,862 0.08535%40165 Northampton County Schools 43,454 0.05038% 47,791 0.04982%40166 Northumberland County School Board 36,233 0.04200% 40,789 0.04253%40167 Nottoway County School Board 52,810 0.06123% 58,908 0.06141%40168 Orange County Public Schools 125,334 0.14530% 136,718 0.14254%40169 Page County Public Schools 87,615 0.10157% 95,535 0.09960%40170 Patrick County School Board 62,276 0.07220% 69,489 0.07245%40171 Pittsylvania County School Board 193,522 0.22436% 215,001 0.22416%40172 Powhatan County School Board 111,104 0.12880% 123,992 0.12927%40173 Prince Edward County School Board 56,945 0.06602% 60,541 0.06312%40174 Prince George County School Board 154,185 0.17875% 168,151 0.17531%40176 Prince William County School Board 2,391,677 2.77275% 2,720,836 2.83668%40177 Pulaski County School Board 102,879 0.11927% 113,316 0.11814%40178 Rappahannock County School Board 27,181 0.03151% 29,774 0.03104%40179 Richmond County School Board 30,267 0.03509% 34,318 0.03578%40180 Roanoke County School Board 347,735 0.40314% 400,196 0.41724%40181 Rockbridge County School Board 75,872 0.08796% 83,797 0.08737%40182 Rockingham County School Board 302,707 0.35094% 335,222 0.34950%40183 Russell County School Board 86,114 0.09983% 93,780 0.09777%40184 Scott County School Board 91,976 0.10663% 103,442 0.10785%40185 Shenandoah County School Board 162,190 0.18803% 178,597 0.18620%40186 Smyth County School Board 108,784 0.12612% 117,551 0.12255%40187 Southampton County School Board 60,231 0.06983% 66,662 0.06950%40188 Spotsylvania County School Board 596,264 0.69127% 654,943 0.68283%40189 Stafford County School Board 690,132 0.80009% 790,750 0.82442%
June 30, 2016 June 30, 2017
Page 9 of 87
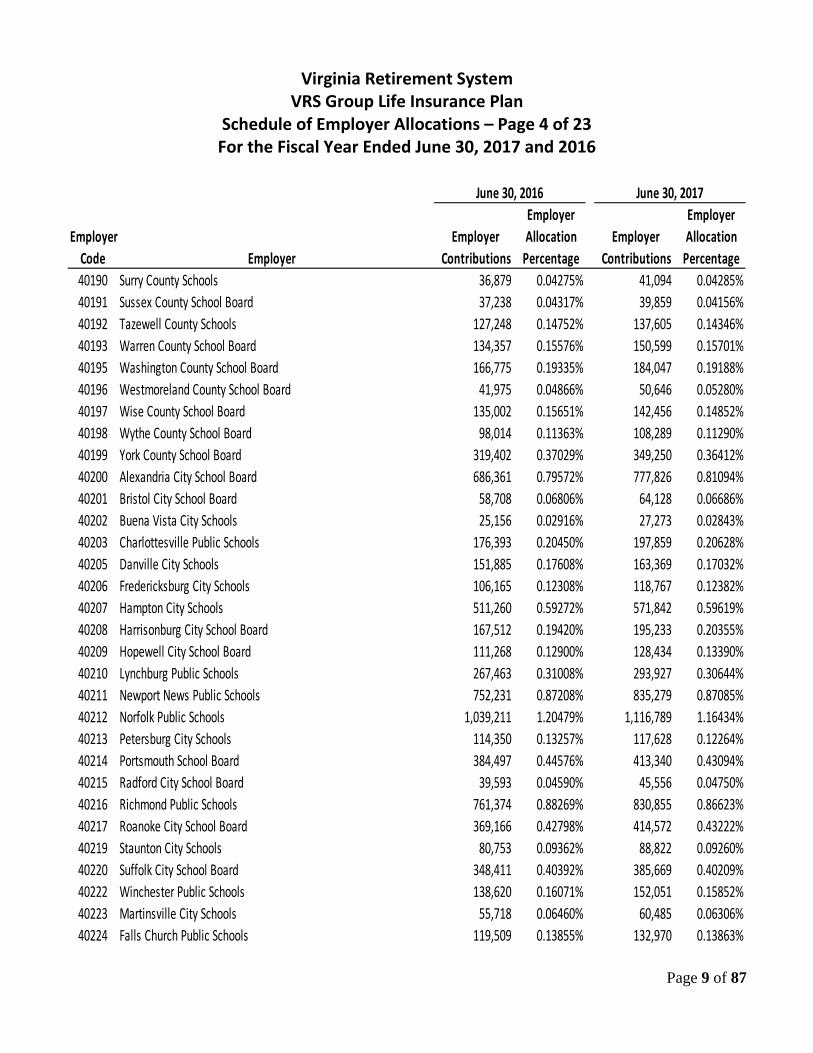
Virginia Retirement System VRS Group Life Insurance Plan
Schedule of Employer Allocations – Page 4 of 23 For the Fiscal Year Ended June 30, 2017 and 2016
Employer EmployerEmployer Employer Allocation Employer Allocation
Code Employer Contributions Percentage Contributions Percentage40190 Surry County Schools 36,879 0.04275% 41,094 0.04285%40191 Sussex County School Board 37,238 0.04317% 39,859 0.04156%40192 Tazewell County Schools 127,248 0.14752% 137,605 0.14346%40193 Warren County School Board 134,357 0.15576% 150,599 0.15701%40195 Washington County School Board 166,775 0.19335% 184,047 0.19188%40196 Westmoreland County School Board 41,975 0.04866% 50,646 0.05280%40197 Wise County School Board 135,002 0.15651% 142,456 0.14852%40198 Wythe County School Board 98,014 0.11363% 108,289 0.11290%40199 York County School Board 319,402 0.37029% 349,250 0.36412%40200 Alexandria City School Board 686,361 0.79572% 777,826 0.81094%40201 Bristol City School Board 58,708 0.06806% 64,128 0.06686%40202 Buena Vista City Schools 25,156 0.02916% 27,273 0.02843%40203 Charlottesville Public Schools 176,393 0.20450% 197,859 0.20628%40205 Danville City Schools 151,885 0.17608% 163,369 0.17032%40206 Fredericksburg City Schools 106,165 0.12308% 118,767 0.12382%40207 Hampton City Schools 511,260 0.59272% 571,842 0.59619%40208 Harrisonburg City School Board 167,512 0.19420% 195,233 0.20355%40209 Hopewell City School Board 111,268 0.12900% 128,434 0.13390%40210 Lynchburg Public Schools 267,463 0.31008% 293,927 0.30644%40211 Newport News Public Schools 752,231 0.87208% 835,279 0.87085%40212 Norfolk Public Schools 1,039,211 1.20479% 1,116,789 1.16434%40213 Petersburg City Schools 114,350 0.13257% 117,628 0.12264%40214 Portsmouth School Board 384,497 0.44576% 413,340 0.43094%40215 Radford City School Board 39,593 0.04590% 45,556 0.04750%40216 Richmond Public Schools 761,374 0.88269% 830,855 0.86623%40217 Roanoke City School Board 369,166 0.42798% 414,572 0.43222%40219 Staunton City Schools 80,753 0.09362% 88,822 0.09260%40220 Suffolk City School Board 348,411 0.40392% 385,669 0.40209%40222 Winchester Public Schools 138,620 0.16071% 152,051 0.15852%40223 Martinsville City Schools 55,718 0.06460% 60,485 0.06306%40224 Falls Church Public Schools 119,509 0.13855% 132,970 0.13863%
June 30, 2016 June 30, 2017

Page 10 of 87
Virginia Retirement System VRS Group Life Insurance Plan
Schedule of Employer Allocations – Page 5 of 23 For the Fiscal Year Ended June 30, 2017 and 2016
Employer EmployerEmployer Employer Allocation Employer Allocation
Code Employer Contributions Percentage Contributions Percentage40225 Colonial Heights City Schools 88,046 0.10208% 97,143 0.10128%40230 Covington City School Board 24,948 0.02892% 29,293 0.03054%40231 Fairfax City School Board 429 0.00050% 485 0.00051%40232 Franklin City Public Schools 36,827 0.04269% 39,763 0.04145%40233 Chesapeake Public Schools 1,050,010 1.21731% 1,175,336 1.22538%40234 Virginia Beach City School Board 1,883,259 2.18332% 2,087,447 2.17633%40236 Manassas Park City Schools 102,260 0.11855% 109,207 0.11386%40306 Town of West Point School Board 23,130 0.02681% 27,900 0.02909%40307 Lexington City School Board 12,584 0.01459% 14,427 0.01504%40308 Waynesboro Public Schools 83,806 0.09716% 93,776 0.09777%40309 Town of Colonial Beach Schools 16,401 0.01901% 18,877 0.01968%40313 Galax City Schools 33,652 0.03901% 36,931 0.03850%40314 Norton City Schools 18,292 0.02121% 19,625 0.02046%40332 Manassas City Schools 265,667 0.30800% 290,728 0.30311%40335 City of Salem Schools 102,701 0.11906% 113,513 0.11835%40402 Williamsburg-James City County School Board 320,698 0.37180% 356,000 0.37116%40403 Poquoson City Public Schools 53,445 0.06196% 59,711 0.06225%40410 Valley Vocational Technical Center 9,283 0.01076% 10,228 0.01066%40412 Charlottesville/Albemarle Vo-Tech Center 5,064 0.00587% 6,050 0.00631%40413 The Pruden Center for Industry and Technology 7,026 0.00815% 6,957 0.00725%40414 Jackson River Technical Center 3,961 0.00459% 2,869 0.00299%40415 New Horizons Technical Center 37,765 0.04378% 43,090 0.04492%40416 Northern Neck Regional Vocational Center 5,520 0.00640% 5,777 0.00602%40417 Rowanty Vocational Technical Center 3,491 0.00405% 3,901 0.00407%40418 Amelia-Nottoway Vocational Center 994 0.00115% 1,113 0.00116%40421 Northern Neck Regional Special Education Program 3,531 0.00409% 4,192 0.00437%40423 Maggie Walker Governor's School for Govt & Intl Studies 20,322 0.02356% 22,772 0.02374%40424 Appomattox Region Governor's School 8,477 0.00983% 8,953 0.00934%40425 Bridging Communities Regional Career and Tech Center 2,186 0.00254% 2,424 0.00253%
Sub-total Teachers 36,753,673$ 42.60973% 41,190,256$ 42.94409%
June 30, 2016 June 30, 2017

Page 11 of 87
Virginia Retirement System VRS Group Life Insurance Plan
Schedule of Employer Allocations – Page 6 of 23 For the Fiscal Year Ended June 30, 2017 and 2016
Employer EmployerEmployer Employer Allocation Employer Allocation
Code Employer Contributions Percentage Contributions PercentagePoliticial Subdivisions:
55100 Accomack County 53,032$ 0.06148% 58,801$ 0.06130%55101 Albemarle County 184,674 0.21410% 204,632 0.21335%55102 Alleghany County 33,279 0.03858% 37,938 0.03955%55103 Amelia County 18,871 0.02188% 20,661 0.02154%55104 Amherst County 36,074 0.04182% 41,985 0.04377%55105 Appomattox County 19,285 0.02236% 21,124 0.02202%55107 Augusta County 91,237 0.10577% 104,914 0.10938%55108 Bath County 13,012 0.01509% 13,527 0.01410%55109 Bedford County 81,259 0.09421% 96,622 0.10074%55110 Bland County 10,121 0.01173% 11,719 0.01222%55111 Botetourt County 53,965 0.06256% 60,295 0.06286%55112 Brunswick County 21,720 0.02518% 24,983 0.02605%55113 Buchanan County 51,846 0.06011% 54,169 0.05648%55114 Buckingham County 19,521 0.02263% 21,285 0.02219%55115 Campbell County 63,126 0.07318% 68,576 0.07150%55116 Caroline County 48,599 0.05634% 55,265 0.05762%55117 Carroll County 36,583 0.04241% 39,972 0.04167%55118 Charles City County 14,062 0.01630% 15,996 0.01668%55119 Charlotte County 19,844 0.02301% 22,049 0.02299%55120 Chesterfield County 866,726 1.00482% 959,339 1.00018%55121 Clarke County 21,010 0.02436% 24,048 0.02507%55122 Craig County 6,667 0.00773% 7,994 0.00833%55123 Culpeper County 80,811 0.09369% 92,841 0.09680%55124 Cumberland County 15,365 0.01781% 17,003 0.01773%55126 Dinwiddie County 42,008 0.04870% 49,941 0.05207%55128 Essex County 18,489 0.02144% 19,928 0.02078%55130 Fauquier County 159,225 0.18459% 178,438 0.18604%55131 Floyd County 17,484 0.02027% 20,563 0.02144%55132 Fluvanna County 29,753 0.03449% 34,086 0.03554%55133 Franklin County 62,584 0.07256% 72,521 0.07561%
June 30, 2016 June 30, 2017
Page 12 of 87
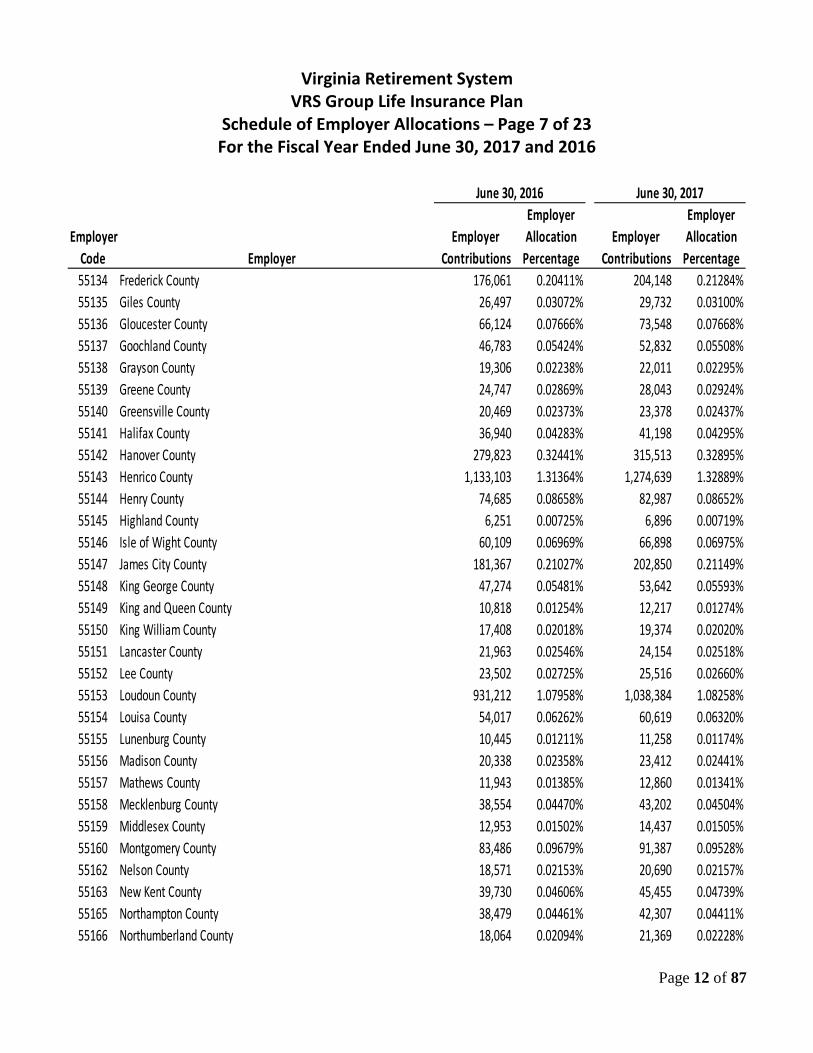
Virginia Retirement System VRS Group Life Insurance Plan
Schedule of Employer Allocations – Page 7 of 23 For the Fiscal Year Ended June 30, 2017 and 2016
Employer EmployerEmployer Employer Allocation Employer Allocation
Code Employer Contributions Percentage Contributions Percentage55134 Frederick County 176,061 0.20411% 204,148 0.21284%55135 Giles County 26,497 0.03072% 29,732 0.03100%55136 Gloucester County 66,124 0.07666% 73,548 0.07668%55137 Goochland County 46,783 0.05424% 52,832 0.05508%55138 Grayson County 19,306 0.02238% 22,011 0.02295%55139 Greene County 24,747 0.02869% 28,043 0.02924%55140 Greensville County 20,469 0.02373% 23,378 0.02437%55141 Halifax County 36,940 0.04283% 41,198 0.04295%55142 Hanover County 279,823 0.32441% 315,513 0.32895%55143 Henrico County 1,133,103 1.31364% 1,274,639 1.32889%55144 Henry County 74,685 0.08658% 82,987 0.08652%55145 Highland County 6,251 0.00725% 6,896 0.00719%55146 Isle of Wight County 60,109 0.06969% 66,898 0.06975%55147 James City County 181,367 0.21027% 202,850 0.21149%55148 King George County 47,274 0.05481% 53,642 0.05593%55149 King and Queen County 10,818 0.01254% 12,217 0.01274%55150 King William County 17,408 0.02018% 19,374 0.02020%55151 Lancaster County 21,963 0.02546% 24,154 0.02518%55152 Lee County 23,502 0.02725% 25,516 0.02660%55153 Loudoun County 931,212 1.07958% 1,038,384 1.08258%55154 Louisa County 54,017 0.06262% 60,619 0.06320%55155 Lunenburg County 10,445 0.01211% 11,258 0.01174%55156 Madison County 20,338 0.02358% 23,412 0.02441%55157 Mathews County 11,943 0.01385% 12,860 0.01341%55158 Mecklenburg County 38,554 0.04470% 43,202 0.04504%55159 Middlesex County 12,953 0.01502% 14,437 0.01505%55160 Montgomery County 83,486 0.09679% 91,387 0.09528%55162 Nelson County 18,571 0.02153% 20,690 0.02157%55163 New Kent County 39,730 0.04606% 45,455 0.04739%55165 Northampton County 38,479 0.04461% 42,307 0.04411%55166 Northumberland County 18,064 0.02094% 21,369 0.02228%
June 30, 2016 June 30, 2017

Page 13 of 87
Virginia Retirement System VRS Group Life Insurance Plan
Schedule of Employer Allocations – Page 8 of 23 For the Fiscal Year Ended June 30, 2017 and 2016
Employer EmployerEmployer Employer Allocation Employer Allocation
Code Employer Contributions Percentage Contributions Percentage55167 Nottoway County 15,710 0.01821% 17,536 0.01828%55168 Orange County 46,874 0.05434% 53,440 0.05572%55169 Page County 32,298 0.03745% 35,719 0.03724%55170 Patrick County 25,427 0.02948% 28,706 0.02993%55171 Pittsylvania County 66,525 0.07712% 74,388 0.07756%55172 Powhatan County 35,409 0.04105% 40,737 0.04247%55173 Prince Edward County 24,175 0.02803% 26,266 0.02738%55174 Prince George County 59,115 0.06853% 65,145 0.06792%55176 Prince William County 1,166,064 1.35184% 1,300,317 1.35566%55177 County of Pulaski 53,429 0.06194% 60,478 0.06305%55178 Rappahannock County 13,722 0.01591% 14,229 0.01483%55179 Richmond County 12,493 0.01448% 14,007 0.01460%55180 Roanoke County 214,555 0.24874% 240,680 0.25093%55181 Rockbridge County 30,096 0.03489% 33,973 0.03542%55182 Rockingham County 114,244 0.13245% 130,373 0.13592%55183 Russell County 26,515 0.03074% 29,662 0.03093%55184 Scott County 26,375 0.03058% 28,636 0.02986%55185 Shenandoah County 59,348 0.06881% 64,885 0.06765%55186 Smyth County 35,685 0.04137% 38,600 0.04024%55187 Southampton County 35,832 0.04154% 40,449 0.04217%55188 Spotsylvania County 218,110 0.25286% 247,394 0.25793%55189 Stafford County 227,851 0.26415% 262,614 0.27380%55190 Surry County 18,606 0.02157% 21,052 0.02195%55191 Sussex County 24,201 0.02806% 25,060 0.02613%55192 Tazewell County 54,967 0.06372% 58,977 0.06149%55193 Warren County 47,159 0.05467% 53,517 0.05580%55195 Washington County 49,923 0.05788% 54,167 0.05647%55196 Westmoreland County 24,658 0.02859% 31,055 0.03238%55197 Wise County 51,181 0.05934% 54,767 0.05710%55198 Wythe County 31,051 0.03600% 35,314 0.03682%55199 York County 182,606 0.21170% 201,745 0.21034%
June 30, 2016 June 30, 2017

Page 14 of 87
Virginia Retirement System VRS Group Life Insurance Plan
Schedule of Employer Allocations – Page 9 of 23 For the Fiscal Year Ended June 30, 2017 and 2016
Employer EmployerEmployer Employer Allocation Employer Allocation
Code Employer Contributions Percentage Contributions Percentage55201 City of Bristol 68,970 0.07996% 74,670 0.07785%55202 City of Buena Vista 14,941 0.01732% 17,389 0.01813%55203 Town of St. Paul 3,470 0.00402% 3,714 0.00387%55204 Town of Clifton Forge 7,094 0.00822% 7,220 0.00753%55206 City of Fredericksburg 110,329 0.12791% 120,964 0.12611%55207 City of Hampton 425,771 0.49361% 471,264 0.49133%55208 City of Harrisonburg 137,322 0.15920% 152,975 0.15949%55209 City of Hopewell 80,943 0.09384% 93,450 0.09743%55210 City of Lynchburg 253,512 0.29391% 279,734 0.29164%55211 Town of Crewe 4,220 0.00489% 4,904 0.00511%55212 City of Norfolk 129,830 0.15052% 137,568 0.14343%55213 City of Petersburg 118,720 0.13763% 109,291 0.11394%55214 City of Portsmouth 319,865 0.37083% 345,251 0.35995%55215 City of Radford 47,731 0.05534% 52,022 0.05424%55216 City of Richmond 123,871 0.14361% 132,787 0.13844%55217 City of Roanoke 41,258 0.04783% 45,993 0.04795%55218 Town of Craigsville 886 0.00103% 1,022 0.00107%55219 City of Staunton 63,299 0.07338% 69,220 0.07217%55220 City of Suffolk 283,950 0.32919% 333,605 0.34781%55221 City of Williamsburg 47,188 0.05471% 51,940 0.05415%55222 City of Winchester 116,676 0.13527% 127,460 0.13289%55223 City of Martinsville 64,524 0.07481% 69,780 0.07275%55224 City of Falls Church 6,292 0.00729% 7,096 0.00740%55225 City of Colonial Heights 63,002 0.07304% 68,161 0.07106%55226 Town of Front Royal 34,542 0.04004% 38,621 0.04027%55229 Town of Chilhowie 4,000 0.00464% 4,351 0.00454%55230 City of Covington 17,821 0.02066% 19,544 0.02038%55231 Town of Floyd 645 0.00075% 829 0.00086%55232 City of Franklin 36,038 0.04178% 39,141 0.04081%55233 City of Chesapeake 716,757 0.83096% 809,643 0.84410%55234 City of Virginia Beach 1,465,980 1.69956% 1,649,406 1.71960%
June 30, 2016 June 30, 2017

Page 15 of 87
Virginia Retirement System VRS Group Life Insurance Plan
Schedule of Employer Allocations – Page 10 of 23 For the Fiscal Year Ended June 30, 2017 and 2016
Employer EmployerEmployer Employer Allocation Employer Allocation
Code Employer Contributions Percentage Contributions Percentage55235 City of Norton 15,129 0.01754% 16,605 0.01731%55236 City of Manassas Park 42,161 0.04888% 47,164 0.04917%55239 Town of Grottoes 3,645 0.00423% 4,083 0.00426%55240 Town of Onley 1,011 0.00117% 1,201 0.00125%55241 Town of West Point 6,599 0.00765% 7,516 0.00784%55245 Town of Scottsville 935 0.00108% 995 0.00104%55246 Town of Burkeville 471 0.00055% 511 0.00053%55247 Town of Madison - 0.00000% 59 0.00006%55252 Town of Windsor 2,825 0.00328% 3,146 0.00328%55254 Town of Stephens City 1,907 0.00221% 1,981 0.00207%55257 Town of Lebanon 9,692 0.01124% 10,986 0.01145%55258 City of Newport News 230,759 0.26753% 290,899 0.30329%55260 Town of Haymarket 2,956 0.00343% 2,981 0.00311%55261 Town of Lovettsville 2,378 0.00276% 2,784 0.00290%55300 Town of Abingdon 25,977 0.03012% 28,419 0.02963%55301 Town of Dumfries 5,947 0.00689% 5,068 0.00528%55302 Town of Iron Gate 368 0.00043% 327 0.00034%55303 Town of Montross 484 0.00056% 436 0.00045%55304 Town of South Boston 14,312 0.01659% 15,849 0.01652%55305 Town of Gretna 2,180 0.00253% 2,281 0.00238%55306 Town of Remington 729 0.00084% 809 0.00084%55307 City of Lexington 24,434 0.02833% 24,138 0.02517%55308 City of Waynesboro 62,824 0.07283% 68,185 0.07109%55309 Town of Colonial Beach 8,719 0.01011% 9,482 0.00988%55310 Town of Smithfield 12,654 0.01467% 14,833 0.01547%55311 Town of Brookneal 1,216 0.00141% 1,512 0.00158%55312 Town of Hamilton 1,324 0.00154% 1,510 0.00157%55313 City of Galax 29,152 0.03380% 32,280 0.03365%55314 Town of Jonesville 1,656 0.00192% 1,975 0.00206%55315 Town of Wytheville 30,309 0.03514% 33,816 0.03526%55317 Town of Vienna 55,674 0.06454% 62,329 0.06498%
June 30, 2016 June 30, 2017

Page 16 of 87
Virginia Retirement System VRS Group Life Insurance Plan
Schedule of Employer Allocations – Page 11 of 23 For the Fiscal Year Ended June 30, 2017 and 2016
Employer EmployerEmployer Employer Allocation Employer Allocation
Code Employer Contributions Percentage Contributions Percentage55318 Town of Vinton 15,824 0.01834% 19,078 0.01989%55319 City of Emporia 19,927 0.02310% 23,274 0.02426%55320 Town of Culpeper 43,912 0.05091% 49,173 0.05127%55321 Town of Woodstock 12,073 0.01400% 13,482 0.01406%55322 Town of Glasgow 630 0.00073% 760 0.00079%55323 Town of Marion 14,931 0.01731% 17,323 0.01806%55324 Town of Altavista 9,604 0.01113% 10,726 0.01118%55325 Town of Herndon 77,225 0.08953% 86,802 0.09050%55326 Town of Pearisburg 6,223 0.00722% 7,062 0.00736%55329 Town of Leesburg 110,036 0.12757% 117,869 0.12289%55330 Town of Chatham 3,155 0.00366% 3,298 0.00344%55331 Town of Bowling Green 1,111 0.00129% 1,436 0.00150%55332 City of Manassas 135,574 0.15718% 152,404 0.15889%55334 Town of Boydton 841 0.00098% 997 0.00104%55335 City of Salem 109,084 0.12647% 118,838 0.12390%55336 Town of McKenney 209 0.00024% 181 0.00019%55338 Town of Quantico 676 0.00078% 754 0.00079%55339 Town of Halifax 1,691 0.00196% 1,730 0.00180%55340 Town of Blacksburg 67,289 0.07801% 75,422 0.07863%55341 Town of Chincoteague 8,907 0.01033% 9,868 0.01029%55342 Town of Lawrenceville 4,377 0.00507% 5,020 0.00523%55343 Town of Amherst 3,677 0.00426% 4,245 0.00443%55344 Town of Stanley 2,856 0.00331% 3,108 0.00324%55345 Town of Hillsville 6,634 0.00769% 7,509 0.00783%55346 Town of Elkton 4,679 0.00543% 4,994 0.00521%55347 Town of Bridgewater 10,480 0.01215% 12,837 0.01338%55348 Town of Purcellville 21,719 0.02518% 24,477 0.02552%55349 Town of Timberville 2,496 0.00289% 3,120 0.00325%55350 Town of Wise 9,975 0.01156% 10,579 0.01103%55351 Town of New Market 3,906 0.00453% 4,165 0.00434%55353 Town of Rocky Mount 12,449 0.01443% 14,248 0.01486%
June 30, 2016 June 30, 2017

Page 17 of 87
Virginia Retirement System VRS Group Life Insurance Plan
Schedule of Employer Allocations – Page 12 of 23 For the Fiscal Year Ended June 30, 2017 and 2016
Employer EmployerEmployer Employer Allocation Employer Allocation
Code Employer Contributions Percentage Contributions Percentage55355 Town of Luray 9,457 0.01096% 10,089 0.01052%55357 Town of Strasburg 12,897 0.01495% 14,615 0.01524%55359 Town of Clarksville 3,880 0.00450% 4,229 0.00441%55360 Town of Dublin 4,468 0.00518% 4,958 0.00517%55361 Town of Middleburg 3,728 0.00432% 4,328 0.00451%55363 Town of Chase City 5,417 0.00628% 5,704 0.00595%55364 City of Bedford 17,360 0.02013% 19,367 0.02019%55365 City of Poquoson 27,661 0.03207% 31,652 0.03300%55366 Town of Ashland 15,160 0.01758% 16,597 0.01730%55367 Town of Broadway 4,116 0.00477% 4,806 0.00501%55368 Town of Berryville 6,609 0.00766% 7,470 0.00779%55370 Town of Urbanna 410 0.00048% 454 0.00047%55371 Town of Bluefield 10,876 0.01261% 12,020 0.01253%55372 Town of Weber City 879 0.00102% 796 0.00083%55374 Town of Hurt 586 0.00068% 741 0.00077%55376 Town of Coeburn 3,614 0.00419% 3,777 0.00394%55377 Town of Dayton 3,604 0.00418% 3,979 0.00415%55378 Town of Courtland 604 0.00070% 576 0.00060%55379 Town of Cape Charles 5,707 0.00662% 6,544 0.00682%55381 Town of Warsaw 2,386 0.00277% 2,537 0.00264%55382 Town of Grundy 3,398 0.00394% 3,639 0.00380%55383 Town of Warrenton 25,497 0.02956% 29,528 0.03079%55384 Town of Louisa 2,962 0.00343% 3,471 0.00362%55385 Town of Kenbridge 1,977 0.00229% 2,180 0.00227%55386 Town of Mt. Jackson 3,280 0.00380% 3,665 0.00382%55387 Town of Pulaski 18,672 0.02165% 21,793 0.02272%55389 Town of Pembroke 1,051 0.00122% 1,220 0.00127%55390 Town of Parksley 1,111 0.00129% 1,019 0.00106%55391 Town of Onancock 2,880 0.00334% 2,994 0.00312%55392 Town of Victoria 2,407 0.00279% 2,745 0.00286%55393 Town of Shenandoah 3,308 0.00383% 3,452 0.00360%
June 30, 2016 June 30, 2017
Page 18 of 87
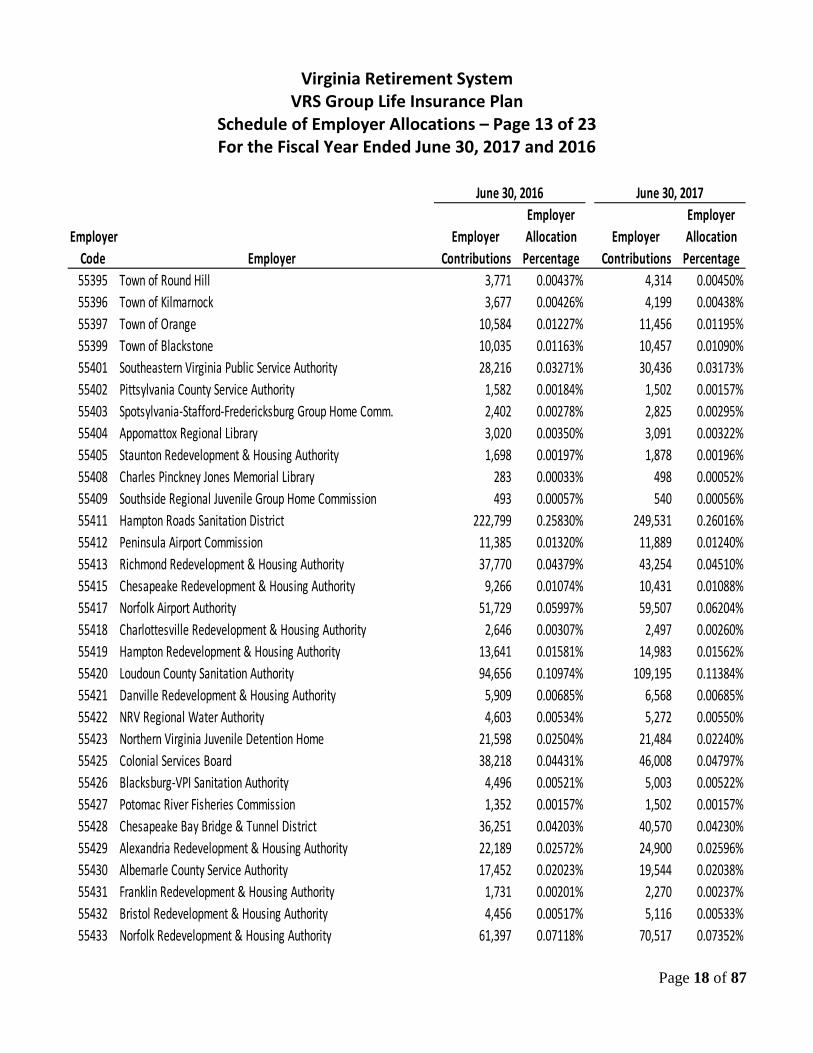
Virginia Retirement System VRS Group Life Insurance Plan
Schedule of Employer Allocations – Page 13 of 23 For the Fiscal Year Ended June 30, 2017 and 2016
Employer EmployerEmployer Employer Allocation Employer Allocation
Code Employer Contributions Percentage Contributions Percentage55395 Town of Round Hill 3,771 0.00437% 4,314 0.00450%55396 Town of Kilmarnock 3,677 0.00426% 4,199 0.00438%55397 Town of Orange 10,584 0.01227% 11,456 0.01195%55399 Town of Blackstone 10,035 0.01163% 10,457 0.01090%55401 Southeastern Virginia Public Service Authority 28,216 0.03271% 30,436 0.03173%55402 Pittsylvania County Service Authority 1,582 0.00184% 1,502 0.00157%55403 Spotsylvania-Stafford-Fredericksburg Group Home Comm. 2,402 0.00278% 2,825 0.00295%55404 Appomattox Regional Library 3,020 0.00350% 3,091 0.00322%55405 Staunton Redevelopment & Housing Authority 1,698 0.00197% 1,878 0.00196%55408 Charles Pinckney Jones Memorial Library 283 0.00033% 498 0.00052%55409 Southside Regional Juvenile Group Home Commission 493 0.00057% 540 0.00056%55411 Hampton Roads Sanitation District 222,799 0.25830% 249,531 0.26016%55412 Peninsula Airport Commission 11,385 0.01320% 11,889 0.01240%55413 Richmond Redevelopment & Housing Authority 37,770 0.04379% 43,254 0.04510%55415 Chesapeake Redevelopment & Housing Authority 9,266 0.01074% 10,431 0.01088%55417 Norfolk Airport Authority 51,729 0.05997% 59,507 0.06204%55418 Charlottesville Redevelopment & Housing Authority 2,646 0.00307% 2,497 0.00260%55419 Hampton Redevelopment & Housing Authority 13,641 0.01581% 14,983 0.01562%55420 Loudoun County Sanitation Authority 94,656 0.10974% 109,195 0.11384%55421 Danville Redevelopment & Housing Authority 5,909 0.00685% 6,568 0.00685%55422 NRV Regional Water Authority 4,603 0.00534% 5,272 0.00550%55423 Northern Virginia Juvenile Detention Home 21,598 0.02504% 21,484 0.02240%55425 Colonial Services Board 38,218 0.04431% 46,008 0.04797%55426 Blacksburg-VPI Sanitation Authority 4,496 0.00521% 5,003 0.00522%55427 Potomac River Fisheries Commission 1,352 0.00157% 1,502 0.00157%55428 Chesapeake Bay Bridge & Tunnel District 36,251 0.04203% 40,570 0.04230%55429 Alexandria Redevelopment & Housing Authority 22,189 0.02572% 24,900 0.02596%55430 Albemarle County Service Authority 17,452 0.02023% 19,544 0.02038%55431 Franklin Redevelopment & Housing Authority 1,731 0.00201% 2,270 0.00237%55432 Bristol Redevelopment & Housing Authority 4,456 0.00517% 5,116 0.00533%55433 Norfolk Redevelopment & Housing Authority 61,397 0.07118% 70,517 0.07352%
June 30, 2016 June 30, 2017

Page 19 of 87
Virginia Retirement System VRS Group Life Insurance Plan
Schedule of Employer Allocations – Page 14 of 23 For the Fiscal Year Ended June 30, 2017 and 2016
Employer EmployerEmployer Employer Allocation Employer Allocation
Code Employer Contributions Percentage Contributions Percentage55435 Richmond Metropolitan Authority 19,537 0.02265% 19,771 0.02061%55436 Riverside Regional Jail 69,332 0.08038% 73,616 0.07675%55439 Rappahannock-Rapidan Planning District Commission 1,592 0.00185% 1,566 0.00163%55440 Shenandoah Valley Juvenile Detention Home 12,678 0.01470% 15,024 0.01566%55443 Bedford Public Library 3,082 0.00357% 3,413 0.00356%55445 Chesterfield County Health Center Commission 32,536 0.03772% 35,130 0.03663%55446 Washington County Service Authority 16,442 0.01906% 18,036 0.01880%55447 Rappahannock Area Community Services Board 83,443 0.09674% 99,842 0.10409%55449 Hampton Roads Planning District Commission 15,558 0.01804% 16,056 0.01674%55450 Meherrin Regional Library 1,325 0.00154% 1,347 0.00140%55453 Rockbridge Area Community Services Board 18,177 0.02107% 19,903 0.02075%55454 Greensville/Emporia Department of Social Services 5,172 0.00599% 5,603 0.00584%55455 James City Service Authority 19,328 0.02241% 21,263 0.02217%55456 Accomack-Northampton Planning District Commission 3,538 0.00410% 3,677 0.00383%55457 Harrisonburg/Rockingham Sewer Authority 7,063 0.00819% 8,035 0.00838%55458 Wytheville Redevelopment & Housing Authority 2,308 0.00267% 2,549 0.00266%55459 Waynesboro Redevelopment and Housing Authority 4,174 0.00484% 4,464 0.00465%55460 Region Ten Community Services Board 96,574 0.11196% 108,888 0.11352%55462 LENOWISCO Planning District Commission 1,774 0.00206% 1,622 0.00169%55465 Rivanna Water & Sewer Authority 21,136 0.02450% 24,012 0.02503%55466 Appomattox River Water Authority 7,046 0.00817% 7,608 0.00793%55467 Campbell County Utilities and Service Authority 5,560 0.00645% 6,285 0.00655%55469 Eastern Shore Community Services Board 21,936 0.02543% 25,320 0.02640%55470 ANCHOR Commission 897 0.00104% 956 0.00100%55471 Central Virginia Community Services 132,097 0.15314% 143,188 0.14929%55472 District 19 Community Services Board 42,181 0.04890% 43,326 0.04517%55473 Tidewater Transportation District 81,644 0.09465% 90,599 0.09446%55474 Upper Occoquan Sewage Authority 64,892 0.07523% 72,050 0.07512%55475 New River Valley Juvenile Detention Home 3,798 0.00440% 4,014 0.00419%55477 Frederick County Sanitation Authority 14,728 0.01708% 17,312 0.01805%55479 Cumberland Mountain Community Services 45,444 0.05268% 53,552 0.05583%
June 30, 2016 June 30, 2017

Page 20 of 87
Virginia Retirement System VRS Group Life Insurance Plan
Schedule of Employer Allocations – Page 15 of 23 For the Fiscal Year Ended June 30, 2017 and 2016
Employer EmployerEmployer Employer Allocation Employer Allocation
Code Employer Contributions Percentage Contributions Percentage55482 Middle Peninsula/Northern Neck Public Service Auth 59,963 0.06952% 69,571 0.07253%55483 Rockbridge County Public Service Authority 1,787 0.00207% 2,028 0.00211%55484 Danville-Pittsylvania Mental Health Services Board 42,908 0.04974% 49,762 0.05188%55485 Crater Youth Care Commission 5,864 0.00680% 6,285 0.00655%55486 Southeastern Tidewater Manpower Authority 9,097 0.01055% 9,599 0.01001%55487 Capital Regional Airport Commission 36,527 0.04235% 41,193 0.04295%55488 Northwestern Community Services Board 29,939 0.03471% 34,154 0.03561%55489 Harrisonburg-Rockingham Community Services Board 26,694 0.03095% 31,266 0.03260%55491 Middle Peninsula Regional Security Center 13,012 0.01509% 14,581 0.01520%55492 Northern Neck Planning District Commission 1,253 0.00145% 1,445 0.00151%55493 Planning District One Community Services Board 1,133 0.00131% 1,276 0.00133%55494 Rockbridge Area Social Services Board 4,262 0.00494% 4,656 0.00485%55495 Dinwiddie County Water Authority 2,437 0.00283% 2,733 0.00285%55496 Rappahannock Rapidan Community Services 49,014 0.05682% 53,849 0.05614%55498 Valley Community Services Board 47,435 0.05499% 51,996 0.05421%55499 Eastern Shore Public Library 919 0.00107% 1,022 0.00107%55500 Alexandria City Public Schools 37,750 0.04377% 42,125 0.04392%55501 Albemarle County Public Schools 30,921 0.03585% 35,170 0.03667%55502 Alleghany Highlands Public Schools 8,643 0.01002% 9,599 0.01001%55503 Charlottesville City Public Schools 9,883 0.01146% 10,367 0.01081%55504 Amherst County Public Schools 11,822 0.01371% 12,661 0.01320%55505 Appomattox County Public Schools 3,279 0.00380% 3,597 0.00375%55506 Arlington County Public Schools 89,114 0.10331% 103,950 0.10838%55507 Augusta County Public Schools 12,712 0.01474% 13,679 0.01426%55508 Bath County Public Schools 3,298 0.00382% 3,575 0.00373%55509 Bedford County Public Schools 25,943 0.03008% 28,264 0.02947%55510 Bland County Public Schools 1,975 0.00229% 2,339 0.00244%55511 Botetourt County Public Schools 11,287 0.01308% 12,850 0.01340%55512 Norfolk Public Schools 79,253 0.09188% 88,330 0.09209%55513 Petersburg City Public Schools 11,589 0.01343% 12,421 0.01295%55514 Buckingham County Public Schools 4,056 0.00470% 4,431 0.00462%
June 30, 2016 June 30, 2017

Page 21 of 87
Virginia Retirement System VRS Group Life Insurance Plan
Schedule of Employer Allocations – Page 16 of 23 For the Fiscal Year Ended June 30, 2017 and 2016
Employer EmployerEmployer Employer Allocation Employer Allocation
Code Employer Contributions Percentage Contributions Percentage55515 Radford City Public Schools 1,539 0.00178% 1,828 0.00191%55516 Caroline County Public Schools 6,398 0.00742% 7,493 0.00781%55517 Carroll County Public Schools 11,942 0.01384% 10,990 0.01146%55518 Charles City County Public Schools 1,323 0.00153% 1,285 0.00134%55519 Charlotte County Public Schools 2,939 0.00341% 3,529 0.00368%55520 Chesterfield County Public Schools 96,560 0.11194% 81,735 0.08521%55521 Clarke County Public Schools 3,133 0.00363% 3,535 0.00369%55522 Winchester City Public Schools 10,217 0.01185% 11,690 0.01219%55523 Culpeper County Public Schools 19,502 0.02261% 22,965 0.02394%55524 Cumberland County Public Schools 3,328 0.00386% 3,591 0.00374%55525 Dickenson County Public Schools 6,634 0.00769% 6,746 0.00703%55526 Dinwiddie County Public Schools 9,411 0.01091% 9,445 0.00985%55528 Essex County Public Schools 3,096 0.00359% 3,317 0.00346%55530 Covington City Public Schools 1,909 0.00221% 2,052 0.00214%55531 Floyd County Public Schools 7,108 0.00824% 7,828 0.00816%55532 Fluvanna County Public Schools 11,124 0.01290% 12,029 0.01254%55533 Chesapeake City Public Schools 103,034 0.11945% 113,282 0.11811%55534 Virginia Beach City Public Schools 209,960 0.24341% 230,517 0.24033%55535 Giles County Public Schools 1,828 0.00212% 1,934 0.00202%55536 Gloucester County Public Schools 16,938 0.01964% 15,950 0.01663%55537 Goochland County Public Schools 3,749 0.00435% 3,699 0.00386%55538 Grayson County Public Schools 5,079 0.00589% 5,518 0.00575%55539 Greene County Public Schools 8,400 0.00974% 9,270 0.00967%55540 Greensville County Public Schools 3,900 0.00452% 4,392 0.00458%55541 Halifax County Public Schools 9,017 0.01045% 9,274 0.00967%55542 Hanover County Public Schools 27,729 0.03215% 27,100 0.02825%55543 Henrico County Public Schools 3,162 0.00367% 3,670 0.00382%55544 Henry County Public Schools 15,475 0.01794% 18,035 0.01880%55545 Highland County Public Schools 1,092 0.00127% 1,214 0.00127%55546 Isle of Wight County Public Schools 7,730 0.00896% 8,356 0.00871%55548 King George County Public Schools 10,309 0.01195% 13,034 0.01359%
June 30, 2016 June 30, 2017

Page 22 of 87
Virginia Retirement System VRS Group Life Insurance Plan
Schedule of Employer Allocations – Page 17 of 23 For the Fiscal Year Ended June 30, 2017 and 2016
Employer EmployerEmployer Employer Allocation Employer Allocation
Code Employer Contributions Percentage Contributions Percentage55549 King and Queen County Public Schools 3,296 0.00382% 3,564 0.00372%55550 King William County Public Schools 6,473 0.00750% 6,849 0.00714%55551 Lancaster County Public Schools 4,140 0.00480% 4,424 0.00461%55552 Lee County Public Schools 8,799 0.01020% 10,081 0.01051%55553 Loudoun County Public Schools 254,042 0.29452% 279,381 0.29128%55554 Louisa County Public Schools 17,631 0.02044% 19,760 0.02060%55555 Lunenburg County Public Schools 3,160 0.00366% 3,366 0.00351%55556 Madison County Public Schools 3,510 0.00407% 3,965 0.00413%55557 Mathews County Public Schools 3,590 0.00416% 4,108 0.00428%55558 Mecklenburg County Public Schools 3,753 0.00435% 5,568 0.00581%55559 Middlesex County Public Schools 2,186 0.00253% 2,329 0.00243%55560 Montgomery County Public Schools 27,457 0.03183% 30,356 0.03165%55562 Nelson County Public Schools 7,522 0.00872% 8,255 0.00861%55563 New Kent County Public Schools 5,582 0.00647% 6,294 0.00656%55565 Northampton County Public Schools 4,707 0.00546% 5,100 0.00532%55566 Northumberland County Public Schools 3,165 0.00367% 3,681 0.00384%55567 Nottoway County Public Schools 4,429 0.00513% 5,041 0.00525%55568 Orange County Public Schools 14,785 0.01714% 15,888 0.01656%55569 Page County Public Schools 8,973 0.01040% 9,527 0.00993%55570 Patrick County Public Schools 8,258 0.00957% 9,172 0.00956%55571 Pittsylvania County Public Schools 13,408 0.01555% 14,788 0.01542%55572 Powhatan County Public Schools 8,329 0.00965% 8,974 0.00936%55573 Prince Edward County Public Schools 2,917 0.00338% 3,027 0.00316%55574 Prince George County Public Schools 18,703 0.02168% 20,556 0.02143%55576 Prince William County Public Schools 260,802 0.30236% 294,241 0.30677%55577 Pulaski County Public Schools 10,943 0.01269% 11,291 0.01177%55578 Rappahannock County Public Schools 3,198 0.00371% 3,497 0.00365%55579 Richmond County Public Schools 455 0.00053% 375 0.00039%55580 Roanoke County Public Schools 14,861 0.01723% 15,983 0.01666%55581 Rockbridge County Public Schools 6,943 0.00805% 7,085 0.00739%55582 Rockingham County Public Schools 38,363 0.04447% 41,537 0.04331%
June 30, 2016 June 30, 2017

Page 23 of 87
Virginia Retirement System VRS Group Life Insurance Plan
Schedule of Employer Allocations – Page 18 of 23 For the Fiscal Year Ended June 30, 2017 and 2016
Employer EmployerEmployer Employer Allocation Employer Allocation
Code Employer Contributions Percentage Contributions Percentage55583 Russell County Public Schools 12,715 0.01474% 13,806 0.01439%55584 Scott County Public Schools 10,353 0.01200% 11,374 0.01186%55585 Shenandoah County Public Schools 17,924 0.02078% 19,180 0.02000%55586 Smyth County Public Schools 10,762 0.01248% 11,647 0.01214%55587 Southampton County Public Schools 4,031 0.00468% 4,809 0.00501%55588 Spotsylvania County Public Schools 43,641 0.05059% 47,882 0.04992%55589 Stafford County Public Schools 39,562 0.04587% 43,989 0.04586%55590 Surry County Public Schools 4,612 0.00535% 4,994 0.00521%55591 Sussex County School Board 4,704 0.00546% 4,514 0.00471%55592 Tazewell County Public Schools 19,014 0.02204% 20,358 0.02123%55593 Warren County Public Schools 9,206 0.01067% 10,328 0.01077%55595 Washington County Public Schools 12,607 0.01462% 14,126 0.01473%55596 Westmoreland County Public Schools 3,453 0.00400% 3,856 0.00402%55597 Wise County Public Schools 7,837 0.00909% 8,239 0.00859%55598 Wythe County Public Schools 5,946 0.00689% 6,915 0.00721%55599 York County Public Schools 31,104 0.03606% 33,621 0.03505%55600 Accomack County Public Schools 13,765 0.01596% 15,352 0.01601%55601 Bristol VA Public Schools 1,816 0.00211% 2,224 0.00232%55602 Buena Vista City Public Schools 1,645 0.00191% 1,778 0.00185%55603 Amelia County Public Schools 4,173 0.00484% 4,394 0.00458%55605 Danville City Public Schools 8,607 0.00998% 9,239 0.00963%55606 Franklin City Public Schools 2,012 0.00233% 2,237 0.00233%55608 Harrisonburg City Public Schools 9,265 0.01074% 10,084 0.01051%55609 Hopewell City Public Schools 8,629 0.01000% 9,752 0.01017%55610 Lynchburg City Public Schools 18,331 0.02125% 19,555 0.02039%55611 Fauquier County Public Schools 34,034 0.03946% 38,836 0.04049%55612 Brunswick County Public Schools 5,341 0.00619% 5,920 0.00617%55613 PD Pruden Vocational-Technical Center 262 0.00030% 291 0.00030%55614 Portsmouth City Public Schools 37,875 0.04391% 40,672 0.04241%55615 Campbell County Public Schools 14,472 0.01678% 16,033 0.01672%55616 Richmond Public Schools 49,337 0.05720% 51,928 0.05414%
June 30, 2016 June 30, 2017

Page 24 of 87
Virginia Retirement System VRS Group Life Insurance Plan
Schedule of Employer Allocations – Page 19 of 23 For the Fiscal Year Ended June 30, 2017 and 2016
Employer EmployerEmployer Employer Allocation Employer Allocation
Code Employer Contributions Percentage Contributions Percentage55617 Roanoke City Schools 14,743 0.01709% 16,702 0.01741%55619 Staunton City Public Schools 4,999 0.00579% 5,554 0.00579%55620 Suffolk City Public Schools 30,600 0.03548% 34,395 0.03586%55622 Craig County Public Schools 1,559 0.00181% 1,705 0.00178%55623 Martinsville City Public Schools 2,140 0.00248% 2,448 0.00255%55624 Appomattox Regional Governor's School 442 0.00051% 488 0.00051%55625 Colonial Heights City Public Schools 5,508 0.00639% 6,498 0.00678%55632 Manassas City Public Schools 18,501 0.02145% 18,050 0.01882%55633 Franklin County Public Schools 24,629 0.02855% 27,796 0.02898%55634 Frederick County Public Schools 40,248 0.04666% 44,621 0.04652%55635 Salem City Public Schools 5,720 0.00663% 6,595 0.00687%55636 Manassas Park City Public Schools 6,130 0.00711% 6,605 0.00689%55637 Newport News Public Schools 32,016 0.03712% 41,295 0.04305%55708 Waynesboro City Public Schools 3,544 0.00411% 4,141 0.00432%55710 Valley Vocational-Technical Center 229 0.00027% 316 0.00033%55711 New Horizons Regional Education Center 1,134 0.00131% 1,311 0.00137%55713 Galax City Public Schools 2,437 0.00283% 2,557 0.00266%55714 Norton City Public Schools 1,210 0.00140% 1,213 0.00126%55802 Williamsburg-James City County Public Schools 25,709 0.02981% 28,303 0.02951%55803 Poquoson City Public Schools 2,537 0.00294% 2,874 0.00300%55806 Fredericksburg City Public Schools 6,011 0.00697% 6,680 0.00697%55807 Hampton City Public Schools 19,271 0.02234% 20,264 0.02113%55813 Buchanan County Public Schools 11,051 0.01281% 11,204 0.01168%55814 Jackson River Technical Center 330 0.00038% 364 0.00038%55815 Northern Neck Regional Vocational Center 167 0.00019% 184 0.00019%55862 Crater Criminal Justice Training Academy - 0.00000% 458 0.00048%55863 Central Shenandoah Criminal Justice Training Academy - 0.00000% 877 0.00091%55864 New River Valley Emergency Comm Regional Authority - 0.00000% 7,866 0.00820%55865 Maury Service Authority - 0.00000% 3,218 0.00335%55866 Hampton Roads Transportation Accountability Commission 403 0.00047% 1,272 0.00133%55867 Pamunkey Regional Library 4,646 0.00539% 5,561 0.00580%
June 30, 2016 June 30, 2017
Page 25 of 87
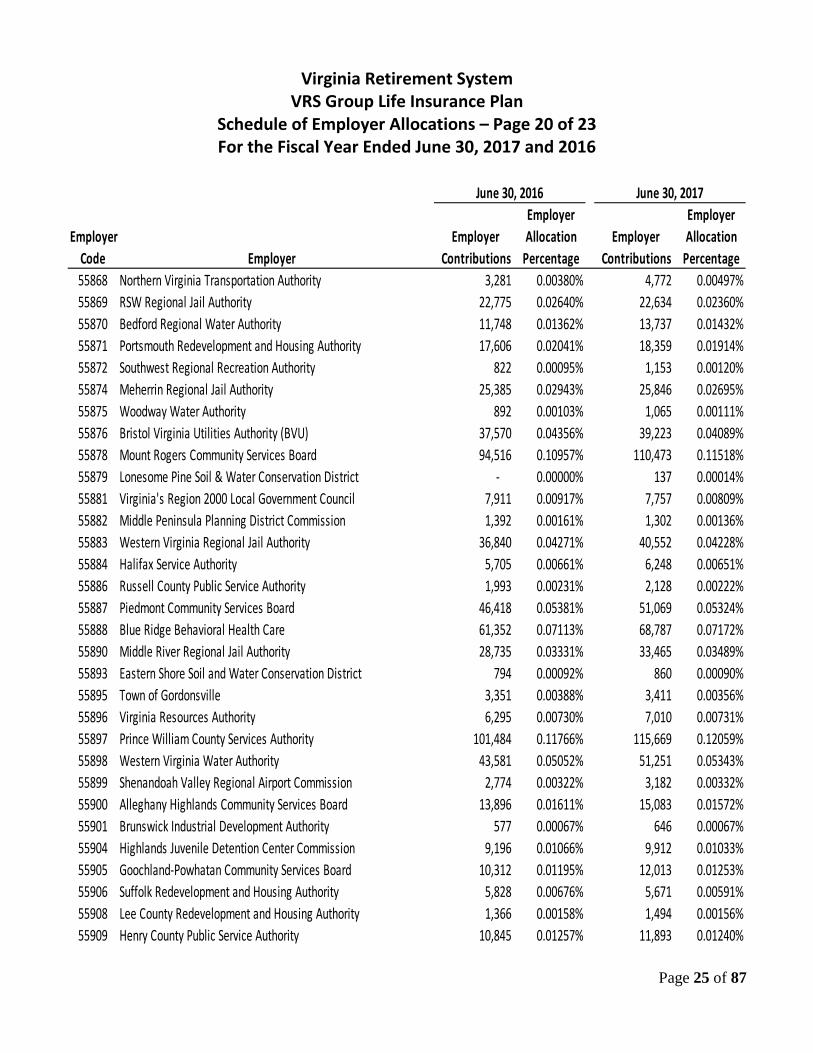
Virginia Retirement System VRS Group Life Insurance Plan
Schedule of Employer Allocations – Page 20 of 23 For the Fiscal Year Ended June 30, 2017 and 2016
Employer EmployerEmployer Employer Allocation Employer Allocation
Code Employer Contributions Percentage Contributions Percentage55868 Northern Virginia Transportation Authority 3,281 0.00380% 4,772 0.00497%55869 RSW Regional Jail Authority 22,775 0.02640% 22,634 0.02360%55870 Bedford Regional Water Authority 11,748 0.01362% 13,737 0.01432%55871 Portsmouth Redevelopment and Housing Authority 17,606 0.02041% 18,359 0.01914%55872 Southwest Regional Recreation Authority 822 0.00095% 1,153 0.00120%55874 Meherrin Regional Jail Authority 25,385 0.02943% 25,846 0.02695%55875 Woodway Water Authority 892 0.00103% 1,065 0.00111%55876 Bristol Virginia Utilities Authority (BVU) 37,570 0.04356% 39,223 0.04089%55878 Mount Rogers Community Services Board 94,516 0.10957% 110,473 0.11518%55879 Lonesome Pine Soil & Water Conservation District - 0.00000% 137 0.00014%55881 Virginia's Region 2000 Local Government Council 7,911 0.00917% 7,757 0.00809%55882 Middle Peninsula Planning District Commission 1,392 0.00161% 1,302 0.00136%55883 Western Virginia Regional Jail Authority 36,840 0.04271% 40,552 0.04228%55884 Halifax Service Authority 5,705 0.00661% 6,248 0.00651%55886 Russell County Public Service Authority 1,993 0.00231% 2,128 0.00222%55887 Piedmont Community Services Board 46,418 0.05381% 51,069 0.05324%55888 Blue Ridge Behavioral Health Care 61,352 0.07113% 68,787 0.07172%55890 Middle River Regional Jail Authority 28,735 0.03331% 33,465 0.03489%55893 Eastern Shore Soil and Water Conservation District 794 0.00092% 860 0.00090%55895 Town of Gordonsville 3,351 0.00388% 3,411 0.00356%55896 Virginia Resources Authority 6,295 0.00730% 7,010 0.00731%55897 Prince William County Services Authority 101,484 0.11766% 115,669 0.12059%55898 Western Virginia Water Authority 43,581 0.05052% 51,251 0.05343%55899 Shenandoah Valley Regional Airport Commission 2,774 0.00322% 3,182 0.00332%55900 Alleghany Highlands Community Services Board 13,896 0.01611% 15,083 0.01572%55901 Brunswick Industrial Development Authority 577 0.00067% 646 0.00067%55904 Highlands Juvenile Detention Center Commission 9,196 0.01066% 9,912 0.01033%55905 Goochland-Powhatan Community Services Board 10,312 0.01195% 12,013 0.01253%55906 Suffolk Redevelopment and Housing Authority 5,828 0.00676% 5,671 0.00591%55908 Lee County Redevelopment and Housing Authority 1,366 0.00158% 1,494 0.00156%55909 Henry County Public Service Authority 10,845 0.01257% 11,893 0.01240%
June 30, 2016 June 30, 2017
Page 26 of 87
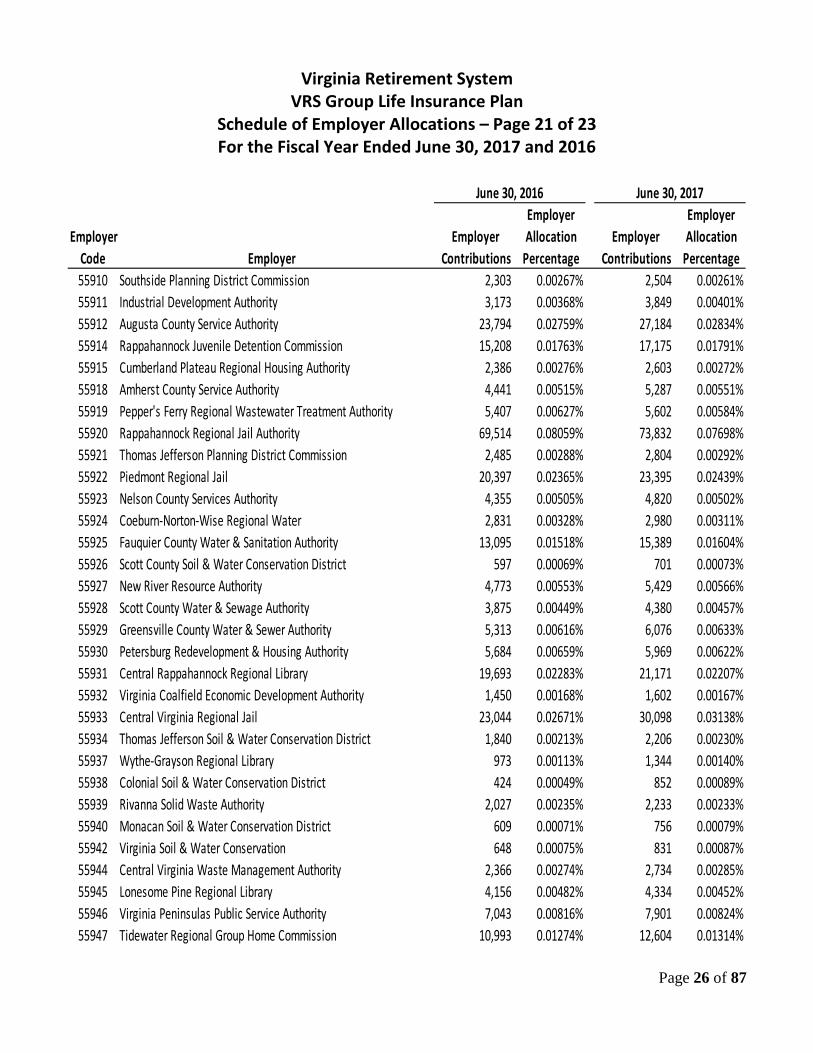
Virginia Retirement System VRS Group Life Insurance Plan
Schedule of Employer Allocations – Page 21 of 23 For the Fiscal Year Ended June 30, 2017 and 2016
Employer EmployerEmployer Employer Allocation Employer Allocation
Code Employer Contributions Percentage Contributions Percentage55910 Southside Planning District Commission 2,303 0.00267% 2,504 0.00261%55911 Industrial Development Authority 3,173 0.00368% 3,849 0.00401%55912 Augusta County Service Authority 23,794 0.02759% 27,184 0.02834%55914 Rappahannock Juvenile Detention Commission 15,208 0.01763% 17,175 0.01791%55915 Cumberland Plateau Regional Housing Authority 2,386 0.00276% 2,603 0.00272%55918 Amherst County Service Authority 4,441 0.00515% 5,287 0.00551%55919 Pepper's Ferry Regional Wastewater Treatment Authority 5,407 0.00627% 5,602 0.00584%55920 Rappahannock Regional Jail Authority 69,514 0.08059% 73,832 0.07698%55921 Thomas Jefferson Planning District Commission 2,485 0.00288% 2,804 0.00292%55922 Piedmont Regional Jail 20,397 0.02365% 23,395 0.02439%55923 Nelson County Services Authority 4,355 0.00505% 4,820 0.00502%55924 Coeburn-Norton-Wise Regional Water 2,831 0.00328% 2,980 0.00311%55925 Fauquier County Water & Sanitation Authority 13,095 0.01518% 15,389 0.01604%55926 Scott County Soil & Water Conservation District 597 0.00069% 701 0.00073%55927 New River Resource Authority 4,773 0.00553% 5,429 0.00566%55928 Scott County Water & Sewage Authority 3,875 0.00449% 4,380 0.00457%55929 Greensville County Water & Sewer Authority 5,313 0.00616% 6,076 0.00633%55930 Petersburg Redevelopment & Housing Authority 5,684 0.00659% 5,969 0.00622%55931 Central Rappahannock Regional Library 19,693 0.02283% 21,171 0.02207%55932 Virginia Coalfield Economic Development Authority 1,450 0.00168% 1,602 0.00167%55933 Central Virginia Regional Jail 23,044 0.02671% 30,098 0.03138%55934 Thomas Jefferson Soil & Water Conservation District 1,840 0.00213% 2,206 0.00230%55937 Wythe-Grayson Regional Library 973 0.00113% 1,344 0.00140%55938 Colonial Soil & Water Conservation District 424 0.00049% 852 0.00089%55939 Rivanna Solid Waste Authority 2,027 0.00235% 2,233 0.00233%55940 Monacan Soil & Water Conservation District 609 0.00071% 756 0.00079%55942 Virginia Soil & Water Conservation 648 0.00075% 831 0.00087%55944 Central Virginia Waste Management Authority 2,366 0.00274% 2,734 0.00285%55945 Lonesome Pine Regional Library 4,156 0.00482% 4,334 0.00452%55946 Virginia Peninsulas Public Service Authority 7,043 0.00816% 7,901 0.00824%55947 Tidewater Regional Group Home Commission 10,993 0.01274% 12,604 0.01314%
June 30, 2016 June 30, 2017

Page 27 of 87
Virginia Retirement System VRS Group Life Insurance Plan
Schedule of Employer Allocations – Page 22 of 23 For the Fiscal Year Ended June 30, 2017 and 2016
Employer EmployerEmployer Employer Allocation Employer Allocation
Code Employer Contributions Percentage Contributions Percentage55948 Virginia Highlands Airport Commission 1,076 0.00125% 1,209 0.00126%55949 Western Tidewater Regional Jail 32,568 0.03776% 36,482 0.03803%55950 Scott County Redevelopment & Housing Authority 1,646 0.00191% 1,467 0.00153%55951 Handley Regional Library 2,974 0.00345% 3,171 0.00331%55952 Northern Neck Regional Jail 15,458 0.01792% 16,915 0.01764%55953 Montgomery Regional Solid Waste Authority 3,191 0.00370% 3,437 0.00358%55954 Potomac & Rappahannock Transportation Comm 37,373 0.04333% 44,865 0.04678%55955 Giles County Public Service Authority 2,633 0.00305% 2,229 0.00232%55956 South Central Wastewater Authority 7,435 0.00862% 8,442 0.00880%55957 Wise County Redevelopment and Housing Authority 3,095 0.00359% 3,332 0.00347%55958 Prince William Soil & Water Conservation District 911 0.00106% 1,037 0.00108%55959 Hampton Roads Regional Jail Authority 56,952 0.06603% 61,506 0.06412%55960 Russell County Water & Sewage Authority 1,455 0.00169% 1,842 0.00192%55961 Pamunkey Regional Jail 27,545 0.03193% 29,288 0.03053%55962 Charlottesville - Albemarle Airport Authority 8,008 0.00928% 8,890 0.00927%55963 Virginia Peninsula Regional Jail 23,843 0.02764% 25,643 0.02673%55964 Virginia Biotechnology Research Park Authority 2,269 0.00263% 2,721 0.00284%55965 Peumansend Creek Regional Jail 22,408 0.02598% 19,429 0.02026%55966 Blue Ridge Regional Jail Authority 71,779 0.08322% 75,914 0.07915%55967 Rockingham Regional Library 2,686 0.00311% 3,333 0.00347%55968 Albemarle-Charlottesville Regional Jail 34,651 0.04017% 39,174 0.04084%55969 Culpeper Soil & Water Conservation District 1,994 0.00231% 2,642 0.00276%55970 New River Valley Regional Jail 41,417 0.04802% 45,271 0.04720%55971 Sussex Service Authority 4,163 0.00483% 4,574 0.00477%55974 Peaks of Otter Soil & Water Conservation District 426 0.00049% 471 0.00049%55975 New River Soil & Water Conservation District 364 0.00042% 411 0.00043%55977 Southside Regional Jail 9,056 0.01050% 9,718 0.01013%55978 Evergreen Soil & Water Conservation District 520 0.00060% 580 0.00060%55979 Roanoke Higher Education Authority 4,146 0.00481% 4,440 0.00463%55981 John Marshall Soil & Water Conservation District 1,301 0.00151% 1,512 0.00158%55982 Daniel Boone Soil & Water Conservation District 512 0.00059% 633 0.00066%
June 30, 2016 June 30, 2017
Page 28 of 87
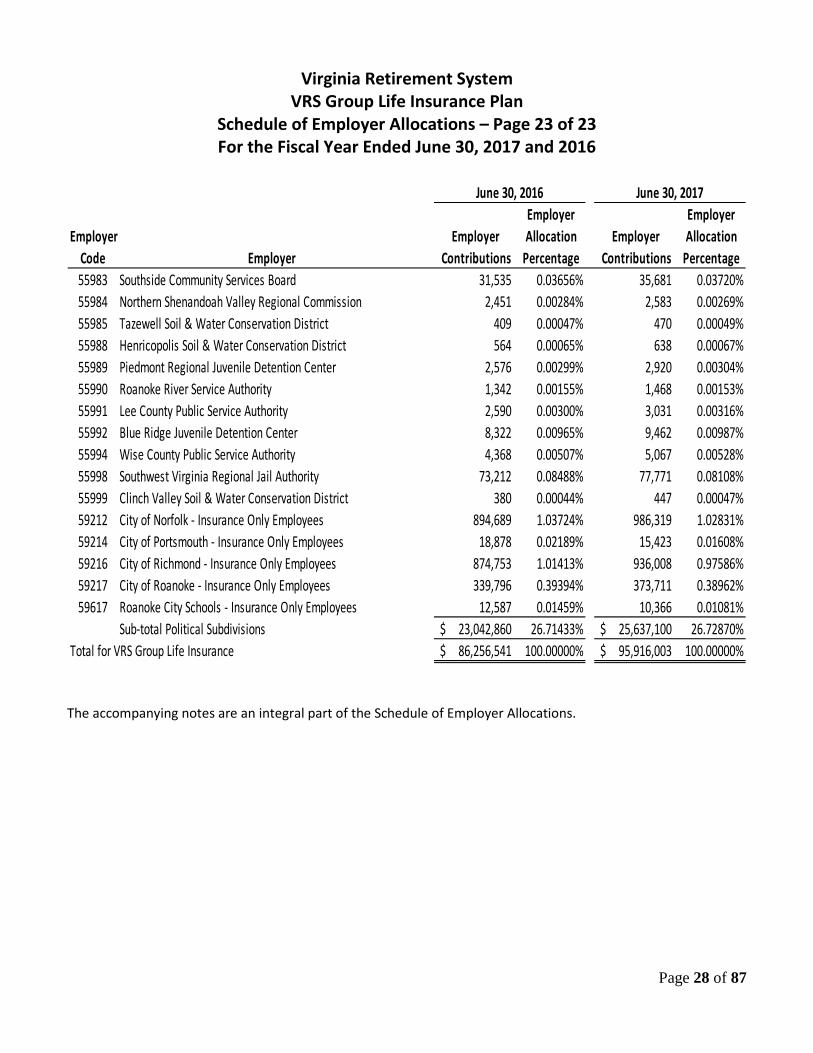
Virginia Retirement System VRS Group Life Insurance Plan
Schedule of Employer Allocations – Page 23 of 23 For the Fiscal Year Ended June 30, 2017 and 2016
Employer EmployerEmployer Employer Allocation Employer Allocation
Code Employer Contributions Percentage Contributions Percentage55983 Southside Community Services Board 31,535 0.03656% 35,681 0.03720%55984 Northern Shenandoah Valley Regional Commission 2,451 0.00284% 2,583 0.00269%55985 Tazewell Soil & Water Conservation District 409 0.00047% 470 0.00049%55988 Henricopolis Soil & Water Conservation District 564 0.00065% 638 0.00067%55989 Piedmont Regional Juvenile Detention Center 2,576 0.00299% 2,920 0.00304%55990 Roanoke River Service Authority 1,342 0.00155% 1,468 0.00153%55991 Lee County Public Service Authority 2,590 0.00300% 3,031 0.00316%55992 Blue Ridge Juvenile Detention Center 8,322 0.00965% 9,462 0.00987%55994 Wise County Public Service Authority 4,368 0.00507% 5,067 0.00528%55998 Southwest Virginia Regional Jail Authority 73,212 0.08488% 77,771 0.08108%55999 Clinch Valley Soil & Water Conservation District 380 0.00044% 447 0.00047%59212 City of Norfolk - Insurance Only Employees 894,689 1.03724% 986,319 1.02831%59214 City of Portsmouth - Insurance Only Employees 18,878 0.02189% 15,423 0.01608%59216 City of Richmond - Insurance Only Employees 874,753 1.01413% 936,008 0.97586%59217 City of Roanoke - Insurance Only Employees 339,796 0.39394% 373,711 0.38962%59617 Roanoke City Schools - Insurance Only Employees 12,587 0.01459% 10,366 0.01081%
Sub-total Political Subdivisions 23,042,860$ 26.71433% 25,637,100$ 26.72870%Total for VRS Group Life Insurance 86,256,541$ 100.00000% 95,916,003$ 100.00000%
June 30, 2016 June 30, 2017
The accompanying notes are an integral part of the Schedule of Employer Allocations.

Page 29 of 87
Virginia Retirement System VRS Group Life Insurance Plan
Schedule of Net GLI OPEB Liability and Total GLI OPEB Expense – Page 1 of 23 As of and For the Fiscal Year Ended June 30, 2017 and 2016
(Dollars in Thousands)
Net Net TotalGLI OPEB GLI OPEB GLI OPEB
Employer Liability Liability ExpenseCode Employer June 30, 2016 June 30, 2017 FY 2017
State: 1XXXX Judicial Retirement System Employees 6,486$ 5,466$ 35$ 2XXXX State Police Officers' Retirement System Employees 11,167 9,119 14 35885 Fort Monroe Federal Area Development Authority 126 104 - 3XXXX All Other State Agency Employees 485,135 413,473 3,913 7XXXX Virginia Law Officers' Retirement System Employees 33,776 28,225 178
Sub-total State 536,690$ 456,387$ 4,140$ Teachers:
40100 Accomack County School Board 2,532$ 2,216$ 32$ 40101 Albemarle County Schools 8,350 7,242 92 40102 Alleghany County School Board 1,154 955 4 40103 Amelia County School Board 803 705 11 40104 Amherst County School Board 2,297 1,889 5 40105 Appomattox County School Board 1,003 896 16 40106 Arlington Public Schools 26,664 23,574 379 40107 Augusta County School Board 5,387 4,726 70 40108 Bath County School Board 445 378 3 40109 Bedford County School Board 4,685 3,938 27 40110 Bland County School Board 360 316 5 40111 Botetourt County Schools 2,558 2,196 24 40112 Brunswick County Public Schools 924 790 8 40113 Buchanan County School Board 1,431 1,158 - 40114 Buckingham County School Board 1,042 870 5 40115 Campbell County School Board 3,650 3,059 19 40116 Caroline County School Board 1,917 1,685 26 40117 Carroll County School Board 1,980 1,759 30 40118 Charles City County School Board 438 381 5 40119 Charlotte County School Board 1,077 906 6 40120 Chesterfield County School Board 27,060 23,727 347 40121 Clarke County School Board 1,136 978 12 40122 Craig County School Board 342 285 1

Page 30 of 87
Virginia Retirement System VRS Group Life Insurance Plan
Schedule of Net GLI OPEB Liability and Total GLI OPEB Expense – Page 2 of 23 As of and For the Fiscal Year Ended June 30, 2017 and 2016
(Dollars in Thousands)
Net Net TotalGLI OPEB GLI OPEB GLI OPEB
Employer Liability Liability ExpenseCode Employer June 30, 2016 June 30, 2017 FY 201740123 Culpeper County School Board 4,103 3,545 43 40124 Cumberland County School Board 758 657 8 40125 Dickenson County School Board 1,038 786 (10) 40126 Dinwiddie County School Board 2,164 1,904 29 40128 Essex County Public Schools 795 663 3 40129 Fairfax County School Board 133,836 117,380 1,757 40130 Fauquier County School Board 7,028 5,967 53 40131 Floyd County School Board 992 831 5 40132 Fluvanna County Public Schools 2,276 1,930 17 40133 Franklin County Public Schools 3,822 3,359 51 40134 Frederick County School Board 8,200 6,992 67 40135 Giles County Schools 1,160 990 10 40136 Gloucester County School Board 2,758 2,458 43 40137 Goochland County School Board 1,401 1,214 16 40138 Grayson County School Board 820 726 12 40139 Greene County Public Schools 1,620 1,402 18 40140 Greensville County School Board 1,193 1,016 9 40141 Halifax County School Board 2,752 2,285 11 40142 Hanover County School Board 9,413 8,163 103 40143 Henrico County School Board 24,741 21,300 243 40144 Henry County Public Schools 3,423 2,963 36 40145 Highland County Public Schools 174 156 3 40146 Isle of Wight County Schools 2,759 2,365 26 40148 King George County School Board 1,975 1,856 50 40149 King & Queen County School Board 415 364 5 40150 King William County School Board 1,134 964 9 40151 Lancaster County Public Schools 724 629 8 40152 Lee County School Board 1,735 1,502 19 40153 Loudoun County School Board 49,354 44,272 824 40154 Louisa County Public Schools 2,571 2,209 22 40155 Lunenburg County School Board 801 622 (5)
Page 31 of 87
Virginia Retirement System VRS Group Life Insurance Plan
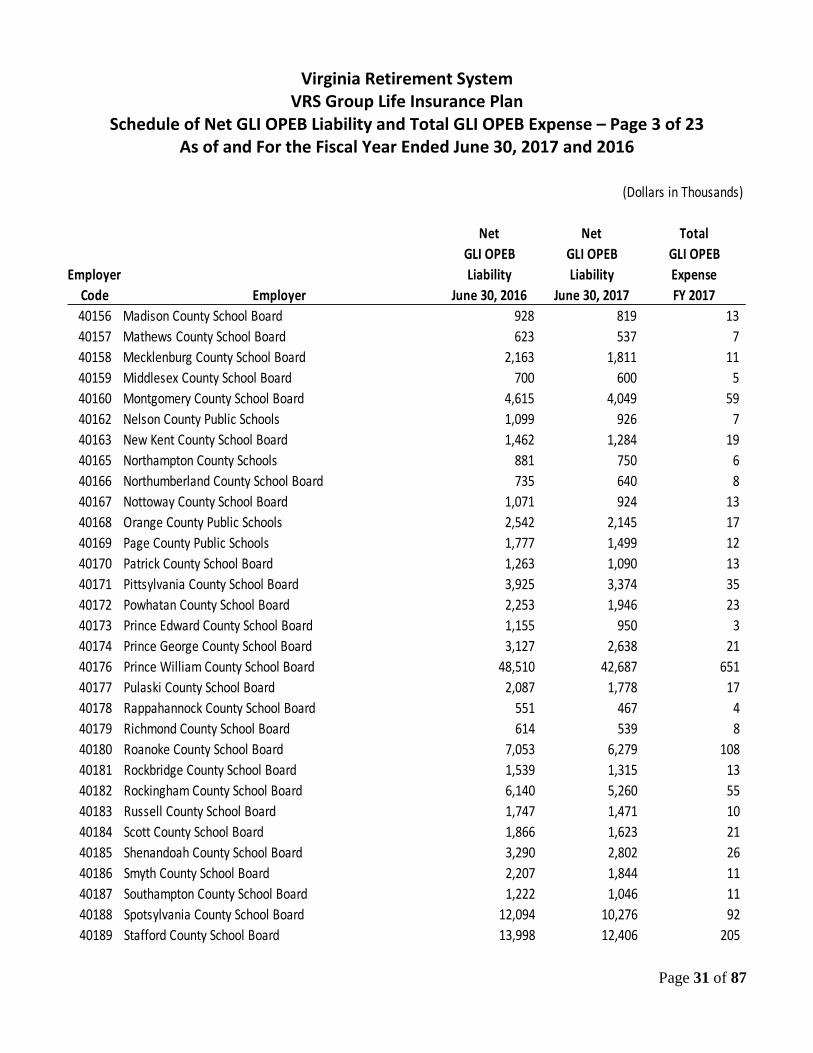
Schedule of Net GLI OPEB Liability and Total GLI OPEB Expense – Page 3 of 23 As of and For the Fiscal Year Ended June 30, 2017 and 2016
(Dollars in Thousands)
Net Net TotalGLI OPEB GLI OPEB GLI OPEB
Employer Liability Liability ExpenseCode Employer June 30, 2016 June 30, 2017 FY 201740156 Madison County School Board 928 819 13 40157 Mathews County School Board 623 537 7 40158 Mecklenburg County School Board 2,163 1,811 11 40159 Middlesex County School Board 700 600 5 40160 Montgomery County School Board 4,615 4,049 59 40162 Nelson County Public Schools 1,099 926 7 40163 New Kent County School Board 1,462 1,284 19 40165 Northampton County Schools 881 750 6 40166 Northumberland County School Board 735 640 8 40167 Nottoway County School Board 1,071 924 13 40168 Orange County Public Schools 2,542 2,145 17 40169 Page County Public Schools 1,777 1,499 12 40170 Patrick County School Board 1,263 1,090 13 40171 Pittsylvania County School Board 3,925 3,374 35 40172 Powhatan County School Board 2,253 1,946 23 40173 Prince Edward County School Board 1,155 950 3 40174 Prince George County School Board 3,127 2,638 21 40176 Prince William County School Board 48,510 42,687 651 40177 Pulaski County School Board 2,087 1,778 17 40178 Rappahannock County School Board 551 467 4 40179 Richmond County School Board 614 539 8 40180 Roanoke County School Board 7,053 6,279 108 40181 Rockbridge County School Board 1,539 1,315 13 40182 Rockingham County School Board 6,140 5,260 55 40183 Russell County School Board 1,747 1,471 10 40184 Scott County School Board 1,866 1,623 21 40185 Shenandoah County School Board 3,290 2,802 26 40186 Smyth County School Board 2,207 1,844 11 40187 Southampton County School Board 1,222 1,046 11 40188 Spotsylvania County School Board 12,094 10,276 92 40189 Stafford County School Board 13,998 12,406 205
Page 32 of 87
Virginia Retirement System VRS Group Life Insurance Plan
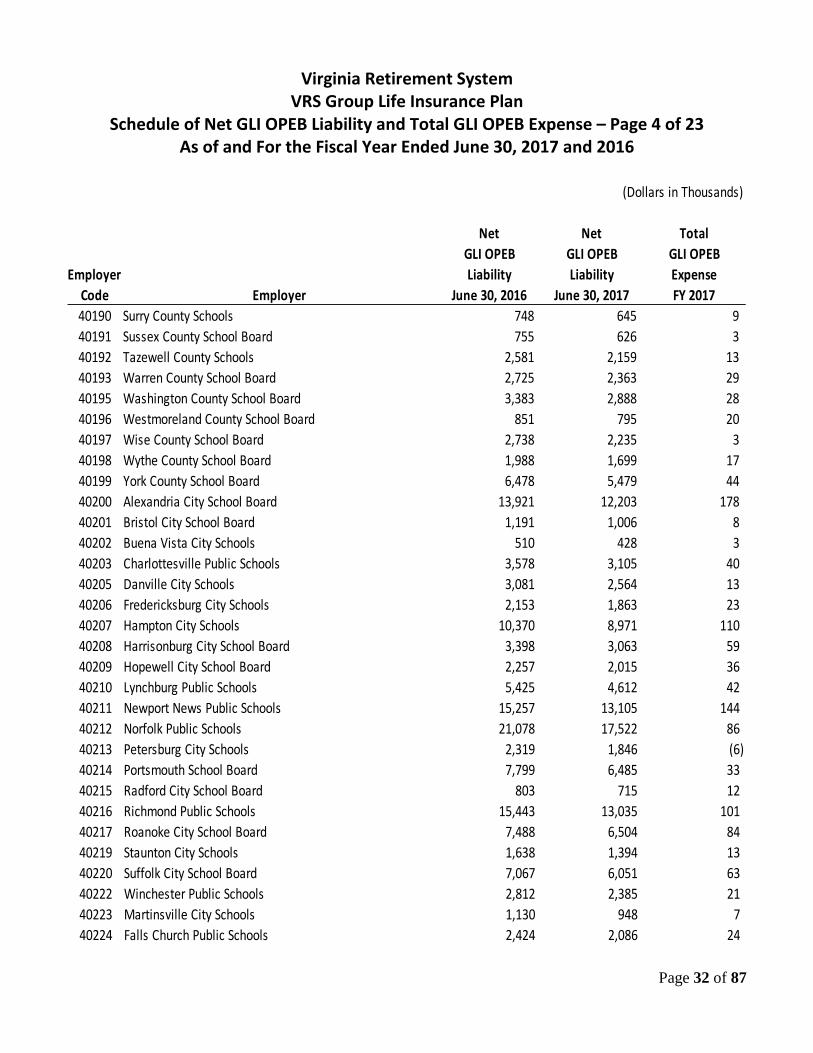
Schedule of Net GLI OPEB Liability and Total GLI OPEB Expense – Page 4 of 23 As of and For the Fiscal Year Ended June 30, 2017 and 2016
(Dollars in Thousands)
Net Net TotalGLI OPEB GLI OPEB GLI OPEB
Employer Liability Liability ExpenseCode Employer June 30, 2016 June 30, 2017 FY 201740190 Surry County Schools 748 645 9 40191 Sussex County School Board 755 626 3 40192 Tazewell County Schools 2,581 2,159 13 40193 Warren County School Board 2,725 2,363 29 40195 Washington County School Board 3,383 2,888 28 40196 Westmoreland County School Board 851 795 20 40197 Wise County School Board 2,738 2,235 3 40198 Wythe County School Board 1,988 1,699 17 40199 York County School Board 6,478 5,479 44 40200 Alexandria City School Board 13,921 12,203 178 40201 Bristol City School Board 1,191 1,006 8 40202 Buena Vista City Schools 510 428 3 40203 Charlottesville Public Schools 3,578 3,105 40 40205 Danville City Schools 3,081 2,564 13 40206 Fredericksburg City Schools 2,153 1,863 23 40207 Hampton City Schools 10,370 8,971 110 40208 Harrisonburg City School Board 3,398 3,063 59 40209 Hopewell City School Board 2,257 2,015 36 40210 Lynchburg Public Schools 5,425 4,612 42 40211 Newport News Public Schools 15,257 13,105 144 40212 Norfolk Public Schools 21,078 17,522 86 40213 Petersburg City Schools 2,319 1,846 (6) 40214 Portsmouth School Board 7,799 6,485 33 40215 Radford City School Board 803 715 12 40216 Richmond Public Schools 15,443 13,035 101 40217 Roanoke City School Board 7,488 6,504 84 40219 Staunton City Schools 1,638 1,394 13 40220 Suffolk City School Board 7,067 6,051 63 40222 Winchester Public Schools 2,812 2,385 21 40223 Martinsville City Schools 1,130 948 7 40224 Falls Church Public Schools 2,424 2,086 24

Page 33 of 87
Virginia Retirement System VRS Group Life Insurance Plan
Schedule of Net GLI OPEB Liability and Total GLI OPEB Expense – Page 5 of 23 As of and For the Fiscal Year Ended June 30, 2017 and 2016
(Dollars in Thousands)
Net Net TotalGLI OPEB GLI OPEB GLI OPEB
Employer Liability Liability ExpenseCode Employer June 30, 2016 June 30, 2017 FY 201740225 Colonial Heights City Schools 1,786 1,524 15 40230 Covington City School Board 506 460 9 40231 Fairfax City School Board 9 8 - 40232 Franklin City Public Schools 747 624 4 40233 Chesapeake Public Schools 21,297 18,440 229 40234 Virginia Beach City School Board 38,198 32,750 348 40236 Manassas Park City Schools 2,074 1,713 6 40306 Town of West Point School Board 469 438 11 40307 Lexington City School Board 255 227 4 40308 Waynesboro Public Schools 1,700 1,471 18 40309 Town of Colonial Beach Schools 333 296 5 40313 Galax City Schools 682 580 5 40314 Norton City Schools 371 308 1 40332 Manassas City Schools 5,389 4,562 38 40335 City of Salem Schools 2,083 1,781 18 40402 Williamsburg-James City County School Board 6,505 5,585 61 40403 Poquoson City Public Schools 1,084 937 12 40410 Valley Vocational Technical Center 188 161 - 40412 Charlottesville/Albemarle Vo-Tech Center 103 95 2 40413 The Pruden Center for Industry and Technology 143 109 (1) 40414 Jackson River Technical Center 80 45 (3) 40415 New Horizons Technical Center 766 676 11 40416 Northern Neck Regional Vocational Center 112 90 - 40417 Rowanty Vocational Technical Center 71 61 1 40418 Amelia-Nottoway Vocational Center 20 17 - 40421 Northern Neck Regional Special Education Program 72 66 2 40423 Maggie Walker Governor's School for Govt & Intl Studies 412 358 7 40424 Appomattox Region Governor's School 172 141 1 40425 Bridging Communities Regional Career and Tech Center 44 38 -
Sub-total Teachers 745,467$ 646,230$ 8,180$
Page 34 of 87
Virginia Retirement System VRS Group Life Insurance Plan
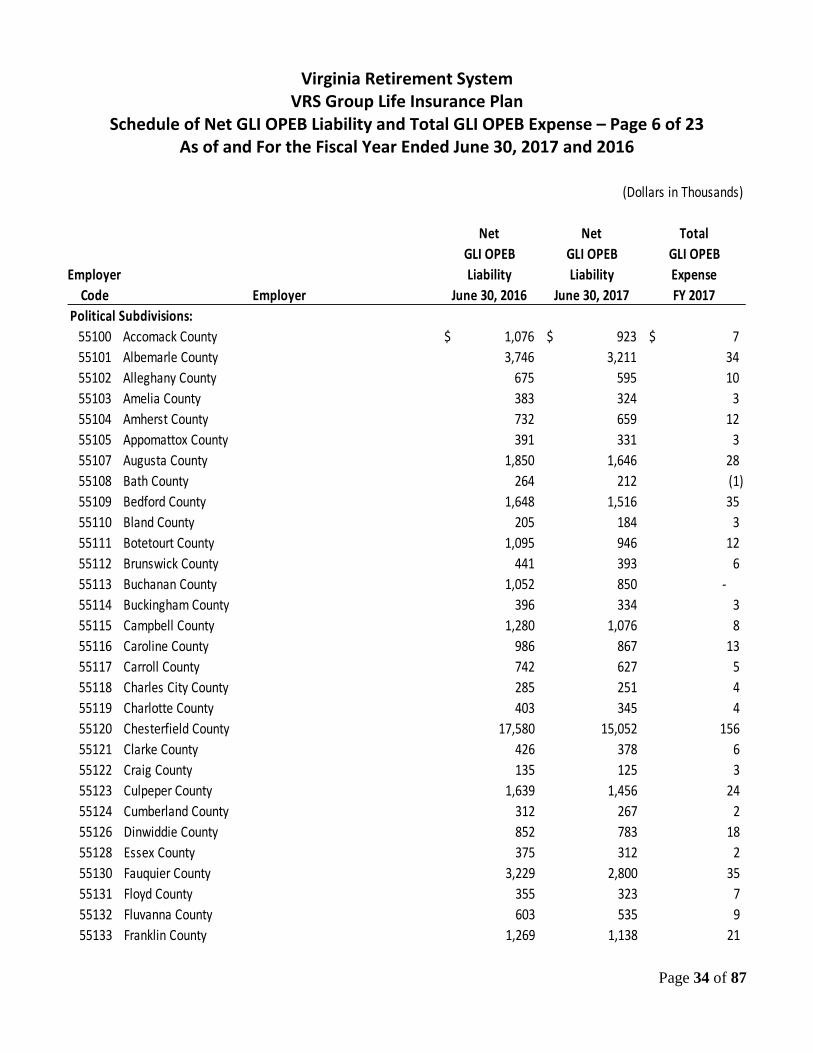
Schedule of Net GLI OPEB Liability and Total GLI OPEB Expense – Page 6 of 23 As of and For the Fiscal Year Ended June 30, 2017 and 2016
(Dollars in Thousands)
Net Net TotalGLI OPEB GLI OPEB GLI OPEB
Employer Liability Liability ExpenseCode Employer June 30, 2016 June 30, 2017 FY 2017
Political Subdivisions: 55100 Accomack County 1,076$ 923$ 7$ 55101 Albemarle County 3,746 3,211 34 55102 Alleghany County 675 595 10 55103 Amelia County 383 324 3 55104 Amherst County 732 659 12 55105 Appomattox County 391 331 3 55107 Augusta County 1,850 1,646 28 55108 Bath County 264 212 (1) 55109 Bedford County 1,648 1,516 35 55110 Bland County 205 184 3 55111 Botetourt County 1,095 946 12 55112 Brunswick County 441 393 6 55113 Buchanan County 1,052 850 - 55114 Buckingham County 396 334 3 55115 Campbell County 1,280 1,076 8 55116 Caroline County 986 867 13 55117 Carroll County 742 627 5 55118 Charles City County 285 251 4 55119 Charlotte County 403 345 4 55120 Chesterfield County 17,580 15,052 156 55121 Clarke County 426 378 6 55122 Craig County 135 125 3 55123 Culpeper County 1,639 1,456 24 55124 Cumberland County 312 267 2 55126 Dinwiddie County 852 783 18 55128 Essex County 375 312 2 55130 Fauquier County 3,229 2,800 35 55131 Floyd County 355 323 7 55132 Fluvanna County 603 535 9 55133 Franklin County 1,269 1,138 21

Page 35 of 87
Virginia Retirement System VRS Group Life Insurance Plan
Schedule of Net GLI OPEB Liability and Total GLI OPEB Expense – Page 7 of 23 As of and For the Fiscal Year Ended June 30, 2017 and 2016
(Dollars in Thousands)
Net Net TotalGLI OPEB GLI OPEB GLI OPEB
Employer Liability Liability ExpenseCode Employer June 30, 2016 June 30, 2017 FY 201755134 Frederick County 3,571 3,203 60 55135 Giles County 537 466 6 55136 Gloucester County 1,341 1,154 13 55137 Goochland County 949 829 11 55138 Grayson County 392 345 6 55139 Greene County 502 440 7 55140 Greensville County 415 367 6 55141 Halifax County 749 647 9 55142 Hanover County 5,676 4,950 67 55143 Henrico County 22,983 19,998 265 55144 Henry County 1,515 1,302 14 55145 Highland County 127 109 - 55146 Isle of Wight County 1,219 1,049 13 55147 James City County 3,679 3,183 39 55148 King George County 959 842 12 55149 King and Queen County 219 192 5 55150 King William County 353 304 3 55151 Lancaster County 445 379 3 55152 Lee County 477 401 2 55153 Loudoun County 18,888 16,291 191 55154 Louisa County 1,096 951 13 55155 Lunenburg County 212 176 1 55156 Madison County 413 367 6 55157 Mathews County 242 202 1 55158 Mecklenburg County 782 678 9 55159 Middlesex County 263 227 4 55160 Montgomery County 1,693 1,434 12 55162 Nelson County 377 325 5 55163 New Kent County 806 713 12 55165 Northampton County 780 664 6 55166 Northumberland County 366 336 8

Page 36 of 87
Virginia Retirement System VRS Group Life Insurance Plan
Schedule of Net GLI OPEB Liability and Total GLI OPEB Expense – Page 8 of 23 As of and For the Fiscal Year Ended June 30, 2017 and 2016
(Dollars in Thousands)
Net Net TotalGLI OPEB GLI OPEB GLI OPEB
Employer Liability Liability ExpenseCode Employer June 30, 2016 June 30, 2017 FY 201755167 Nottoway County 319 275 4 55168 Orange County 951 839 13 55169 Page County 655 561 5 55170 Patrick County 516 451 6 55171 Pittsylvania County 1,349 1,167 14 55172 Powhatan County 718 639 11 55173 Prince Edward County 490 412 3 55174 Prince George County 1,199 1,022 9 55176 Prince William County 23,651 20,400 239 55177 County of Pulaski 1,084 949 14 55178 Rappahannock County 278 223 - 55179 Richmond County 253 220 4 55180 Roanoke County 4,352 3,776 48 55181 Rockbridge County 610 533 7 55182 Rockingham County 2,317 2,045 32 55183 Russell County 538 465 8 55184 Scott County 535 450 3 55185 Shenandoah County 1,204 1,018 8 55186 Smyth County 724 606 4 55187 Southampton County 727 635 9 55188 Spotsylvania County 4,424 3,881 58 55189 Stafford County 4,621 4,120 72 55190 Surry County 377 330 5 55191 Sussex County 491 393 (1) 55192 Tazewell County 1,115 925 4 55193 Warren County 956 840 12 55195 Washington County 1,013 850 6 55196 Westmoreland County 500 488 15 55197 Wise County 1,038 859 4 55198 Wythe County 630 554 8 55199 York County 3,704 3,165 31
Page 37 of 87
Virginia Retirement System VRS Group Life Insurance Plan
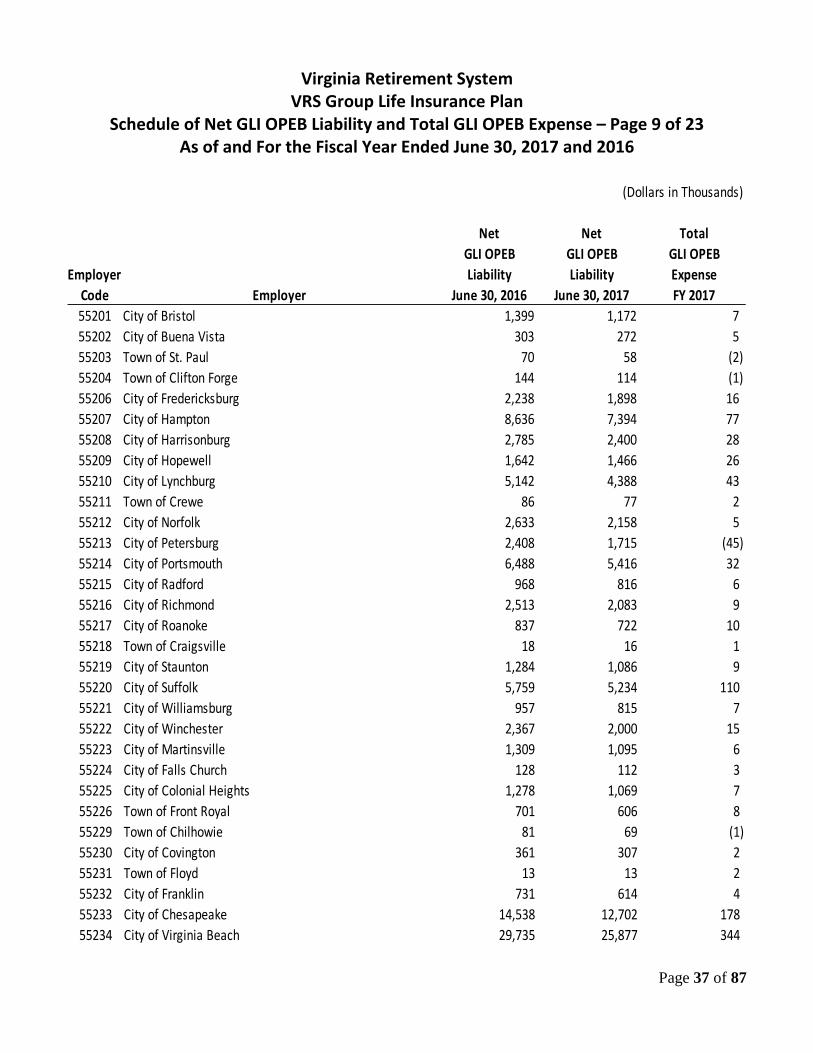
Schedule of Net GLI OPEB Liability and Total GLI OPEB Expense – Page 9 of 23 As of and For the Fiscal Year Ended June 30, 2017 and 2016
(Dollars in Thousands)
Net Net TotalGLI OPEB GLI OPEB GLI OPEB
Employer Liability Liability ExpenseCode Employer June 30, 2016 June 30, 2017 FY 201755201 City of Bristol 1,399 1,172 7 55202 City of Buena Vista 303 272 5 55203 Town of St. Paul 70 58 (2) 55204 Town of Clifton Forge 144 114 (1) 55206 City of Fredericksburg 2,238 1,898 16 55207 City of Hampton 8,636 7,394 77 55208 City of Harrisonburg 2,785 2,400 28 55209 City of Hopewell 1,642 1,466 26 55210 City of Lynchburg 5,142 4,388 43 55211 Town of Crewe 86 77 2 55212 City of Norfolk 2,633 2,158 5 55213 City of Petersburg 2,408 1,715 (45) 55214 City of Portsmouth 6,488 5,416 32 55215 City of Radford 968 816 6 55216 City of Richmond 2,513 2,083 9 55217 City of Roanoke 837 722 10 55218 Town of Craigsville 18 16 1 55219 City of Staunton 1,284 1,086 9 55220 City of Suffolk 5,759 5,234 110 55221 City of Williamsburg 957 815 7 55222 City of Winchester 2,367 2,000 15 55223 City of Martinsville 1,309 1,095 6 55224 City of Falls Church 128 112 3 55225 City of Colonial Heights 1,278 1,069 7 55226 Town of Front Royal 701 606 8 55229 Town of Chilhowie 81 69 (1) 55230 City of Covington 361 307 2 55231 Town of Floyd 13 13 2 55232 City of Franklin 731 614 4 55233 City of Chesapeake 14,538 12,702 178 55234 City of Virginia Beach 29,735 25,877 344
Page 38 of 87
Virginia Retirement System VRS Group Life Insurance Plan
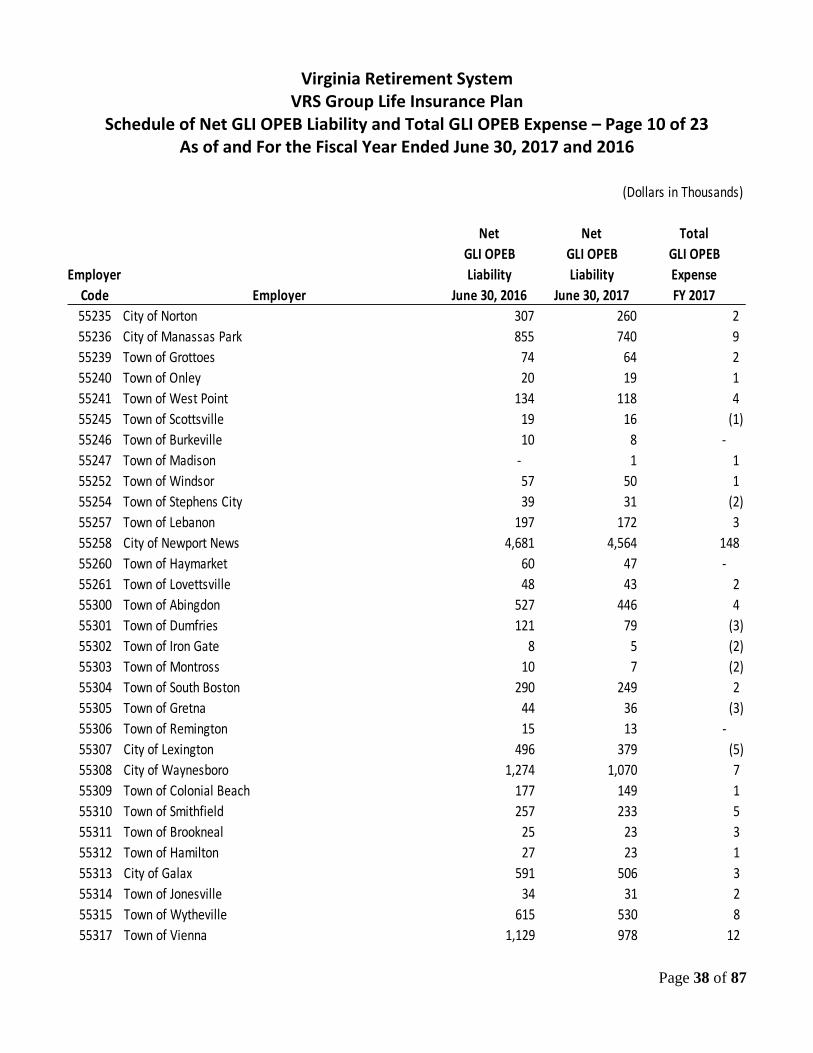
Schedule of Net GLI OPEB Liability and Total GLI OPEB Expense – Page 10 of 23 As of and For the Fiscal Year Ended June 30, 2017 and 2016
(Dollars in Thousands)
Net Net TotalGLI OPEB GLI OPEB GLI OPEB
Employer Liability Liability ExpenseCode Employer June 30, 2016 June 30, 2017 FY 201755235 City of Norton 307 260 2 55236 City of Manassas Park 855 740 9 55239 Town of Grottoes 74 64 2 55240 Town of Onley 20 19 1 55241 Town of West Point 134 118 4 55245 Town of Scottsville 19 16 (1) 55246 Town of Burkeville 10 8 - 55247 Town of Madison - 1 1 55252 Town of Windsor 57 50 1 55254 Town of Stephens City 39 31 (2) 55257 Town of Lebanon 197 172 3 55258 City of Newport News 4,681 4,564 148 55260 Town of Haymarket 60 47 - 55261 Town of Lovettsville 48 43 2 55300 Town of Abingdon 527 446 4 55301 Town of Dumfries 121 79 (3) 55302 Town of Iron Gate 8 5 (2) 55303 Town of Montross 10 7 (2) 55304 Town of South Boston 290 249 2 55305 Town of Gretna 44 36 (3) 55306 Town of Remington 15 13 - 55307 City of Lexington 496 379 (5) 55308 City of Waynesboro 1,274 1,070 7 55309 Town of Colonial Beach 177 149 1 55310 Town of Smithfield 257 233 5 55311 Town of Brookneal 25 23 3 55312 Town of Hamilton 27 23 1 55313 City of Galax 591 506 3 55314 Town of Jonesville 34 31 2 55315 Town of Wytheville 615 530 8 55317 Town of Vienna 1,129 978 12

Page 39 of 87
Virginia Retirement System VRS Group Life Insurance Plan
Schedule of Net GLI OPEB Liability and Total GLI OPEB Expense – Page 11 of 23 As of and For the Fiscal Year Ended June 30, 2017 and 2016
(Dollars in Thousands)
Net Net TotalGLI OPEB GLI OPEB GLI OPEB
Employer Liability Liability ExpenseCode Employer June 30, 2016 June 30, 2017 FY 201755318 Town of Vinton 321 299 7 55319 City of Emporia 404 365 7 55320 Town of Culpeper 891 772 10 55321 Town of Woodstock 245 212 3 55322 Town of Glasgow 13 12 1 55323 Town of Marion 303 271 5 55324 Town of Altavista 195 168 3 55325 Town of Herndon 1,566 1,362 18 55326 Town of Pearisburg 126 111 3 55329 Town of Leesburg 2,232 1,849 8 55330 Town of Chatham 64 52 - 55331 Town of Bowling Green 23 22 1 55332 City of Manassas 2,750 2,391 32 55334 Town of Boydton 17 16 1 55335 City of Salem 2,213 1,865 14 55336 Town of McKenney 4 3 (1) 55338 Town of Quantico 14 12 - 55339 Town of Halifax 34 27 (3) 55340 Town of Blacksburg 1,365 1,184 15 55341 Town of Chincoteague 181 155 1 55342 Town of Lawrenceville 89 79 4 55343 Town of Amherst 75 66 4 55344 Town of Stanley 58 48 - 55345 Town of Hillsville 135 117 3 55346 Town of Elkton 95 78 - 55347 Town of Bridgewater 213 202 5 55348 Town of Purcellville 441 384 5 55349 Town of Timberville 51 49 2 55350 Town of Wise 202 166 1 55351 Town of New Market 79 66 (2) 55353 Town of Rocky Mount 252 223 4

Page 40 of 87
Virginia Retirement System VRS Group Life Insurance Plan
Schedule of Net GLI OPEB Liability and Total GLI OPEB Expense – Page 12 of 23 As of and For the Fiscal Year Ended June 30, 2017 and 2016
(Dollars in Thousands)
Net Net TotalGLI OPEB GLI OPEB GLI OPEB
Employer Liability Liability ExpenseCode Employer June 30, 2016 June 30, 2017 FY 201755355 Town of Luray 192 159 1 55357 Town of Strasburg 262 229 4 55359 Town of Clarksville 79 67 (1) 55360 Town of Dublin 91 78 1 55361 Town of Middleburg 76 68 4 55363 Town of Chase City 110 89 - 55364 City of Bedford 352 304 4 55365 City of Poquoson 561 497 8 55366 Town of Ashland 308 260 2 55367 Town of Broadway 83 75 2 55368 Town of Berryville 134 117 3 55370 Town of Urbanna 8 7 - 55371 Town of Bluefield 221 189 1 55372 Town of Weber City 18 12 (3) 55374 Town of Hurt 12 12 2 55376 Town of Coeburn 73 59 - 55377 Town of Dayton 73 62 - 55378 Town of Courtland 12 9 (2) 55379 Town of Cape Charles 116 103 4 55381 Town of Warsaw 48 40 (2) 55382 Town of Grundy 69 57 (1) 55383 Town of Warrenton 517 463 8 55384 Town of Louisa 60 55 4 55385 Town of Kenbridge 40 34 - 55386 Town of Mt. Jackson 66 57 1 55387 Town of Pulaski 379 342 7 55389 Town of Pembroke 21 19 1 55390 Town of Parksley 23 16 (1) 55391 Town of Onancock 58 47 - 55392 Town of Victoria 49 43 1 55393 Town of Shenandoah 67 54 -

Page 41 of 87
Virginia Retirement System VRS Group Life Insurance Plan
Schedule of Net GLI OPEB Liability and Total GLI OPEB Expense – Page 13 of 23 As of and For the Fiscal Year Ended June 30, 2017 and 2016
(Dollars in Thousands)
Net Net TotalGLI OPEB GLI OPEB GLI OPEB
Employer Liability Liability ExpenseCode Employer June 30, 2016 June 30, 2017 FY 201755395 Town of Round Hill 76 67 3 55396 Town of Kilmarnock 75 66 3 55397 Town of Orange 215 180 1 55399 Town of Blackstone 203 164 - 55401 Southeastern Virginia Public Service Authority 572 478 2 55402 Pittsylvania County Service Authority 32 23 (1) 55403 Spotsylvania-Stafford-Fredericksburg Group Home Comm. 49 45 3 55404 Appomattox Regional Library 61 49 - 55405 Staunton Redevelopment & Housing Authority 34 30 - 55408 Charles Pinckney Jones Memorial Library 6 8 3 55409 Southside Regional Juvenile Group Home Commission 10 8 - 55411 Hampton Roads Sanitation District 4,519 3,915 49 55412 Peninsula Airport Commission 231 187 - 55413 Richmond Redevelopment & Housing Authority 766 679 12 55415 Chesapeake Redevelopment & Housing Authority 188 164 4 55417 Norfolk Airport Authority 1,049 933 16 55418 Charlottesville Redevelopment & Housing Authority 54 40 (1) 55419 Hampton Redevelopment & Housing Authority 277 235 - 55420 Loudoun County Sanitation Authority 1,920 1,713 30 55421 Danville Redevelopment & Housing Authority 120 104 1 55422 NRV Regional Water Authority 93 83 4 55423 Northern Virginia Juvenile Detention Home 438 337 (3) 55425 Colonial Services Board 775 721 18 55426 Blacksburg-VPI Sanitation Authority 91 79 1 55427 Potomac River Fisheries Commission 27 23 - 55428 Chesapeake Bay Bridge & Tunnel District 735 637 8 55429 Alexandria Redevelopment & Housing Authority 450 391 5 55430 Albemarle County Service Authority 354 307 6 55431 Franklin Redevelopment & Housing Authority 35 36 1 55432 Bristol Redevelopment & Housing Authority 90 80 4 55433 Norfolk Redevelopment & Housing Authority 1,245 1,106 18

Page 42 of 87
Virginia Retirement System VRS Group Life Insurance Plan
Schedule of Net GLI OPEB Liability and Total GLI OPEB Expense – Page 14 of 23 As of and For the Fiscal Year Ended June 30, 2017 and 2016
(Dollars in Thousands)
Net Net TotalGLI OPEB GLI OPEB GLI OPEB
Employer Liability Liability ExpenseCode Employer June 30, 2016 June 30, 2017 FY 201755435 Richmond Metropolitan Authority 396 310 (3) 55436 Riverside Regional Jail 1,406 1,155 3 55439 Rappahannock-Rapidan Planning District Commission 32 25 (1) 55440 Shenandoah Valley Juvenile Detention Home 257 236 6 55443 Bedford Public Library 62 54 1 55445 Chesterfield County Health Center Commission 660 551 3 55446 Washington County Service Authority 333 283 2 55447 Rappahannock Area Community Services Board 1,693 1,567 38 55449 Hampton Roads Planning District Commission 316 252 (1) 55450 Meherrin Regional Library 27 21 (2) 55453 Rockbridge Area Community Services Board 369 313 3 55454 Greensville/Emporia Department of Social Services 105 88 (2) 55455 James City Service Authority 392 333 3 55456 Accomack-Northampton Planning District Commission 72 58 - 55457 Harrisonburg/Rockingham Sewer Authority 143 127 4 55458 Wytheville Redevelopment & Housing Authority 47 40 - 55459 Waynesboro Redevelopment and Housing Authority 85 70 (2) 55460 Region Ten Community Services Board 1,959 1,708 23 55462 LENOWISCO Planning District Commission 36 26 (1) 55465 Rivanna Water & Sewer Authority 429 376 5 55466 Appomattox River Water Authority 143 119 - 55467 Campbell County Utilities and Service Authority 113 99 3 55469 Eastern Shore Community Services Board 445 397 7 55470 ANCHOR Commission 18 15 (1) 55471 Central Virginia Community Services 2,679 2,247 15 55472 District 19 Community Services Board 856 680 (2) 55473 Tidewater Transportation District 1,656 1,421 13 55474 Upper Occoquan Sewage Authority 1,316 1,130 11 55475 New River Valley Juvenile Detention Home 77 63 - 55477 Frederick County Sanitation Authority 299 272 6 55479 Cumberland Mountain Community Services 922 840 18

Page 43 of 87
Virginia Retirement System VRS Group Life Insurance Plan
Schedule of Net GLI OPEB Liability and Total GLI OPEB Expense – Page 15 of 23 As of and For the Fiscal Year Ended June 30, 2017 and 2016
(Dollars in Thousands)
Net Net TotalGLI OPEB GLI OPEB GLI OPEB
Employer Liability Liability ExpenseCode Employer June 30, 2016 June 30, 2017 FY 201755482 Middle Peninsula/Northern Neck Public Service Auth 1,216 1,091 20 55483 Rockbridge County Public Service Authority 36 32 1 55484 Danville-Pittsylvania Mental Health Services Board 870 781 15 55485 Crater Youth Care Commission 119 99 - 55486 Southeastern Tidewater Manpower Authority 185 151 1 55487 Capital Regional Airport Commission 741 647 9 55488 Northwestern Community Services Board 607 536 8 55489 Harrisonburg-Rockingham Community Services Board 541 490 9 55491 Middle Peninsula Regional Security Center 264 228 5 55492 Northern Neck Planning District Commission 25 22 1 55493 Planning District One Community Services Board 23 20 - 55494 Rockbridge Area Social Services Board 86 73 (1) 55495 Dinwiddie County Water Authority 50 43 - 55496 Rappahannock Rapidan Community Services 994 845 7 55498 Valley Community Services Board 962 816 7 55499 Eastern Shore Public Library 19 16 - 55500 Alexandria City Public Schools 766 661 10 55501 Albemarle County Public Schools 627 552 8 55502 Alleghany Highlands Public Schools 175 151 2 55503 Charlottesville City Public Schools 200 163 - 55504 Amherst County Public Schools 240 198 1 55505 Appomattox County Public Schools 66 56 - 55506 Arlington County Public Schools 1,807 1,631 32 55507 Augusta County Public Schools 258 215 1 55508 Bath County Public Schools 67 56 (1) 55509 Bedford County Public Schools 526 443 3 55510 Bland County Public Schools 40 37 3 55511 Botetourt County Public Schools 229 201 3 55512 Norfolk Public Schools 1,607 1,386 17 55513 Petersburg City Public Schools 235 195 1 55514 Buckingham County Public Schools 82 70 -

Page 44 of 87
Virginia Retirement System VRS Group Life Insurance Plan
Schedule of Net GLI OPEB Liability and Total GLI OPEB Expense – Page 16 of 23 As of and For the Fiscal Year Ended June 30, 2017 and 2016
(Dollars in Thousands)
Net Net TotalGLI OPEB GLI OPEB GLI OPEB
Employer Liability Liability ExpenseCode Employer June 30, 2016 June 30, 2017 FY 201755515 Radford City Public Schools 31 29 2 55516 Caroline County Public Schools 130 118 2 55517 Carroll County Public Schools 242 172 (5) 55518 Charles City County Public Schools 27 20 (3) 55519 Charlotte County Public Schools 60 55 2 55520 Chesterfield County Public Schools 1,958 1,282 (59) 55521 Clarke County Public Schools 64 56 2 55522 Winchester City Public Schools 207 184 3 55523 Culpeper County Public Schools 396 360 8 55524 Cumberland County Public Schools 68 56 (1) 55525 Dickenson County Public Schools 135 106 (1) 55526 Dinwiddie County Public Schools 191 148 (1) 55528 Essex County Public Schools 63 52 (1) 55530 Covington City Public Schools 39 32 (1) 55531 Floyd County Public Schools 144 123 - 55532 Fluvanna County Public Schools 226 189 1 55533 Chesapeake City Public Schools 2,090 1,777 16 55534 Virginia Beach City Public Schools 4,259 3,617 33 55535 Giles County Public Schools 37 30 (2) 55536 Gloucester County Public Schools 344 250 (5) 55537 Goochland County Public Schools 76 59 - 55538 Grayson County Public Schools 103 86 (1) 55539 Greene County Public Schools 170 146 1 55540 Greensville County Public Schools 79 69 2 55541 Halifax County Public Schools 183 146 - 55542 Hanover County Public Schools 562 425 (6) 55543 Henrico County Public Schools 64 57 4 55544 Henry County Public Schools 314 283 5 55545 Highland County Public Schools 22 19 - 55546 Isle of Wight County Public Schools 157 131 - 55548 King George County Public Schools 209 205 6

Page 45 of 87
Virginia Retirement System VRS Group Life Insurance Plan
Schedule of Net GLI OPEB Liability and Total GLI OPEB Expense – Page 17 of 23 As of and For the Fiscal Year Ended June 30, 2017 and 2016
(Dollars in Thousands)
Net Net TotalGLI OPEB GLI OPEB GLI OPEB
Employer Liability Liability ExpenseCode Employer June 30, 2016 June 30, 2017 FY 201755549 King and Queen County Public Schools 67 56 (1) 55550 King William County Public Schools 131 107 - 55551 Lancaster County Public Schools 84 70 (2) 55552 Lee County Public Schools 178 158 3 55553 Loudoun County Public Schools 5,153 4,384 40 55554 Louisa County Public Schools 358 310 6 55555 Lunenburg County Public Schools 64 53 (2) 55556 Madison County Public Schools 71 63 2 55557 Mathews County Public Schools 73 64 3 55558 Mecklenburg County Public Schools 76 87 5 55559 Middlesex County Public Schools 44 37 (2) 55560 Montgomery County Public Schools 557 476 2 55562 Nelson County Public Schools 153 129 (1) 55563 New Kent County Public Schools 113 99 3 55565 Northampton County Public Schools 96 81 (1) 55566 Northumberland County Public Schools 64 58 4 55567 Nottoway County Public Schools 90 79 3 55568 Orange County Public Schools 300 249 1 55569 Page County Public Schools 182 149 1 55570 Patrick County Public Schools 167 144 2 55571 Pittsylvania County Public Schools 272 232 1 55572 Powhatan County Public Schools 169 140 1 55573 Prince Edward County Public Schools 59 48 - 55574 Prince George County Public Schools 379 323 3 55576 Prince William County Public Schools 5,290 4,616 64 55577 Pulaski County Public Schools 222 177 - 55578 Rappahannock County Public Schools 65 55 - 55579 Richmond County Public Schools 9 5 (2) 55580 Roanoke County Public Schools 301 250 1 55581 Rockbridge County Public Schools 141 111 (1) 55582 Rockingham County Public Schools 778 651 4
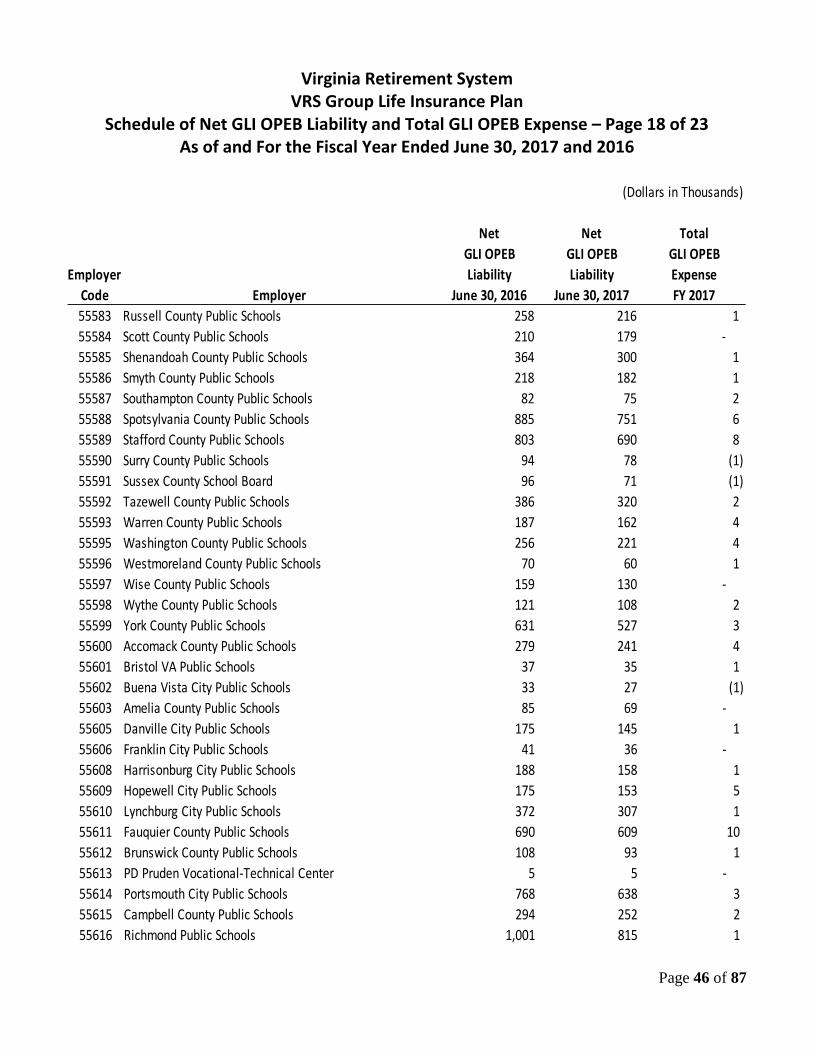
Page 46 of 87
Virginia Retirement System VRS Group Life Insurance Plan
Schedule of Net GLI OPEB Liability and Total GLI OPEB Expense – Page 18 of 23 As of and For the Fiscal Year Ended June 30, 2017 and 2016
(Dollars in Thousands)
Net Net TotalGLI OPEB GLI OPEB GLI OPEB
Employer Liability Liability ExpenseCode Employer June 30, 2016 June 30, 2017 FY 201755583 Russell County Public Schools 258 216 1 55584 Scott County Public Schools 210 179 - 55585 Shenandoah County Public Schools 364 300 1 55586 Smyth County Public Schools 218 182 1 55587 Southampton County Public Schools 82 75 2 55588 Spotsylvania County Public Schools 885 751 6 55589 Stafford County Public Schools 803 690 8 55590 Surry County Public Schools 94 78 (1) 55591 Sussex County School Board 96 71 (1) 55592 Tazewell County Public Schools 386 320 2 55593 Warren County Public Schools 187 162 4 55595 Washington County Public Schools 256 221 4 55596 Westmoreland County Public Schools 70 60 1 55597 Wise County Public Schools 159 130 - 55598 Wythe County Public Schools 121 108 2 55599 York County Public Schools 631 527 3 55600 Accomack County Public Schools 279 241 4 55601 Bristol VA Public Schools 37 35 1 55602 Buena Vista City Public Schools 33 27 (1) 55603 Amelia County Public Schools 85 69 - 55605 Danville City Public Schools 175 145 1 55606 Franklin City Public Schools 41 36 - 55608 Harrisonburg City Public Schools 188 158 1 55609 Hopewell City Public Schools 175 153 5 55610 Lynchburg City Public Schools 372 307 1 55611 Fauquier County Public Schools 690 609 10 55612 Brunswick County Public Schools 108 93 1 55613 PD Pruden Vocational-Technical Center 5 5 - 55614 Portsmouth City Public Schools 768 638 3 55615 Campbell County Public Schools 294 252 2 55616 Richmond Public Schools 1,001 815 1
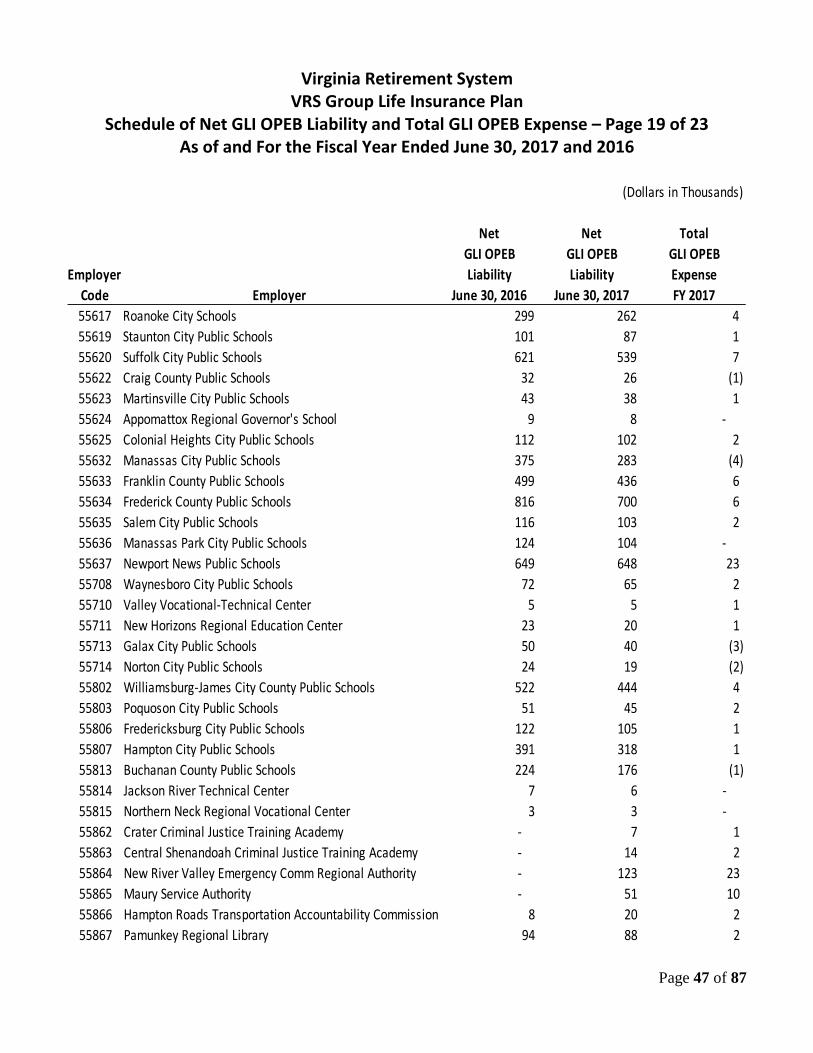
Page 47 of 87
Virginia Retirement System VRS Group Life Insurance Plan
Schedule of Net GLI OPEB Liability and Total GLI OPEB Expense – Page 19 of 23 As of and For the Fiscal Year Ended June 30, 2017 and 2016
(Dollars in Thousands)
Net Net TotalGLI OPEB GLI OPEB GLI OPEB
Employer Liability Liability ExpenseCode Employer June 30, 2016 June 30, 2017 FY 201755617 Roanoke City Schools 299 262 4 55619 Staunton City Public Schools 101 87 1 55620 Suffolk City Public Schools 621 539 7 55622 Craig County Public Schools 32 26 (1) 55623 Martinsville City Public Schools 43 38 1 55624 Appomattox Regional Governor's School 9 8 - 55625 Colonial Heights City Public Schools 112 102 2 55632 Manassas City Public Schools 375 283 (4) 55633 Franklin County Public Schools 499 436 6 55634 Frederick County Public Schools 816 700 6 55635 Salem City Public Schools 116 103 2 55636 Manassas Park City Public Schools 124 104 - 55637 Newport News Public Schools 649 648 23 55708 Waynesboro City Public Schools 72 65 2 55710 Valley Vocational-Technical Center 5 5 1 55711 New Horizons Regional Education Center 23 20 1 55713 Galax City Public Schools 50 40 (3) 55714 Norton City Public Schools 24 19 (2) 55802 Williamsburg-James City County Public Schools 522 444 4 55803 Poquoson City Public Schools 51 45 2 55806 Fredericksburg City Public Schools 122 105 1 55807 Hampton City Public Schools 391 318 1 55813 Buchanan County Public Schools 224 176 (1) 55814 Jackson River Technical Center 7 6 - 55815 Northern Neck Regional Vocational Center 3 3 - 55862 Crater Criminal Justice Training Academy - 7 1 55863 Central Shenandoah Criminal Justice Training Academy - 14 2 55864 New River Valley Emergency Comm Regional Authority - 123 23 55865 Maury Service Authority - 51 10 55866 Hampton Roads Transportation Accountability Commission 8 20 2 55867 Pamunkey Regional Library 94 88 2

Page 48 of 87
Virginia Retirement System VRS Group Life Insurance Plan
Schedule of Net GLI OPEB Liability and Total GLI OPEB Expense – Page 20 of 23 As of and For the Fiscal Year Ended June 30, 2017 and 2016
(Dollars in Thousands)
Net Net TotalGLI OPEB GLI OPEB GLI OPEB
Employer Liability Liability ExpenseCode Employer June 30, 2016 June 30, 2017 FY 201755868 Northern Virginia Transportation Authority 66 75 4 55869 RSW Regional Jail Authority 462 355 (4) 55870 Bedford Regional Water Authority 238 215 4 55871 Portsmouth Redevelopment and Housing Authority 357 288 - 55872 Southwest Regional Recreation Authority 17 18 1 55874 Meherrin Regional Jail Authority 515 406 (2) 55875 Woodway Water Authority 18 17 1 55876 Bristol Virginia Utilities Authority (BVU) 762 615 - 55878 Mount Rogers Community Services Board 1,917 1,733 34 55879 Lonesome Pine Soil & Water Conservation District - 2 2 55881 Virginia's Region 2000 Local Government Council 160 122 (2) 55882 Middle Peninsula Planning District Commission 28 20 (1) 55883 Western Virginia Regional Jail Authority 747 636 6 55884 Halifax Service Authority 116 98 (1) 55886 Russell County Public Service Authority 40 33 (2) 55887 Piedmont Community Services Board 941 802 7 55888 Blue Ridge Behavioral Health Care 1,244 1,079 14 55890 Middle River Regional Jail Authority 583 525 10 55893 Eastern Shore Soil and Water Conservation District 16 13 - 55895 Town of Gordonsville 68 54 - 55896 Virginia Resources Authority 128 110 1 55897 Prince William County Services Authority 2,059 1,814 28 55898 Western Virginia Water Authority 884 804 17 55899 Shenandoah Valley Regional Airport Commission 56 50 3 55900 Alleghany Highlands Community Services Board 282 237 2 55901 Brunswick Industrial Development Authority 12 10 - 55904 Highlands Juvenile Detention Center Commission 187 155 1 55905 Goochland-Powhatan Community Services Board 209 189 4 55906 Suffolk Redevelopment and Housing Authority 118 89 (1) 55908 Lee County Redevelopment and Housing Authority 28 24 - 55909 Henry County Public Service Authority 220 187 (1)

Page 49 of 87
Virginia Retirement System VRS Group Life Insurance Plan
Schedule of Net GLI OPEB Liability and Total GLI OPEB Expense – Page 21 of 23 As of and For the Fiscal Year Ended June 30, 2017 and 2016
(Dollars in Thousands)
Net Net TotalGLI OPEB GLI OPEB GLI OPEB
Employer Liability Liability ExpenseCode Employer June 30, 2016 June 30, 2017 FY 201755910 Southside Planning District Commission 47 39 (1) 55911 Industrial Development Authority 64 60 2 55912 Augusta County Service Authority 483 427 7 55914 Rappahannock Juvenile Detention Commission 308 270 4 55915 Cumberland Plateau Regional Housing Authority 48 41 (1) 55918 Amherst County Service Authority 90 83 2 55919 Pepper's Ferry Regional Wastewater Treatment Authority 110 88 - 55920 Rappahannock Regional Jail Authority 1,410 1,158 3 55921 Thomas Jefferson Planning District Commission 50 44 1 55922 Piedmont Regional Jail 414 367 6 55923 Nelson County Services Authority 88 76 - 55924 Coeburn-Norton-Wise Regional Water 57 47 (2) 55925 Fauquier County Water & Sanitation Authority 266 241 5 55926 Scott County Soil & Water Conservation District 12 11 1 55927 New River Resource Authority 97 86 3 55928 Scott County Water & Sewage Authority 79 68 2 55929 Greensville County Water & Sewer Authority 108 95 4 55930 Petersburg Redevelopment & Housing Authority 115 94 - 55931 Central Rappahannock Regional Library 399 332 2 55932 Virginia Coalfield Economic Development Authority 29 25 - 55933 Central Virginia Regional Jail 467 472 18 55934 Thomas Jefferson Soil & Water Conservation District 37 35 3 55937 Wythe-Grayson Regional Library 20 21 1 55938 Colonial Soil & Water Conservation District 9 13 1 55939 Rivanna Solid Waste Authority 41 36 - 55940 Monacan Soil & Water Conservation District 12 12 1 55942 Virginia Soil & Water Conservation 13 13 2 55944 Central Virginia Waste Management Authority 48 43 2 55945 Lonesome Pine Regional Library 84 68 - 55946 Virginia Peninsulas Public Service Authority 143 124 2 55947 Tidewater Regional Group Home Commission 223 198 3

Page 50 of 87
Virginia Retirement System VRS Group Life Insurance Plan
Schedule of Net GLI OPEB Liability and Total GLI OPEB Expense – Page 22 of 23 As of and For the Fiscal Year Ended June 30, 2017 and 2016
(Dollars in Thousands)
Net Net TotalGLI OPEB GLI OPEB GLI OPEB
Employer Liability Liability ExpenseCode Employer June 30, 2016 June 30, 2017 FY 201755948 Virginia Highlands Airport Commission 22 19 - 55949 Western Tidewater Regional Jail 661 572 7 55950 Scott County Redevelopment & Housing Authority 33 23 (1) 55951 Handley Regional Library 60 49 (1) 55952 Northern Neck Regional Jail 314 265 2 55953 Montgomery Regional Solid Waste Authority 65 54 (1) 55954 Potomac & Rappahannock Transportation Comm 758 703 17 55955 Giles County Public Service Authority 53 35 (2) 55956 South Central Wastewater Authority 151 132 4 55957 Wise County Redevelopment and Housing Authority 63 52 (1) 55958 Prince William Soil & Water Conservation District 19 16 - 55959 Hampton Roads Regional Jail Authority 1,155 965 6 55960 Russell County Water & Sewage Authority 30 28 1 55961 Pamunkey Regional Jail 559 459 1 55962 Charlottesville - Albemarle Airport Authority 162 140 2 55963 Virginia Peninsula Regional Jail 484 403 3 55964 Virginia Biotechnology Research Park Authority 46 43 1 55965 Peumansend Creek Regional Jail 455 305 (13) 55966 Blue Ridge Regional Jail Authority 1,456 1,191 2 55967 Rockingham Regional Library 54 52 2 55968 Albemarle-Charlottesville Regional Jail 703 615 9 55969 Culpeper Soil & Water Conservation District 40 41 1 55970 New River Valley Regional Jail 840 710 6 55971 Sussex Service Authority 85 71 - 55974 Peaks of Otter Soil & Water Conservation District 9 7 - 55975 New River Soil & Water Conservation District 7 7 - 55977 Southside Regional Jail 184 152 1 55978 Evergreen Soil & Water Conservation District 10 9 - 55979 Roanoke Higher Education Authority 84 69 (2) 55981 John Marshall Soil & Water Conservation District 26 23 1 55982 Daniel Boone Soil & Water Conservation District 10 10 1
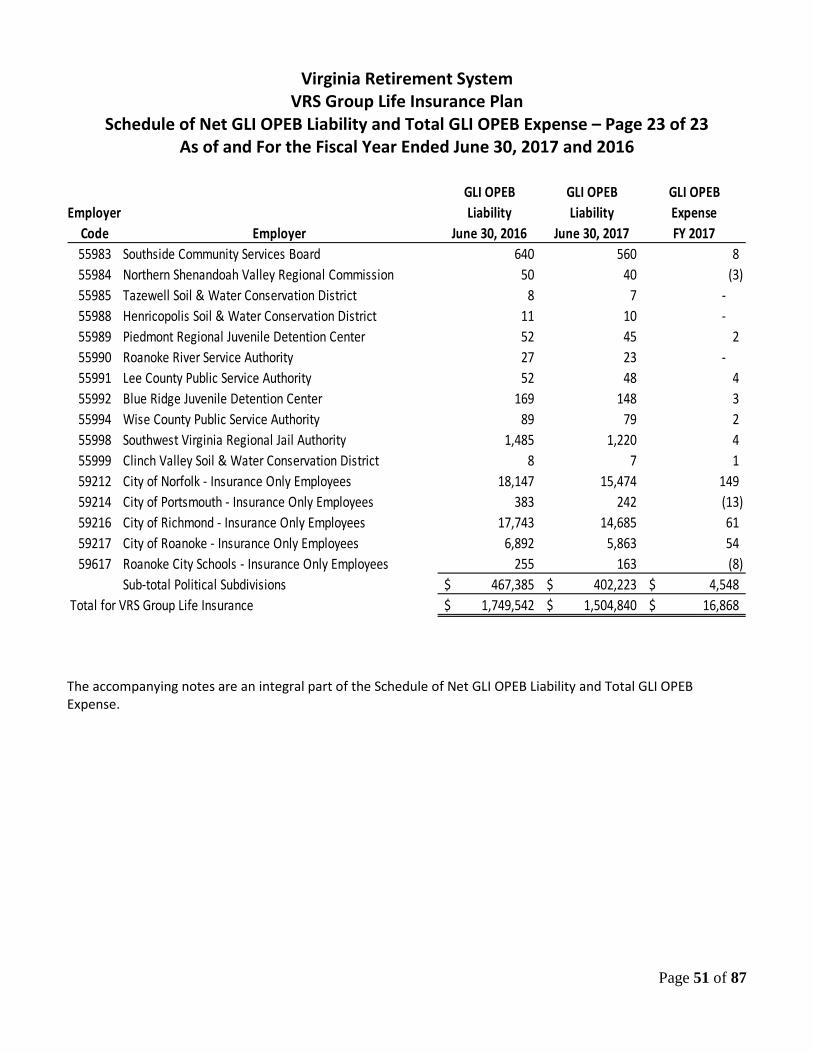
Page 51 of 87
Virginia Retirement System VRS Group Life Insurance Plan
Schedule of Net GLI OPEB Liability and Total GLI OPEB Expense – Page 23 of 23 As of and For the Fiscal Year Ended June 30, 2017 and 2016
GLI OPEB GLI OPEB GLI OPEB
Employer Liability Liability ExpenseCode Employer June 30, 2016 June 30, 2017 FY 201755983 Southside Community Services Board 640 560 8 55984 Northern Shenandoah Valley Regional Commission 50 40 (3) 55985 Tazewell Soil & Water Conservation District 8 7 - 55988 Henricopolis Soil & Water Conservation District 11 10 - 55989 Piedmont Regional Juvenile Detention Center 52 45 2 55990 Roanoke River Service Authority 27 23 - 55991 Lee County Public Service Authority 52 48 4 55992 Blue Ridge Juvenile Detention Center 169 148 3 55994 Wise County Public Service Authority 89 79 2 55998 Southwest Virginia Regional Jail Authority 1,485 1,220 4 55999 Clinch Valley Soil & Water Conservation District 8 7 1 59212 City of Norfolk - Insurance Only Employees 18,147 15,474 149 59214 City of Portsmouth - Insurance Only Employees 383 242 (13) 59216 City of Richmond - Insurance Only Employees 17,743 14,685 61 59217 City of Roanoke - Insurance Only Employees 6,892 5,863 54 59617 Roanoke City Schools - Insurance Only Employees 255 163 (8)
Sub-total Political Subdivisions 467,385$ 402,223$ 4,548$ Total for VRS Group Life Insurance 1,749,542$ 1,504,840$ 16,868$
The accompanying notes are an integral part of the Schedule of Net GLI OPEB Liability and Total GLI OPEB Expense.

Page 52 of 87
Virginia Retirement System VRS Group Life Insurance Plan
Schedule of Deferred Outflows and Deferred Inflows of Resources by Employer – Page 1 of 23 As of June 30, 2017
(Dollars in Thousands)
Net Net Difference Difference Between Between Projected Projected
Differences and Actual Total Differences and Actual TotalBetween Investment Deferred Between Investment DeferredExpected Earnings on Changes in Outflows Expected Earnings on Changes in Inflows
Employer and Actual OPEB Plan Change of Proportionate of and Actual OPEB Plan Change of Proportionate ofCode Employer Experience Investments Assumptions Share Resources Experience Investments Assumptions Share Resources
State: 1XXXX Judicial Retirement System Employees -$ -$ -$ -$ -$ 123$ 205$ 281$ 105$ 714$ 2XXXX State Police Officers' Retirement System Employees - - - - - 202 343 470 477 1,492 35885 Fort Monroe Federal Area Development Authority - - - - - 3 4 5 4 16 3XXXX All Other State Agency Employees - - - 3,648 3,648 9,167 15,554 21,297 7,365 53,383 7XXXX Virginia Law Officers' Retirement System Employees - - - 226 226 623 1,061 1,458 1,049 4,191
Sub-total State -$ -$ -$ 3,874$ 3,874$ 10,118$ 17,167$ 23,511$ 9,000$ 59,796$ Teachers:
40100 Accomack County School Board -$ -$ -$ 37$ 37$ 50$ 83$ 114$ -$ 247$ 40101 Albemarle County Schools - - - 58 58 160 273 373 - 806 40102 Alleghany County School Board - - - - - 21 36 49 37 143 40103 Amelia County School Board - - - 14 14 16 27 36 - 79 40104 Amherst County School Board - - - - - 42 71 97 84 294 40105 Appomattox County School Board - - - 33 33 20 34 46 - 100 40106 Arlington Public Schools - - - 628 628 523 887 1,214 - 2,624 40107 Augusta County School Board - - - 90 90 105 178 243 - 526 40108 Bath County School Board - - - - - 9 14 19 4 46 40109 Bedford County School Board - - - - - 87 148 203 90 528 40110 Bland County School Board - - - 6 6 7 12 16 - 35 40111 Botetourt County Schools - - - - - 48 83 113 3 247 40112 Brunswick County Public Schools - - - - - 17 30 41 5 93 40113 Buchanan County School Board - - - - - 25 44 60 71 200 40114 Buckingham County School Board - - - - - 19 33 45 25 122 40115 Campbell County School Board - - - - - 67 115 158 79 419 40116 Caroline County School Board - - - 35 35 38 63 87 - 188 40117 Carroll County School Board - - - 55 55 39 66 91 - 196 40118 Charles City County School Board - - - 3 3 8 14 20 - 42 40119 Charlotte County School Board - - - - - 20 34 47 20 121 40120 Chesterfield County School Board - - - 444 444 526 893 1,222 - 2,641 40121 Clarke County School Board - - - - - 22 37 50 - 109 40122 Craig County School Board - - - - - 6 11 15 9 41
Deferred Outflows of Resources Deferred Inflows of Resources

Page 53 of 87
Virginia Retirement System VRS Group Life Insurance Plan
Schedule of Deferred Outflows and Deferred Inflows of Resources by Employer – Page 2 of 23 As of June 30, 2017
(Dollars in Thousands)
Net Net Difference Difference Between Between Projected Projected
Differences and Actual Total Differences and Actual TotalBetween Investment Deferred Between Investment DeferredExpected Earnings on Changes in Outflows Expected Earnings on Changes in Inflows
Employer and Actual OPEB Plan Change of Proportionate of and Actual OPEB Plan Change of Proportionate ofCode Employer Experience Investments Assumptions Share Resources Experience Investments Assumptions Share Resources40123 Culpeper County School Board - - - 16 16 79 133 183 - 395 40124 Cumberland County School Board - - - 5 5 14 25 34 - 73 40125 Dickenson County School Board - - - - - 17 30 40 105 192 40126 Dinwiddie County School Board - - - 42 42 42 72 98 - 212 40128 Essex County Public Schools - - - - - 15 25 34 21 95 40129 Fairfax County School Board - - - 2,217 2,217 2,579 4,430 6,045 - 13,054 40130 Fauquier County School Board - - - - - 132 225 307 78 742 40131 Floyd County School Board - - - - - 18 31 43 23 115 40132 Fluvanna County Public Schools - - - - - 43 73 99 27 242 40133 Franklin County Public Schools - - - 71 71 75 126 173 - 374 40134 Frederick County School Board - - - - - 155 263 360 60 838 40135 Giles County Schools - - - - - 22 37 51 8 118 40136 Gloucester County School Board - - - 83 83 54 92 127 - 273 40137 Goochland County School Board - - - 8 8 26 46 63 - 135 40138 Grayson County School Board - - - 21 21 17 27 37 - 81 40139 Greene County Public Schools - - - 8 8 31 53 72 - 156 40140 Greensville County School Board - - - - - 23 38 52 9 122 40141 Halifax County School Board - - - - - 50 86 118 81 335 40142 Hanover County School Board - - - 66 66 182 307 420 - 909 40143 Henrico County School Board - - - 19 19 472 802 1,097 - 2,371 40144 Henry County Public Schools - - - 19 19 66 111 153 - 330 40145 Highland County Public Schools - - - 6 6 3 6 8 - 17 40146 Isle of Wight County Schools - - - - - 52 89 122 8 271 40148 King George County School Board - - - 155 155 41 70 96 - 207 40149 King & Queen County School Board - - - 7 7 7 14 19 - 40 40150 King William County School Board - - - - - 21 36 50 11 118 40151 Lancaster County Public Schools - - - 7 7 14 24 32 - 70 40152 Lee County School Board - - - 9 9 33 57 77 - 167 40153 Loudoun County School Board - - - 1,789 1,789 981 1,666 2,280 - 4,927 40154 Louisa County Public Schools - - - - - 49 83 114 - 246 40155 Lunenburg County School Board - - - - - 14 23 32 66 135
Deferred Outflows of Resources Deferred Inflows of Resources
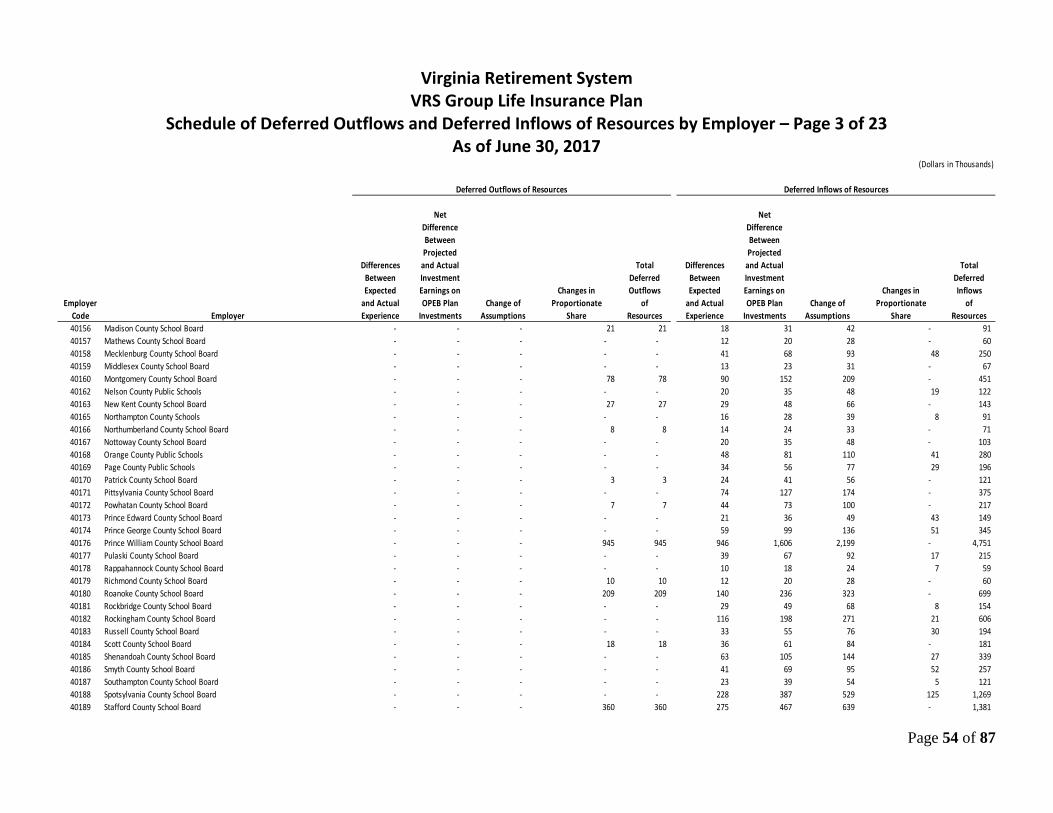
Page 54 of 87
Virginia Retirement System VRS Group Life Insurance Plan
Schedule of Deferred Outflows and Deferred Inflows of Resources by Employer – Page 3 of 23 As of June 30, 2017
(Dollars in Thousands)
Net Net Difference Difference Between Between Projected Projected
Differences and Actual Total Differences and Actual TotalBetween Investment Deferred Between Investment DeferredExpected Earnings on Changes in Outflows Expected Earnings on Changes in Inflows
Employer and Actual OPEB Plan Change of Proportionate of and Actual OPEB Plan Change of Proportionate ofCode Employer Experience Investments Assumptions Share Resources Experience Investments Assumptions Share Resources40156 Madison County School Board - - - 21 21 18 31 42 - 91 40157 Mathews County School Board - - - - - 12 20 28 - 60 40158 Mecklenburg County School Board - - - - - 41 68 93 48 250 40159 Middlesex County School Board - - - - - 13 23 31 - 67 40160 Montgomery County School Board - - - 78 78 90 152 209 - 451 40162 Nelson County Public Schools - - - - - 20 35 48 19 122 40163 New Kent County School Board - - - 27 27 29 48 66 - 143 40165 Northampton County Schools - - - - - 16 28 39 8 91 40166 Northumberland County School Board - - - 8 8 14 24 33 - 71 40167 Nottoway County School Board - - - - - 20 35 48 - 103 40168 Orange County Public Schools - - - - - 48 81 110 41 280 40169 Page County Public Schools - - - - - 34 56 77 29 196 40170 Patrick County School Board - - - 3 3 24 41 56 - 121 40171 Pittsylvania County School Board - - - - - 74 127 174 - 375 40172 Powhatan County School Board - - - 7 7 44 73 100 - 217 40173 Prince Edward County School Board - - - - - 21 36 49 43 149 40174 Prince George County School Board - - - - - 59 99 136 51 345 40176 Prince William County School Board - - - 945 945 946 1,606 2,199 - 4,751 40177 Pulaski County School Board - - - - - 39 67 92 17 215 40178 Rappahannock County School Board - - - - - 10 18 24 7 59 40179 Richmond County School Board - - - 10 10 12 20 28 - 60 40180 Roanoke County School Board - - - 209 209 140 236 323 - 699 40181 Rockbridge County School Board - - - - - 29 49 68 8 154 40182 Rockingham County School Board - - - - - 116 198 271 21 606 40183 Russell County School Board - - - - - 33 55 76 30 194 40184 Scott County School Board - - - 18 18 36 61 84 - 181 40185 Shenandoah County School Board - - - - - 63 105 144 27 339 40186 Smyth County School Board - - - - - 41 69 95 52 257 40187 Southampton County School Board - - - - - 23 39 54 5 121 40188 Spotsylvania County School Board - - - - - 228 387 529 125 1,269 40189 Stafford County School Board - - - 360 360 275 467 639 - 1,381
Deferred Outflows of Resources Deferred Inflows of Resources
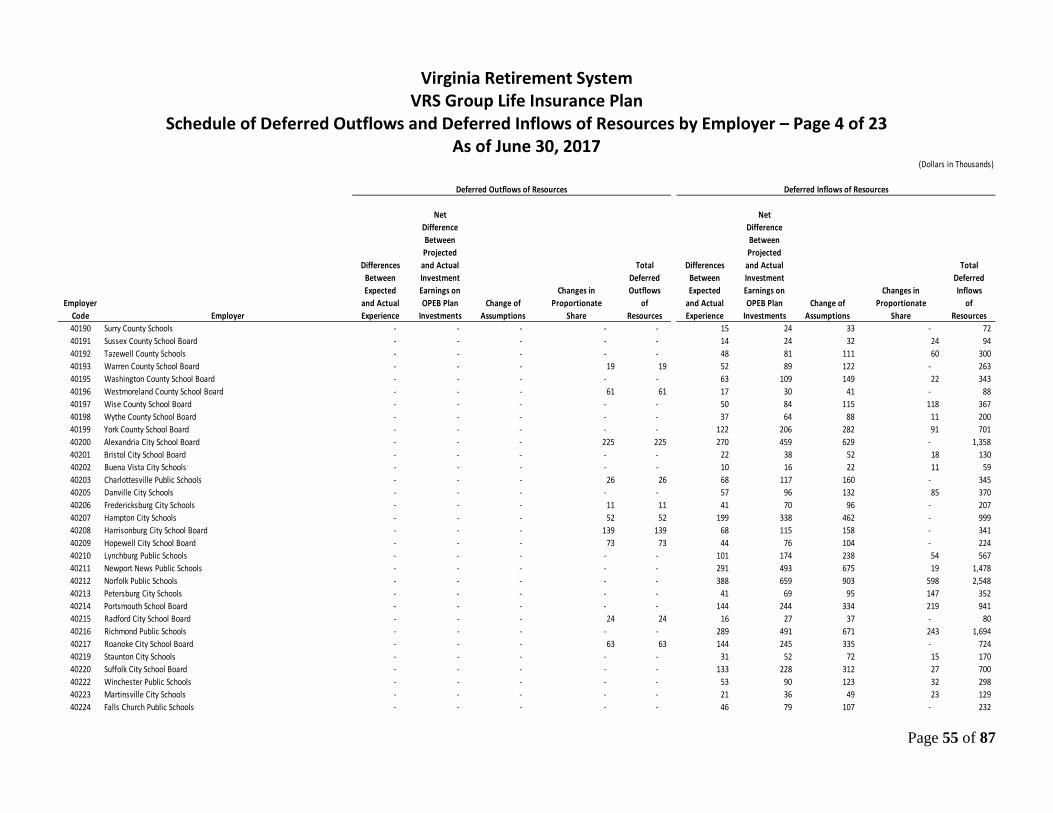
Page 55 of 87
Virginia Retirement System VRS Group Life Insurance Plan
Schedule of Deferred Outflows and Deferred Inflows of Resources by Employer – Page 4 of 23 As of June 30, 2017
(Dollars in Thousands)
Net Net Difference Difference Between Between Projected Projected
Differences and Actual Total Differences and Actual TotalBetween Investment Deferred Between Investment DeferredExpected Earnings on Changes in Outflows Expected Earnings on Changes in Inflows
Employer and Actual OPEB Plan Change of Proportionate of and Actual OPEB Plan Change of Proportionate ofCode Employer Experience Investments Assumptions Share Resources Experience Investments Assumptions Share Resources40190 Surry County Schools - - - - - 15 24 33 - 72 40191 Sussex County School Board - - - - - 14 24 32 24 94 40192 Tazewell County Schools - - - - - 48 81 111 60 300 40193 Warren County School Board - - - 19 19 52 89 122 - 263 40195 Washington County School Board - - - - - 63 109 149 22 343 40196 Westmoreland County School Board - - - 61 61 17 30 41 - 88 40197 Wise County School Board - - - - - 50 84 115 118 367 40198 Wythe County School Board - - - - - 37 64 88 11 200 40199 York County School Board - - - - - 122 206 282 91 701 40200 Alexandria City School Board - - - 225 225 270 459 629 - 1,358 40201 Bristol City School Board - - - - - 22 38 52 18 130 40202 Buena Vista City Schools - - - - - 10 16 22 11 59 40203 Charlottesville Public Schools - - - 26 26 68 117 160 - 345 40205 Danville City Schools - - - - - 57 96 132 85 370 40206 Fredericksburg City Schools - - - 11 11 41 70 96 - 207 40207 Hampton City Schools - - - 52 52 199 338 462 - 999 40208 Harrisonburg City School Board - - - 139 139 68 115 158 - 341 40209 Hopewell City School Board - - - 73 73 44 76 104 - 224 40210 Lynchburg Public Schools - - - - - 101 174 238 54 567 40211 Newport News Public Schools - - - - - 291 493 675 19 1,478 40212 Norfolk Public Schools - - - - - 388 659 903 598 2,548 40213 Petersburg City Schools - - - - - 41 69 95 147 352 40214 Portsmouth School Board - - - - - 144 244 334 219 941 40215 Radford City School Board - - - 24 24 16 27 37 - 80 40216 Richmond Public Schools - - - - - 289 491 671 243 1,694 40217 Roanoke City School Board - - - 63 63 144 245 335 - 724 40219 Staunton City Schools - - - - - 31 52 72 15 170 40220 Suffolk City School Board - - - - - 133 228 312 27 700 40222 Winchester Public Schools - - - - - 53 90 123 32 298 40223 Martinsville City Schools - - - - - 21 36 49 23 129 40224 Falls Church Public Schools - - - - - 46 79 107 - 232
Deferred Outflows of Resources Deferred Inflows of Resources

Page 56 of 87
Virginia Retirement System VRS Group Life Insurance Plan
Schedule of Deferred Outflows and Deferred Inflows of Resources by Employer – Page 5 of 23 As of June 30, 2017
(Dollars in Thousands)
Net Net Difference Difference Between Between Projected Projected
Differences and Actual Total Differences and Actual TotalBetween Investment Deferred Between Investment DeferredExpected Earnings on Changes in Outflows Expected Earnings on Changes in Inflows
Employer and Actual OPEB Plan Change of Proportionate of and Actual OPEB Plan Change of Proportionate ofCode Employer Experience Investments Assumptions Share Resources Experience Investments Assumptions Share Resources40225 Colonial Heights City Schools - - - - - 34 57 79 12 182 40230 Covington City School Board - - - 24 24 10 17 24 - 51 40231 Fairfax City School Board - - - - - 1 - - - 1 40232 Franklin City Public Schools - - - - - 14 23 32 19 88 40233 Chesapeake Public Schools - - - 119 119 408 694 950 - 2,052 40234 Virginia Beach City School Board - - - - - 726 1,232 1,687 103 3,748 40236 Manassas Park City Schools - - - - - 39 64 88 69 260 40306 Town of West Point School Board - - - 34 34 10 16 23 - 49 40307 Lexington City School Board - - - 7 7 4 9 12 - 25 40308 Waynesboro Public Schools - - - 9 9 33 55 76 - 164 40309 Town of Colonial Beach Schools - - - 10 10 7 11 15 - 33 40313 Galax City Schools - - - - - 12 22 30 8 72 40314 Norton City Schools - - - - - 6 12 16 11 45 40332 Manassas City Schools - - - - - 101 172 235 73 581 40335 City of Salem Schools - - - - - 39 67 92 10 208 40402 Williamsburg-James City County School Board - - - - - 124 210 288 9 631 40403 Poquoson City Public Schools - - - 4 4 21 35 48 - 104 40410 Valley Vocational Technical Center - - - - - 4 6 8 - 18 40412 Charlottesville/Albemarle Vo-Tech Center - - - 7 7 2 4 5 - 11 40413 The Pruden Center for Industry and Technology - - - - - 2 4 6 14 26 40414 Jackson River Technical Center - - - - - 1 2 2 24 29 40415 New Horizons Technical Center - - - 17 17 15 25 35 - 75 40416 Northern Neck Regional Vocational Center - - - - - 2 3 5 6 16 40417 Rowanty Vocational Technical Center - - - - - 2 2 3 - 7 40418 Amelia-Nottoway Vocational Center - - - - - - 1 1 - 2 40421 Northern Neck Regional Special Education Program - - - 4 4 2 2 3 - 7 40423 Maggie Walker Governor's School for Govt & Intl Studies - - - - - 9 13 18 - 40 40424 Appomattox Region Governor's School - - - - - 4 5 7 8 24 40425 Bridging Communities Regional Career and Tech Center - - - - - 1 1 2 - 4
Sub-total Teachers -$ -$ -$ 8,565$ 8,565$ 14,298$ 24,327$ 33,289$ 3,638$ 75,552$
Deferred Outflows of Resources Deferred Inflows of Resources

Page 57 of 87
Virginia Retirement System VRS Group Life Insurance Plan
Schedule of Deferred Outflows and Deferred Inflows of Resources by Employer – Page 6 of 23 As of June 30, 2017
(Dollars in Thousands)
Net Net Difference Difference Between Between Projected Projected
Differences and Actual Total Differences and Actual TotalBetween Investment Deferred Between Investment DeferredExpected Earnings on Changes in Outflows Expected Earnings on Changes in Inflows
Employer and Actual OPEB Plan Change of Proportionate of and Actual OPEB Plan Change of Proportionate ofCode Employer Experience Investments Assumptions Share Resources Experience Investments Assumptions Share Resources
Political Subdivisions:55100 Accomack County - - - - - 20 35 48 - 103 55101 Albemarle County - - - - - 71 121 165 11 368 55102 Alleghany County - - - 14 14 13 22 31 - 66 55103 Amelia County - - - - - 7 12 17 5 41 55104 Amherst County - - - 29 29 14 25 34 - 73 55105 Appomattox County - - - - - 8 12 17 5 42 55107 Augusta County - - - 53 53 36 62 85 - 183 55108 Bath County - - - - - 5 8 11 14 38 55109 Bedford County - - - 96 96 34 57 78 - 169 55110 Bland County - - - 8 8 4 7 9 - 20 55111 Botetourt County - - - 4 4 20 36 49 - 105 55112 Brunswick County - - - 13 13 9 15 20 - 44 55113 Buchanan County - - - - - 19 32 44 54 149 55114 Buckingham County - - - - - 7 13 17 7 44 55115 Campbell County - - - - - 25 40 55 25 145 55116 Caroline County - - - 19 19 19 33 45 - 97 55117 Carroll County - - - - - 14 24 32 11 81 55118 Charles City County - - - 6 6 6 9 13 - 28 55119 Charlotte County - - - - - 8 13 18 - 39 55120 Chesterfield County - - - - - 334 566 775 68 1,743 55121 Clarke County - - - 10 10 9 14 19 - 42 55122 Craig County - - - 8 8 3 5 6 - 14 55123 Culpeper County - - - 46 46 32 55 75 - 162 55124 Cumberland County - - - - - 6 10 14 - 30 55126 Dinwiddie County - - - 50 50 18 29 40 - 87 55128 Essex County - - - - - 7 12 16 10 45 55130 Fauquier County - - - 21 21 63 105 144 - 312 55131 Floyd County - - - 17 17 7 12 17 - 36 55132 Fluvanna County - - - 15 15 12 20 28 - 60 55133 Franklin County - - - 45 45 25 43 59 - 127
Deferred Outflows of Resources Deferred Inflows of Resources

Page 58 of 87
Virginia Retirement System VRS Group Life Insurance Plan
Schedule of Deferred Outflows and Deferred Inflows of Resources by Employer – Page 7 of 23 As of June 30, 2017
(Dollars in Thousands)
Net Net Difference Difference Between Between Projected Projected
Differences and Actual Total Differences and Actual TotalBetween Investment Deferred Between Investment DeferredExpected Earnings on Changes in Outflows Expected Earnings on Changes in Inflows
Employer and Actual OPEB Plan Change of Proportionate of and Actual OPEB Plan Change of Proportionate ofCode Employer Experience Investments Assumptions Share Resources Experience Investments Assumptions Share Resources55134 Frederick County - - - 129 129 70 121 165 - 356 55135 Giles County - - - 4 4 10 18 24 - 52 55136 Gloucester County - - - - - 26 43 59 - 128 55137 Goochland County - - - 13 13 18 31 43 - 92 55138 Grayson County - - - 8 8 7 13 18 - 38 55139 Greene County - - - 8 8 9 17 23 - 49 55140 Greensville County - - - 9 9 8 14 19 - 41 55141 Halifax County - - - - - 15 24 33 - 72 55142 Hanover County - - - 67 67 110 186 255 - 551 55143 Henrico County - - - 226 226 443 753 1,030 - 2,226 55144 Henry County - - - - - 29 49 67 - 145 55145 Highland County - - - - - 2 4 6 - 12 55146 Isle of Wight County - - - - - 24 39 54 - 117 55147 James City County - - - 18 18 70 120 164 - 354 55148 King George County - - - 17 17 19 32 43 - 94 55149 King and Queen County - - - - - 4 7 10 - 21 55150 King William County - - - - - 7 11 16 - 34 55151 Lancaster County - - - - - 8 14 20 4 46 55152 Lee County - - - - - 9 15 21 9 54 55153 Loudoun County - - - 44 44 361 613 839 - 1,813 55154 Louisa County - - - 8 8 21 36 49 - 106 55155 Lunenburg County - - - - - 4 7 9 5 25 55156 Madison County - - - 13 13 8 14 19 - 41 55157 Mathews County - - - - - 4 8 10 7 29 55158 Mecklenburg County - - - 5 5 14 26 35 - 75 55159 Middlesex County - - - - - 4 9 12 - 25 55160 Montgomery County - - - - - 32 54 74 22 182 55162 Nelson County - - - - - 7 12 17 - 36 55163 New Kent County - - - 19 19 15 27 37 - 79 55165 Northampton County - - - - - 15 25 34 8 82 55166 Northumberland County - - - 19 19 7 13 17 - 37
Deferred Outflows of Resources Deferred Inflows of Resources

Page 59 of 87
Virginia Retirement System VRS Group Life Insurance Plan
Schedule of Deferred Outflows and Deferred Inflows of Resources by Employer – Page 8 of 23 As of June 30, 2017
(Dollars in Thousands)
Net Net Difference Difference Between Between Projected Projected
Differences and Actual Total Differences and Actual TotalBetween Investment Deferred Between Investment DeferredExpected Earnings on Changes in Outflows Expected Earnings on Changes in Inflows
Employer and Actual OPEB Plan Change of Proportionate of and Actual OPEB Plan Change of Proportionate ofCode Employer Experience Investments Assumptions Share Resources Experience Investments Assumptions Share Resources55167 Nottoway County - - - - - 7 10 14 - 31 55168 Orange County - - - 20 20 18 32 43 - 93 55169 Page County - - - - - 12 21 29 3 65 55170 Patrick County - - - 7 7 10 17 23 - 50 55171 Pittsylvania County - - - 7 7 26 44 60 - 130 55172 Powhatan County - - - 21 21 14 24 33 - 71 55173 Prince Edward County - - - - - 9 16 21 9 55 55174 Prince George County - - - - - 23 38 53 9 123 55176 Prince William County - - - 57 57 452 768 1,051 - 2,271 55177 County of Pulaski - - - 16 16 21 36 49 - 106 55178 Rappahannock County - - - - - 6 8 11 16 41 55179 Richmond County - - - - - 5 8 11 - 24 55180 Roanoke County - - - 32 32 83 142 195 - 420 55181 Rockbridge County - - - 8 8 12 20 27 - 59 55182 Rockingham County - - - 52 52 46 77 105 - 228 55183 Russell County - - - - - 10 18 24 - 52 55184 Scott County - - - - - 10 17 23 11 61 55185 Shenandoah County - - - - - 23 38 52 17 130 55186 Smyth County - - - - - 13 23 31 17 84 55187 Southampton County - - - 9 9 14 24 33 - 71 55188 Spotsylvania County - - - 75 75 86 146 200 - 432 55189 Stafford County - - - 143 143 92 155 212 - 459 55190 Surry County - - - 6 6 8 12 17 - 37 55191 Sussex County - - - - - 9 15 20 29 73 55192 Tazewell County - - - - - 20 35 48 33 136 55193 Warren County - - - 17 17 18 32 43 - 93 55195 Washington County - - - - - 19 32 44 21 116 55196 Westmoreland County - - - 56 56 11 18 25 - 54 55197 Wise County - - - - - 20 32 44 33 129 55198 Wythe County - - - 12 12 12 21 29 - 62 55199 York County - - - - - 70 119 163 20 372
Deferred Outflows of Resources Deferred Inflows of Resources

Page 60 of 87
Virginia Retirement System VRS Group Life Insurance Plan
Schedule of Deferred Outflows and Deferred Inflows of Resources by Employer – Page 9 of 23 As of June 30, 2017
(Dollars in Thousands)
Net Net Difference Difference Between Between Projected Projected
Differences and Actual Total Differences and Actual TotalBetween Investment Deferred Between Investment DeferredExpected Earnings on Changes in Outflows Expected Earnings on Changes in Inflows
Employer and Actual OPEB Plan Change of Proportionate of and Actual OPEB Plan Change of Proportionate ofCode Employer Experience Investments Assumptions Share Resources Experience Investments Assumptions Share Resources55201 City of Bristol - - - - - 26 44 60 31 161 55202 City of Buena Vista - - - 12 12 6 10 14 - 30 55203 Town of St. Paul - - - - - 1 2 3 - 6 55204 Town of Clifton Forge - - - - - 3 4 6 10 23 55206 City of Fredericksburg - - - - - 42 71 98 26 237 55207 City of Hampton - - - - - 164 278 381 34 857 55208 City of Harrisonburg - - - 4 4 53 90 124 - 267 55209 City of Hopewell - - - 53 53 32 55 76 - 163 55210 City of Lynchburg - - - - - 97 165 226 34 522 55211 Town of Crewe - - - 3 3 2 3 4 - 9 55212 City of Norfolk - - - - - 48 81 111 105 345 55213 City of Petersburg - - - - - 38 65 88 350 541 55214 City of Portsmouth - - - - - 120 204 279 161 764 55215 City of Radford - - - - - 18 31 42 16 107 55216 City of Richmond - - - - - 47 78 107 76 308 55217 City of Roanoke - - - - - 16 27 37 - 80 55218 Town of Craigsville - - - - - - 1 1 - 2 55219 City of Staunton - - - - - 24 41 56 18 139 55220 City of Suffolk - - - 275 275 116 197 270 - 583 55221 City of Williamsburg - - - - - 18 31 42 8 99 55222 City of Winchester - - - - - 45 75 103 35 258 55223 City of Martinsville - - - - - 25 41 56 30 152 55224 City of Falls Church - - - - - 2 4 6 - 12 55225 City of Colonial Heights - - - - - 24 40 55 30 149 55226 Town of Front Royal - - - 3 3 13 23 31 - 67 55229 Town of Chilhowie - - - - - 1 3 4 - 8 55230 City of Covington - - - - - 6 12 16 4 38 55231 Town of Floyd - - - - - - - 1 - 1 55232 City of Franklin - - - - - 13 23 32 14 82 55233 City of Chesapeake - - - 194 194 282 478 654 - 1,414 55234 City of Virginia Beach - - - 297 297 573 974 1,333 - 2,880
Deferred Outflows of Resources Deferred Inflows of Resources

Page 61 of 87
Virginia Retirement System VRS Group Life Insurance Plan
Schedule of Deferred Outflows and Deferred Inflows of Resources by Employer – Page 10 of 23 As of June 30, 2017
(Dollars in Thousands)
Net Net Difference Difference Between Between Projected Projected
Differences and Actual Total Differences and Actual TotalBetween Investment Deferred Between Investment DeferredExpected Earnings on Changes in Outflows Expected Earnings on Changes in Inflows
Employer and Actual OPEB Plan Change of Proportionate of and Actual OPEB Plan Change of Proportionate ofCode Employer Experience Investments Assumptions Share Resources Experience Investments Assumptions Share Resources55235 City of Norton - - - - - 6 10 13 3 32 55236 City of Manassas Park - - - 4 4 16 28 38 - 82 55239 Town of Grottoes - - - - - 2 2 3 - 7 55240 Town of Onley - - - - - - 1 1 - 2 55241 Town of West Point - - - - - 3 4 6 - 13 55245 Town of Scottsville - - - - - - 1 1 - 2 55246 Town of Burkeville - - - - - 1 - - - 1 55247 Town of Madison - - - - - - - - - - 55252 Town of Windsor - - - - - - 2 3 - 5 55254 Town of Stephens City - - - - - - 1 2 - 3 55257 Town of Lebanon - - - 3 3 4 6 9 - 19 55258 City of Newport News - - - 529 529 101 172 235 - 508 55260 Town of Haymarket - - - - - 1 2 2 5 10 55261 Town of Lovettsville - - - - - 1 2 2 - 5 55300 Town of Abingdon - - - - - 10 17 23 8 58 55301 Town of Dumfries - - - - - 2 3 4 24 33 55302 Town of Iron Gate - - - - - 1 - - - 1 55303 Town of Montross - - - - - 1 - - - 1 55304 Town of South Boston - - - - - 6 9 13 - 28 55305 Town of Gretna - - - - - 1 1 2 - 4 55306 Town of Remington - - - - - - - 1 - 1 55307 City of Lexington - - - - - 8 14 20 46 88 55308 City of Waynesboro - - - - - 24 40 55 25 144 55309 Town of Colonial Beach - - - - - 3 6 8 3 20 55310 Town of Smithfield - - - 12 12 5 9 12 - 26 55311 Town of Brookneal - - - - - 1 1 1 - 3 55312 Town of Hamilton - - - - - 1 1 1 - 3 55313 City of Galax - - - - - 11 19 26 - 56 55314 Town of Jonesville - - - - - - 1 2 - 3 55315 Town of Wytheville - - - - - 12 20 27 - 59 55317 Town of Vienna - - - 7 7 22 37 50 - 109
Deferred Outflows of Resources Deferred Inflows of Resources

Page 62 of 87
Virginia Retirement System VRS Group Life Insurance Plan
Schedule of Deferred Outflows and Deferred Inflows of Resources by Employer – Page 11 of 23 As of June 30, 2017
(Dollars in Thousands)
Net Net Difference Difference Between Between Projected Projected
Differences and Actual Total Differences and Actual TotalBetween Investment Deferred Between Investment DeferredExpected Earnings on Changes in Outflows Expected Earnings on Changes in Inflows
Employer and Actual OPEB Plan Change of Proportionate of and Actual OPEB Plan Change of Proportionate ofCode Employer Experience Investments Assumptions Share Resources Experience Investments Assumptions Share Resources55318 Town of Vinton - - - 23 23 7 11 15 - 33 55319 City of Emporia - - - 17 17 8 14 19 - 41 55320 Town of Culpeper - - - 5 5 17 29 40 - 86 55321 Town of Woodstock - - - - - 5 8 11 - 24 55322 Town of Glasgow - - - - - - - 1 - 1 55323 Town of Marion - - - 11 11 6 10 14 - 30 55324 Town of Altavista - - - - - 4 6 9 - 19 55325 Town of Herndon - - - 14 14 31 51 70 - 152 55326 Town of Pearisburg - - - - - 2 4 6 - 12 55329 Town of Leesburg - - - - - 41 70 95 69 275 55330 Town of Chatham - - - - - 1 2 3 3 9 55331 Town of Bowling Green - - - 3 3 1 1 1 - 3 55332 City of Manassas - - - 25 25 53 90 123 - 266 55334 Town of Boydton - - - - - - 1 1 - 2 55335 City of Salem - - - - - 42 70 96 38 246 55336 Town of McKenney - - - - - - - - - - 55338 Town of Quantico - - - - - - - 1 - 1 55339 Town of Halifax - - - - - 1 1 1 - 3 55340 Town of Blacksburg - - - 9 9 26 45 61 - 132 55341 Town of Chincoteague - - - - - 3 6 8 - 17 55342 Town of Lawrenceville - - - - - 2 3 4 - 9 55343 Town of Amherst - - - - - 1 3 3 - 7 55344 Town of Stanley - - - - - - 2 3 - 5 55345 Town of Hillsville - - - - - 3 4 6 - 13 55346 Town of Elkton - - - - - 2 3 4 3 12 55347 Town of Bridgewater - - - 19 19 4 8 10 - 22 55348 Town of Purcellville - - - 5 5 9 14 20 - 43 55349 Town of Timberville - - - 5 5 - 2 3 - 5 55350 Town of Wise - - - - - 3 6 9 8 26 55351 Town of New Market - - - - - 2 2 3 - 7 55353 Town of Rocky Mount - - - 7 7 5 8 12 - 25
Deferred Outflows of Resources Deferred Inflows of Resources

Page 63 of 87
Virginia Retirement System VRS Group Life Insurance Plan
Schedule of Deferred Outflows and Deferred Inflows of Resources by Employer – Page 12 of 23 As of June 30, 2017
(Dollars in Thousands)
Net Net Difference Difference Between Between Projected Projected
Differences and Actual Total Differences and Actual TotalBetween Investment Deferred Between Investment DeferredExpected Earnings on Changes in Outflows Expected Earnings on Changes in Inflows
Employer and Actual OPEB Plan Change of Proportionate of and Actual OPEB Plan Change of Proportionate ofCode Employer Experience Investments Assumptions Share Resources Experience Investments Assumptions Share Resources55355 Town of Luray - - - - - 4 6 8 7 25 55357 Town of Strasburg - - - 4 4 5 9 12 - 26 55359 Town of Clarksville - - - - - 2 2 3 - 7 55360 Town of Dublin - - - - - 2 3 4 - 9 55361 Town of Middleburg - - - - - 2 3 3 - 8 55363 Town of Chase City - - - - - 2 3 5 5 15 55364 City of Bedford - - - - - 7 11 16 - 34 55365 City of Poquoson - - - 14 14 10 19 26 - 55 55366 Town of Ashland - - - - - 6 10 13 4 33 55367 Town of Broadway - - - 3 3 1 3 4 - 8 55368 Town of Berryville - - - - - 3 4 6 - 13 55370 Town of Urbanna - - - - - 1 - - - 1 55371 Town of Bluefield - - - - - 4 7 10 - 21 55372 Town of Weber City - - - - - - - 1 - 1 55374 Town of Hurt - - - - - - - 1 - 1 55376 Town of Coeburn - - - - - 2 2 3 3 10 55377 Town of Dayton - - - - - 2 2 3 - 7 55378 Town of Courtland - - - - - 1 - - - 1 55379 Town of Cape Charles - - - - - 2 4 5 - 11 55381 Town of Warsaw - - - - - 1 1 2 - 4 55382 Town of Grundy - - - - - 1 2 3 - 6 55383 Town of Warrenton - - - 19 19 11 17 24 - 52 55384 Town of Louisa - - - - - 1 2 3 - 6 55385 Town of Kenbridge - - - - - 1 1 2 - 4 55386 Town of Mt. Jackson - - - - - 1 2 3 - 6 55387 Town of Pulaski - - - 16 16 7 13 18 - 38 55389 Town of Pembroke - - - - - - 1 1 - 2 55390 Town of Parksley - - - - - - 1 1 3 5 55391 Town of Onancock - - - - - 1 2 2 3 8 55392 Town of Victoria - - - - - 1 2 2 - 5 55393 Town of Shenandoah - - - - - 1 2 3 3 9
Deferred Outflows of Resources Deferred Inflows of Resources

Page 64 of 87
Virginia Retirement System VRS Group Life Insurance Plan
Schedule of Deferred Outflows and Deferred Inflows of Resources by Employer – Page 13 of 23 As of June 30, 2017
(Dollars in Thousands)
Net Net Difference Difference Between Between Projected Projected
Differences and Actual Total Differences and Actual TotalBetween Investment Deferred Between Investment DeferredExpected Earnings on Changes in Outflows Expected Earnings on Changes in Inflows
Employer and Actual OPEB Plan Change of Proportionate of and Actual OPEB Plan Change of Proportionate ofCode Employer Experience Investments Assumptions Share Resources Experience Investments Assumptions Share Resources55395 Town of Round Hill - - - - - 2 3 3 - 8 55396 Town of Kilmarnock - - - - - 2 2 3 - 7 55397 Town of Orange - - - - - 4 7 9 5 25 55399 Town of Blackstone - - - - - 4 6 8 11 29 55401 Southeastern Virginia Public Service Authority - - - - - 10 18 25 14 67 55402 Pittsylvania County Service Authority - - - - - 1 1 1 4 7 55403 Spotsylvania-Stafford-Fredericksburg Group Home Comm. - - - - - 1 2 2 - 5 55404 Appomattox Regional Library - - - - - 1 2 2 4 9 55405 Staunton Redevelopment & Housing Authority - - - - - - 1 2 - 3 55408 Charles Pinckney Jones Memorial Library - - - - - 1 - - - 1 55409 Southside Regional Juvenile Group Home Commission - - - - - 1 - - - 1 55411 Hampton Roads Sanitation District - - - 28 28 87 147 202 - 436 55412 Peninsula Airport Commission - - - - - 4 7 10 12 33 55413 Richmond Redevelopment & Housing Authority - - - 19 19 15 26 35 - 76 55415 Chesapeake Redevelopment & Housing Authority - - - - - 4 6 8 - 18 55417 Norfolk Airport Authority - - - 30 30 21 35 48 - 104 55418 Charlottesville Redevelopment & Housing Authority - - - - - 1 1 2 7 11 55419 Hampton Redevelopment & Housing Authority - - - - - 5 9 12 - 26 55420 Loudoun County Sanitation Authority - - - 61 61 39 64 88 - 191 55421 Danville Redevelopment & Housing Authority - - - - - 2 4 5 - 11 55422 NRV Regional Water Authority - - - - - 2 3 4 - 9 55423 Northern Virginia Juvenile Detention Home - - - - - 8 13 17 39 77 55425 Colonial Services Board - - - 54 54 16 27 37 - 80 55426 Blacksburg-VPI Sanitation Authority - - - - - 2 3 4 - 9 55427 Potomac River Fisheries Commission - - - - - 1 1 1 - 3 55428 Chesapeake Bay Bridge & Tunnel District - - - 4 4 14 24 33 - 71 55429 Alexandria Redevelopment & Housing Authority - - - 3 3 8 15 20 - 43 55430 Albemarle County Service Authority - - - - - 6 12 16 - 34 55431 Franklin Redevelopment & Housing Authority - - - 5 5 1 1 2 - 4 55432 Bristol Redevelopment & Housing Authority - - - - - 2 3 4 - 9 55433 Norfolk Redevelopment & Housing Authority - - - 35 35 24 42 57 - 123
Deferred Outflows of Resources Deferred Inflows of Resources

Page 65 of 87
Virginia Retirement System VRS Group Life Insurance Plan
Schedule of Deferred Outflows and Deferred Inflows of Resources by Employer – Page 14 of 23 As of June 30, 2017
(Dollars in Thousands)
Net Net Difference Difference Between Between Projected Projected
Differences and Actual Total Differences and Actual TotalBetween Investment Deferred Between Investment DeferredExpected Earnings on Changes in Outflows Expected Earnings on Changes in Inflows
Employer and Actual OPEB Plan Change of Proportionate of and Actual OPEB Plan Change of Proportionate ofCode Employer Experience Investments Assumptions Share Resources Experience Investments Assumptions Share Resources55435 Richmond Metropolitan Authority - - - - - 7 12 16 30 65 55436 Riverside Regional Jail - - - - - 27 43 59 54 183 55439 Rappahannock-Rapidan Planning District Commission - - - - - 1 1 1 3 6 55440 Shenandoah Valley Juvenile Detention Home - - - 14 14 5 9 12 - 26 55443 Bedford Public Library - - - - - 1 2 3 - 6 55445 Chesterfield County Health Center Commission - - - - - 12 21 28 16 77 55446 Washington County Service Authority - - - - - 5 11 15 4 35 55447 Rappahannock Area Community Services Board - - - 109 109 34 59 81 - 174 55449 Hampton Roads Planning District Commission - - - - - 6 9 13 19 47 55450 Meherrin Regional Library - - - - - - 1 1 - 2 55453 Rockbridge Area Community Services Board - - - - - 7 12 16 5 40 55454 Greensville/Emporia Department of Social Services - - - - - 2 3 5 - 10 55455 James City Service Authority - - - - - 7 13 17 3 40 55456 Accomack-Northampton Planning District Commission - - - - - 1 2 3 4 10 55457 Harrisonburg/Rockingham Sewer Authority - - - - - 3 5 6 - 14 55458 Wytheville Redevelopment & Housing Authority - - - - - - 2 2 - 4 55459 Waynesboro Redevelopment and Housing Authority - - - - - 1 3 4 - 8 55460 Region Ten Community Services Board - - - 23 23 38 64 88 - 190 55462 LENOWISCO Planning District Commission - - - - - 1 1 1 5 8 55465 Rivanna Water & Sewer Authority - - - 8 8 9 14 19 - 42 55466 Appomattox River Water Authority - - - - - 3 4 6 3 16 55467 Campbell County Utilities and Service Authority - - - - - 2 4 5 - 11 55469 Eastern Shore Community Services Board - - - 14 14 9 15 20 - 44 55470 ANCHOR Commission - - - - - - 1 1 - 2 55471 Central Virginia Community Services - - - - - 49 85 116 57 307 55472 District 19 Community Services Board - - - - - 15 26 35 55 131 55473 Tidewater Transportation District - - - - - 32 53 73 - 158 55474 Upper Occoquan Sewage Authority - - - - - 25 43 58 - 126 55475 New River Valley Juvenile Detention Home - - - - - 2 2 3 3 10 55477 Frederick County Sanitation Authority - - - 14 14 6 10 14 - 30 55479 Cumberland Mountain Community Services - - - 46 46 19 32 43 - 94
Deferred Outflows of Resources Deferred Inflows of Resources

Page 66 of 87
Virginia Retirement System VRS Group Life Insurance Plan
Schedule of Deferred Outflows and Deferred Inflows of Resources by Employer – Page 15 of 23 As of June 30, 2017
(Dollars in Thousands)
Net Net Difference Difference Between Between Projected Projected
Differences and Actual Total Differences and Actual TotalBetween Investment Deferred Between Investment DeferredExpected Earnings on Changes in Outflows Expected Earnings on Changes in Inflows
Employer and Actual OPEB Plan Change of Proportionate of and Actual OPEB Plan Change of Proportionate ofCode Employer Experience Investments Assumptions Share Resources Experience Investments Assumptions Share Resources55482 Middle Peninsula/Northern Neck Public Service Auth - - - 45 45 24 41 56 - 121 55483 Rockbridge County Public Service Authority - - - - - 1 1 2 - 4 55484 Danville-Pittsylvania Mental Health Services Board - - - 31 31 18 29 40 - 87 55485 Crater Youth Care Commission - - - - - 2 4 5 3 14 55486 Southeastern Tidewater Manpower Authority - - - - - 3 6 8 8 25 55487 Capital Regional Airport Commission - - - 8 8 15 24 33 - 72 55488 Northwestern Community Services Board - - - 14 14 12 20 28 - 60 55489 Harrisonburg-Rockingham Community Services Board - - - 25 25 12 18 25 - 55 55491 Middle Peninsula Regional Security Center - - - - - 4 9 12 - 25 55492 Northern Neck Planning District Commission - - - - - 1 1 1 - 3 55493 Planning District One Community Services Board - - - - - - 1 1 - 2 55494 Rockbridge Area Social Services Board - - - - - 1 3 4 - 8 55495 Dinwiddie County Water Authority - - - - - 1 2 2 - 5 55496 Rappahannock Rapidan Community Services - - - - - 18 32 44 10 104 55498 Valley Community Services Board - - - - - 18 31 42 12 103 55499 Eastern Shore Public Library - - - - - - 1 1 - 2 55500 Alexandria City Public Schools - - - - - 15 25 34 - 74 55501 Albemarle County Public Schools - - - 12 12 12 21 28 - 61 55502 Alleghany Highlands Public Schools - - - - - 3 6 8 - 17 55503 Charlottesville City Public Schools - - - - - 4 6 8 9 27 55504 Amherst County Public Schools - - - - - 5 7 10 8 30 55505 Appomattox County Public Schools - - - - - 1 2 3 - 6 55506 Arlington County Public Schools - - - 75 75 37 61 84 - 182 55507 Augusta County Public Schools - - - - - 5 8 11 7 31 55508 Bath County Public Schools - - - - - 1 2 3 - 6 55509 Bedford County Public Schools - - - - - 9 17 23 9 58 55510 Bland County Public Schools - - - - - 1 1 2 - 4 55511 Botetourt County Public Schools - - - 5 5 4 8 10 - 22 55512 Norfolk Public Schools - - - 3 3 31 52 71 - 154 55513 Petersburg City Public Schools - - - - - 5 7 10 7 29 55514 Buckingham County Public Schools - - - - - 1 3 4 - 8
Deferred Outflows of Resources Deferred Inflows of Resources

Page 67 of 87
Virginia Retirement System VRS Group Life Insurance Plan
Schedule of Deferred Outflows and Deferred Inflows of Resources by Employer – Page 16 of 23 As of June 30, 2017
(Dollars in Thousands)
Net Net Difference Difference Between Between Projected Projected
Differences and Actual Total Differences and Actual TotalBetween Investment Deferred Between Investment DeferredExpected Earnings on Changes in Outflows Expected Earnings on Changes in Inflows
Employer and Actual OPEB Plan Change of Proportionate of and Actual OPEB Plan Change of Proportionate ofCode Employer Experience Investments Assumptions Share Resources Experience Investments Assumptions Share Resources55515 Radford City Public Schools - - - - - 1 1 1 - 3 55516 Caroline County Public Schools - - - 6 6 3 4 6 - 13 55517 Carroll County Public Schools - - - - - 4 6 9 35 54 55518 Charles City County Public Schools - - - - - - 1 1 - 2 55519 Charlotte County Public Schools - - - 4 4 1 2 3 - 6 55520 Chesterfield County Public Schools - - - - - 29 48 66 395 538 55521 Clarke County Public Schools - - - - - 1 2 3 - 6 55522 Winchester City Public Schools - - - 5 5 4 7 9 - 20 55523 Culpeper County Public Schools - - - 19 19 7 14 19 - 40 55524 Cumberland County Public Schools - - - - - 1 2 3 - 6 55525 Dickenson County Public Schools - - - - - 3 4 5 10 22 55526 Dinwiddie County Public Schools - - - - - 2 6 8 16 32 55528 Essex County Public Schools - - - - - 1 2 3 - 6 55530 Covington City Public Schools - - - - - 1 1 2 - 4 55531 Floyd County Public Schools - - - - - 3 5 6 - 14 55532 Fluvanna County Public Schools - - - - - 4 7 10 5 26 55533 Chesapeake City Public Schools - - - - - 39 67 92 19 217 55534 Virginia Beach City Public Schools - - - - - 81 136 186 46 449 55535 Giles County Public Schools - - - - - - 1 2 - 3 55536 Gloucester County Public Schools - - - - - 6 9 13 45 73 55537 Goochland County Public Schools - - - - - 1 2 3 8 14 55538 Grayson County Public Schools - - - - - 3 3 4 - 10 55539 Greene County Public Schools - - - - - 4 5 7 - 16 55540 Greensville County Public Schools - - - - - 1 3 4 - 8 55541 Halifax County Public Schools - - - - - 4 5 7 12 28 55542 Hanover County Public Schools - - - - - 9 16 22 57 104 55543 Henrico County Public Schools - - - - - 1 2 3 - 6 55544 Henry County Public Schools - - - 13 13 5 11 15 - 31 55545 Highland County Public Schools - - - - - - 1 1 - 2 55546 Isle of Wight County Public Schools - - - - - 3 5 7 3 18 55548 King George County Public Schools - - - 25 25 4 8 11 - 23
Deferred Outflows of Resources Deferred Inflows of Resources

Page 68 of 87
Virginia Retirement System VRS Group Life Insurance Plan
Schedule of Deferred Outflows and Deferred Inflows of Resources by Employer – Page 17 of 23 As of June 30, 2017
(Dollars in Thousands)
Net Net Difference Difference Between Between Projected Projected
Differences and Actual Total Differences and Actual TotalBetween Investment Deferred Between Investment DeferredExpected Earnings on Changes in Outflows Expected Earnings on Changes in Inflows
Employer and Actual OPEB Plan Change of Proportionate of and Actual OPEB Plan Change of Proportionate ofCode Employer Experience Investments Assumptions Share Resources Experience Investments Assumptions Share Resources55549 King and Queen County Public Schools - - - - - 1 2 3 - 6 55550 King William County Public Schools - - - - - 2 4 6 5 17 55551 Lancaster County Public Schools - - - - - 1 3 4 - 8 55552 Lee County Public Schools - - - 4 4 4 6 8 - 18 55553 Loudoun County Public Schools - - - - - 97 165 226 48 536 55554 Louisa County Public Schools - - - - - 7 12 16 - 35 55555 Lunenburg County Public Schools - - - - - 1 2 3 - 6 55556 Madison County Public Schools - - - - - 2 2 3 - 7 55557 Mathews County Public Schools - - - - - 2 2 3 - 7 55558 Mecklenburg County Public Schools - - - 22 22 2 3 5 - 10 55559 Middlesex County Public Schools - - - - - 1 1 2 - 4 55560 Montgomery County Public Schools - - - - - 10 18 25 - 53 55562 Nelson County Public Schools - - - - - 2 5 7 - 14 55563 New Kent County Public Schools - - - - - 2 4 5 - 11 55565 Northampton County Public Schools - - - - - 2 3 4 - 9 55566 Northumberland County Public Schools - - - - - 1 2 3 - 6 55567 Nottoway County Public Schools - - - - - 2 3 4 - 9 55568 Orange County Public Schools - - - - - 6 9 13 8 36 55569 Page County Public Schools - - - - - 3 6 8 7 24 55570 Patrick County Public Schools - - - - - 4 5 7 - 16 55571 Pittsylvania County Public Schools - - - - - 5 9 12 - 26 55572 Powhatan County Public Schools - - - - - 4 5 7 4 20 55573 Prince Edward County Public Schools - - - - - 1 2 2 3 8 55574 Prince George County Public Schools - - - - - 7 12 17 3 39 55576 Prince William County Public Schools - - - 65 65 102 174 238 - 514 55577 Pulaski County Public Schools - - - - - 4 7 9 14 34 55578 Rappahannock County Public Schools - - - - - 1 2 3 - 6 55579 Richmond County Public Schools - - - - - 1 - - - 1 55580 Roanoke County Public Schools - - - - - 6 9 13 8 36 55581 Rockbridge County Public Schools - - - - - 2 4 6 10 22 55582 Rockingham County Public Schools - - - - - 14 25 34 17 90
Deferred Outflows of Resources Deferred Inflows of Resources

Page 69 of 87
Virginia Retirement System VRS Group Life Insurance Plan
Schedule of Deferred Outflows and Deferred Inflows of Resources by Employer – Page 18 of 23 As of June 30, 2017
(Dollars in Thousands)
Net Net Difference Difference Between Between Projected Projected
Differences and Actual Total Differences and Actual TotalBetween Investment Deferred Between Investment DeferredExpected Earnings on Changes in Outflows Expected Earnings on Changes in Inflows
Employer and Actual OPEB Plan Change of Proportionate of and Actual OPEB Plan Change of Proportionate ofCode Employer Experience Investments Assumptions Share Resources Experience Investments Assumptions Share Resources55583 Russell County Public Schools - - - - - 5 8 11 5 29 55584 Scott County Public Schools - - - - - 4 7 9 - 20 55585 Shenandoah County Public Schools - - - - - 6 11 16 12 45 55586 Smyth County Public Schools - - - - - 4 7 9 5 25 55587 Southampton County Public Schools - - - 5 5 1 3 4 - 8 55588 Spotsylvania County Public Schools - - - - - 17 28 39 10 94 55589 Stafford County Public Schools - - - - - 15 26 36 - 77 55590 Surry County Public Schools - - - - - 2 3 4 - 9 55591 Sussex County School Board - - - - - 1 3 4 11 19 55592 Tazewell County Public Schools - - - - - 8 12 16 12 48 55593 Warren County Public Schools - - - - - 4 6 8 - 18 55595 Washington County Public Schools - - - - - 6 8 11 - 25 55596 Westmoreland County Public Schools - - - - - 2 2 3 - 7 55597 Wise County Public Schools - - - - - 2 5 7 8 22 55598 Wythe County Public Schools - - - 5 5 2 4 6 - 12 55599 York County Public Schools - - - - - 12 20 27 15 74 55600 Accomack County Public Schools - - - - - 6 9 12 - 27 55601 Bristol VA Public Schools - - - 3 3 1 1 2 - 4 55602 Buena Vista City Public Schools - - - - - 1 1 1 - 3 55603 Amelia County Public Schools - - - - - 1 3 4 4 12 55605 Danville City Public Schools - - - - - 4 5 7 5 21 55606 Franklin City Public Schools - - - - - 1 1 2 - 4 55608 Harrisonburg City Public Schools - - - - - 4 6 8 3 21 55609 Hopewell City Public Schools - - - - - 3 6 8 - 17 55610 Lynchburg City Public Schools - - - - - 6 12 16 13 47 55611 Fauquier County Public Schools - - - 15 15 14 23 31 - 68 55612 Brunswick County Public Schools - - - - - 2 3 5 - 10 55613 PD Pruden Vocational-Technical Center - - - - - 1 - - - 1 55614 Portsmouth City Public Schools - - - - - 14 24 33 22 93 55615 Campbell County Public Schools - - - - - 6 9 13 - 28 55616 Richmond Public Schools - - - - - 18 31 42 46 137
Deferred Outflows of Resources Deferred Inflows of Resources

Page 70 of 87
Virginia Retirement System VRS Group Life Insurance Plan
Schedule of Deferred Outflows and Deferred Inflows of Resources by Employer – Page 19 of 23 As of June 30, 2017
(Dollars in Thousands)
Net Net Difference Difference Between Between Projected Projected
Differences and Actual Total Differences and Actual TotalBetween Investment Deferred Between Investment DeferredExpected Earnings on Changes in Outflows Expected Earnings on Changes in Inflows
Employer and Actual OPEB Plan Change of Proportionate of and Actual OPEB Plan Change of Proportionate ofCode Employer Experience Investments Assumptions Share Resources Experience Investments Assumptions Share Resources55617 Roanoke City Schools - - - 5 5 6 10 13 - 29 55619 Staunton City Public Schools - - - - - 3 3 4 - 10 55620 Suffolk City Public Schools - - - 6 6 12 20 28 - 60 55622 Craig County Public Schools - - - - - 1 1 1 - 3 55623 Martinsville City Public Schools - - - - - 1 1 2 - 4 55624 Appomattox Regional Governor's School - - - - - 1 - - - 1 55625 Colonial Heights City Public Schools - - - 6 6 2 4 5 - 11 55632 Manassas City Public Schools - - - - - 6 11 15 39 71 55633 Franklin County Public Schools - - - 7 7 11 16 22 - 49 55634 Frederick County Public Schools - - - - - 16 26 36 - 78 55635 Salem City Public Schools - - - 3 3 3 4 5 - 12 55636 Manassas Park City Public Schools - - - - - 3 4 5 3 15 55637 Newport News Public Schools - - - 88 88 15 24 33 - 72 55708 Waynesboro City Public Schools - - - 3 3 2 2 3 - 7 55710 Valley Vocational-Technical Center - - - - - 1 - - - 1 55711 New Horizons Regional Education Center - - - - - - 1 1 - 2 55713 Galax City Public Schools - - - - - - 2 2 - 4 55714 Norton City Public Schools - - - - - - 1 1 - 2 55802 Williamsburg-James City County Public Schools - - - - - 9 17 23 4 53 55803 Poquoson City Public Schools - - - - - 1 2 2 - 5 55806 Fredericksburg City Public Schools - - - - - 3 4 5 - 12 55807 Hampton City Public Schools - - - - - 7 12 16 18 53 55813 Buchanan County Public Schools - - - - - 4 7 9 17 37 55814 Jackson River Technical Center - - - - - 1 - - - 1 55815 Northern Neck Regional Vocational Center - - - - - - - - - - 55862 Crater Criminal Justice Training Academy - - - 7 7 1 - - - 1 55863 Central Shenandoah Criminal Justice Training Academy - - - 14 14 - 1 1 - 2 55864 New River Valley Emergency Comm Regional Authority - - - 121 121 3 5 6 - 14 55865 Maury Service Authority - - - 50 50 1 2 3 - 6 55866 Hampton Roads Transportation Accountability Commission - - - 13 13 - 1 1 - 2 55867 Pamunkey Regional Library - - - 6 6 3 3 4 - 10
Deferred Outflows of Resources Deferred Inflows of Resources

Page 71 of 87
Virginia Retirement System VRS Group Life Insurance Plan
Schedule of Deferred Outflows and Deferred Inflows of Resources by Employer – Page 20 of 23 As of June 30, 2017
(Dollars in Thousands)
Net Net Difference Difference Between Between Projected Projected
Differences and Actual Total Differences and Actual TotalBetween Investment Deferred Between Investment DeferredExpected Earnings on Changes in Outflows Expected Earnings on Changes in Inflows
Employer and Actual OPEB Plan Change of Proportionate of and Actual OPEB Plan Change of Proportionate ofCode Employer Experience Investments Assumptions Share Resources Experience Investments Assumptions Share Resources55868 Northern Virginia Transportation Authority - - - 17 17 1 3 4 - 8 55869 RSW Regional Jail Authority - - - - - 9 13 18 41 81 55870 Bedford Regional Water Authority - - - 10 10 5 8 11 - 24 55871 Portsmouth Redevelopment and Housing Authority - - - - - 6 11 15 19 51 55872 Southwest Regional Recreation Authority - - - 3 3 - 1 1 - 2 55874 Meherrin Regional Jail Authority - - - - - 9 15 21 36 81 55875 Woodway Water Authority - - - - - - 1 1 - 2 55876 Bristol Virginia Utilities Authority (BVU) - - - - - 13 23 32 40 108 55878 Mount Rogers Community Services Board - - - 83 83 39 65 89 - 193 55879 Lonesome Pine Soil & Water Conservation District - - - - - - - - - - 55881 Virginia's Region 2000 Local Government Council - - - - - 3 5 6 16 30 55882 Middle Peninsula Planning District Commission - - - - - - 1 1 3 5 55883 Western Virginia Regional Jail Authority - - - - - 14 24 33 7 78 55884 Halifax Service Authority - - - - - 2 4 5 - 11 55886 Russell County Public Service Authority - - - - - 1 1 2 - 4 55887 Piedmont Community Services Board - - - - - 18 30 41 8 97 55888 Blue Ridge Behavioral Health Care - - - 8 8 23 41 56 - 120 55890 Middle River Regional Jail Authority - - - 24 24 11 20 27 - 58 55893 Eastern Shore Soil and Water Conservation District - - - - - - 1 1 - 2 55895 Town of Gordonsville - - - - - 1 2 3 5 11 55896 Virginia Resources Authority - - - - - 2 4 6 - 12 55897 Prince William County Services Authority - - - 43 43 41 68 93 - 202 55898 Western Virginia Water Authority - - - 43 43 18 30 41 - 89 55899 Shenandoah Valley Regional Airport Commission - - - - - 1 2 3 - 6 55900 Alleghany Highlands Community Services Board - - - - - 5 9 12 6 32 55901 Brunswick Industrial Development Authority - - - - - - - 1 - 1 55904 Highlands Juvenile Detention Center Commission - - - - - 3 6 8 5 22 55905 Goochland-Powhatan Community Services Board - - - 8 8 4 7 10 - 21 55906 Suffolk Redevelopment and Housing Authority - - - - - 2 3 5 13 23 55908 Lee County Redevelopment and Housing Authority - - - - - 1 1 1 - 3 55909 Henry County Public Service Authority - - - - - 4 7 10 - 21
Deferred Outflows of Resources Deferred Inflows of Resources

Page 72 of 87
Virginia Retirement System VRS Group Life Insurance Plan
Schedule of Deferred Outflows and Deferred Inflows of Resources by Employer – Page 21 of 23 As of June 30, 2017
(Dollars in Thousands)
Net Net Difference Difference Between Between Projected Projected
Differences and Actual Total Differences and Actual TotalBetween Investment Deferred Between Investment DeferredExpected Earnings on Changes in Outflows Expected Earnings on Changes in Inflows
Employer and Actual OPEB Plan Change of Proportionate of and Actual OPEB Plan Change of Proportionate ofCode Employer Experience Investments Assumptions Share Resources Experience Investments Assumptions Share Resources55910 Southside Planning District Commission - - - - - 1 1 2 - 4 55911 Industrial Development Authority - - - 5 5 2 2 3 - 7 55912 Augusta County Service Authority - - - 11 11 9 16 22 - 47 55914 Rappahannock Juvenile Detention Commission - - - 4 4 6 10 14 - 30 55915 Cumberland Plateau Regional Housing Authority - - - - - 1 2 2 - 5 55918 Amherst County Service Authority - - - 5 5 2 3 4 - 9 55919 Pepper's Ferry Regional Wastewater Treatment Authority - - - - - 2 3 5 7 17 55920 Rappahannock Regional Jail Authority - - - - - 25 44 60 53 182 55921 Thomas Jefferson Planning District Commission - - - - - 1 2 2 - 5 55922 Piedmont Regional Jail - - - 11 11 8 14 19 - 41 55923 Nelson County Services Authority - - - - - 1 3 4 - 8 55924 Coeburn-Norton-Wise Regional Water - - - - - 1 2 2 - 5 55925 Fauquier County Water & Sanitation Authority - - - 13 13 6 9 12 - 27 55926 Scott County Soil & Water Conservation District - - - - - - - 1 - 1 55927 New River Resource Authority - - - - - 2 3 4 - 9 55928 Scott County Water & Sewage Authority - - - - - 1 3 4 - 8 55929 Greensville County Water & Sewer Authority - - - - - 2 4 5 - 11 55930 Petersburg Redevelopment & Housing Authority - - - - - 1 4 5 5 15 55931 Central Rappahannock Regional Library - - - - - 8 12 17 11 48 55932 Virginia Coalfield Economic Development Authority - - - - - 1 1 1 - 3 55933 Central Virginia Regional Jail - - - 69 69 11 18 24 - 53 55934 Thomas Jefferson Soil & Water Conservation District - - - - - 1 1 2 - 4 55937 Wythe-Grayson Regional Library - - - 4 4 - 1 1 - 2 55938 Colonial Soil & Water Conservation District - - - 6 6 (1) 1 1 - 1 55939 Rivanna Solid Waste Authority - - - - - 1 1 2 - 4 55940 Monacan Soil & Water Conservation District - - - - - - - 1 - 1 55942 Virginia Soil & Water Conservation - - - - - - - 1 - 1 55944 Central Virginia Waste Management Authority - - - - - 1 2 2 - 5 55945 Lonesome Pine Regional Library - - - - - 1 3 4 4 12 55946 Virginia Peninsulas Public Service Authority - - - - - 3 5 6 - 14 55947 Tidewater Regional Group Home Commission - - - 6 6 5 7 10 - 22
Deferred Outflows of Resources Deferred Inflows of Resources

Page 73 of 87
Virginia Retirement System VRS Group Life Insurance Plan
Schedule of Deferred Outflows and Deferred Inflows of Resources by Employer – Page 22 of 23 As of June 30, 2017
(Dollars in Thousands)
Net Net Difference Difference Between Between Projected Projected
Differences and Actual Total Differences and Actual TotalBetween Investment Deferred Between Investment DeferredExpected Earnings on Changes in Outflows Expected Earnings on Changes in Inflows
Employer and Actual OPEB Plan Change of Proportionate of and Actual OPEB Plan Change of Proportionate ofCode Employer Experience Investments Assumptions Share Resources Experience Investments Assumptions Share Resources55948 Virginia Highlands Airport Commission - - - - - - 1 1 - 2 55949 Western Tidewater Regional Jail - - - 4 4 13 22 29 - 64 55950 Scott County Redevelopment & Housing Authority - - - - - 1 1 1 6 9 55951 Handley Regional Library - - - - - 1 2 3 - 6 55952 Northern Neck Regional Jail - - - - - 6 10 14 4 34 55953 Montgomery Regional Solid Waste Authority - - - - - 1 2 3 - 6 55954 Potomac & Rappahannock Transportation Comm - - - 51 51 16 26 36 - 78 55955 Giles County Public Service Authority - - - - - 1 1 2 11 15 55956 South Central Wastewater Authority - - - - - 3 5 7 - 15 55957 Wise County Redevelopment and Housing Authority - - - - - 1 2 3 - 6 55958 Prince William Soil & Water Conservation District - - - - - - 1 1 - 2 55959 Hampton Roads Regional Jail Authority - - - - - 21 36 50 28 135 55960 Russell County Water & Sewage Authority - - - 3 3 1 1 1 - 3 55961 Pamunkey Regional Jail - - - - - 10 17 24 20 71 55962 Charlottesville - Albemarle Airport Authority - - - - - 4 5 7 - 16 55963 Virginia Peninsula Regional Jail - - - - - 9 15 21 14 59 55964 Virginia Biotechnology Research Park Authority - - - 3 3 1 2 2 - 5 55965 Peumansend Creek Regional Jail - - - - - 7 11 16 84 118 55966 Blue Ridge Regional Jail Authority - - - - - 27 45 61 60 193 55967 Rockingham Regional Library - - - 5 5 1 2 3 - 6 55968 Albemarle-Charlottesville Regional Jail - - - 10 10 13 23 32 - 68 55969 Culpeper Soil & Water Conservation District - - - 7 7 1 2 2 - 5 55970 New River Valley Regional Jail - - - - - 15 27 37 12 91 55971 Sussex Service Authority - - - - - 1 3 4 - 8 55974 Peaks of Otter Soil & Water Conservation District - - - - - 1 - - - 1 55975 New River Soil & Water Conservation District - - - - - 1 - - - 1 55977 Southside Regional Jail - - - - - 3 6 8 5 22 55978 Evergreen Soil & Water Conservation District - - - - - 1 - - - 1 55979 Roanoke Higher Education Authority - - - - - 1 3 4 - 8 55981 John Marshall Soil & Water Conservation District - - - - - 1 1 1 - 3 55982 Daniel Boone Soil & Water Conservation District - - - - - - - 1 - 1
Deferred Outflows of Resources Deferred Inflows of Resources

Page 74 of 87
Virginia Retirement System VRS Group Life Insurance Plan
Schedule of Deferred Outflows and Deferred Inflows of Resources by Employer – Page 23 of 23 As of June 30, 2017
(Dollars in Thousands)
Net Net Difference Difference Between Between Projected Projected
Differences and Actual Total Differences and Actual TotalBetween Investment Deferred Between Investment DeferredExpected Earnings on Changes in Outflows Expected Earnings on Changes in Inflows
Employer and Actual OPEB Plan Change of Proportionate of and Actual OPEB Plan Change of Proportionate ofCode Employer Experience Investments Assumptions Share Resources Experience Investments Assumptions Share Resources55983 Southside Community Services Board - - - 9 9 12 21 29 - 62 55984 Northern Shenandoah Valley Regional Commission - - - - - 1 2 2 - 5 55985 Tazewell Soil & Water Conservation District - - - - - 1 - - - 1 55988 Henricopolis Soil & Water Conservation District - - - - - - - 1 - 1 55989 Piedmont Regional Juvenile Detention Center - - - - - 1 2 2 - 5 55990 Roanoke River Service Authority - - - - - 1 1 1 - 3 55991 Lee County Public Service Authority - - - - - 1 2 2 - 5 55992 Blue Ridge Juvenile Detention Center - - - 3 3 3 6 8 - 17 55994 Wise County Public Service Authority - - - 3 3 2 3 4 - 9 55998 Southwest Virginia Regional Jail Authority - - - - - 27 46 63 56 192 55999 Clinch Valley Soil & Water Conservation District - - - - - 1 - - - 1 59212 City of Norfolk - Insurance Only Employees - - - - - 343 582 797 132 1,854 59214 City of Portsmouth - Insurance Only Employees - - - - - 6 9 12 86 113 59216 City of Richmond - Insurance Only Employees - - - - - 325 553 756 566 2,200 59217 City of Roanoke - Insurance Only Employees - - - - - 130 221 302 64 717 59617 Roanoke City Schools - Insurance Only Employees - - - - - 4 6 8 56 74
Sub-total Political Subdivisions -$ -$ -$ 4,870$ 4,870$ 8,927$ 15,136$ 20,715$ 4,671$ 49,449$ Total for VRS Group Life Insurance -$ -$ -$ 17,309$ 17,309$ 33,343$ 56,630$ 77,515$ 17,309$ 184,797$
Deferred Outflows of Resources Deferred Inflows of Resources
The accompanying notes are an integral part of the Schedule of Deferred Outflows and Deferred Inflows of Resources by Employer.
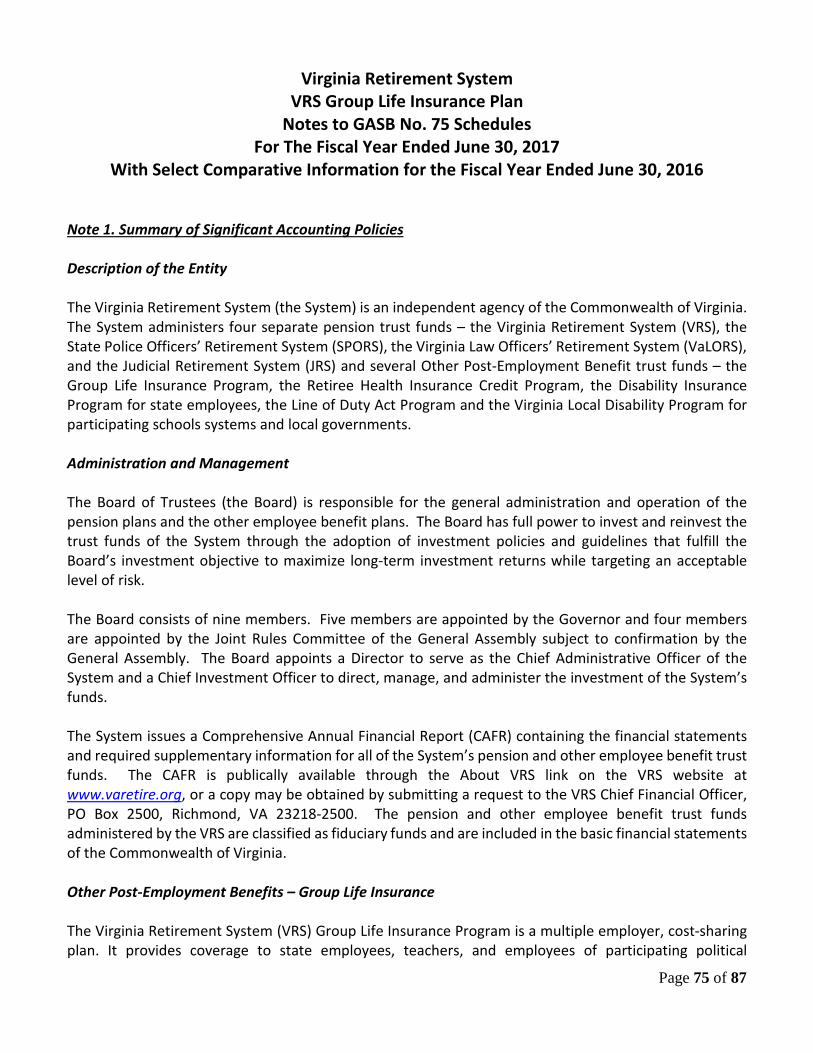
Page 75 of 87
Virginia Retirement System VRS Group Life Insurance Plan
Notes to GASB No. 75 Schedules For The Fiscal Year Ended June 30, 2017
With Select Comparative Information for the Fiscal Year Ended June 30, 2016 Note 1. Summary of Significant Accounting Policies Description of the Entity The Virginia Retirement System (the System) is an independent agency of the Commonwealth of Virginia. The System administers four separate pension trust funds – the Virginia Retirement System (VRS), the State Police Officers’ Retirement System (SPORS), the Virginia Law Officers’ Retirement System (VaLORS), and the Judicial Retirement System (JRS) and several Other Post-Employment Benefit trust funds – the Group Life Insurance Program, the Retiree Health Insurance Credit Program, the Disability Insurance Program for state employees, the Line of Duty Act Program and the Virginia Local Disability Program for participating schools systems and local governments. Administration and Management The Board of Trustees (the Board) is responsible for the general administration and operation of the pension plans and the other employee benefit plans. The Board has full power to invest and reinvest the trust funds of the System through the adoption of investment policies and guidelines that fulfill the Board’s investment objective to maximize long-term investment returns while targeting an acceptable level of risk. The Board consists of nine members. Five members are appointed by the Governor and four members are appointed by the Joint Rules Committee of the General Assembly subject to confirmation by the General Assembly. The Board appoints a Director to serve as the Chief Administrative Officer of the System and a Chief Investment Officer to direct, manage, and administer the investment of the System’s funds. The System issues a Comprehensive Annual Financial Report (CAFR) containing the financial statements and required supplementary information for all of the System’s pension and other employee benefit trust funds. The CAFR is publically available through the About VRS link on the VRS website at www.varetire.org, or a copy may be obtained by submitting a request to the VRS Chief Financial Officer, PO Box 2500, Richmond, VA 23218-2500. The pension and other employee benefit trust funds administered by the VRS are classified as fiduciary funds and are included in the basic financial statements of the Commonwealth of Virginia. Other Post-Employment Benefits – Group Life Insurance The Virginia Retirement System (VRS) Group Life Insurance Program is a multiple employer, cost-sharing plan. It provides coverage to state employees, teachers, and employees of participating political
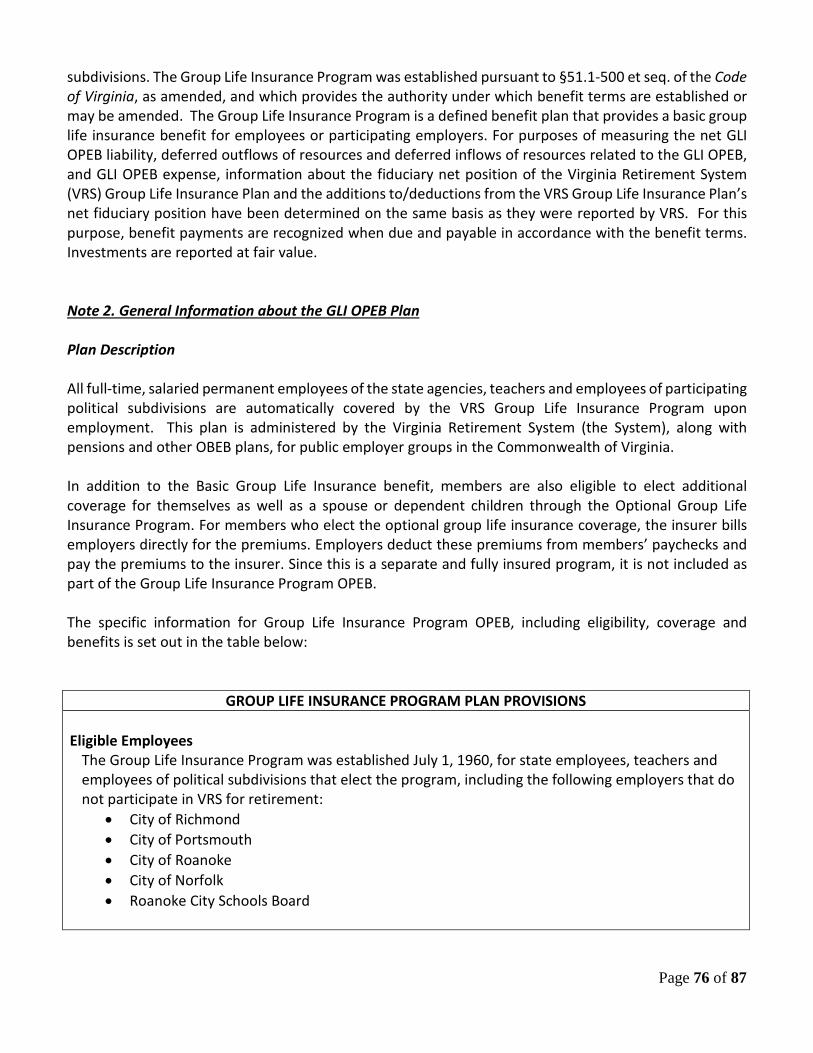
Page 76 of 87
subdivisions. The Group Life Insurance Program was established pursuant to §51.1-500 et seq. of the Code of Virginia, as amended, and which provides the authority under which benefit terms are established or may be amended. The Group Life Insurance Program is a defined benefit plan that provides a basic group life insurance benefit for employees or participating employers. For purposes of measuring the net GLI OPEB liability, deferred outflows of resources and deferred inflows of resources related to the GLI OPEB, and GLI OPEB expense, information about the fiduciary net position of the Virginia Retirement System (VRS) Group Life Insurance Plan and the additions to/deductions from the VRS Group Life Insurance Plan’s net fiduciary position have been determined on the same basis as they were reported by VRS. For this purpose, benefit payments are recognized when due and payable in accordance with the benefit terms. Investments are reported at fair value. Note 2. General Information about the GLI OPEB Plan Plan Description All full-time, salaried permanent employees of the state agencies, teachers and employees of participating political subdivisions are automatically covered by the VRS Group Life Insurance Program upon employment. This plan is administered by the Virginia Retirement System (the System), along with pensions and other OBEB plans, for public employer groups in the Commonwealth of Virginia. In addition to the Basic Group Life Insurance benefit, members are also eligible to elect additional coverage for themselves as well as a spouse or dependent children through the Optional Group Life Insurance Program. For members who elect the optional group life insurance coverage, the insurer bills employers directly for the premiums. Employers deduct these premiums from members’ paychecks and pay the premiums to the insurer. Since this is a separate and fully insured program, it is not included as part of the Group Life Insurance Program OPEB. The specific information for Group Life Insurance Program OPEB, including eligibility, coverage and benefits is set out in the table below:
GROUP LIFE INSURANCE PROGRAM PLAN PROVISIONS Eligible Employees
The Group Life Insurance Program was established July 1, 1960, for state employees, teachers and employees of political subdivisions that elect the program, including the following employers that do not participate in VRS for retirement:
• City of Richmond • City of Portsmouth • City of Roanoke • City of Norfolk • Roanoke City Schools Board

Page 77 of 87
Basic group life insurance coverage is automatic upon employment. Coverage end for employees who leave their position before retirement eligibility or who take a refund of their member contributions and accrued interest.
Benefit Amounts The benefits payable under the Group Life Insurance Program have several components.
• Natural Death Benefit – The natural death benefit is equal to the employee’s covered compensation rounded to the next highest thousand and then doubled.
• Accidental Death Benefit – The accidental death benefit is double the natural death benefit. • Other Benefit Provisions – In addition to the basic natural and accidental death benefits, the
program provides additional benefits provided under specific circumstances. These include: o Accidental dismemberment benefit o Safety belt benefit o Repatriation benefit o Felonious assault benefit o Accelerated death benefit option
Reduction in benefit Amounts The benefit amounts provided to members covered under the Group Life Insurance Program are subject to a reduction factor. The benefit amount reduces by 25% on January 1 following one calendar year of separation. The benefit amount reduces by an additional 25% on each subsequent January 1 until it reaches 25% of its original value. Minimum Benefit Amount and Cost-of-Living Adjustment (COLA) For covered members with at least 30 years of creditable service, there is a minimum benefit payable under the Group Life Insurance Program. The minimum benefit was set at $8,000 by statute. This amount is increased annually based on the VRS Plan 2 cost-of-living adjustment and is currently $8,111. Contributions The contribution requirements for the Group Life Insurance Program are governed by §51.1-506 and §51.1-508 of the Code of Virginia, as amended, but may be impacted as a result of funding provided to state agencies and school divisions by the Virginia General Assembly. The total rate for the Group Life Insurance Program was 1.31% of covered employee compensation. This was allocated into an employee and an employer component using a 60/40 split. The employee component was 0.79% (1.31% X 60%) and the employer component was 0.52% (1.31% X 40%). Employers may elect to pay all or part of the employee contribution, however the employer must pay all of the employer contribution. Each employer’s contractually required employer contribution rate for the year ended June 30, 2018 was 0.52% of covered employee compensation. This rate was based on an actuarially determined rate from an actuarial valuation as of June 30, 2015. The actuarially determined rate, when combined with employee

Page 78 of 87
contributions, was expected to finance the costs of benefits payable during the year, with an additional amount to finance any unfunded accrued liability. Actuarial Assumptions The total GLI OPEB liability was based on an actuarial valuation as of June 30, 2016, using the Entry Age Normal actuarial cost method and the following assumptions, applied to all periods included in the measurement and rolled forward to the measurement date of June 30, 2017.
Inflation 2.5 percent
Salary increases, including inflation – General state employees 3.5 percent – 5.35 percent
Teachers 3.5 percent – 5.95 percent SPORS employees 3.5 percent – 4.75 percent VaLORS employees 3.5 percent – 4.75 percent JRS employees 4.5 percent Locality – General employees 3.5 percent – 5.35 percent
Locality – Hazardous Duty employees 3.5 percent – 4.75 percent Investment rate of return 7.0 Percent, net of plan investment expenses, including inflation*
* Administrative expenses as a percent of the market value of assets for the last experience study were found to be approximately 0.06% of the market assets for all of the VRS plans. This would provide an assumed investment return rate for GASB purposes of slightly more than the assumed 7.0%. However, since the difference was minimal, and a more conservative 7.0% investment return assumption provided a projected plan net position that exceeded the projected benefit payments, the long-term expected rate of return on investments was assumed to be 7.0% to simplify preparation of the liabilities.
Mortality rates – General State Employees
Pre-Retirement: RP-2014 Employee Rates to age 80, Healthy Annuitant Rates to 81 and older projected with Scale
BB to 2020; males set back 1 year, 85% of rates; females set back 1 year. Post-Retirement:
RP-2014 Employee Rates to age 49, Healthy Annuitant Rates at ages 50 and older projected with Scale BB to 2020; males set forward 1 year; females set back 1 year with 1.5% increase compounded from ages 70 to 85.
Post-Disablement:
RP-2014 Disability Life Mortality Table projected with scale BB to 2020; males 115% of rates; females 130% of rates.
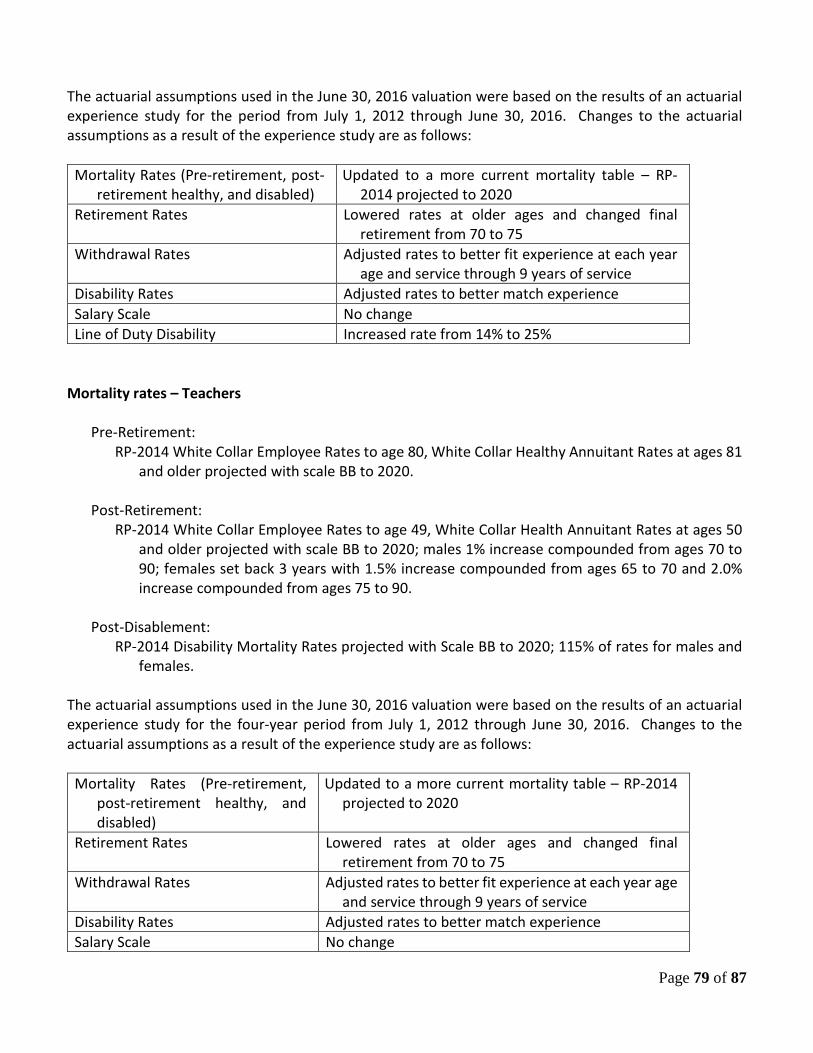
Page 79 of 87
The actuarial assumptions used in the June 30, 2016 valuation were based on the results of an actuarial experience study for the period from July 1, 2012 through June 30, 2016. Changes to the actuarial assumptions as a result of the experience study are as follows:
Mortality Rates (Pre-retirement, post-retirement healthy, and disabled)
Updated to a more current mortality table – RP-2014 projected to 2020
Retirement Rates Lowered rates at older ages and changed final retirement from 70 to 75
Withdrawal Rates Adjusted rates to better fit experience at each year age and service through 9 years of service
Disability Rates Adjusted rates to better match experience Salary Scale No change Line of Duty Disability Increased rate from 14% to 25%
Mortality rates – Teachers
Pre-Retirement:
RP-2014 White Collar Employee Rates to age 80, White Collar Healthy Annuitant Rates at ages 81 and older projected with scale BB to 2020.
Post-Retirement:
RP-2014 White Collar Employee Rates to age 49, White Collar Health Annuitant Rates at ages 50 and older projected with scale BB to 2020; males 1% increase compounded from ages 70 to 90; females set back 3 years with 1.5% increase compounded from ages 65 to 70 and 2.0% increase compounded from ages 75 to 90.
Post-Disablement:
RP-2014 Disability Mortality Rates projected with Scale BB to 2020; 115% of rates for males and females.
The actuarial assumptions used in the June 30, 2016 valuation were based on the results of an actuarial experience study for the four-year period from July 1, 2012 through June 30, 2016. Changes to the actuarial assumptions as a result of the experience study are as follows:
Mortality Rates (Pre-retirement, post-retirement healthy, and disabled)
Updated to a more current mortality table – RP-2014 projected to 2020
Retirement Rates Lowered rates at older ages and changed final retirement from 70 to 75
Withdrawal Rates Adjusted rates to better fit experience at each year age and service through 9 years of service
Disability Rates Adjusted rates to better match experience Salary Scale No change

Page 80 of 87
Mortality rates – SPORS Employees Pre-Retirement:
RP-2014 Employee Rates to age 80, Healthy Annuitant Rates to 81 and older projected with Scale BB to 2020; males 90% of rates; females set forward 1 year.
Post-Retirement:
RP-2014 Employee Rates to age 49, Healthy Annuitant Rates at ages 50 and older projected with Scale BB to 2020; males set forward 1 year with 1.0% increase compounded from ages 70 to 90; females set forward 3 years.
Post-Disablement:
RP-2014 Disability Life Mortality Table projected with scale BB to 2020; males set forward 2 years; unisex using 100% male.
The actuarial assumptions used in the June 30, 2016 valuation were based on the results of an actuarial experience study for the period from July 1, 2012 through June 30, 2016. Changes to the actuarial assumptions as a result of the experience study are as follows:
Mortality Rates (Pre-retirement, post-retirement healthy, and disabled)
Updated to a more current mortality table – RP-2014 projected to 2020 and reduced margin for future improvement in accordance with experience
Retirement Rates Increased age 50 rates and lowered rates at older ages
Withdrawal Rates Adjusted rates to better fit experience Disability Rates Adjusted rates to better match experience Salary Scale No change Line of Duty Disability Increased rate from 60% to 85%
Mortality rates – VaLORS Employees
Pre-Retirement:
RP-2014 Employee Rates to age 80, Healthy Annuitant Rates to 81 and older projected with Scale BB to 2020; males 90% of rates; females set forward 1 year.
Post-Retirement:
RP-2014 Employee Rates to age 49, Healthy Annuitant Rates at ages 50 and older projected with Scale BB to 2020; males set forward 1 year with 1.0% increase compounded from ages 70 to 90; females set forward 3 years.
Post-Disablement:
RP-2014 Disability Life Mortality Table projected with scale BB to 2020; males set forward 2 years; unisex using 100% male.
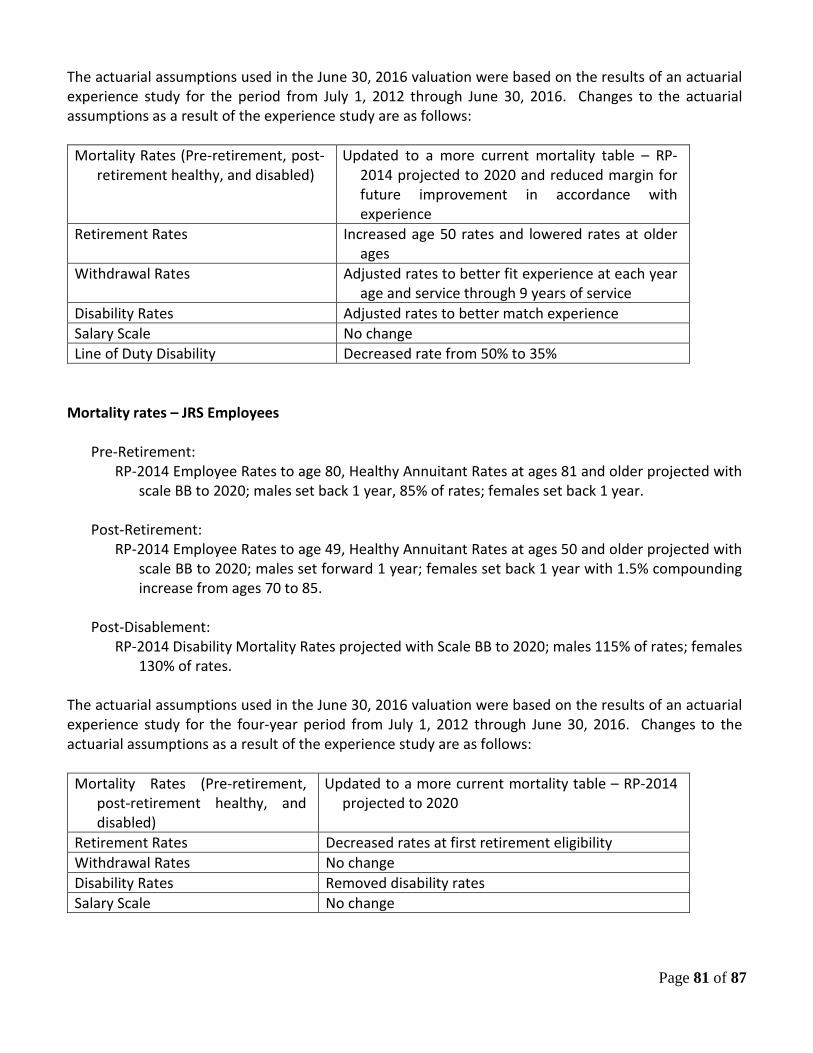
Page 81 of 87
The actuarial assumptions used in the June 30, 2016 valuation were based on the results of an actuarial experience study for the period from July 1, 2012 through June 30, 2016. Changes to the actuarial assumptions as a result of the experience study are as follows:
Mortality Rates (Pre-retirement, post-retirement healthy, and disabled)
Updated to a more current mortality table – RP-2014 projected to 2020 and reduced margin for future improvement in accordance with experience
Retirement Rates Increased age 50 rates and lowered rates at older ages
Withdrawal Rates Adjusted rates to better fit experience at each year age and service through 9 years of service
Disability Rates Adjusted rates to better match experience Salary Scale No change Line of Duty Disability Decreased rate from 50% to 35%
Mortality rates – JRS Employees
Pre-Retirement:
RP-2014 Employee Rates to age 80, Healthy Annuitant Rates at ages 81 and older projected with scale BB to 2020; males set back 1 year, 85% of rates; females set back 1 year.
Post-Retirement:
RP-2014 Employee Rates to age 49, Healthy Annuitant Rates at ages 50 and older projected with scale BB to 2020; males set forward 1 year; females set back 1 year with 1.5% compounding increase from ages 70 to 85.
Post-Disablement:
RP-2014 Disability Mortality Rates projected with Scale BB to 2020; males 115% of rates; females 130% of rates.
The actuarial assumptions used in the June 30, 2016 valuation were based on the results of an actuarial experience study for the four-year period from July 1, 2012 through June 30, 2016. Changes to the actuarial assumptions as a result of the experience study are as follows:
Mortality Rates (Pre-retirement, post-retirement healthy, and disabled)
Updated to a more current mortality table – RP-2014 projected to 2020
Retirement Rates Decreased rates at first retirement eligibility Withdrawal Rates No change Disability Rates Removed disability rates Salary Scale No change

Page 82 of 87
Mortality rates – Largest Ten Locality Employers - General Employees Pre-Retirement:
RP-2014 Employee Rates to age 80, Healthy Annuitant Rates to 81 and older projected with Scale BB to 2020; males 95% of rates; females 105% of rates.
Post-Retirement:
RP-2014 Employee Rates to age 49, Healthy Annuitant Rates at ages 50 and older projected with Scale BB to 2020; males set forward 3 years; females 1.0% increase compounded from ages 70 to 90.
Post-Disablement:
RP-2014 Disability Life Mortality Table projected with scale BB to 2020; males set forward 2 years, 110% of rates; females 125% of rates
The actuarial assumptions used in the June 30, 2016 valuation were based on the results of an actuarial experience study for the period from July 1, 2012 through June 30, 2016. Changes to the actuarial assumptions as a result of the experience study are as follows:
Mortality Rates (Pre-retirement, post-retirement healthy, and disabled)
Updated to a more current mortality table – RP-2014 projected to 2020
Retirement Rates Lowered retirement rates at older ages and extended final retirement age from 70 to 75
Withdrawal Rates Adjusted termination rates to better fit experience at each age and service year
Disability Rates Lowered disability rates Salary Scale No change Line of Duty Disability Increased rate from 14% to 20%
Mortality rates – Non-Largest Ten Locality Employers - General Employees
Pre-Retirement:
RP-2014 Employee Rates to age 80, Healthy Annuitant Rates to 81 and older projected with Scale BB to 2020; males 95% of rates; females 105% of rates.
Post-Retirement:
RP-2014 Employee Rates to age 49, Healthy Annuitant Rates at ages 50 and older projected with Scale BB to 2020; males set forward 3 years; females 1.0% increase compounded from ages 70 to 90.
Post-Disablement:
RP-2014 Disability Life Mortality Table projected with scale BB to 2020; males set forward 2 years, 110% of rates; females 125% of rates.
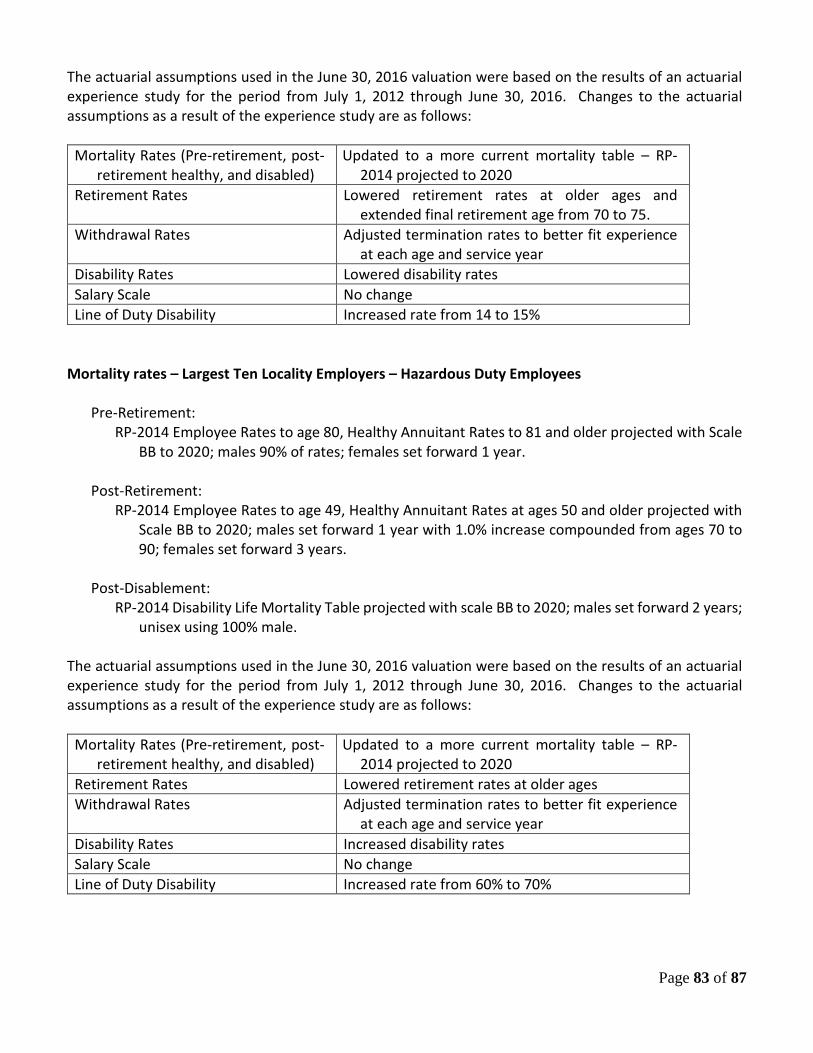
Page 83 of 87
The actuarial assumptions used in the June 30, 2016 valuation were based on the results of an actuarial experience study for the period from July 1, 2012 through June 30, 2016. Changes to the actuarial assumptions as a result of the experience study are as follows:
Mortality Rates (Pre-retirement, post-retirement healthy, and disabled)
Updated to a more current mortality table – RP-2014 projected to 2020
Retirement Rates Lowered retirement rates at older ages and extended final retirement age from 70 to 75.
Withdrawal Rates Adjusted termination rates to better fit experience at each age and service year
Disability Rates Lowered disability rates Salary Scale No change Line of Duty Disability Increased rate from 14 to 15%
Mortality rates – Largest Ten Locality Employers – Hazardous Duty Employees
Pre-Retirement:
RP-2014 Employee Rates to age 80, Healthy Annuitant Rates to 81 and older projected with Scale BB to 2020; males 90% of rates; females set forward 1 year.
Post-Retirement:
RP-2014 Employee Rates to age 49, Healthy Annuitant Rates at ages 50 and older projected with Scale BB to 2020; males set forward 1 year with 1.0% increase compounded from ages 70 to 90; females set forward 3 years.
Post-Disablement:
RP-2014 Disability Life Mortality Table projected with scale BB to 2020; males set forward 2 years; unisex using 100% male.
The actuarial assumptions used in the June 30, 2016 valuation were based on the results of an actuarial experience study for the period from July 1, 2012 through June 30, 2016. Changes to the actuarial assumptions as a result of the experience study are as follows:
Mortality Rates (Pre-retirement, post-retirement healthy, and disabled)
Updated to a more current mortality table – RP-2014 projected to 2020
Retirement Rates Lowered retirement rates at older ages Withdrawal Rates Adjusted termination rates to better fit experience
at each age and service year Disability Rates Increased disability rates Salary Scale No change Line of Duty Disability Increased rate from 60% to 70%
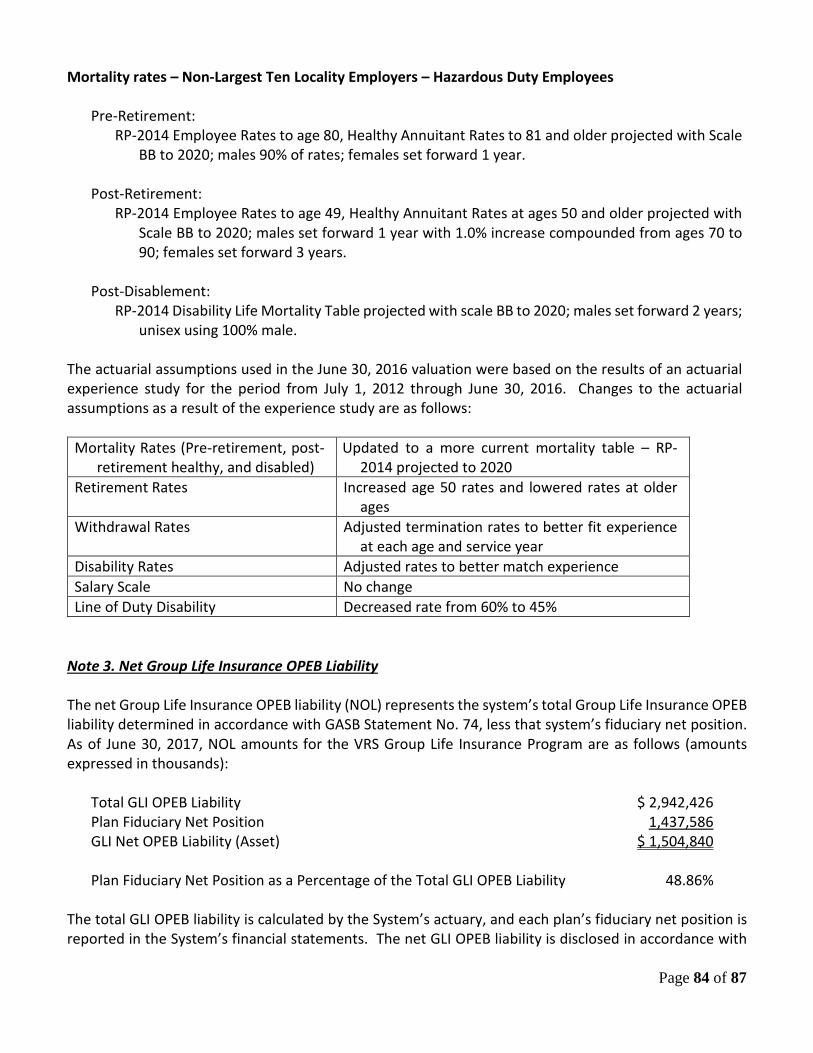
Page 84 of 87
Mortality rates – Non-Largest Ten Locality Employers – Hazardous Duty Employees Pre-Retirement:
RP-2014 Employee Rates to age 80, Healthy Annuitant Rates to 81 and older projected with Scale BB to 2020; males 90% of rates; females set forward 1 year.
Post-Retirement:
RP-2014 Employee Rates to age 49, Healthy Annuitant Rates at ages 50 and older projected with Scale BB to 2020; males set forward 1 year with 1.0% increase compounded from ages 70 to 90; females set forward 3 years.
Post-Disablement:
RP-2014 Disability Life Mortality Table projected with scale BB to 2020; males set forward 2 years; unisex using 100% male.
The actuarial assumptions used in the June 30, 2016 valuation were based on the results of an actuarial experience study for the period from July 1, 2012 through June 30, 2016. Changes to the actuarial assumptions as a result of the experience study are as follows:
Mortality Rates (Pre-retirement, post-retirement healthy, and disabled)
Updated to a more current mortality table – RP-2014 projected to 2020
Retirement Rates Increased age 50 rates and lowered rates at older ages
Withdrawal Rates Adjusted termination rates to better fit experience at each age and service year
Disability Rates Adjusted rates to better match experience Salary Scale No change Line of Duty Disability Decreased rate from 60% to 45%
Note 3. Net Group Life Insurance OPEB Liability The net Group Life Insurance OPEB liability (NOL) represents the system’s total Group Life Insurance OPEB liability determined in accordance with GASB Statement No. 74, less that system’s fiduciary net position. As of June 30, 2017, NOL amounts for the VRS Group Life Insurance Program are as follows (amounts expressed in thousands): Total GLI OPEB Liability $ 2,942,426 Plan Fiduciary Net Position 1,437,586 GLI Net OPEB Liability (Asset) $ 1,504,840 Plan Fiduciary Net Position as a Percentage of the Total GLI OPEB Liability 48.86% The total GLI OPEB liability is calculated by the System’s actuary, and each plan’s fiduciary net position is reported in the System’s financial statements. The net GLI OPEB liability is disclosed in accordance with

Page 85 of 87
the requirements of GASB Statement No. 74 in the System’s notes to the financial statements and required supplementary information. Discount Rate The discount rate used to measure the total GLI OPEB liability was 7.00%. The projection of cash flows used to determine the discount rate assumed that employer contributions will be made in accordance with the VRS funding policy and at rates equal to the actuarially determined contribution rates adopted by the VRS Board of Trustees. Through the fiscal year ending June 30, 2019, the rate contributed by the school division for the VRS GLI OPEB Plan will be subject to the portion of the VRS Board-certified rates that are funded by the Virginia General Assembly. From July 1, 2019 on, school divisions are assumed to contribute 100% of the actuarially determined contribution rates. Based on those assumptions, the GLI OPEB plan’s fiduciary net position was projected to be available to make all projected future benefit payments of current active and inactive employees. Therefore the long-term expected rate of return was applied to all periods of projected benefit payments to determine the total GLI OPEB liability. Long-Term Expected Rate of Return The long-term expected rate of return on VRS System investments was determined using a log-normal distribution analysis in which best-estimate ranges of expected future real rates of return (expected returns, net of VRS System investment expense and inflation) are developed for each major asset class. These ranges are combined to produce the long-term expected rate of return by weighting the expected future real rates of return by the target asset allocation percentage and by adding expected inflation. The target asset allocation and best estimate of arithmetic real rates of return for each major asset class are summarized in the following table:
WeightedArithmetic AverageLong-Term Long-Term
Target Expected ExpectedAsset Class (Strategy) Allocation Rate of Return Rate of Return
Public Equity 40.00% 4.54% 1.82%Fixed Income 15.00% 0.69% 0.10%Credit Strategies 15.00% 3.96% 0.59%Real Assets 15.00% 5.76% 0.86%Private Equity 15.00% 9.53% 1.43%
Total 100.00% 4.80%
Inflation 2.50%* Expected arithmetic nominal return 7.30%
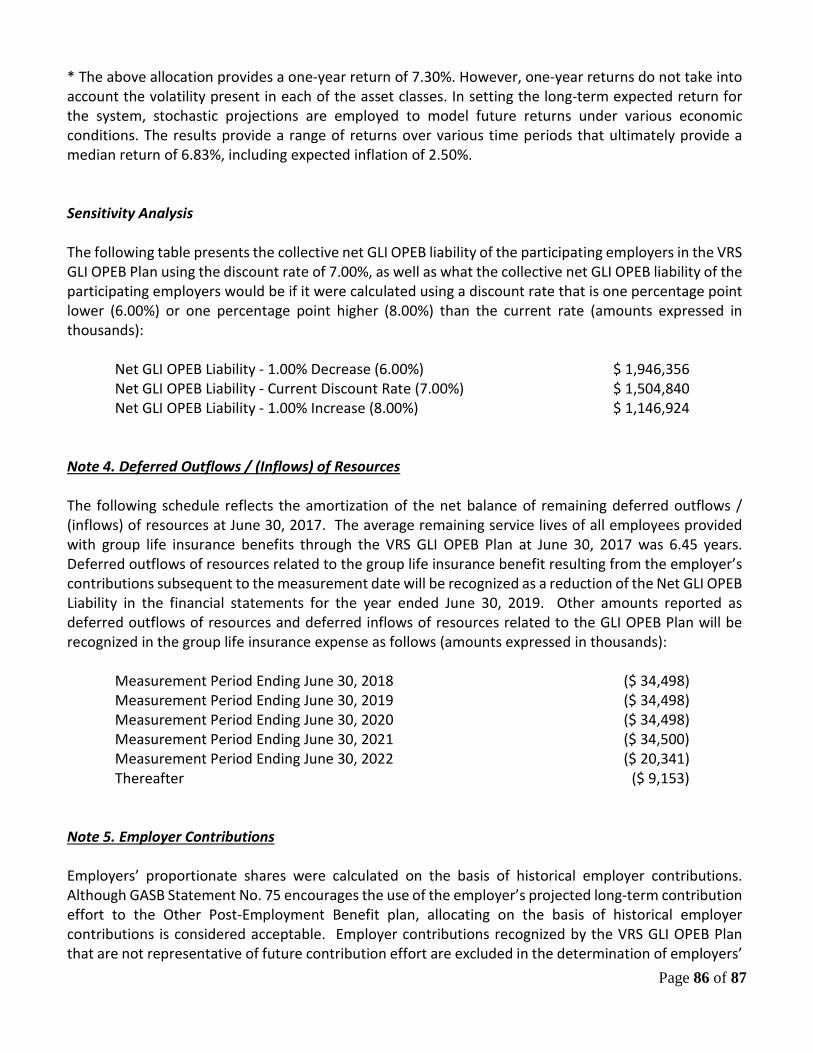
Page 86 of 87
* The above allocation provides a one-year return of 7.30%. However, one-year returns do not take into account the volatility present in each of the asset classes. In setting the long-term expected return for the system, stochastic projections are employed to model future returns under various economic conditions. The results provide a range of returns over various time periods that ultimately provide a median return of 6.83%, including expected inflation of 2.50%. Sensitivity Analysis The following table presents the collective net GLI OPEB liability of the participating employers in the VRS GLI OPEB Plan using the discount rate of 7.00%, as well as what the collective net GLI OPEB liability of the participating employers would be if it were calculated using a discount rate that is one percentage point lower (6.00%) or one percentage point higher (8.00%) than the current rate (amounts expressed in thousands): Net GLI OPEB Liability - 1.00% Decrease (6.00%) $ 1,946,356 Net GLI OPEB Liability - Current Discount Rate (7.00%) $ 1,504,840 Net GLI OPEB Liability - 1.00% Increase (8.00%) $ 1,146,924 Note 4. Deferred Outflows / (Inflows) of Resources The following schedule reflects the amortization of the net balance of remaining deferred outflows / (inflows) of resources at June 30, 2017. The average remaining service lives of all employees provided with group life insurance benefits through the VRS GLI OPEB Plan at June 30, 2017 was 6.45 years. Deferred outflows of resources related to the group life insurance benefit resulting from the employer’s contributions subsequent to the measurement date will be recognized as a reduction of the Net GLI OPEB Liability in the financial statements for the year ended June 30, 2019. Other amounts reported as deferred outflows of resources and deferred inflows of resources related to the GLI OPEB Plan will be recognized in the group life insurance expense as follows (amounts expressed in thousands): Measurement Period Ending June 30, 2018 ($ 34,498) Measurement Period Ending June 30, 2019 ($ 34,498) Measurement Period Ending June 30, 2020 ($ 34,498) Measurement Period Ending June 30, 2021 ($ 34,500) Measurement Period Ending June 30, 2022 ($ 20,341) Thereafter ($ 9,153) Note 5. Employer Contributions Employers’ proportionate shares were calculated on the basis of historical employer contributions. Although GASB Statement No. 75 encourages the use of the employer’s projected long-term contribution effort to the Other Post-Employment Benefit plan, allocating on the basis of historical employer contributions is considered acceptable. Employer contributions recognized by the VRS GLI OPEB Plan that are not representative of future contribution effort are excluded in the determination of employers’
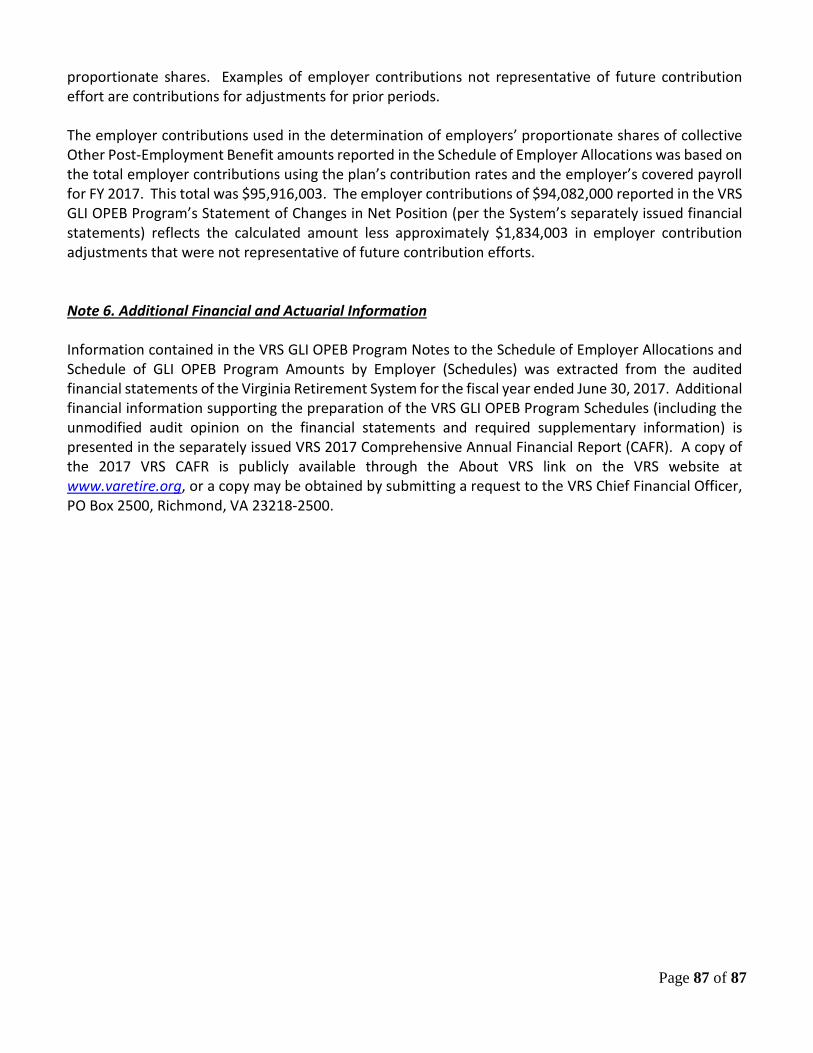
Page 87 of 87
proportionate shares. Examples of employer contributions not representative of future contribution effort are contributions for adjustments for prior periods. The employer contributions used in the determination of employers’ proportionate shares of collective Other Post-Employment Benefit amounts reported in the Schedule of Employer Allocations was based on the total employer contributions using the plan’s contribution rates and the employer’s covered payroll for FY 2017. This total was $95,916,003. The employer contributions of $94,082,000 reported in the VRS GLI OPEB Program’s Statement of Changes in Net Position (per the System’s separately issued financial statements) reflects the calculated amount less approximately $1,834,003 in employer contribution adjustments that were not representative of future contribution efforts. Note 6. Additional Financial and Actuarial Information Information contained in the VRS GLI OPEB Program Notes to the Schedule of Employer Allocations and Schedule of GLI OPEB Program Amounts by Employer (Schedules) was extracted from the audited financial statements of the Virginia Retirement System for the fiscal year ended June 30, 2017. Additional financial information supporting the preparation of the VRS GLI OPEB Program Schedules (including the unmodified audit opinion on the financial statements and required supplementary information) is presented in the separately issued VRS 2017 Comprehensive Annual Financial Report (CAFR). A copy of the 2017 VRS CAFR is publicly available through the About VRS link on the VRS website at www.varetire.org, or a copy may be obtained by submitting a request to the VRS Chief Financial Officer, PO Box 2500, Richmond, VA 23218-2500.