gasb statement no. 67 report for the county … · gasb statement no. 67 report for the county...
TRANSCRIPT
GASB STATEMENT NO. 67 REPORT
FOR THE
COUNTY EMPLOYEES RETIREMENT SYSYTEM
PREPARED AS OF JUNE 30, 2016

August 30, 2016 Board of Trustees Kentucky Retirement System Perimeter Park West 1260 Louisville Road Frankfort, KY 40601 Ladies and Gentlemen: Presented in this report is information to assist the County Employees Retirement System in meeting the requirements of the Governmental Accounting Standards Board (GASB) Statement No. 67. The information is presented for the period ending June 30, 2016. The annual actuarial valuation used as a basis for much of the information presented in this report was performed as of June 30, 2015. The valuation was based upon data, furnished by the Executive Director and the Kentucky Retirement Systems staff, concerning active, inactive and retired members along with pertinent financial information. To the best of our knowledge, this report is complete and accurate. The necessary calculations were performed by, and under the supervision of, independent actuaries who are members of the American Academy of Actuaries with experience in performing valuations for public retirement systems. The calculations were prepared in accordance with the principles of practice prescribed by the Actuarial Standards Board, and, in our opinion, meet the requirements of GASB 67. The actuarial calculations were performed by qualified actuaries according to generally accepted actuarial procedures and methods. The calculations are based on the current provisions of the System, and on actuarial assumptions that are, individually and in the aggregate, internally consistent and reasonably based on the actual experience of the System. In addition, the calculations were completed in compliance with the laws governing the System. The undersigned are members of the American Academy of Actuaries and meet the Qualification Standards of the American Academy of Actuaries to render the actuarial opinions contained herein.
Off
Cavanaugh Macdonald CC OO NN SS UU LL TT II NN GG,, LL LL CC
The experience and dedication you deserve
3550 Busbee Pkwy, Suite 250, Kennesaw, GA 30144 Phone (678) 388-1700 • Fax (678) 388-1730
www.CavMacConsulting.com Offices in Englewood, CO • Kennesaw, GA • Bellevue, NE

Board of Trustees August 30, 2016 Page 2 Future actuarial results may differ significantly from the current results presented in this report due to such factors as the following: plan experience differing from that anticipated by the economic or demographic assumptions; changes in economic or demographic assumptions; increases or decreases expected as part of the natural operation of the methodology used for these measurements (such as the end of an amortization period or additional cost or contribution requirements based on the plan’s funded status); and changes in plan provisions or applicable law. Since the potential impact of such factors is outside the scope of a normal annual actuarial valuation, an analysis of the range of results is not presented herein. Respectfully submitted,
Todd B. Green, ASA, FCA, MAAA Beverly V. Bailey, ASA, EA, FCA, MAAA Principal and Consulting Actuary Senior Actuary TBG:bvb

TABLE OF CONTENTS Section Item Page No. I Introduction 1 II Financial Statement Notes 3 III Required Supplementary Information 9 Schedule A Required Supplementary Information Tables 11 B Summary of Main Benefit Provisions 16 C Statement of Actuarial Assumptions and Methods 29

Page 1
REPORT OF THE ANNUAL GASB STATEMENT NO. 67 REQUIRED INFORMATION FOR THE
COUNTY EMPLOYEES RETIREMENT SYSTEM PREPARED AS OF JUNE 30, 2016
SECTION I – INTRODUCTION The Governmental Accounting Standards Board issued Statement No. 67 (GASB 67), “Financial Reporting For Pension Plans”, in June 2012. GASB 67’s effective date is for plan years beginning after June 15, 2013. This report, prepared as of June 30, 2016 (the Measurement Date), presents information to assist the County Employees Retirement System in meeting the requirements of GASB 67. Much of the material provided in this report is based on the data, assumptions and results of the annual actuarial valuation of the County Employees Retirement System as of June 30, 2015. The results of that valuation were detailed in a report dated November 10, 2015. GASB 67 basically divorces accounting and funding, creating disclosure and reporting requirements that may or may not be consistent with the basis used for funding the System. A major change in GASB 67 is the requirement to determine the Total Pension Liability (TPL) utilizing the Entry Age Normal actuarial funding method. The Net Pension Liability (NPL) is then set equal to the TPL minus the System’s Fiduciary Net Position (FNP) (basically the market values of assets). The benefit provisions recognized in the calculation of the TPL are summarized in Schedule C. Among the assumptions needed for the liability calculation is a Single Equivalent Interest Rate (SEIR). To determine the SEIR, the FNP must be projected into the future for as long as there are anticipated benefits payable under the plan’s provision applicable to the membership and beneficiaries of the System on the Measurement Date. If the FNP is projected to not be depleted at any point in the future, the long term expected rate of return on plan investments expected to be used to finance the benefit payments may be used as the SEIR. If, however, the FNP is projected to be depleted, the SEIR is determined as the single rate that will generate a present value of benefit payments equal to the sum of the present value determined by discounting all projected benefit payments through the date of depletion by the long term expected rate of return, and the present value determined by discounting those benefits after the date of depletion by a 20-year tax-exempt municipal bond (rating AA/Aa or higher) rate. The rate used, if necessary, for this purpose is the Bond Buyer General Obligation 20-year

Page 2
Municipal Bond Index published monthly by the Board of Governors of the Federal Reserve System. The sections that follow provide the results of all the necessary calculations, presented in the order laid out in GASB 67 for note disclosure and Required Supplementary Information (RSI).

Page 3
SECTION II – FINANCIAL STATEMENT NOTES
The material presented herein will follow the order presented in GASB 67. Paragraph numbers are provided for ease of reference.
Paragraphs 30(a) (1)-(3): The information required is to be supplied by the System.
Paragraph 30(a) (4): The data required regarding the membership of the County Employees Retirement System were furnished by the Kentucky Retirement Systems office. The following table summarizes the membership of the system as of June 30, 2015, the Valuation Date.
Membership
Non-Hazardous Hazardous
Inactive Members Or Their Beneficiaries Currently Receiving Benefits
51,673 6,834
Inactive Members Entitled To But Not Yet Receiving Benefits
75,904 2,309
Active Members 83,346 9,139
Total 210,923 18,282
Paragraphs 30(a)(5)-(6) and Paragraphs 30(b)-(f): The information required is to be supplied by the System.

Page 4
Paragraphs 31(a) (1)-(4): The information is provided in the following table. As stated above, the NPL is equal to the TPL minus the FNP. That result as of June 30, 2016 is presented in the table below.
Fiscal Year End June 30, 2016
Non-Hazardous Hazardous
Total Pension Liability $11,065,012,656 $3,726,115,488
Fiduciary Net Position 6,141,394,419 2,010,174,047
Net Pension Liability $4,923,618,237 $1,715,941,441
Ratio of Fiduciary Net Position to Total Pension Liability
55.50% 53.95%
Paragraph 31(b) (1)(a)-(f): This paragraph requires information regarding the actuarial assumptions used to measure the TPL. The actuarial assumptions utilized in developing the TPL are outlined in Schedule C. The total pension liability was determined by an actuarial valuation as of June 30, 2015, using the following actuarial assumptions, applied to all periods included in the measurement: Inflation 3.25 percent
Salary increases 4.00 percent, average, including inflation
Investment rate of return 7.50 percent, net of pension plan investment expense, including inflation
The mortality table used for active members is RP-2000 Combined Mortality Table projected with Scale BB to 2013 (multiplied by 50% for males and 30% for females). For healthy retired members and beneficiaries, the mortality table used is the RP-2000 Combined Mortality Table projected with Scale BB to 2013 (set back 1 year for females). For disabled members, the RP-2000 Combined Disabled Mortality Table projected with Scale BB to 2013 (set back 4 years for males) is used for the period after disability retirement. There is some margin in the current mortality tables for possible future improvement in mortality rates and that margin will be reviewed again when the next experience investigation is conducted.

Page 5
The actuarial assumptions used in the June 30, 2015 valuation were based on the results of an actuarial experience study for the period July 1, 2008 – June 30, 2013. Paragraph 31.b.(1)
(a) Discount rate: The discount rate used to measure the total pension liability was 7.50% (b) Projected cash flows: The projection of cash flows used to determine the discount rate
assumed that the employer- would contribute the actuarially determined contribution rate of projected compensation. The remaining amortization period of the unfunded actuarial accrued liability is 28 years. Once the unfunded actuarial accrued liability is fully amortized, the employer will only contribute the normal cost rate and the administrative expense rate on the closed payroll for existing members.
(c) Long term rate of return: The long-term expected return on plan assets is reviewed as part of the regular experience studies prepared every five years for the System. The most recent analysis was dated December 3, 2015. Several factors are considered in evaluating the long-term rate of return assumption including long term historical data, estimates inherent in current market data, and a log-normal distribution analysis in which best-estimate ranges of expected future real rates of return (expected return, net of investment expense and inflation) were developed by the investment consultant for each major asset class. These ranges were combined to produce the long-term expected rate of return by weighting the expected future real rates of return by the target asset allocation percentage and then adding expected inflation. The assumption is intended to be a long term assumption and is not expected to change absent a significant change in the asset allocation, a change in the inflation assumption, or a fundamental change in the market that alters expected returns in future years.
(d) Municipal bond rate: the discount rate determination does not use a municipal bond rate.
(e) Periods of projected benefit payments: projected future benefit payments for all current plan members were projected through 2117.
Page 6
(f) Assumed Asset Allocation: The target asset allocation and best estimates of arithmetic
real rates of return for each major asset class are summarized in the following table for both the Non-Hazardous and Hazardous Systems:
Asset Class Target
Allocation Long-Term Expected Real Rate of Return
Combined Equity 44% 5.40%
Combined Fixed Income 19 1.50
Real Return (Diversified Inflation Strategies)
10 3.50
Real Estate 5 4.50
Absolute Return (Diversified Hedge Funds)
10 4.25
Private Equity 10 8.50
Cash Equivalent 2 -0.25
Total 100%
Page 7
Paragraph 31(b) (1) (g): This paragraph requires disclosure of the sensitivity of the net pension liability to changes in the discount rate. The following presents the net pension liability of the Systems, calculated using the discount rate of 7.50 percent for Non-hazardous and 7.50% for Hazardous, as well as what the System’s net pension liability would be if it were calculated using a discount rate that is 1-percentage-point lower (6.50% percent) or 1-percentage-point higher (8.50%percent) than the current rate for non-hazardous and 1-percentage-point lower (6.50% percent) or 1-percentage-point higher (8.50%percent) than the current rate for hazardous ($ thousands):
Non-Hazardous Members
1% Decrease (6.50%)
Current
Discount Rate (7.50%)
1%
Increase (8.50%)
System’s net pension liability $6,135,625,606 $4,923,618,237 $3,884,686,628
Hazardous Members
1% Decrease (6.50%)
Current
Discount Rate (7.50%)
1%
Increase (8.50%)
System’s net pension liability $2,155,722,903 $1,715,941,441 $1,353,197,862
Paragraph 31(c): June 30, 2015 is the actuarial valuation date upon which the TPL is based. An expected TPL is determined as of June 30, 2016 using standard roll forward techniques. The roll forward calculation adds the annual normal cost (also called the service cost), subtracts the actual benefit payments and refunds for the plan year and then applies the expected investment rate of return for the year. The procedure was used to determine the TPL as of July 1, 2016, as shown in the tables on the following page:
Page 8
Non-Hazardous
TPL Roll Forward TPL Reported for Fiscal Year Ended
2016 (a) Interest Rate 7.50% (b) Valuation Date for Measurement June 30, 2015 (c) TPL as of June 30, 2015 $10,740,325,421 (d) Entry Age Normal Cost for the period
July 1, 2015 – June 30, 2016 $194,512,073 (e) Actual Benefit Payments and Refunds
for the period July 1, 2015 – June 30, 2016 $665,000,145
(f) TPL as of July 1, 2016 $11,065,012,656 =[(c+d) x (1 + (a))] – [e x (1 + (a)/2)]
Hazardous
TPL Roll Forward TPL Reported for Fiscal Year Ended
2016 (a) Interest Rate 7.50% (b) Valuation Date for Measurement June 30, 2015 (c) TPL as of June 30, 2015 $3,613,307,547 (d) Entry Age Normal Cost for the period
July 1, 2015 – June 30, 2016 $61,627,333 (e) Actual Benefit Payments and Refunds
for the period July 1, 2015 – June 30, 2016 $216,327,237
(f) TPL as of July 1, 2016 $3,726,115,488 =[(c+d) x (1 + (a))] – [e x (1 + (a)/2)]

Page 9
SECTION III – REQUIRED SUPPLEMENTARY INFORMATION There are several tables of Required Supplementary Information (RSI) that need to be included in the System’s financial statements:
Paragraphs 32(a)-(c): The required tables are provided in Schedule B. Paragraph 32(d): The money-weighted rates of return required are to be supplied by the System.
Paragraph 34: In addition the following should be noted regarding the RSI: Changes of benefit terms: none. Changes of assumption: The following changes were adopted by the Board and reflected in the valuation performed as of June 30, listed below: 2015
The assumed investment rate of return was decreased from 7.75% to7.50%. The assumed rate of inflation was reduced from 3.50% to 3.25%. The assumed rate of wage inflation was reduced from 1.00% to 0.75%. Payroll growth assumption was reduced from 4.50% to 4.00%. The mortality table used for active members is RP-2000 Combined Mortality Table
projected with Scale BB to 2013 (multiplied by 50% for males and 30% for females). For healthy retired members and beneficiaries, the mortality table used is the RP-2000
Combined Mortality Table projected with Scale BB to 2013 (set back 1 year for females). For disabled members, the RP-2000 Combined Disabled Mortality Table projected with Scale BB to 2013 (set back 4 years for males) is used for the period after disability retirement. There is some margin in the current mortality tables for possible future improvement in mortality rates and that margin will be reviewed again when the next experience investigation is conducted.
The assumed rates of Retirement, Withdrawal and Disability were updated to more accurately reflect experience.
Method and assumptions used in calculations of actuarially determined contributions. The actuarially determined contribution rates are determined on an annual basis beginning with the fiscal years ended 2017, determined as of June 30, 2015. The amortization period of the unfunded liability has been reset as of July 1, 2013 to a closed 30-year period. The following actuarial methods and assumptions were used to determine contribution rates reported in that schedule:

Page 10
Actuarial cost method Entry age Amortization method Level percentage of payroll, closed Remaining amortization period 28 years Asset valuation method 5-year smoothed market Inflation 3.25 percent Salary increase 4.00 percent, average, including inflation Investment rate of return 7.50 percent, net of pension plan investment
expense, including inflation
Page 11
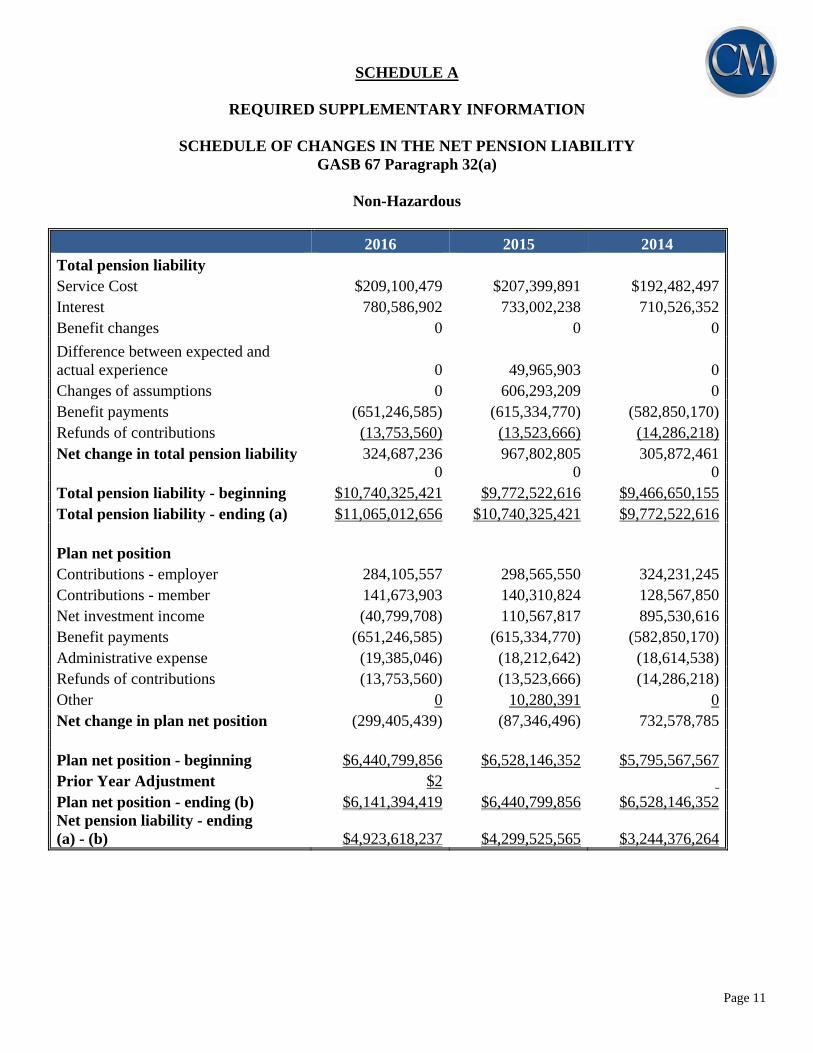
SCHEDULE A
REQUIRED SUPPLEMENTARY INFORMATION
SCHEDULE OF CHANGES IN THE NET PENSION LIABILITY
GASB 67 Paragraph 32(a)
Non-Hazardous
2016 2015 2014 Total pension liability
Service Cost $209,100,479 $207,399,891 $192,482,497Interest 780,586,902 733,002,238 710,526,352 Benefit changes 0 0 0
Difference between expected and actual experience 0 49,965,903 0 Changes of assumptions 0 606,293,209 0 Benefit payments (651,246,585) (615,334,770) (582,850,170)Refunds of contributions (13,753,560) (13,523,666) (14,286,218)Net change in total pension liability 324,687,236 967,802,805 305,872,461 0 0 0Total pension liability - beginning $10,740,325,421 $9,772,522,616 $9,466,650,155Total pension liability - ending (a) $11,065,012,656 $10,740,325,421 $9,772,522,616 Plan net position Contributions - employer 284,105,557 298,565,550 324,231,245 Contributions - member 141,673,903 140,310,824 128,567,850 Net investment income (40,799,708) 110,567,817 895,530,616 Benefit payments (651,246,585) (615,334,770) (582,850,170)Administrative expense (19,385,046) (18,212,642) (18,614,538)Refunds of contributions (13,753,560) (13,523,666) (14,286,218)Other 0 10,280,391 0 Net change in plan net position (299,405,439) (87,346,496) 732,578,785 Plan net position - beginning $6,440,799,856 $6,528,146,352 $5,795,567,567Prior Year Adjustment $2 Plan net position - ending (b) $6,141,394,419 $6,440,799,856 $6,528,146,352Net pension liability - ending (a) - (b) $4,923,618,237 $4,299,525,565 $3,244,376,264
Page 12
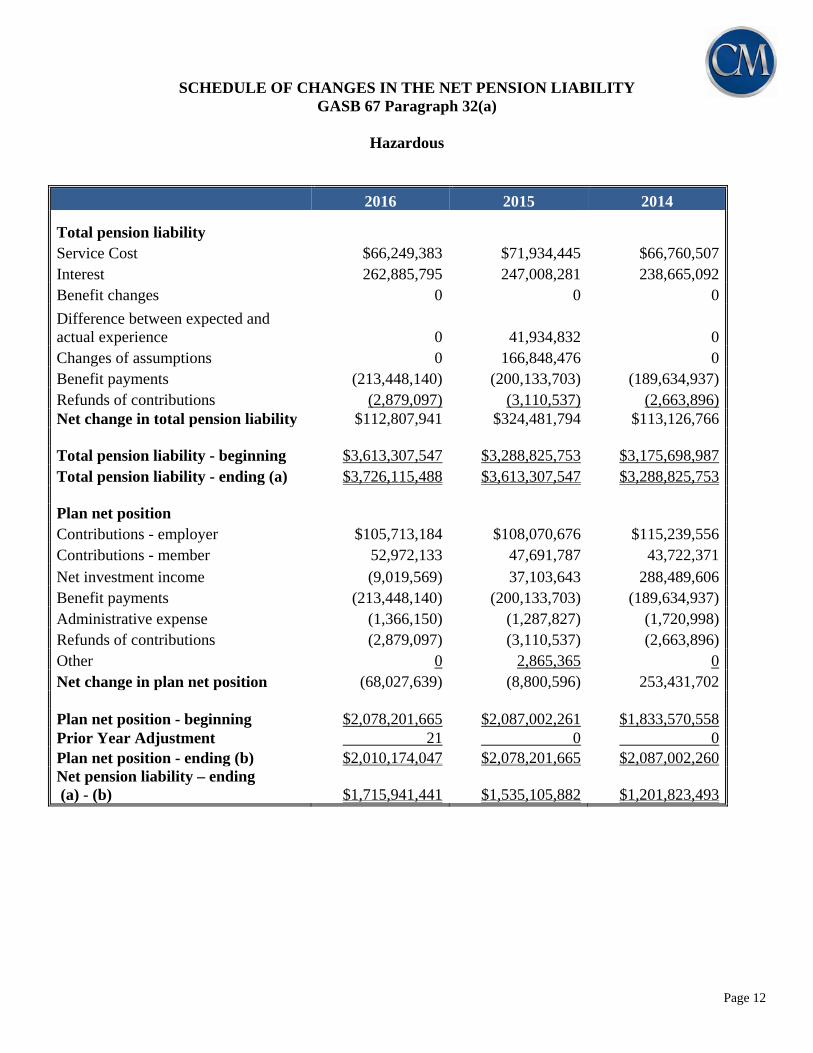
SCHEDULE OF CHANGES IN THE NET PENSION LIABILITY GASB 67 Paragraph 32(a)
Hazardous
2016 2015 2014
Total pension liability
Service Cost $66,249,383 $71,934,445 $66,760,507Interest 262,885,795 247,008,281 238,665,092 Benefit changes 0 0 0
Difference between expected and actual experience 0 41,934,832 0 Changes of assumptions 0 166,848,476 0 Benefit payments (213,448,140) (200,133,703) (189,634,937)Refunds of contributions (2,879,097) (3,110,537) (2,663,896)Net change in total pension liability $112,807,941 $324,481,794 $113,126,766 Total pension liability - beginning $3,613,307,547 $3,288,825,753 $3,175,698,987Total pension liability - ending (a) $3,726,115,488 $3,613,307,547 $3,288,825,753 Plan net position Contributions - employer $105,713,184 $108,070,676 $115,239,556Contributions - member 52,972,133 47,691,787 43,722,371 Net investment income (9,019,569) 37,103,643 288,489,606 Benefit payments (213,448,140) (200,133,703) (189,634,937)Administrative expense (1,366,150) (1,287,827) (1,720,998)Refunds of contributions (2,879,097) (3,110,537) (2,663,896)Other 0 2,865,365 0 Net change in plan net position (68,027,639) (8,800,596) 253,431,702 Plan net position - beginning $2,078,201,665 $2,087,002,261 $1,833,570,558Prior Year Adjustment 21 0 0 Plan net position - ending (b) $2,010,174,047 $2,078,201,665 $2,087,002,260Net pension liability – ending (a) - (b) $1,715,941,441 $1,535,105,882 $1,201,823,493
Page 13
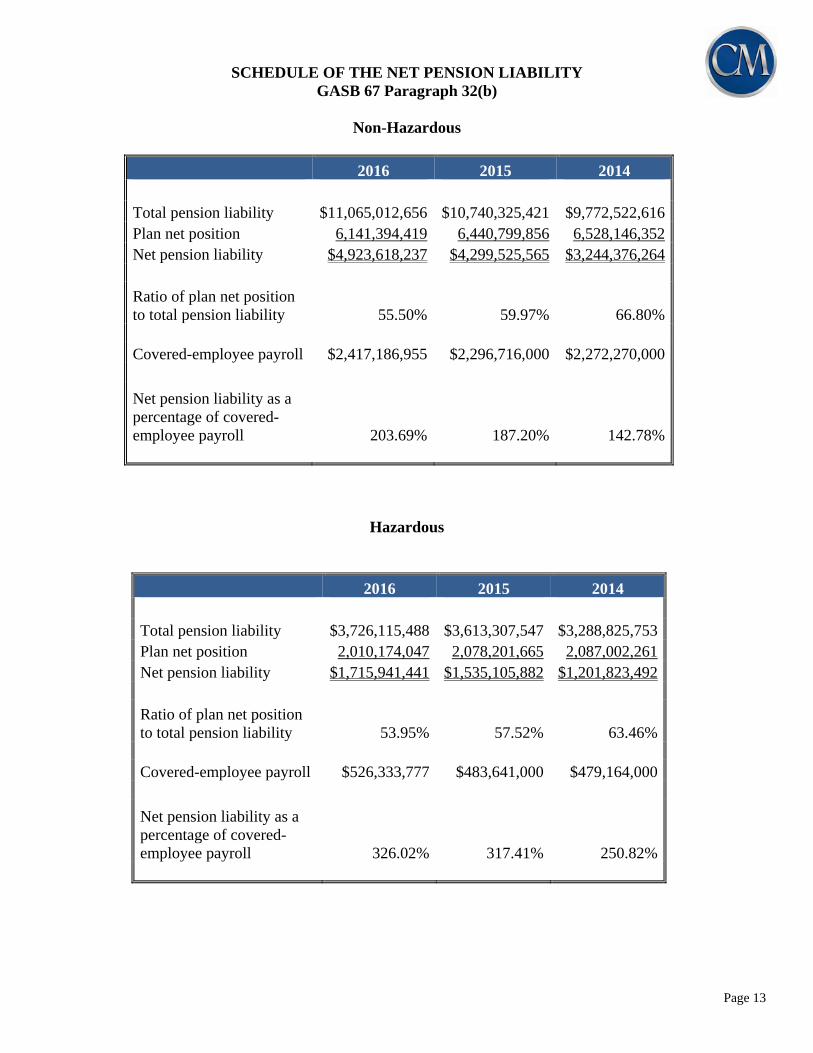
SCHEDULE OF THE NET PENSION LIABILITY
GASB 67 Paragraph 32(b)
Non-Hazardous
2016 2015 2014 Total pension liability $11,065,012,656 $10,740,325,421 $9,772,522,616Plan net position 6,141,394,419 6,440,799,856 6,528,146,352Net pension liability $4,923,618,237 $4,299,525,565 $3,244,376,264
Ratio of plan net position to total pension liability 55.50% 59.97% 66.80% Covered-employee payroll $2,417,186,955 $2,296,716,000 $2,272,270,000
Net pension liability as a percentage of covered-employee payroll 203.69% 187.20% 142.78%
Hazardous
2016 2015 2014 Total pension liability $3,726,115,488 $3,613,307,547 $3,288,825,753Plan net position 2,010,174,047 2,078,201,665 2,087,002,261Net pension liability $1,715,941,441 $1,535,105,882 $1,201,823,492
Ratio of plan net position to total pension liability 53.95% 57.52% 63.46% Covered-employee payroll $526,333,777 $483,641,000 $479,164,000
Net pension liability as a percentage of covered-employee payroll 326.02% 317.41% 250.82%
Page 14
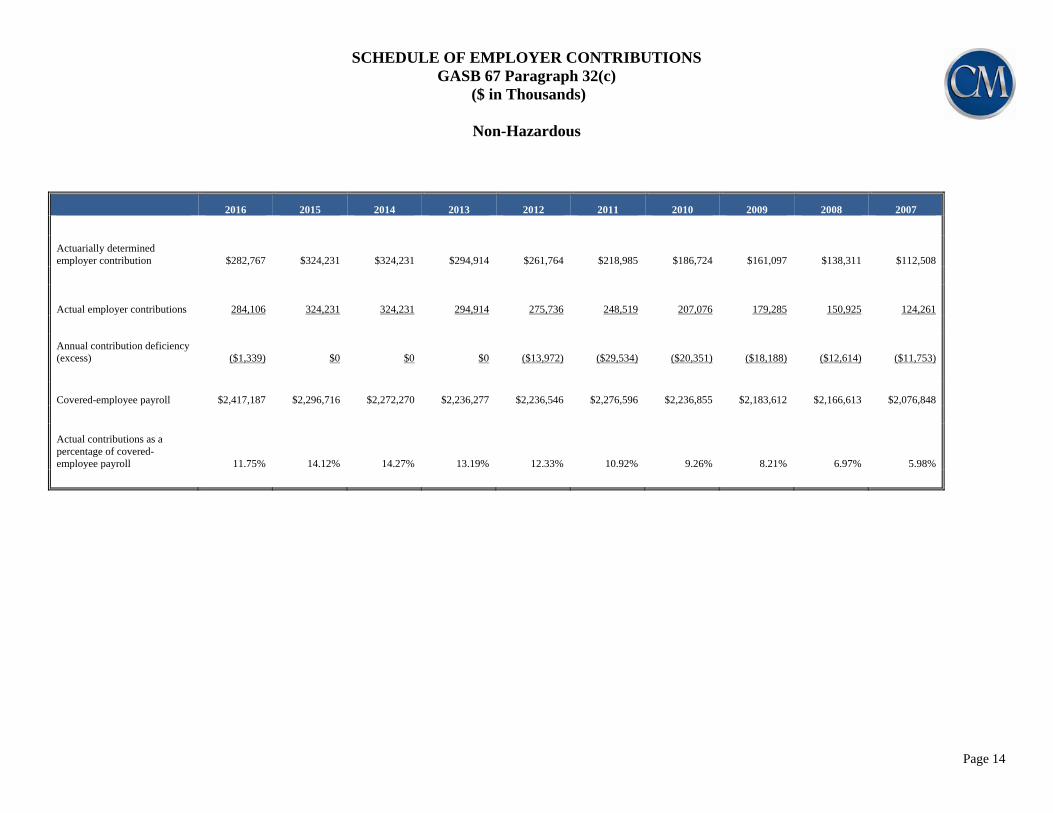
SCHEDULE OF EMPLOYER CONTRIBUTIONS GASB 67 Paragraph 32(c)
($ in Thousands)
Non-Hazardous
2016 2015 2014 2013 2012 2011 2010 2009 2008 2007
Actuarially determined employer contribution $282,767 $324,231 $324,231 $294,914 $261,764 $218,985 $186,724 $161,097 $138,311 $112,508
Actual employer contributions 284,106 324,231 324,231 294,914 275,736 248,519 207,076 179,285 150,925 124,261
Annual contribution deficiency (excess) ($1,339) $0 $0 $0 ($13,972) ($29,534) ($20,351) ($18,188) ($12,614) ($11,753)
Covered-employee payroll $2,417,187 $2,296,716 $2,272,270 $2,236,277 $2,236,546 $2,276,596 $2,236,855 $2,183,612 $2,166,613 $2,076,848
Actual contributions as a percentage of covered-employee payroll 11.75% 14.12% 14.27% 13.19% 12.33% 10.92% 9.26% 8.21% 6.97% 5.98%

Page 15
SCHEDULE OF EMPLOYER CONTRIBUTIONS GASB 67 Paragraph 32(c)
($ in Thousands)
Hazardous
2016 2015 2014 2013 2012 2011 2010 2009 2008 2007
Actuarially determined employer contribution $104,952 $107,514 $115,240 $120,140 $83,589 $78,796 $76,391 $69,056 $64,082 $53,890
Actual employer contributions 105,713 108,071 115,240 120,140 89,329 85,078 82,887 78,152 72,155 61,553
Annual contribution deficiency (excess) ($761) ($557) $0 $0 ($5,740) ($6,282) ($6,496) ($9,095) ($8,073) ($7,663)
Covered-employee payroll $526,334 $483,641 $479,164 $461,673 $464,229 $466,964 $466,549 $469,315 $474,241 $458,999
Actual contributions as a percentage of covered-employee payroll 20.08% 22.35% 24.05% 26.02% 19.24% 18.22% 17.77% 16.65% 15.21% 13.41%

Page 16
SCHEDULE B
SUMMARY OF MAIN BENEFIT AND CONTRIBUTION PROVISIONS
This schedule summarizes the major retirement benefit provisions of CERS included in the valuation. It is not intended to be, nor should it be interpreted as, a complete statement of all plan provisions. Plan Year: July 1 through June 30 Non-Hazardous Normal Retirement:
Members whose participation began before 8/1/2004
Age Requirement 65 Service Requirement At least one month of non-hazardous duty service
credit Amount If a member has at least 48 months of service, the
monthly benefit is 2.20% multiplied by final average compensation, multiplied by years of service.
Final compensation is calculated by taking the average of the highest five (5) fiscal years of salary. If the number of months of service credit during the five (5) year period is less than forty-eight (48), one (1) or more additional fiscal years shall be used. If a member has less than 48 months of service, the monthly benefit is the actuarial equivalent of two times the member’s contributions with interest.
Members whose participation began on or after 8/1/2004, but before 9/1/2008
Age Requirement 65 Service Requirement At least one month of non-hazardous duty service
credit Amount If a member has at least 48 months of service, the
monthly benefit is 2.00% multiplied by final
Page 17
average compensation, multiplied by years of service.
Final compensation is calculated by taking the average of the highest five (5) fiscal years of salary. If the number of months of service credit during the five (5) year period is less than forty-eight (48), one (1) or more additional fiscal years shall be used. If a member has less than 48 months of service, the monthly benefit is the actuarial equivalent of two times the member’s contributions with interest.
Non-Hazardous Normal Retirement (continued):
Members whose participation began on or after 9/1/2008 but before 1/1/2014
Requirement Age 65 with 60 months of non-hazardous duty
service credit, or age 57 if age plus service equals at least 87.
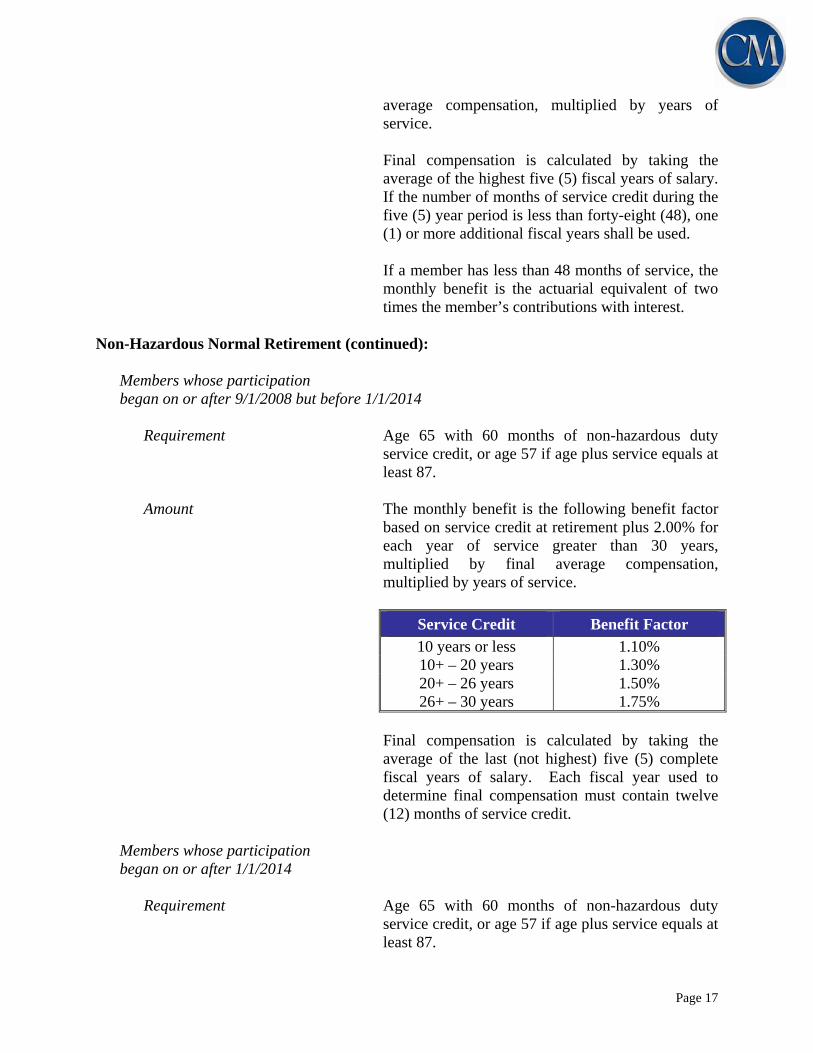
Amount The monthly benefit is the following benefit factor
based on service credit at retirement plus 2.00% for each year of service greater than 30 years, multiplied by final average compensation, multiplied by years of service.
Service Credit Benefit Factor
10 years or less 1.10% 10+ – 20 years 1.30% 20+ – 26 years 1.50% 26+ – 30 years 1.75%
Final compensation is calculated by taking the average of the last (not highest) five (5) complete fiscal years of salary. Each fiscal year used to determine final compensation must contain twelve (12) months of service credit.
Members whose participation began on or after 1/1/2014
Requirement Age 65 with 60 months of non-hazardous duty
service credit, or age 57 if age plus service equals at least 87.

Page 18
Amount Each year that a member is an active contributing
member to the System, the member and the member’s employer will contribute 5.00% and 4.00% of creditable compensation respectively into a hypothetical account. This hypothetical account will earn interest annually on both the member’s and employer’s contribution at a minimum rate of 4%. If the System’s geometric average net investment return for the previous five years exceeds 4%, then the hypothetical account will be credited with an additional amount of interest equal to 75% of the amount of the return which exceeds 4%. All interest credits will be applied to the hypothetical account balance on June 30 based on the account balance as of June 30 of the previous year.
Upon retirement the hypothetical account which
includes member contributions, employer contributions and interest credits can be withdrawn from the System as a lump sum or annuitized into a single life annuity option.

Page 19
Hazardous Normal Retirement:
Members whose participation began before 9/1/2008
Age Requirement 55 Service Requirement At least one month of hazardous duty service credit Amount If a member has at least 60 months of service, the
monthly benefit is 2.50% multiplied by final average compensation, multiplied by years of service.
Final compensation is calculated by taking the average of the highest three (3) fiscal years of salary. If the number of months of service credit during the three (3) year period is less than twenty-four (24), one (1) or more additional fiscal years shall be used. If a member has less than 60 months of service, the monthly benefit is the actuarial equivalent of two times the member’s contributions with interest.
Members whose participation began on or after 9/1/2008 but before 1/1/2014
Age Requirement 60 Service Requirement At least 60 months of hazardous duty service credit Amount The monthly benefit is the following benefit factor
based on service credit at retirement, multiplied by final average compensation, multiplied by years of service.
Service Credit Benefit Factor
10 years or less 1.30% 10+ – 20 years 1.50% 20+ – 25 years 2.25%
25+ years 2.50%
Final compensation is calculated by taking the average of the highest three (3) complete fiscal years of salary. Each fiscal year used to determine
Page 20
final compensation must contain twelve (12) months of service credit.
Hazardous Normal Retirement (continued):
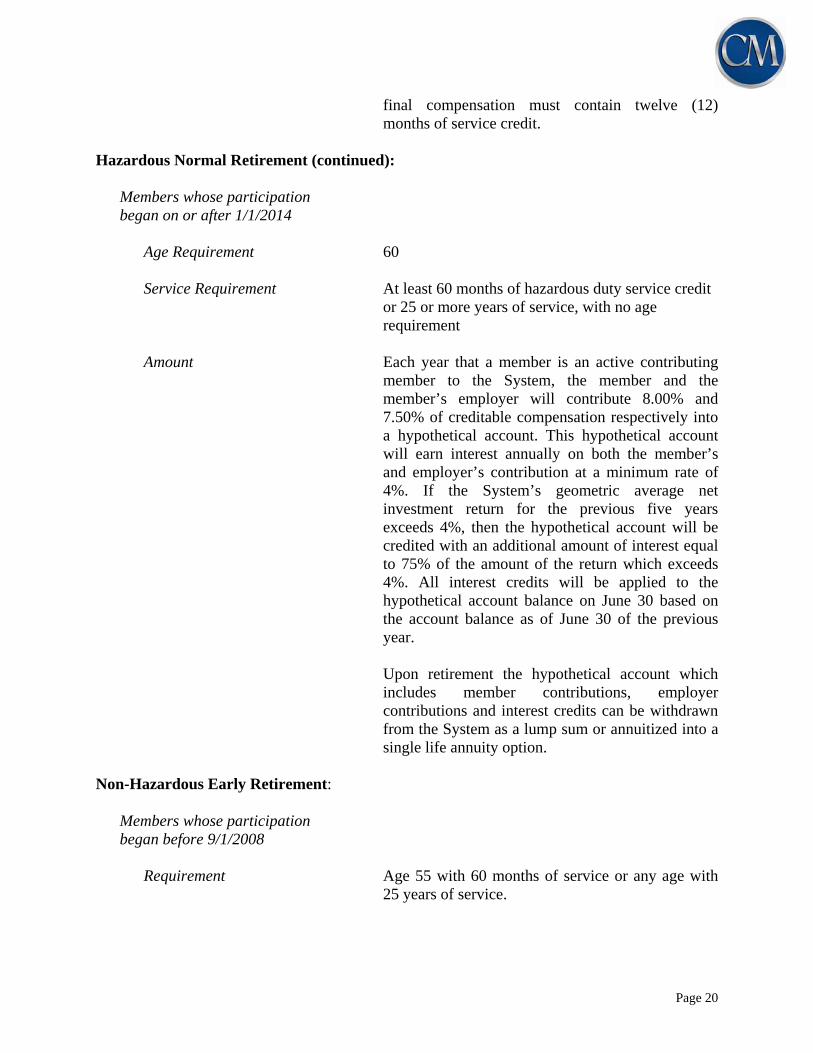
Members whose participation began on or after 1/1/2014
Age Requirement 60 Service Requirement At least 60 months of hazardous duty service credit
or 25 or more years of service, with no age requirement
Amount Each year that a member is an active contributing
member to the System, the member and the member’s employer will contribute 8.00% and 7.50% of creditable compensation respectively into a hypothetical account. This hypothetical account will earn interest annually on both the member’s and employer’s contribution at a minimum rate of 4%. If the System’s geometric average net investment return for the previous five years exceeds 4%, then the hypothetical account will be credited with an additional amount of interest equal to 75% of the amount of the return which exceeds 4%. All interest credits will be applied to the hypothetical account balance on June 30 based on the account balance as of June 30 of the previous year.
Upon retirement the hypothetical account which
includes member contributions, employer contributions and interest credits can be withdrawn from the System as a lump sum or annuitized into a single life annuity option.
Non-Hazardous Early Retirement:
Members whose participation began before 9/1/2008
Requirement Age 55 with 60 months of service or any age with
25 years of service.

Page 21
Amount Normal retirement benefit reduced by 6.5% per year for the first five years and 4.5% per year for the next five years for each year the member is younger than age 65 or has less than 27 years of service, whichever is smaller.
Non-Hazardous Early Retirement (continued):
Members whose participation began on or after 9/1/2008 but before 1/1/2014
Requirement Age 60 with 10 years of service. Amount Normal retirement benefit reduced by 6.5% per year
for the first five years and 4.5% per year for the next five years for each year the member is younger than age 65, or does not meet the rule of 87 (age plus service) and is younger than age 57, whichever is smaller.
Hazardous Early Retirement:
Members whose participation began before 9/1/2008
Requirement Age 50 with 15 years of service or any age with 20
years service. Amount Normal retirement benefit reduced by 6.5% per year
for the first five years and 4.5% per year for the next five years for each year the member is younger than age 55 or has less than 20 years service, whichever is smaller.
Hazardous Early Retirement (continued):
Members whose participation began on or after 9/1/2008 but before 1/1/2014
Requirement Age 50 with 15 years of service or any age with 25
years service. Amount Normal retirement benefit reduced by 6.5% per year
for the first five years and 4.5% per year for the next five years for each year the member is younger than age 60 or has less than 25 years service, whichever is smaller.

Page 22
Non-Hazardous Disability:
Age Requirement None Service Requirement 60 months
Members whose participation began before 8/1/2004 Normal retirement benefit except that service credit
will be added to total service for the period from the last day of plan employment to the member’s 65th birthday or until the combined total service as of the last day of paid employment and added service equals 25 years. The total amount of service credit added shall not exceed the member’s actual service credit on the last day of paid employment. For members with at least 25 years of service but less than 27 years of service, total service shall be 27 years. For employees with 27 or more years of service credit, actual service will be used.
Non-Hazardous Disability (continued):
A contributing member in a non-hazardous position who is disabled in the line of duty is entitled to a retirement benefit of not less than 25% of the member’s final monthly rate of pay plus 10% of the member’s final monthly rate of pay for each dependent child. The maximum dependent child’s benefit is 40% of the member’s final monthly rate of pay.
Members whose participation began on or after 8/1/2004 but before 1/1/2014
Normal retirement benefit based on actual service with no penalty or, if larger, 20% of the Final Rate of Pay. May apply for disability even after normal retirement age.
Members whose participation began on or after 1/1/2014 The hypothetical account which includes member
contributions, employer contributions and interest credits can be withdrawn from the System as a lump sum or an annuity equal to the larger of 20% of the member’s monthly final rate of pay or the annuitized hypothetical account into a single life annuity option.

Page 23
Hazardous Disability:
Age Requirement None
Service Requirement 60 months (waived if in line of duty disability) Members whose participation began before 8/1/2004 Normal retirement benefit except if the member’s
total service credit is less than 20 years, service credit will be added for the period from the last day of paid employment to the member’s 55th birthday. The maximum service credit added will not exceed the total service the member had on this last day of paid employment and the maximum service credit for calculating his retirement allowance, including total service and service added will not exceed 20 years. May not apply if eligible for an unreduced retirement allowance.
A member in a hazardous position who is disabled in the line of duty is entitled to the normal retirement benefit based on years of service and final compensation determined as of the date of disability (no penalty), except that the monthly retirement allowance payable shall not be less than 25% of the member’s monthly final monthly rate of pay. Each dependent child shall receive 10% of the disabled member’s monthly final rate of pay; however the total maximum dependent children’s benefit shall not exceed 40% of the member’s monthly final rate of pay.

Page 24
Hazardous Disability (continued):
Members whose participation began on or after 8/1/2004 but before 1/1/2014 Normal retirement benefit based on years of service
and final compensation determined as of the date of disability (no penalty) or, if larger, 25% of the member’s monthly final rate of pay. May apply for disability even after normal retirement age.
Members whose participation began on or after 1/1/2014 The hypothetical account which includes member
contributions, employer contributions and interest credits can be withdrawn from the System as a lump sum or an annuity equal to the larger of 25% of the member’s monthly final rate of pay or the annuitized hypothetical account into a single life annuity option.
Vesting:
Members whose participation began before 9/1/2008
Age Requirement None
Service Requirement 60 months. Service purchased after August 1, 2004 does not count toward vesting insurance benefits. Service purchased by employees who began participating on or after August 1, 2004 does not count toward vesting retirement benefits. Recontribution of refunds and omitted service purchases are the exception to this rule for service requirement.
Amount Normal retirement benefit deferred to normal
retirement age or reduced benefit payable at early retirement age.
Normal Retirement Age 65 for non-hazardous members and 55 for
hazardous members.

Page 25
Members whose participation began on or after 9/1/2008 but before 1/1/2014
Age Requirement None
Service Requirement 60 months. Service purchased after August 1, 2004
does not count toward vesting insurance benefits. Service purchased by employees who began participating on or after August 1, 2004 does not count toward vesting retirement benefits. Recontribution of refunds and omitted service purchases are the exception to this rule for service requirement.
Amount Normal retirement benefit deferred to normal
retirement age or reduced benefit payable at early retirement age.
Vesting (continued):
Normal Retirement Age 65 for non-hazardous members and 60 for hazardous members.
Members whose participation began on or after 1/1/2014
Age Requirement None
Service Requirement 60 months. Amount Upon termination the hypothetical account which
includes member contributions, employer contributions and interest credits can be withdrawn from the System as a lump sum or the member can elect to leave the hypothetical account balance in the System. If the member does not withdraw the account balance, it will continue to earn 4% interest. Upon reaching normal retirement age the member can apply for retirement and receive the account balance as a lump sum payment or annuitize the account balance into a single life annuity.

Page 26
Pre-Retirement Death Benefit (not in line of duty):
Members whose participation began before 1/1/2014
Requirement Eligible for Normal or Early Retirement, or any age in active employment with 60 months service, or any age and not in active employment with at least 144 months of service.
Amount Benefit equal to the benefit the member would have
received had the member retired on the day before the date of death and elected a 100% joint and survivor form. Benefit is actuarially reduced if member is less than normal retirement age at the date of death.
Members whose participation began on or after 1/1/2014
Requirement 60 months service Amount The maximum of the benefit equal to the benefit the
member would have received had the member retired on the day before the date of death.

Page 27
Spouse’s Pre-Retirement Death Benefit (in line of duty):
Requirement None Amount The spouse may choose (1) a $10,000 lump sum
payment and monthly payments of 25% of the member’s final monthly rate of pay or (2) benefit options offered under death not in line of duty.
Dependent Non-Spouse’s Death Benefit (in line of duty) – Hazardous Plan:
Requirement None Amount The non-spouse may choose (1) a $10,000 lump
sum payment or (2) benefit options offered under death not in line of duty.
Dependent Child’s Death Benefit (in line of duty):
Requirement None Amount 10% of member’s final monthly rate of pay.
Dependent child payments cannot exceed 40% of the member’s monthly final rate of pay.
Post-Retirement Death Benefit:
Requirement Retired member in receipt of monthly benefit based on at least 48 months or more of combined service with KERS, CERS or SPRS.
Amount $5,000
Non-Hazardous Member Contributions: Members whose participation began before 9/1/2008 5% of all creditable compensation. Interest paid on
the members’ accounts is currently 2.5% shall not be less than 2.0%. Member entitled to a full refund of contributions with interest.
Members whose participation began on or after 9/1/2008 6% of all creditable compensation, with 5% being
credited to the member’s account and 1% deposited to the KRS 401(h) Account. Interest paid on the members’ accounts will be set at 2.5%. Member

Page 28
entitled to a full refund of contributions and interest in their individual account, however, the 1% contributed to the insurance fund is non-refundable.
Non-Hazardous Member Contributions (continued):
Members whose participation began on or after 1/1/2014 6% of all creditable compensation, with 5% being
credited to the member’s account and 1% deposited to the KRS 401(h) Account. Member entitled to a full refund of contributions and interest on the member’s portion of the hypothetical account, however, the 1% contributed to the insurance fund is non-refundable.
Hazardous Member Contributions:
Members whose participation began before 9/1/2008 8% of all creditable compensation. Interest paid on
the members’ accounts is currently 2.5% shall not be less than 2.0%. Member entitled to a full refund of contributions with interest.
Members whose participation began on or after 9/1/2008 9% of all creditable compensation, with 8% being
credited to the member’s account and 1% deposited to the KRS 401(h) Account. Interest paid on the members’ accounts will be set at 2.5%. Member entitled to a full refund of contributions and interest in their individual account, however, the 1% contributed to the insurance fund is non-refundable.
Members whose participation began on or after 1/1/2014 9% of all creditable compensation, with 8% being
credited to the member’s account and 1% deposited to the KRS 401(h) Account. Member entitled to a full refund of contributions and interest on the member’s portion of the hypothetical account, however, the 1% contributed to the insurance fund is non-refundable.

Page 29
SCHEDULE C
STATEMENT OF ACTUARIAL ASSUMPTIONS AND METHODS The assumptions and methods used in the valuation were based on the actuarial experience study for the five-year period ending June 30, 2013, submitted April 30, 2014, and adopted by the Board on December 4, 2014. INVESTMENT RATE OF RETURN: 7.50% per annum, compounded annually for retirement and insurance benefits. PRICE INFLATION: 3.25% per annum, compounded annually. PAYROLL GROWTH: 4.00% per annum, compounded annually. SALARY INCREASES: The assumed annual rates of future salary increases for both non-hazardous and hazardous members are as follows and include inflation at 4.00% per annum:
Service Years
Annual Rates of Salary Increases
Merit & Seniority Base (Economy
)
Increase Next Year
Non-Hazardous Hazardous
Non-Hazardous Hazardous
0-1 8.17% 14.90% 4.00% 12.50% 19.50%
1-2 4.81% 5.77% 4.00% 9.00% 10.00%
2-3 1.44% 1.92% 4.00% 5.50% 6.00%
3-4 1.44% 1.20% 4.00% 5.50% 5.25%
4-5 0.96% 0.96% 4.00% 5.00% 5.00%
5-6 0.96% 0.48% 4.00% 5.00% 4.50%
6-7 0.72% 0.00% 4.00% 4.75% 4.00%
7-8 0.72% 0.00% 4.00% 4.75% 4.00%
8-9 0.48% 0.00% 4.00% 4.50% 4.00%
9-10 0.48% 0.00% 4.00% 4.50% 4.00%
10 & Over 0.24% 0.00% 4.00% 4.25% 4.00%

Page 30
DISABILITY: Representative assumed annual rates of disability for both non-hazardous and hazardous members are as follows:
Nearest Age
Annual Rates of Disability
Non-Hazardous Hazardous
Male Female Male Female
20 0.02% 0.02% 0.05% 0.05%
30 0.03% 0.03% 0.09% 0.09%
40 0.07% 0.07% 0.20% 0.20%
50 0.19% 0.19% 0.56% 0.56%
60 0.49% 0.49% 1.46% 1.46%

Page 31
RETIREMENT: The assumed annual rates of retirement for both non-hazardous and hazardous members are as follows:
Annual Rates of Retirement
Non-Hazardous Hazardous
Age
Those Eligible for Service
Retirement*
Those Eligible for Service
Retirement** Service
Those Eligible for Service
Retirement+
Those Eligible for Service
Retirement++
55 5.0% 20 22.5%
56 6.0% 21 22.5%
57 7.0% 22 22.5%
58 7.0% 23 22.5%
59 8.0% 24 30.0%
60 9.0% 9.0% 25 33.0% 22.5%
61 15.0% 15.0% 26 33.0% 22.5%
62 18.0% 18.0% 27 36.0% 22.5%
63 18.0% 18.0% 28 39.0% 22.5%
64 18.0% 18.0% 29 55.0% 30.0%
65 18.0% 18.0% 30 33.0% 33.0%
66 18.0% 18.0% 31 33.0% 33.0%
67 18.0% 18.0% 32 50.0% 36.0%
68 18.0% 18.0% 33 40.0% 39.0%
69 18.0% 18.0% 34 40.0% 55.0%
70 18.0% 18.0% 35 40.0% 33.0%
71 18.0% 18.0% 36 40.0% 33.0%
72 18.0% 18.0% 37 40.0% 50.0%
73 18.0% 18.0% 38 40.0% 40.0%
74 18.0% 18.0% 39 40.0% 40.0%
75 100.0% 100.0% 40 40.0% 40.0%
* For members participating before September 1, 2008. If service is at least 27 years, the rate is 30%. ** For members participating on or after September 1, 2008. If age plus service is at least 87, the rate is 30%. + For members participating before September 1, 2008. The annual rate of service retirement is 100% at age 62. ++ For members participating on or after September 1, 2008. The annual rate of service retirement is 100% at age 60.
Page 32
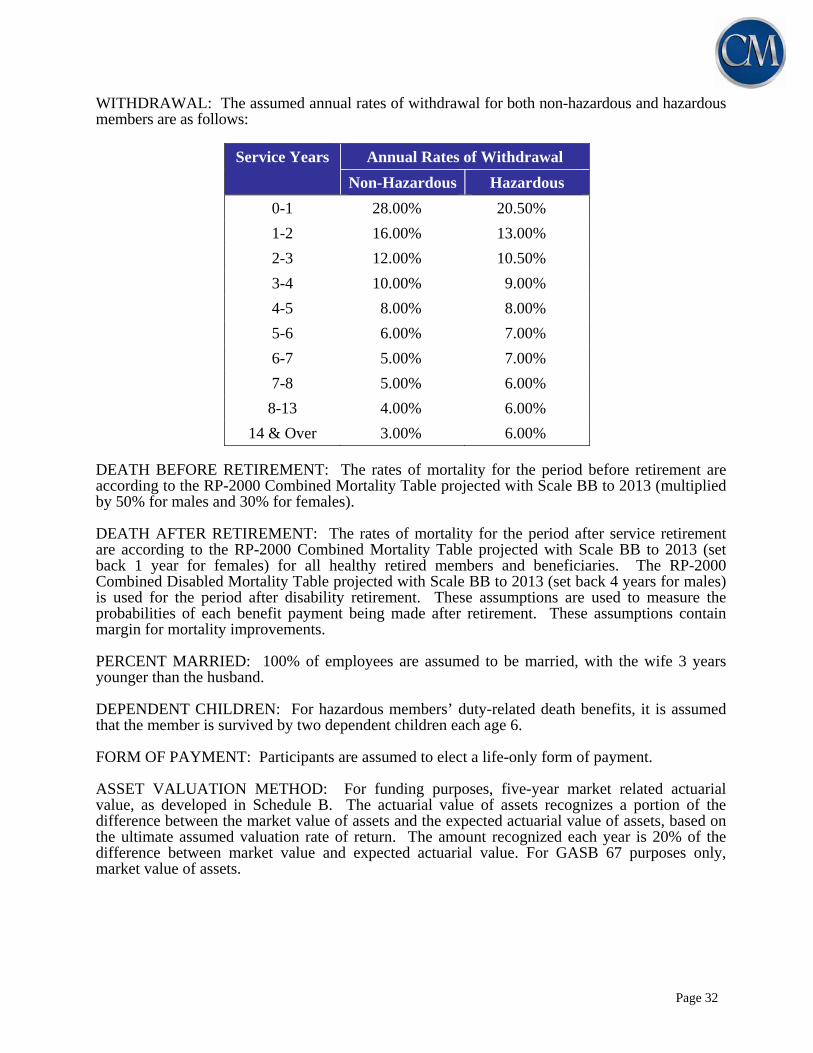
WITHDRAWAL: The assumed annual rates of withdrawal for both non-hazardous and hazardous members are as follows:
Service Years Annual Rates of Withdrawal
Non-Hazardous Hazardous
0-1 28.00% 20.50%
1-2 16.00% 13.00%
2-3 12.00% 10.50%
3-4 10.00% 9.00%
4-5 8.00% 8.00%
5-6 6.00% 7.00%
6-7 5.00% 7.00%
7-8 5.00% 6.00%
8-13 4.00% 6.00%
14 & Over 3.00% 6.00% DEATH BEFORE RETIREMENT: The rates of mortality for the period before retirement are according to the RP-2000 Combined Mortality Table projected with Scale BB to 2013 (multiplied by 50% for males and 30% for females). DEATH AFTER RETIREMENT: The rates of mortality for the period after service retirement are according to the RP-2000 Combined Mortality Table projected with Scale BB to 2013 (set back 1 year for females) for all healthy retired members and beneficiaries. The RP-2000 Combined Disabled Mortality Table projected with Scale BB to 2013 (set back 4 years for males) is used for the period after disability retirement. These assumptions are used to measure the probabilities of each benefit payment being made after retirement. These assumptions contain margin for mortality improvements. PERCENT MARRIED: 100% of employees are assumed to be married, with the wife 3 years younger than the husband. DEPENDENT CHILDREN: For hazardous members’ duty-related death benefits, it is assumed that the member is survived by two dependent children each age 6. FORM OF PAYMENT: Participants are assumed to elect a life-only form of payment. ASSET VALUATION METHOD: For funding purposes, five-year market related actuarial value, as developed in Schedule B. The actuarial value of assets recognizes a portion of the difference between the market value of assets and the expected actuarial value of assets, based on the ultimate assumed valuation rate of return. The amount recognized each year is 20% of the difference between market value and expected actuarial value. For GASB 67 purposes only, market value of assets.

Page 33
ACTUARIAL COST METHOD: Costs were determined using the Entry Age Normal, Level Percentage of Pay Actuarial Cost Method. Under this method, a calculation is made for retirement benefits to determine the uniform and constant percentage rate of contribution which, if applied to the compensation of the average new member during the entire period of his or her anticipated covered service, would be required to meet the cost of benefits payable. Actuarial gains and losses are reflected in the unfunded actuarial accrued liability.