gasb statement no. 75 report for the connecticut …
TRANSCRIPT

GASB STATEMENT NO. 75 REPORT
FOR THE
CONNECTICUT STATE TEACHERS’ RETIREMENT SYSTEM
RETIREE HEALTH INSURANCE PLAN
PREPARED AS OF JUNE 30, 2019
SR_GASB7519_200306

February 19, 2020
Board of Directors Connecticut State Teachers’ Retirement System 765 Asylum Avenue Hartford, CT 06105
Re: June 30, 2019 GASB Statement No. 75 Report for the Retiree Health Insurance Plan of the Connecticut State Teachers’ Retirement System
Members of the Board:
This financial accounting report provides the information that the Connecticut State Teachers’ Retirement System (the System) should use to satisfy the requirements described in Governmental Accounting Standards Board (GASB) Statement No. 75 for the System’s Retiree Health Insurance Plan (the Plan). This report has been prepared by the System’s actuary, Cavanaugh Macdonald Consulting (CMC), as of June 30, 2019 (Measurement Date) for financial reporting as of June 30, 2020.
GASB Statement No. 75 (GASB 75) establishes accounting and financial reporting requirements for governmental employers who sponsor or participate in other postemployment benefits (OPEB) plans. In general, the GASB 75 rules that apply to postretirement benefit plans are designed to help plan sponsors adequately and systematically account for plan costs, facilitate comparisons of plan sponsor financial information by standardizing certain aspects of postretirement benefit plan asset and liability measurement, and improve the utility of financial statement information by requiring that plan sponsors provide certain information about their OPEB plans.
Additional Information and Disclosures
The information contained in this report is intended to be used by the System for financial accounting purposes for the fiscal year ending on June 30, 2020 and its use for other purposes may not be appropriate. Calculations for purposes other than satisfying the requirements of GASB 75 may produce significantly different results. This report supersedes all June 30, 2020 financial reporting results, including draft versions of this document, issued prior to the date of this report. The System should rely only on the June 30, 2020 (as of FYE 2019) financial accounting information provided herein.
The results contained in this report were prepared by qualified actuaries according to generally accepted actuarial principles and practices, and in compliance with Actuarial Standards of Practice issued by the Actuarial Standards Board. The financial accounting information provided in this report reflects our current understanding of GASB Statement Nos. 74 and 75 (GASB accounting rules), including any applicable guidance provided by the System or its audit partners as of the date of this report.
Off
Cavanaugh Macdonald CC OO NN SS UU LL TT II NN GG,, LL LL CC
The experience and dedication you deserve
3550 Busbee Pkwy, Suite 250, Kennesaw, GA 30144 Phone (678) 388-1700 • Fax (678) 388-1730
www.CavMacConsulting.com Offices in Kennesaw, GA • Bellevue, NE

Board of Directors February 19, 2020 Page 2
The biennial actuarial valuation used as the basis for much of the information presented in this report was performed as of June 30, 2018 (Valuation Date). The census data for active and retired members as of the Valuation Date, changes in plan provisions since the prior Valuation Date, the net benefits and administrative expenses paid during the fiscal year beginning on July 1, 2018 and ending on June 30, 2019, and pertinent financial information was provided by the System for actuarial valuation and financial accounting purposes. We did not audit the supplied information, but it was reviewed for reasonableness and consistency. In certain situations, the supplied information was adjusted to account for normal differences in collection dates and/or methods. As a result, we have no reason to doubt the substantial accuracy or completeness of the information and believe that it is reliable for the purposes stated herein. The results and conclusions contained in this report depend on the integrity of this information, and if any of the supplied information or analyses change, our results and conclusions may be different and this report may need to be revised. Likewise, this information may need to be revised to reflect any significant event that affects the Plan subsequent to the Valuation Date.
All assumptions used for GASB 75 purposes—including, but not limited to, discount rates, expected rates of return on assets, expected annual per capita claims, long-term health care cost trend rates, and expected active employee and retired member health care coverage election assumptions—should reflect best estimates of anticipated Plan experience. The discount rate was determined based on the methods prescribed by GASB accounting rules. Other than the discount rate required under GASB 75, we believe that those assumptions selected for financial accounting and reporting purposes as of June 30, 2019 and June 30, 2020, respectively, are reasonable for their intended purposes.
The actuarial cost method, the asset valuation method, and the amortization methods are prescribed under GASB rules for financial accounting purposes as of the Measurement Date. Actuarial methods, such as the actuarial cost method, asset valuation method, and amortization methods, used in the cost allocation procedure (for financial accounting purposes) are designed to recognize changes in an orderly fashion over a period of years. In certain situations, the actuarial methods used in an allocation procedure may have the effect of deferring changes in amounts into later years. Likewise, the use of these methods could produce deferred gains or losses if any material underlying assumption is not met over an extended period of time.
Future actuarial measurements may differ significantly from the current measurements presented in this report due to such factors as the following: retiree group benefits program experience differing from that anticipated by the assumptions; changes in assumptions; increases or decreases expected as part of the natural operation of the methodology used for these measurements (such as the end of an amortization period or additional cost or contribution requirements based on the plan’s funded status); and changes in retiree group benefits program provisions or applicable law. Retiree group benefits models necessarily rely on the use of approximations and estimates, and are sensitive to changes in these approximations and estimates. Small variations in these approximations and estimates may lead to significant changes in actuarial measurements. Since an assessment of the potential impact of variations in factors other than discount rates and health care cost trend rates is outside the scope of typical financial reporting requirements, we have not performed any analysis of the potential range of such future differences. This report does not consider all possible scenarios.
The funded status measurements included in this report are based on the assumptions and methods used to determine the Plan’s obligations and asset values as of the Valuation and/or Measurement Date(s). Funded status measurements for financial accounting purposes may not be appropriate for assessing the sufficiency of Plan assets to cover the estimated cost of settling the Plan’s benefit obligations. Likewise, funded status measurements for financial accounting purposes may not be appropriate for assessing the need for or the amount of future actuarially determined contributions.

Board of Directors February 19, 2020 Page 3
CMC does not provide legal, investment, or accounting advice. Thus, the information in this report is not intended to supersede or supplant the advice and interpretations of the System or its affiliated legal, investing, or accounting partners.
The undersigned is familiar with the near-term and long-term aspects of other postemployment benefit plan valuations and meets the Qualification Standards of the American Academy of Actuaries necessary to render the actuarial opinions contained in this report. All sections of this report, including any appendices and attachments, are considered an integral part of the actuarial opinions.
To the best of our knowledge, no executive or employee of CMC providing services to the System has any direct financial interest or indirect material interest in the System. As a result, we believe that there is no relationship existing that might affect our capacity to prepare and certify these estimates for the System’s Plan as of June 30, 2019.
Please call us at 678-388-1700 if you have any questions.
Respectfully submitted,
Bradley R. Wild, ASA, FCA, MAAA Alisa Bennett, FSA, EA, FCA, MAAA Senior Actuary President
BW/AB:nh

Connecticut State Teachers’ Retirement System
Cavanaugh Macdonald Consulting, LLC
Table of Contents
Section I — Board Summary......................................................................................................................... 1
Section II — Introduction ............................................................................................................................... 2
Section III — Schedule of Changes in the Collective Net OPEB Liability / (Asset) ...................................... 7
Section IV — Balances of Collective Deferred Outflows / (Inflows) of Resources ....................................... 9
Section V — Collective OPEB Expense / (Income) .................................................................................... 11
Section VI — Financial Statement Note Disclosures .................................................................................. 12
Section VII — Required Supplementary Information .................................................................................. 17
Section VIII — Schedule of Employer Allocations as of June 30, 2019 ..................................................... 20
Schedule A — Additional Supporting Information ....................................................................................... 26
Schedule B — Summary of Actuarial Assumptions and Methods for GASB Accounting Purposes .......... 28
Schedule C — Summary of Actuarial Cost and Asset Valuation Methods ................................................. 39
Schedule D — Summary of Main Plan Provisions for Valuation Purposes ................................................ 40
Connecticut State Teachers’ Retirement System
Cavanaugh Macdonald Consulting, LLC Page 1
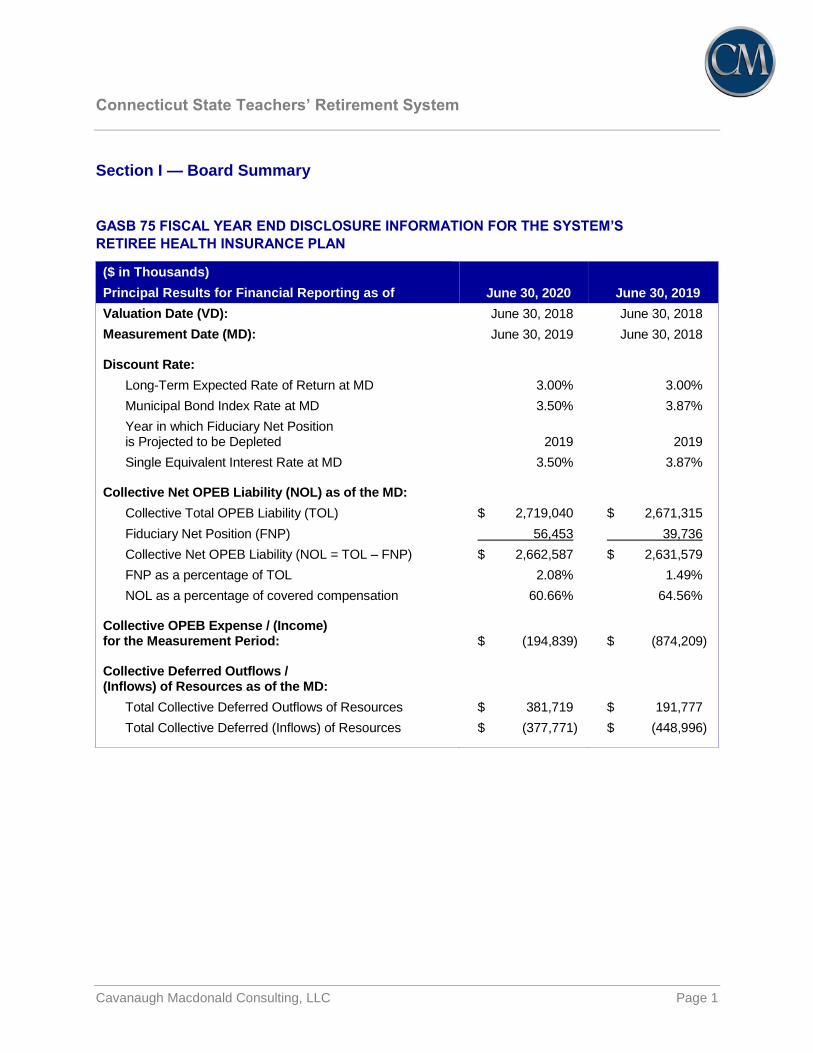
Section I — Board Summary
GASB 75 FISCAL YEAR END DISCLOSURE INFORMATION FOR THE SYSTEM’S
RETIREE HEALTH INSURANCE PLAN
($ in Thousands)
Principal Results for Financial Reporting as of June 30, 2020 June 30, 2019
Valuation Date (VD): June 30, 2018 June 30, 2018
Measurement Date (MD): June 30, 2019 June 30, 2018
Discount Rate:
Long-Term Expected Rate of Return at MD 3.00% 3.00%
Municipal Bond Index Rate at MD 3.50% 3.87%
Year in which Fiduciary Net Position is Projected to be Depleted 2019 2019
Single Equivalent Interest Rate at MD 3.50% 3.87%
Collective Net OPEB Liability (NOL) as of the MD:
Collective Total OPEB Liability (TOL) $ 2,719,040 $ 2,671,315
Fiduciary Net Position (FNP) 56,453 39,736
Collective Net OPEB Liability (NOL = TOL – FNP) $ 2,662,587 $ 2,631,579
FNP as a percentage of TOL 2.08% 1.49%
NOL as a percentage of covered compensation 60.66% 64.56%
Collective OPEB Expense / (Income) for the Measurement Period: $ (194,839) $ (874,209)
Collective Deferred Outflows / (Inflows) of Resources as of the MD:
Total Collective Deferred Outflows of Resources $ 381,719 $ 191,777
Total Collective Deferred (Inflows) of Resources $ (377,771) $ (448,996)

Connecticut State Teachers’ Retirement System
Cavanaugh Macdonald Consulting, LLC Page 2
Section II — Introduction The Governmental Accounting Standards Board issued Statement No. 75 (GASB 75), “Accounting and
Financial Reporting for Postemployment Benefit Plans Other Than Pensions” in June 2015. GASB 75 is
effective for employer fiscal years beginning after June 15, 2017. For the purposes of reporting under
GASB 75, the Plan is assumed to be a cost-sharing, other than insured, defined benefit OPEB plan with a
special funding situation where assets are accumulated in a trust that meets the criteria in paragraph 4 of
GASB 75. Additionally, we have assumed that the System will not restate results for any period prior to the
adoption of GASB 75 based on the guidance in paragraph 244 of that Standard.
This report, prepared as of June 30, 2019 (Measurement Date or MD), presents information to assist the
System in meeting the requirements of GASB 75. Much of the material provided in this report is based on
the data, assumptions, plan provisions, and results of the actuarial valuation of the Plan as of June 30, 2018
(Valuation Date or VD).
GASB 75 requires the plan sponsors to determine the Total OPEB Liability (TOL) utilizing the Entry Age
Normal (EAN) actuarial funding method. If the valuation date at which the TOL is determined is before the
measurement date, the TOL must be rolled forward to the measurement date. The plan provisions
recognized in the determination of the TOL are summarized in Schedule D. The development of the
changes in the TOL during the measurement period is shown in Section III.
If a financial accounting asset exists, a Collective Net OPEB Liability / (Asset) (NOL), which is equal to the
difference between the actual/projected TOL and the Plan’s Fiduciary Net Position (FNP)—the market value
of the financial accounting asset—must be determined as of the Measurement Date.
The discount rate is an important assumption used in the measurement of the TOL, and the guidance
concerning discount rate selection provided in GASB 75 varies based on whether or not the plan has a
financial accounting asset. The environment for yields on 20-year tax-exempt municipal bonds (rating
AA/Aa or higher) on the measurement date (Municipal Bond Index Rate) could affect discount rates in either
case, so the plan sponsor must choose an appropriate basis for these Municipal Bond Index Rates. The
Municipal Bond Index Rate used for this purpose is the 20-Bond average General Obligation 20-year
Municipal Bond Rate published at the end of the last week during the month of June by The Bond Buyer
(www.bondbuyer.com).
If the plan does not have a financial accounting asset, the plan sponsor must select a discount rate based
solely on the Municipal Bond Index Rate. However, if the plan has assets that are accumulated in a Trust
that meets the criteria in paragraph 4 of GASB 75, the plan sponsor must select a discount rate based on
the Single Equivalent Interest Rate (SEIR) for the plan.
To determine the SEIR, the FNP must be projected into the future for as long as there are anticipated
benefits payable to members and beneficiaries under the relevant plan provisions in effect on the
measurement date. Future contributions must be projected in accordance with the plan’s funding policy
and/or the application of professional judgment in situations where the recent contribution history of the
contributing entities warrants detailed consideration. If the FNP is not projected to be depleted at any point
in the future, the long term expected rate of return on plan investments expected to be used to finance the
benefit payments may be used as the SEIR.

Connecticut State Teachers’ Retirement System
Cavanaugh Macdonald Consulting, LLC Page 3
Conversely, if the FNP is projected to be depleted on any future measurement date, the SEIR will be equal
to the single rate that generates a present value of benefit payments equal to the sum of the present value
determined by discounting all projected benefit payments through the date of depletion based on the long-
term expected rate of return on plan investments, and the present value determined by discounting those
benefits after the date of depletion by the Municipal Bond Index Rate on the measurement date.
The changes reflected in the TOL and FNP during the measurement period are shown in Section III.
Differences between expected and actual experience and changes of assumptions or other inputs, if any,
are recorded as Collective Deferred Outflows of Resources if the change increases the Plan’s TOL, or
Collective Deferred Inflows of Resources if the change reduces the Plan’s TOL.
Schedule A shows the development of the Plan’s projected earnings on plan investments, and the
determination of the difference between actual and projected earnings on plan investments during the
measurement period. Differences between actual and projected earnings on plan investments, if any, are
recorded as Collective Deferred Outflows of Resources if the change lowers the FNP, or Collective Deferred
Inflows of Resources if the change increases the FNP.
Collective Deferred Outflows of Resources and Collective Deferred Inflows of Resources are usually
recognized on a level dollar basis without any adjustments for interest. The unrecognized portions of the
Collective Deferred Outflows of Resources and Collective Deferred Inflows of Resources that must be
included on the Statement of Net Position are provided in Section IV.

Connecticut State Teachers’ Retirement System
Cavanaugh Macdonald Consulting, LLC Page 4
GASB 75 requires the determination and disclosure of the Collective OPEB Expense / (Income) (OE) for
the Plan in the notes to financial statements. Generally speaking, OE includes the following components:
COMPONENTS OF COLLECTIVE OPEB EXPENSE / (INCOME)
+ Service Cost (SC)
This is equal to the Normal Cost determined using the Entry Age Normal (Level
Percentage of Pay) actuarial cost method.
‒ Active Member Contributions
The total amount of active employee payroll deductions for OPEB benefits, if
applicable.
+ Administrative Expenses
The amount, if any, paid during the measurement period for OPEB costs not directly
related to the payment of benefits. This amount would include costs such as actuarial
fees, audit fees, trust fees, salaries associated with staff time spent on OPEB related
tasks, etc.
+ / ‒ Changes of Benefit Terms
Benefit changes during the period are recognized immediately. Plan amendments
increase OE if the change improves benefits for existing Plan members. Likewise,
changes that reduce benefits for existing Plan members lower OE.
+ Interest on the Collective Total OPEB Liability (IOT)
IOT is determined based on the Discount Rate that was used to measure the Plan’s
TOL as of the Prior Measurement Date. Please note that the SC component may
include interest to the end of the measurement period, or this interest adjustment may
be included with IOT.
‒ Projected Earnings on Plan Investments (XR)
If the Plan has a financial accounting asset, XR is determined based on the long-term
expected rate of return assumption at the end of the prior measurement period.
+ / ‒ Other
Miscellaneous and non-standard expense items are included in this component.

Connecticut State Teachers’ Retirement System
Cavanaugh Macdonald Consulting, LLC Page 5
COMPONENTS OF COLLECTIVE OPEB EXPENSE / (INCOME)
+ / ‒ Recognition of Current Period
Collective Deferred Outflows / (Inflows) of Resources for:
— Differences Between Expected and Actual Experience
— Changes of Assumptions or Other Inputs
— Differences Between Actual and Projected Earnings on Plan Investments
Please note that the results provided in this report reflect the following conventions:
Experience losses (“positive amounts”) increase the balances of Collective Deferred
Outflows of Resources, and amounts recognized increase OPEB expense.
Experience gains (“negative amounts”) decrease the balances of Collective Deferred
Inflows of Resources, and amounts recognized decrease OPEB expense.
For differences between expected and actual experience and changes of assumptions
or other inputs, the amounts that must be recognized during the current period are
determined by spreading the total changes over the average expected remaining
service lives (AERSL) of the entire Plan membership at the beginning of the
measurement period. The active member AERSL is the average number of years that
the active members are expected to remain in covered employment. AERSL is equal
to zero for inactive members. The AERSL of the entire Plan membership is the
weighted average of these two values, but cannot be less than one year1. The
development of the AERSL as of the Prior Measurement Date is shown in Schedule A.
For differences between actual and projected earnings on plan investments, if any, the
amount that must be recognized during the current period is determined by amortizing
the total change over five (5) years.
+ Recognition of Prior Period Collective Deferred Outflows of Resources
The amounts that must be recognized during the current year for those Collective
Deferred Outflows of Resources established before the current measurement period.
‒ Recognition of Prior Period Collective Deferred (Inflows) of Resources
The amounts that must be recognized during the current year for those Collective
Deferred (Inflows) of Resources established before the current measurement period.
The development of the OE is shown in Section V.
Generally speaking, each contributing entity must report an allocation (proportionate share) of the collective
financial accounting amounts associated with a cost-sharing defined benefit OPEB plan. However, the
State of Connecticut (State) makes all contributions to the Plan on behalf of the employees of the
participating districts. Therefore, our understanding is that the participating districts (employers) are
considered to be in a special funding situation as defined by GASB 75 and the State is treated as a
1 Based on the guidance in GASB Implementation Guide 2017-3, paragraph 4.264.

Connecticut State Teachers’ Retirement System
Cavanaugh Macdonald Consulting, LLC Page 6
governmental non-employer contributing entity in the System. Since employers do not contribute directly
to the Plan, we believe that the participating districts would not be required to report proportionate shares
of the Plan’s NOL or Collective Deferred Outflows or (Inflows) of Resources in their financial statements.
However, each employer must disclose its share of the NOL (i.e. the non-employer contributing entities’
total proportionate share of the NOL that is associated with the employer) in the notes to its financial
statements, and would also be required to provide information about the Plan in its note disclosures and
schedules of Required Supplementary Information (RSI). Additionally, each district must recognize
expense and record revenue equal to the district’s share of the OE for the Plan (i.e. the non-employer
contributing entities’ total proportionate share of the Collective OPEB Expense / (Income) associated with
the district). The State—as the sole (non-employer) contributing entity—would report the entire NOL,
Collective Deferred Outflows and Inflows of Resources, and OE for the Plan.
Section VI provides the actuarial information for the Plan that must be disclosed for financial reporting
purposes. Section VII provides the RSI for the reporting entity’s financial statements.
Section VIII of this report shows the total amount of employer contributions from the State as support
provided to the districts for the year ending June 30, 2019. Section VIII also shows the proportionate share
percentages that have been determined based on these contributions.
Based on these percentages we have determined the proportionate share amounts of the NOL associated
with each participating employer and the employer OE and revenue for State support for each participating
employer for the year ending June 30, 2019. These amounts are also provided in Section VIII.
The appendices (Schedules) contain additional details and in-depth information. As a final reminder, please
keep in mind that any information that may be included in this report for periods prior to June 30, 2010 was
produced by the prior actuarial consulting firm.

Connecticut State Teachers’ Retirement System
Cavanaugh Macdonald Consulting, LLC Page 7
Section III — Schedule of Changes in the Collective Net OPEB Liability / (Asset) The tables below provide the changes in the Collective Total OPEB Liability (TOL), the Fiduciary Net Position (FNP), and the Collective Net OPEB
Liability / (Asset) (NOL) during the current measurement period that must be disclosed under GASB accounting rules, as well as the most recent
five years of the 10-year schedule of changes in the TOL, FNP, NOL, and related ratios that must be included in Required Supplementary Information
(RSI). We have assumed that the System will not restate results for any period prior to the adoption of GASB 74 or 75, so only results for the years
since adoption are shown. Additional periods within the five year window will be added in the future.
Reconciliation of Changes in the Plan’s Collective Total OPEB Liability (TOL)
($ in Thousands)
Fiscal Years Ending on June 30 2019 2018 2017 2016 2015
Collective Total OPEB Liability (TOL)
Service Cost $ 87,313 $ 132,392 $ 148,220
Interest on the TOL 105,702 133,597 111,129
Changes of benefit terms (339,076) (1,044,628) 0
Difference between expected and actual experience 66,502 217,853 0
Changes of assumptions or other inputs 182,438 (196,049) (370,549)
Net benefit payments (55,154) (110,622) (84,071)
Net change in TOL $ 47,725 $ (867,457) $ (195,271)
TOL—beginning of period $ 2,671,315 $ 3,538,772 $ 3,734,043
TOL—end of period $ 2,719,040 $ 2,671,315 $ 3,538,772

Connecticut State Teachers’ Retirement System
Cavanaugh Macdonald Consulting, LLC Page 8
Reconciliation of Changes in the Plan’s Fiduciary Net Position (FNP) and Collective Net OPEB Liability / (Asset) (NOL)
($ in Thousands)
Fiscal Years Ending on June 30 2019 2018 2017 2016 2015
TOL—end of period (a) $ 2,719,040 $ 2,671,315 $ 3,538,772
Fiduciary Net Position (FNP)
Contributions – State of Connecticut $ 35,320 $ 35,299 $ 19,922
Contributions – active member 51,944 51,484 50,436
Net investment income 1,090 411 369
Net benefit payments (55,154) (110,622) (84,071)
Administrative expenses (383) (264) (150)
Other (16,100) 0 42
Net change in FNP $ 16,717 $ (23,692) $ (13,452)
FNP—beginning of period $ 39,736 $ 63,428 $ 76,880
FNP—end of period (b) $ 56,453 $ 39,736 $ 63,428
FNP as a percentage of the TOL [(b) / (a)] 2.08% 1.49% 1.79%
Collective Net OPEB Liability / (Asset) (NOL)
NOL—end of period [(a) – (b)] $ 2,662,587 $ 2,631,579 $ 3,475,344
Covered Payroll1 $ 4,389,654 $ 4,075,939 $ 4,279,755
NOL as a percentage of Covered Payroll 60.66% 64.56% 81.20%
1 Covered Payroll provided by the System for active employees who would be eligible for benefits at retirement.

Connecticut State Teachers’ Retirement System
Cavanaugh Macdonald Consulting, LLC Page 9
Section IV — Balances of Collective Deferred Outflows / (Inflows) of Resources The following tables provide the balances of Collective Deferred Outflows and (Inflows) of Resources that
are reported for current and prior period differences between expected and actual experience, changes of
assumptions or other inputs, and differences between actual and projected earnings on plan investments.
The information in the tables reflects the assumptions and other conventions listed below. This presentation
is designed to facilitate the development of Collective OPEB Expense / (Income) (OE), and should not be
used for financial reporting purposes without appropriate adjustments. Please note that the contributing
entities may be required to report Collective Deferred Outflows / (Inflows) of Resources for contributions
made subsequent to the measurement date and prior to the end of the reporting period; however, CMC will
not provide or incorporate these amounts in the tables included in this section of the report.
No differences between expected and actual experience, changes of assumptions or other inputs, or
differences between actual and projected earnings on plan investments during measurement periods
ending prior to June 30, 2017 are being recognized.
Experience losses are presented as positive amounts. Experience gains are presented as negative
amounts.
Collective Deferred Outflows of Resources are presented as positive amounts. Collective Deferred
(Inflows) of Resources are presented as negative amounts.
Experience losses (“positive amounts”) increase the balances of Collective Deferred Outflows of
Resources, and amounts recognized increase OE. Experience gains (“negative amounts”) decrease
the balances of Collective Deferred (Inflows) of Resources, and amounts recognized decrease OE.
The table below provides a summary of the unrecognized balances of Collective Deferred Outflows of
Resources and (Inflows) of Resources by source as of June 30, 2019:
($ in Thousands)
Collective Deferred Outflows
of Resources
Collective Deferred (Inflows)
of Resources
Differences between expected and actual experience $ 220,799 $ 0
Changes of assumptions or other inputs 159,576 (377,771)
Differences between projected and actual earnings on plan investments 1,344 0
Total unrecognized balance as of June 30, 2019 $ 381,719 $ (377,771)

Connecticut State Teachers’ Retirement System
Cavanaugh Macdonald Consulting, LLC Page 10
Balances of Collective Deferred Outflows / (Inflows) of Resources by Source and Year
($ Thousands)
Measurement Period Ending
(a)
Initial Experience
(Gain) / Loss Amount
(b)
Initial Recognition
Period (Years)
(c)
Initial Recognition
Amount [(a) ÷ (b)]
(d)
Amounts Recognized in
Collective OPEB Expense through
June 30, 2019
Balances as of June 30, 2019
Collective Deferred Outflows
of Resources
[(a) – (d), > 0]
Collective Deferred (Inflows)
of Resources
[(a) – (d), < 0]
Collective Deferred Outflows / (Inflows) of Resources for Differences Between Expected and Actual Experience:
2017 $ 0 7.99 $ 0 $ 0 $ 0 $ 0
2018 $ 217,853 7.89 $ 27,611 $ 55,222 $ 162,631 $ 0
2019 $ 66,502 7.98 $ 8,334 $ 8,334 $ 58,168 $ 0
$ 35,945 $ 220,799 $ 0
Collective Deferred Outflows / (Inflows) of Resources for Changes in Assumptions or Other Inputs:
2017 $ (370,549) 7.99 $ (46,377) $ (139,131) $ 0 $ (231,418)
2018 $ (196,049) 7.89 $ (24,848) $ (49,696) $ 0 $ (146,353)
2019 $ 182,438 7.98 $ 22,862 $ 22,862 $ 159,576 $ 0
$ (48,363) $ 159,576 $ (377,771)
Collective Deferred Outflows / (Inflows) of Resources for Differences Between Projected and Actual Earnings on Plan Investments:
2017 $ 1,512 5.00 $ 302 $ 906 $ 606 $ 0
2018 $ 784 5.00 $ 157 $ 314 $ 470 $ 0
2019 $ 335 5.00 $ 67 $ 67 $ 268 $ 0
$ 526 $ 1,344 $ 0

Connecticut State Teachers’ Retirement System
Cavanaugh Macdonald Consulting, LLC Page 11
Section V — Collective OPEB Expense / (Income) The development of the Collective OPEB Expense / (Income) for the financial reporting period ending on
June 30, 2020 is shown in the following table:
Collective OPEB Expense / (Income) For the Fiscal Year Ending on June 30, 2020
($ in Thousands)
Service cost $ 87,313
Active member contributions (51,944)
Administrative costs* 383
Changes of benefit terms during the current period (339,076)
Interest on the TOL 105,702
Projected earnings on plan investments (1,425)
Other 16,100
Recognition of current period Collective Deferred Outflows / (Inflows) of Resources:
Difference between expected and actual experience 8,334
Changes of assumptions or other inputs 22,862
Difference between actual and projected earnings on plan investments 67
Recognition of prior period Collective Deferred Outflows of Resources 28,070
Recognition of prior period Collective Deferred (Inflows) of Resources (71,225)
Collective OPEB Expense / (Income) $ (194,839)
* Administrative costs are based on the administrative expenses paid from the Plan’s
trust during the fiscal year ending on June 30, 2019.

Connecticut State Teachers’ Retirement System
Cavanaugh Macdonald Consulting, LLC Page 12
Section VI — Financial Statement Note Disclosures This section contains financial accounting information that may be used to satisfy the reporting
requirements for employers and governmental nonemployer contributing entities (GNCEs) under
Governmental Accounting Standards Board Statement No. 75 (GASB 75) for the year ending on June 30,
2020, based on a June 30, 2018 valuation date. The Plan is assumed to be cost-sharing, other than
insured, defined benefit OPEB plan with a special funding situation where assets are accumulated in a trust
that meets the criteria in paragraph 4 of GASB 75. Additionally, we have assumed that the System will not
restate results for any period prior to the adoption of GASB 75 based on the guidance in paragraph 244 of
that Standard. Amounts are shown in aggregate. This report does not include any non-actuarial items that
may need to be reported or disclosed.
Summary of Key Actuarial Assumptions, Methods, and Other Inputs
The TOL was determined by an actuarial valuation as of June 30, 2018, using the key actuarial
assumptions, methods, and other inputs listed below. Please note that the complete set of actuarial
assumptions, methods, and other inputs that were used to develop the TOL are provided in Schedule B.
Inflation 2.50%
Real Wage Growth 0.75%
Wage Inflation 3.25%
Salary Increases, Including Wage Inflation 3.25% - 6.50%
Long-term Investment Rate of Return, Net of OPEB Plan Investment Expense, Including Inflation
3.00%
Municipal Bond Index Rate 3.50%
Year FNP is Projected to be Depleted 2019
Single Equivalent Interest Rate, Net of OPEB Plan Investment Expense, Including Price Inflation
3.50%
Health Care Cost Trend Rates
Medicare Supplement Plan Options
Claims / Member Contributions
5.95% for 2018, decreasing to an ultimate rate of 4.75% by 2025
Medicare Advantage Plan Options
Claims
5.00% for 2018, decreasing to an ultimate rate of 4.75% by 2028
Member Contributions
0.00% for 2018 and 2019, increasing to 5.00% for 2020, and decreasing to an ultimate rate of 4.75% by 2028
Local School District Subsidies
0.00% for members / dependents who are receiving the maximum subsidy;
Otherwise, 5.95% for 2018, decreasing to an ultimate rate of 0.00% when the maximum subsidy is reached

Connecticut State Teachers’ Retirement System
Cavanaugh Macdonald Consulting, LLC Page 13
Health care cost trend rates are set on an annual basis based on published annual health care inflation
surveys in conjunction with actual plan experience (if credible), building block models and heuristics
developed by health plan actuaries and administrators, and the views of experts who are familiar with the
System’s Plan and/or similar plan offerings. Effective June 30, 2018, the health care cost trend rates for the
Medicare Supplement and Medicare Advantage medical and prescription drug options were revised to
reflect current expectations of future increases in health care claim costs for those options.
Mortality rates were based on the RPH-2014 White Collar table with employee and annuitant rates blended
from ages 50 to 80, projected to the year 2020 using the BB improvement scale, and further adjusted to
grade in increases (5% for females and 8% for males) to rates over age 80 for the period after service
retirement and for dependent beneficiaries as well as for active members. The RPH-2014 Disabled Mortality
Table projected to 2017 using the MP-2014 improvement scale is used for the period after disability
retirement.
The demographic actuarial assumptions for retirement, disability incidence, and withdrawal used in the
June 30, 2018 valuation were based on the results of an actuarial experience study for the period
July 1, 2010 – June 30, 2015. The actuarial economic assumptions used in the June 30, 2018 valuation
were based on the results of a study of economic assumptions for use in actuarial valuations report dated
April 24, 2019.
The remaining actuarial assumptions (e.g., initial per capita costs, rates of plan participation, rates of plan
election, etc.) used in the June 30, 2018 valuation are based on a review of recent plan experience that
was performed concurrently with the June 30, 2018 valuation and/or based on anticipated changes in
participant behavior following the change of benefit terms, effective January 1, 2019, that was adopted by
the System on September 12, 2018, and communicated to members prior to January 1, 2019.
The State does not have a formal funding policy intended to fully fund OPEB benefits. The State does have
statutory obligation to fund one-third of the base plan of the Health Plan and the Prescription Plan.
The long-term expected return on plan assets is reviewed as part of the GASB 75 valuation process.
Several factors are considered in evaluating the long-term rate of return assumption, including the Plan’s
current asset allocations and a log-normal distribution analysis using the best-estimate ranges of expected
future real rates of return (expected return, net of investment expense and inflation) for each major asset
class compiled by Horizon Actuarial Services, LLC in its “Survey of Capital Market Assumptions, 2019
Edition”. The long-term expected rate of return was determined by weighting the expected future real rates
of return by the target asset allocation percentage and then adding expected inflation. The assumption is
not expected to change absent a significant change in the asset allocation, a change in the inflation
assumption, or a fundamental change in the market that alters expected returns in future years.

Connecticut State Teachers’ Retirement System
Cavanaugh Macdonald Consulting, LLC Page 14
The target asset allocation and best estimates of geometric real rates of return for each major asset class
are summarized in the following table:
Asset Class Target
Allocation
Expected 10-Year Geometric Real Rate of Return
Standard Deviation
U.S. Treasuries (Cash Equivalents) 100.00%* 0.41% 2.31%
Price Inflation 2.50%
Expected Rate of Return 1.0041 x 1.0250 – 1 = 2.92%
Expected Rate of Return (Rounded Nearest 0.25%) 3.00%
*All of the Plan’s assets are assumed to be invested in cash equivalents given the need for liquidity.
DEVELOPMENT OF THE DISCOUNT RATE (SEIR)
The projection of cash flows used to determine the discount rate was performed in accordance with
GASB 75. The basis for this projection was the actuarial valuation performed as of June 30, 2018. In
addition to the actuarial methods and assumptions of the June 30, 2018 actuarial valuation, the following
actuarial methods and assumptions were used in the projection of cash flows:
Total payroll for the initial projection year consists of the payroll of the active membership present on
the Valuation Date. In subsequent projection years, total payroll was assumed to increase annually at
a rate of 3.25%.
Employee contributions were assumed to be made at the current member contribution rate, and were
first applied to reduce applicable service costs for these members.
No future State contributions were assumed to be made.
Based on these assumptions, the Plan’s FNP was projected to be depleted in 2019 and, as a result, the
Municipal Bond Index Rate was used in the determination of the SEIR. In this analysis, the long-term
expected rate of return on Plan investments equal to 3.00% was applied to periods through 2019 and the
Municipal Bond Index Rate as of the Measurement Date (3.50%) was applied to periods on or after 2019,
resulting in an SEIR equal to 3.50% as of the Measurement Date.
Please note that the FNP projections are based upon the Plan’s financial status on the Valuation Date, the
indicated set of methods and assumptions, and the requirements of GASB 75. As such, the FNP projections
are not reflective of the cash flows and asset accumulations that would occur on an ongoing plan basis,
reflecting the impact of future members. Therefore, the results of this test do not necessarily indicate
whether or not the fund will actually run out of money, the financial condition of the Plan, or the Plan’s ability
to make benefit payments in future years.
Connecticut State Teachers’ Retirement System
Cavanaugh Macdonald Consulting, LLC Page 15
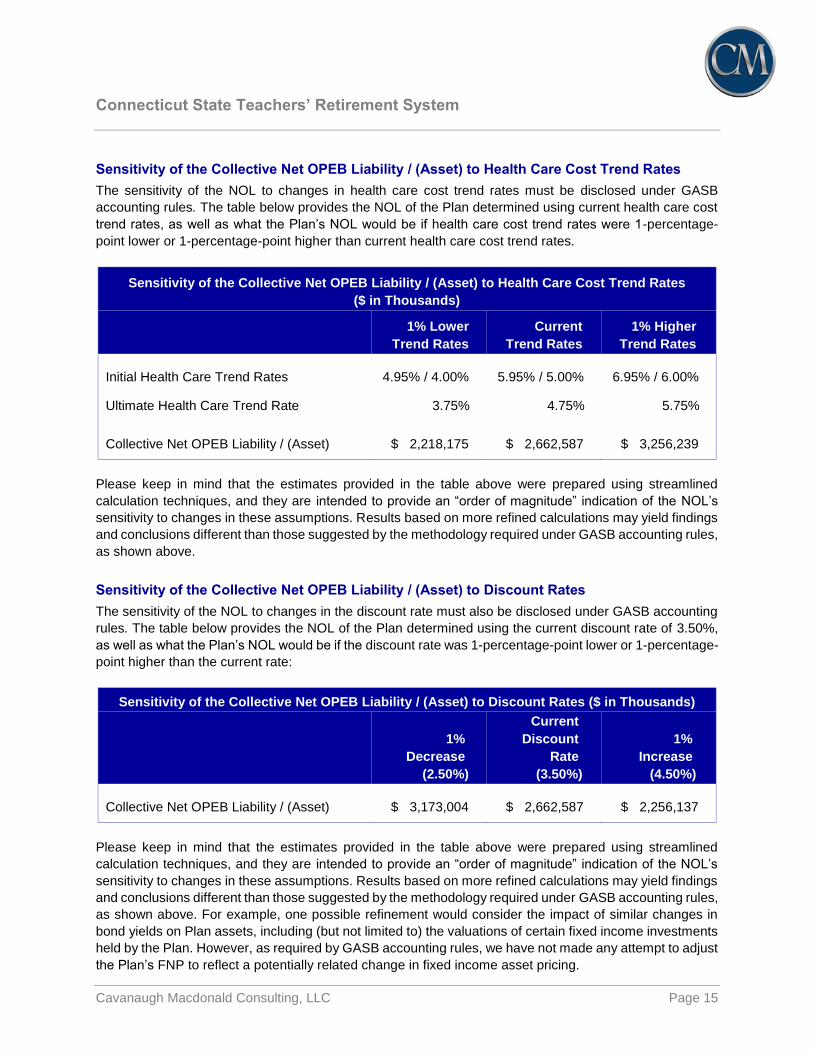
Sensitivity of the Collective Net OPEB Liability / (Asset) to Health Care Cost Trend Rates
The sensitivity of the NOL to changes in health care cost trend rates must be disclosed under GASB
accounting rules. The table below provides the NOL of the Plan determined using current health care cost
trend rates, as well as what the Plan’s NOL would be if health care cost trend rates were 1-percentage-
point lower or 1-percentage-point higher than current health care cost trend rates.
Sensitivity of the Collective Net OPEB Liability / (Asset) to Health Care Cost Trend Rates
($ in Thousands)
1% Lower
Trend Rates
Current
Trend Rates
1% Higher
Trend Rates
Initial Health Care Trend Rates 4.95% / 4.00% 5.95% / 5.00% 6.95% / 6.00%
Ultimate Health Care Trend Rate 3.75% 4.75% 5.75%
Collective Net OPEB Liability / (Asset) $ 2,218,175 $ 2,662,587 $ 3,256,239
Please keep in mind that the estimates provided in the table above were prepared using streamlined
calculation techniques, and they are intended to provide an “order of magnitude” indication of the NOL’s
sensitivity to changes in these assumptions. Results based on more refined calculations may yield findings
and conclusions different than those suggested by the methodology required under GASB accounting rules,
as shown above.
Sensitivity of the Collective Net OPEB Liability / (Asset) to Discount Rates
The sensitivity of the NOL to changes in the discount rate must also be disclosed under GASB accounting
rules. The table below provides the NOL of the Plan determined using the current discount rate of 3.50%,
as well as what the Plan’s NOL would be if the discount rate was 1-percentage-point lower or 1-percentage-
point higher than the current rate:
Sensitivity of the Collective Net OPEB Liability / (Asset) to Discount Rates ($ in Thousands)
1%
Decrease
(2.50%)
Current
Discount
Rate
(3.50%)
1%
Increase
(4.50%)
Collective Net OPEB Liability / (Asset) $ 3,173,004 $ 2,662,587 $ 2,256,137
Please keep in mind that the estimates provided in the table above were prepared using streamlined
calculation techniques, and they are intended to provide an “order of magnitude” indication of the NOL’s
sensitivity to changes in these assumptions. Results based on more refined calculations may yield findings
and conclusions different than those suggested by the methodology required under GASB accounting rules,
as shown above. For example, one possible refinement would consider the impact of similar changes in
bond yields on Plan assets, including (but not limited to) the valuations of certain fixed income investments
held by the Plan. However, as required by GASB accounting rules, we have not made any attempt to adjust
the Plan’s FNP to reflect a potentially related change in fixed income asset pricing.

Connecticut State Teachers’ Retirement System
Cavanaugh Macdonald Consulting, LLC Page 16
Schedule of the Recognition of Collective Deferred Outflows / (Inflows) of Resources
in Collective OPEB Expense / (Income)
Amounts reported as Collective Deferred Outflows of Resources and Collective Deferred (Inflows) of
Resources related to OPEB benefits will be recognized in Collective OPEB Expense / (Income) as follows:
Reporting Period Ending:
Net Amount Recognized
($ in Thousands)
June 30, 2021 $ (11,891)
June 30, 2022 $ (11,891)
June 30, 2023 $ (12,195)
June 30, 2024 $ (12,351)
June 30, 2025 $ (11,951)
Thereafter $ 64,227

Connecticut State Teachers’ Retirement System
Cavanaugh Macdonald Consulting, LLC Page 17
Section VII — Required Supplementary Information Under GASB 75, the reporting entity may need to incorporate one or more of the following items in the
Required Supplementary Information (RSI) that must be included in its financial statements.
Details Concerning Plan Amendments and Assumption Changes
Information about changes to benefit terms and changes to assumptions or other inputs should be provided
in RSI. The information should be listed by the date for which the indicated change was first reflected in
reported amounts. We have only provided relevant details for the measurement period ending on June 30,
2019.
CHANGES TO BENEFIT TERMS
June 30, 2019 (Valuation Date: June 30, 2018)
The Plan was amended by the Board, effective January 1, 2019, during the September 12, 2018 meeting.
The Board elected a new prescription drug plan, which is expected to reduce overall costs and allow
for the Board to receive a government subsidy for members whose claims reach a catastrophic level.
These changes were communicated to retired members during the months leading up to the open
enrollment period that preceded the January 1, 2019 implementation date.
CHANGES TO ASSUMPTIONS OR OTHER INPUTS
June 30, 2019 (Valuation Date: June 30, 2018)
Based on the procedure described in GASB 74, the discount rate used to measure Plan obligations for
financial accounting purposes as of June 30, 2019 was updated to equal the Municipal Bond Index
Rate of 3.50% as of June 30, 2019;
Expected annual per capita claims costs were updated to better reflect anticipated medical and
prescription drug claim experience both before and after the plan change that became effective on
January 1, 2019; and
The expected rate of inflation was decreased, and the Real Wage Growth assumption was increased.

Connecticut State Teachers’ Retirement System
Cavanaugh Macdonald Consulting, LLC Page 18
Methods and Assumptions Used in the
Determination of Actuarially Determined Contributions
The actuarially determined contribution (ADC) rates, as a percentage of payroll, used to determine the
actuarially determined State contribution amounts for the measurement period ending on June 30, 2018
that are shown in the following “Schedule of Governmental Nonemployer Contributing Entity Contributions”
are calculated as of the most recent Valuation Date. The following actuarial methods and assumptions as
of June 30, 2018 were used to determine the actuarially determined State contribution amounts reported in
that schedule for the fiscal year ending on June 30, 2019:
Actuarial cost method Entry age
Amortization method
Level percentage of payroll over an open period
Amortization period 30 years
Asset valuation method Market value of assets
Long-term investment rate of return, net of pension plan investment expense, including price inflation
3.00%
Price inflation 2.75%
Real wage growth 0.50%
Wage inflation 3.25%
Salary increases, including wage inflation 3.25% to 6.50%
Initial health care cost trend rates
Medicare Supplement / Advantage Claims Medicare Supplement / Advantage Retiree Contributions Local School District Subsidies
5.95% / 5.00% 5.95% / 0.00% 0.00% or 5.95%
Ultimate health care cost trend rates
Medicare Supplement / Advantage Claims Medicare Supplement / Advantage Retiree Contributions Local School District Subsidies
4.75% / 4.75% 4.75% / 4.75% 0.00% when maximum is reached
Year ultimate trend rates reached
Medicare Supplement Claims and Contributions Medicare Advantage Claims and Contributions Local School District Subsidies
2025 2028 Varies
Basis for Postretirement Mortality Rates RP‒2014 Headcount-weighted
Basis for Postretirement Mortality Improvement Rates For Healthy / Disabled Lives
Scale BB / MP-2014
Projection of Mortality Improvements for Healthy / Disabled Lives
Static Projection to 2020 / 2017

Connecticut State Teachers’ Retirement System
Cavanaugh Macdonald Consulting, LLC Page 19
REQUIRED SUPPLEMENTARY INFORMATION—
SCHEDULE OF GOVERNMENTAL NONEMPLOYER CONTRIBUTING ENTITY CONTRIBUTIONS
($ in Thousands)
Fiscal Year Ending on June 30 2019 2018 2017 2016 2015 2014 2013 2012 2011 2010
Actuarially Determined State Contribution $ 167,819 $ 172,223 $ 166,802 $ 130,331 $ 125,620 $ 187,227 $ 180,460 $ 184,145 $ 177,063 $ 121,334
Contributions in relation to the Actuarially Determined Contribution 35,320 35,299 19,922 19,960 25,145 25,955 27,040 49,486 5,312 12,108
Annual Contribution Deficiency (Excess) $ 132,499 $ 136,924 $ 146,880 $ 110,371 $ 100,475 $ 161,272 $ 153,420 $ 134,659 $ 171,751 $ 109,226
Covered Payroll $4,389,654 $4,075,939 $4,279,755 $4,125,066 $4,078,367 $3,930,957 $4,101,750 $3,943,990 $3,823,754 $3,676,686
Actual Contributions as a Percentage of Covered Payroll 0.80% 0.87% 0.47% 0.48% 0.62% 0.66% 0.66% 1.25% 0.14% 0.33%

Connecticut State Teachers’ Retirement System
Cavanaugh Macdonald Consulting, LLC Page 20
Section VIII — Schedule of Employer Allocations as of June 30, 2019
State's
Expected Proportionate
Employer Employer Share of the NOL
Contribution Allocation Associated With Employer OPEB
Effort at Percentage at the Employer Expense and
Employer FYE 2019 FYE 2019 at FYE 2019 Revenue
Andover $16,028 0.0453795% $1,208,269 $(88,417)
Ansonia 116,402 0.3295628% 8,774,896 (642,117)
Ashford 27,023 0.0765081% 2,037,095 (149,068)
Avon 240,819 0.6818214% 18,154,088 (1,328,454)
Barkhamsted 14,216 0.0402504% 1,071,702 (78,423)
Berlin 188,398 0.5334031% 14,202,322 (1,039,277)
Bethany 27,107 0.0767478% 2,043,477 (149,535)
Bethel 176,817 0.5006139% 13,329,281 (975,391)
Highville Chtr 16,150 0.0457239% 1,217,439 (89,088)
Bloomfield 127,071 0.3597706% 9,579,205 (700,973)
Bolton 58,057 0.1643733% 4,376,582 (320,263)
Bozrah 16,187 0.0458309% 1,220,288 (89,296)
Branford 226,369 0.6409102% 17,064,792 (1,248,743)
Bridgeport 1,039,630 2.9434591% 78,372,159 (5,735,007)
Bristol 485,902 1.3757124% 36,629,540 (2,680,424)
Brookfield 172,263 0.4877218% 12,986,017 (950,272)
Brooklyn 49,146 0.1391453% 3,704,865 (271,109)
Cldrn Ctr Com Prog 2,572 0.0072813% 193,871 (14,187)
Canaan 7,577 0.0214535% 571,218 (41,800)
Canterbury 30,389 0.0860401% 2,290,893 (167,640)
Canton 102,497 0.2901956% 7,726,710 (565,414)
Chaplin 12,816 0.0362848% 966,114 (70,697)
Cheshire 290,315 0.8219556% 21,885,283 (1,601,490)
Chester 13,021 0.0368644% 981,547 (71,826)
Clinton 137,790 0.3901190% 10,387,258 (760,104)
Colchester 159,591 0.4518425% 12,030,700 (880,365)
Amistad Acd 22,142 0.0626907% 1,669,194 (122,146)
Colebrook 8,070 0.0228469% 608,319 (44,515)
Columbia 36,344 0.1028996% 2,739,791 (200,489)
Cornwall 8,769 0.0248273% 661,048 (48,373)
Coventry 112,261 0.3178408% 8,462,788 (619,278)
Cromwell 121,686 0.3445249% 9,173,275 (671,269)
Danbury 655,210 1.8550678% 49,392,794 (3,614,396)
Darien 393,817 1.1149965% 29,687,752 (2,172,448)
Deep River 14,274 0.0404143% 1,076,066 (78,743)
Derby 80,915 0.2290906% 6,099,737 (446,358)
Eastford 11,223 0.0317752% 846,042 (61,910)
East Granby 70,596 0.1998753% 5,321,854 (389,435)
East Haddam 81,795 0.2315838% 6,166,120 (451,216)
East Hampton 136,080 0.3852766% 10,258,325 (750,669)

Connecticut State Teachers’ Retirement System
Cavanaugh Macdonald Consulting, LLC Page 21
State's
Expected Proportionate
Employer Employer Share of the NOL
Contribution Allocation Associated With Employer OPEB
Effort at Percentage at the Employer Expense and
Employer FYE 2019 FYE 2019 at FYE 2019 Revenue
East Hartford 465,492 1.3179262% 35,090,932 (2,567,834)
East Haven 173,242 0.4904917% 13,059,768 (955,669)
East Lyme 183,842 0.5205041% 13,858,875 (1,014,145)
Easton 63,899 0.1809146% 4,817,009 (352,492)
East Windsor 92,911 0.2630539% 7,004,039 (512,532)
Ellington 163,331 0.4624311% 12,312,630 (900,996)
Enfield 324,175 0.9178223% 24,437,817 (1,788,276)
Essex 18,695 0.0529299% 1,409,305 (103,128)
Fairfield 744,813 2.1087578% 56,147,511 (4,108,683)
Farmington 284,965 0.8068094% 21,482,002 (1,571,979)
Franklin 11,173 0.0316349% 842,307 (61,637)
Glastonbury 408,506 1.1565850% 30,795,082 (2,253,479)
Granby 120,870 0.3422133% 9,111,727 (666,765)
Greenwich 841,218 2.3817056% 63,414,984 (4,640,491)
Griswold 108,812 0.3080747% 8,202,757 (600,250)
Groton 317,177 0.8980109% 23,910,321 (1,749,675)
Guilford 228,432 0.6467487% 17,220,247 (1,260,119)
Hamden 404,160 1.1442813% 30,467,485 (2,229,506)
Hampton 9,315 0.0263739% 702,228 (51,387)
Hartford 1,195,687 3.3852968% 90,136,472 (6,595,879)
Hartland 13,754 0.0389424% 1,036,875 (75,875)
Hebron 47,703 0.1350584% 3,596,047 (263,146)
Kent 16,968 0.0480419% 1,279,157 (93,604)
Killingly 138,418 0.3918956% 10,434,561 (763,565)
Lebanon 70,502 0.1996079% 5,314,734 (388,914)
Ledyard 154,142 0.4364167% 11,619,974 (850,310)
Lisbon 26,957 0.0763208% 2,032,108 (148,703)
Litchfield 74,370 0.2105611% 5,606,372 (410,255)
Madison 212,247 0.6009266% 16,000,194 (1,170,839)
Manchester 444,261 1.2578157% 33,490,437 (2,450,716)
Mansfield 98,192 0.2780059% 7,402,149 (541,664)
Marlborough 34,658 0.0981252% 2,612,669 (191,186)
Meriden 482,572 1.3662840% 36,378,500 (2,662,054)
Middletown 313,833 0.8885424% 23,658,214 (1,731,227)
Milford 442,666 1.2533011% 33,370,232 (2,441,919)
Monroe 237,508 0.6724455% 17,904,446 (1,310,186)
Montville 160,578 0.4546385% 12,105,146 (885,813)
Naugatuck 254,347 0.7201224% 19,173,885 (1,403,079)
New Britain 630,148 1.7841104% 47,503,492 (3,476,143)
New Canaan 359,355 1.0174263% 27,089,860 (1,982,343)
New Fairfield 170,217 0.4819288% 12,831,774 (938,985)
New Hartford 27,793 0.0786886% 2,095,152 (153,316)

Connecticut State Teachers’ Retirement System
Cavanaugh Macdonald Consulting, LLC Page 22
State's
Expected Proportionate
Employer Employer Share of the NOL
Contribution Allocation Associated With Employer OPEB
Effort at Percentage at the Employer Expense and
Employer FYE 2019 FYE 2019 at FYE 2019 Revenue
New Haven 1,291,948 3.6578393% 97,393,153 (7,126,899)
Newington 279,359 0.7909381% 21,059,415 (1,541,056)
New London 195,325 0.5530139% 14,724,476 (1,077,487)
New Milford 239,793 0.6789147% 18,076,695 (1,322,791)
Newtown 298,524 0.8451983% 22,504,140 (1,646,776)
Norfolk 7,252 0.0205332% 546,714 (40,007)
North Branford 117,553 0.3328231% 8,861,705 (648,469)
North Canaan 17,193 0.0486765% 1,296,054 (94,841)
North Haven 220,141 0.6232746% 16,595,228 (1,214,382)
No.Stonington 54,368 0.1539303% 4,098,528 (299,916)
Norwalk 797,228 2.2571583% 60,098,803 (4,397,825)
Norwich 169,698 0.4804579% 12,792,610 (936,119)
NFA 139,924 0.3961622% 10,548,163 (771,878)
Old Saybrook 104,807 0.2967356% 7,900,844 (578,157)
Orange 84,196 0.2383819% 6,347,125 (464,461)
Oxford 111,606 0.3159850% 8,413,376 (615,662)
Plainfield 124,961 0.3537976% 9,420,169 (689,336)
Plainville 151,518 0.4289857% 11,422,117 (835,831)
Plymouth 86,755 0.2456271% 6,540,035 (478,577)
Pomfret 24,302 0.0688045% 1,831,980 (134,058)
Portland 83,511 0.2364399% 6,295,418 (460,677)
Preston 30,441 0.0861866% 2,294,793 (167,925)
Putnam 75,282 0.2131438% 5,675,139 (415,287)
Redding 86,713 0.2455059% 6,536,808 (478,341)
RSD 1 56,772 0.1607363% 4,279,744 (313,177)
RSD 4 61,611 0.1744373% 4,644,545 (339,872)
RSD 5 168,807 0.4779362% 12,725,467 (931,206)
RSD 6 68,395 0.1936448% 5,155,961 (377,296)
RSD 7 68,478 0.1938798% 5,162,218 (377,753)
RSD 8 99,951 0.2829864% 7,534,759 (551,368)
Ridgefield 373,531 1.0575616% 28,158,498 (2,060,542)
Rocky Hill 180,036 0.5097296% 13,571,994 (993,152)
Salem 26,947 0.0762934% 2,031,378 (148,649)
Salisbury 21,475 0.0608003% 1,618,861 (118,463)
Scotland 9,318 0.0263806% 702,406 (51,400)
Seymour 138,853 0.3931285% 10,467,388 (765,968)
Sharon 14,594 0.0413186% 1,100,144 (80,505)
Shelton 320,363 0.9070313% 24,150,497 (1,767,251)
Sherman 28,988 0.0820723% 2,185,246 (159,909)
Simsbury 297,826 0.8432231% 22,451,549 (1,642,927)
Somers 97,572 0.2762510% 7,355,423 (538,245)
Southington 380,402 1.0770151% 28,676,464 (2,098,445)

Connecticut State Teachers’ Retirement System
Cavanaugh Macdonald Consulting, LLC Page 23
State's
Expected Proportionate
Employer Employer Share of the NOL
Contribution Allocation Associated With Employer OPEB
Effort at Percentage at the Employer Expense and
Employer FYE 2019 FYE 2019 at FYE 2019 Revenue
S. Windsor 293,899 0.8321036% 22,155,482 (1,621,262)
Sprague 16,755 0.0474368% 1,263,046 (92,425)
Stafford 98,320 0.2783701% 7,411,846 (542,374)
Stamford 1,198,963 3.3945736% 90,383,474 (6,613,954)
SDE 301,653 0.8540579% 22,740,035 (1,664,038)
DCF Recq Home 13,318 0.0377063% 1,003,963 (73,467)
Sterling 19,573 0.0554174% 1,475,536 (107,975)
Stonington 140,701 0.3983610% 10,606,708 (776,163)
Stratford 457,822 1.2962114% 34,512,756 (2,525,525)
Suffield 155,668 0.4407352% 11,734,958 (858,724)
Thomaston 56,991 0.1613564% 4,296,255 (314,385)
Thompson 64,008 0.1812239% 4,825,244 (353,095)
Tolland 140,872 0.3988438% 10,619,563 (777,103)
Torrington 249,629 0.7067626% 18,818,169 (1,377,049)
Trumbull 469,230 1.3285095% 35,372,721 (2,588,455)
Union 5,219 0.0147768% 393,445 (28,791)
Vernon 215,585 0.6103754% 16,251,776 (1,189,249)
Voluntown 19,849 0.0561986% 1,496,337 (109,497)
Wallingford 444,139 1.2574721% 33,481,289 (2,450,046)
Waterbury 1,000,818 2.8335720% 75,446,320 (5,520,904)
Waterford 200,690 0.5682050% 15,128,952 (1,107,085)
Watertown 152,974 0.4331090% 11,531,904 (843,865)
Westbrook 68,835 0.1948883% 5,189,071 (379,718)
W.Hartford 653,955 1.8515154% 49,298,208 (3,607,474)
West Haven 369,373 1.0457888% 27,845,037 (2,037,604)
Weston 196,592 0.5566026% 14,820,028 (1,084,479)
Westport 483,667 1.3693847% 36,461,059 (2,668,095)
Wethersfield 232,103 0.6571425% 17,496,991 (1,280,370)
Willington 32,189 0.0911351% 2,426,551 (177,567)
Wilton 323,782 0.9167095% 24,408,188 (1,786,108)
Winchester 43,328 0.1226718% 3,266,243 (239,013)
Windham 213,692 0.6050175% 16,109,117 (1,178,810)
Windsor 268,567 0.7603831% 20,245,862 (1,481,523)
Windsor Locks 136,943 0.3877217% 10,323,428 (755,433)
Winsted/Gilbert 34,589 0.0979308% 2,607,493 (190,807)
Wolcott 140,274 0.3971511% 10,574,494 (773,805)
Woodbridge 56,581 0.1601940% 4,265,305 (312,120)
Woodstock 42,044 0.1190366% 3,169,453 (231,930)
Woodstock Ad 66,959 0.1895788% 5,047,700 (369,373)
UCONN 12,740 0.0360716% 960,438 (70,282)
RSD 9 79,828 0.2260139% 6,017,817 (440,363)
RSD 10 152,908 0.4329215% 11,526,912 (843,500)

Connecticut State Teachers’ Retirement System
Cavanaugh Macdonald Consulting, LLC Page 24
State's
Expected Proportionate
Employer Employer Share of the NOL
Contribution Allocation Associated With Employer OPEB
Effort at Percentage at the Employer Expense and
Employer FYE 2019 FYE 2019 at FYE 2019 Revenue
Supervison District 29,337 0.0830600% 2,211,545 (161,833)
NWCTC 3,412 0.0096610% 257,233 (18,823)
MCTC 9,154 0.0259162% 690,041 (50,495)
Norwalk CTC 5,297 0.0149985% 399,348 (29,223)
WCSU 10,476 0.0296615% 789,763 (57,792)
CCSU 25,784 0.0730002% 1,943,694 (142,233)
ESCU 7,468 0.0211448% 562,999 (41,198)
SCSU 22,729 0.0643530% 1,713,455 (125,385)
RSD 11 19,506 0.0552272% 1,470,472 (107,604)
CCTC 1,022 0.0028933% 77,037 (5,637)
Hou CTC 9,390 0.0265841% 707,825 (51,796)
Naug CTC 10,849 0.0307174% 817,877 (59,849)
MCTC 9,154 0.0259162% 690,041 (50,495)
Ed Connection 21,792 0.0616986% 1,642,779 (120,213)
RSD 12 71,491 0.2024085% 5,389,302 (394,371)
Gateway CTC 14,673 0.0415438% 1,106,140 (80,944)
RSD 13 132,569 0.3753371% 9,993,677 (731,303)
RSD 14 126,356 0.3577459% 9,525,296 (697,029)
CCI Cheshire 474 0.0013427% 35,751 (2,616)
Shared Svcs 13,583 0.0384577% 1,023,970 (74,931)
CREC 681,086 1.9283285% 51,343,424 (3,757,136)
RSD 15 247,059 0.6994873% 18,624,458 (1,362,874)
RSD 16 135,607 0.3839376% 10,222,673 (748,060)
TRCC (Mohegan) 3,906 0.0110589% 294,453 (21,547)
Tunxis CTC 4,401 0.0124609% 331,782 (24,279)
QVCC 1,275 0.0036094% 96,103 (7,033)
Odyssey 15,886 0.0449764% 1,197,536 (87,632)
CES 100,602 0.2848313% 7,583,881 (554,962)
ACES 187,974 0.5322028% 14,170,363 (1,036,939)
Project Learn 134,434 0.3806184% 10,134,296 (741,593)
RSD 17 137,578 0.3895189% 10,371,280 (758,935)
Asnun CTC 1,385 0.0039205% 104,387 (7,639)
RSD 18 106,810 0.3024075% 8,051,863 (589,208)
EASTCONN 60,801 0.1721434% 4,583,468 (335,402)
BSBE 9,276 0.0262637% 699,294 (51,172)
RSD 19 83,561 0.2365839% 6,299,252 (460,958)
UCONN Health 9,246 0.0261791% 697,041 (51,007)
CCI Niantic 591 0.0016744% 44,582 (3,262)
Children's CTR 9,320 0.0263880% 702,603 (51,414)
Bridges Academy 12,633 0.0357665% 952,314 (69,687)
Common Ground 11,294 0.0319758% 851,383 (62,301)
Explorations 8,241 0.0233316% 621,224 (45,459)

Connecticut State Teachers’ Retirement System
Cavanaugh Macdonald Consulting, LLC Page 25
State's
Expected Proportionate
Employer Employer Share of the NOL
Contribution Allocation Associated With Employer OPEB
Effort at Percentage at the Employer Expense and
Employer FYE 2019 FYE 2019 at FYE 2019 Revenue
Intergrated Day 15,075 0.0426812% 1,136,424 (83,160)
Isaac 13,729 0.0388711% 1,034,977 (75,736)
Jumoke Academy 26,431 0.0748318% 1,992,462 (145,802)
Side by Side 9,747 0.0275967% 734,786 (53,769)
Trailblazers Academy 8,221 0.0232769% 619,768 (45,352)
New Beginnings 19,151 0.0542211% 1,443,684 (105,644)
Elm City CP 13,625 0.0385745% 1,027,080 (75,158)
Stamford Academy 5,252 0.0148685% 395,887 (28,970)
Park City 13,927 0.0394313% 1,049,893 (76,828)
AF Bridgeport Academy 12,947 0.0366571% 976,027 (71,422)
SERC 888 0.0025135% 66,924 (4,897)
AF Hartford Acad 29,272 0.0828766% 2,206,662 (161,476)
Brass City 5,461 0.0154609% 411,660 (30,124)
Path Academy 5,014 0.0141970% 378,007 (27,661)
Great Oaks Charter 5,558 0.0157363% 418,993 (30,660)
Booker T. Washington(BTW) 8,655 0.0245042% 652,446 (47,744)
Capitol Prep Harbor 9,062 0.0256568% 683,135 (49,989)
Stamford Charter Excellance 5,471 0.0154884% 412,392 (30,177)
Totals $ 35,320,000 100.0000000% $ 2,662,587,000 $ (194,839,000)

Connecticut State Teachers’ Retirement System
Cavanaugh Macdonald Consulting, LLC Page 26
Schedule A — Additional Supporting Information
Development of the Projected Earnings on Plan Investments as of June 30, 2019
The development of the projected earnings on plan investments component of Collective OPEB Expense /
(Income) as of the June 30, 2019 measurement date is shown in the following table:
Projected Earnings on Plan Investments For the Measurement Period Ending on June 30, 2019
($ in Thousands)
(a) Expected rate of return on assets at June 30, 2018 3.00%
(b) Beginning of year market value of assets $ 39,736
(c) Expected return on assets at the beginning of the year [(b) x (a)] $ 1,192
(d) External cash flow (mid-year payments assumed): Contributions—State of Connecticut $ 35,320
Contributions—active members 51,944
Refunds of contributions 0
Net benefit payments (55,154)
Administrative expenses (383)
Other (16,100)
Total external cash flow $ 15,627
(e) Expected return on external cash flow [(d) x ((1 + (a))½ – 1)] $ 233
(f) Projected earnings on plan investments [(c) + (e)] $ 1,425
Development of the Collective Deferred Outflow / (Inflow) of Resources for the
Difference Between Projected and Actual Earnings on Plan Investments at June 30, 2019
The determination of the Collective Deferred Outflow / (Inflow) of Resources for the difference between
projected and actual earnings on plan investments at June 30, 2019 is shown in the following table:
Difference Between Projected and Actual Earnings on Plan Investments at June 30, 2019
($ in Thousands)
(a) Projected earnings on plan investments at June 30, 2019 $ 1,425
(b) Net investment income1 $ 1,090
(c) Difference between projected and actual earnings on plan investments [(a) – (b)]
$ 335
1 See “Reconciliation of Changes in the Plan’s Fiduciary Net Position (PFNP) and Collective Net OPEB Liability / (Asset) (NOL)” on
page 8.

Connecticut State Teachers’ Retirement System
Cavanaugh Macdonald Consulting, LLC Page 27
Development of the Average Expected Remaining Service Lives at July 1, 2018
The determination of the average expected remaining service lives for the entire Plan membership at the
beginning of the measurement period is provided in the following table:
Membership Category
(1)
Number
(2) Average
Remaining Service Lives
(in Years)
(a) Active Members 50,594 14.17
(b) Inactive Members 39,214 0.00
(c) Total Membership [((1a) × (2a)) + ((1b) × (2b))] / (1c)
89,808
7.98

Connecticut State Teachers’ Retirement System
Cavanaugh Macdonald Consulting, LLC Page 28
Schedule B — Summary of Actuarial Assumptions and Methods for GASB Accounting Purposes
ECONOMIC ASSUMPTIONS
Discount Rate
3.50% per year for all periods after June 30, 2019 (adopted June 30, 2019).
Municipal Bond Index Rate Basis
The 20-Bond average General Obligation 20-year Municipal Bond Rate published at the end of the last
week during the month of June by The Bond Buyer (www.bondbuyer.com) was used as the 20-year tax-
exempt municipal bond (rating AA/Aa or higher) rate required under GASB rules.
Expected Long-term Rate of Return on Assets
3.00% per year, net of investment expenses, for all periods after June 30, 2018 (adopted June 30, 2018).
Expected Long-term Rates of Inflation
CPI: 2.50% per year for all periods after June 30, 2019.
MEDICAL CPI: 3.25% per year for all periods after June 30, 2019.
Expected Long-term Real Wage Growth
0.75% per year for all periods after June 30, 2019.
Expected Long-term Wage Inflation
3.25% per year for all periods after June 30, 2019. This rate does not reflect any expected future increase
in the number of active members.
Expected Administrative Expenses Included in Service Cost
None.

Connecticut State Teachers’ Retirement System
Cavanaugh Macdonald Consulting, LLC Page 29
Long-term Health Care Cost Trend Rates
Annual per capita health care claims costs are expected to increase in future years as a result of medical
inflation, utilization, leverage in the plan design, and improvements in technology adjusted for any implicit
and/or explicit cost containment features. Initial health care cost trend rates were selected based on an
analysis of national average health trend surveys specific to similarly structured plans for Medicare-eligible
participants.
The assumed annual assumed rates of increases in retiree expected health care claims costs and
contributions1 during each period subsequent to the measurement date are shown in the table below
(adopted June 30, 2018).
Fiscal Year Beginning
July 1,
Medicare Supplement Plan
Claims / Contributions
Medicare Advantage Plan
Claims
Medicare Advantage Plan Contributions
2018 5.95% 5.00% 0.00%
2019 5.90% 5.00% 0.00%
2020 5.80% 5.00% 5.00%
2021 5.70% 5.00% 5.00%
2022 5.60% 5.00% 5.00%
2023 5.35% 5.00% 5.00%
2024 5.10% 5.00% 5.00%
2025 4.75% 5.00% 5.00%
2026 4.75% 4.95% 4.95%
2027 4.75% 4.85% 4.85%
2028+ 4.75% 4.75% 4.75%
1 A 7.00% trend rate for the fiscal year ending on the valuation date, and a 7.25% trend rate for all periods prior to July 1, 2017, were
used to project health care claim costs and contributions backward from the valuation year to entry year in measurements of benefit obligations based on the Entry Age Normal (Level Percentage of Pay) actuarial cost method.

Connecticut State Teachers’ Retirement System
Cavanaugh Macdonald Consulting, LLC Page 30
DEMOGRAPHIC ASSUMPTIONS
The demographic actuarial assumptions for retirement, disability incidence, and withdrawal were developed
based on the results of an actuarial experience study for the five-year period from July 1, 2010 to
June 30, 2015, adopted by the System, and prescribed for use in the Plan’s June 30, 2018 actuarial
valuation.
Expected Annual Subsidies for Local School District Coverage
FUTURE RETIREES AND DEPENDENTS
The lesser of $1,320 per year ($110 per month) and the Maximum Annual Subsidy for all future retired
members and dependents who are expected to be covered under local school district OPEB plans in future
periods.
CURRENT RETIREES AND DEPENDENTS
The lesser of the annualized actual monthly subsidy amounts provided by the System for retired members
and dependents who are covered under local school district OPEB plans as of June 30, 2018 and the
applicable Maximum Annual Subsidy. Reported subsidies are expected to increase each year based on
the assumed long-term health care cost trend rates for Medicare Supplement Plans until the Maximum
Annual Subsidy is reached.
The following table provides Maximum Annual Subsidy amounts for Medicare-ineligible and Medicare-
eligible members and dependents who are receiving health care coverage under a local school district
OPEB plan:
Medicare Status Maximum Annual Subsidy
Ineligible $1,320 per year ($110 per month)
Eligible
$2,640 per year ($220 per month) for those without “premium free” Medicare Part A, and
contribute at least $220 per month for coverage under a local school district plan;
$1,320 per year ($110 per month), otherwise.
The Maximum Annual Subsidies provided in the table above have not increased since July of 1996. Our
understanding is that these types of benefit improvements would not be considered “substantially
automatic” (as that term is defined in GASB 74 and 75) based on the Plan’s history of such changes. As a
result, the Maximum Annual Subsidy Amounts shown above are not expected to increase in any future
period.

Connecticut State Teachers’ Retirement System
Cavanaugh Macdonald Consulting, LLC Page 31
Expected Annual Per Capita Health Care Claims Costs
MEDICAL AND PRESCRIPTION DRUGS
Assumed annual per capita health care claims costs were developed for the Medicare Supplement Plan
and the Medicare Advantage Plan based on the medical and prescription drug premium / premium
equivalent rates for each plan and period provided by the System. Our understanding is that these premium
/ premium equivalent rates include all relevant medical, prescription drug, and/or third-party administrative
costs, and represent the amounts paid by the System as “the full contribution amount” for each coverage
provided.
Age-adjusted health care premium / premium equivalent rates for covered adults were trended forward to
the midpoint of the measurement period. The expected annual age 65 per capita health care claims costs
for the Medicare Supplement Plan and Medicare Advantage Plan for the year following the valuation date
are shown below:
Expected Annual Age 65 Per Capita Claims Cost for
Medicare Supplement Plans $2,961
Medicare Advantage Plans $1,714
Future experience may differ significantly from the cost estimates presented in this report due to unforeseen
and random events, including, but not limited to, any event that would affect one or more insurers’ ability to
provide coverage under the terms of the Plan, any significant change to existing Department of Health and
Human Services (HHS) and/or Centers for Medicare & Medicaid Services (CMS) regulations, and/or any
insolvency of Social Security and/or Medicare Trust Funds on any future date. As such, these results should
be viewed as having a likely range of variability.
AFFORDABLE CARE ACT (ACA)
The impact of the Affordable Care Act (ACA) was addressed in this valuation. A review of the information
currently available did not identify any specific provisions of the ACA that are anticipated to significantly
impact results. While the impact of certain provisions—if applicable—such as the future implementation of
the excise tax on high-value health insurance plans, mandated benefits, and participation changes due to
the individual mandate should be recognized in the determination of liabilities, overall future plan costs and
the resulting liabilities are driven by amounts employers and retirees can afford (i.e., trend). As stated
previously, the trend assumption forecasts the anticipated increase to initial per capita costs, taking into
account health care cost inflation, increases in benefit utilization, plan changes, government-mandated
benefits, and technological advances. Given the uncertainty regarding the ACA’s implementation,
continued monitoring of the ACA’s impact on the Plan’s liability will be required.
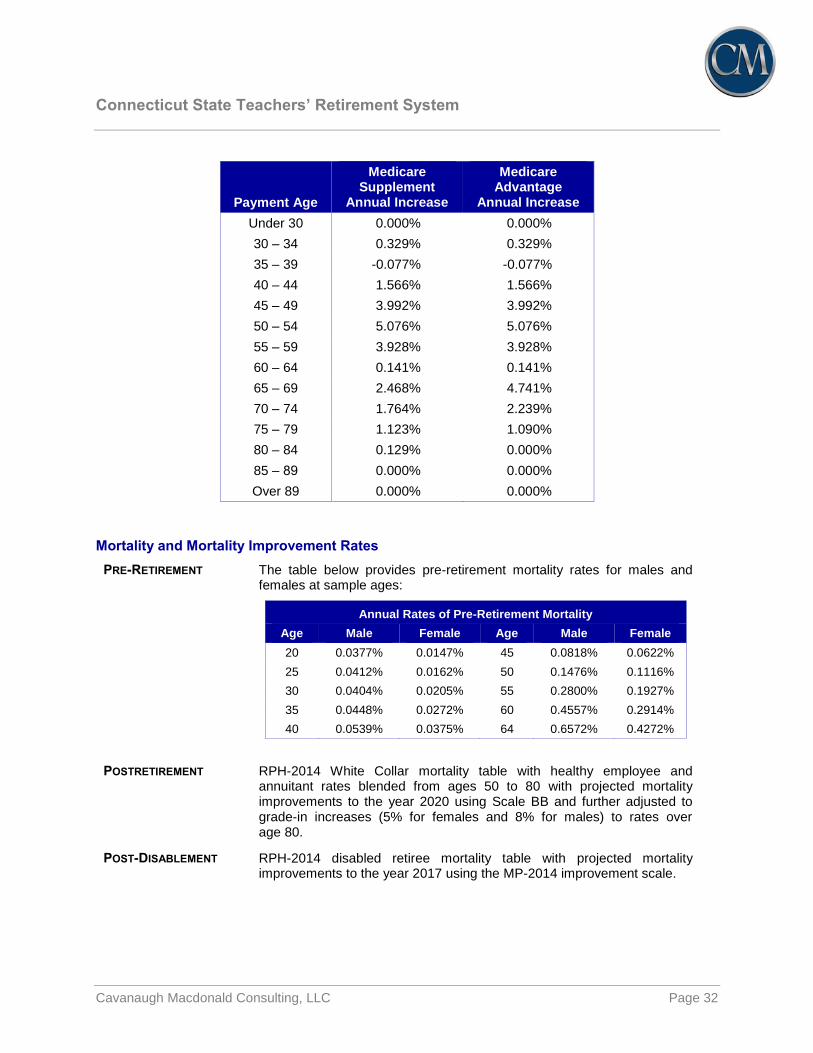
AGE RELATED MORBIDITY
Expected annual age 65 per capita health care claims costs are adjusted to reflect anticipated age-related
cost changes. The assumed annual percentage increases in expected annual per capita health care
costs/net incurred claims that were used to adjust Medicare Supplement and Medicare Advantage Plan
amounts from one age to the next are provided in the following table for both retirees and their dependents
(adopted June 30, 2018):
Connecticut State Teachers’ Retirement System
Cavanaugh Macdonald Consulting, LLC Page 32
Payment Age
Medicare Supplement
Annual Increase
Medicare Advantage
Annual Increase
Under 30 0.000% 0.000%
30 – 34 0.329% 0.329%
35 – 39 -0.077% -0.077%
40 – 44 1.566% 1.566%
45 – 49 3.992% 3.992%
50 – 54 5.076% 5.076%
55 – 59 3.928% 3.928%
60 – 64 0.141% 0.141%
65 – 69 2.468% 4.741%
70 – 74 1.764% 2.239%
75 – 79 1.123% 1.090%
80 – 84 0.129% 0.000%
85 ‒ 89 0.000% 0.000%
Over 89 0.000% 0.000%
Mortality and Mortality Improvement Rates
PRE-RETIREMENT The table below provides pre-retirement mortality rates for males and females at sample ages:
Annual Rates of Pre-Retirement Mortality
Age Male Female Age Male Female
20 0.0377% 0.0147% 45 0.0818% 0.0622%
25 0.0412% 0.0162% 50 0.1476% 0.1116%
30 0.0404% 0.0205% 55 0.2800% 0.1927%
35 0.0448% 0.0272% 60 0.4557% 0.2914%
40 0.0539% 0.0375% 64 0.6572% 0.4272%
POSTRETIREMENT RPH-2014 White Collar mortality table with healthy employee and annuitant rates blended from ages 50 to 80 with projected mortality improvements to the year 2020 using Scale BB and further adjusted to grade-in increases (5% for females and 8% for males) to rates over age 80.
POST-DISABLEMENT RPH-2014 disabled retiree mortality table with projected mortality improvements to the year 2017 using the MP-2014 improvement scale.

Connecticut State Teachers’ Retirement System
Cavanaugh Macdonald Consulting, LLC Page 33
Retirement Rates
The following table contains age and service based annual rates of retirement at sample ages:
Annual Rates of Retirement
Unreduced Proratable Reduced
Age Male Female Male Female Male Female
50 27.5% 27.5% 1.00% 1.00%
55 38.5% 27.5% 4.00% 4.75%
60 22.0% 27.5% 6.0% 5.5%
65 36.3% 32.5% 13.0% 12.5%
70 100.0% 32.5% 30.0% 14.5%
75 100.0% 32.5% 30.0% 18.0%
80 100.0% 100.0% 100.0% 100.0%
Withdrawal Rates
The following table contains service based annual rates of withdrawal (separation from service for causes
other than death, disability, or retirement) for males and females:
Annual Rates of Withdrawal
Years of Service
10 or More Years of Service
Male Female Age Male Female
0 14.00% 12.00% 25 1.50% 4.00%
1 11.00% 10.50% 30 1.50% 4.00%
2 8.00% 8.75% 35 1.50% 3.50%
3 6.50% 7.50% 40 1.50% 2.30%
4 4.50% 6.75% 45 1.59% 1.50%
5 3.50% 6.00% 50 2.04% 2.00%
6 3.00% 5.25% 55 3.44% 2.50%
7 2.75% 4.75% 59 4.00% 2.90%
8 2.50% 4.25%
9 2.50% 4.00%

Connecticut State Teachers’ Retirement System
Cavanaugh Macdonald Consulting, LLC Page 34
Disability Rates
The table below provides age based annual rates of disability for males and females at sample ages:
Annual Rates of Disability
Age Male Female
20 0.0341% 0.0500%
25 0.0341% 0.0500%
30 0.0341% 0.0410%
35 0.0341% 0.0410%
40 0.0536% 0.0720%
45 0.1219% 0.1200%
50 0.2438% 0.2630%
55 0.5363% 0.4380%
60 0.9604% 0.5000%
Rates of Annual Salary Increases
Rates of annual salary increases are constructed geometrically based on the expected long-term rate of
inflation (currently, 2.50%), an expected productivity component (currently, 0.75%), and a variable expected
merit component that is dependent on years of service. The following table provides a sample of the service-
based rates of salary increases that are used to project a member’s total salary as of the valuation date to
future years.
Years of Service Total Increase (Next Year)
Under 2 6.50%
2 – 9 6.25%
10 – 11 5.50%
12 – 14 5.00%
15 4.75%
16 4.50%
17 4.25%
18 4.00%
19 3.75%
20 3.50%
Over 20 3.25%

Connecticut State Teachers’ Retirement System
Cavanaugh Macdonald Consulting, LLC Page 35
Decrement Timing and Adjustment
Decrements—retirement, withdrawal, death, and disability—are assumed to occur at the middle of the year,
except that 100% retirement is assumed to occur at the beginning of the year. Decrement rates (or
“probabilities”) are assumed to be uniformly distributed throughout the year, and reflect multiple decrement
effects.
Subsidized Local School District Coverage and
System-Sponsored Health Care Plan Participation Rates1
FUTURE RETIREES AND DEPENDENTS
The table below provides the percentage of future retired members and dependents who are expected to
be covered under local school district OPEB plans or the System-sponsored health care plan options in
future periods.
Membership Class
Subsidized Local School District
Coverage System-Sponsored Health Care Plans
Pre-65 Members 60.0% N/A
Post-64 Members 20.0% 60.0%
Pre 65 Spouses/Survivors* 45.0% N/A
Post-64 Spouses/Survivors* 40.0% 45.0%
* Percentage of participating members electing spouse coverage.
CURRENT RETIREES AND DEPENDENTS—ENROLLED
All current retirees and dependents who are eligible for Medicare as of the valuation date are assumed to
continue current coverage. For retirees and surviving spouses who are not eligible for Medicare and are
covered under local school district OPEB plans as of the valuation date, the following table shows the
assumed migration from subsidized local school district coverage to a System-sponsored health care plan
option at age 65:
Membership Class
Assumed Percentage Electing
Subsidized Local School District
Coverage On or After Age 65
Assumed Percentage Electing System-Sponsored Health Care Plans On or After Age 65
Pre-65 Members 25.0% 75.0%
Pre-65 Spouses/Survivors* 47.1% 52.9%
* Percentage of participating members electing spouse coverage.
1 Long-term Plan participation and spouse coverage election and enrollment rates are uncertain due to the recent plan change that
became effective on July 1, 2018, and future experience may differ significantly from the assumptions that were used to measure Plan obligations as of June 30, 2018. As such, these assumptions will need to be reviewed as experience evolves, and the results provided in this report should be viewed as having a likely range of variability.

Connecticut State Teachers’ Retirement System
Cavanaugh Macdonald Consulting, LLC Page 36
CURRENT RETIREES AND DEPENDENTS—NOT ENROLLED
50% of retired members who are not eligible for Medicare, are currently receiving a retirement or disability
benefit, but are not participating in the Plan, are expected to be covered under a System-sponsored health
care plan option at age 65. Of these participants, 50% are assumed to cover a spouse (adopted
June 30, 2018).
Of those participating, the percentage of current and future retirees and surviving spouses who are
assumed to enroll in the coverage options available on July 1, 2018 are shown in the table below. In each
future year that begins on or after July 1, 2019, 50% of the current and future retirees and surviving spouses
are expected to choose the Medicare Advantage Plan in lieu of their existing Medicare Supplement Plan
coverage (adopted June 30, 2018). The first five years of the aforementioned progression are illustrated in
the table below.
Grandfathered Members All Other Members
Initial Enrollment Percentages Beginning on
Medicare Supplement
Plan
Medicare Advantage
Plan
Medicare Supplement
Plan
Medicare Advantage
Plan
July 1, 2018 25.00% 75.00% 15.00% 85.00%
July 1, 2019 12.50% 87.50% 7.50% 92.50%
July 1, 2020 6.25% 93.75% 3.75% 96.25%
July 1, 2021 3.13% 96.87% 1.88% 98.12%
July 1, 2022 1.56% 98.44% 0.94% 99.06%
… … … … …
Assumed Eligibility for “Premium Free” Medicare Part A Benefits
FUTURE RETIREES AND DEPENDENTS
100% of future Medicare-eligible retirees and dependents are expected to be eligible for “premium free”
Medicare Part A benefits.
CURRENT RETIREES AND DEPENDENTS
0% of retired members and dependents who are currently receiving a subsidy equal to $2,640 per year
($220 per month) as of June 30, 2018 are expected to be eligible for “premium free” Medicare Part A
benefits. Otherwise, 100% of retired members and dependents are expected to be eligible for these benefits
when they reach age 65 or, if they are older, their attained age on the valuation date.

Connecticut State Teachers’ Retirement System
Cavanaugh Macdonald Consulting, LLC Page 37
Assumed Commencement Age for Eligible Deferred Vested Members
Eligible deferred vested members and their dependents are expected to begin receiving health care benefits
when members reach age 60 or, if they are older, the member’s attained age on the valuation date.
The following table contains the age based assumed percentages of deferred vested members who will
become ineligible for future health care benefits because they are expected to withdraw their contributions
from the System (adopted June 30, 2018):
Attained Ages on the Later of the Valuation Date or Date of Decrement
Under Age 55 Age 56 Age 57 Age 58 Age 59 Over Age 59
30.00% 24.00% 18.00% 12.00% 6.00% 0.00%
Marital and Spouse Assumptions
FUTURE RETIREES
100% of future retired members are assumed to be married to a spouse of the opposite gender. Husbands
are assumed to be three years older than their wives.
CURRENT RETIREES
Actual spouse age is used where available. If relevant spouse information is not available, husbands are
assumed to be three years older than their wives.
Valuation Date
June 30, 2018
Measurement Date
June 30, 2019
Measurement Period
July 1, 2018 to June 30, 2019
Benefits Not Valued
Dental, vision, and hearing benefits for retirees and their dependents are paid by the retiree on a full cost
basis, and without an implicit subsidy. As a result, no dental, vision, or hearing benefit liabilities are included
in the Plan’s GASB 75 results as of June 30, 2019.
Other Assumptions and Methods
Unless otherwise stated above, all other actuarial assumptions and methods are the same as those used
for the purpose of preparing Plan financial accounting results as of June 30, 2019.
Please see the June 30, 2018 GASB 75 report for additional information about the data, assumptions,
methods, and plan provisions used to prepare financial accounting results as of the June 30, 2018
measurement date.

Connecticut State Teachers’ Retirement System
Cavanaugh Macdonald Consulting, LLC Page 38
Changes in Assumptions and Methods Since the Prior Valuation
The June 30, 2018 measurements used in the development of June 30, 2019 financial accounting results
for the Plan reflect the following prescribed changes in assumptions and methods:
Based on the procedure described in GASB 74, the discount rate used to measure Plan obligations for
financial accounting purposes as of June 30, 2019 was updated to equal the Municipal Bond Index
Rate of 3.50% as of June 30, 2019;
Expected annual per capita claims costs were updated to better reflect anticipated medical and
prescription drug claim experience both before and after the plan change that became effective on
January 1, 2019; and
The expected rate of inflation was decreased, and the Real Wage Growth assumption was increased.
The aggregate effect of the changes described above was a reduction in the Plan’s Total OPEB Liability
and Service Cost measured as of June 30, 2019.

Connecticut State Teachers’ Retirement System
Cavanaugh Macdonald Consulting, LLC Page 39
Schedule C — Summary of Actuarial Cost and Asset Valuation Methods
Actuarial Cost Method
The valuation is prepared on the projected benefit basis, under which the present value, at the interest rate
assumed to be earned in the future (currently 3.50%), of each member’s expected benefits at retirement is
determined, based upon age, service, and gender. The calculations take into account the probability of a
member’s death or termination of employment prior to receiving benefits under the Plan. The present value
of the expected benefits payable on account of active members is added to the present value of the
expected future payments to retired members and beneficiaries to obtain the present value of all expected
benefits payable by the Plan.
The actuarial cost method is a procedure for allocating the actuarial present value of postemployment
benefits and expenses to time periods. The method used for the valuation is known as the Entry Age Normal
(Level Percentage of Pay) actuarial cost method, and has the following characteristics:
(i) The annual normal costs for each individual active participant are sufficient to accumulate the
value of the participant’s postemployment benefits at time of retirement.
(ii) Each annual normal cost is a constant percentage of the participant’s year-by-year projected
covered compensation.
The Entry Age Normal (Level Percentage of Pay) actuarial cost method allocates the actuarial present
value of each participant’s projected benefits on a level basis over the participant’s assumed compensation
rates between the entry age of the participant and the assumed ages at which the participant will leave
active service.
The portion of the actuarial present value allocated to the valuation year is called the service cost (SC).
The portion of the actuarial present value of expected benefits not provided for by the actuarial present
value of future service costs is called the Total OPEB Liability (TOL). The difference between the TOL and
the Fiduciary Net Position (FNP) is the Net OPEB Liability / (Asset) (NOL).
The actuarial cost method is prescribed by GASB 74 and 75 for financial accounting purposes.
Asset Valuation Method
The Actuarial Asset Value for financial accounting purposes is equal to the market value of plan assets.
The asset valuation method is prescribed by GASB 74 and 75 for financial accounting purposes.
Changes in Actuarial Cost and Asset Valuation Methods Since the Previous Valuation
There were no changes in actuarial cost or amortization methods since the previous valuation on
June 30, 2018.

Connecticut State Teachers’ Retirement System
Cavanaugh Macdonald Consulting, LLC Page 40
Schedule D — Summary of Main Plan Provisions for Valuation Purposes This summary of main plan provisions is intended to describe only the principal features of the Retiree
Health Insurance Plan (RHIP, or the Plan), cost-sharing, other than insured, defined benefit OPEB plan
with a special funding situation sponsored by the Connecticut State Teachers' Retirement System (the
System) as interpreted for valuation purposes. All actual eligibility requirements and benefit amounts will
be determined in accordance with the Plan document and any System practices, processes, and
procedures.
Key Plan Terms
COVERED EMPLOYEES
Any teacher, principal, superintendent or supervisor engaged in service of public schools, plus professional
employees at State schools of higher education if they choose to be covered.
CREDITED SERVICE
One month for each month of service as a teacher in Connecticut public schools, maximum 10 months for
each school year. Ten months of credited service constitutes one year of Credited Service. Certain other
types of teaching service, State employment, or wartime military service may be purchased prior to
retirement, if the Member pays one-half the cost.
NORMAL RETIREMENT
Eligibility—Age 60 with 20 years of Credited Service in Connecticut, or 35 years of Credited Service
including at least 25 years of service in Connecticut.
EARLY RETIREMENT
Eligibility—25 years of Credited Service including 20 years of Connecticut service, or age 55 with 20 years
of Credited Service including 15 years of Connecticut service.
PRORATABLE RETIREMENT
Eligibility—Age 60 with 10 years of Credited Service.
DISABILITY RETIREMENT
Eligibility—5 years of Credited Service in Connecticut if not incurred in the performance of duty and no
service requirement if incurred in the performance of duty.
TERMINATION OF EMPLOYMENT
Eligibility—10 or more years of Credited Service.
Teachers’ Required Contribution
1.25% of annual salaries in excess of $500,000 is contributed for health insurance of retired teachers.
State Contribution
The State pays for one third of the costs through an annual appropriation in the General Fund.
Administrative costs of the Plan are financed by the State. Based upon Chapter 167a, Subsection D of
Section 10-183t of the Connecticut statutes, it is assumed the State will pay for any long-term shortfall
arising from insufficient active member contributions.

Connecticut State Teachers’ Retirement System
Cavanaugh Macdonald Consulting, LLC Page 41
Retiree Health Care Coverage
Any member who is currently receiving a retirement or disability benefit is eligible to participate in the Plan.
There are two types of the health care benefits offered through the system. Subsidized Local School District
Coverage provides a subsidy paid to members still receiving coverage through their former employer and
the CTRB Sponsored Medical Plans provide coverage for those participating in Medicare, but not receiving
Subsidized Local School District Coverage.
Any member who is not currently participating in Medicare Parts A & B is eligible to continue health care
coverage with their former employer. A subsidy of up to $110 per month for a retired member plus an
additional $110 per month for a spouse enrolled in a local school district plan is provided to the school
district to first offset the retiree’s share of the cost of coverage, any remaining portion is used to offset the
district’s cost. The subsidy amount is set by statute, and has not increased since July of 1996. A subsidy
amount of $220 per month may be paid for a retired member, spouse or the surviving spouse of a member
who has attained the normal retirement age to participate in Medicare, is not eligible for Part A of Medicare
without cost, and contributes at least $220 per month towards coverage under a local school district plan.
Any member that is currently participating in Medicare Parts A & B is eligible to either continue health care
coverage with their former employer, if offered, or enroll in the plan sponsored by the System. If they elect
to remain in the plan with their former employer, the same subsidies as above will be paid to offset the cost
of coverage.
If a member participating in Medicare Parts A & B so elects, they may enroll in one of the CTRB Sponsored
Medicare Supplement Plan(s). Effective July 1, 2018, the System added a Medicare Advantage Plan option.
Active members, retirees, and the State pay equally toward the cost of the basic coverage (medical and
prescription drug benefits) under the Medicare Advantage plan. Retired members who choose to enroll in
the Medicare Supplement Plan are responsible for the full difference in the premium cost between the two
plans. Additionally, effective July 1, 2018, retired members who cancel their health care coverage(s) or
elect not enroll in a CTRB sponsored health care coverage option must wait two years to re-enroll.
Survivor Health Care Coverage
Survivors of former employees or retirees remain eligible to participate in the Plan and continue to be eligible
to receive either the $110 monthly subsidy or participate in the CTRB Sponsored Medicare Supplement or
Medicare Advantage Plan options, as long as they do not remarry.
System Determined Monthly Retiree Contributions Since 2014
Eligible retirees who elect to enroll in a health care coverage option under the Plan contribute a monthly
amount based on the coverages that they selected during the enrollment process. Effective
January 1, 2015, new enrollees will only be able to elect the “all coverages” package (Medical with
Prescription Drugs, Dental, Vision and Hearing). Existing retired members and dependents were
grandfathered into the health care option elections that they had made prior to January 1, 2015.

Connecticut State Teachers’ Retirement System
Cavanaugh Macdonald Consulting, LLC Page 42
The following tables provide the monthly health care contributions for retiree and dependent coverage
options during the periods beginning on January 1, 2014 and ending on January 1, 2019.
Monthly Funding Rates for the CTRB Sponsored Medicare Supplemental Plan Options
Coverage 2014 2015 2016 2017 Jan. 1 2018
July 1 2018
Jan. 1 2019
Medical with Prescriptions $97 $91 $95 $92 $101 $199 $173
Medical with Prescriptions and Dental $141 $136 $143 $136 $151 $254 $231
Medical with Prescriptions, Dental, Vision & Hearing $146 $140 $148 $141 $156 $259 $238
Monthly Funding Rates for the CTRB Sponsored Medicare Advantage Plan Options
Coverage 2014 2015 2016 2017 Jan. 1 2018
July 1 2018
Jan. 1 2019
Medical with Prescriptions N/A N/A N/A N/A N/A $74 $65
Medical with Prescriptions and Dental N/A N/A N/A N/A N/A $129 $123
Medical with Prescriptions, Dental, Vision & Hearing N/A N/A N/A N/A N/A $134 $130
Changes in Plan Provisions Since the Previous Valuation
The Plan was amended by the Board, effective January 1, 2019, during the September 12, 2018 meeting.
The Board elected a new prescription drug plan, which is expected to reduce overall costs and allow for the
Board to receive a government subsidy for members whose claims reach a catastrophic level. These
changes were communicated to retired members during the months leading up to the open enrollment
period that preceded the January 1, 2019 implementation date.
We have reflected these changes in the measurement of the Plan’s benefit obligations for financial
accounting purposes as of June 30, 2019.