gateway cities park and ride assessment
TRANSCRIPT
GatewayCitiesPark‐and‐RideAssessmentFinalDraft
Date: September27,2013
Preparedfor: GatewayCitiesCouncilofGovernments LosAngelesCountyMetropolitanTransportationAuthority
Preparedby:
445 S. Figueroa Street, Suite 2700 Los Angeles, CA 90071

i
Table of Contents Executive Summary .................................................................................................. ES-1
Results ................................................................................................................ ES-3
Summary ............................................................................................................ ES-5
1.0 Purpose and Approach ....................................................................................... 1-1 1.1 Parking Capacity ......................................................................................... 1-2
1.2 Parking Demand ......................................................................................... 1-2
1.3 Automobile VMT Reduction ..................................................................... 1-3
2.0 Content .................................................................................................................. 2-1 2.1 Existing Park-and-Ride Lots ..................................................................... 2-1
2.2 New Lots and Planned Expansions ......................................................... 2-3
2.3 The Park-and-Ride Database .................................................................... 2-5
3.0 Data Sources ........................................................................................................ 3-1
4.0 Database Summary ............................................................................................. 4-1
5.0 Findings ................................................................................................................ 5-1 5.1 Existing Conditions .................................................................................... 5-1
5.2 Year 2035 No Build ..................................................................................... 5-2
5.3 Year 2035 Build ........................................................................................... 5-3
5.4 Year 2035 Unconstrained ........................................................................... 5-5
5.5 Summary ...................................................................................................... 5-5
A. Park-and-Ride Database ................................................................................... A-1 A.1 Lot Description ........................................................................................... A-1
A.2 Existing Facilities ....................................................................................... A-1
A.3 Unconstrained Parking Demand ............................................................. A-1
A.4 2035 No Build and 2035 Build .................................................................. A-2
B. Station-Specific Parking Utilization and VMT Reduction Charts ........... B-1

iii
List of Tables Table ES.1 2035 Build Park-and-Ride Lots Over or Near Capacity ............... ES-3
Table 1.1 Automobile VMT Reduction Assumptions ....................................... 1-3
Table 3.1 Prior Studies Used to Develop the Park-and-Ride Assessment ..... 3-1
Table 3.2 Agencies Contacted to Confirm Park-and-Ride Information ......... 3-2
Table 4.1 Park-and-Ride Facilities Overview (2013 Average Weekday) ....... 4-3
Table 5.1 Existing Park-and-Ride Lots and Capacity Constraints .................. 5-2
Table 5.2 2035 No Build Park-and-Ride Lots Near or Over Capacity ............ 5-3
Table 5.3 2035 Build Park-and-Rides Over and Nearing Capacity ................. 5-4
Table A.1 Park-and-Ride Database ..................................................................... A-3

v
List of Figures Figure ES.1 Existing Park-and-Ride Lots ................................................................... 2
Figure ES.2 Annual Automobile VMT Reduction in 2035 Scenarios due to Gateway Cities Park-and-Ride Lots (High Transit) ............................ 5
Figure 2.1 Existing Park-and-Ride Lots ................................................................ 2-2
Figure 2.2 Planned Park-and-Ride Projects and Expansions ............................ 2-4
Figure 5.1 Annual VMT Reduction in 2035 Scenarios (High Transit) .............. 5-5
Figure B.1 2035 No Build Parking Utilization ..................................................... B-2
Figure B.2 2035 Build Parking Utilization ........................................................... B-3
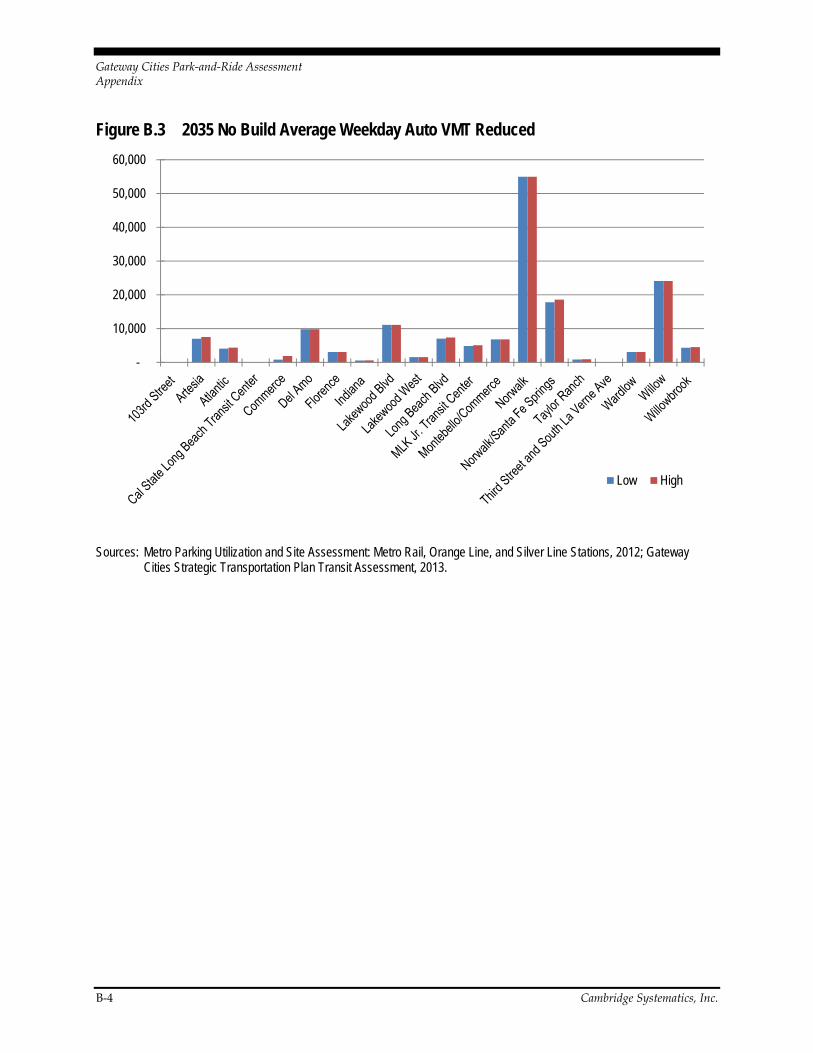
Figure B.3 2035 No Build Average Weekday Auto VMT Reduced ................. B-4
Figure B.4 2035 Build Average Weekday Auto VMT Reduced ........................ B-5

ES-1
Executive Summary The Gateway Cities Park-and-Ride Assessment provides an inventory of existing and planned park-and-ride lots, forecasts of future lot capacity impacts, and forecasts of the impact of proposed lot expansions on regional automobile travel.
There are currently 18 existing park-and-ride lots located in or directly adjacent to the Gateway Cities (See Figure ES.1). The report addresses these and five planned improvements to regional park-and-ride lots (operator in parentheses):
A new Cal State Long Beach Transit Center lot (City of Long Beach);
A new Third Street and South La Verne Avenue lot (Los Angeles County).
Expansion of the Lakewood Boulevard Metro Station lot (Metro);
Expansion of the Norwalk Metro Station lot (Metro); and
Expansion of the Willow Metro Station lot (Metro).
These expansions will add at least 1,387 spaces to total capacity in the Gateway Cities.
The assessment offers planning-level forecasts of parking demand, capacity, and utilization at existing and proposed park-and-ride lots. The forecasts are based on readily available information, and on transit ridership forecasts developed in the Gateway Cities Transit Assessment, a separate report also prepared as part of the Gateway Cities Strategic Transportation Plan.
We analyzed three future park-and-ride lot scenarios to understand the interplay between park-and-ride improvements, demand, capacity and automobile vehicle miles traveled (VMT):
1. 2035 No Build. A future scenario under which no improvements are made to park-and-ride lots in the Gateway Cities;
2. 2035 Build. A future scenario under which all planned and proposed park-and-ride improvements in the Gateway Cities are constructed but parking at park-and-ride lots is constrained by planned vehicle capacity; and
3. 2035 Unconstrained. A future scenario under which all planned and proposed park-and-ride improvements in the Gateway Cities are constructed and parking demand can be accommodated at park-and-ride lots regardless of planned vehicle capacity.

Gateway Cities Park-and-Ride Assessment
ES-2 Cambridge Systematics, Inc.
Figure ES.1 Existing Park-and-Ride Lots

Gateway Cities Park-and-Ride Assessment
Cambridge Systematics, Inc. ES-3
We forecasted year 2035 parking demand as the product of current parking demand and projected transit ridership growth for routes connecting to each park-and-ride lot. Year 2035 transit ridership increases are based on planning-level forecasts developed in the Gateway Cities Transit Assessment using its own 2035 No Build and 2035 Build transit scenarios, which we refer to as “low transit” and “high transit,” respectively. We contacted Metro, Metrolink, and city staff to verify existing and planned park-and-ride data.
RESULTS
Parking Capacity and Utilization
Table ES.1 presents the park-and-ride lots that are over or nearing capacity by 2035 Build conditions. The table details the transit connections to each of the park-and-ride lots, the number of parking stalls, the forecasted utilization rate based on parking demand, and the additional potential daily automobile VMT reduction if the parking demand in excess of 100 percent utilization can be accommodated.
Table ES.1 2035 Build Park-and-Ride Lots Over or Near Capacity
Lot Name Transit
Connections Parking Stalls
Utilization Rate (Low-High)
Additional Potential Daily VMT Reduction
(Low-High)
Over capacity
Del Amo Metro Blue Line, Bus 202 367 103-108% 334-797
Florence Metro Blue Line, Buses 1021,110, 611,111/311
115 105-109% 139-285
Montebello/Commerce Metrolink Riverside, Buses 18, 66
255 102-232% 107-9,032
Norwalk Metro Green Line, Buses 115, 125, 270, 460, 111/311
2,050 118-123% 9,724-12,664
Norwalk/Santa Fe Springs
Metrolink 91, Metro Orange Line
844 79-180% 0-18,117
Wardlow Metro Blue Line 115 100-105% 3-143
Total 10,308-41,037
Nearing Capacity
Artesia Metro Blue Line, 60, 130, 205, 260, 762
287 91%-98%
Source: Metro Parking Utilization and Site Assessment: Metro Rail, Orange Line, and Silver Line Stations, 2012; Gateway Cities Transit Assessment, 2013; other project-specific sources.
Our analysis shows that by 2035, six of the 20 regional park-and-ride lots may have utilization rates in excess of 100 percent by the year 2035. These lots
Gateway Cities Park-and-Ride Assessment
ES-4 Cambridge Systematics, Inc.
represent the highest priority locations to evaluate and plan for greater capacity. Only the Norwalk/Santa Fe Springs lot has plans to expand at the time of this assessment. The Artesia park-and-ride lot approaches capacity by 2035, indicating another potential area for expansion
Automobile VMT Reduction
In the Gateway Cities, park-and-ride lots are located primarily at Metro light rail and Metrolink commuter rail stations. Drivers in Los Angeles County experience significantly longer average commute distances (18 miles) and greater freeway congestion compared to the national average. As a result, vehicles that use Gateway Cities park-and-ride lot can have a greater impact on reducing area auto travel compared to other regions.
While park-and-ride lots do not reduce automobile trips, they do reduce automobile vehicle miles traveled (VMT) and resulting vehicle congestion, because every vehicle parked at a park-and-ride lot represents a driving trip that would otherwise travel the full commute distance on Gateway Cities roadways.
Figure ES.2 summarizes VMT reduction for the three parking scenarios using high ridership demand forecasts. Key results include:
Under existing conditions, park-and-ride lots reduce annual auto VMT by 46.1 million miles in the Gateway Cities;
Under 2035 No Build conditions, increased demand at park-and-ride lots due to forecasted socioeconomic growth is projected to reduce auto VMT by an additional 3.4 million, to 49.5 million miles of travel annually;
Under 2035 Build conditions, increased demand at park-and-ride lots due to socioeconomic growth and transit expansion is projected to reduce auto VMT by an additional 3.0 million, to 52.5 million annual miles of travel; and
Accommodating all forecasted demand at park-and-ride lots would reduce an auto VMT by an additional 12.3 million, resulting in a total 64.8 million annual automobile VMT reduced due to park-and-ride lot access.

Gateway Cities Park-and-Ride Assessment
Cambridge Systematics, Inc. ES-5
Figure ES.2 Annual Automobile VMT Reduction in 2035 Scenarios due to Gateway Cities Park-and-Ride Lots (High Transit)
Source: Metro Parking Utilization and Site Assessment: Metro Rail, Orange Line, and Silver Line Stations,
2012; Gateway Cities Transit Assessment, 2013; other project-specific sources.
SUMMARY Park-and-ride lots provide an attractive alternative to many commuters who wish to avoid traffic congestion but do not live adjacent to a convenient transit access point. The combination of planned transit expansions and forecasted traffic growth on the Gateway Cities’ already congested roadways will likely make transit a more attractive commute option to those who would otherwise use freeways or arterial highways to travel to and from work during the week.
Based on extrapolation of past trends and existing conditions, we estimate six of the 20 park-and-ride lots within the Gateway Cities will be over capacity by 2035. These lots represent potential targets for expansion. In addition, proposed light rail enhancements such as the Gold Line extension and ECO Rapid Transit may represent additional opportunities for future park-and-ride lot projects.
Our analysis indicates that park-and-ride lots currently help reduce about 46.1 million annual automobile VMT in the Gateway Cities. Given anticipated growth in regional transit demand, this figure could approach 64.8 million by 2035 if all parking demand is met, an increase of about 41 percent. To put this in regional perspective, these reductions amount to about a half-percent of existing annual VMT within the Gateway Cities, which has been estimated at upwards of 11 billion.
Gateway Cities Park-and-Ride Assessment
ES-6 Cambridge Systematics, Inc.
Note that while increased demand for park-and-ride lots will contribute to congestion reduction on area freeways and highways, individual park-and-ride lot areas may experience higher levels of localized congestion. Such impacts may be successfully mitigated through targeted station area planning efforts.
Opportunities for Further Study
This assessment illustrates potential park-and-ride lot demand and capacity issues using a planning-level approach and readily available data, with the expectation that further study is needed to refine and prioritize new investments. Such studies may include:
Multi-resolution modeling. As part of the Gateway Cities Strategic Transportation Plan, Metro and the Gateway Cities Council of Governments are overseeing the development of a new state-of-the-art multi-resolution model to evaluate local transportation conditions and improvements in the subregion. Once operational, the model will allow more rigorous analysis of the interplay between transit and other travel modes, including demand for park-and-ride services. This analysis could offer more insights into the types of auto trips impacted by park-and-ride lots, for instance, which trips are removed from freeways or arterial highways, and impacts on regional congestion. Note that the data generated by more rigorous methods is likely to differ, in some cases significantly, from figures generated in this planning-level analysis.
Station area planning and design. Efficient expansion of park-and-ride lots requires a detailed understanding of the station site, surrounding areas, and residents’ methods of access. Local communities and transit agencies should coordinate in the analysis of individual lots in order to prioritize planned park-and-ride enhancements and expansions. This includes identifying site-specific needs and solutions for meeting parking demand, ensuring efficient local traffic circulation, mitigating conflicts between access modes, and prioritizing user safety and security.
1-1
1.0 Purpose and Approach Park-and-ride facilities in the Gateway Cities are operated by Metro, Metrolink, Caltrans and municipal governments. This report provides an inventory of the 18 existing park-and-ride facilities and two proposed facilities in or near the Gateway Cities. The Park-and-Ride Assessment has two main purposes:
1. Develop a comprehensive inventory of existing and planned park-and-ride facilities in the Gateway Cities; and
2. Understand the relationship between forecasted transit demand and existing and planned park-and-ride facilities, including potential areas for improvement and impacts on regional automobile travel.
Our analysis presents planning-level forecasts of parking demand, capacity, and utilization at existing and proposed park-and-ride lots, as well as estimates of impacts on regional automobile vehicle miles traveled (VMT). A three-step approach was used to gather all necessary data and factors underlying the analysis:
1. Gather information from existing documents and data sources, including planning-level forecasts of transit ridership from the Gateway Cities Transit Assessment;
2. Interview staff at Los Angeles County Metropolitan Transportation Authority (Metro), Metrolink, other transit agencies, and municipalities responsible for park-and-ride facilities; and
3. Estimate remaining information as needed using trends and widely-accepted analysis factors.
The analysis considered three future park-and-ride scenarios:
1. 2035 No Build – A future scenario under which socioeconomic growth occurs but no improvements are made to park-and-ride lots in the Gateway Cities;
2. 2035 Build – A future scenario under which all planned and proposed park-and-ride improvements in the Gateway Cities are constructed; and
3. 2035 Unconstrained – A future scenario under which all parking demand can be accommodated at park-and-ride lots, regardless of existing or planned vehicle capacity.
The following sections describe the methodology and key data sources used in the analysis.

Gateway Cities Park-and-Ride Assessment
1-2 Cambridge Systematics, Inc.
1.1 PARKING CAPACITY We collected existing parking demand estimates primarily from the 2012 Metro report Metro Parking Utilization and Site Assessment: Metro Rail, Orange Line, and Silver Line Stations, supplemented by interviews with Metrolink staff (for more information, see Section 3.0 Data Sources).
For each scenario we identified park-and-ride lots that were near capacity (90 – 100 percent utilization) or over capacity (over 100 percent utilization).
1.2 PARKING DEMAND We collected existing parking demand estimates primarily from the 2012 Metro report Metro Parking Utilization and Site Assessment: Metro Rail, Orange Line, and Silver Line Stations, supplemented by interviews with Metrolink staff.1
We forecasted year 2035 parking demand as the product of current parking demand and projected transit ridership growth for routes connecting to each park-and-ride lot. The year 2035 transit ridership increases are based on planning-level forecasts developed in the Gateway Cities Transit Assessment using its 2035 No Build and 2035 Build transit scenarios. For the purposes of this report, the transit scenario ridership forecasts are referred to as “low transit” and “high transit,” respectively, to provide a range of potential demand.
The Transit Assessment accounts for planned improvements to regional and local transit service. Most notably, the Transit Assessment includes changes expected due to the implementation of the California High Speed Rail (HSR), Phase 1 Blended scenario2. While plans do not include an HSR station in the Gateway Cities, they do account for increased Metrolink service providing transit connections to HSR stations near the Gateway Cities. To reflect blended HSR service in this report, we assumed Metrolink ridership would increase a rate consistent with that of interregional transit services.
Based on the Transit Assessment low transit scenario, we assume that the average park-and-ride lot will serve:
40 percent more users in 2035 than today if served by Metrolink rail service;
10 percent more if served by a Metro rail line (Blue, Green, or Gold); and
10 percent more if served by any other bus services.
1 In the absence of data on the Taylor Ranch lot (City of Montebello), we assumed an
average weekday utilization rate of 75 percent (30 of 40 spaces occupied).
2 Based on service descriptions in the California High Speed Rail Authority 2012 Revised Business Plan, and the 2013 California State Rail Plan.
Gateway Cities Park-and-Ride Assessment
Cambridge Systematics, Inc. 1-3
Based on the Transit Assessment high transit scenario, we assume that the average park-and-ride lot will serve:
220 percent more users in 2035 than today if served by Metrolink;
15 percent more if served by a Metro rail line;
18 percent if served by the proposed Atlantic Bus Rapid Transit route; and
10 percent if served by any other bus service.
Where multiple transit types connect to the lot (e.g., light rail and bus services), we assumed the highest service-specific ridership increase would affect parking demand, rather than cumulative increases by mode.
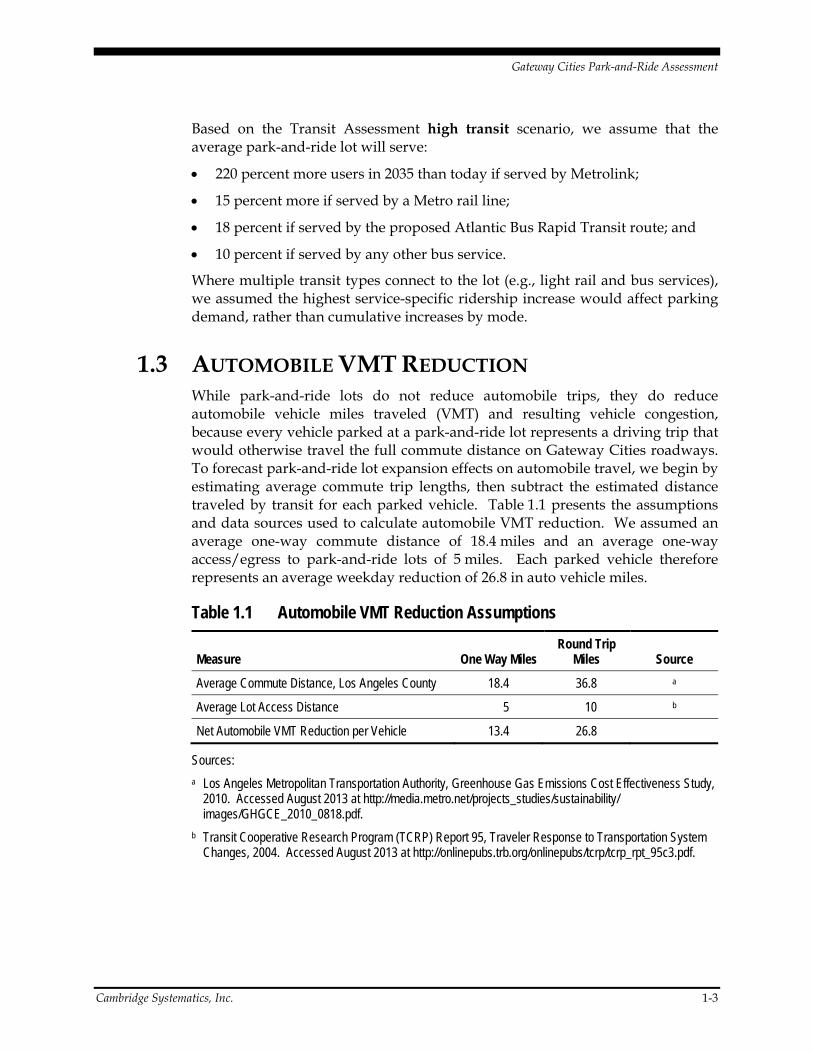
1.3 AUTOMOBILE VMT REDUCTION While park-and-ride lots do not reduce automobile trips, they do reduce automobile vehicle miles traveled (VMT) and resulting vehicle congestion, because every vehicle parked at a park-and-ride lot represents a driving trip that would otherwise travel the full commute distance on Gateway Cities roadways. To forecast park-and-ride lot expansion effects on automobile travel, we begin by estimating average commute trip lengths, then subtract the estimated distance traveled by transit for each parked vehicle. Table 1.1 presents the assumptions and data sources used to calculate automobile VMT reduction. We assumed an average one-way commute distance of 18.4 miles and an average one-way access/egress to park-and-ride lots of 5 miles. Each parked vehicle therefore represents an average weekday reduction of 26.8 in auto vehicle miles.
Table 1.1 Automobile VMT Reduction Assumptions
Measure One Way Miles Round Trip
Miles Source
Average Commute Distance, Los Angeles County 18.4 36.8 a
Average Lot Access Distance 5 10 b
Net Automobile VMT Reduction per Vehicle 13.4 26.8
Sources:
a Los Angeles Metropolitan Transportation Authority, Greenhouse Gas Emissions Cost Effectiveness Study, 2010. Accessed August 2013 at http://media.metro.net/projects_studies/sustainability/ images/GHGCE_2010_0818.pdf.
b Transit Cooperative Research Program (TCRP) Report 95, Traveler Response to Transportation System Changes, 2004. Accessed August 2013 at http://onlinepubs.trb.org/onlinepubs/tcrp/tcrp_rpt_95c3.pdf.
2-1
2.0 Content All data and sources used in the development of this report are contained in a separate spreadsheet database. This section describes the content of the existing and proposed services evaluated in the database, which includes all existing and planned facilities located both in or immediately adjacent to the Gateway Cities. Excerpts of the database can be found in Table 4.1 and Appendix A of this report.
2.1 EXISTING PARK-AND-RIDE LOTS Figure 2.1 indicates the 18 existing park-and-ride lots located in or near the Gateway Cities (lot operator indicated in parentheses):
103rd Street Metro Station (Metro);
Artesia Metro Station (Metro);
Atlantic Metrolink Station (Metro);
Commerce Metrolink Station (Metrolink);
Del Amo Metro Station (Metro);
Florence Metro Station (Metro);
Indiana Metrolink Station (Metro);
Lakewood Boulevard Metro Station (Metro);
Long Beach Boulevard Metro Station (Metro);
MLK Jr. Transit Center (City of Compton);
Montebello/Commerce Metrolink Station (Metrolink);
Norwalk Metro Station (Metro);
Norwalk/Santa Fe Springs Metro Station (Metrolink);
Taylor Ranch (Montebello)
Third Street and South La Verne Avenue (Los Angeles County);
Wardlow Metro Station (Metro);
Willow Metro Station (Metro); and
Willowbrook Metro Station (Metro).

Gateway Cities Park-and-Ride Assessment
2-2 Cambridge Systematics, Inc.
Figure 2.1 Existing Park-and-Ride Lots

Gateway Cities Park-and-Ride Assessment
Cambridge Systematics, Inc. 2-3
2.2 NEW LOTS AND PLANNED EXPANSIONS Figure 2.2 illustrates the geographic location of new park-and-ride lots and existing lots with planned expansions. It also illustrates the additional parking capacity expected as a result of planned improvements. Further park-and-ride lot details can be found in Table 4.1 and Appendix A.
New Facilities
Two new park-and-ride facilities are proposed in the Gateway Cities:
Cal State Long Beach Transit Center (City of Long Beach); and
Third Street and South La Verne Avenue (Los Angeles County).
The Third Street lot will have 87 parking spaces, while the number of spaces at Cal State Long Beach has not yet been determined.
Planned Expansions
Three park-and-ride lots are expected to be expanded by the year 2035:
1. Lakewood Boulevard Metro Station (Metro);
2. Norwalk Metro Station (Metro); and
3. Willow Metro Station (Metro).
These expansions will add at least 1,300 spaces to total capacity in the Gateway Cities.

Gateway Cities Park-and-Ride Assessment
2-4 Cambridge Systematics, Inc.
Figure 2.2 Planned Park-and-Ride Projects and Expansions

Gateway Cities Park-and-Ride Assessment
Cambridge Systematics, Inc. 2-5
2.3 THE PARK-AND-RIDE DATABASE This technical memorandum summarizes results from a spreadsheet-based database of existing and proposed park-and-ride facilities in the Gateway Cities. The database is organized in five sections and each section includes several data fields. The sections and data definitions are provided below. Summaries of the database contents are presented as Table 4.1 and Appendix A.
Lot Description
Name. The title of the park-and-ride lot;
Improvement Type. Denotes whether a lot will be new construction or an improvement/expansion of an existing lot;
City. The municipality in which the parking lot is located, as indicated in project documents or approximated using data provided as part of the project;
Location. A specific description of a station area or intersection where the parking lot is located;
Transit Connections. A list of light rail and bus services that serve the park-and-ride lot;
Roadway Connections. A list of freeways, highways, and major arterials that provide automobile and bus access to the park-and-ride lot.
Owner/Operator. The agency responsible for operating and maintaining the park-and-ride lot;
Existing Lot. A yes/no field for users to quickly identify if a lot is proposed or currently in service;
Project or Improvement Status. Denotes if a proposed project is under construction, in environmental study phases, or in a proposed plan;
Project Description. A narrative of the types of capital investments planned for the park-and-ride lot;
Project New Parking Stalls. The number of additional parking spaces planned at the lot;
Project Lead. The agency responsible for managing the construction of the park-and-ride lot improvements;
Project Capital Cost in year of expenditure dollars; and
Project Funding Source.

Gateway Cities Park-and-Ride Assessment
2-6 Cambridge Systematics, Inc.
Existing Facilities
Existing Parking Stalls. The number of automobiles the lot is designed to accommodate;
Existing Parking Spaces Utilized. The number of parking spaces occupied by vehicles on an average weekday; and
Existing Parking Percent Utilized. The share of existing parking stalls occupied by vehicles on an average weekday.
Unconstrained Parking Demand
Ridership Increase –Low and High. The projected transit ridership growth rate at this park-and-ride lot for the 2035 No Build and 2035 Build scenarios from the Transit Assessment. The park-and-ride analysis is based on ridership demand forecasts shown in the Gateway Cities Transit Assessment.
2035 Parking Demand –Low and High. The projected parking demand at the lot under both scenarios from the Transit Assessment.
2035 Potential Auto VMT reduction –Low and High. The additional annual VMT reduction that is miles the parked vehicles would otherwise travel if users were not using transit.
2035 No Build and 2035 Build
The 2035 No Build and 2035 Build scenarios comprise two separate sections in the database, which both use the following data fields:
Available Parking. The number of vehicles the parking lot is designed to accommodate.
Percent (Pct.) Utilization –Low and High. The percent of parking spaces used in the 2035 Build scenario with unconstrained parking demand. Some values may exceed 100 percent (e.g., parking in aisles, on shoulders, etc.);
Capped Parking –Low and High. The number of parking spaces used, assuming parking utilization cannot exceed 100 percent;
Over Capacity –Low and High. The number of automobiles that cannot be accommodated assuming a 100 percent parking utilization cap; and
Auto VMT Reduction –Low and High. The miles the parked vehicles would otherwise travel if users were not using transit.

3-1
3.0 Data Sources We reviewed available plans, reports and studies related to park-and-ride lots. Table 3.1 lists documents referenced in this analysis. In all cases, the most recent document was considered the most accurate. Many of these documents were reviewed in conjunction with the Transit Assessment. The most relevant document was the 2012 Metro Parking Utilization and Site Assessment, as noted in Section 1.1.
Table 3.1 Prior Studies Used to Develop the Park-and-Ride Assessment
I-710 Major Corridor Study
I-710 EIR/EIS (Various Studies):
2008 SCAG RTP Traffic Model
Railroad Goods Movement Study
Alternative Goods Movement Technology Study
Multimodal Review
I-710 Geometric Studies at the SR 91 Freeway
I-605/SR 91/1- 405 Hot Spots Feasibility Study
Gateway Cities Strategic Transportation Plan – Phase I (prepared by Infraconsult, 2012)
SR 91/I-605/I-405 Project– Final Multimodal Analysis Report
Freeway Congestion Analysis Report
Arterial Intersection Congestion Analysis Report
Feasibility Report
I-5 EIR/EIS (SR 91 to I-605) – Carminita Road, Alondra Boulevard, Imperial Highway, Rosecrans Avenue, Valley View Avenue, and Florence Avenue
I-5 EIR/EIS (I-605 to I-710)
Eastside Transit Corridor Phase 2
Comprehensive Regional Goods Movement Plan and Implementation Strategy
Metro Parking Utilization and Site Assessment: Metro Rail, Orange Line, and Silver Line Stations (2012).
Multiple Orangeline Studies
SCAG 2012-2035 Regional Transportation Plan (RTP)
SCAG 2013 Federal Transportation Improvement Program (FTIP)

Gateway Cities Park-and-Ride Assessment
3-2 Cambridge Systematics, Inc.
We contacted owners, operators, and project sponsors of the park-and-ride lots to verify our sources and information. Table 3.2 lists the agencies we contacted in July 2013.
Table 3.2 Agencies Contacted to Confirm Park-and-Ride Information
Agency Relevant Lot Staff Contact Response
Metro All Metro park-and-ride lots
Lucy Olmos, Chris Joe
Detailed information for all park-and-ride lots from various sources.
Metrolink Commerce
Montebello/Commerce
Santa Fe Springs
Luis Zarza Detailed information for relevant park-and-ride lots.
City of Compton MLK Jr. Transit Center N/A No response; limited information available from Metro.
City of Montebello Taylor Ranch N/A No response; limited information available from Metro.

4-1
4.0 Database Summary All data used in the preparation of this analysis is contained in a spreadsheet database, which is available as a companion piece to this report. Table 4.1 summarizes relevant database content, including each park-and-ride lot’s name, location, description of planned projects, existing and future parking demand, existing and future parking utilization, and average weekday automobile VMT reduction. Definitions of the data fields are provided in Section 2.3. Some fields included in the full database are not presented in Table 4.1, but can be found in the spreadsheet tool.
Additional detail from the park-and-ride database, including utilization forecasts, are presented in Appendix A.

Gateway Cities Park-and-Ride Assessment
Cambridge Systematics, Inc. 4-3
Table 4.1 Park-and-Ride Facilities Overview (2013 Average Weekday)
Lot Name Type Roadway Connections Transit Connections Existing Parking
Existing Utilization
2035 Parking Demand –Low
2035 Parking Demand –
High
2035 NB Available Parking
2035 NB VMT Reduction –
Low
2035 NB VMT Reduction –
High
2035 Build Available Parking
2035 Build VMT Reduction –
Low
2035 Build VMT Reduction –
High
Unconstr. VMT Reduction –
Low
Unconstr. VMT Reduction –
High
103rd Streeta Existing I-105, I-110, S Alameda St Metro: Bluec, 117, 254, 305, 612, 55/355
63 0 0 0 63 0 0 63 0 0 0 0
Artesia Existing CA-91, I-710, S Alameda St Metro: Bluec, 60, 130, 205, 260, 762 287 238 262 281 287 7,022 7,533 287 7,022 7,533 7,022 7,533
Atlantic Existing CA-60, I- 710 Pomona Blvd, S Atlantic Blvd, E Beverly Blvd
Metro: Goldc, 68, 260, 762 262 139 153 164 262 4,094 4,391 262 4,094 4,391 4,094 4,391
Cal State Long Beach Transit Centerb
New CA-1, I-405, Bellflower Blvd To be determined (TBD) TBD
Commerce Existing I-5, E Washington Blvd, S Garfield Ave
Metrolink 91 and OCc 135 22 31 70 135 825 1,887 135 825 1,887 825 1,887
Del Amo Existing I-710, CA-91, Del Amo Blvd, I-405
Metro: Bluec, 202 367 345 379 397 367 9,836 9,836 367 9,836 9,836 10,170 10,632
Florence Existing E Florence Ave, Compton Ave, S Alameda St
Metro: Bluec, 102, 110, 611, 111/311 115 109 120 126 115 3,082 3,082 115 3,082 3,082 3,221 3,367
Indiana Existing CA-60, I-5, N Indiana St Metro: Goldc, 30, 68, 254, 620, 665 42 19 21 22 42 557 582 42 557 582 557 582
Lakewood Blvd Expansion I-105, Lakewood Blvd, Imperial Hwy
Metro: Greenc, 117, 265, 266 414 447 492 514 414 11,095 11,095 644 13,181 13,780 13,181 13,780
Lakewood West Existing I-5, I-605, Lakewood Blvd Metro 62, 266 (Indirect connection) 83 53 58 58 83 1,564 1,564 83 1,564 1,564 1,564 1,564
Long Beach Blvd Existing I-105, Long Beach Blvd Metro: Greenc, 60, 251, 760 646 239 263 275 646 7,046 7,367 646 7,046 7,367 7,046 7,367
MLK Jr. Transit Center (Compton Station)
Existing S Alameda St, Rosecrans Ave, Compton Blvd
Metro: Bluec, 51/52/352, 60, 125, 127, 128, 202
330 165 182 190 330 4,864 5,085 330 4,864 5,085 4,864 5,085
Montebello/Commerce Existing I-5, S Garfield Ave, Whittier Blvd Metrolink: Riversidec, Metro: 18, 66 255 185 259 592 255 6,834 6,834 255 6,834 6,834 6,941 15,866
Norwalk Existing I-105, I-605, Imperial Hwy Metro: Greenc, 115, 125, 270, 460, 111/311
2,050 2194 2,413 2,523 2,050 54,940 54,940 2,050 54,940 54,940 64,664 67,604
Norwalk/Santa Fe Springs 1 and 2
Existing Imperial Hwy, Bloomfield Ave, I-5 Metrolink: 91 c, Metro: Orange 694 475 665 1,520 694 17,822 18,599 844 17,822 22,619 17,822 40,736
Taylor Ranch Existing I-60 Montebello Express 341 40 30 33 35 40 884 925 40 884 925 884 925
Third Street and South La Verne Ave
New CA-60, E 3rd St, S Atlantic Blvd, S Mednik Ave
Metro: 68c, 258, 260, 762 N/A 87 1,359 1,458 1,359 1,458
Wardlow Existing I-405, I-710, N Pacific Pl, W Wardlow Rd
Metro: Bluec 115 105 115 120 115 3,082 3,082 115 3,082 3,082 3,085 3,225
Willow Expansion Long Beach Blvd, E Willow St, I-405
Metro: Bluec, 60 899 836 920 961 899 24,093 24,093 1,819 24,647 25,768 24,647 25,768
Willowbrook Existing I-105, S Wilmington Ave, Imperial Hwy
Metro: Bluec, Green, 120, 202, 205, 305, 612, 55/355
335 147 162 170 335 4,345 4,543 335 4,345 4,543 4,345 4,543
Total 7,132 5,748 6,578 8,071 7,132 161,986 165,438 8,513 165,986 175,275 176,294 216,313 a Metro estimated 0 percent utilization at this lot in 2012, which we assumed would not change in future scenarios. b Detailed information on this proposed station not available at the time of this report. c Denotes the route with highest ridership growth by year 2035, based on the Gateway Cities Transit Assessment.

5-1
5.0 Findings This section summarizes the park-and-ride analysis results for existing conditions and three future year scenarios. Details can be found in the summary data in Table 4.1, and the supplementary data table in Appendix A.
5.1 EXISTING CONDITIONS Park-and-ride facilities in and adjacent to the Gateway Cities provide daily parking capacity for about 7,130 vehicles, of which an average of 5,750 is used each weekday. These lots range in size from 42 spaces (Indiana Metro station) to 2,050 (Norwalk Metro station).
Capacity and Utilization
Table 5.1 indicates all park-and-ride lots over or near capacity in existing conditions. Two park-and-ride facilities currently operate over-capacity:
Lakewood Blvd – 108 percent utilization; and
Norwalk – 107 percent.
Both stations have planned expansion and improvement projects that will alleviate some parking congestion by the year 2035.
Four stations are approaching capacity under existing conditions:
Florence – 95 percent utilization;
Del Amo – 94 percent;
Willow – 93 percent; and
Wardlow – 91 percent.
Of these, only the Willow Metro station has planned improvements to alleviate these capacity concerns under the 2035 Build scenario.
The lowest utilization rate is reported at the 103rd Street Metro Blue Line station.
Automobile VMT Reduction
Existing park-and-ride lots help reduce automobile travel in the Gateway Cities by an estimated 154,000 vehicle miles each weekday, or 46.0 million annually.
Gateway Cities Park-and-Ride Assessment
5-2 Cambridge Systematics, Inc.
Table 5.1 Existing Park-and-Ride Lots and Capacity Constraints
Lot Name Transit Connections Parking Stalls Utilization Rate
Over Capacity
Lakewood Boulevard Green Line; Buses 117, 265, 266 414 108%
Norwalk Green Line, Buses 115, 125, 270, 460, 111/311
2,050 107%
Nearing Capacity
Del Amo Blue Line, Bus 202 367 94%
Florence Blue Line; Buses 102, 110, 611, 111/311
115 95%
Wardlow Blue Line 115 91%
Willow Blue Line, Bus 60 899 93%
Source: Cambridge Systematics, Inc.; based on Gateway Cities Transit Assessment (2013), and Metro Parking Utilization and Site Assessment: Metro Rail, Orange Line, and Silver Line Stations (2012).
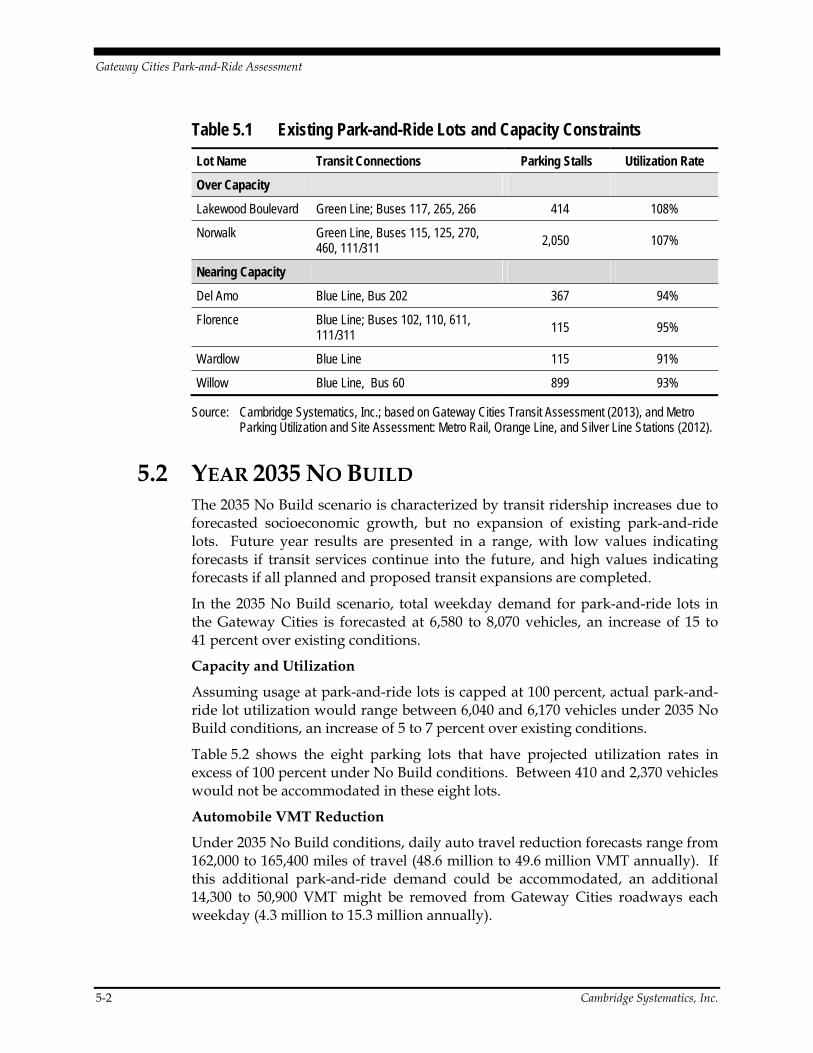
5.2 YEAR 2035 NO BUILD The 2035 No Build scenario is characterized by transit ridership increases due to forecasted socioeconomic growth, but no expansion of existing park-and-ride lots. Future year results are presented in a range, with low values indicating forecasts if transit services continue into the future, and high values indicating forecasts if all planned and proposed transit expansions are completed.
In the 2035 No Build scenario, total weekday demand for park-and-ride lots in the Gateway Cities is forecasted at 6,580 to 8,070 vehicles, an increase of 15 to 41 percent over existing conditions.
Capacity and Utilization
Assuming usage at park-and-ride lots is capped at 100 percent, actual park-and-ride lot utilization would range between 6,040 and 6,170 vehicles under 2035 No Build conditions, an increase of 5 to 7 percent over existing conditions.
Table 5.2 shows the eight parking lots that have projected utilization rates in excess of 100 percent under No Build conditions. Between 410 and 2,370 vehicles would not be accommodated in these eight lots.
Automobile VMT Reduction
Under 2035 No Build conditions, daily auto travel reduction forecasts range from 162,000 to 165,400 miles of travel (48.6 million to 49.6 million VMT annually). If this additional park-and-ride demand could be accommodated, an additional 14,300 to 50,900 VMT might be removed from Gateway Cities roadways each weekday (4.3 million to 15.3 million annually).
Gateway Cities Park-and-Ride Assessment
Cambridge Systematics, Inc. 5-3
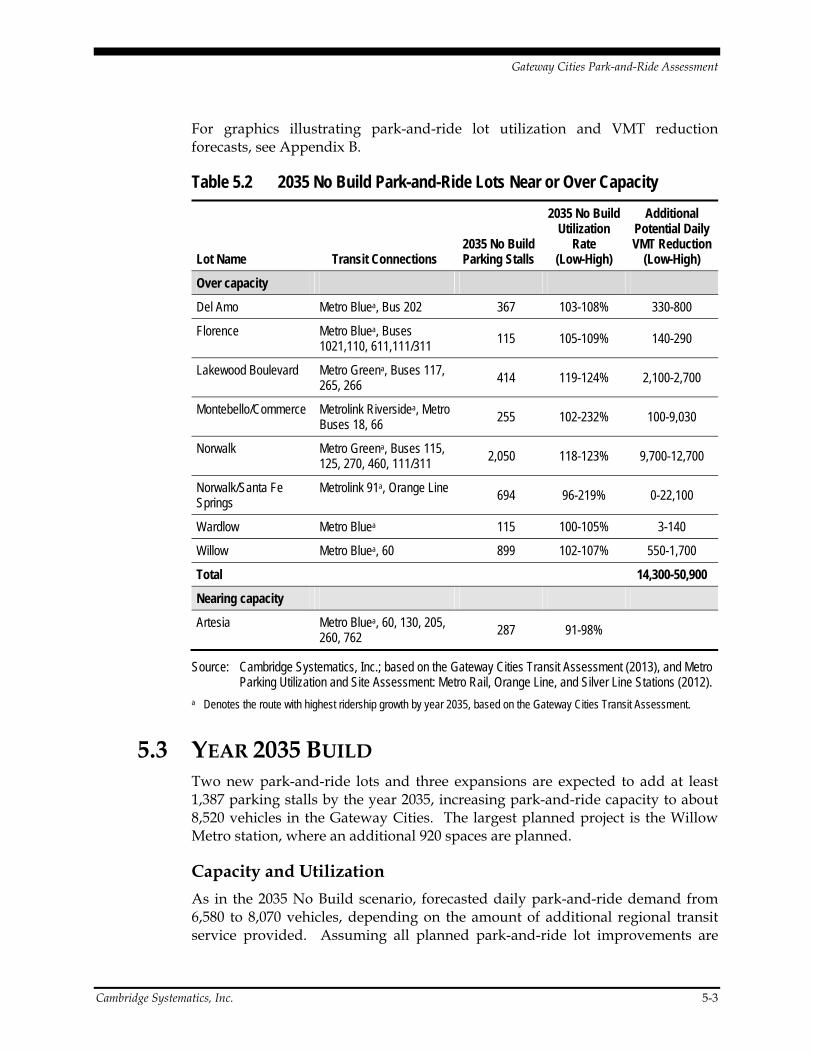
For graphics illustrating park-and-ride lot utilization and VMT reduction forecasts, see Appendix B.
Table 5.2 2035 No Build Park-and-Ride Lots Near or Over Capacity
Lot Name Transit Connections 2035 No Build Parking Stalls
2035 No Build Utilization
Rate (Low-High)
Additional Potential Daily VMT Reduction
(Low-High)
Over capacity
Del Amo Metro Bluea, Bus 202 367 103-108% 330-800
Florence Metro Bluea, Buses 1021,110, 611,111/311
115 105-109% 140-290
Lakewood Boulevard Metro Greena, Buses 117, 265, 266
414 119-124% 2,100-2,700
Montebello/Commerce Metrolink Riversidea, Metro Buses 18, 66
255 102-232% 100-9,030
Norwalk Metro Greena, Buses 115, 125, 270, 460, 111/311 2,050 118-123% 9,700-12,700
Norwalk/Santa Fe Springs
Metrolink 91a, Orange Line 694 96-219% 0-22,100
Wardlow Metro Bluea 115 100-105% 3-140
Willow Metro Bluea, 60 899 102-107% 550-1,700
Total 14,300-50,900
Nearing capacity
Artesia Metro Bluea, 60, 130, 205, 260, 762 287 91-98%
Source: Cambridge Systematics, Inc.; based on the Gateway Cities Transit Assessment (2013), and Metro Parking Utilization and Site Assessment: Metro Rail, Orange Line, and Silver Line Stations (2012).
a Denotes the route with highest ridership growth by year 2035, based on the Gateway Cities Transit Assessment.
5.3 YEAR 2035 BUILD Two new park-and-ride lots and three expansions are expected to add at least 1,387 parking stalls by the year 2035, increasing park-and-ride capacity to about 8,520 vehicles in the Gateway Cities. The largest planned project is the Willow Metro station, where an additional 920 spaces are planned.
Capacity and Utilization
As in the 2035 No Build scenario, forecasted daily park-and-ride demand from 6,580 to 8,070 vehicles, depending on the amount of additional regional transit service provided. Assuming all planned park-and-ride lot improvements are

Gateway Cities Park-and-Ride Assessment
5-4 Cambridge Systematics, Inc.
constructed and parking is capped at 100 percent utilization at all stations, actual utilization in the Gateway Cities would range between 6,190 and 6,540 daily, an increase of 3-6 percent over 2035 No Build conditions.
Table 5.3 shows the six parking lots in the 2035 Build scenario that have projected utilization rates in excess of 100 percent. This insufficient capacity results in 100 to 1,870 vehicles being turned away to due insufficient capacity.
Table 5.3 2035 Build Park-and-Rides Over and Nearing Capacity
Lot Name Transit Connections 2035 No Build Parking Stalls
2035 No Build Utilization Rate
(Low-High)
Additional Potential Daily VMT Reduction
(Low-High)
Over Capacity
Del Amo Metro Bluea, Bus 202 367 103-108% 330-800
Florence Metro Bluea, Buses 1021,110, 611,111/311
115 105-109% 140-290
Montebello/Commerce Metrolink Riversidea, Buses 18, 66
255 102-232% 110-9,030
Norwalk Metro Greena, Buses 115, 125, 270, 460, 111/311
2,050 118-123% 9,700-12,700
Norwalk/Santa Fe Springs
Metrolink 91a, Metro Orange Line
844 79-180% 0-18,100
Wardlow Metro Bluea 115 100-105% 3-140
Total 10,300-41,000
Nearing Capacity
Artesia Metro Bluea, 60, 130, 205, 260, 762 287 91%-98%
Source: Cambridge Systematics, Inc.; based on the Gateway Cities Transit Assessment (2013), and Metro Parking Utilization and Site Assessment: Metro Rail, Orange Line, and Silver Line Stations (2012).
a Denotes the route with highest ridership growth by year 2035, based on the Gateway Cities Transit Assessment.
Automobile VMT Reduction
Due to planned park-and-ride improvements in the 2035 Build scenario, daily VMT reduction increases to 166,000 to 175,300 miles daily (49.8 million to 52.6 million annually), an improvement of 2 to 6 percent versus 2035 No Build conditions. If additional park-and-ride demand could be accommodated at regional lots, approximately 10,300 to 41,000 additional daily VMT might be removed from Gateway Cities roadways (3.1 million to 12.3 million annually).
For graphics illustrating park-and-ride lot utilization and VMT reduction forecasts, see Appendix B.

Gateway Cities Park-and-Ride Assessment
Cambridge Systematics, Inc. 5-5
5.4 YEAR 2035 UNCONSTRAINED As seen in the 2035 No Build and 2035 Build scenarios, limited capacity at certain park-and-ride lots can turn many would-be transit users back onto congested roadways. In the 2035 Unconstrained scenario, we assume that all parking demand is accommodated at each station.
Under this assumption, park-and-ride lot capacity in the Gateway Cities would range between 6,550 and 8,040 vehicles. The resulting reduction in daily miles of auto travel would range from 175,400 to 215,400 daily (52.6 million to 64.6 million annually). This would represent an 8- to 24-percent increase over 2035 No Build and 6 to 19 percent increase over 2035 Build conditions.
Figure 5.1 illustrates the annual VMT reduction for all three 2035 scenarios, assuming all planned and proposed transit facilities are implemented by 2035.
Figure 5.1 Annual VMT Reduction in 2035 Scenarios (High Transit)
Source: Gateway Cities Transit Assessment (2013), and Metro Parking Utilization and Site Assessment:
Metro Rail, Orange Line, and Silver Line Stations (2012).
5.5 SUMMARY Park-and-ride lots provide an attractive alternative to many commuters who wish to avoid traffic congestion but do not live adjacent to a convenient transit access point. The combination of planned transit expansions and forecasted traffic growth on the Gateway Cities’ already congested roadways will likely make transit a more attractive commute option to those who would otherwise use freeways or arterial highways to travel to and from work during the week.

Gateway Cities Park-and-Ride Assessment
5-6 Cambridge Systematics, Inc.
Based on extrapolation of past trends and existing conditions, we estimate six of the 20 park-and-ride lots within the Gateway Cities will be over capacity by 2035. These lots represent potential targets for expansion. In addition, proposed light rail enhancements such as the Gold Line extension and ECO Rapid Transit may represent additional opportunities for future park-and-ride lot projects.
Our analysis indicates that park-and-ride lots currently help reduce about 46.1 million annual automobile VMT in the Gateway Cities. Given anticipated growth in regional transit demand, this figure could approach 64.8 million by 2035 if all parking demand is met, an increase of about 41 percent. To put this in regional perspective, these reductions amount to about a half-percent of existing annual VMT within the Gateway Cities, which has been estimated at upwards of 11 billion.
Note that while increased demand for park-and-ride lots will contribute to congestion reduction on area freeways and highways, individual park-and-ride lot areas may experience higher levels of localized congestion. Such impacts may be successfully mitigated through targeted station area planning efforts.
Opportunities for Further Study
This assessment illustrates potential park-and-ride lot demand and capacity issues using a planning-level approach and readily available data, with the expectation that further study is needed to refine and prioritize new investments. Such studies may include:
Multi-resolution modeling. As part of the Gateway Cities Strategic Transportation Plan, Metro and the Gateway Cities Council of Governments are overseeing the development of a new state-of-the-art multi-resolution model to evaluate local transportation conditions and improvements in the subregion. Once operational, the model will allow more rigorous analysis of the interplay between transit and other travel modes, including demand for park-and-ride services. This analysis could offer more insights into the types of auto trips impacted by park-and-ride lots, for instance, which trips are removed from freeways or arterial highways, and impacts on regional congestion. Note that the data generated by more rigorous methods is likely to differ, in some cases significantly, from figures generated in this planning-level analysis.
Station area planning and design. Efficient expansion of park-and-ride lots requires a detailed understanding of the station site, surrounding areas, and residents’ methods of access. Local communities and transit agencies should coordinate in the analysis of individual lots in order to prioritize planned park-and-ride enhancements and expansions. This includes identifying site-specific needs and solutions for meeting parking demand, ensuring efficient local traffic circulation, mitigating conflicts between access modes, and prioritizing user safety and security.

A-1
A. Park-and-Ride Database This appendix includes a supplementary summary of the park-and-ride database. The database is summarized in Table A.1, featuring five sections: lot description; existing facilities; unconstrained parking demand; 2035 No Build; 2035 Build; and 2035 Unconstrained. Each section has several data fields described below.
For an explanation of the development of low and high estimates, see Section 1.2.
A.1 LOT DESCRIPTION Name. The title of the park-and-ride lot;
Location. A specific description of a station area or intersection where the parking lot is located;
Transit Connections. Public transportation serving the park-and-ride lot;
Roadway Connections. A list of freeways, highways, and major arterials that provide automobile and bus access to the park-and-ride lot.
A.2 EXISTING FACILITIES Parking Spaces. The number of automobiles the lot is designed for;
Parking Spaces Utilized. The number of parking spaces occupied by vehicles on an average weekday; and
Parking Percent Utilized. The share of existing parking stalls occupied by vehicles on an average weekday. Bold text indicates utilization rates that are near capacity (90 to 100 percent) or over capacity.
A.3 UNCONSTRAINED PARKING DEMAND Ridership Increase – Low and High. The projected transit ridership growth
rate at this park-and-ride lot for the 2035 No Build and 2035 Build scenarios from the Transit Assessment. The park-and-ride analysis is based on ridership demand forecasts shown in the Gateway Cities Transit Assessment.
2035 Parking Demand – Low and High. The projected parking demand at the lot under both scenarios from the Transit Assessment.

Gateway Cities Park-and-Ride Assessment Appendix
A-2 Cambridge Systematics, Inc.
2035 Potential Automobile VMT reduction – Low and High. The additional annual VMT reduction that is miles the parked vehicles would otherwise travel if users were not using transit.
A.4 2035 NO BUILD AND 2035 BUILD The 2035 No Build and 2035 Build scenarios comprise two separate sections in the database, which both use the following data fields:
Parking Spaces. The number of vehicles the parking lot is designed for.
Percent Utilization –Low and High. The average percent of parking spaces occupied in the 2035 scenario with unconstrained parking demand. Bold text indicates utilization rates that are approaching or over capacity (90+ percent).
Capped Parking –Low and High. The number of parking spaces used, assuming a maximum 100 percent parking utilization;
Over Capacity –Low and High. The number of automobiles that cannot be accommodated assuming a maximum 100 percent parking utilization; and
Automobile VMT Reduction –Low and High. The miles the parked vehicles would otherwise travel if users were not using transit.

Gateway Cities Park-and-Ride Assessment Appendix
Cambridge Systematics, Inc. A-3
Table A.1 Park-and-Ride Database
Name Location Transit
Connections Roadway
Connections
Existing Scenario (2011) 2035 Unconstrained Scenario 2035 No Build Scenario 2035 Build Scenario
Parking Spaces
Parking Spaces Utilized
Parking Percent Utilized
VMT Avoided
Ridership Increase
2035 Parking Demand
2035 Potential Auto VMT Avoided
Parking Spaces
Percent Utilization Capped Parking Over Capacity
Capped Percent Utilization
Auto VMT Avoided
Parking Spaces
Percent Utilization
Capped Parking Over Capacity
Capped Percent
Utilization Auto VMT Avoided
Low High Low High Low High Low High Low High Low High Low High Low High Low High Low High Low High Low High Low High
103rd Street Metro Bluea, 117, 254, 305, 612, 55/355
I-105, I-110, S Alameda St
63 0 0% 0 10% 15% 0 0 0 0 63 0% 0% 0 0 0 0 0% 0% – – 63 0% 0% 0 0 0 0 0% 0% – –
Artesia Artesia Metro Station
Metro Bluea, 60, 130, 205, 260, 762
CA-91, I-710, S Alameda St
287 238 83% 6,384 10% 18% 262 281 7,022 7,533 287 91% 98% 262 281 0 0 91% 98% 7,022 7,533 287 91% 98% 262 281 0 0 100% 100% 7,022 7,533
Atlantic Atlantic Station Metro Golda, 68, 260, 762
CA-60, I-710 Pomona Blvd, S Atlantic Blvd, E Beverly Blvd
262 139 53% 3,721 10% 18% 153 164 4,094 4,391 262 58% 63% 153 164 0 0 58% 63% 4,094 4,391 262 58% 63% 153 164 0 0 58% 63% 4,094 4,391
Cal State Long Beach Transit Center
Long Beach Undetermined Local and regional connections
Undetermined To be determined. Information for this park-and-ride lot is still in the early planning stages and no further information was available.
Commerce Commerce Metrolink Station
Metrolink 91 and OCa
I-5, E Washington Blvd, S Garfield Ave
135 22 16% 590 40% 220% 31 70 825 1,887 135 23% 52% 31 70 0 0 23% 52% 825 1,887 135 23% 52% 31 70 0 0 23% 52% 825 1,887
Del Amo Del Amo Metro Station
Metro Bluea, 202
I-710, CA-91, Del Amo Blvd, I-405
367 345 94% 9,245 10% 15% 379 397 10,170 10,632 367 103% 108% 367 367 12 30 100% 100% 9,836 9,836 367 103% 108% 367 367 12 30 100% 100% 9,836 9,836
Florence Florence Metro Station
Metro Bluea, 102, 110, 611, 111/311
E Florence Ave, Compton Ave, S Alameda St
115 109 95% 2,928 10% 15% 120 126 3,221 3,367 115 105% 109% 115 115 5 11 100% 100% 3,082 3,082 115 105% 109% 115 115 5 11 100% 100% 3,082 3,082
Indiana Indiana Station Metro Golda, 30, 68, 254, 620, 665
CA-60, I-5, N Indiana St
42 19 45% 507 10% 15% 21 22 557 582 42 50% 52% 21 22 0 0 50% 52% 557 582 42 50% 52% 21 22 0 0 50% 52% 557 582
Lakewood Blvd
Lakewood Blvd Metro Station
Metro Greena, 117, 265, 266
I-105, Lakewood Blvd, Imperial Hwy
414 447 108% 11,983 10% 15% 492 514 13,181 13,780 414 119% 124% 414 414 78 100 100% 100% 11,095 11,095 644 76% 80% 492 514 0 0 76% 80% 13,181 13,780
Lakewood West
Lakewood Blvd/ I-5 Interchange
Metro 62, 266 (No direct connection)
I-5, I-605, Lakewood Blvd
83 53 64% 1,421 10% 10% 58 58 1,564 1,564 83 70% 70% 58 58 0 0 70% 70% 1,564 1,564 83 70% 70% 58 58 0 0 70% 70% 1,564 1,564
Long Beach Blvd
Long Beach Boulevard Metro Station
Metro Greena, 60, 251, 760
I-105, Long Beach Blvd
646 239 37% 6,406 10% 15% 263 275 7,046 7,367 646 41% 43% 263 275 0 0 41% 43% 7,046 7,367 646 41% 43% 263 275 0 0 41% 43% 7,046 7,367
MLK Jr. Transit Center
Metro Blue Line Compton Station – adjacent
Metro Bluea, 51/52/352, 60, 125, 127, 128, 202
S Alameda St, Rosecrans Ave, Compton Blvd
330 165 50% 4,422 10% 15% 182 190 4,864 5,085 330 55% 58% 182 190 0 0 55% 58% 4,864 5,085 330 55% 58% 182 190 0 0 55% 58% 4,864 5,085
Montebello/ Commerce
Montebello/ Commerce Metrolink Station
Metrolink Riversidea, Metro 18, 66
I-5, S Garfield Ave, Whittier Blvd
255 185 73% 4,958 40% 220% 259 592 6,941 15,866 255 102% 232% 255 255 4 337 100% 100% 6,834 6,834 255 102% 232% 255 255 4 337 100% 100% 6,834 6,834

Gateway Cities Park-and-Ride Assessment Appendix
Cambridge Systematics, Inc. A-5
Table A.1 Park-and-Ride Lot Utilization and VMT Detail (continued)
Name Location Transit
Connections Roadway
Connections
Existing Scenario (2011) 2035 Unconstrained Scenario 2035 No Build Scenario 2035 Build Scenario
Parking Stalls Number Percent
VMT Avoided
Ridership Increase
2035 Parking Demand
2035 Potential Auto VMT Avoided Avail.
Parking No Build
Percent Utilization Capped Parking Over Capacity
Capped Percent Utilization
Auto VMT Avoided Avail.
Parking Build
Percent Utilization –
Transit
Capped Parking –
Transit
Over Capacity –
Transit
Capped Percent
Utilization – Transit
Auto VMT Avoided –
Transit
Low High Low High Low High Low High Low High Low High Low High Low High Low High Low High Low High Low High Low High
Norwalk Norwalk Metro Station
Metro Greena, 115, 125, 270, 460, 111/311
I-105, I-605, Imperial Hwy
2050 2194 107% 58,786 10% 15% 2413 2523 64,664 67,604 2,050 118% 123% 2,050 2,050 363 473 100% 100% 54,940 54,940 2,050 118% 123% 2,050 2,050 363 473 100% 100% 54,940 54,940
Norwalk/ Santa Fe Springs
Norwalk/ Santa Fe Springs Station
Metrolink 91, Metro Orangea, 121, Norwalk Transit 3 and 4, City of SFS MetroExpress
Imperial Hwy, Bloomfield Ave, I-5
694 475 68% 12,730 40% 220% 665 1520 17,822 40,736 694 96% 219% 665 694 0 826 96% 100% 17,822 18,599 844 79% 180% 665 844 0 676 79% 100% 17,822 22,619
Taylor Ranch
Lincoln and Montebello
Montebello Express 341
Montebello 40 30 75% 804 10% 15% 33 35 884 925 40 83% 86% 33 35 0 0 83% 86% 884 925 40 83% 86% 33 35 0 0 83% 86% 884 925
Third Street and South La Verne Ave
Metro 68, 258, 260, 762
CA-60, E Third St, S Atlantic Blvd, S Mednik Ave
0 0 0% 0 10% 18% 51 54 1,359 1,458 0 0 0 51 54 - - 87 58% 63% 51 54 0 0 58% 63% 1,359 1,458
Wardlow Wardlow Metro Station
Metro Bluea I-405, I-710, N Pacific Pl, W Wardlow Rd
115 105 91% 2,805 10% 15% 115 120 3,085 3,225 115 100% 105% 115 115 0 5 100% 100% 3,082 3,082 115 100% 105% 115 115 0 5 100% 100% 3,082 3,082
Willow Willow Metro Station
Metro Bluea, 60 Long Beach Blvd, E Willow St, I-405
899 836 93% 22,407 10% 15% 920 961 24,647 25,768 899 102% 107% 899 899 21 62 100% 100% 24,093 24,093 1,819 51% 53% 920 961 0 0 51% 53% 24,647 25,768
Willowbrook Willowbrook Metro Station
Metro Bluea, Green, 120, 202, 205, 305, 612, 55/355
I-105, S Wilmington Ave, Imperial Hwy
335 147 44% 3,950 10% 15% 162 170 4,345 4,543 335 48% 51% 162 170 0 0 48% 51% 4,345 4,543 335 48% 51% 162 170 0 0 48% 51% 4,345 4,543
Sources: Gateway Cities Transit Assessment, 2013; Metro Parking Utilization and Site Assessment: Metro Rail, Orange Line, and Silver Line Stations, 2012.
Bold text Indicates utilization rates that are approaching or over capacity (90+ percent)
a Denotes the route with highest ridership growth by year 2035, based on the Gateway Cities Transit Assessment.

B-1
B. Station-Specific Parking Utilization and VMT Reduction Charts This appendix includes supplementary charts illustrating forecasted park-and-ride lot utilization rates and annual automobile VMT reduction. The results are presented for both the 2035 No Build and 2035 Build scenarios. For an explanation of the low and high estimates, see Section 1.2. For more detail on underlying results, see Section 6.0.

Gateway Cities Park-and-Ride Assessment Appendix
B-2 Cambridge Systematics, Inc.
Figure B.1 2035 No Build Parking Utilization
Sources: Metro Parking Utilization and Site Assessment: Metro Rail, Orange Line, and Silver Line Stations, 2012; Gateway
Cities Strategic Transportation Plan Transit Assessment, 2013.
0%
50%
100%
150%
200%
250%
Util
izat
ion
Rat
e
Low High

Gateway Cities Park-and-Ride Assessment Appendix
Cambridge Systematics, Inc. B-3
Figure B.2 2035 Build Parking Utilization
Sources: Metro Parking Utilization and Site Assessment: Metro Rail, Orange Line, and Silver Line Stations, 2012; Gateway
Cities Strategic Transportation Plan Transit Assessment, 2013.
0%
50%
100%
150%
200%
250%
Utilization Rate
Low High
Gateway Cities Park-and-Ride Assessment Appendix
B-4 Cambridge Systematics, Inc.
Figure B.3 2035 No Build Average Weekday Auto VMT Reduced
Sources: Metro Parking Utilization and Site Assessment: Metro Rail, Orange Line, and Silver Line Stations, 2012; Gateway
Cities Strategic Transportation Plan Transit Assessment, 2013.
-
10,000
20,000
30,000
40,000
50,000
60,000
Low High

Gateway Cities Park-and-Ride Assessment Appendix
Cambridge Systematics, Inc. B-5
Figure B.4 2035 Build Average Weekday Auto VMT Reduced
Sources: Metro Parking Utilization and Site Assessment: Metro Rail, Orange Line, and Silver Line Stations, 2012; Gateway
Cities Strategic Transportation Plan Transit Assessment, 2013.
-
10,000
20,000
30,000
40,000
50,000
60,000
Low High