gating strategies for facs analyses of different cells ... · supplementary figure 4: dc-lmp1/cd40...
TRANSCRIPT
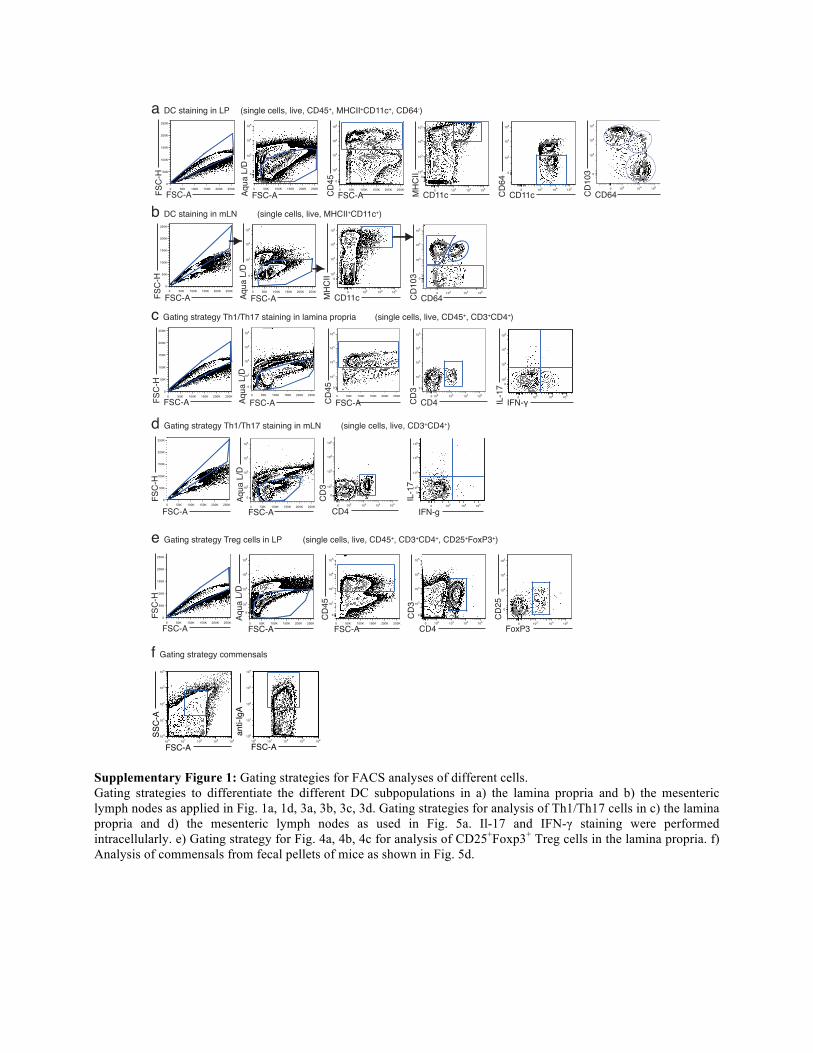
Supplementary Figure 1: Gating strategies for FACS analyses of different cells. Gating strategies to differentiate the different DC subpopulations in a) the lamina propria and b) the mesenteric lymph nodes as applied in Fig. 1a, 1d, 3a, 3b, 3c, 3d. Gating strategies for analysis of Th1/Th17 cells in c) the lamina propria and d) the mesenteric lymph nodes as used in Fig. 5a. Il-17 and IFN-γ staining were performed intracellularly. e) Gating strategy for Fig. 4a, 4b, 4c for analysis of CD25+Foxp3+ Treg cells in the lamina propria. f) Analysis of commensals from fecal pellets of mice as shown in Fig. 5d.
a DC staining in LP (single cells, live, CD45+, MHCII+CD11c+, CD64-)
0 50K 100K 150K 200K 250K
0
103
104
105
0 50K 100K 150K 200K 250K
0
102
103
104
105
0 103 104 105
0102
103
104
105
0 103 104 105
0
103
104
105
45
0
103
104
105
0 103 104 1050 50K 100K 150K 200K 250K
0
50K
100K
150K
200K
250K
FSC-AFSC
-H
FSC-AAqua
L/D
FSC-ACD
45
CD11cMH
CII
CD11cCD
64
CD64CD
103
b DC staining in mLN
0 103 104 105
0
103
104
105
0 50K 100K 150K 200K 250K
0
50K
100K
150K
200K
250K
0 50K 100K 150K 200K 250K
0
103
104
105
0 103 104 105
0102
103
104
105
FSC-AFSC
-H
FSC-AAqua
L/D
CD11cMH
CII
CD64CD
103
(single cells, live, MHCII+CD11c+)
c Gating strategy Th1/Th17 staining in lamina propria (single cells, live, CD45+, CD3+CD4+)
0 50K 100K 150K 200K 250K
0
102
103
104
105
0 50K 100K 150K 200K 250K
0
102
103
104
105
0 102 103 104 105
0
102
103
104
105
18.7
0 50K 100K 150K 200K 250K
0
50K
100K
150K
200K
250K
FSC-AFSC
-H
FSC-AAqua
L/D
FSC-ACD
45
CD4CD
3IFN-γIL
-17
0 103 104 105
0102
103
104
105
0102
103
104
105
0 103 104 105
0 50K 100K 150K 200K 250K
0
102
103
104
105
0 102 103 104 105
0
2
103
104
105
d Gating strategy Th1/Th17 staining in mLN (single cells, live, CD3+CD4+)
0 50K 100K 150K 200K 250K
0
50K
100K
150K
200K
250K
FSC-A
FSC
-H
FSC-A
Aqua
L/D
CD4
CD
3
IFN-g
IL-1
7
e Gating strategy Treg cells in LP (single cells, live, CD45+, CD3+CD4+, CD25+FoxP3+)
0 50K 100K 150K 200K 250K
0
102
103
104
105
0 50K 100K 150K 200K 250K
0
102
103
104
105
0 102 103 104 105
0
102
103
104
105
0 103 104 105
0
103
104
105
0 50K 100K 150K 200K 250K
0
50K
100K
150K
200K
250K
FSC-A
FSC
-H
FSC-A
Aqua
L/D
FSC-A
CD
45
CD4
CD
3
FoxP3
CD
25
SSC
-A
FSC-A FSC-A
anti-
IgA
100 101 102 103 104100
101
102
103
104
100 101 102 103 104100
101
102
103
104
f Gating strategy commensals
10

Supplementary Figure 2: Mice were injected with 200 µg anti-CD40 mAb and DC from LP were analysed 24 hours later. Dendritic cells (live, single cells, CD45+MHCII+CD11c+CD64-; gating not shown) were further analysed for subpopulations with CD103 and CD11b as shown in the left panel. Gates of the three main subpopulations are shown and were further analysed for active Caspase3 (middle panel). The percentages and total numbers of the active caspase 3+ DC are shown in the bar graphs (right-hand panel). One representative experiment out two is shown. Depicted is the mean ± s.e.m. of (Ctr, n=3, +anti-CD40, n=4) individual female 8-10 wk old animals per group. *P<0.05; **P<0.01; ***P<0.001; n.d., two-tailed unpaired t-test.
CD11b
CD
103
Ctr anti-CD40
0 103 104 1050 103 104 105
0
102
103
104
105
0
102
103
104
105
0
102
103
104
105
0 103 104 105
0
102
103
104
105
0 103 104 105
act. Caspase3
CD
103
Ctr anti-CD40
CD11b-
CD103+
CD11b+
CD103+
CD11b+
CD103-
% C
aspa
se 3
+ DC
CD11b-
CD103+CD11b+
CD103+CD11b+
CD103-
cell
num
ber [
*103 ]
0
10
20
30
0
5
10
15
20 **
0
5
10
15
20
Ctr
+aCD40
0
1
2
3
4
5 *
Ctr
+aCD40
0.0
0.2
0.4
0.6
0.8 ***
Ctr
+aCD40
0
2
4
6
8
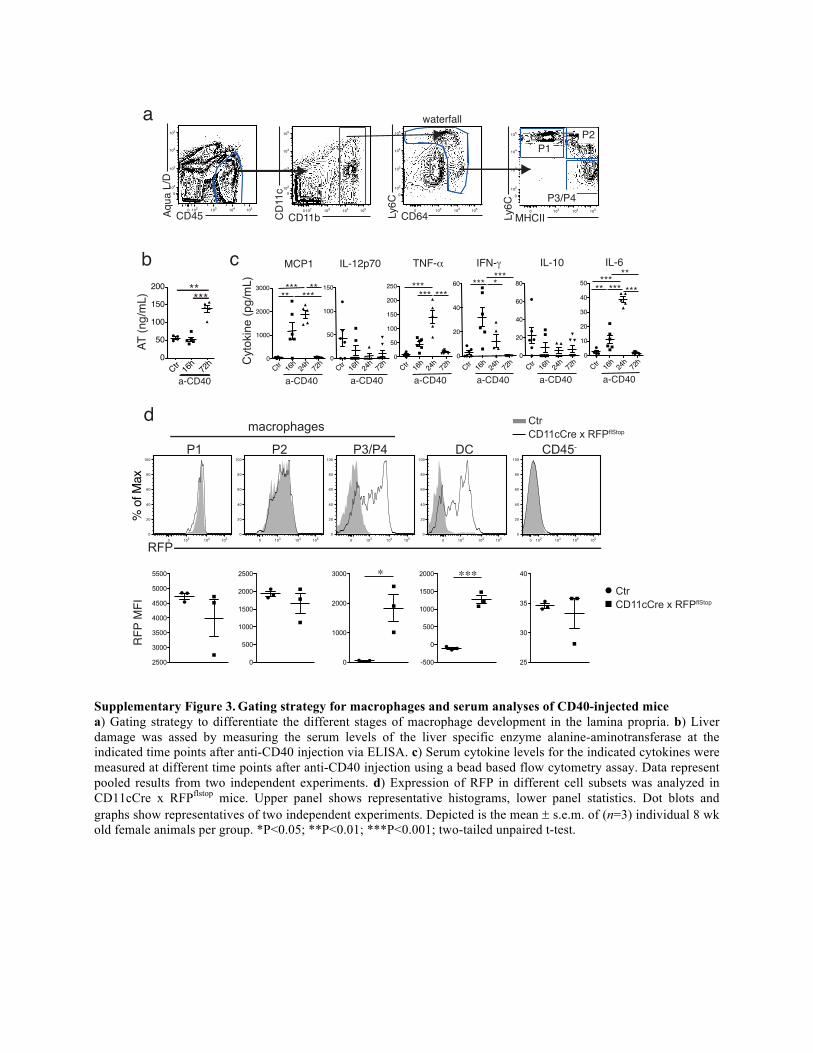
Supplementary Figure 3. Gating strategy for macrophages and serum analyses of CD40-injected mice a) Gating strategy to differentiate the different stages of macrophage development in the lamina propria. b) Liver damage was assed by measuring the serum levels of the liver specific enzyme alanine-aminotransferase at the indicated time points after anti-CD40 injection via ELISA. c) Serum cytokine levels for the indicated cytokines were measured at different time points after anti-CD40 injection using a bead based flow cytometry assay. Data represent pooled results from two independent experiments. d) Expression of RFP in different cell subsets was analyzed in CD11cCre x RFPflstop mice. Upper panel shows representative histograms, lower panel statistics. Dot blots and graphs show representatives of two independent experiments. Depicted is the mean ± s.e.m. of (n=3) individual 8 wk old female animals per group. *P<0.05; **P<0.01; ***P<0.001; two-tailed unpaired t-test.
0 102 103 104 105
0102
103
104
105
0 102 103 104 105
0102
103
104
105
CD45Aqua
L/D
CD11bCD
11c
0 103 104 105
0
102
103
104
105
CD64Ly6C
0
102
103
104
105
0 103 104 105
MHCIILy6C
P3/P4
P1P2
waterfalla
d
0 103 104 1050
20
40
60
80
100
0 103 104 1050
20
40
60
80
100
0 103 104 1050
20
40
60
80
100
P1
0 103 104 1050
20
40
60
80
100
P2 P3/P4 DC
macrophages
RFP
∗ ∗∗∗
0 102 103 104 1050
20
40
60
80
100
CD45-
RFP
MFI
% o
f Max
CtrCD11cCre x RFPflStop
b MCP1 IL-12p70 TNF-α IFN-γC
ytok
ine
(pg/
mL)
IL-10
0
20
40
60
80
Ctr 16h
24h
72h
IL-6
Ctr 16h
24h
72h
0
20
40
60****** *
0
10
20
30
40
50
Ctr 16h
24h
72h
*** ******** **
0
50
100
150
200
250 ****** ***
Ctr 16h
24h
72h
0
50
100
150
Ctr 16h
24h
72h
*****
a-CD40
*** **
0
1000
2000
3000
Ctr 16h
24h
72h
a-CD40a-CD40a-CD40a-CD40a-CD40
c
0
50
100
150
200***
**
a-CD40Ctr 16
h72
h
AT (n
g/m
L)
CtrCD11cCre x RFPflStop
2500
3000
3500
4000
4500
5000
5500
0
500
1000
1500
2000
2500
0
1000
2000
3000
-500
0
500
1000
1500
2000
25
30
35
40
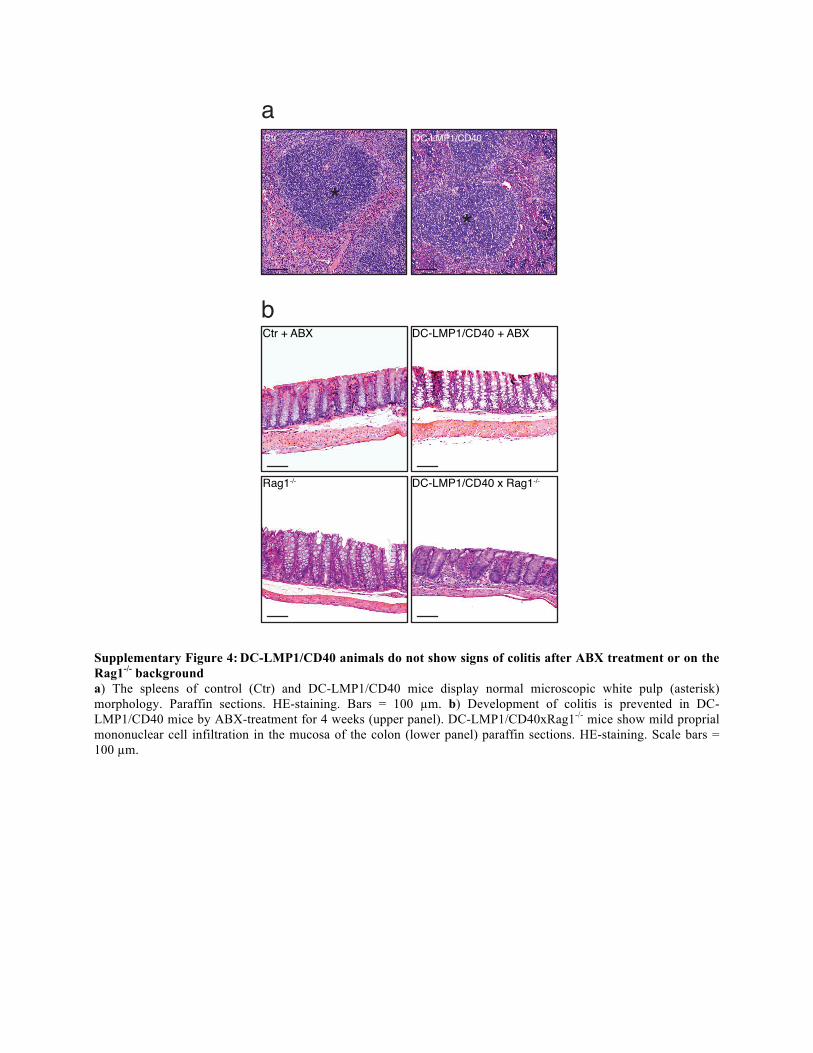
Supplementary Figure 4: DC-LMP1/CD40 animals do not show signs of colitis after ABX treatment or on the Rag1-/- background a) The spleens of control (Ctr) and DC-LMP1/CD40 mice display normal microscopic white pulp (asterisk) morphology. Paraffin sections. HE-staining. Bars = 100 µm. b) Development of colitis is prevented in DC-LMP1/CD40 mice by ABX-treatment for 4 weeks (upper panel). DC-LMP1/CD40xRag1-/- mice show mild proprial mononuclear cell infiltration in the mucosa of the colon (lower panel) paraffin sections. HE-staining. Scale bars = 100 µm.
Ctr + ABX DC-LMP1/CD40 + ABX
Rag1-/- DC-LMP1/CD40 x Rag1-/-
DC-LMP1/CD40 Ctr
* *
a
b
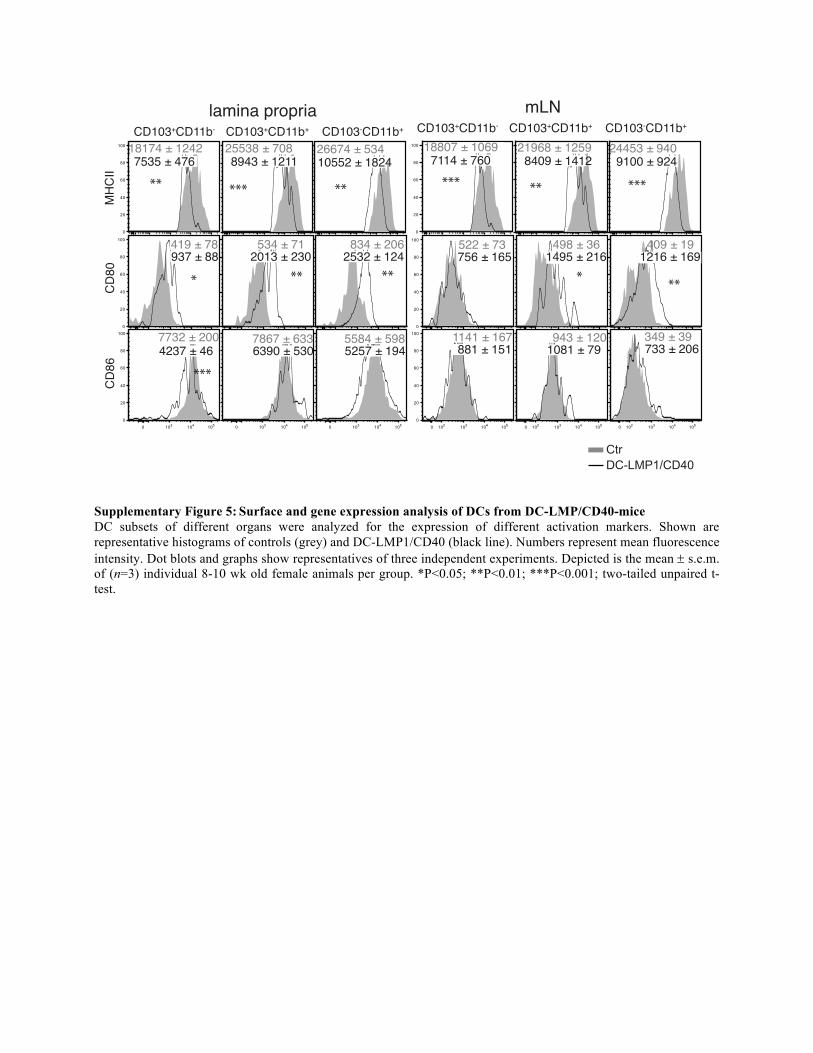
Supplementary Figure 5: Surface and gene expression analysis of DCs from DC-LMP/CD40-mice DC subsets of different organs were analyzed for the expression of different activation markers. Shown are representative histograms of controls (grey) and DC-LMP1/CD40 (black line). Numbers represent mean fluorescence intensity. Dot blots and graphs show representatives of three independent experiments. Depicted is the mean ± s.e.m. of (n=3) individual 8-10 wk old female animals per group. *P<0.05; **P<0.01; ***P<0.001; two-tailed unpaired t-test.
0 103 104 1050 103 104 1050 103 104 1050
20
40
60
80
100
0
20
40
60
80
100
CD103+CD11b- CD103+CD11b+ CD103-CD11b+
CD
86
0
20
40
60
80
100
CD
80lamina propria
0
20
40
60
80
100
MH
CII
CD103+CD11b- CD103+CD11b+ CD103-CD11b+
mLN
0
20
40
60
80
100
0 102 103 104 1050 102 103 104 1050
20
40
60
80
100
0 102 103 104 105
522 ± 73756 ± 165
498 ± 361495 ± 216
409 ± 191216 ± 169
* **
1141 ± 167881 ± 151
349 ± 39733 ± 206
943 ± 1201081 ± 79
534 ± 712013 ± 230
***
419 ± 78937 ± 88
***
834 ± 2062532 ± 124
**
18174 ± 12427535 ± 476
**
25538 ± 7088943 ± 1211
***
26674 ± 53410552 ± 1824
**
18807 ± 10697114 ± 760
21968 ± 12598409 ± 1412
**
24453 ± 9409100 ± 924
***
7732 ± 2004237 ± 46
7867 ± 6336390 ± 530
5584 ± 5985257 ± 194
***
CtrDC-LMP1/CD40
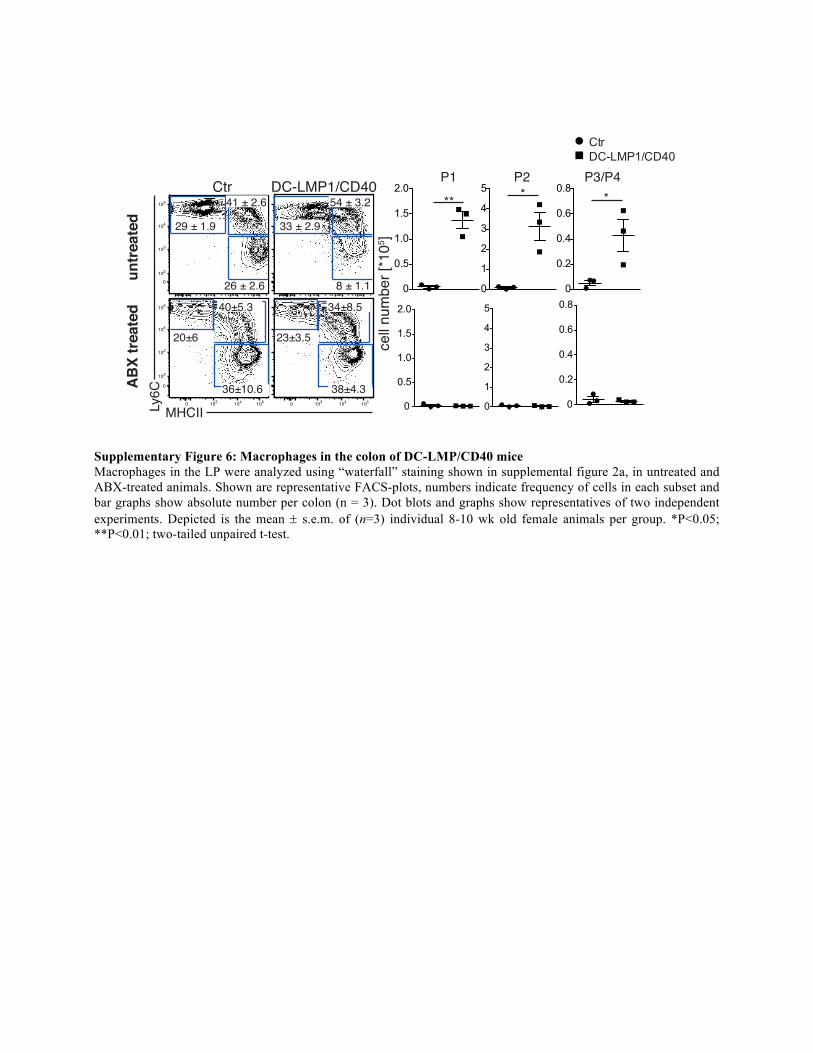
Supplementary Figure 6: Macrophages in the colon of DC-LMP/CD40 mice Macrophages in the LP were analyzed using “waterfall” staining shown in supplemental figure 2a, in untreated and ABX-treated animals. Shown are representative FACS-plots, numbers indicate frequency of cells in each subset and bar graphs show absolute number per colon (n = 3). Dot blots and graphs show representatives of two independent experiments. Depicted is the mean ± s.e.m. of (n=3) individual 8-10 wk old female animals per group. *P<0.05; **P<0.01; two-tailed unpaired t-test.
Ctr DC-LMP1/CD40
MHCII
AB
X tr
eate
d
0
102
103
104
105
untr
eate
d
0 103 104 105 0 103 104 105
** *
0
102
103
104
105
P1 P3/P4P2Ly
6C
41 ± 2.6
26 ± 2.6
29 ± 1.9
54 ± 3.2
8 ± 1.1
33 ± 2.9
40±5.3
36±10.6
20±6
34±8.5
38±4.3
23±3.5
CtrDC-LMP1/CD40
*
0
0.5
1.0
1.5
2.0
0
1
2
3
4
5
0
0.2
0.4
0.6
0.80
0.5
1.0
1.5
2.0
0
1
2
3
4
5
0
0.2
0.4
0.6
0.8
cell
num
ber [
*105 ]
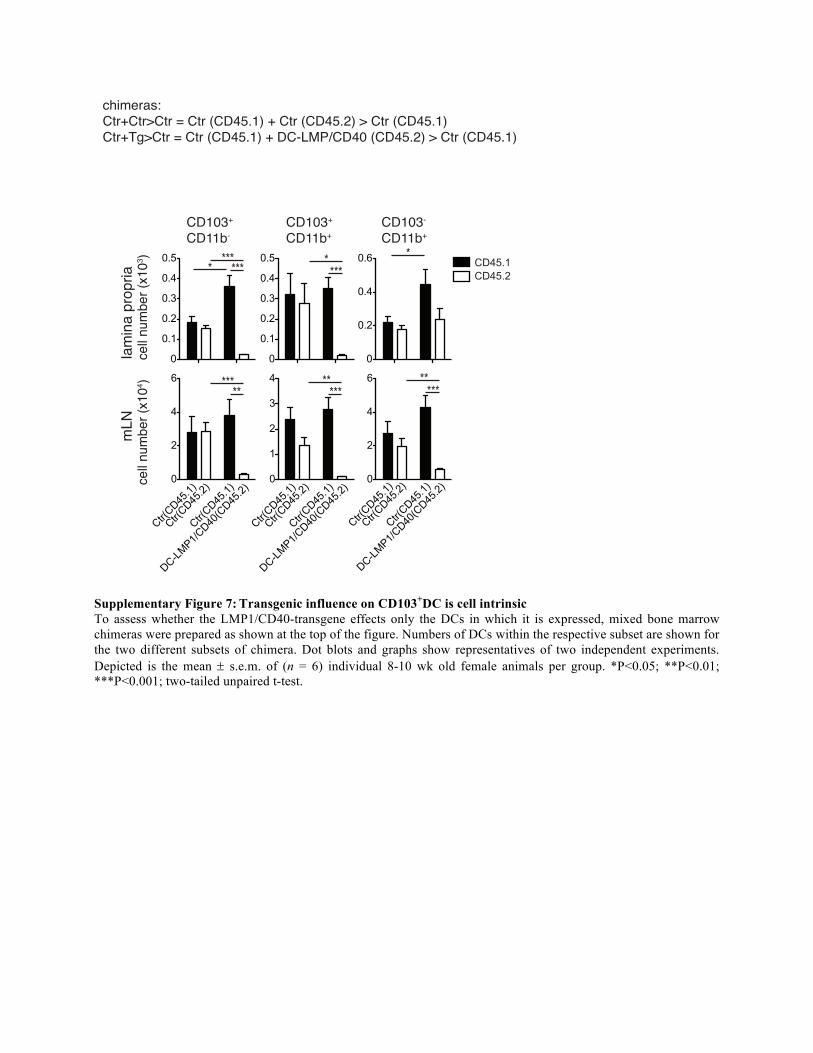
Supplementary Figure 7: Transgenic influence on CD103+DC is cell intrinsic To assess whether the LMP1/CD40-transgene effects only the DCs in which it is expressed, mixed bone marrow chimeras were prepared as shown at the top of the figure. Numbers of DCs within the respective subset are shown for the two different subsets of chimera. Dot blots and graphs show representatives of two independent experiments. Depicted is the mean ± s.e.m. of (n = 6) individual 8-10 wk old female animals per group. *P<0.05; **P<0.01; ***P<0.001; two-tailed unpaired t-test.
cell n
umbe
r (x1
04 )la
min
a pr
opria
mLN
CD103+
CD11b-CD103+
CD11b+CD103-
CD11b+
chimeras:Ctr+Ctr>Ctr = Ctr (CD45.1) + Ctr (CD45.2) > Ctr (CD45.1)Ctr+Tg>Ctr = Ctr (CD45.1) + DC-LMP/CD40 (CD45.2) > Ctr (CD45.1)
cell n
umbe
r (x1
03 )
0
0.1
0.2
0.3
0.4
0.5
0
0.1
0.2
0.3
0.4
0.5
0
0.2
0.4
0.6
0
2
4
6
0
1
2
3
4
0
2
4
6
Ctr(CD45
.1)
DC-LMP1/C
D40(C
D45.2)
CD45.1CD45.2
****** ****
**
** *** ****** ** **
Ctr(CD45
.2)
Ctr(CD45
.1)
Ctr(CD45
.1)
DC-LMP1/C
D40(C
D45.2)
Ctr(CD45
.2)
Ctr(CD45
.1)
Ctr(CD45
.1)
DC-LMP1/C
D40(C
D45.2)
Ctr(CD45
.2)
Ctr(CD45
.1)