gazealyze: a matlab toolbox for the analysis of eye ... · gazealyze: a matlab toolbox for the...
TRANSCRIPT

GazeAlyze: a MATLAB toolbox for the analysisof eye movement data
Christoph Berger & Martin Winkels &
Alexander Lischke & Jacqueline Höppner
Published online: 5 September 2011# Psychonomic Society, Inc. 2011
Abstract This article presents GazeAlyze, a software pack-age, written as a MATLAB (MathWorks Inc., Natick, MA)toolbox developed for the analysis of eye movement data.GazeAlyze was developed for the batch processing ofmultiple data files and was designed as a framework withextendable modules. GazeAlyze encompasses the mainfunctions of the entire processing queue of eye movementdata to static visual stimuli. This includes detecting andfiltering artifacts, detecting events, generating regions ofinterest, generating spread sheets for further statisticalanalysis, and providing methods for the visualization ofresults, such as path plots and fixation heat maps. Allfunctions can be controlled through graphical user interfaces.GazeAlyze includes functions for correcting eye movementdata for the displacement of the head relative to the cameraafter calibration in fixed head mounts. The preprocessing andevent detection methods in GazeAlyze are based on thesoftware ILAB 3.6.8 Gitelman (Behav Res Methods InstrumComput 34(4), 605–612, 2002). GazeAlyze is distributed freeof charge under the terms of the GNU public license andallows code modifications to be made so that the program'sperformance can be adjusted according to a user's scientificrequirements.
Keywords Eye movement analysis . Eye tracking .
Fixations . Saccades . Heat maps .MATLAB .
Computer software
Introduction
In recent psychophysiological research, eye-trackingmethodology has been widely used to obtain reactionparameters from eye movement data to analyze cognitiveprocesses underlying visual behavior. Eye movements areclassified into two basic components: the movements of theeye itself (called saccades) and the times between move-ments when the eye remains in a single position (calledfixations). Fixations typically occur only with the receptionof sensory information, and vision is generally suppressedduring saccades (Matin, 1974). Eye movements are closelylinked to visual attention; therefore, many studies have usedthe analysis of saccadic target regions to investigate the linkbetween eye movements and covert attention. Some of thesestudies have shown that attention is always oriented in thesame direction as saccades (Deubel & Schneider, 1996;Hoffman & Subramaniam, 1995; Irwin & Gordon, 1998;Kowler, Anderson, Dosher, & Blaser, 1995).Others haveshown that attention and eye movements can be dissociated(Awh, Armstrong, & Moore, 2006; Hunt & Kingstone,2003). A recent article (Golomb, Marino, Chun, & Mazer,2011) discussed the representation of spatiovisual attention inretinotopically organized salience maps that were updatedwith saccadic movement. Other studies have investigatedsituations in which multiple objects must be tracked andhave found that eye gaze is directed more toward thecentroid of the target group than to any single target (Fehd& Seiffert, 2008; Huff, Papenmeier, Jahn, & Hesse, 2010)The relationship between attention and eye movements has
C. Berger (*) :M. Winkels :A. Lischke : J. HöppnerDepartment of Psychiatry and Psychotherapy,University of Rostock,Gehlsheimer Straße 20,18147 Rostock, Germanye-mail: [email protected]
A. LischkeDepartment of General Psychiatry, University of Heidelberg,Voßstraße 2,69115 Heidelberg, Germany
Behav Res (2012) 44:404–419DOI 10.3758/s13428-011-0149-x
also been discussed in some literature reviews (Rayner,2009; Theeuwes, Belopolsky, & Olivers, 2009). Researchinto visual behavior is motivated by applied psychologicalquestions; the main topics of such research include theprocessing of facial expressions in social cognition (Brassen,Gamer, Rose, & Buchel, 2010; Domes et al., 2010; Gamer,Zurowski, & Buchel, 2010), the flexibility in the cognitivecontrol of the oculomotor system analyzed in antisaccadeparadigms (Liu et al., 2010; Stigchel, Imants, & RichardRidderinkhof, 2011), and the experimental research ofspeech processing (Cho & Thompson, 2010; Myung et al.,2010). Eye movement data must undergo a principalprocessing pipeline including the following modules. Thefirst module is preprocessing, such as blink detection andfiltering. The second module is an event detection of patternsin eye movement, such as fixations and saccades. The thirdmodule is the generation of analysis parameters from theseevents for further statistical analysis. Finally, the fourthmodule includes different visualization and stimulus overlaytechniques of the eye movement data, such as heat maps andgaze plots. In addition to this main data processing queue,there is also the separation of visual stimuli regions ofinterest (ROIs), in case these subregions have specialpsychological meanings.
While this processing queue has largely remainedconsistent since the beginning of eye-tracking research,the analysis paradigm can be further developed: Some ofthese different approaches to eye movement data processingare mentioned below. There exist various methods fordetecting events in the raw data, such as algorithms forblink detection (Morris, Blenkhorn, & Farhan, 2002),fixation detection (Blignaut, 2009; Nystrom & Holmqvist,2010; Salvucci & Goldberg, 2000; Widdel, 1984), andsaccade detection (Fischer, Biscaldi, & Otto, 1993). Theanalysis of eye movement in response to dynamic visualstimuli and dynamic ROIs (Papenmeier & Huff, 2010;Reimer & Sodhi, 2006) requires the development ofmethods that can detect the pursuit of dynamic stimuli inthe eye movement. Some researchers have focused on themodel-based analysis of the eye-tracking data to explainsequences of eye movement patterns with assumptions forunderlying cognitive models. (Goldberg & Helfman, 2010;Salvucci & Anderson, 2001)
The present article presents the software GazeAlyze, aMATLAB toolbox for the offline batch analysis of eye-tracking data. GazeAlyze was developed to analyze gazedata for static visual stimuli and to obtain parameters fromfixations and saccades for further visualization and statis-tical analysis. GazeAlyze is suitable for application inresearch on visual attention in the cognitive processing ofvisual stimuli and for measurement of volitional control ofbehavior that is sensitive to fronto-striatal dysfunction, suchas the antisaccade task.
GazeAlyze can utilize various algorithms according tochoice and is an open-source software: Users can changeand extend analysis steps. GazeAlyze is a universal analysissoftware and includes import capabilities for different eye-tracking data types and, therefore, is useful for datapooling. GazeAlyze also includes features of data qualityanalysis and artifact control, such as reports of global andtrial-wise validation parameters or correction strategies tohandle scan path drifts in fixed head settings. GazeAlyzestores the experimental settings in study-related controlscripts for easy overview and editing.
Our intent was to design an application that allows themanagement of the entire offline processing and analysis ofeye movement data (containing capabilities such as extendi-bility, universality, and quality control), as well as batchprocessing of file sets. GazeAlyze uses modules for blinkdetection, filtering, and event detection from ILAB 3.6.8(Gitelman, 2002), a MATLAB toolbox for processing eyemovement data. The GazeAlyze data structure can also beloaded into the ILAB software. GazeAlyze mainly expandsthe capabilities of ILAB by providing the following utilities:the batch processing of data file sets, the analysis and exportof detected eye movement events such as fixations andsaccades, and visualization capabilities in the form of heatmaps. Besides ILAB, other free open-source software toolsare available for offline eye movement analysis. There aretwo freeware tools programmed in C#, which run only onWindows computers. A very well-designed application isOGAMA (Vosskuhler, Nordmeier, Kuchinke, & Jacobs,2008), which allows the analysis of gaze and mousemovement data together and the recording and storage ofdata in a Structured Query Language (SQL) database. Theother C#-based software is ASTEF (Camilli, Nacchia,Terenzi, & Di Nocera, 2008), an easy-to-use tool for theinvestigation of fixations that implements the nearestneighbor Index as a measure of the spatial dispersion ofthe fixation distribution.
Program description
GazeAlyze can be used as a tool for researchers with nospecific programming skills, because the setting of all analysisparameters and all functionalities are controllable fromgraphical user interfaces (GUIs). All analysis parameters ofspecific experiments (i.e., definition of trial structure, defini-tion of ROIs, statistics, plots, and heatmaps settings) are savedin a single control script. This allows the comfortable handlingof the analysis of different experiments.
Eye movement parameters of cognitive processing, visualsearch, or stimulus impact are estimated separately for ROIsby analyzing fixation, saccade, and movement path parame-ters. The analysis parameters and covariates are reported for
Behav Res (2012) 44:404–419 405

different trials in a single spread sheet for all data filesincluded in the analysis. Heat maps may be generated over acollection of data files for the visualization of fixation numberor duration. Fixation and movement path parameters fromexperimental periods with determined gaze can be used ascorrection parameters to minimize drift errors in the eyemovement path due to shifts between the camera and head.
GazeAlyze was entirely written in the MATLAB scriptinglanguage. All functions are separated from the GUI, exist inseparate m-files, and are called through a manager m-file. TheGUI allows users to set analysis parameters and to call either asingle or a set of processing steps. Through the General PublicLicense (GPL), more experienced users are encouraged toadjust and extend the code for their needs.
The software ILAB 3.6.8 was the starting point indeveloping GazeAlyze. Because ILAB was written as aMATLAB toolbox, MATLAB was used as the platform forthe open-source tool GazeAlyze. Even though MATLAB isonly available commercially, it is commonly used inpsychophysiological research. Many popular neuroscientifictools have been written for MATLAB; several examples arementioned below: EEGLab (Delorme & Makeig, 2004), atoolbox for processing electrophysiological data; SPM8(Wellcome Trust Centre for Neuroimaging, London, U.K.)a toolbox for processing brain imaging data; or thePsychophysics Toolbox (Brainard, 1997), a function set foraccurately presenting controlled visual and auditory stimuli.
The software architecture and the data structure ofGazeAlyze are similar to those of ILAB, because GazeA-lyze uses the functions from ILAB for deblinking, filtering,and event detection, as mentioned in the Graphical UserInterface section. Data imported in GazeAlyze contain thesame structure as those in ILAB, but GazeAlyze extendsthis structure with a labeling of data segments intoexperimental trials and fixed gaze periods to obtaincorrection parameters. This labeling extends only thevariable structure of ILAB and is implemented in the scriptGA-controller; therefore, imported GazeAlyze data can beloaded into ILAB, and ILAB import scripts can be used inGazeAlyze. The structure of event detection results andsegmented data exported to the MATLAB variables and intoExcel format is also the same in both toolboxes.
For all other functions besides ILAB-based preprocessingand event detection, GazeAlyze uses different code. Theeditor for generating ROIs, the ROI variable structure, and allGUI elements differ from ILAB.
The GazeAlyze workflow
The program modularity of GazeAlyze is oriented towardthe steps of the processing queue of eye movement data.This processing queue can be separated into four mainparts. The workflow starts with the file format conversion
and import of eye movement data from various eye-tracking systems. For data import, it is also necessary toinform GazeAlyze about the trial structure of the data.Second, preprocessing is needed to remove artifacts(mainly lid blinks) from the data and to filter the noisegenerated by suboptimal pupil detection by the eye-trackingsoftware. Third, eye movement events must be detected anddescribed—in particular, the location, duration, and onset offixations and saccades. Fourth, from these event propertiesand the preprocessed movement path, variables that can beused to operationalize different psychological aspects of theprocessing of visual stimuli are calculated (see Fig. 1).
In addition to this, GazeAlyze contains several specialfunctional modules. Eye-tracking systems that track onlyeye movement, such as fixed head or head-mountedsystems, cannot separate these data from the movement ofthe head and are susceptible to a shift between the cameraand head during the experiment, thereby producing defi-cient results. Therefore, in GazeAlyze, a correction functionis implemented that generates correction parameters fromperiods in the experiment, during which the participant isasked to fixate on a special region. These correctionparameters, such as the spatial median of movement pathor fixation location, can be used to shift the eye-trackingdata prior to the generation of parameters for furtherstatistical analysis.
Plots can be generated of the movement path and thespatiotemporal fixation distribution for a quick datainspection after event detection. In ILAB, plots wereoriginally available only in the MATLAB environment. InGazeAlyze, plots are exported into images in the .jpg fileformat. Another visualization function of GazeAlyze is thegeneration of heat maps of the spatial distribution offixation count or duration. These heat maps can begenerated with various color maps and scaling on basis ofselectable participant and stimulus samples.
The managing of special ROIs inside the visual stimulican be done via the ROI editor or the ROI import option.ROIs are important for marking regions with enclosedvisual importance and separating movement analysis forthese regions. It is possible to generate rectangular,elliptical, and polygonal ROIs with GazeAlyze; these ROIscan be imported from external ROI lists or obtained directlyfrom pictures. Multiple ROIs can be tagged together androtated by any angle.
The application design
The program structure is described in Fig. 2. The handlingof GazeAlyze is controlled by the GUI, where the user canset all analysis parameters and perform the processing ofthe eye movement data. The analysis parameters are savedin an experiment-specific control file. During a GazeAlyze
406 Behav Res (2012) 44:404–419

session, this control file is loaded from the hard disk, andall variables are stored in a structure of the main GUI panel.Via the GUI, the user has access to these experimentparameters. It is possible to edit them and to store themback into the control file on the hard disk.
A call of a processing task from the GUI passes thestructure of the experiment control variables to thecontroller script with the order to start a particularrequired processing task. The controller then calls theparticular processing scripts designated to perform thetask operations (i.e. importing, preprocessing, plotting,heat map generating, and analysis). It is possible toprocess the data from any point in the workflowwithout the need to run prior steps again (e.g., to rundifferent visualization steps after the data are importedand preprocessed without preprocessing or importing thedata again). It is also possible to batch task operationsto perform a set of functions with the data. If aprocessing step is performed, the result will be storedin a subset of the variable structure in the GazeAlyzeeye movement data file, as mentioned below:
& import: all data from the external file for furtherconversion
& ILAB: includes the variable structure needed as inputfor deblinking, filtering, and event detection with ILAB
& corr_par: result from correction parameter calculation& quality: report of global data quality (signal-to-noise
ratio and amount of blinks)& eyemove, fixvar, saccvar: results from preprocessing
and event detection.
The graphical user interface
Main panel After typing "gazeaylze" into the MATLABcommand window, the main panel appears, which containsthree main parts. At the top, there is a menu for accessingall functions of GazeAlyze and some quick-start buttons fordirectly accessing the most frequently used functions. Onthe left, a list box contains an overview of all actualvariable settings controlling a specific experiment. At thebottom of the main panel, a list contains the loggedinformation about all actions performed since the last timethe experiment control script was loaded (see Fig. 3).
Include/exclude settings menu item under this menu, thereare three panels for the selection of a subset of experimental
Fig. 1 Flow chart of GazeAlyze processing pipeline
Behav Res (2012) 44:404–419 407
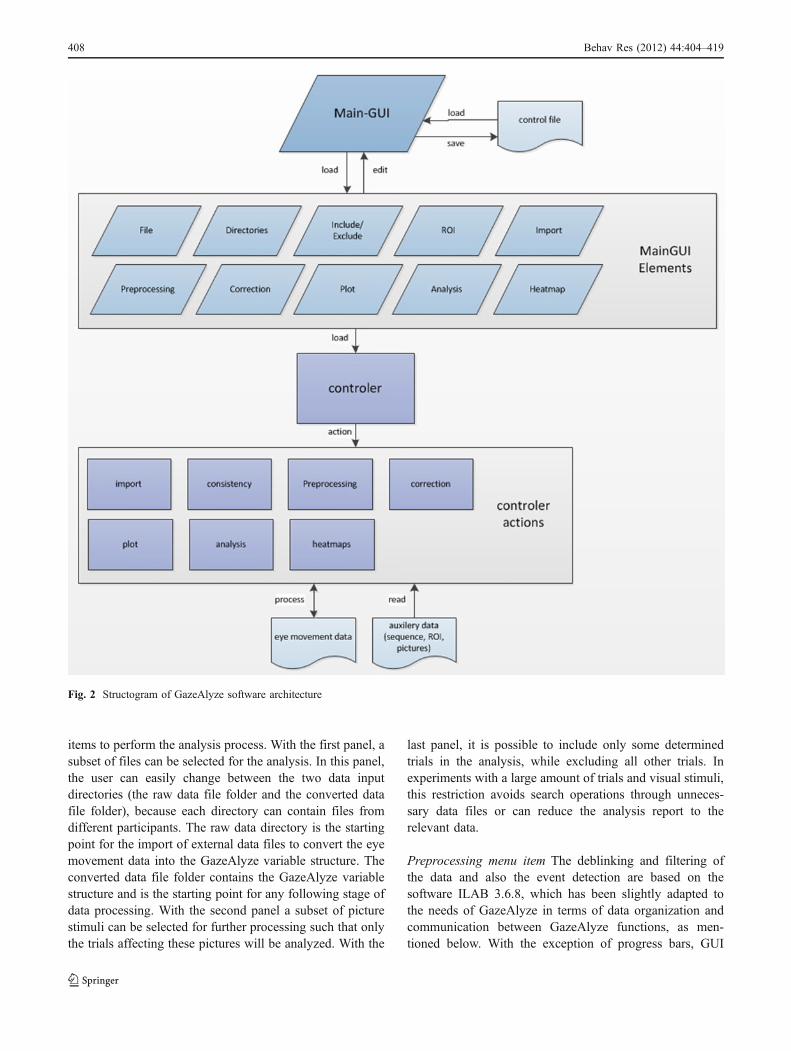
items to perform the analysis process. With the first panel, asubset of files can be selected for the analysis. In this panel,the user can easily change between the two data inputdirectories (the raw data file folder and the converted datafile folder), because each directory can contain files fromdifferent participants. The raw data directory is the startingpoint for the import of external data files to convert the eyemovement data into the GazeAlyze variable structure. Theconverted data file folder contains the GazeAlyze variablestructure and is the starting point for any following stage ofdata processing. With the second panel a subset of picturestimuli can be selected for further processing such that onlythe trials affecting these pictures will be analyzed. With the
last panel, it is possible to include only some determinedtrials in the analysis, while excluding all other trials. Inexperiments with a large amount of trials and visual stimuli,this restriction avoids search operations through unneces-sary data files or can reduce the analysis report to therelevant data.
Preprocessing menu item The deblinking and filtering ofthe data and also the event detection are based on thesoftware ILAB 3.6.8, which has been slightly adapted tothe needs of GazeAlyze in terms of data organization andcommunication between GazeAlyze functions, as men-tioned below. With the exception of progress bars, GUI
Fig. 2 Structogram of GazeAlyze software architecture
408 Behav Res (2012) 44:404–419

elements of ILAB are not shown. All of the advancedsettings belonging to the preprocessing steps based onILAB can be achieved by direct editing of a MATLABscript corresponding to this menu item. Furthermore, theconsistency check can be performed separately here. Theconsistency check is a new GazeAlyze feature and mainlydetermines whether an import step was performed correctly,there are data in the file, and the marker timing was correct.If an error is recognized during import, the affected files arestored separately. Because GazeAlyze uses a global struct tocommunicate between different scripts and functions, theILAB analysis parameter are stored in this global struct.ILAB offers a velocity- and a dispersion-based algorithm todetect fixation events, which were transferred in theiroriginal functionality into GazeAlyze. The event detectionoutput does not differ between ILAB and GazeAlyze.
Trial import settings panel In this panel, the user cancomfortably adjust settings for the trial structure to besegmented from the raw data stream (see Fig. 4). In theupper part of the settings for the trial, timing markerinformation can be adjusted. It is possible to specify trialswith a fixed duration relative to a single marker or tospecify trials limited by start and stop markers. There canbe various markers in the data stream, and the marker
strings that label the trials can be specified. It is possible toanalyze a block set of trials separately that are labeled withonly one marker per block.
In addition to the trial markers, it is often important toevaluate fixed-gaze periods in the raw data stream. In thesefixed-gaze periods, the gaze is often focused on adetermined region, such as a fixation cross, and thedeviance from this region in the eye movement data canbe used for measurements of data quality. The marker ofthese fixed-gaze periods can be determined separately inthis panel.
Directories panel In the processing pipeline of eye-trackingdata analysis, various data files are involved. Qualitystructured file handling is especially important for the batchprocessing of multiple data files. In the "directories" panel,all of the relevant file locations can be determined. The eyemovement data processed by GazeAlyze are stored in theiroriginal file format in the directory for raw eye movementdata. All other stages of processed eye movement data arestored in files containing the GazeAlyze variable structurein the directory for converted and further processed eyemovement data. Furthermore, there is a directory for theexport of data from various analysis steps, which containssubfolders for correction parameters in text file format, the
Fig. 3 Main panel of the GazeAlyze GUI
Behav Res (2012) 44:404–419 409

variable worksheet for further statistical analysis, andvisualized data such as heat maps and fixations or scanpath plots.
Two other directories contain the visual stimuli that werepresented in the experiment and the files that contain theinformation about the stimulus sequences. These sequencefiles determine which stimulus belongs to which trial and mayalso contain additional trial-specific covariates such asresponse information, which can also be reported togetherwith eye movement parameters for further statistical analysis.
Sequence file panel In a separate panel accessible from thedirectory panel, the user can determine the structure of thesequence files. Sequence files are typically text files withheader information such as the experiment name, theparticipant identifier, and the experiment date. Trial dataare written in a table under each row belonging to aseparate trial. The user must determine at which row tobegin the trial table, which column contains the name of the
presented picture, and which columns should be reportedfor further statistical analysis. The other information neededis the format of the picture names.
Correction setting panel As described above, the fixed-gaze period can be analyzed to receive correction param-eters for quality control and possible offline manipulationof the data. When the head is fixed and head-mounted eye-tracking cameras are used, as in the scanner duringfunctional imaging, the camera position relative to the headmay move. For example, the eyetracker belonging to thepresentation system “Visua Stim” (Resonance Technology,CA) is mounted on a visor that the participant wears on theeyes during the scan and is only fixed on the participantshead with a rubber strap. If the visor slips after thecalibration period, the complete eye movement data willbe shifted from the original position.
Therefore, in this section, the user can obtain informa-tion about a data shift and use this information to correct
Fig. 4 Trial import settingspanel
410 Behav Res (2012) 44:404–419

the eye movement data before the statistical analysis isconducted. The basis of the data shift measurement is thefixed-gaze periods in the experiment when the region thatthe participant looked at was determined in a special task,such as looking at a fixation cross. The distance betweengaze location measures and the location of this region isused to correct the data shift.
The user can select between different strategies toreceive the gaze location measures. It is possible to selectbetween the location of the longest fixation, the first or lastfixation, the mean of all fixations, or the median of the scanpath. It is also possible to mark the subsequent trial as bad,if the fixation period ends with a saccade. In this fixed-gazeperiod, it must be ensured that the gaze that will be analyzed toobtain the correction parameter is really directed toward thefixation object. GazeAlyze uses markers for the segmentationof the fixed-gaze periods from the entire data set. When afixation object is shown over the entire duration of the fixed-gaze period and no more objects are presented, all methodswill be good estimates for the amount of shift in the measuredgaze. In scenarios in which the presentation time of thefixation object is shorter than the duration of the entiresegment, it should be useful to have more focus on theanalysis of fixations such as the mean or the last fixation thanon the median of the scan path from the entire segment tocalculate the shift between gaze and origin of the fixationobject. It is also possible to evaluate fixed-gaze periodsbelonging to experimental trials and to determine the durationof this period independently of the trial duration.
Correction parameters are stored in the GazeAlyzevariable structure in MATLAB format and as a table in textfiles. In this table, the first two columns refer to the first andthe last trial to which the correction parameter applies, andthe third and fourth columns list the shift in the x and ydirections that must be subtracted from the eye movementdata.
Plot setting panel Data plots can be used to visualize theeye movement data and events for each trial. In this panel,it is possible to select the plot of the fixations, the scan pathof experimental or fixed-gaze trials, and the median of thescan path of the fixed-gaze trials. It’s also possible to plotdata based on scan path shift corrections and to plot only acertain amount of time of the trials.
ROI editor panel In this panel, GazeAlyze offers theopportunity to create and edit ROIs. ROIs are areas in thepicture in which analysis steps were performed separately.ROIs can belong to a special visual stimulus or to allstimuli that were presented during the experiment. ROIscan be simple geometrical forms (rectangles and ellipses),
or they can be drawn in an arbitrary outline. It is alsopossible to rotate ROIs to various angles. An ROI isdetermined by the combination of its name and the stimulusto which it belongs. GazeAlyze also offers the opportunityto group different ROIs using the flag labels from the ROIdescription. Furthermore, it is also possible to analyze eyemovement parameters for each ROI separately or for agroup of ROIs with a particular flag name.
There are two ways to create an ROI with this panel (seeFig. 5). One way is to draw an ROI with the mouse on thefield on the right in this panel. Alternatively, the positionand the expansion of the ROI can be inserted into the fieldson the left.
ROI import from the file panel In addition to creating newROIs with the ROI editor panel, GazeAlyze can import anentire ROI table from an external text file. This ROI tabletypically contains multiple ROI groups with the same namebut different positions, sizes, and picture origins. GazeA-lyze can import tables where a group of columns containsthe parameter of a group of ROIs. Starting from a rowbelow heading information, each row contains the name ofthe original picture stimulus and the position and size of theROI in this picture. It is also possible to import only asubset of the pictures in this list.
Analysis setting panel In addition to the batch processing ofeye movement data, the ROI handling, and the heat mapvisualization, the main feature of GazeAlyze is that it is easy toobtain, calculate, and aggregate eye movement event parame-ters for further statistical analysis. The corresponding settingcan be adjusted in this panel (see Fig. 6).
Future development of the analysis features of GazeA-lyze is planned, because many extensions are possible.Currently, the following parameter can be exported from thedata:
Parameters of cognitive processing:
& Absolute cumulative and mean fixation durations andnumbers, relative fixation durations, and numbers asfixation parameter from an ROI, relative to the fixationparameters from another ROI or from the entire stimulus
& The fixation/saccade ratio
Parameters of visual search:
& Spatial extension of the scan path
Parameters of stimulus impact:
& Region of initial fixation& Fixation order
Behav Res (2012) 44:404–419 411

& First saccade direction& First saccade latency
In addition to these analysis parameters, several othersettings relevant for further statistical analysis can beadjusted. The user can select the following actions:
& Report global data quality in the form of the ratiobetween data points and detected blink points and thesignal-to-noise ratio
& Correct the data prior to analysis with the scan pathshift correction parameters
& Report a trial validation measure. Trials are marked asinvalid, if there is no accessible correction parameterbecause of noisy data and if the fixed-gaze period endswith a saccade, whether this should be reported asinvalid too
& Report trial covariates from the sequence file& Report the entire trial duration, especially from trials
with different durations& Sort the trials by the trial ore condition number in
ascending order
It is also possible to weight or normalize the analysisparameters, relative to the spatial extent of the ROI, bymultiplying them with a normalization factor. This featurecan be useful for allowing a better comparison of analysisparameter from ROIs with different spatial extensions insome experimental settings. For example, with two photo-graphs of social interaction scenes, both pictures have thesame number of objects shown; however, the subset ofobjects that is more closely relevant to the social interactiondiffers between the pictures. ROIs that are drawn aroundthese object subsets have different spatial extents. Object
Fig. 5 ROI editor panel
412 Behav Res (2012) 44:404–419

count and complexity of visual content should be correlatedwith eye movement parameters of visual attention, assumingthat the perception of more complex picture content requiresmore sensory effort for a person to perceive and orient him-/herself to the picture regardless of further picture properties,such as the social meaning of the object constellation. Tocompare ROIs of different relative complexity, it could beuseful to take into account the spatial extent of the ROIs asoperationalization of complexity. Weighting analysis parame-ters relative to the spatial extent removes the relativecomplexity of ROI objects from further statistical analysis ofattention caused by picture content directly related to socialcognition.
However, in scenarios in which the relative complexitydoes not differ between ROIs, this spatial weighting shouldnot be applied and can lead to artifacts. For example, if twoequally sized objects were shown in a picture at differentdepths, the closer object would occupy a larger area on thecomputer monitor. ROIs placed around these two objects to
distinguish them from other picture content will differ insize, since the closer object will define a larger ROI thanwill the farther object. In this case, the complexity betweenthe two ROIs does not differ, and the distribution ofgaze for the close and the far objects should be valuedin the same manner without weighting them for spatialextent.
As a normalization factor, the following equation isused:
1� area ROI=area screen:
As the spatial extent of the ROI decreases, the relevanceof the related analysis parameters increases.
It is possible to obtain all of these parameters from atemporal segment and not from the entire trial. The startand the end of this analysis period inside the trial can bespecified relative to the trial start or end as a percentage ofthe trial duration or in milliseconds.
Fig. 6 Analysis settings panel
Behav Res (2012) 44:404–419 413

Batch job setting panel All of the processing steps can beperformed independently via the corresponding menu itemsor can be processed in immediate succession with theGazeAlyze batch job feature. The jobs included in the batchprocessing are selectable under this panel. It is also possibleto send an e-mail when the batched job execution is ready.
General settings panel for heat maps GazeAlyze mainvisualization feature is the ability to present eye movementdata as heat maps with variable layout settings. It ispossible to visualize the amount and dispersion of fixationdurations or fixation numbers. These data plots can bemade as the visualization of a single participant or as themean of these parameters over a selectable group ofparticipants. Figure 7 show examples of visualization offixation number as heat maps generated with GazeAlyze.
The workflow of heat map creation is outlined in Fig. 8. Agroup of three single fixations, each from a differentparticipant (a), is grouped in (b). A circle of arbitrary radiusis drawn around the fixation origins (c).These circles overlaywith each other in some areas. A color map (d) can bedefined to represent the amount of overlaying circle areas (e).In this example, the number of fixations is represented in thecolor map, but it is also possible to colorize the amount ofadded fixation duration with GazeAlyze. The part of thestimulus picture that is not covered by fixations can beoverlaid with a unique color. This unique color and thecolored circle areas can have some transparency (f). Finally,the heat map is smoothed to blur the edges of the differentcolors (g), and the stimulus picture is plotted into an imagefile with the screen pixel size (h) in the position in which itwas shown during the eye movement recording.
In the general heat maps settings panel (see Fig. 9), asubset of files can be selected to be included in a heat map
group. This selection can be made by direct input or byimporting the filenames from a .csv file. Corrected oruncorrected data can be chosen to be visualized. In asecond step, the user should select the global color settingsfor the heat map. The locations of the visualized data pointsare first plotted on an empty screen, and this plot is thenlaid over the stimulus picture that was presented during theexperiment. For this overlay of the plotted data, the followingadjustments can be set on this panel. First, the backgroundcolor, as the color of the screen where no stimulus waspresented, can be adjusted. Second, the basic overlay color,which overlays the entire stimulus where no fixationsoccurred, can be adjusted. Third, the data points, which aredrawn as circular areas with a certain radius, can be adjusted.Fourth, the transparency of the data overlay can be adjusted,so that the stimulus picture is also visible under the heatmap. Fifth, the filter strength for smoothing the edges ofthe overlaid data point circle areas, as well as theposition of the stimulus picture on the screen, can also beadjusted.
Heat map color/gradient settings panel In this panel, thedifferent colors used to visualize the different amounts ofdata focused on a region of the stimulus can be set. Thecolor map can be chosen from a selection of preinstalledcolor maps, and each color can also be manually adjusted.The range and the gradient of the color map—that is, thenumber of data points that are focused to a region andpresented with a single color—can also be set here. It ispossible to choose whether the fixation duration or thefixation numbers must be plotted (see Fig. 10).
System requirements
GazeAlyze requires less than 6 MB of free hard disk space.The program will run on any operating system supportingMATLAB (MathWorks Inc.) or later. The MATLAB image-processing toolbox (commercially available from Math-Works), is needed for the use of the visualization capabilitiesof GazeAlyze, such as the creation of plots and heat maps. Forany other function in GazeAlyze, no special MATLABtoolbox is required. GazeAlyze has been tested in its currentversion 1.0.1 onMATLAB 2007a onMac OS X, version 10.5(Apple Inc., CA), Ubuntu 8.10 Linux,MicrosoftWindows XP,and Microsoft Windows 7(Microsoft Inc., WA).
Installation procedure
The installation routine involves downloading and unzip-ping the GazeAlyze package. GazeAlyze is then launchedby typing “gazealyze” into the MATLAB commandFig. 7 Heat map example of the number of fixations
414 Behav Res (2012) 44:404–419

window. When starting GazeAlyze for the first time, it isnecessary to start from the GazeAlyze directory. Then
GazeAlyze can be started from any other working directory.After closing GazeAlyze, all subfolders will be automati-
Fig. 8 Heat map generatingworkflow
Fig. 9 General settings panelfor heat maps
Behav Res (2012) 44:404–419 415

cally removed from the search path to prevent interferenceswith other scripts in the search path.
Availability
GazeAlyze is distributed free of charge under the terms ofthe GNU General Public License as published by the FreeSoftware Foundation. Under these terms of the GNULicense, users are free to redistribute and modify thesoftware. GazeAlyze is freely available for download athttp://gazealyze.sourceforge.net.
Samples of typical system or program runsand comparison of correction methods
GazeAlyze is the standard tool in our laboratory for theanalysis of eye movement data. The GazeAlyze softwarepackage also contains some sample data. These sample datainclude raw data files in text file format as Viewpoint eyemovement data and the regarding control script with thetrial marker settings. The performance of the differentcorrection strategies was tested in an experiment to correctthe eye movement data for scan path drifts induced by theshifting of the eyetracker camera after the calibrationprocedure, such as the use of the camera as a part of the
VisuaStim system (Resonance Technology Inc., USA) infunctional imaging settings or in other head-mountedsystems.
Materials and methods
Participants Sixty-four healthy adults (age:M = 25.83 years,SD = 3.04), who were enrolled in an ongoing study onemotion recognition abilities in males, participated in thevalidation study. All participants provided written informedconsent and were paid for participation. The study wascarried out in accordance with the Declaration of Helsinkiand was approved by the ethical committee of the Universityof Rostock.
Emotional recognition task A dynamic emotion recognitiontask with neutral expressions that gradually changed intoemotional expressions was used (Domes et al., 2008).
For this task, six male and six female individuals, eachshowing a neutral, sad, angry, fearful, and happy expres-sion, were chosen from the FACES database (Ebner,Riediger & Lindenberger, 2010) Using Winmorph 3.01(http://www.debugmode.com/winmorph/), each emotionalexpression was morphed by steps of in 5% incrementsfrom 0% to 100% of intensity. For each individual, four sets
Fig. 10 Heat map color/gradientsettings panel
416 Behav Res (2012) 44:404–419

of emotional expressions (happy, sad, angry, and fearful)were created, each containing 21 images. Each image of aset of expressions was presented for 800 ms, ranging from0% to 100% of intensity. Each set of 21 pictures waspreceded by a presentation of a fixation cross in the middleof the screen for 1 s. Each image was presented on a 20-in.computer screen (screen size, 30.6 × 40.8 cm; resolution,1,024 × 768 pixels) against a gray background at a viewingdistance of 55 cm. The mean viewing angle for each imagewas 16.93° in the vertical direction and 23.33° in thehorizontal direction.
The participants were instructed to press a stop button assoon as they became aware of the emotional expression.After stopping the presentation, a forced choice between thefour emotions (happy, sad, angry, and fearful) was asked for.
Eye tracking Participants’ eye movements were recordedwith a remote infrared eyetracker (PC-60 Head Fixed;Arrington Research Inc.; Scottsdale, AZ) to record gazechanges during emotion recognition. Raw data werecollected at a 60-Hz sampling rate with a spatial resolutionof approximately 0.15° for tracking resolution and 0.25°–1.0° for gaze position accuracy. Eye movement data wereanalyzed with GazeAlyze. After filtering and deblinking ofthe raw data, fixations were coded with dispersionalgorithm (Widdel, 1984) when the gaze remained for atleast 100 ms within an area with a diameter of 1°. Image-specific templates were used to differentiate betweenfixations to distinct facial ROIs (eyes, mouth, forehead,and cheeks). For statistical testing, the number of fixationson the eye region was calculated. Regarding eye movementdata for the correction strategies, the data recorded duringthe time of presentation of the fixation cross were used.
Statistical analysis Since the focus of the present study wason the eye-tracking data, data pertaining to the emotionrecognition task will be presented elsewhere. The effect ofthree different scan path drift compensation methods(median of scan path, last fixation, mean fixation) to themean number of fixations counted in the eye region over allemotions was tested with a one-way analysis of variance(ANOVA). The significance level for analysis was set at p <
.05. All statistical analyses were performed using SPSS 17(SPSS Inc., Chicago, IL).
Results
The one-way ANOVA showed that there were significantlymore fixations counted inside the eye region for all correctionmethods, as compared with no correction for the scan pathdrift, F(3, 1020) = 8.73, p < .00001. Post hoc t-tests showedno evidence for a significant difference in the performance ofcorrection methods (see Table 1 and Fig. 11).
Discussion
This evaluation study showed that in experiments with fixedhead settings, the amount of fixation parameters of attentioninto regions of high saliency can be improved via correctionmethods for scan path drifts. In interpreting the results as asuccessful correction of scan path drifts, there are twoassumptions that have to be discussed in greater detail—namely, first, the correction methods do not create any artifacts
Table 1 Comparison of corrected versus uncorrected data and the number of fixations involving the eye region of facial expressions
Correction Method Mean Differenceto No Correction
Standard Error Significance 95% Confidence Intervall
Lower Bound Upper Bound
lastfix 20.71* 4.91 .0001 -33.68 -7.74
mean 16.37* 4.91 .005 -29.34 -3.40
median 22.48** 4.91 .0001 -35.45 -9.50
Note. ANOVA, N = 256, (64 probands, 4 events)
Fig. 11 Mean number of fixations in the eye region of facialexpressions
Behav Res (2012) 44:404–419 417

causing the results, and second, the participants originallylooked at the ROIs and, during the presentation of the fixationcross, they originally looked at the fixation cross. There arefour arguments to support these assumptions, as discussedbelow. The first two arguments concern the artifact-freeapplication of the correction methods.
First, the correction method will be applied to thefixations at a time when they are already created. Applyingor even calculating correction parameters does not changethe overall number or duration of fixations. The calculationof fixations is the main part of the event detection.Furthermore, eye movement events, such as saccades andfixations, must be created first, and corrections will only beapplied to them.
Second, the data used for the calculation of the correctionparameter are independent of the data for event detection oftrial fixations. Only the eye movement data from gazing at thefixation cross are used to calculate correction parameters andare measured at a different experimental time than the eyemovement data from the trial. The origins of ROIs areindependent of the origin of the fixation cross. We measuredeye movement data during a simple procedure of one pointcalibration (gaze at a fixation cross) and calculated the shift ofmeasured eye movement data to the origin of this calibrationpoint. A similar calibration procedure was performed with theeyetracker recording software at the beginning of theexperiment. This strategy was used to remap the gaze towardthe original coordinates again. It is also possible to use moresalient stimuli than a simple fixation cross to guide the gazecloser to the calibration object.
The last two arguments address the origin of the regionsthe participants looked at during the sampling of the eyemovement data. First, during the fixation period, theparticipants were asked to look at the fixation cross. Duringthe trial, they did not explicitly have the task of looking atthe eyes but were told to look at the picture on the screen.Regarding the eye movement during the presentation ofstatic faces, it was shown that the eyes are especially salientand are the main point of fixation (Emery, 2000; Itier &Batty, 2009). Second, no other objects were near the eyeROIs that might have attracted the gaze at all. For bothreasons, it is most likely that participants do fixate directlyon the eye region and that it is a more appropriate mappingof the participants gaze that fixations originally counted as"next to the eyes" after the correction are counted as "on theeyes."
According to the data, there were no significant differencesbetween the methods used for the calculation of the correctionparameter. In the present experiment, there was a fixationcross shown over the entire duration of this fixed-gaze period,and nomore objects were presented. For scenarios like this, allmethods are good estimates of the amount of shift in themeasured gaze. However, the fixation-based correction
methods may have some advantages over the median of thescan path when the fixation object occurs only in a part of thefixed-gaze data segment. Furthermore, for convenience,GazeAlyze also offers the opportunity to use fixation-basedcorrection for such situations.
Conclusion
GazeAlyze is currently in use in research laboratories at theUniversity of Rostock and at the Free University of Berlin.It has proven to be useful in psychophysiological experi-ments of the analysis of visual attention in the research ofsocial cognition. Furthermore, it has also been developedfor the analysis of reflex suppression in antisaccade tasks.The easy handling of all processing settings through theGUIs, the capabilities of batch processing, and the widerange of analysis and visualization features allow theresearcher to shorten the analysis time and provide all toolsfor handling the complexity of eye movement data analysis.
GazeAlyze offers a single software tool for managing alloffline processing steps involved in the preparation of eyemovement data for further statistical analysis: (from trialextraction during raw data file import over event detectionto the aggregation of event parameters into a single table).Because all settings are separate from the software inexperimental control files, setting information sharing anddata handling are further facilitated.
GazeAlyze is being actively maintained and developed.New functionality, such as the extension of analysisfeatures, (e.g., pupillometry) and the implementation ofother kind of event detection algorithms, such as Glissadedetection algorithms (Nystrom & Holmqvist, 2010), isexpected in future versions.
Acknowledgements We would like to thank Evelyn Schnapka andLars Schulze for their valuable suggestions and support during thedevelopment of the features of GazeAlyze.
Conflict of interest statement None declared.
References
Awh, E., Armstrong, K. M., & Moore, T. (2006). Visual andoculomotor selection: Links, causes and implications for spatialattention. Trends in Cognitive Sciences, 10, 124–130.
Blignaut, P. (2009). Fixation identification: The optimum threshold fora dispersion algorithm. Attention, Perception, & Psychophysics,71, 881–895.
Brainard, D. H. (1997). The Psychophysics Toolbox. Spatial Vision,10, 433–436.
Brassen, S., Gamer, M., Rose, M., & Buchel, C. (2010). The influenceof directed covert attention on emotional face processing.NeuroImage, 50, 545–551.
418 Behav Res (2012) 44:404–419

Camilli, M., Nacchia, R., Terenzi, M., & Di Nocera, F. (2008).ASTEF: A simple tool for examining fixations. BehaviorResearch Methods, 40, 373–382.
Cho, S., & Thompson, C. K. (2010). What goes wrong during passivesentence production in agrammatic aphasia: An eyetrackingstudy. Aphasiology, 24, 1576–1592.
Delorme, A., & Makeig, S. (2004). EEGLAB: An open sourcetoolbox for analysis of single-trial EEG dynamics includingindependent component analysis. Journal of NeuroscienceMethods, 134, 9–21.
Deubel, H., & Schneider, W. X. (1996). Saccade target selection andobject recognition: Evidence for a common attentional mecha-nism. Vision Research, 36, 1827–1837.
Domes, G., Czieschnek, D., Weidler, F., Berger, C., Fast, K., & Herpertz,S. C. (2008). Recognition of facial affect in borderline personalitydisorder. Journal of Personality Disorders, 22, 135–147.
Domes, G., Lischke, A., Berger, C., Grossmann, A., Hauenstein, K.,Heinrichs, M., et al. (2010). Effects of intranasal oxytocin onemotional face processing in women. Psychoneuroendocrinology,35, 83–93.
Ebner, N. C., Riediger, M., & Lindenberger, U. (2010). FACES—adatabase of facial expressions in young, middle-aged, and olderwomen and men: Development and validation. Behavior Re-search Methods, 42, 351–362.
Emery, N. J. (2000). The eyes have it: The neuroethology, functionand evolution of social gaze. Neuroscience and BiobehavioralReviews, 24, 581–604.
Fehd, H. M., & Seiffert, A. E. (2008). Eye movements during multipleobject tracking: Where do participants look? Cognition, 108,201–209.
Fischer, B., Biscaldi, M., & Otto, P. (1993). Saccadic eye movementsof dyslexic adult subjects. Neuropsychologia, 31, 887–906.
Gamer, M., Zurowski, B., & Buchel, C. (2010). Different amygdalasubregions mediate valence-related and attentional effects ofoxytocin in humans. Proceedings of the National Academy ofSciences, 107, 9400–9405.
Gitelman, D. R. (2002). ILAB: A program for postexperimental eyemovement analysis. Behavior Research Methods, Instruments, &Computers, 34, 605–612.
Goldberg, J. H., & Helfman, J. I. (2010). Scanpath clustering andaggregation. Paper presented at the 2010 Symposium on Eye-Tracking Research & Applications, Austin, TX.
Golomb, J. D., Marino, A. C., Chun, M. M., & Mazer, J. A. (2011).Attention doesn't slide: Spatiotopic updating after eye move-ments instantiates a new, discrete attentional locus. Attention,Perception, & Psychophysics, 73, 7–14.
Hoffman, J. E., & Subramaniam, B. (1995). The role of visual attention insaccadic eyemovements. Perception & Psychophysics, 57, 787–795.
Huff, M., Papenmeier, F., Jahn, G., & Hesse, F. W. (2010). Eyemovements across viewpoint changes in multiple object tracking.Visual Cognition, 18, 1368–1391.
Hunt, A. R., & Kingstone, A. (2003). Covert and overt voluntaryattention: Linked or independent? Cognitive Brain Research, 18,102–105.
Irwin, D. E., & Gordon, R. D. (1998). Eye movements, attention andtrans-saccadic memory. Visual Cognition, 5, 127–155.
Itier, R. J., & Batty, M. (2009). Neural bases of eye and gazeprocessing: The core of social cognition. Neuroscience andBiobehavioral Reviews, 33, 843–863.
Kowler, E., Anderson, E., Dosher, B., & Blaser, E. (1995). The role ofattention in the programming of saccades. Vision Research, 35,1897–1916.
Liu, C.-L., Chiau, H.-Y., Tseng, P., Hung, D. L., Tzeng, O. J. L.,Muggleton, N. G., et al. (2010). Antisaccade cost is modulatedby contextual experience of location probability. Journal ofNeurophysiology, 103(3), 1438–1447.
Matin, E. (1974). Saccadic suppression: A review and an analysis.Psychological Bulletin, 81, 899–917.
Morris, T., Blenkhorn, P., & Farhan, Z. (2002). Blink detection forreal-time eye tracking. Journal of Network and ComputerApplications, 25, 129–143.
Myung, J. Y., Blumstein, S. E., Yee, E., Sedivy, J. C., Thompson-Schill, S.L., & Buxbaum, L. J. (2010). Impaired access to manipulationfeatures in apraxia: Evidence from eyetracking and semanticjudgment tasks. Brain and Language, 112, 101–112.
Nystrom, M., & Holmqvist, K. (2010). An adaptive algorithm forfixation, saccade, and glissade detection in eyetracking data.Behavior Research Methods, 42, 188–204.
Papenmeier, F., & Huff, M. (2010). DynAOI: A tool for matchingeye-movement data with dynamic areas of interest inanimations and movies. Behavior Research Methods, 42,179–187.
Rayner, K. (2009). Eye movements and attention in reading, sceneperception, and visual search. Quarterly Journal of ExperimentalPsychology, 62, 1457–1506.
Reimer, B., & Sodhi, M. (2006). Detecting eye movements in dynamicenvironments. Behavior Research Methods, 38, 667–682.
Salvucci, D., & Anderson, J. R. (2001). Automated eye-movementprotocol analysis. Human Computer Interaction, 16, 39–86.
Salvucci, D., & Goldberg, J. (2000). Identifying fixations andsaccades in eye-tracking protocols. Paper presented at the ACMSymposium on Eye Tracking Research and Applications–ETRA2000, Palm Beach Gardens, FL.
Stigchel, S. V., Imants, P., & Richard Ridderinkhof, K. (2011). Positiveaffect increases cognitive control in the antisaccade task. Brainand Cognition, 75, 177–181.
Theeuwes, J., Belopolsky, A., & Olivers, C. N. (2009). Interactionsbetween working memory, attention and eye movements. ActaPsychologica, 132, 106–114.
Vosskuhler, A., Nordmeier, V., Kuchinke, L., & Jacobs, A. M. (2008).OGAMA (Open Gaze and Mouse Analyzer): Open-sourcesoftware designed to analyze eye and mouse movements inslideshow study designs. Behavior Researcj Methods, 40, 1150–1162.
Widdel, H. (1984). Operational problems in analysing eye movements.In A. G. Gale & F. Johnson (Eds.), Theoretical and appliedaspects of eye movement research (pp. 21–29). New York:Elsevier.
Behav Res (2012) 44:404–419 419