gca savvian corporation...deal siz e no. of advisor us$ mil. deals 1 mizuho 7,500 74 2 nomura 16,366...
TRANSCRIPT

GCA Savvian Corporation
Shareholders’ Meeting
(TSE1 :Ticker 2174)
March 26, 2014

1
Strengths of GCA Savvian
Philosophy
Firm
Our Corporate Philosophy:“Trusted Advisor for Client’s Best Interest”
Unique independent global M&A advisory firm listed on the Tokyo Stock Exchange with an extensive international platform
Advisory Deep experience in complex and innovative deals including cross-border and MBO transactions
HumanResources
HR management strategy that allows for professionals to focus on the client
Deal Size No. ofAdvisor US$ mil. Deals
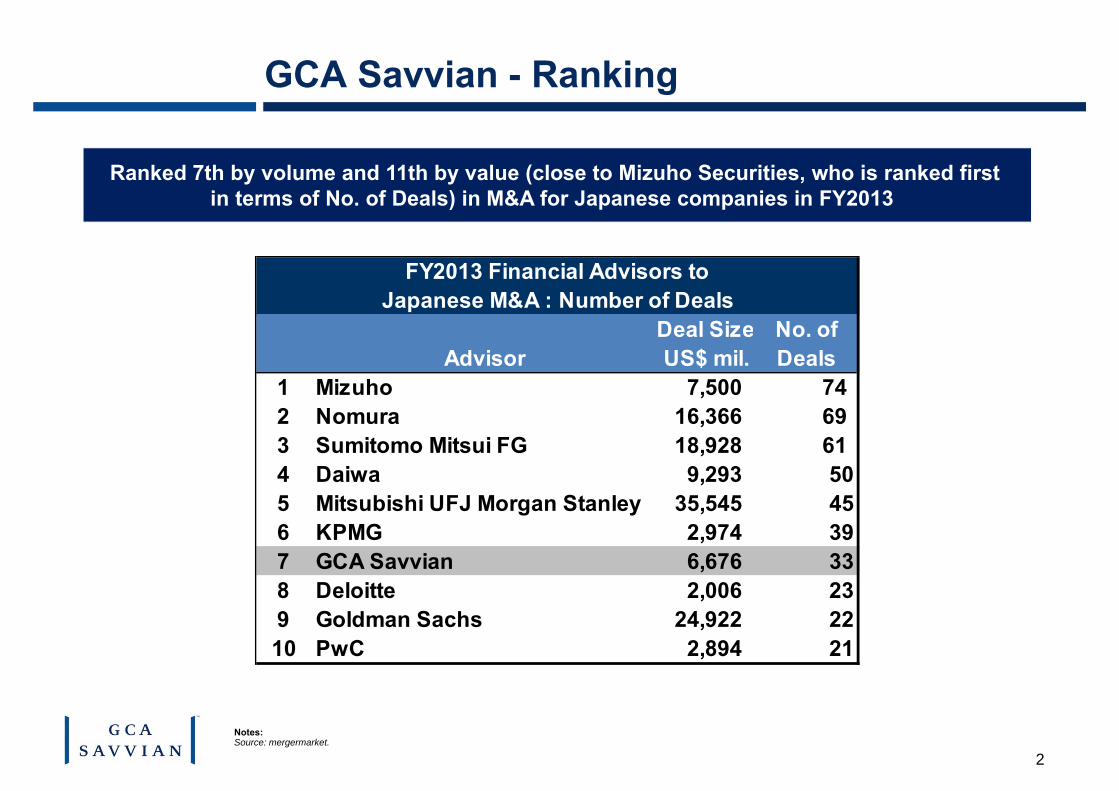
1 Mizuho 7,500 742 Nomura 16,366 693 Sumitomo Mitsui FG 18,928 614 Daiwa 9,293 505 Mitsubishi UFJ Morgan Stanley 35,545 456 KPMG 2,974 397 GCA Savvian 6,676 338 Deloitte 2,006 239 Goldman Sachs 24,922 2210 PwC 2,894 21
FY2013 Financial Advisors toJapanese M&A : Number of Deals
2
Ranked 7th by volume and 11th by value (close to Mizuho Securities, who is ranked firstin terms of No. of Deals) in M&A for Japanese companies in FY2013
GCA Savvian - Ranking
Notes:Source: mergermarket.

40
50
60
70
80
90
100
110
120
FY2010 FY2011 FY2012 FY2013
GCA Savvian
Major Japanese securities firms
3
GCA Savvian – Revenues
Over the years, GCA Savvian has steadily grown to achieve M&A advisory revenues that match leading Japanese securities firms
(0.1 billion Yen)
Notes:Sources: FY financial settlement information. Japanese major securities firm: March-end settlement, multiplied April to September figures by 2 for FY2013.(1) Fund unconsolidated.
(1)

Notes:Senior professionals are the aggregate of Managing Directors and Executive Directors. As of fiscal year end.
0
5
10
15
20
25
30
35
40
45
FY2009 FY2010 FY2011 FY2012 FY2013
Japan
US
4
Number of Senior Professionals
Advisory Business = Grow by increasing senior professionals
(People)

2,000
3,000
4,000
5,000
6,000
7,000
8,000
9,000
10,000
FY2009 FY2010 FY2011 FY2012 FY2013
Revenue
5
Revenue Trends
Strengthen deal origination = Aim for further revenue increases
(Million yen)
Notes:(1) Fund unconsolidated.
(1)

FY2013 M&A Market Trends

0
2000
4000
6000
8000
10000
12000
14000
0
500
1,000
1,500
2,000
2,500
2004 2005 2006 2007 2008 2009 2010 2011 2012 2013
Value
Number
0
500
1000
1500
2000
2500
3000
3500
0
2,000
4,000
6,000
8,000
10,000
12,000
14,000
16,000
18,000
20,000
2004 2005 2006 2007 2008 2009 2010 2011 2012 2013
Value
Number
7
M&A Market Trends in Japan / US
(Value : Billion Yen) (Number)
Japan M&A Market US M&A Market
Somewhat slow M&A growth in Japan and US in both volume and value
(Value : Billion USD) (Number)
Notes:Source: Thomson Reuters (based on deals completed).

8
Cross-border M&A transactions by Japanese companies (IN-OUT) declined in value by 33% in 2013
0
100
200
300
400
500
600
700
800
0
1,000
2,000
3,000
4,000
5,000
6,000
7,000
8,000
2004 2005 2006 2007 2008 2009 2010 2011 2012 2013
Value
Number
(Value : Billion Yen) (Number)
Notes:Source: Thomson Reuters (based on deals completed).
Decline in Japan Cross-border Transactions

0
10
20
30
40
50
60
70
80
90
100
0
1,000
2,000
3,000
4,000
5,000
6,000
7,000
8,000
2004 2005 2006 2007 2008 2009 2010 2011 2012 2013
Value
Number
9
However, cross-border M&A activities involving Asian countries by Japanese companies increased significantly
Our Asia-related revenues increased threefold from 2012 (250→790 mm yen)
Increase Cross-border Transactions in Asia
Notes:Source: Nikkei Newspaper (Recof, as of December 16, 2013).
(Value : 0.1 Billion Yen) (Number)

FY2013 Financial Performance
11
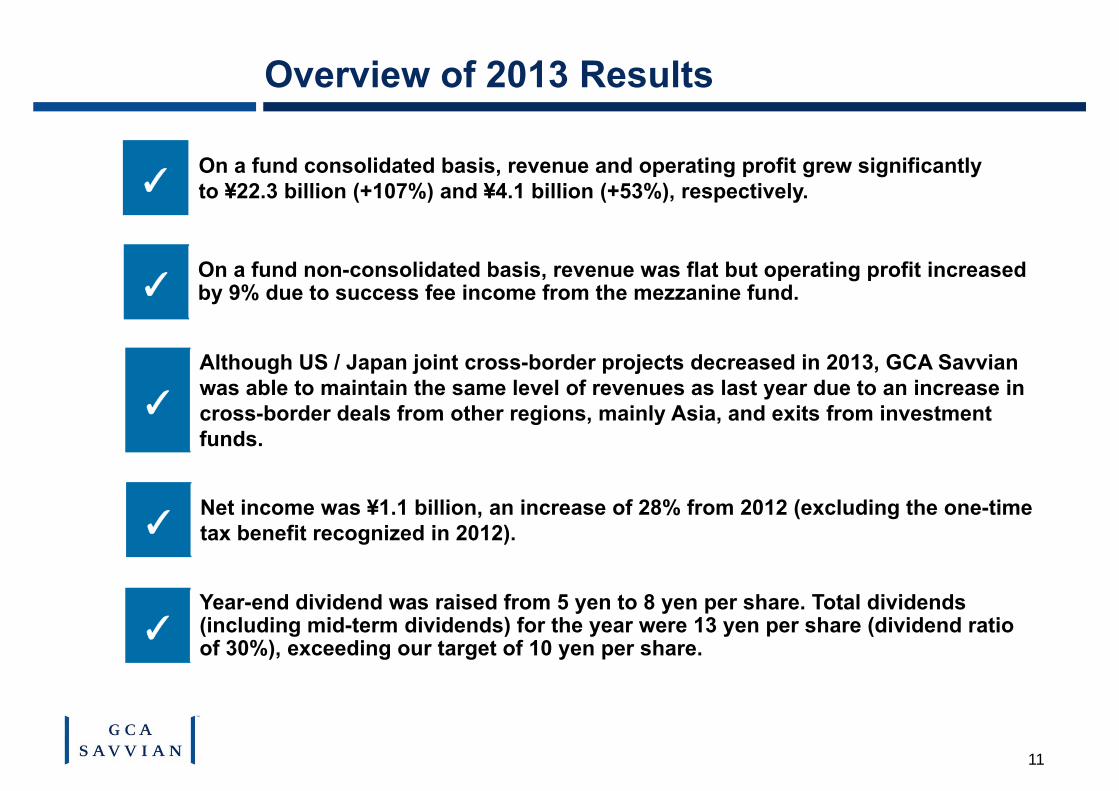
Overview of 2013 Results
✓On a fund consolidated basis, revenue and operating profit grew significantly to ¥22.3 billion (+107%) and ¥4.1 billion (+53%), respectively.
✓On a fund non-consolidated basis, revenue was flat but operating profit increased by 9% due to success fee income from the mezzanine fund.
✓
Although US / Japan joint cross-border projects decreased in 2013, GCA Savvian was able to maintain the same level of revenues as last year due to an increase in cross-border deals from other regions, mainly Asia, and exits from investment funds.
✓Net income was ¥1.1 billion, an increase of 28% from 2012 (excluding the one-time tax benefit recognized in 2012).
✓Year-end dividend was raised from 5 yen to 8 yen per share. Total dividends (including mid-term dividends) for the year were 13 yen per share (dividend ratio of 30%), exceeding our target of 10 yen per share.

12
FY2013 Financial Performance
On a fund consolidated basis, the realization of 7 investments by the mezzanine fund resulted in a significant increase in revenue and operating income
On a non-fund consolidated basis, income also increased due to success fee income from the mezzanine fund
(Million Yen)
Fund Consolidated Fund Unconsolidated
10,813
22,381
2,746
4,187
0
500
1,000
1,500
2,000
2,500
3,000
3,500
4,000
4,500
0
5,000
10,000
15,000
20,000
25,000
2012 2013
Revenue EBIT
Notes:Foreign exchange rates for FY2013 Actual Average : ¥97.65/US$ and ¥152.71/GBP.Foreign exchange rates for FY2012 Actual Average: ¥79.82/US$ and ¥126.50/GBP.
(Million Yen)
9,555 9,572
1,588 1,737
0
200
400
600
800
1,000
1,200
1,400
1,600
1,800
2,000
0
2,000
4,000
6,000
8,000
10,000
12,000
2012 2013
Revenue EBIT

(Million Yen)Actual (1)
FY2013 率 FY2012 率 Change %RevenueAdvisory Japan 4,124 4,395 (271) (6.2)% US 3,914 4,065 (151) (3.7)%Due Diligence 308 346 (38) (11.0)%Asset Management 1,226 749 477 63.7 % Fund Unconsolidated 9,572 9,555 17 0.2 %Revenue from Fund 14,035 1,996 12,039 603.2 %Elimination (1,226) (738) (488) 66.1 % Fund Consolidated 22,381 10,813 11,568 107.0 %
EBIT Fund Unconsolidated 1,737 18.1% 1,588 16.6% 149 9.4 % Fund 2,450 1,158 1,292 111.6 % Fund Consolidated 4,187 18.7% 2,746 25.4% 1,441 52.5 %
Net Income 1,125 5.0% 1,259 11.6% (134) (10.6)%
(Reference) Net Income excluding deferred tax effectNet Income 1,125 879 246 28.0 %
13
The Advisory Business was able to maintain the same level of revenue as last year despite the absence of a mega-deal and a decline in US / Japan joint cross-border M&A
Net income increased by 28% from 2012 when excluding the one-time tax benefit recognized in 2012
FY2013 Financial Performance - Detail
Notes:(1) Foreign exchange rates for FY2013 Actual Average : ¥97.65/US$ and ¥152.71/GBP; Foreign exchange rates for FY2012 Actual Average: ¥79.82/US$ and ¥126.50/GBP.
-600-400-200
0200400600800
1,0001,2001,400
Q1 Q2 Q3 Q4 Q1 Q2 Q3 Q4 Q1 Q2 Q3 Q4 Q1 Q2 Q3 Q4
0500
1,0001,5002,0002,5003,0003,5004,000
Q1 Q2 Q3 Q4 Q1 Q2 Q3 Q4 Q1 Q2 Q3 Q4 Q1 Q2 Q3 Q4
Asset Management
Due Diligence
Advisory
14
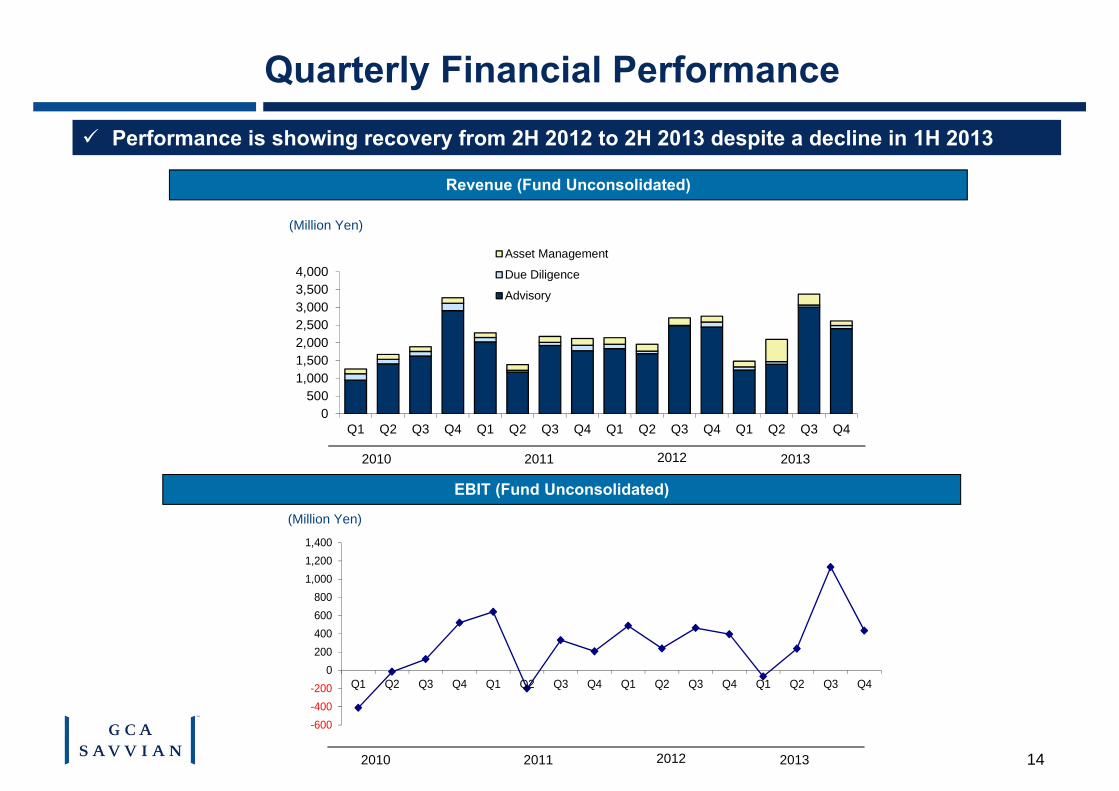
Quarterly Financial Performance
Revenue (Fund Unconsolidated)
EBIT (Fund Unconsolidated)
2011 20132010 2012
2011 20132010 2012
Performance is showing recovery from 2H 2012 to 2H 2013 despite a decline in 1H 2013
(Million Yen)
(Million Yen)

Fund Consolidated Fund UnconsolidatedAccounts 2012/12 (1) 2013/12 (2) 2012/12 (1) 2013/12 (2)
Cash and Cash Equivalent 5,556 7,147 4,781 5,659Accounts Receivable 1,033 1,154 1,033 1,154Operational Invest Security (3) 15,491 5,328 255 328Operational Invest Loan (3) 10,589 1,008 240 17Others 1,128 482 1,010 473
Current Assets 33,799 15,119 7,321 7,631Furniture etc. 235 239 235 239Investment Sec. 251 287 251 287Others 1,079 1,191 1,077 1,192
Fixed Assets 1,565 1,717 1,565 1,718Total 35,364 16,836 8,886 9,349Income Tax Payable 488 268 488 268Others 2,418 2,149 2,407 2,135
Liabilities 2,906 2,417 2,895 2,403Capital 7,644 8,260 7,580 8,192Treasury Stock (2,000) (2,000) (2,000) (2,000)Exchange Valuation 412 753 411 754Minority Interest (3) 26,402 7,406
Net Assets 32,458 14,419 5,991 6,946Total 35,364 16,836 8,886 9,349
Actual Capital Ratio→ 74%
(Million Yen)
15
Strong Balance Sheet
ROE for FY2012 was 22% compared to 18% in FY2013 As investment recovery of the mezzanine funds progressed, fund consolidated net
assets have declined due to fewer investments in the funds
Notes:(1) Ex-rate as of Dec 31, 2012: ¥86.58/US$ and ¥139.53/GBP.(2) Ex-rate as of Dec 31, 2013 : ¥105.40/US$ and ¥173.74/GBP.(3) Accounts reflected by Fund Consolidation.

Other Topics

0
100
200
300
400
500
600
0
200
400
600
800
1,000
1,200
FY2009 FY2010 FY2011 FY2012 FY2013
Revenue
EBIT (Pre-elimination)
17
Mezzanine Fund Business
Performance trends are stable for the business Success fees were recognized this year
(Million yen)
(Revenue) (EBIT)
Investments were realized from 7 transactions and the associated success fees were recognized during the year
A total of 18 investments in 3 funds totaling approximately 43 billion yen were made so far
New deal flow activities of the buyout mezzanine fund led by PE funds and corporate mezzanine deals are steady and on track with extensive transaction pipelines

18
Strategic Business Alliance with ICICI In October 2013, GCA Savvian entered into a strategic business alliance with ICICI
Securities Ltd., a wholly-owned subsidiary of ICICI Bank Ltd, a leading bank in the private sector
ICICI Securities’ extensive network and information will enable us to provide further M&A deal opportunities with Indian companies to our clients

19
Closed in Feb 2014
FY2013 Notable Transactions
Advised on many complex transactions by leveraging our unique strengths
Closed in Dec 2013
Advised Monolith Holdings Inc. (SPC) on its management
buyout of 1st Holdings, Inc.
Advised Toray Industries, Inc. on acquisition of
Zoltek Companies, Inc.
Closed in Feb 2014
Advised Hitachi, LTD. on its business integration in the thermal
power generation systems field with Mitsubishi Heavy
Industries, LTD.

20
Corporate GoalsFY2013 Corporate Goals and Evaluation
(1) Improve our cost structure through reduction of office rent (Tokyo and NYC rent reduction beginning in 2014)- Rent savings of approximately 200 mm yen starting in 2014
(2) Reinforce alliance with boutique firms in Europe and Asia- Alliance with ICICI Securities in India; sending professional staff
from Japan to a European boutique firm (3) Enhance GCA Savvian brand: Promote through seminars (Japan)
- Actively arrange and host seminars and conferences(4) Increase Japan-US joint cross-border projects by 30%
- Significant decline during 2013, in part due to very strong 2012(5) Increase non-US cross-border transactions by Japanese companies
by 30% (Japan)- 60% increase in value from 807 mm yen to 1,293 mm yen
FY2014 Corporate Goals(1) Increase cross-border execution business(2) Continue to recruit senior professionals in our existing areas (3) Broaden sector coverage, with particular focus on areas that are relevant to Japan
(Industrials) (4) Improve revenue per partner

21
FY2014 Outlook
✓We expect the M&A environment to improve in 2014 as the US economy continues its recovery. Financial sponsors continue to be active and corporations have strong balance sheets and are seeking growth through M&A.
✓Due to stronger stock prices, profitability and increased confidence in Japan’seconomy, Japanese companies are expected to accelerate foreign investments. Already, we are encouraged by our firm’s pipeline heading into 2014.
✓ Japan and the U.S. each hired four new Managing Directors in 2013. This expands our relationship base and execution expertise and we expect further headcount growth in 2014.
✓We introduced a new management strategy in Japan called "Cell Management." This should create greater efficiency, increased sector specialization and better service for our corporate clients.
✓We expect a significant reduction in our rent expense of 200 million yen annually due to new leases in both Tokyo and New York. The mezzanine fund expects continued strength in success fee income during FY2014.
✓We plan to adopt IFRS (International Financial Reporting Standard) in 2014 to reflect the globalization of the firm.
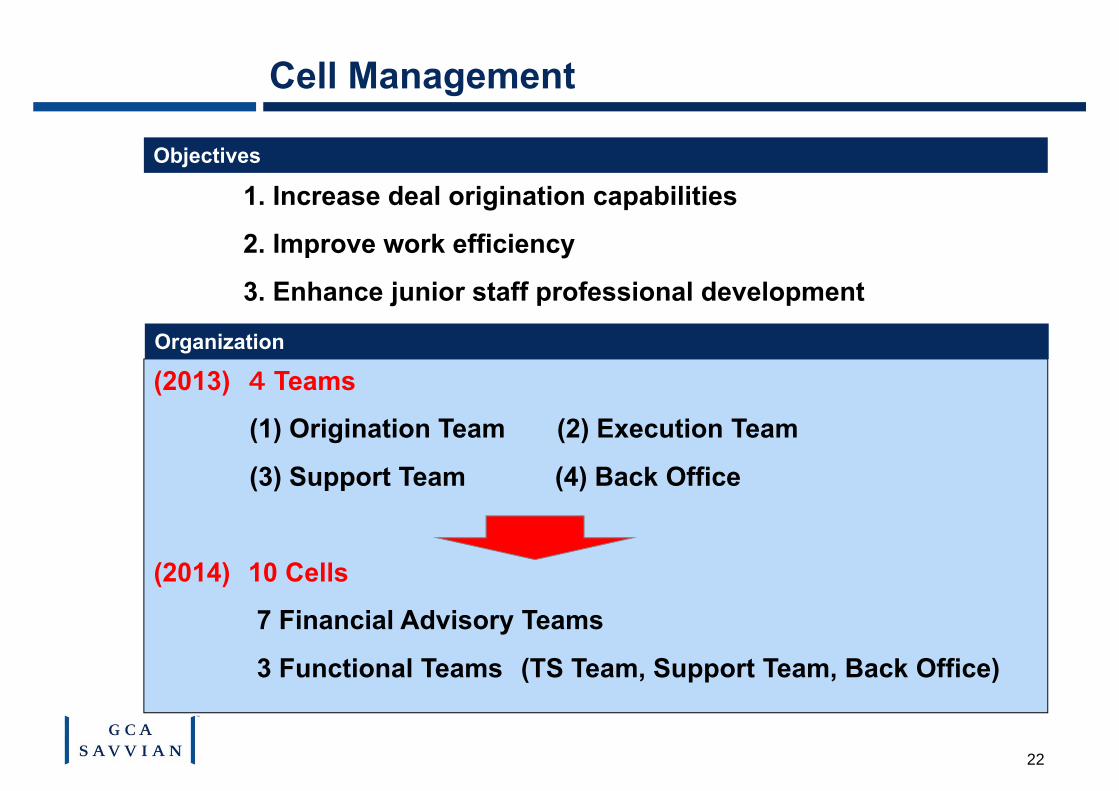
1. Increase deal origination capabilities
2. Improve work efficiency
3. Enhance junior staff professional development
(2013) 4 Teams
(1) Origination Team (2) Execution Team
(3) Support Team (4) Back Office
(2014) 10 Cells
7 Financial Advisory Teams
3 Functional Teams (TS Team, Support Team, Back Office)
Cell Management
Objectives
Organization
22

23
Digital Technology Operating New Co.
New Co. supports venture-backed companies in Silicon Valley where our U.S. team already has strong relationships in order to expand their businesses in Japan and other Asian countries
New Co. serves as a bridge between Silicon Valley companies and major Japanese companies that need their technology
Videology is the largest video advertising platform in the world.We successfully connected Yahoo! Japan and Videology, resulting in a strategic alliance.
Martini Media provides technology for prestigious brands to deliver advertising more effectively to an affluent audience. We support their business expansion in the Japanese market.
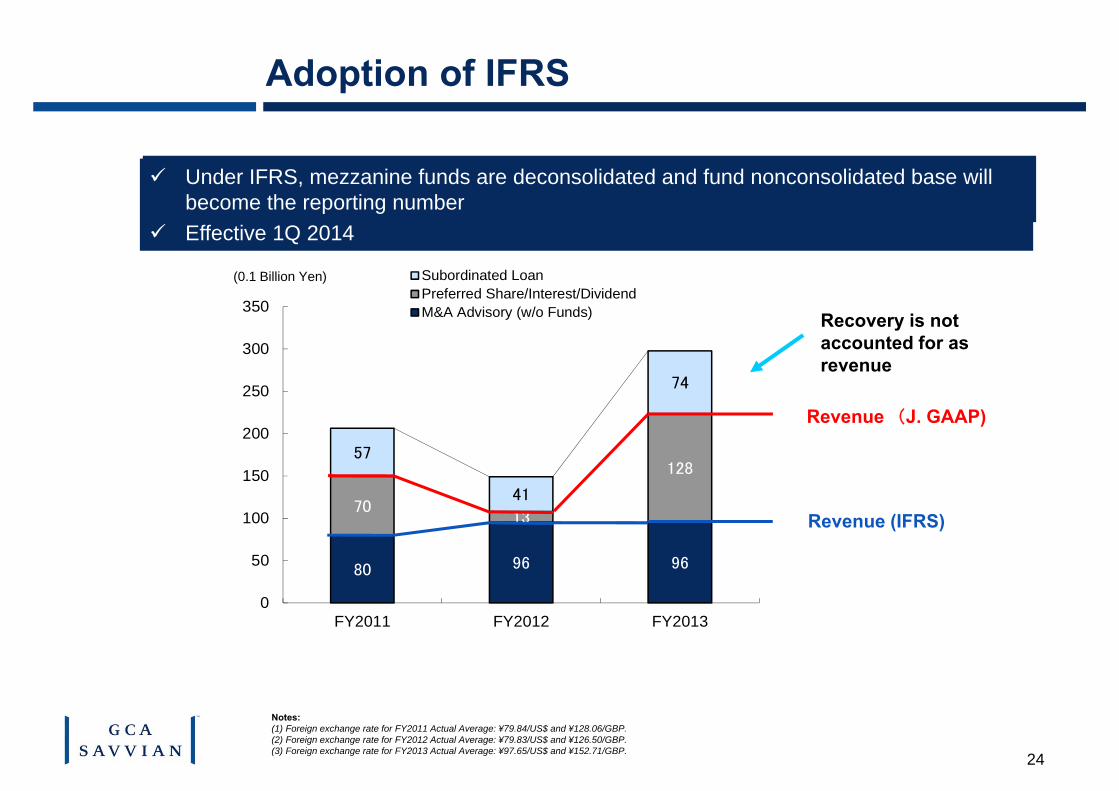
80 96 96
7013
12857
41
74
0
50
100
150
200
250
300
350
FY2011 FY2012 FY2013
Subordinated LoanPreferred Share/Interest/DividendM&A Advisory (w/o Funds)
24
Adoption of IFRS
Revenue (J. GAAP)
Recovery is not accounted for as revenue
Revenue (IFRS)
(0.1 Billion Yen)
●
●
Notes:(1) Foreign exchange rate for FY2011 Actual Average: ¥79.84/US$ and ¥128.06/GBP.(2) Foreign exchange rate for FY2012 Actual Average: ¥79.83/US$ and ¥126.50/GBP.(3) Foreign exchange rate for FY2013 Actual Average: ¥97.65/US$ and ¥152.71/GBP.
Under IFRS, mezzanine funds are deconsolidated and fund nonconsolidated base will become the reporting number
Effective 1Q 2014

Market Opportunity

26
Growth of Global Economy and Japan
The global economy has tripled in size over the past 20 years, but Japan GDP has remained unchanged
Japan’s GDP as a percentage of global GDP declined to 7% in 2013 from 18% 20 years ago
Global: $25,000Bn <3 times> $74,000Bn
Japan: $4,400Bn <1.1 times> $5,000Bn
1993
2013
Reason for the decline : Slow Globalization and Market Expansion
EU29.6%
US27.2%
Japan17.5%
China2.4%
Asia(Excluding China)
3.0%
EU23.5%
US22.8%
Japan12.2%
China6.8%
Asia(Excluding China)
5.7%
Notes:“Developing Asia” is defined by IMF.Source: GCAS prepared based on IMF World Economic Outlook Database (October 2013)

27
Global M&A Market
996.2
862.1
92.330.9 25.7
1,227.6
835.3
124.8
269.3
88.2
0
200
400
600
800
1,000
1,200
1,400
米国 EU 日本 中国 アジア新興国
(除く中国)
($Billions)
2004 2013
The size of the Japanese M&A market is only 10% of the size of the US M&A market, and it has grown only 30% over the past 10 years
The Asian market is expanding rapidly; specifically, the size of the Chinese market has become twice as large as that of Japan, while 10 years ago it was only a third of the size of the Japanese market
The markets of other developing Asian countries have become the same size as the Japanese market 10 years ago
Notes:“Market size represents total of deal values in which buyer / seller locates relevant region / country. Developing Asia represents the total deal values in
“Developing Asia” as defined by IMF.Source: Prepared by GCAS based on Thomson Reuters.

28
3.2
2.1
2.9 3.0
2.5
0.0
0.5
1.0
1.5
2.0
2.5
3.0
3.5
2008 2009 2010 2011 2012
JapanUS/CanadaEuropeGlobal
M&A Market Size
Total global M&A advisory fees are estimated at JPY 2.5 trillion, and JPY 150billion for Japan. GCA Savvian’s current market share is approx 0.4%.
1% share = JPY 25 billion, 5% share = JPY 125 billion
Significant room for growth
(Unit : Trillion Yen)
Notes:Average exchange rate at ¥100.00/US$.

29
Mission / Growth Strategy
As an independent / specialized M&A advisory firm, we continue to uphold our mission, “For Client’s Best Interest,” and enhance the GCA Savvian brand
Support Japanese clients in their globalization through M&A
By leveraging our network in the US technology market, we will drive and support M&A activity that will connect innovative technologies with Japanese companies looking to expand internationally
By 2020, become Japan’s leading investment bank and by 2030, become a world leading M&A
advisory firm

Resolution

31
1. Selection of 7 directors
31
Resolution

32
“Trusted Advisor For Client’s Best Interest”
Statements made at this presentation and in these materials include forward-looking statements that are based on our current forecasts, assumptions, estimates and projections about our business and the industry. These forward-looking statements are subject to various risks and uncertainties. These statements discuss future forecasts and plans, identify strategies, contain projections of results of operations and of our financial condition, and state other “forward-looking” information. Known and unknown risks, uncertainties and other factors could cause the actual results to differ materially from expected results contained in any forward-looking statements. Potential risks and uncertainties include, without limitation, our ability to continue to attract and retain customers; our ability to make our operations profitable; our ability to continue to expand and maintain our computers and electronic systems to avoid failures of these systems, and our ability to maintain our relationship with our founding shareholders. The financial information presented in not in accordance with US GAAP. Forward-looking statements are made based upon the best information available to us on the day of presentation and we will not revise or update any forward-looking statements for any new information or future events.
This is an English translation of Japanese presentation materials prepared for investor relations purpose. If there is any discrepancy between a statement in English and a statement in Japanese, the Japanese version will be the controlling document.
As the world’s global public M&A solutions group and public institution, GCA Savvian Corporation aims to contribute to the growth and development of clients and the world economy by
continuously providing value creating M&A solutions.