gcse geography - worthing high · pdf filegeography unit two: population change. question 1....
TRANSCRIPT

GCSE
Geography
Unit Two: Population Change.
Question 1.
Population Change Revision Checklist:
1. Read through your notes and tick off whether you have notes on the topics that have been covered. If not,
you must copy up ASAP.
2. For each topic you must provide a score to reflect how well you think you understand what you’ve
covered. Provide a score of 1-5.
3. Identify the topics you most need to revise – and do this as a priority!
1 = Don’t understand 3 = Understand some 5 = Understand all
Section of Topic Pages: Notes? Understanding?
POPULATION GROWTH:
Global: The exponential rate of world population growth.
DTM: The five different stages of the Demographic Transition Model (birth rates, death rates, natural population change, and the changing population structure).
Causes of population change: The impact of increasing urbanisation, agricultural change, education and the emancipation of women on the rate of population growth.
76/77
STRATEGIES TO MANAGE POPULATION CHANGE:
Implications of population growth: The social, environmental, economic and political implication of population change and the need to achieve sustainable development.
Policies: The effectiveness of population policies adopted in different countries (China & Indonesia) since the 1990’s.
Case study: A case study of China’s one child policy (with a focus on post 1990).
Case study: A case study of Indonesia’s transmigration policy (non-birth control).
78/79/80/81
AGING POPULATIONS:
Population structure: the relationship between the population structure and population decline and the impact on the future economic development.
Issues: The problems associated with an ageing dependent population.
Coping strategies: Government strategies to cope with an ageing population and the incentives suggested for encouraging an increase in a country’s birth rate.
Case study: A case study of the problems and strategies in one EU country with an ageing population.
77/80/81
MIGRATION:
Causes: decision making, push factors, pull factors and the positive & negative impacts experienced by the source and host country.
EU migration: Economic movements within the EU, refugee movements to the EU and the impacts of these movements.
78/82/83

Population
Revision Checklist and Booklet
Birth rate/death rate/natural increase
Population Pyramids
Demographic Model of Transition
Reasons for higher birth rates in poorer countries
Impact on population growth of
Urbanisation
Agricultural change
Emancipation of women
Education
Reasons why and how a country controls its population size including
China’s One Child Policy (up to present day)
Kerala
Reasons for an ageing population
Problems of an ageing Population
Government strategies to solve the problem of an ageing Population in the EU
Types of Migration
Push-Pull Factors
Advantages and disadvantages to an EU country receiving Migrants
Advantages and disadvantages to a country of emigration
Reasons for refugee movements to the EU
Factors affecting Population
http://www.bbc.co.uk/learningzone/clips/topics/secondary/geography/population_factors_affecting_population.sht
ml

World Population Growth
The worlds population has grown exponentially (resulting in a J curve). In recent years the
growth rate is starting to slow down. Population is likely to reach 9.2 billion by 2050 and
peak at 10 billion in 2150. This should be followed by a period of zero growth (birth rate is
equal to the death rate so there is no growth or decrease)
Key Population Terms
Birth Rate The number of babies born per 1000 per year
Death Rate The number of deaths per 1000 per year
Natural Increase The birth rate is higher than the death rate
Natural Decrease The death rate is higher than the birth rate
Natural Change The difference between birth rate and death rate expressed as a
percentage
Infant Mortality The number of babies under one that die per 1000 per year
Child Mortality The number of children under five that die per 1000 per year
S curve: growth rates are slowing
down so the shape of the graph is
levelling off into an S curve.
Exponential growth: a pattern
where the growth rate constantly
increases- often shown as a J
curve

Factors affecting population growth
Agricultural change
Mechanisation means fewer children are needed to work the land.
Urbanisation
A major reason for rural to urban migration is to find better
education for children. This means that child labour is less valued
in cities so people have fewer children
Education
Improved education brings improved standards of living- children
then become an economic disadvantage so people have fewer
Emancipation and
Status of Women:
Opportunities for girls increase. Equality increases. Choice over
contraception. Women choose not to have children or to have
them later reducing the number they have. Larger families
rejected. As childcare is expensive child numbers are limited.
Demographic Transition Model (DTM)
This model explains birth and death rate patterns across the world and through time.

The UK DTM through Time:
Stage Time Events
1 Before 1760 Little birth control, low life expectancy, Little medicine
2 From 1760 Improvements in medical discoveries following the agricultural
and industrial revolutions meant that the death rate started to
drop. Life expectancy started to increase as hygiene improved
and some diseases started to fall.
3 From 1880 Death rates continue to fall. Economic changes meant that
children cost the family money rather than earn it. The 1870
Education Act meant children up to 12 went to school costing
money and meaning they couldn’t earn money. This made people
have fewer children
4 Post War
Post 1945
Birth and death rates both low. Women working, high levels of
wealth. Growing status of women, Availability of contraception,
longer life expectancy.
The UK has not entered stage 5 as although our death rates
have risen slightly due to an increasing number of older people
our birth rates have not dropped below the death rate as it has
in other countries.
Countries is different stages of the DTM
Stage Country/
Location
Reasons
1 Traditional
rainforest
tribes
Isolated tribes who have little health care so still have high
death rates and high birth rates
2 Afghanistan Very poor country. Very high birth rates but lower death
rates. Many children needed to work.
3 Brazil NIC (Newly Industrialised Country). Catholic country so high
birth rates as contraception not widely used. Rapidly improving
standard of living means that people can see the benefits of
having fewer children so birth rate dropping.
4 USA Low birth rates and death rates due to high levels of economic
development.
5 Germany Women achieving high powered positions at work mean a lower
birth rate plus an ageing population means that Germany’s birth
rate is well below replacement level.

Population Pyramids
Type of bar graph used to show the age and gender structure of a country. We can compare
them to the stages of the DTM. The stage one pyramid has a very wide base, but infant
mortality and child mortality rates are very high so the sides are convex. Only a few remote
tribes now have this shape.
DTM - Stage 2: Afghanistan:
A few more elderly people than in stage one
Sides narrow due to relatively high death rate
Wide base due to high birth rate
DTM - Stage 3: Bangladesh:

Narrowing base shows the decrease in birth rate
Beginning to become straighter sided
Health improvements allow people to live into old age
DTM - Stage 4: USA
Most people die in old age- life expectancy high
Birth rate reducing causing a concave shape
Straighter sides equals a steady low birth rate
DTM - Stage 5: Germany
Increasing proportions of very old people
Middle aged generations much larger than those of their children due to the low birth
rate
When the middle aged population becomes elderly the problem is that the working
population is not large enough to support them

Strategies to deal with rapid population growth
A sustainable population is one whose growth and development means that it does not
threaten the welfare of future generations.
Stage 4 of the DTM is the most sustainable.
China realised in the 1970s that the country was heading for famine unless changes were
made as they had experienced serious famine before. After the last famine there was a
baby boom which meant that the population was then growing too fast.
ONE CHILD POLICY, CHINA
A Case Study of Population Control in an Poor Country
Background:
China is an LEDC with a largely
rural population
70% of water supply does not
meet World Health
Organisation minimum
standards
Rural – urban migration
significant since the 1980’s
Huge pressure on natural
resources and services – 50%
of Chinese are under 25
1979 – Chinese population
exceeded 1 billion – 1 Child
Policy started – population
growth has slowed
2008 – population 1.3 billion
Strategy:
Couples:
Must not marry until late 20’s
Must not have more than 1 Child
Must be sterilised after the first pregnancy
or abort future pregnancies
Would receive a 5-10% salary increase for
limiting the family to 1 child
Would have priority housing, pension, family
benefits – free education for child
Rigorously enforced amongst the Han
Chinese in cities – rural areas & minority
groups exempted
Couples not following the rules:
10% salary cut
Fine imposed so large it would bankrupt
families
Family have to pay for education of any
children & all health costs for the family
‘Granny Police’: older women of the community
entrusted to keep everyone in line.
Positive Effects:
Population growth has slowed
(estimated that 400 million
fewer people have been born)
Negative Effects:
The elderly tend to be looked after by sons
– decline in number of girls being born due to
abortions – in 2000, 90% of abortions were

Estimated that population was
reduced by 300 million in first
20 years
Standards of living have
improved
girls
2009 – national average of 114 males to
every 100 females
In time there will be a rise in the relative
number of elderly
Controversy reigns about this policy as:
Women forced to have very late abortions (9th month)
Women under great pressure from families and granny policy
Local officials had power over private lives
Sons preferred so large incidences of girls in orphanages (15 million orphans as a
result of this policy) and female infanticide
Children known as ‘Little Emperors’ as they have the reputation of being over indulged.
Changes in 1990s and 2000s
Young couples who are both only children are allowed 2 children
If you work for the government you are still only allowed one child to set an example
The attitude towards girls has improved now that women are doing better in the
workplace.
Due to increased wealth more people are willing to break the rules and pay all the
extras that go with more than one child
Not all young men will be able to marry as there are now 60 million more young men
than women.
Policy will remain as there are still 1 million more births than deaths every 5 weeks

KERALA, INDIA
A Case Study of a poor country (an alternative to the One Child Policy in China)
Background:
India was the first LEDC to
launch a national family planning
strategy in 1952 – included both
contraception & social changes
Kerala, SW India is a socialist
state.
Population 32 million – 3% of
India’s total population
It is one of the few regions to
have passed through stage 4 of
the Demographic Transition
Model
It’s decreased birth rate is the
most dramatic in India
Its GDP higher than most of
India
Kerala’s Birth control strategy
started in 1960’s
Strategy:
Equality between boys & girls in education
Right to literacy Programme - adult literacy
classes in towns & villages
Stressing the benefits of smaller families
Reducing infant mortality = people don’t
need so many children
Vaccination programmes & better health
care
Free contraception & advice
Encouraging higher age marriage
Allowing maternity leave for first 2 babies
only
Extra retirement benefits for those with
small families
Following a land reform programme
Positive Effects:
Population growth has slowed
More girls go to university than
boys
Each family now has 8 hectares
of land – enough to be self-
sufficient – larger families
would endanger this
Adult literacy in Kerala is
89.9% compared to 58% in the
rest of India
Life expectancy in Kerala is 73
years compared to 64% in the
rest of the country
Negative Effects:
Preference for sons reflected in higher
female infant mortality rates
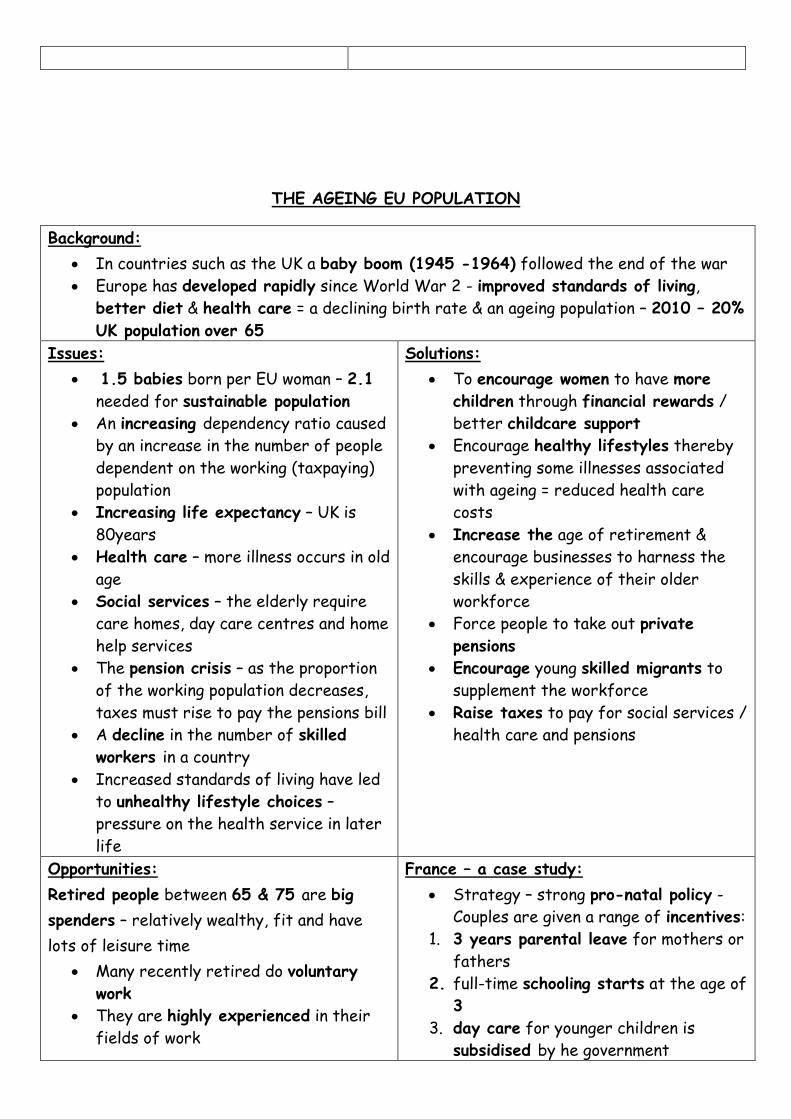
THE AGEING EU POPULATION
Background:
In countries such as the UK a baby boom (1945 -1964) followed the end of the war
Europe has developed rapidly since World War 2 - improved standards of living,
better diet & health care = a declining birth rate & an ageing population – 2010 – 20%
UK population over 65
Issues:
1.5 babies born per EU woman – 2.1
needed for sustainable population
An increasing dependency ratio caused
by an increase in the number of people
dependent on the working (taxpaying)
population
Increasing life expectancy – UK is
80years
Health care – more illness occurs in old
age
Social services – the elderly require
care homes, day care centres and home
help services
The pension crisis – as the proportion
of the working population decreases,
taxes must rise to pay the pensions bill
A decline in the number of skilled
workers in a country
Increased standards of living have led
to unhealthy lifestyle choices –
pressure on the health service in later
life
Solutions:
To encourage women to have more
children through financial rewards /
better childcare support
Encourage healthy lifestyles thereby
preventing some illnesses associated
with ageing = reduced health care
costs
Increase the age of retirement &
encourage businesses to harness the
skills & experience of their older
workforce
Force people to take out private
pensions
Encourage young skilled migrants to
supplement the workforce
Raise taxes to pay for social services /
health care and pensions
Opportunities:
Retired people between 65 & 75 are big
spenders – relatively wealthy, fit and have
lots of leisure time
Many recently retired do voluntary
work
They are highly experienced in their
fields of work
France – a case study:
Strategy – strong pro-natal policy -
Couples are given a range of incentives:
1. 3 years parental leave for mothers or
fathers
2. full-time schooling starts at the age of
3
3. day care for younger children is
subsidised by he government

Provide free child care for
grandchildren
4. the more children a woman has, the
earlier she is allowed to retire
Not completely successful – birth rates have
decreased from 18 / 1000 in 1960 to
14.4/1000 in 2010
Sample Answer
The population of the EU is ageing. Discuss how this is contributing to making the EU
population unsustainable.
(6marks)
The current trend in the EU population is unsustainable for a number of reasons.
Currently, in the EU 1.5 babies are born per woman, but 2.1 are needed for a sustainable
population. As a result, many EU countries are experiencing a decline in population. What
is more, the end of the Second World War saw a baby boom which lasted until 1964.
Europe as a whole developed rapidly in this period. Rising living standards have led to
improved standards of living, the emancipation of women, smaller families, but most
tellingly of all, an ageing population. This ageing population and the decline in the birth rate
over the past few decades has meant that the dependency ratio has increased. This is in
part the result of increased life expectancy (the UK is currently 80years) and partly
because the percentage of the working population supporting them has decreased. This has
a number of consequences: firstly, in the UK we face a pensions crisis as the proportion of
the working population decreases, taxes must rise to pay the pensions bill; secondly, one
result of increased standards of living is that we make unhealthy lifestyle choices which
puts increasing pressure on the health service as we age; thirdly, as we develop,
communities and family ties break down meaning that more and more old people are reliant
on social services for their needs. Clearly, all this has to be funded by the taxpayer. This
means that the birth rate needs to be sufficient to replace retiring workers or we need to
encourage immigration to fill the short fall. In summary, the current relationship between
birth rates and increasing life expectancy is unsustainable and governments need to
address this situation.
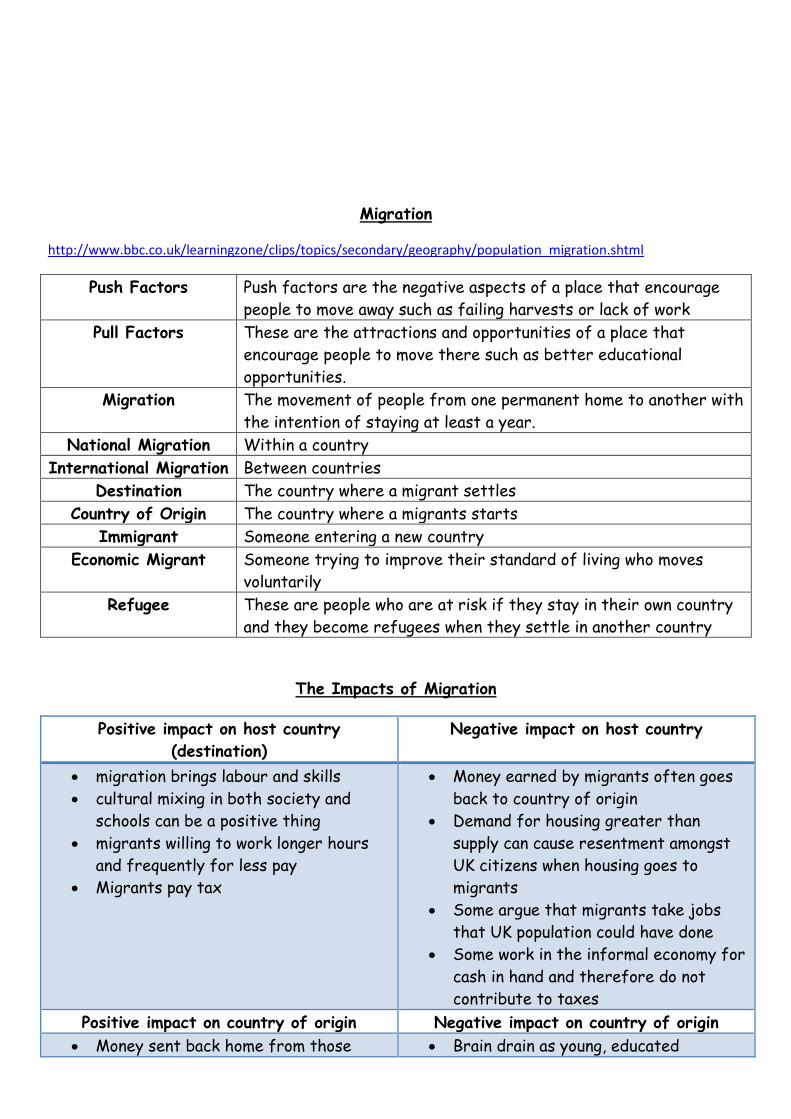
Migration
http://www.bbc.co.uk/learningzone/clips/topics/secondary/geography/population_migration.shtml
Push Factors Push factors are the negative aspects of a place that encourage
people to move away such as failing harvests or lack of work
Pull Factors These are the attractions and opportunities of a place that
encourage people to move there such as better educational
opportunities.
Migration The movement of people from one permanent home to another with
the intention of staying at least a year.
National Migration Within a country
International Migration Between countries
Destination The country where a migrant settles
Country of Origin The country where a migrants starts
Immigrant Someone entering a new country
Economic Migrant Someone trying to improve their standard of living who moves
voluntarily
Refugee These are people who are at risk if they stay in their own country
and they become refugees when they settle in another country
The Impacts of Migration
Positive impact on host country
(destination)
Negative impact on host country
migration brings labour and skills
cultural mixing in both society and
schools can be a positive thing
migrants willing to work longer hours
and frequently for less pay
Migrants pay tax
Money earned by migrants often goes
back to country of origin
Demand for housing greater than
supply can cause resentment amongst
UK citizens when housing goes to
migrants
Some argue that migrants take jobs
that UK population could have done
Some work in the informal economy for
cash in hand and therefore do not
contribute to taxes
Positive impact on country of origin Negative impact on country of origin
Money sent back home from those Brain drain as young, educated

working abroad
Reduces pressure on jobs
Migrants develop new skills to bring
home
population are the most likely to leave
to improve their lives abroad
Lose people of working age
Males migrate causing social effects on
families
Large elderly population left behind
Case Study: Migration and the EU
Migration within the EU
(European Union)
Since Poland and other eastern
European countries joined the
EU in 2004 many people have
moved temporarily or
permanently to the UK
The UK received 600,000
Eastern European migrants
between 2004-2006
Poles earn on average 5 times
as much as they would at home.
Migration from outside the EU
Europe receives 2 million migrants per
year
European population is changing more in
structure because of migration than by
changes in birth and death rates
8.6% EU population is foreign born (USA:
10.3% and Australia: 25%)
Africa and Asia the major sources of
migration
UN (United Nations) predict immigration
into the EU will increase by 40% in 40
years
Not everyone happy with such influxes
but Europe needs workers due to falling
birth rate and the resulting lack of
workers
Often migrants can take jobs in highly
skilled temporary areas such as
teaching, nursing and high tech computer
jobs which are experiencing shortages
About 20% immigrants are graduates
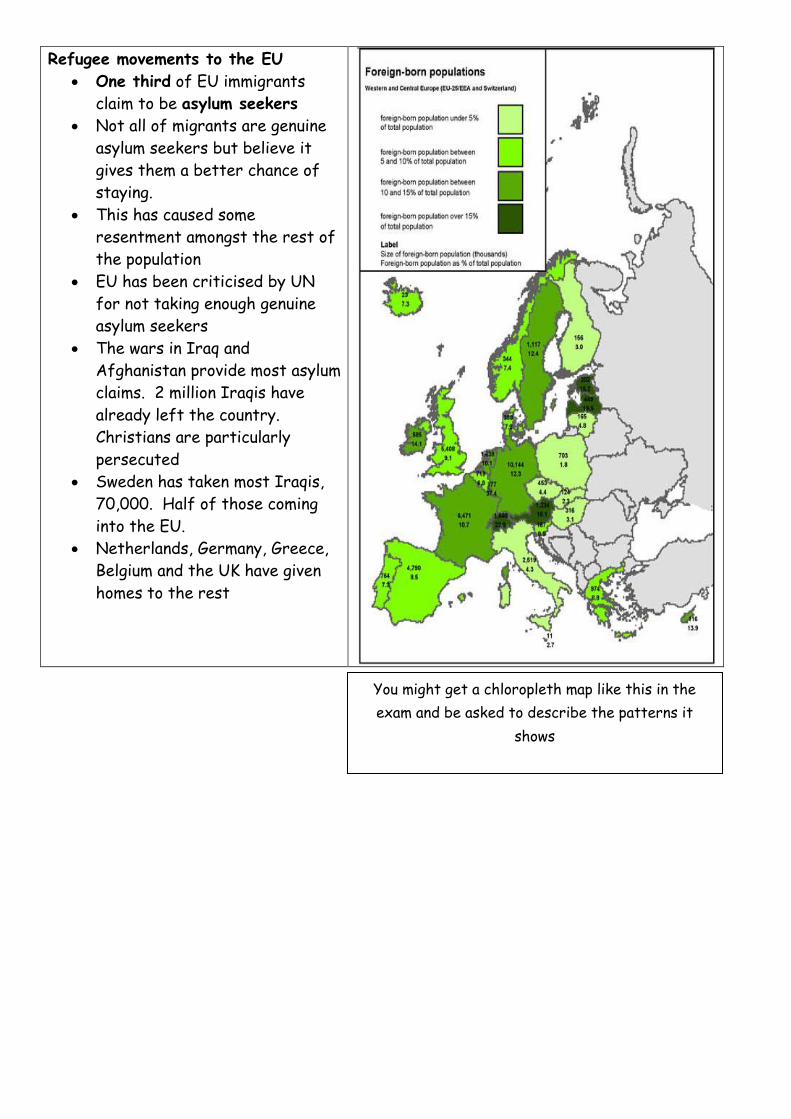
Refugee movements to the EU
One third of EU immigrants
claim to be asylum seekers
Not all of migrants are genuine
asylum seekers but believe it
gives them a better chance of
staying.
This has caused some
resentment amongst the rest of
the population
EU has been criticised by UN
for not taking enough genuine
asylum seekers
The wars in Iraq and
Afghanistan provide most asylum
claims. 2 million Iraqis have
already left the country.
Christians are particularly
persecuted
Sweden has taken most Iraqis,
70,000. Half of those coming
into the EU.
Netherlands, Germany, Greece,
Belgium and the UK have given
homes to the rest
You might get a chloropleth map like this in the
exam and be asked to describe the patterns it
shows