gdt 7 - georgia department of transportation 7 page 3 ww = wet weight of the compacted soil, in...
TRANSCRIPT
Page 1
GDT 7
A. Scope For a complete list of GDTs, see the Table of Contents.
Use this test method to determine the relation between moisture content and the theoretical or laboratory maximum dry
density. Measure the density in a 1/30 ft³ (0.000943, ± 0.000008 m³)(Reference ASTM D-698 Mold Volume Calibration)
mold compacted by a 5.5 lb (2.5 kg) rammer.
B. Apparatus The apparatus consists of the following:
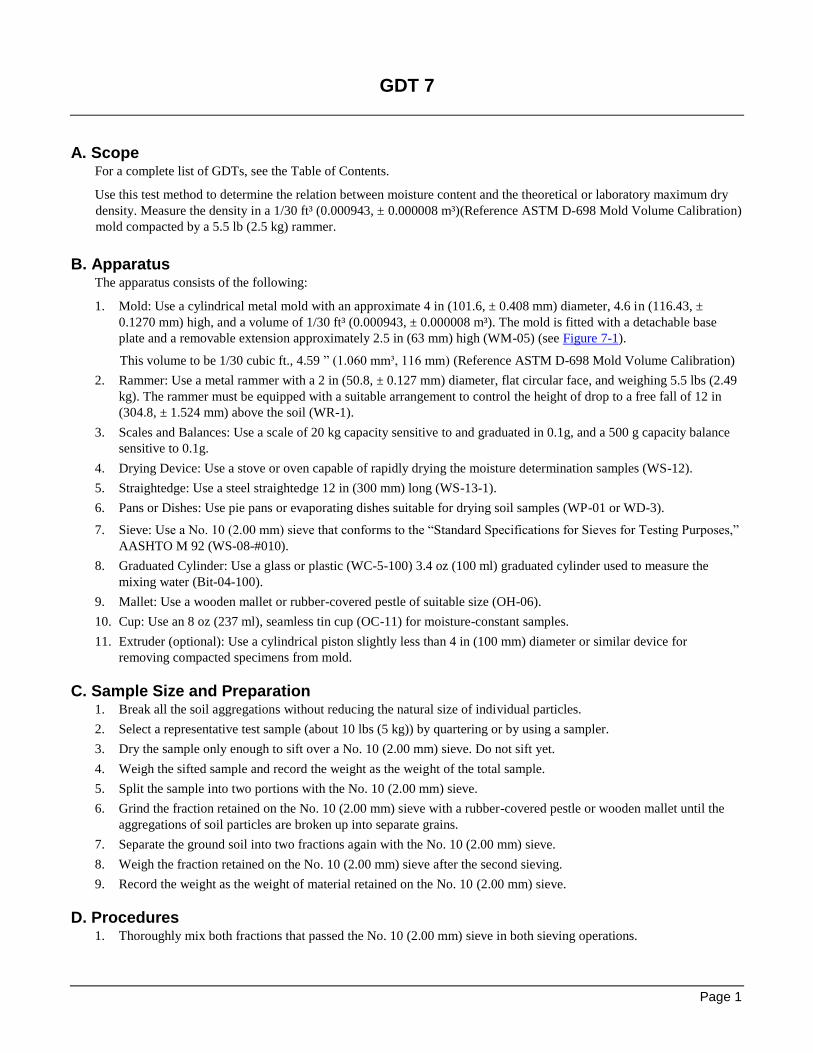
1. Mold: Use a cylindrical metal mold with an approximate 4 in (101.6, ± 0.408 mm) diameter, 4.6 in (116.43, ±
0.1270 mm) high, and a volume of 1/30 ft³ (0.000943, ± 0.000008 m³). The mold is fitted with a detachable base
plate and a removable extension approximately 2.5 in (63 mm) high (WM-05) (see Figure 7-1).
This volume to be 1/30 cubic ft., 4.59 ” (1.060 mm³, 116 mm) (Reference ASTM D-698 Mold Volume Calibration)
2. Rammer: Use a metal rammer with a 2 in (50.8, ± 0.127 mm) diameter, flat circular face, and weighing 5.5 lbs (2.49
kg). The rammer must be equipped with a suitable arrangement to control the height of drop to a free fall of 12 in
(304.8, ± 1.524 mm) above the soil (WR-1).
3. Scales and Balances: Use a scale of 20 kg capacity sensitive to and graduated in 0.1g, and a 500 g capacity balance
sensitive to 0.1g.
4. Drying Device: Use a stove or oven capable of rapidly drying the moisture determination samples (WS-12).
5. Straightedge: Use a steel straightedge 12 in (300 mm) long (WS-13-1).
6. Pans or Dishes: Use pie pans or evaporating dishes suitable for drying soil samples (WP-01 or WD-3).
7. Sieve: Use a No. 10 (2.00 mm) sieve that conforms to the “Standard Specifications for Sieves for Testing Purposes,”
AASHTO M 92 (WS-08-#010).
8. Graduated Cylinder: Use a glass or plastic (WC-5-100) 3.4 oz (100 ml) graduated cylinder used to measure the
mixing water (Bit-04-100).
9. Mallet: Use a wooden mallet or rubber-covered pestle of suitable size (OH-06).
10. Cup: Use an 8 oz (237 ml), seamless tin cup (OC-11) for moisture-constant samples.
11. Extruder (optional): Use a cylindrical piston slightly less than 4 in (100 mm) diameter or similar device for
removing compacted specimens from mold.
C. Sample Size and Preparation 1. Break all the soil aggregations without reducing the natural size of individual particles.
2. Select a representative test sample (about 10 lbs (5 kg)) by quartering or by using a sampler.
3. Dry the sample only enough to sift over a No. 10 (2.00 mm) sieve. Do not sift yet.
4. Weigh the sifted sample and record the weight as the weight of the total sample.
5. Split the sample into two portions with the No. 10 (2.00 mm) sieve.
6. Grind the fraction retained on the No. 10 (2.00 mm) sieve with a rubber-covered pestle or wooden mallet until the
aggregations of soil particles are broken up into separate grains.
7. Separate the ground soil into two fractions again with the No. 10 (2.00 mm) sieve.
8. Weigh the fraction retained on the No. 10 (2.00 mm) sieve after the second sieving.
9. Record the weight as the weight of material retained on the No. 10 (2.00 mm) sieve.
D. Procedures 1. Thoroughly mix both fractions that passed the No. 10 (2.00 mm) sieve in both sieving operations.
GDT 7
Page 2
2. Take a 6.6 lb (3000 g) sample from the minus No. 10 (2.00 mm) material by quartering or by using a sampler.
3. Attach the extension to the cylinder.
4. Compact the sample in the cylinder in three equal layers.
a. Compact each layer with 25 blows from the rammer dropped from 1 ft (304.8 mm) above the soil.
b. Rest the mold on a uniform, rigid foundation, such as a concrete block weighing at least 200 lbs (90 kg).
c. Uniformly distribute the blows over the surface of the compacted layer.
d. Remove the soil that adheres to the face of the rammer after every 25th blow.
5. After compacting, remove the extension and base plate.
6. Carefully level the compacted soil to the top and bottom of the cylinder with the straightedge.
7. Weigh the cylinder and sample together.
8. Calculate the wet weight of the compacted soil in pounds per cubic foot as follows:
Wet Weight of Compacted Soil (lbs/ft3) = (Ws-Wc)/453.6 or (Ws-Wc) * Mold Factor or (Ws-Wc) * C.F.C
V 453.6
V = Volume in lbs/ft3 of the Mold as calibrated Using (Reference ASTM D-698 Mold Volume Calibration)
Mold Factor = calculated 1/volume lbs/ft3
C.F.C = Corretion Factor Conversion = Mold Factor/453.6
Ws = weight of the compacted soil and mold, in grams
Wc = weight of the mold, in grams
If you weighed in grams, dividing by 453.6 converts grams to pounds. This will give you the wet weight in pounds
per cubic foot.
9. Remove the compacted soil from the cylinder and slice it vertically through its center.
10. Take a 100 g sample from the center and weigh it immediately.
11. Dry the sample to a constant weight.
12. Calculate the moisture content of the soil as follows:
13. Moisture (%) = A - B x 100
B
where:
A = weight of the wet soil
B = weight of the dry soil
14. Thoroughly pulverize the remaining material from the compacted sample.
15. Add enough water to increase the moisture content of the soil in predetermined increments (1 percent to 2 percent
for sandy soils, 2 percent to 3 percent for clay soils).
a. For a 5.94 lb (2.7 kg) sample, add 0.9 oz (27 ml) of water to increase the moisture content by 1 percent.
b. For a 6.6 lb (3000 g) sample, add 1 oz (30 ml) of water.
16. Repeat steps 1 through 13 again, taking a moisture sample after each determination.
17. Repeat the procedure until the soil becomes very wet and the wet weight of the compacted soil substantially
decreases.
E. Calculations 1. Calculate the density (dry weight), in pounds per cubic foot (kilograms per cubic meter), of the compacted soil as
follows:
English—Dry Density (lb/ft3) = Ww x 100
M + 100
where:
Ww = wet weight of the compacted soil, in pounds per cubic foot (Procedures, step D.8)
M = moisture content, in percent, at which the wet weight was determined (Procedures, step D.12)

GDT 7
Page 3
2. Moisture-Density Relationship
a. Calculate and record the percent moisture and density for each determination in the series.
b. When using the moisture-density relationship for compaction control:
1) Plot a moisture-density curve by plotting the densities against their respective moisture contents.
2) Draw a smooth curve through the resulting points.
3) The peak of the curve represents the maximum dry density of the material being tested, and the moisture
content at this point represents the optimum moisture content.
c. For classification purposes, interpret the maximum dry density as the highest density obtained in the test series,
and the optimum moisture as the moisture content at that respective density.
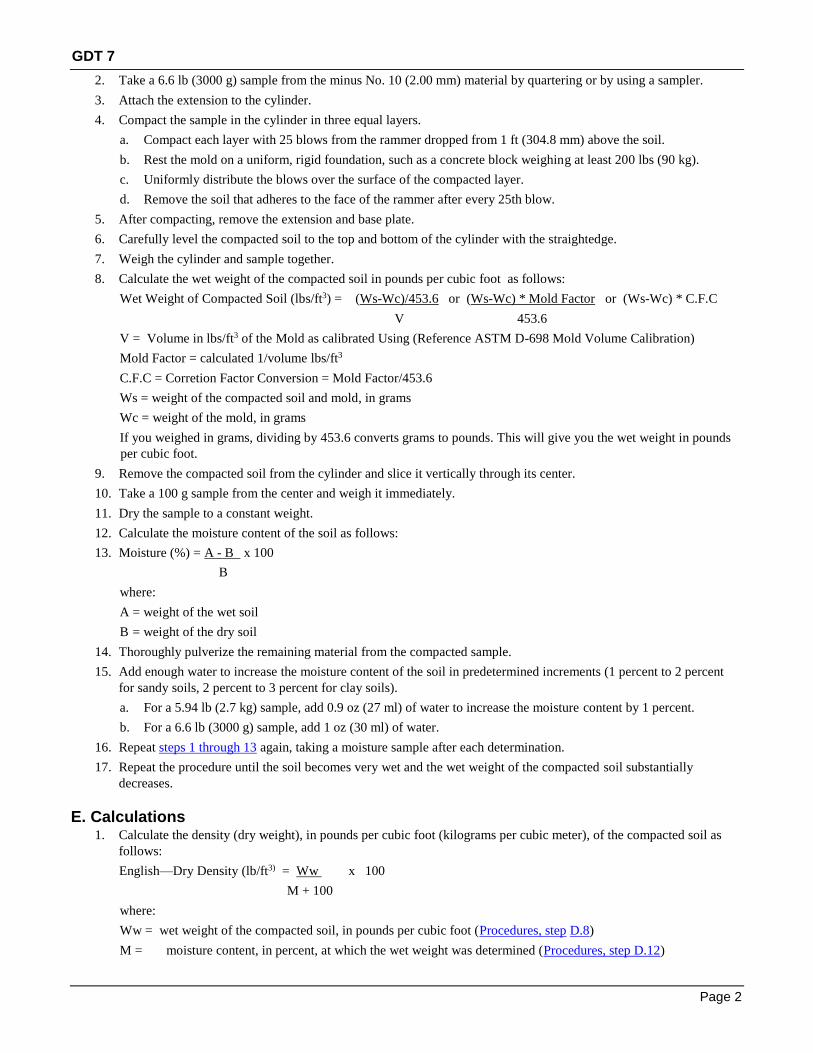
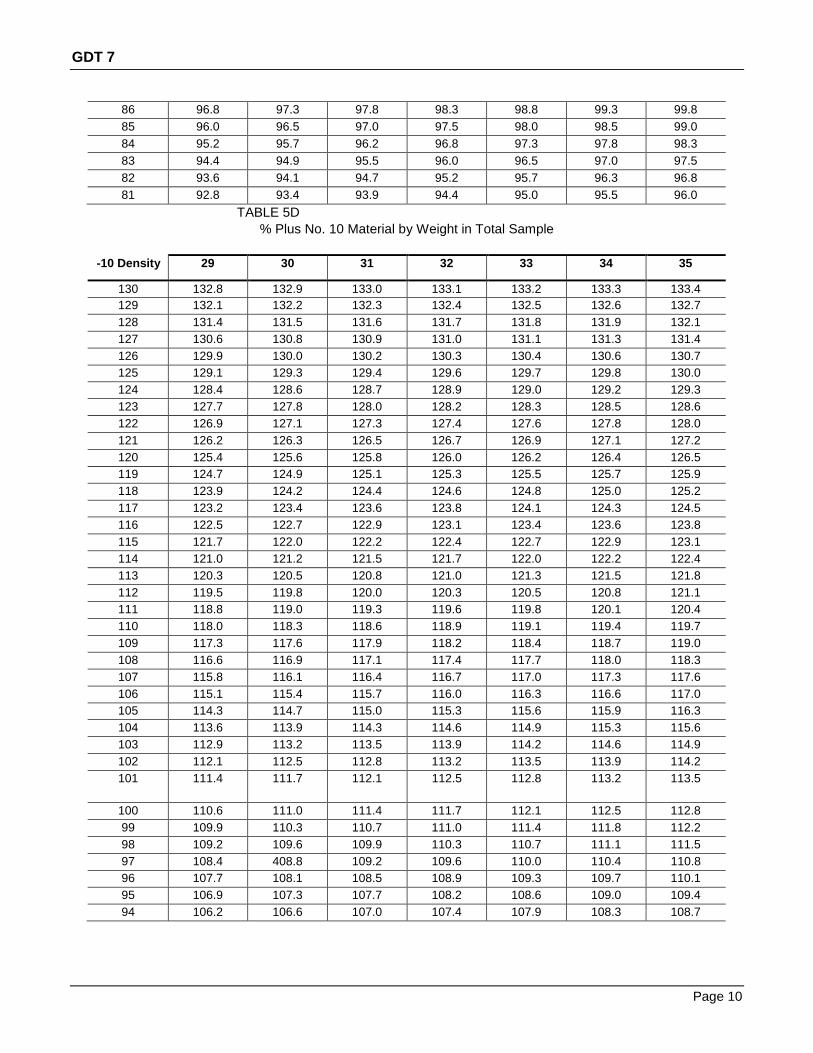
3. Correction for Plus No. 10 (2.00 mm) Material
a. If the soil contains material retained on the No. 10 (2.00 mm) sieve and the specifications show density
requirements on the total sample, you must correct the maximum dry density to reflect the percentage of Plus
No. 10 (2.00 mm) material.
b. When determining maximum densities for compaction control, always correct the densities for the percentage
of Plus No. 10 (2.00 mm) material.
c. Use the conversion factors for correcting the density in Tables 1D - 7D, below.
d. Use the conversion factors for correcting the moisture of Minus No. 10 (2.00 mm) for the Plus No. 10 (2.00
mm) 1n Tables 1M - 10M, below.
F. Report 1. Record the maximum dry density and the optimum moisture content of the material being tested as the theoretical or
laboratory maximum dry density on Form 495.
2. Send the completed original form to the Office of Materials and Research in Forest Park.
3. Send copies of the form to the Branch Lab and the Area Engineer.
4. Notify the department head of any material that fails.

GDT 7
Page 4
Figure 7-1
TABLE 1D—CORRECTION OF MINUS NO. 10 DENSITY FOR % PLUS NO. 10 IN
TOTAL SAMPLE

GDT 7
% Plus No. 10 Material by Weight in Total Sample
—CORRECTION OF MINUS NO. 10
DENSITY
FOR % PLUS NO. 10 IN TOTAL SAMPLE
Page 5
-10
Density
1 2 3 4 5 6 7
130 130.1 130.2 130.3 130.4 130.5 130.6 130.7
129 129.1
129.2 129.3 129.4 129.5 129.6 129.7
128 128.1 128.2 128.3 128.5 128.6 128.7 128.8
127 127.1 127.3 127.4 127.5 127.6 127.8 127.9
126 126.1 126.3 126.4 126.5 126.7 126.8 126.9
125 125.1 125.3 125.4 125.6 125.7 125.9 126.0
124 124.2 124.3 124.5 124.6 124.8 124.9 125.1
123 123.2 123.3 123.5 123.6 123.8 124.0 124.1
122 122.2 122.3 122.5 122.7 122.9 123.0 123.2
121 121.2 121.4 121.5 121.7 121.9 122.1 122.2
120 120.2 120.4 120.6 120.7 120.9 121.1 121.3
119 119.2 119.4 119.6 119.8 120.0 120.2 120.4
118 118.2 118.4 118.6 118.8 119.0 119.2 119.4
117 117.2 117.4 117.6 117.9 118.1 118.3 118.5
116 116.2 116.4 116.7 116.9 117.1 117.3 117.6
115 115.2 115.5 115.7 115.9 116.2 116.4 116.6
114 114.2 114.5 114.7 115.0 115.2 115.4 115.7
113 113.3 113.5 113.8 114.0 114.3 114.5 114.8
112 112.3 112.5 112.8 113.0 113.3 113.6 113.8
111 111.3 111.5 111.8 112.1 112.3 112.6 112.9
110 110.3 110.6 110.8 111.1 111.4 111.7 111.9
109 109.3 109.6 109.9 110.1 110.4 110.7 111.0
108 108.3 108.6 108.9 109.2 109.5 119.8 110.1
107 107.3 107.6 107.9 108.2 108.5 108.8 109.1
106 106.3 106.6 106.9 107.3 107.6 107.9 108.2
105 105.3 105.6 106.0 106.3 106.6 106.9 107.3
104 104.3 104.7 105.0 105.3 105.7 106.0 106.3
103 103.3 103.7 104.0 104.4 104.7 105.0 105.4
102 102.3 102.7 103.0 103.4 103.7 104.1 104.4
101 101.4 101.7 102.1 102.4 102.8 103.1 103.5
100 100.4 100.7 101.1 101.5 101.8 102.2 102.6
99 99.4 99.8 100.1 100.5 100.9 101.3 101.6
98 98.4 98.8 99.2 99.5 99.9 100.3 100.7
97 97.4 97.8 98.2 98.6 99.0 99.4 99.8
96 96.4 96.8 97.2 97.6 98.0 98.4 98.8
95 95.4 95.8 96.2 96.6 97.1 97.5 97.9
94 94.4 94.8 95.3 95.7 96.1 96.5 96.9
93 93.4 93.9 94.3 94.7 95.1 95.6 96.0
92 92.4 92.9 93.3 93.8 94.2 94.6 95.1
91 91.4 91.9 92.3 92.8 93.2 93.7 94.1
90 90.5 90.9 91.4 91.8 92.3 92.7 93.2
89 89.5 89.9 90.4 90.9 91.3 91.8 92.3
88 88.5 88.9 89.4 89.9 90.4 90.8 91.3
87 87.5 88.0 88.4 88.9 89.4 89.9 90.4
86 86.5 87.0 87.5 88.0 88.5 89.0 89.4

GDT 7
% Plus No. 10 Material by Weight in Total Sample
—CORRECTION OF MINUS NO. 10
DENSITY
FOR % PLUS NO. 10 IN TOTAL SAMPLE
Page 6
85 85.5 86.0 86.5 87.0 87.5 88.0 88.5
84 84.5 85.0 85.5 86.0 86.6 87.1 87.6
83 83.5 84.0 84.6 85.1 85.6 86.1 86.6
82 82.5 83.1 86.3 84.1 84.6 85.2 85.7
81 81.5 82.1 82.6 83.1 83.7 84.2 84.8
TABLE 2D
-10 Density 8 9 10 11 12 13 14
130 130.8 130.9 131.0 131.1 131.2 131.3 131.4
129 129.8 130.0 130.1 130.2 130.3 130.4 130.5
128 128.9 129.0 129.2 129.3 129.4 129.5 129.6
127 128.0 128.1 128.3 128.4 128.5 128.6 128.8
126 127.1 127.2 127.3 127.5 127.6 127.7 127.9
125 126.1 126.3 126.3 126.4 126.6 126.9 127.0
124 125.2 125.4 125.5 125.7 125.8 126.0 126.1
123 124.3 124.4 124.6 124.8 124.9 125.1 125.3
122 123.4 123.5 123.7 123.9 124.0 124.2 124.4
121 122.4 122.6 122.8 123.0 123.1 123.3 123.5
120 121.5 121.7 121.9 122.1 122.2 122.4 122.6
119 120.6 120.8 121.0 121.2 121.4 121.5 121.7
118 119.6 119.8 120.1 120.3 120.5 120.7 120.9
117 118.7 118.9 119.1 119.4 119.6 119.8 120.0
116 117.8 118.0 118.2 118.5 118.7 118.9 119.1
115 116.9 117.1 117.3 117.6 117.8 118.0 118.2
114 115.9 116.2 116.4 116.7 116.9 117.1 117.4
113 115.0 115.3 115.5 115.8 116.0 116.3 116.5
112 114.1 114.3 114.6 114.8 115.1 115.4 115.6
111 113.1 113.4 113.7 113.9 114.2 114.5 114.8
110 112.2 112.5 112.8 113.0 113.3 113.6 113.9
109 111.3 111.6 111.9 112.1 112.4 112.7 113.0
108 110.4 110.7 111.0 111.2 111.5 111.8 112.1
107 109.4 109.7 110.0 110.3 110.6 111.0 111.3
106 108.5 1.8.8 109.1 109.4 409.8 110.1 110.4
105 107.6 107.9 108.2 108.5 108.9 109.2 109.5
104 106.6 107.0 107.3 107.6 108.0 108.3 108.6
103 105.7 106.1 106.4 106.7 107.1 107.4 107.8
102 104.8 105.1 105.5 105.8 106.2 106.5 106.9
101 103.9 104.2 104.6 104.9 105.3 105.7 106.0
100 102.9 103.3 103.7 104.0 104.4 104.8 105.1
99 102.0 102.4 102.8 103.1 103.5 103.9 104.3
98 101.1 101.5 101.9 102.2 102.6 103.0 103.4
97 100.2 100.5 100.9 101.3 101.7 102.1 102.5
96 99.2 99.6 100.0 100.4 100.8 101.2 101.6
95 98.3 98.7 99.1 99.5 99.9 100.3 100.8
94 97.4 97.8 98.2 98.6 99.0 99.5 99.9
93 96.4 96.9 97.3 97.7 98.1 98.6 99.0
92 95.5 95.9 96.4 96.8 97.3 97.7 98.1

GDT 7
% Plus No. 10 Material by Weight in Total Sample
—CORRECTION OF MINUS NO. 10
DENSITY
FOR % PLUS NO. 10 IN TOTAL SAMPLE
Page 7
91 94.6 95.0 7.397.798.195.5
95.9 96.4 96.8 97.3
90 93.6 94.1 94.6 95.0 95.5 95.9 96.4
89 92.7 93.2 93.7 94.1 94.6 95.0 95.5
88 91.8 92.3 92.7 93.2 93.7 94.2 94.6
87 90.9 91.3 91.8 92.3 92.8 93.3 93.8
86 89.9 90.4 90.9 91.4 91.9 92.4 92.9
85 89.0 89.5 90.0 90.5 91.0 91.5 92.0
84 88.1 88.6 89.1 89.6 90.1 90.6 91.1
83 87.2 87.7 88.2 88.7 89.2 89.7 90.3
82 86.2 86.8 87.3 87.8 88.3 88.9 89.4
81 85.3 85.8 86.4 89.9 87.4 88.0 88.5
TABLE 3D
-10 Density 15 16 17 18 19 20 21
130 131.5 131.6 131.7 131.8 131.9 132.0 132.1
129 130.6 130.7 130.8 130.9 131.0 131.1 131.2
128 129.7 129.9 130.0 130.1 130.2 130.3 130.4
127 128.9 129.0 129.1 129.3 129.4 129.5 129.6
126 128.0 128.1 128.3 128.4 128.5 128.7 128.8
125 127.1 127.3 127.4 127.6 127.7 127.9 128.0
124 126.3 126.4 126.6 126.7 126.9 127.0 127.2
123 125.4 125.6 125.7 125.9 126.1 126.2 126.4
122 124.6 124.7 124.9 125.1 125.2 125.4 125.6
121 123.7 123.8 124.0 124.2 124.4 124.6 124.7
120 122.8 123.0 123.2 123.4 123.6 123.7 123.9
119 121.9 122.1 122.3 122.5 122.7 122.9 123.1
118 121.1 121.3 121.5 121.7 121.9 122.1 122.3
117 120.2 120.4 120.6 120.9 121.1 121.3 121.5
116 119.3 119.6 119.8 120.0 120.2 120.5 120.7
115 118.5 118.7 118.9 119.2 119.4 119.6 119.9
114 117.6 117.9 118.1 118.3 118.6 118.8 119.1
113 116.8 117.0 117.3 117.5 117.8 118.0 118.3
112 115.9 116.1 116.4 116.7 116.9 117.2 117.4
111 115.0 115.3 115.6 115.8 116.1 116.4 116.6
110 114.2 114.4 114.7 115.0 115.3 115.5 115.8
109 113.3 113.6 113.9 114.1 114.4 114.7 115.0
108 112.4 112.7 113.0 113.3 113.6 113.9 114.2
107 111.6 111.9 112.2 112.5 112.8 113.1 113.4
106 110.7 111.0 111.3 111.6 111.9 112.3 112.6
105 109.8 110.2 110.5 110.8 111.1 111.4 111.8
104 109.0 109.3 109.6 110.0 110.3 110.6 111.0
103 108.1 108.4 108.8 109.1 109.5 109.8 110.0
102 107.2 107.6 107.9 108.3 108.6 109.0 109.3
101 106.4 106.7 107.1 107.4 407.8 108.2 108.5
100 105.5 105.9 106.2 106.6 107.0 107.3 107.7
99 104.6 105.0 105.4 105.8 106.1 106.5 106.9

GDT 7
% Plus No. 10 Material by Weight in Total Sample
—CORRECTION OF MINUS NO. 10
DENSITY
FOR % PLUS NO. 10 IN TOTAL SAMPLE
Page 8
98 103.8 104.2 104.5 104.9 105.3 105.7 106.1
97 102.9 103.3 103.7 104.1 104.5 104.9 105.3
96 102.0 102.4 102.8 103.2 103.6 104.0 104.4
95 101.2 101.6 102.0 102.4 102.8 103.2 103.6
94 100.3 100.7 101.1 101.6 102.0 102.4 102.8
93 99.4 99.9 100.3 100.7 101.2 101.6 102.0
92 98.6 99.0 99.4 99.9 100.3 100.8 101.2
91 97.7 98.2 98.6 99.0 99.5 99.9 100.4
90 96.8 97.3 97.8 98.2 98.7 99.1 99.6
89 96.0 96.4 96.9 97.4 97.8 98.3 98.8
88 95.1 95.6 96.1 96.5 97.0 97.5 98.0
87 94.2 94.7 95.2 95.7 96.2 96.7 97.1
86 93.4 93.9 94.4 94.9 95.3 95.8 96.3
85 92.5 93.0 93.5 94.0 94.5 95.0 95.5
84 91.7 92.2 92.7 93.2 93.7 94.2 94.7
83 90.8 91.3 91.8 92.3 90.9 93.4 93.9
82 89.9 90.4 91.0 91.5 92.0 92.6 93.1
81 89.1 89.6 90.1 90.7 91.2 91.7 92.3
TABLE 4D

GDT 7
—CORRECTION OF MINUS NO. 10
DENSITY
FOR % PLUS NO. 10 IN TOTAL SAMPLE
Page 9
% Plus No. 10 Material by Weight in Total Sample
-10 Density 22 23 24 25 26 27 28
130 132.2 132.3 132.4 132.5 132.5 132.6 132.7
129 131.4 131.5 131.6 131.7 131.8 131.9 132.0
128 130.6 130.7 130.8 130.9 131.0 131.1 131.2
127 129.8 129.9 130.0 130.1 130.3 130.4 130.5
126 128.9 129.1 129.2 129.4 129.5 129.6 129.8
125 128.1 128.3 128.4 128.6 128.7 128.9 129.0
124 127.3 127.5 127.6 127.8 128.0 128.1 128.3
123 126.5 126.7 126.9 127.0 127.2 127.3 127.5
122 125.7 125.9 126.1 126.3 126.4 126.6 126.8
121 124.9 125.1 125.3 125.5 125.6 125.8 126.0
120 124.1 124.3 124.5 124.7 124.9 125.0 125.0
119 123.3 123.5 123.7 123.9 124.1 124.3 124.5
118 122.5 122.7 122.9 123.1 123.3 123.5 123.7
117 121.7 121.9 122.1 122.4 122.6 122.8 123.0
116 120.9 121.1 121.4 121.6 121.8 122.0 122.2
115 120.1 120.3 120.6 120.8 121.0 121.3 121.5
114 119.3 119.5 119.8 120.0 120.3 120.5 120.7
113 118.5 118.8 119.0 119.3 119.5 119.8 120.0
112 117.7 118.0 118.2 118.5 118.7 119.0 119.3
111 116.9 117.2 117.4 117.7 118.0 118.2 118.5
110 116.1 116.4 116.6 116.9 117.2 117.5 117.8
109 115.3 115.6 115.9 116.2 116.4 116.7 117.0
108 114.5 114.8 115.1 115.4 115.7 116.0 116.3
107 113.7 114.0 114.3 114.6 114.9 115.2 115.5
106 112.9 113.2 113.5 113.8 114.1 114.5 114.8
105 112.1 112.4 112.7 113.1 113.4 113.7 114.0
104 111.3 111.6 111.9 112.3 112.6 112.9 113.3
103 110.5 110.8 111.2 111.5 111.8 112.2 112.5
102 109.7 110.0 110.4 110.7 111.1 111.4 111.8
101 108.9 109.2 109.6 110.0 110.3 110.7 111.0
100 108.1 108.4 108.8 109.2 109.5 109.9 110.3
99 107.3 107.6 108.0 108.4 408.8 109.2 109.5
98 106.5 106.9 107.2 107.6 108.0 108.4 108.8
97 105.7 106.1 106.5 106.9 107.2 107.6 108.0
96 104.8 105.2 105.6 106.1 106.5 106.9 107.3
95 104.0 104.5 104.9 105.3 105.7 106.1 106.5
94 103.2 103.7 104.1 104.5 104.9 105.3 105.8
93 102.4 102.9 103.3 103.7 104.2 104.6 105.0
92 101.6 102.1 102.5 103.0 103.4 103.8 104.3
91 100.8 101.3 101.7 102.2 102.6 103.1 103.5
90 100.0 100.5 100.9 101.4 101.9 102.3 102.8
89 99.2 99.7 100.2 100.6 101.1 101.6 102.0
88 98.4 98.9 99.4 99.9 100.3 100.8 101.3
87 97.6 98.1 98.6 99.1 99.6 100.0 100.5
GDT 7
Page 10
86 96.8 97.3 97.8 98.3 98.8 99.3 99.8
85 96.0 96.5 97.0 97.5 98.0 98.5 99.0
84 95.2 95.7 96.2 96.8 97.3 97.8 98.3
83 94.4 94.9 95.5 96.0 96.5 97.0 97.5
82 93.6 94.1 94.7 95.2 95.7 96.3 96.8
81 92.8 93.4 93.9 94.4 95.0 95.5 96.0
TABLE 5D
% Plus No. 10 Material by Weight in Total Sample
-10 Density 29 30 31 32 33 34 35
130 132.8 132.9 133.0 133.1 133.2 133.3 133.4
129 132.1 132.2 132.3 132.4 132.5 132.6 132.7
128 131.4 131.5 131.6 131.7 131.8 131.9 132.1
127 130.6 130.8 130.9 131.0 131.1 131.3 131.4
126 129.9 130.0 130.2 130.3 130.4 130.6 130.7
125 129.1 129.3 129.4 129.6 129.7 129.8 130.0
124 128.4 128.6 128.7 128.9 129.0 129.2 129.3
123 127.7 127.8 128.0 128.2 128.3 128.5 128.6
122 126.9 127.1 127.3 127.4 127.6 127.8 128.0
121 126.2 126.3 126.5 126.7 126.9 127.1 127.2
120 125.4 125.6 125.8 126.0 126.2 126.4 126.5
119 124.7 124.9 125.1 125.3 125.5 125.7 125.9
118 123.9 124.2 124.4 124.6 124.8 125.0 125.2
117 123.2 123.4 123.6 123.8 124.1 124.3 124.5
116 122.5 122.7 122.9 123.1 123.4 123.6 123.8
115 121.7 122.0 122.2 122.4 122.7 122.9 123.1
114 121.0 121.2 121.5 121.7 122.0 122.2 122.4
113 120.3 120.5 120.8 121.0 121.3 121.5 121.8
112 119.5 119.8 120.0 120.3 120.5 120.8 121.1
111 118.8 119.0 119.3 119.6 119.8 120.1 120.4
110 118.0 118.3 118.6 118.9 119.1 119.4 119.7
109 117.3 117.6 117.9 118.2 118.4 118.7 119.0
108 116.6 116.9 117.1 117.4 117.7 118.0 118.3
107 115.8 116.1 116.4 116.7 117.0 117.3 117.6
106 115.1 115.4 115.7 116.0 116.3 116.6 117.0
105 114.3 114.7 115.0 115.3 115.6 115.9 116.3
104 113.6 113.9 114.3 114.6 114.9 115.3 115.6
103 112.9 113.2 113.5 113.9 114.2 114.6 114.9
102 112.1 112.5 112.8 113.2 113.5 113.9 114.2
101 111.4 111.7 112.1 112.5
112.8 113.2 113.5
100 110.6 111.0 111.4 111.7 112.1 112.5 112.8
99 109.9 110.3 110.7 111.0 111.4 111.8 112.2
98 109.2 109.6 109.9 110.3 110.7 111.1 111.5
97 108.4 408.8 109.2 109.6 110.0 110.4 110.8
96 107.7 108.1 108.5 108.9 109.3 109.7 110.1
95 106.9 107.3 107.7 108.2 108.6 109.0 109.4
94 106.2 106.6 107.0 107.4 107.9 108.3 108.7

GDT 7
Page 11
93 105.4 105.9 106.3 106.7 107.2 107.6 108.0
92 104.7 105.1 105.6 106.0 106.5 106.9 107.3
91 104.0 104.4 104.9 105.3 105.8 106.2 106.6
90 103.2 103.7 104.1 104.6 105.0 105.5 106.0
89 102.5 103.0 103.4 103.9 104.3 104.8 105.3
88 101.7 102.2 102.7 103.2 103.6 104.1 104.6
87 101.0 101.5 102.0 102.5 102.9 103.4 103.9
86 100.3 100.8 101.3 101.7 102.2 102.7 103.2
85 99.5 100.0 100.5 101.0 101.5 102.0 102.5
84 98.8 99.3 99.8 100.3 100.8 101.3 101.9
83 98.1 98.6 99.1 99.6 100.1 100.6 101.2
82 97.3 97.8 98.4 98.9 99.4 100.0 100.5
81 96.6 97.1 97.6 98.2 98.7 99.3 99.8
TABLE 6D—CORRECTION OF MINUS NO. 10
DENSITY
FOR % PLUS NO. 10 IN TOTAL SAMPLE
% Plus No. 10 Material by Weight in Total Sample
-10 Density 36 37 38 39 40 41 42
130 133.5 133.6 133.7 133.8 133.9 134.0 134.1
129 132.9 133.0 133.1 133.2 133.3 133.4 133.5
128 132.2 132.3 132.4 132.5 132.6 132.8 132.9
127 131.5 131.6 131.8 131.9 132.0 132.1 132.3
126 130.8 131.0 131.1 131.2 131.4 131.5 131.6
125 130.1 130.3 130.4 130.6 130.731.4 130.9 131.0
124 129.5 129.6 129.8 121.93 130.1 130.2 130.4
123 128.8 129.0 129.1 129.3 129.4 129.6 129.8
122 128.1 128.3 128.5 128.6 128.8 129.0 129.1
121 127.4 127.6 127.8 127.9 128.1 128.3 128.5
120 126.7 126.9 127.1 127.3 127.5 127.7 127.9
119 126.1 126.3 126.4 126.6 126.8 127.0 127.2
118 125.4 125.6 125.8 126.0 126.2 126.4 126.6
117 124.7 124.9 125.1 125.3 125.6 125.8 126.0
116 124.0 124.3 124.5 124.7 124.9 125.1 125.4
115 123.4 123.6 123.8 124.0 124.3 124.5 124.7
114 122.7 122.9 123.2 123.4 123.6 123.9 124.1
113 122.0 122.3 122.5 122.8 123.0 123.3 123.5
112 121.3 121.6 121.8 122.1 122.4 122.6 122.9
111 120.6 120.9 121.2 121.5 121.7 122.0 122.3
110 120.0 120.2 120.5 120.8 121.1 121.4 121.6
109 119.3 119.6 119.9 120.2 120.4 120.7 121.0
108 118.6 118.9 119.2 119.5 119.8 120.1 120.4
107 117.9 118.2 118.6 118.9 119.2 119.5 119.8
106 117.3 117.6 117.9 118.2 118.5 118.8 119.1
105 116.6 116.9 117.2 117.6 117.9 118.2 118.5
104 115.9 116.2 116.6 116.9 117.2 117.6 117.9
103 115.2 115.6 115.9 116.3 116.6 116.9 117.3
102 114.6 114.9 115.3 115.6 116.0 116.3 116.7
101 113.9 114.2 114.6 115.0 115.3 115.7 116.0

GDT 7
Page 12
100 113.2 113.6 113.9 114.3 114.7 115.0 115.4
99 112.5 112.9 113.3 113.7 114.0 114.4 114.8
98 111.9 112.2 112.6 113.0 113.4 113.8 114.2
97 111.2 111.6 112.0 112.4 112.8 113.2 113.5
96 110.5 110.9 111.3 111.7 112.1 112.5 112.9
95 109.8 110.2 110.6 111.0 111.4 111.9 112.3
94 109.1 109.5 110.0 110.4 110.8 111.2 111.6
93 108.4 108.9 109.3 109.7 110.2 110.6 111.0
92 107.8 108.2 108.6 109.1 109.5 110.0 110.4
91 107.1 107.5 108.0 108.4 408.9 109.3 109.8
90 106.4 106.9 107.3 107.8 108.2 108.7 109.2
89 105.7 106.2 106.7 107.1 107.6 108.1 108.5
88 105.1 105.5 106.0 106.5 107.0 107.4 107.9
87 104.4 104.9 105.4 405.8 106.3 106.8 107.3
86 103.7 104.2 104.7 105.2 105.7 106.2 106.7
85 103.0 103.5 104.0 104.5 105.0 105.5 106.0
84 102.4 102.9 103.4 103.9 104.4 104.9 105.4
83 101.7 102.2 102.7 103.2 103.8 104.3 104.8
82 101.0 101.5 102.1 102.6 103.1 103.6 104.2
81 100.3 100.9 101.4 101.9 102.5 103.0 103.6
TABLE 7D—CORRECTION OF MINUS NO. 10
DENSITY
FOR % PLUS NO. 10 IN TOTAL SAMPLE

GDT 7
Page 13
% Plus No. 10 Material by Weight in Total Sample
-10 Density 43 44 45
130 134.2 134.3 134.4
129 133.6 133.7 133.8
128 133.0 133.1 133.2
127 132.4 132.5 132.6
126 131.8 131.9 132.0
125 131.1 131.3 131.4
124 130.5 130.7 103.8
123 129.9 130.1 130.2
122 129.3 129.5 129.7
121 128.7 128.8 139.0
120 128.0 128.2 128.8
119 127.4 127.6 127.8
118 126.8 127.0 127.2
117 126.2 126.4 126.6
116 125.6 125.8 126.0
115 125.0 125.2 125.4
114 124.4 124.6 124.8
113 123.8 124.0 124.3
112 123.1 123.4 123.7
111 122.5 122.8 123.1
110 121.9 122.2 122.5
109 121.3 121.6 121.9
108 120.7 121.0 121.3
107 120.1 120.4 120.7
106 119.5 119.8 120.1
105 118.8 119.2 119.5
104 118.2 118.6 118.9
103 117.6 118.0 118.3
102 117.0 117.4 117.7
101 116.4 116.8 117.1
100 115.8 116.1 116.5
99 115.2 115.5 115.9
98 114.6 114.9 115.3
97 113.9 114.3 114.7
96 113.3 113.7 114.1
95 112.7 113.1 113.5
94 112.1 112.5 112.9
93 111.4 111.9 112.3
92 110.8 111.3 111.7
91 110.2 110.7 111.1

GDT 7
Page 14
90 109.7 110.1 110.5
89 109.0 109.5 109.9
88 108.4 108.9 109.3
87 107.8 108.3 108.7
86 107.2 107.6 108.1
85 106.5 107.0 107.5
84 105.9 106.4 107.0
83 105.3 105.8 106.4
82 104.7 105.2 105.8
81 104.1 104.6 105.2

GDT 7
Page 15
TABLE 1M—MOISTURE CORRECTION OF MINUS NO. 10 FOR % PLUS No. 10
(FOR + 10 ABSORPTION OF 1%)
% Plus No. 10 Material by Weight in Total Sample
-10 Moisture 5 10 15 20 25
40 38.1 36.1 34.2 32.2 30.3
39 37.1 35.2 33.3 31.4 29.5
38 36.2 34.3 32.5 30.6 28.8
37 35.2 33.4 31.6 29.8 28.0
36 34.3 32.5 30.8 29.0 27.3
35 33.3 31.6 29.9 28.2 26.5
34 32.4 30.7 29.1 27.4 25.8
33 31.4 29.8 28.2 26.6 25.0
32 30.5 28.9 27.4 25.8 24.3
31 29.5 28.0 26.5 25.0 23.5
30 28.6 27.1 25.7 24.2 22.8
29 27.6 26.2 24.8 23.4 22.0
28 26.7 25.3 23.9 22.6 21.3
27 25.7 24.2 23.1 21.8 20.5
26 24.8 23.5 22.3 21.0 19.8
25 23.8 22.6 21.4 20.2 19.0
24 22.9 21.7 20.6 19.4 18.3
23 21.9 20.8 19.7 18.6 17.5
22 21.0 19.9 18.9 17.8 16.8
21 20.0 19.0 18.0 17.0 16.0
20 19.1 18.1 17.2 16.2 15.3
19 18.1 17.2 16.3 15.4 14.5
18 17.2 16.3 15.5 14.6 13.8
17 16.2 15.4 14.6 13.8 13.0
16 15.3 14.6 13.8 13.0 12.3
15 14.3 13.6 12.9 12.2 11.5
14 13.4 12.7 12.1 11.4 10.8
13 12.4 11.8 11.2 10.6 10.0
12 11.5 11.0 10.4 9.8 9.3

GDT 7
Page 16
11 10.5 10.0 9.5 9.0 8.5
10 9.6 9.1 8.7 8.2 7.8
9 8.6 8.2 7.8 7.4 7.0
8 7.7 7.3 7.0 6.6 6.3
7 6.7 6.4 6.1 5.8 5.5
6 5.8 5.5 5.3 5.0 4.8
5 4.8 4.6 4.4 4.2 4.0
4 3.9 3.7 3.6 3.4 3.3
3 2.9 2.8 2.7 2.6 2.5
2 2.0 1.9 1.9 1.8 1.8
TABLE 2M—MOISTURE CORRECTION OF MINUS NO. 10 FOR % PLUS No. 10
(FOR + 10 ABSORPTION OF 1%)
% Plus No. 10 Material by Weight in Total Sample
-10 Moisture 30 35 40 45
40 28.3 26.4 24.4 22.5
39 27.6 25.7 23.8 21.9
38 26.9 25.1 23.2 21.4
37 26.2 24.4 22.6 20.8
36 25.5 23.8 22.0 20.3
35 24.8 23.1 21.4 19.7
34 24.1 22.5 20.8 19.2
33 23.4 21.8 20.2 18.6
32 22.7 21.2 19.6 18.1
31 22.0 20.5 19.0 17.5
30 21.3 19.9 18.4 17.0
29 20.6 19.2 17.8 16.4
28 19.9 18.6 17.2 15.9
27 19.2 17.9 16.6 15.3
26 18.5 17.3 16.0 14.8
25 17.8 16.6 15.4 14.2
24 17.1 16.0 14.8 13.7
23 16.4 15.3 14.2 13.1
22 15.7 14.7 13.6 12.6
21 15.0 14.0 13.0 12.0
20 14.3 13.4 12.4 11.5
19 13.6 12.7 11.8 10.9
18 12.9 12.1 11.2 10.4
17 12.2 11.4 10.6 9.8
16 11.5 10.8 10.0 9.3
15 10.8 10.1 9.4 8.7
14 10.1 9.5 8.8 8.2
13 9.4 8.8 8.2 7.6
12 8.7 8.2 7.6 7.1
11 8.0 7.5 7.0 6.5
10 7.3 6.9 6.4 6.0
9 6.6 6.2 5.8 5.4

GDT 7
Page 17
8 5.9 5.6 5.2 4.9
7 5.2 4.9 4.6 4.3
6 4.5 4.3 4.0 3.8
5 3.8 3.6 3.4 3.3
4 3.1 3.0 2.8 2.7
3 2.4 2.3 2.2 2.1
2 1.7 1.7 1.6 1.6
TABLE 3M—MOISTURE CORRECTION OF MINUS NO. 10 FOR % PLUS No. 10
(FOR + 10 ABSORPTION OF 2%)
% Plus No. 10 Material by Weight in
Total Sample
-10 Moisture 5 10 15 20 25
40 38.1 36.2 34.3 32.4 30.5
39 37.2 35.3 33.5 31.6 29.8
38 36.2 34.4 32.6 30.8 29.0
37 35.3 33.5 31.8 30.0 28.3
36 34.3 32.6 30.9 29.2 27.5
35 33.4 31.7 30.1 28.4 26.8
34 32.4 30.8 29.2 27.6 26.0
33 31.5 29.9 28.4 26.8 25.3
32 30.5 29.0 27.5 26.0 24.5
31 29.6 28.1 26.7 25.2 23.8
30 28.6 27.2 25.8 24.4 23.0
29 27.7 26.3 25.0 23.6 22.3
28 26.7 25.4 24.1 22.8 21.5
27 25.8 24.5 23.3 22.0 20.8
26 24.8 23.6 22.4 21.2 20.0
25 23.9 22.7 21.6 20.4 19.3
24 22.9 21.8 20.7 19.6 18.5
23 22.0 20.9 19.9 18.8 17.8
22 21.0 20.0 19.0 18.0 17.0
21 20.1 19.1 18.2 17.2 16.3
20 19.1 18.2 17.3 16.4 15.5
19 18.2 17.3 16.5 15.6 14.8
18 17.2 16.4 15.6 14.8 14.0
17 16.3 15.5 14.8 14.0 13.3
16 15.3 14.6 13.9 13.2 12.5
15 14.4 13.7 13.1 12.4 11.8

GDT 7
Page 18
14 13.4 12.8 12.2 11.6 11.0
13 12.5 11.9 11.4 10.8 10.3
12 11.5 11.0 10.5 10.0 9.5
11 10.6 10.1 9.7 9.2 8.8
10 9.6 9.2 8.8 8.5 8.0
9 8.7 8.3 8.0 7.6 7.3
8 7.7 7.4 7.1 6.8 6.5
7 6.8 6.5 6.3 6.0 5.8
6 5.8 5.6 5.4 5.2 5.0
5 4.9 4.7 4.6 4.4 4.3
4 3.9 3.8 3.7 3.6 3.5
3 3.0 2.9 2.9 2.8 2.8
2 2.0 2.0 2.0 2.0 2.0
TABLE 4M—MOISTURE CORRECTION OF MINUS NO. 10 FOR % PLUS No. 10
(FOR + 10 ABSORPTION OF 2%)
% Plus No. 10 Material by Weight in Total Sample
-10 Moisture 30 35 40 45
40 28.6 26.7 24.8 22.9
39 27.9 26.1 24.2 22.4
38 27.2 25.4 23.6 21.8
37 26.5 24.8 23.0 21.3
36 25.8 24.1 22.4 20.7
35 25.1 23.5 21.8 20.2
34 24.4 22.8 21.2 19.6
33 23.7 22.2 20.6 19.1
32 23.0 21.5 20.0 18.5
31 22.3 20.9 19.4 18.0
30 21.6 20.2 18.8 17.4
29 20.9 19.6 18.2 16.9
28 20.2 18.9 17.6 16.3
27 19.5 18.3 17.0 15.8
26 18.8 17.6 16.4 15.2
25 18.1 17.0 15.8 14.7
24 17.4 16.3 15.2 14.1
23 16.7 15.7 14.6 13.6
22 16.0 15.0 14.0 13.0
21 15.3 14.4 13.4 12.5
20 14.6 13.7 12.8 11.9
19 13.9 13.1 12.2 11.4
18 13.2 12.4 11.6 10.8

GDT 7
Page 19
17 12.5 11.8 11.0 10.3
16 11.8 11.1 10.4 9.7
15 11.1 10.5 9.8 9.2
14 10.4 9.8 9.2 8.6
13 9.7 9.2 8.6 8.1
12 9.0 8.5 8.0 7.5
11 8.3 7.9 7.4 7.0
10 7.6 7.2 6.8 6.4
9 6.9 6.6 6.2 5.9
8 6.2 5.9 5.6 5.3
7 5.5 5.3 5.0 4.8
6 4.8 4.6 4.4 4.2
5 4.1 4.0 3.8 3.7
4 3.4 3.3 3.2 3.1
3 2.7 2.7 2.6 2.6
2 2.0 2.0 2.0 2.0
TABLE 5M—MOISTURE CORRECTION OF MINUS NO. 10 FOR % PLUS No. 10
(FOR + 10 ABSORPTION OF 3%)
% Plus No. 10 Material by Weight in Total Sample
-10 Moisture 5 10 15 20 25
40 38.2 36.3 34.5 32.6 30.8
39 37.2 35.4 33.6 31.8 30.0
38 36.3 34.5 32.8 31.0 29.3
37 35.3 33.6 31.9 30.2 28.5
36 34.4 32.7 31.1 29.4 27.8
35 33.4 31.8 30.2 28.6 27.0
34 32.5 30.9 29.4 27.8 26.3
33 31.5 30.0 28.5 27.0 25.5
32 30.6 29.1 27.7 26.2 24.8
31 29.6 28.2 26.8 25.4 24.0
30 28.7 27.3 26.0 24.6 23.3
29 27.7 26.4 25.1 23.8 22.5
28 26.8 25.5 24.3 23.0 21.8
27 25.8 24.6 23.4 22.2 21.0
26 24.9 23.7 22.6 21.4 20.3
25 23.9 22.8 21.7 20.6 19.5
24 23.0 21.9 20.9 19.8 18.8
23 22.0 21.0 20.0 19.0 18.0

GDT 7
Page 20
22 21.1 20.1 19.2 18.2 17.3
21 20.1 19.2 18.3 17.4 16.5
20 19.2 18.3 17.5 16.6 15.8
19 18.2 17.4 16.6 15.8 15.0
18 17.3 16.5 15.8 15.0 14.3
17 16.3 15.6 14.9 14.2 13.5
16 15.4 14.7 14.1 13.4 12.8
15 14.4 13.8 13.2 12.6 12.0
14 13.5 12.9 12.4 11.8 11.3
13 12.5 12.0 11.5 11.0 10.5
12 11.6 11.1 10.7 10.2 9.8
11 10.6 10.2 9.8 9.4 9.0
10 9.7 9.3 9.0 8.6 8.3
9 8.7 8.4 8.1 7.8 7.5
8 7.8 7.5 7.3 7.0 6.8
7 6.8 6.6 6.4 6.2 6.0
6 5.9 5.7 5.6 5.4 5.3
5 4.9 4.8 4.7 4.6 4.5
4 4.0 3.9 3.9 3.8 3.8
3 3.0 3.0 3.0 3.0 3.0
2 2.1 2.1 2.2 2.2 2.3
TABLE 6M—MOISTURE CORRECTION OF MINUS NO. 10 FOR % PLUS No. 10
(FOR + 10 ABSORPTION OF 3%)
% Plus No. 10 Material by Weight in Total Sample
-10 Moisture 30 35 40 45
40 28.9 27.1 25.2 23.4
39 28.2 26.4 24.6 22.8
38 27.5 25.8 24.0 22.3
37 26.8 25.1 23.4 21.7
36 26.1 24.5 22.8 21.2
35 25.4 23.8 22.2 20.6
34 24.7 23.2 21.6 21.1
33 24.0 22.5 21.0 19.5
32 23.3 21.9 20.4 19.0
31 22.6 21.2 19.8 16.4
30 21.9 20.6 19.2 17.9
29 21.2 19.9 18.6 17.3

GDT 7
Page 21
28 20.5 19.3 18.0 16.8
27 19.8 18.6 17.4 16.2
26 19.1 18.0 16.8 15.7
25 18.4 17.3 16.2 15.1
24 17.7 16.7 15.6 14.6
23 17.0 16.0 15.0 14.0
22 16.3 15.4 14.4 13.5
21 15.6 14.7 13.8 12.9
20 14.9 14.1 13.2 12.4
19 14.2 13.4 12.6 11.8
18 13.5 12.8 12.0 11.3
17 12.8 12.1 11.4 10.7
16 12.1 11.5 10.8 10.2
15 11.4 10.8 10.2 9.6
14 10.7 10.2 9.6 9.1
13 10.0 9.5 9.0 8.5
12 9.3 8.9 8.4 8.0
11 8.6 8.2 7.8 7.4
10 7.9 7.6 7.2 6.9
9 7.2 6.9 6.6 6.3
8 6.5 6.3 6.0 5.8
7 5.8 5.6 5.4 5.2
6 5.1 5.0 4.8 4.7
5 4.4 4.3 4.2 4.1
4 3.7 3.7 3.6 3.6
3 3.0 3.0 3.0 3.0
2 2.3 2.4 2.4 2.5
TABLE 7M—MOISTURE CORRECTION OF MINUS NO. 10 FOR % PLUS No. 10
(FOR + 10 ABSORPTION OF 4%)
% Plus No. 10 Material by Weight in Total Sample
40 38.2 36.3 34.5 32.6 30.8
39 37.2 35.4 33.6 31.8 30.0
38 36.3 34.5 32.8 31.0 29.3
37 35.3 33.6 31.9 30.2 28.5
36 34.4 32.7 31.1 29.4 27.8
35 33.4 31.8 30.2 28.6 27.0
34 32.5 30.9 29.4 27.8 26.3
- Moisture 10 5 10 15 20 25

GDT 7
Page 22
33 31.5 30.0 28.5 27.0 25.5
32 30.6 29.1 27.7 26.2 24.8
31 29.6 28.2 26.8 25.4 24.0
30 28.7 27.3 26.0 24.6 23.3
29 27.7 26.4 25.1 23.8 22.5
28 26.8 25.5 24.3 23.0 21.8
27 25.8 24.6 23.4 22.2 21.0
26 24.9 23.7 22.6 21.4 20.3
25 23.9 22.8 21.7 20.6 19.5
24 23.0 21.9 20.9 19.8 18.8
23 22.0 21.0 20.0 19.0 18.0
22 21.1 20.1 19.2 18.2 17.3
21 20.1 19.2 18.3 17.4 16.5
20 19.2 18.3 17.5 16.6 15.8
19 18.2 17.4 16.6 15.8 15.0
18 17.3 16.5 15.8 15.0 14.3
17 16.3 15.6 14.9 14.2 13.5
16 15.4 14.7 14.1 13.4 12.8
15 14.4 13.8 13.2 12.6 12.0
14 13.5 12.9 12.4 11.8 11.3
13 12.5 12.0 11.5 11.0 10.5
12 11.6 11.1 10.7 10.2 9.8
11 10.6 10.2 9.8 9.4 9.0
10 9.7 9.3 9.0 8.6 8.3
9 8.7 8.4 8.1 7.8 7.5
8 7.8 7.5 7.3 7.0 6.8
7 6.8 6.6 6.4 6.2 6.0
6 5.9 5.7 5.6 5.4 5.3
5 4.9 4.8 4.7 4.6 4.5
4 4.0 3.9 3.9 3.8 3.8
3 3.0 3.0 3.0 3.0 3.0
2 2.1 2.1 2.2 2.2 2.3
TABLE 8M—MOISTURE CORRECTION OF MINUS NO. 10 FOR % PLUS No. 10
(FOR + 10 ABSORPTION OF 4%)
% Plus No. 10 Material by Weight in Total Sample

GDT 7
Page 23
40 29.2 27.4 25.6 23.8
39 28.5 26.8 25.0 23.3
38 27.8 26.1 24.4 22.7
37 27.1 25.5 23.8 22.2
36 26.4 24.8 23.2 21.6
35 25.7 25.4 22.6 21.1
34 25.0 23.5 22.0 20.5
33 24.3 22.9 21.4 20.0
32 23.6 22.2 20.8 19.4
31 22.9 21.6 20.2 18.9
30 22.2 20.9 20.6 18.3
29 21.5 20.3 19.0 17.8
28 20.8 19.6 18.4 17.2
27 20.1 19.0 17.8 16.7
26 19.4 18.3 17.2 16.1
25 18.7 17.7 16.6 15.6
24 18.0 17.0 16.0 15.0
23 17.3 16.4 15.4 14.5
22 16.0 15.7 14.8 13.9
21 15.9 15.1 14.2 13.4
20 15.2 14.4 13.6 12.8
19 14.5 13.8 13.0 12.3
18 13.8 13.1 12.4 11.7
17 13.1 12.5 11.8 11.2
16 12.4 11.8 11.2 10.6
15 11.7 11.2 10.6 10.1
14 11.0 10.5 10.0 9.5
13 10.3 9.9 9.4 9.0
12 9.6 9.2 8.8 8.4
11 8.9 8.6 8.2 7.9
10 8.2 7.9 7.6 7.3
9 7.5 7.3 7.0 6.8
8 6.8 6.6 6.4 6.2
7 6.1 6.0 5.8 5.7
6 5.4 5.3 5.2 5.1
5 4.7 4.7 4.6 4.6
4 4.0 4.0 4.0 4.0
3 3.3 3.4 3.4 3.5
2 2.6 2.7 2.8 2.9
- Moisture 10 30 35 40 45

GDT 7
Page 24
TABLE 9M—MOISTURE CORRECTION OF MINUS NO. 10 FOR % PLUS No. 10
(FOR + 10 ABSORPTION OF 5%)
% Plus No. 10 Material by Weight in Total Sample
40 38.3 36.5 34.8 33.0 31.3
39 37.3 35.6 33.9 32.2 30.5
38 36.4 34.7 33.1 31.4 29.8
37 35.4 33.8 32.2 30.6 29.0
36 34.5 32.9 31.4 29.8 28.3
35 33.5 32.0 30.5 29.0 27.5
34 32.6 31.1 29.7 28.2 26.8
33 31.6 30.2 28.8 27.4 26.0
32 30.7 29.3 28.0 26.6 25.3
31 29.7 28.4 27.1 25.8 24.5
30 28.8 27.5 26.3 25.0 23.8
29 27.8 26.6 25.4 24.2 23.0
28 26.9 25.7 24.6 23.4 22.3
27 25.9 24.8 23.7 22.6 21.5
26 25.0 23.9 22.9 21.8 20.8
25 24.0 23.0 22.0 21.0 20.0
24 23.1 22.1 21.2 20.2 19.3
23 22.1 21.2 20.3 19.4 18.5
22 21.2 20.3 19.5 18.6 17.8
21 20.2 19.4 18.6 17.8 17.0
20 19.3 18.5 17.8 17.0 16.3
19 18.3 17.6 16.9 16.2 15.5
18 17.4 16.7 16.1 15.4 14.8
17 16.4 15.8 15.2 14.6 14.0
16 15.5 14.9 14.4 13.8 13.3
15 14.5 14.0 13.5 13.0 12.5
14 13.6 13.1 12.7 12.2 11.8
13 12.6 12.2 11.8 11.4 11.0
12 11.7 11.3 11.0 10.6 10.3
11 10.7 10.4 10.1 9.8 9.5
10 9.8 9.5 9.3 9.0 8.8
9 8.8 8.6 8.4 8.2 8.0
8 7.9 7.7 7.6 7.4 7.3
7 6.9 6.8 6.7 6.6 6.5
6 6.0 5.9 5.9 5.8 5.8
5 5.0 5.0 5.0 5.0 5.0
4 4.1 4.1 4.2 4.2 4.3
3 3.1 3.2 3.3 3.4 3.5
2 2.2 2.3 2.5 2.6 2.8
- Moisture 10 5 10 15 20 25

GDT 7
Page 25
TABLE 10M—MOISTURE CORRECTION OF MINUS NO. 10 FOR % PLUS No.
10
(FOR + 10 ABSORPTION OF 5%)
% Plus No. 10 Material by Weight in Total Sample
-10 Moisture 30 35 40 45
40 29.5 27.8 26.0 24.3
39 28.8 27.1 25.4 23.7
38 28.1 26.5 24.8 23.2
37 27.4 25.8 24.2 22.6
36 26.7 25.2 23.6 22.1
35 26.0 24.5 23.0 21.5
34 25.3 23.9 22.4 21.0
33 24.6 23.2 21.8 20.4
32 23.9 22.6 21.2 19.9
31 23.2 21.9 20.6 19.3
30 22.5 21.3 20.0 18.8
29 21.8 20.6 19.4 18.2
28 21.1 20.0 18.8 17.7
27 20.4 19.3 18.2 17.1
26 19.7 18.7 17.6 16.6
25 19.0 18.0 17.0 16.0
24 18.3 17.4 16.4 15.5
23 17.6 16.7 15.8 14.9
22 16.9 16.1 15.2 14.4
21 16.2 15.4 14.6 13.8
20 15.5 14.8 14.0 13.3
19 14.8 14.1 13.4 12.7
18 14.1 13.5 12.8 12.2
17 13.4 12.8 12.2 11.6
16 12.7 12.2 11.6 11.1
15 12.0 11.5 11.0 10.5
14 11.3 10.9 10.4 10.0
13 10.6 10.2 9.8 9.4
12 9.9 9.6 9.2 8.9
11 9.2 8.9 8.6 8.3
10 8.5 8.3 8.0 7.8
9 7.8 7.6 7.4 7.2
8 7.1 7.0 6.8 6.7
7 6.4 6.3 6.2 6.1
6 5.7 5.7 5.6 5.6
5 5.0 5.0 5.0 5.0
4 4.3 4.4 4.4 4.5
3 3.6 3.7 3.8 3.9
2 2.9 3.1 3.2 3.4

GDT 7
Page 26