gdwd ,2 * 3 (qylurqp hqwdoshuirup dqfhlqglfdwruv
TRANSCRIPT

REPORT
2018e SEPTEMBER2020
DATA SERIES
IOGP Environmental performance indicators - 2018data

Feedback
IOGP welcomes feedback on our reports: [email protected]
DisclaimerWhilst every effort has been made to ensure the accuracy of the information contained in this publication, neitherIOGP nor any of its Members past present or future warrants its accuracy or will, regardless of its or theirnegligence, assume liability for any foreseeable or unforeseeable use made thereof, which liability is herebyexcluded. Consequently, such use is at the recipient’s own risk on the basis that any use by the recipientconstitutes agreement to the terms of this disclaimer. The recipient is obliged to inform any subsequent recipientof such terms.
This publication is made available for information purposes and solely for the private use of the user. IOGP will notdirectly or indirectly endorse, approve or accredit the content of any course, event or otherwise where thispublication will be reproduced.
Copyright noticeThe contents of these pages are © International Association of Oil & Gas Producers. Permission is given toreproduce this report in whole or in part provided (i) that the copyright of IOGP and (ii) the sources areacknowledged. All other rights are reserved. Any other use requires the prior written permission of IOGP.
These Terms and Conditions shall be governed by and construed in accordance with the laws of England andWales. Disputes arising here from shall be exclusively subject to the jurisdiction of the courts of England andWales.

Contents
Contributing companies
Introduction
Scope of data submissions
Detailed review
1. Gaseous emissions
1.1 Carbon dioxide (CO )1.2 Methane (CH )1.3 Greenhouse gas (GHG)1.4 Non-methane volatile organic compounds (NMVOCs)1.5 Sulphur dioxide (SO )1.6 Nitrogen oxides (NO )
2. Energy consumption
3. Flaring
4. Produced water
4.1 Concentration (oil content) of produced water discharges4.2 Quantity of oil discharged in produced water per unit of production4.3 Produced water injection
5. Non-aqueous drilling fluids retained on cuttings discharged to sea
6. Spills
6.1 Oil spills6.2 Chemical spills
7. Fresh water
Appendix A – Data tables
Scope of data submissions
Detailed review
Gaseous emissionsEnergy consumptionFlaringProduced waterNon-aqueous drilling fluids retained on cuttings discharged to seaSpillsFresh water
Glossary
2
4
2
X
IOGP environmental performance indicators – 2018 data
/ 2
Contributing companiesThe environmental statistics were derived from data provided by the following companies:
2019ADNOCAkerBPAssala EnergyBHP BillitonBPBW EnergyCEPSA EPChevronCNOOCConocoPhillipsDolphin EnergyENIEquinor ASAExxonMobilGENELGulf KeystoneHess CorporationHusky EnergyINPEX CorporationKMGKosmos EnergyKuwait Oil CompanyMOLNeptune EnergyNorth Oil CompanyOil SearchOMVPan American EnergyPetrobrasPGNiGPluspetrolPremier OilPTTEPShell CompaniesSOCARSonangolSuncorTotalTullow OilWintershall DeaWoodside
2018ADNOCAkerBPAssala EnergyBPCairn EnergyCEPSA EPChevronCNOOCConocoPhillipsDEADolphin EnergyENIEquinor ASAExxonMobilGeoParkGulf KeystoneHess CorporationHusky EnergyINPEX CorporationKMGKosmos EnergyKuwait Oil CompanyMOLNeptune EnergyNexen IncNorth Oil CompanyOil SearchOMVPan American EnergyPetrobrasPGNiGPluspetrolPremier OilPTTEPRepsolShell CompaniesSOCARSonangolSuncorTotalTullow OilWintershallWoodside
2017ADNOCAnadarko Petroleum CorporationAssala EnergyBPCairn EnergyCEPSA EPChevronCNOOCConocoPhillipsDEADolphin EnergyDragon OilENIEquinor ASAExxonMobilGalp EnergiaGeoParkGulf KeystoneHess CorporationHusky EnergyINEOS Oil & GasINPEX CorporationKMGKosmos EnergyKuwait Oil CompanyMOLNeptune EnergyNorth Oil CompanyOil SearchOMVPan American EnergyPetrobrasPGNiGPluspetrolPremier OilPTTEPRepsolSasolShell CompaniesSuncorTotalTullow OilWintershallWoodside
IOGP environmental performance indicators – 2018 data
/ 3

IntroductionThe International Association of Oil and Gas Producers (IOGP) has collected and published environmentaldata from its member companies every year since 2001. The ultimate aim of this effort is to provide arepresentative statement on the environmental performance of the contributing IOGP membercompanies.
Subsidiary objectives are to provide a basis for individual member companies to compare theirenvironmental performance, thereby helping them to identify areas for improvement and to demonstratethe industry's wish for greater transparency concerning its activities.
Environmental information is collected under the following categories:
gaseous emissionsenergy consumptionflaringproduced waternon-aqueous drilling fluids retained on cuttings discharged to seaspillsfresh water
Data are collected annually for each of the categories above, on the basis of a set of definitions agreed bythe IOGP membership. These definitions align with IPIECA/API/IOGP Report 437 - Oil and gas industryguidance on voluntary sustainability reporting. The definitions are provided via a user guide that isreviewed at regular intervals and updated to reflect improvements in reporting and to provide additionalclarification.
IOGP environmental performance indicators – 2018 data
/ 4

Scope of data submissionsThe 43 IOGP participating member companies reported 2018 environmental data for, on average, 13countries each. Information reported for 2018 covered operations in a total of 73 countries.
To show the data from a geographical perspective, 7 regions have been defined, as shown in Figures 1 and2.
Figure 1:
Figure 2. Data provided for the 7 geographic regions (2018)
Regional contribution to total productionreported by participating companies
(2018)
Middle East22 %
Africa16 %
Europe15 %
Asia /Australasia
14 %
North America14 %
South &Central America
12 %
Russia &Central Asia
7 %
IOGP environmental performance indicators – 2018 data
/ 5

This report only reflects the performance of the IOGP member companies that have provided data in agiven year. For 2018, the data represent 2131 million tonnes of hydrocarbon production, equivalent toapproximately 27% of 2018 world production as reported in the BP Statistical Review of World Energy2019.
There is substantial variation in regional coverage when compared with the 2018 sales productionreported in the BP Statistical Review of World Energy 2019, as shown in Figure 3.
In Europe, where a high percentage (83% in 2018) of hydrocarbon productionis represented, the information can be taken to approximate 'industry'performance in that region.In Africa (59%), South & Central America (52%) and Asia/Australasia (34%), thedata give a broad indication of industry performance.For the Middle East (22%) and North America (16%), the regional coverage isless comprehensive, giving a weaker indication of industry performance.For the Russia & Central Asia region, data reported by participating companiesrepresent just 10% of the total sales production for that region and thus maynot be representative of the region’s performance.
Figure 3:
Africa Asia/
Australasia
Europe MiddleEast
NorthAmerica
Russia&
CentralAsia
South&
CentralAmerica
59%
34%
83%
22%16%
10%
52%
0
500
1000
1500
2000
2500
Milli
on to
nnes
of h
ydro
carb
on p
rodu
ctio
n
Production reported by participating companies relative tosales production in BP Statistical Review of World Energy
by region (2016–2018)
2018 Sales production* (% 2018 IOGP-reported production relative to regional sales production*)2016 Production** 2017 Production** 2018 Production*** Sales production as published in BP Statistical Review** Production reported by participating companies
IOGP environmental performance indicators – 2018 data
/ 6

Figure 4:
Changes in results for various environmental indicators may not necessarily reflect actual changes inperformance for the following reasons:
The number and makeup of companies reporting has fluctuated between years, as shown in Table1 and Figure 4.Not all metrics are consistently reported each year by all companies, (reporting coverage by metricfor 2018 is shown in Table 2).Performance indicator results may be influenced by changes in mixtures of assets held by theparticipating companies between years.Differences between years for participating companies may also, in some cases, reflect changes incalculation methodology applied or reporting definitions.
Table 1. Company participation
Note: This represents the number of companies reporting hydrocarbon production. Some companies that reported hydrocarbon production did not
report data for all metrics, e.g. atmospheric emission or produced water discharges, consistently for all countries each year.
Data in the figures are generally presented on a normalised basis. This allows relative comparisonsacross regions and reduces the effect of variations in reporting coverage. Normalised analyses are onlypossible when data are available for both the metric to be normalised (e.g., emissions, discharges, spills)and the normaliser (e.g., hydrocarbon production, produced water).
MiddleEast
Africa Europe Asia/
Australasia
NorthAmerica
South&
CentralAmerica
Russia&
CentralAsia
0
50
100
150
200
250
300
350
400
450
500
Milli
on to
nnes
of h
ydro
carb
on p
rodu
ctio
n
0
5
10
15
20
25
Num
ber o
f com
pani
es p
artic
ipat
ing
Hydrocarbon production reported by participating companiesand the number of participating companies
(2016–2018)
2016 Companies 2017 Companies 2018 Companies2016 Production 2017 Production 2018 Production
2019 41 4 6
2018 43 4 5
2017 44 9 1
2016 36 1 3
2015 38 0 5
Year Companies Reporting Companies Joining (did not report previous year) Companies dropping out (reported previous year)
IOGP environmental performance indicators – 2018 data
/ 7

Some of the analyses will cover less than 100% of the total production reported because some companiesdid not submit data for all metrics covered in the survey. This is particularly relevant to the normalisedenergy consumption results in South & Central America and fresh water withdrawal results in Russia &Central Asia, where in each case less than 65% of reported production is included.
Data on the source types of gaseous emissions (energy, flare, vent, fugitive emissions and other) havebeen collected since 2009. It is recognised that not all participating companies are able to contribute dataat that level of detail; nevertheless, data broken down by source cover between 52% and 79% of thegaseous emissions reported for 2018 for the emissions compounds discussed in this report.
The current year data shown in this report are based on the best available information that membercompanies are able to provide at time of publication.
Table 2: Percentage of reported production included in normalised analyses 2018
Green: (90%–100%): data fairly representative of participating companies in the region
Yellow: (65%–89%) data moderately representative
Orange: (30%–64%): lower confidence that data are representative
Red: (0%–29%): lowest confidence that data are representative
Africa 100 97 97 97 100 100 100 100 100 74
Asia /Australasia 85 83 99 99 100 100 100 99 96 69
Europe 100 100 100 100 100 100 100 97 97 99
Middle East 97 93 97 97 97 100 100 93 100 98
North America 99 98 100 100 100 99 100 93 100 85
Russia & CentralAsia 100 85 100 100 100 100 100 93 78 64
South & CentralAmerica 100 87 96 96 100 100 100 100 100 99
ALL REGIONS 97 93 98 98 99 100 100 96 98 86
Region
Gas emissions
Energyconsumed Flaring
Oil discharged inproduced water
Oilspills
Freshwater
withdrawalCH4 NMVOC SO2 NOX CO2
IOGP environmental performance indicators – 2018 data
/ 8

Detailed review
1. Gaseous emissions
Gaseous emissions covered in this report are those considered most relevant to the nature of E&Pactivities as well as regulatory perspectives*:
CO : carbon dioxideCH : methaneGHG: greenhouse gas is CO + CH expressed as CO equivalentNMVOCs: Non-Methane Volatile Organic Compounds are all hydrocarbons, other than methaneSO : the sum of sulphur dioxide (SO ) and sulphur trioxide (SO ) expressed as SO equivalentNO : the sum of nitric oxide (NO) and nitrogen dioxide (NO ) expressed as NO equivalent. Nitrousoxide (N O) is not included as a component of NO .
As nitrous oxide, hydrofluorocarbons, perfluorocarbons and sulphur hexafluoride contribute only a smallfraction of greenhouse gas emissions from E&P activities, they have not been included here.
Given the wide range of sources of gaseous emissions, it is not practicable (or possible) to measure everysingle source. Industry has, however, developed and updated detailed guidance methodologies tocalculate and estimate emissions and losses**. Since companies may use a variety of estimationtechniques care must be taken when interpreting aggregated data.
A number of factors affect the quantity of gases emitted from E&P petroleum industry operations.Consequently, understanding the variations in performance in terms of normalised emission ratios iscomplex.
These factors include:
presence or absence of infrastructure for gas salesgas–oil ratioreservoir and field characteristicsproduction techniquesregulatory and contractual aspectslocation and logisticsage of the fieldsemissions controls
Normalised figures for 2014–2018 direct emissions are shown in Figures 5 and 6. Emissions reported arethose directly emitted by the facilities operated or controlled by the participating companies. Emissionsfrom the generation of energy (electricity, steam) purchased from third parties are not reported.
** Consistent with IPIECA/API/IOGP Oil and gas industry guidance on voluntary sustainability reporting, 2015* See for example:
Petroleum Industry Guidelines for Reporting Greenhouse Gas Emissions (2003) Joint IPIECA/API/IOGP report (in revision);Compendium of Greenhouse Gas Emission Estimation Methodologies for the Oil and Gas Industry, API, 2009;SangeaTM Energy and Emissions Estimating System, API, http://GHG.API.org.
2
4
2 4 2
2 2 3 2
X 2 2
2 X
IOGP environmental performance indicators – 2018 data
/ 9
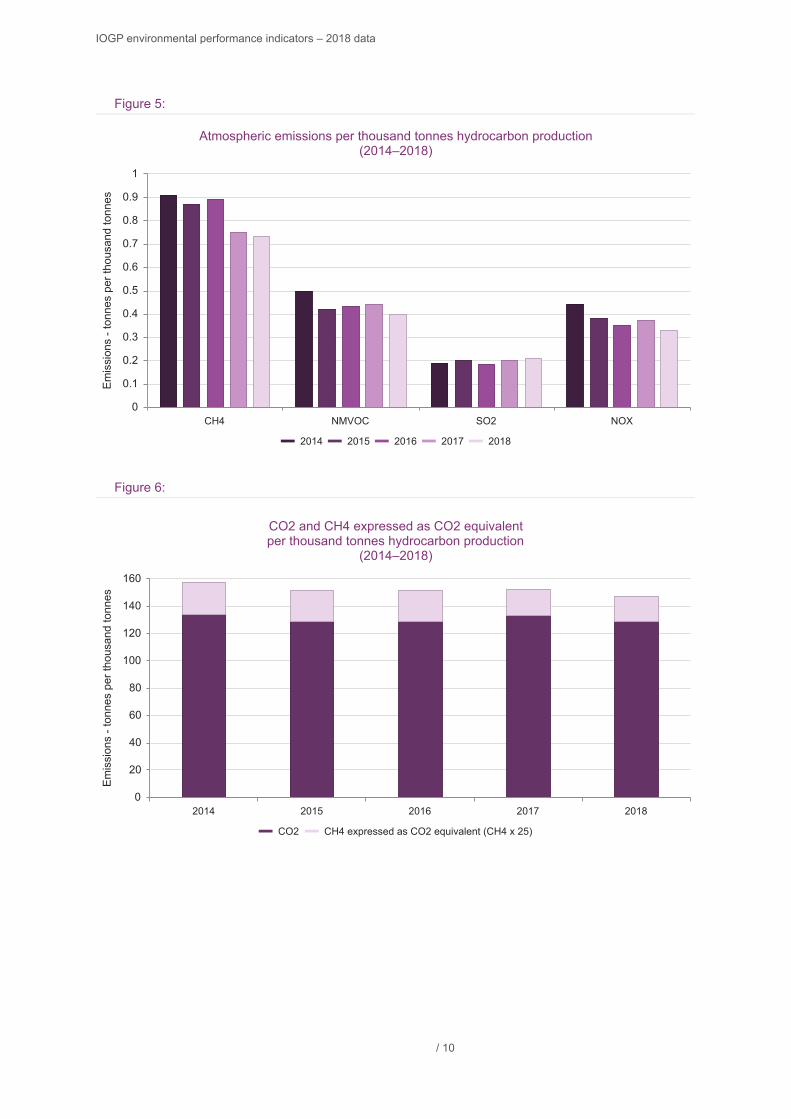
Figure 5:
Figure 6:
CH4 NMVOC SO2 NOX0
0.1
0.2
0.3
0.4
0.5
0.6
0.7
0.8
0.9
1
Emis
sion
s - t
onne
s pe
r tho
usan
d to
nnes
Atmospheric emissions per thousand tonnes hydrocarbon production(2014–2018)
2014 2015 2016 2017 2018
2014 2015 2016 2017 20180
20
40
60
80
100
120
140
160
Emis
sion
s - t
onne
s pe
r tho
usan
d to
nnes
CO2 and CH4 expressed as CO2 equivalentper thousand tonnes hydrocarbon production
(2014–2018)
CO2 CH4 expressed as CO2 equivalent (CH4 x 25)
IOGP environmental performance indicators – 2018 data
/ 10

1.1 Carbon dioxide (CO )
Emissions of carbon dioxide occur principally from the combustion of fuels for energy production andfrom flaring. Carbon dioxide releases may also occur where CO is stripped from the reservoir gases tomeet sales specifications.
Emissions per unit of productionOverall, CO emissions normalised to hydrocarbon production for 2018 participating companies were 129tonnes of CO per thousand tonnes of production, 3% lower than the average result for the 2017participating companies, as shown in Figure 7.
Figure 7:
In 2018, regional averages for carbon dioxide emissions expressed per unit of production varied from 64 to199 tonnes of carbon dioxide per thousand tonnes of hydrocarbon production, as shown in Figure 8. In2017, the range was between 69 and 204 tonnes per thousand tonnes of production. The wide rangeacross regions points towards the strong influence of different types of production assets on greenhousegas metrics.
2
2
2
2
2014 2015 2016 2017 20180
20
40
60
80
100
120
140
160
Tonn
es p
er th
ousa
nd to
nnes
pro
duct
ion
CO2 emissions per unit of hydrocarbon production(2014–2018)
CO2
IOGP environmental performance indicators – 2018 data
/ 11

Figure 8:
Emissions by source
The source was specified for 65% of the carbon dioxide emissions reported for 2018. Where the sourcewas specified, 71% of the reported carbon dioxide emissions were from energy use, 24% were fromflaring, 5% were from venting and 0% were from fugitive losses, as shown in Figure 9.
Figure 9:
Note: based only on emissions where the source is specified.
Africa Asia/
Australasia
Europe MiddleEast
NorthAmerica
Russia&
CentralAsia
South&
CentralAmerica
0
50
100
150
200
250
Tonn
es p
er th
ousa
nd to
nnes
pro
duct
ion
CO2 emissions per unit of hydrocarbon production by region(2016–2018)
2016 2017 2018 2018 Overall
CO2 emissions by source(2018)
Energy/Fuelcombustion
71 %
Flare24 %
Process vents5 %
Fugitive losses0 %
IOGP environmental performance indicators – 2018 data
/ 12

1.2 Methane (CH )
Methane is emitted from sources including process vents, gas-driven pneumatic devices and tank vents.It also escapes as fugitive emissions from process components (valves, flanges, etc.). In addition, somemethane emissions result from incomplete combustion of hydrocarbons in flares.
Emissions per unit of production
Overall, CH emissions normalised to hydrocarbon production for 2018 participating companies were 0.73tonnes of CH per thousand tonnes of production, 3% lower than the average result for the 2017participating companies, as shown in Figure 10.
The increase in methane emissions in Russia & Central Asia is due to the introduction of new data.
Figure 10:
In 2018, regional averages for methane emissions expressed per unit of production varied from 0.1 to 1.4tonnes of methane per thousand tonnes of hydrocarbon production, as shown in Figure 11. In 2017, therange was between 0.1 and 1.7 tonnes per thousand tonnes of production. The wide range across regionspoints towards the strong influence of different types of production assets on greenhouse gas metrics.
4
4
4
2014 2015 2016 2017 20180
0.2
0.4
0.6
0.8
1
Tonn
es p
er th
ousa
nd to
nnes
pro
duct
ion
CH4 emissions per unit of hydrocarbon production(2014–2018)
CH4
IOGP environmental performance indicators – 2018 data
/ 13

Figure 11:
Emissions by sourceThe source was specified for 79% of the methane emissions reported for 2018. Where the source wasspecified, 58% were from vents (including venting, vessel loading, tank storage, pneumatic devices, etc.),19% were from flaring, 15% were from fugitive losses, and 7% of the reported methane emissions werefrom energy use, as shown in Figure 12.
Figure 12:
Note: based only on emissions where the source is specified.
Africa Asia/
Australasia
Europe MiddleEast
NorthAmerica
Russia&
CentralAsia
South&
CentralAmerica
0
0.5
1
1.5
2
2.5
3
Tonn
es p
er th
ousa
nd to
nnes
pro
duct
ion
CH4 emissions per unit of hydrocarbon production by region(2016–2018)
2016 2017 2018 2018 Overall
CH4 emissions by source(2018)
Energy/Fuelcombustion
7 %
Flare19 %
Process vents58 %
Fugitive losses15 %
IOGP environmental performance indicators – 2018 data
/ 14

1.3 Greenhouse gas (GHG)
For E&P activities, CO and CH are the principal contributors to greenhouse gas emissions.
The CO and CH data presented above are used to calculate an estimate of the GHG emissions for thecontributing IOGP reporting companies, using the conversion to CO equivalent (GHG = CO + 25 x CH )**.
Emissions per unit of production
Participating companies in 2018 reported normalised emissions of 148 tonnes of GHG per thousandtonnes of hydrocarbon production, 2% lower than the average result for the 2017 participating companies,as shown in Figure 13.
Figure 13:
In 2018, regional averages for quantity of greenhouse gas emissions expressed per unit of productionvaried from 67 to 235 tonnes of greenhouse gas per thousand tonnes of hydrocarbon production, asshown in Figure 14. In 2017, the range was between 72 and 246 tonnes per thousand tonnes of production.The wide range across regions points towards the strong influence of different types of production assetson greenhouse gas metrics.
* GHG: Total Greenhouse Gases (CO2 + CH4 expressed as CO2 equivalent)** Consistent with IPIECA/API/IOGP Oil and gas industry guidance on voluntary sustainability reporting, 2015
2 4
2 4
2 2 4
2014 2015 2016 2017 20180
20
40
60
80
100
120
140
160
Tonn
es p
er th
ousa
nd to
nnes
pro
duct
ion
GHG emissions per unit of hydrocarbon production(2014–2018)
GHG
IOGP environmental performance indicators – 2018 data
/ 15

Figure 14:
Emissions by source
The source was specified for 67% of the greenhouse gas emissions reported for 2018. Where the sourcewas specified, 62% of the reported greenhouse gas emissions were from energy use, 23% were fromflaring, 13% were from venting and 2% were from fugitive losses, as shown in Figure 15.
Figure 15:
Note: based only on emissions where the source is specified.
Africa Asia/
Australasia
Europe MiddleEast
NorthAmerica
Russia&
CentralAsia
South&
CentralAmerica
0
50
100
150
200
250
300
Tonn
es p
er th
ousa
nd to
nnes
pro
duct
ion
GHG emissions per unit of hydrocarbon production by region(2016–2018)
2016 2017 2018 2018 Overall
GHG emissions by source(2018)
Energy/Fuelcombustion
62 %
Flare23 %
Process vents13 %
Fugitive losses2 %
IOGP environmental performance indicators – 2018 data
/ 16

1.4 Non-methane volatile organic compounds (NMVOCs)
NMVOC emissions mainly occur from flaring, venting and fugitive releases and, to a lesser extent,combustion equipment.
Overall NMVOC emissions normalised to hydrocarbon production for 2018 participating companies were0.40 tonnes of NMVOC per thousand tonnes of production, 9% lower than the average result for the 2017participating companies, as shown in Figure 16.
Figure 16:
In 2018, regional averages for NMVOC emissions expressed per unit of production varied from 0.1 to 1.0tonne of NMVOC per thousand tonnes of hydrocarbon production, as shown in Figure 17. In 2017, therange was between 0.1 and 0.9 tonnes per thousand tonnes of production.
2014 2015 2016 2017 20180
0.1
0.2
0.3
0.4
0.5
Tonn
es p
er th
ousa
nd to
nnes
pro
duct
ion
NMVOC emissions per unit of hydrocarbon production(2014–2018)
NMVOC
IOGP environmental performance indicators – 2018 data
/ 17

Figure 17:
Emissions by sourceThe source was specified for 73% of the NMVOC emissions reported for 2018. Where the source wasspecified, 65% were from venting or vents, 18% were from flaring, 12% were from fugitive losses, and 5%of the reported NMVOC emissions were from energy use, as shown in Figure 18.
Figure 18:
Note: based only on emissions where the source is specified.
Africa Asia/
Australasia
Europe MiddleEast
NorthAmerica
Russia&
CentralAsia
South&
CentralAmerica
0
0.2
0.4
0.6
0.8
1
1.2
Tonn
es p
er th
ousa
nd to
nnes
pro
duct
ion
NMVOC emissions per unit of hydrocarbon production by region(2016–2018)
2016 2017 2018 2018 Overall
NMVOC emissions by source(2018)
Energy/Fuelcombustion
5 %
Flare18 %
Process vents65 %
Fugitive losses12 %
IOGP environmental performance indicators – 2018 data
/ 18

1.5 Sulphur dioxide (SO )
Sulphur oxide emissions by the E&P industry arise through oxidation during combustion of sulphurnaturally contained within fuel gas or flared gas (H S content) and within diesel and other liquid fuels(sulphur content).
Overall, SO emissions normalised to hydrocarbon production for 2018 participating companies were 0.21tonnes of SO per thousand tonnes of production, 5% higher than the average result for the 2017participating companies, as shown in Figure 19.
Figure 19:
In 2018, regional averages for SO emissions expressed per unit of production varied from 0.0 to 0.7tonnes of SO per thousand tonnes of hydrocarbon production, as shown in Figure 17. In 2017, the rangewas between 0.0 and 0.6 tonnes per thousand tonnes of production.
2
2
2
2
2014 2015 2016 2017 20180
0.05
0.1
0.15
0.2
0.25
Tonn
es p
er th
ousa
nd to
nnes
pro
duct
ion
SO2 emissions per unit of hydrocarbon production(2014–2018)
SO2
2
2
IOGP environmental performance indicators – 2018 data
/ 19
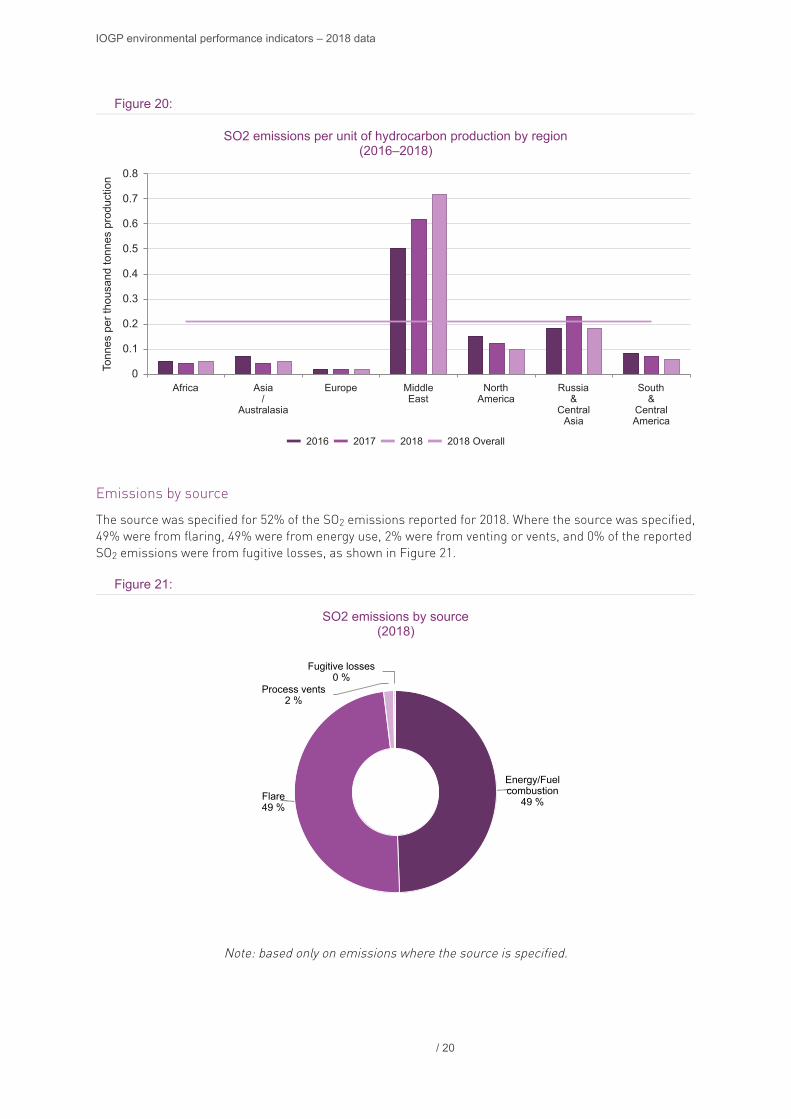
Figure 20:
Emissions by source
The source was specified for 52% of the SO emissions reported for 2018. Where the source was specified,49% were from flaring, 49% were from energy use, 2% were from venting or vents, and 0% of the reportedSO emissions were from fugitive losses, as shown in Figure 21.
Figure 21:
Note: based only on emissions where the source is specified.
Africa Asia/
Australasia
Europe MiddleEast
NorthAmerica
Russia&
CentralAsia
South&
CentralAmerica
0
0.1
0.2
0.3
0.4
0.5
0.6
0.7
0.8
Tonn
es p
er th
ousa
nd to
nnes
pro
duct
ion
SO2 emissions per unit of hydrocarbon production by region(2016–2018)
2016 2017 2018 2018 Overall
2
2
SO2 emissions by source(2018)
Energy/Fuelcombustion
49 %Flare49 %
Process vents2 %
Fugitive losses0 %
IOGP environmental performance indicators – 2018 data
/ 20

1.6 Nitrogen oxides (NO )
Emissions of nitrogen oxides, (principally nitric oxide and nitrogen dioxide, expressed as NO ), occuralmost exclusively from the combustion of natural gas or other fuels. These emissions are heavilyinfluenced by energy use and are also a function of the combustion equipment, loading and technology.
Overall, NO emissions normalised to hydrocarbon production for 2018 participating companies were 0.33tonnes of NO per thousand tonnes of production, 11% lower than the average result for the 2017participating companies, as shown in Figure 22.
Figure 22:
In 2018, regional averages for NO emissions expressed per unit of production varied from 0.2 to 0.5tonnes of NO per thousand tonnes of hydrocarbon production, as shown in Figure 17. In 2017, the rangewas between 0.2 and 0.6 tonnes per thousand tonnes of production.
X
X
X
X
2014 2015 2016 2017 20180
0.05
0.1
0.15
0.2
0.25
0.3
0.35
0.4
0.45
Tonn
es p
er th
ousa
nd to
nnes
pro
duct
ion
NOX emissions per unit of hydrocarbon production(2014–2018)
NOX
X
X
IOGP environmental performance indicators – 2018 data
/ 21

Figure 23:
Emissions by sourceThe source was specified for 62% of the NO emissions reported for 2018. Where the source wasspecified, 5% were from flaring, 95% were from energy use, 0% were from venting or vents, and 0% of thereported NO emissions were from fugitive losses, as shown in Figure 24.
Figure 24:
Note: based only on emissions where the source is specified.
Africa Asia/
Australasia
Europe MiddleEast
NorthAmerica
Russia&
CentralAsia
South&
CentralAmerica
0
0.1
0.2
0.3
0.4
0.5
0.6
0.7
Tonn
es p
er th
ousa
nd to
nnes
pro
duct
ion
NOX emissions per unit of hydrocarbon production by region(2016–2018)
2016 2017 2018 2018 Overall
X
X
NOX emissions by source(2018)
Energy/Fuelcombustion
95 %
Flare5 %
Process vents0 %
Fugitive losses0 %
IOGP environmental performance indicators – 2018 data
/ 22

2. Energy consumption
The energy used to produce oil and gas covers a range of activities. These include:
powering compressors to re-inject produced gas or to export it through pipelinesdriving turbines to generate electricity needed for operational activities, including logistics, and forliving quarters (e.g., at offshore platforms)driving pumps that produce the hydrocarbons (and any associated produced water)heating produced oil for separationproducing steam for enhanced oil recoverydriving the pumps to re-inject produced water, inject water for water-flooding and transport theproduced oil through pipelines
Energy consumption will vary widely depending upon the specific local circumstances and operationalconditions. For example, mature or remote fields usually consume more energy than other fields.
In 2018, IOGP reporting companies consumed on average 1.5 gigajoules of energy for every tonne ofhydrocarbon produced, as shown in Figure 25. This is virtually unchanged compared with the 2017average.
As in previous years, data indicate that onshore production in 2018 was more energy intensive thanoffshore production (see data table A.10).
Figure 25:
The source of energy used was specified for 86% of the energy reported by participating companies in2018. Where specified, the majority of energy requirements were met by the combustion of fuels onsite(fuel gas, natural gas, liquid fuels) rather than by purchase of electricity or steam.
In Figure 26, the (overall) energy consumption is normalised against the quantity of hydrocarbonsproduced for each region.
The wide range across regions points towards the strong influence of different types of production assets
2015 2016 2017 20180
0.2
0.4
0.6
0.8
1
1.2
1.4
1.6
Gig
ajou
les
ener
gy p
er to
nne
prod
uctio
n
Energy consumed per unit of hydrocarbon production – by source(2014–2018)
Onsite combustion Purchased energy Unspecified
IOGP environmental performance indicators – 2018 data
/ 23
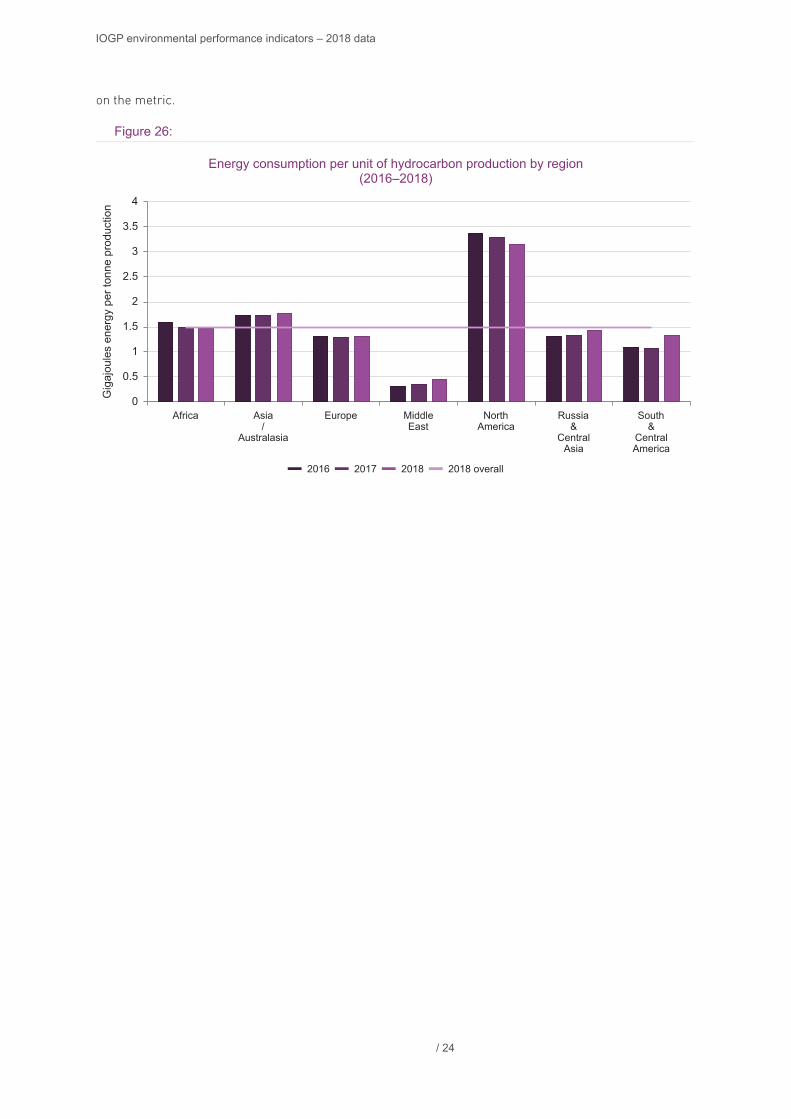
on the metric.
Figure 26:
Africa Asia/
Australasia
Europe MiddleEast
NorthAmerica
Russia&
CentralAsia
South&
CentralAmerica
0
0.5
1
1.5
2
2.5
3
3.5
4
Gig
ajou
les
ener
gy p
er to
nne
prod
uctio
n
Energy consumption per unit of hydrocarbon production by region(2016–2018)
2016 2017 2018 2018 overall
IOGP environmental performance indicators – 2018 data
/ 24

3. Flaring
Flaring is the controlled burning of hydrocarbons produced during petroleum exploration and productionoperations. It includes the controlled and safe burning of gas that, for safety or technical reasons or forlack of export infrastructure, is not used or exported.
Despite some differences in the performance of individual companies or regions, it is apparent that thereis an overall continual reduction in flaring.
In 2018, participating companies reported 22348 thousand tonnes of gas flared. This equates to 10.5tonnes of gas flared for every thousand tonnes of hydrocarbon produced versus 12.1 in 2017 and 12.9 in2016, as shown in Figure 27.
Figure 27:
Figure 28 shows flaring per unit of hydrocarbon production for the participating companies, by region.
Flaring intensities for the participating companies are higher in Africa than in other regions, due in part toa relative lack of infrastructure to allow utilization of the gas. But efforts to improve the utilisation viareinjection and gas export have led to reduced intensities in Africa in recent years.
2014 2015 2016 2017 20180
2
4
6
8
10
12
14
16
Tonn
es h
ydro
carb
on fl
ared
per t
hous
and
tonn
es p
rodu
ctio
n
Hydrocarbon flared per unit of hydrocarbon production(2014–2018)
IOGP environmental performance indicators – 2018 data
/ 25

Figure 28:
Africa Asia/
Australasia
Europe MiddleEast
NorthAmerica
Russia&
CentralAsia
South&
CentralAmerica
0
5
10
15
20
25
30
35
40
45
Tonn
es h
ydro
carb
on fl
ared
per t
hous
and
tonn
es p
rodu
ctio
nHydrocarbon flared per unit of hydrocarbon production by region
(2016–2018)
2016 2017 2018 2018 overall
IOGP environmental performance indicators – 2018 data
/ 26
4. Produced water
Produced water is often generated during the production of oil and gas. It consists of formation water(water present naturally in the reservoir) and floodwater (water previously injected into the reservoir).
After extraction, produced water is separated and treated (de-oiled) before discharge to surface water(including seas, rivers, lakes, etc.) or to land (including to evaporation ponds). Produced water can also beinjected either into the producing reservoir where it can enhance hydrocarbon recovery or into anotherappropriate formation for disposal. The volume of produced water typically increases as recovery of oiland gas from a field progresses, that is, as the field becomes ‘mature’.
Most countries regulate the discharge of produced water, taking into account differing environmentalconditions and sensitivities between onshore and offshore.
The quality of produced water is most widely expressed in terms of its oil content. There are severalanalytical methodologies in use around the world for measuring oil in water. Due to differences inanalytical methodologies, care should be taken when interpreting aggregated data.
In 2018, participating companies reported the oil content of 862 million tonnes of dischargedproduced water. Where the location was specified, approximately 15% of water discharged wasfrom offshore operations and 85% was from onshore operations.An average of 57% of produced water is re-injected versus 43% of produced water discharged tothe surface.The overall average oil content of produced water discharges was 16.1 mg/l in 2018, compared with15.2 mg/l in 2017 and 11.4 mg/l in 2016. Offshore the average oil content in produced water in 2018was 18.3 mg/l, whilst onshore it was 5.2 mg/l (See Figures 29, 30 and 31).Overall 6.8 tonnes of oil were discharged per million tonnes of hydrocarbon production in 2018 byparticipating companies, a 9% reduction compared with 2017 participating companies (7.5 in 2017and 6.6 in 2016). The quantity of oil discharged per unit of hydrocarbon production was 0.8 t/Mtonshore and 12.3 t/Mt offshore (See Figures 32, 33 and 34).
Note 1: For this analysis produced water discharges from crude oil and natural gas facilities are categorised by the source of production and not thelocation where the discharges occur. In other words, where production is offshore the discharges are reported as “offshore” even if the dischargesare generated from an onshore facility.Note 2: For various reasons companies either discharge or re-inject produced water. The split between the produced water injected and dischargedmay change over time and this may influence the quantity and concentration of oil in produced water discharged to surface.Note 3: There are marked differences in the companies providing data for each region between the years, onshore and offshore.
IOGP environmental performance indicators – 2018 data
/ 27

4.1 Concentration (oil content) of produced water dischargesThe global quantity of oil discharged per unit of produced water was 16.1 mg/l for 2018 participatingcompanies, 6% higher than the average for 2017 participating companies (15.2 mg/l).
Figure 29:
Onshore results were 33% higher compared with 2017. Offshore the average was 2% higher comparedwith 2017.
Onshore Offshore OVERALL0
2
4
6
8
10
12
14
16
18
20
Milli
gram
mes
oil
per l
itre
ofpr
oduc
ed w
ater
dis
char
ged
onsh
ore
(app
roxi
mat
ely
equa
l to
tonn
es p
er m
illion
tonn
es)
Oil discharged per unit of produced water discharged(2014–2018)
2014 2015 2016 2017 2018
IOGP environmental performance indicators – 2018 data
/ 28

The onshore database for the concentration of oil discharged in produced water for South & CentralAmerica was affected, in 2016, substantially by improvements in produced water monitoring (volumes andoil content) by some reporting companies and, in 2017 and 2018, by a reduction in reported operationsresulting in a reduction in produced water discharges.
The higher oil content onshore in 2017 in Africa is also attributed to a change in assets. The reduction inNorth America is due to platform shut-ins.
Figure 30:
The offshore database for the concentration of oil discharged in produced water for South & CentralAmerica was affected substantially, in 2017, by an increase in the volume of water discharged as well aschanges in the analysis methodology driven by updated regulatory requirements.
In 2018 the higher oil content offshore for Russia & Central Asia was due to increased produced water re-injection offshore.
Africa Asia/
Australasia
Europe MiddleEast
NorthAmerica
Russia&
CentralAsia
South&
CentralAmerica
0
5
10
15
20
25
30
35
40
Milli
gram
mes
oil
per l
itre
ofpr
oduc
ed w
ater
dis
char
ged
onsh
ore
(app
roxi
mat
ely
equa
l to
tonn
es p
er m
illion
tonn
es)
Oil content of produced water discharged onshore by region(2016–2018)
2016 2017 2018 2018 overall
IOGP environmental performance indicators – 2018 data
/ 29

Figure 31:
Africa Asia/
Australasia
Europe MiddleEast
NorthAmerica
Russia&
CentralAsia
South&
CentralAmerica
0
5
10
15
20
25
30
35
40
45
50
Milli
gram
mes
oil
per l
itre
ofpr
oduc
ed w
ater
dis
char
ged
offs
hore
(app
roxi
mat
ely
equa
l to
tonn
es p
er m
illion
tonn
es)
Oil content of produced water discharged offshore by region(2016–2018)
2016 2017 2018 2018 overall
IOGP environmental performance indicators – 2018 data
/ 30

4.2 Quantity of oil discharged in produced water per unit ofproduction
Overall the rate of oil discharged per unit of production for participating companies in 2018 shows a 9%reduction compared with the average for 2017 participating companies.
Figure 32:
Regional averages for the quantity of oil discharged per unit of hydrocarbon production in 2017 varied,onshore (see Figure 33), from minimum levels in Europe, to 3.2 t/106 t in Asia/Australasia. Offshore(Figure 34) they varied from almost zero in Russia & Central Asia, to 25.5 t/106 t in South & CentralAmerica.
The difference between the overall averages onshore and offshore reflects the fact that produced water islargely re-injected onshore (where environmental sensitivities to produced water – especially saline water– are generally higher) while the offshore environment is generally less sensitive to produced waterdischarges.
Onshore Offshore OVERALL0
2
4
6
8
10
12
14
Tonn
es o
il di
scha
rged
per
milli
on to
nnes
pro
duct
ion
Oil discharged per unit of hydrocarbon production(2014–2018)
2014 2015 2016 2017 2018
IOGP environmental performance indicators – 2018 data
/ 31

Figure 33:
Figure 34:
Africa Asia/
Australasia
Europe MiddleEast
NorthAmerica
Russia&
CentralAsia
South&
CentralAmerica
0
0.5
1
1.5
2
2.5
3
3.5
4
Tonn
es o
il pe
r milli
on to
nnes
of p
rodu
ctio
n
Oil discharged per unit of hydrocarbon production onshore by region(2016–2018)
2016 2017 2018 2018 overall
Africa Asia/
Australasia
Europe MiddleEast
NorthAmerica
Russia&
CentralAsia
South&
CentralAmerica
0
5
10
15
20
25
30
35
Tonn
es o
il pe
r milli
on to
nnes
of p
rodu
ctio
n
Oil discharged per unit of hydrocarbon production offshore by region(2016–2018)
2016 2017 2018 2018 overall
IOGP environmental performance indicators – 2018 data
/ 32

4.3 Produced water injection
As stated previously, produced water is often injected back into producing reservoirs (reinjection) toimprove hydrocarbon recovery or into other geological strata for disposal.
Figure 35:
* total produced water generated: produced water discharged + produced water re-injected.
Onshore, where disposal to surface is often constrained by regulatory and environmental concerns,injection of produced water for beneficial reuse or for final disposal are the most common managementmethods. In 2018, 86% of water produced from onshore assets was returned below ground in data setswhere the volumes of re-injected water were provided by reporting companies (see Figure 35).
Offshore, de-oiled produced water can typically be discharged to sea with limited impact, therefore thereis much less reinjection (32% in 2018 for data sets with reinjection data). Nevertheless reinjection may bepursued in locations where it would be beneficial to the management of the reservoir and water chemistryallows for reinjection or where environmental sensitivity is considered to be high.
While the average is 32% offshore, there is a large variation between the regions. For example,participating companies in the Russia & Central Asia region reported that more than 100% of the offshoreproduced water was reinjected, while in North America less than 7% of offshore produced water wasreinjected by participating companies in 2018.
Onshore Offshore OVERALL0
10
20
30
40
50
60
70
80
90
Perc
ent o
f pro
duce
d w
ater
re-in
ject
ed o
vera
llex
pres
sed
as p
erce
nt to
tal p
rodu
ced
wat
er g
ener
ated
Percent of produced water re-injected overallexpressed as percent of total produced water generated*
(2014–2018)
2014 2015 2016 2017 2018
IOGP environmental performance indicators – 2018 data
/ 33

5. Non-aqueous drilling fluids retained on cuttingsdischarged to sea
While much of the drilling in the offshore oil and gas industry is achieved using water-based drilling fluids(muds), technical challenges often require the use of non-aqueous drilling fluids (NADF) that providehigher lubricity, better performance at higher temperatures and enhanced well-bore stability comparedwith water-based muds.
These challenges arise especially with techniques such as extended-reach and directional drilling, eitheror both of which may be required to develop new reservoirs or to improve recovery from previouslyidentified resources.
IOGP reports non-aqueous base fluids (NABFs) according to the classifications in Table 3.
Table 3. NABF classifications
Classification Base fluid Aromatic (%) PAH (%)Group I Diesel and Conventional Mineral Oil >5.0 >0.35Group II Low Toxicity Mineral Oil 0.5 – 5.0 0.001 – 0.35
Group III Enhanced Mineral OilSynthetics (esters, olefins, paraffins) <0.5 <0.001
Classification is defined in IOGP report "Environmental Aspects Of The Use of Non Aqueous Drilling Fluids Associated With Offshore Oil & GasOperations", Report No. 342, May 2003.
In the past, diesel-based and mineral oil-based fluids (Group I fluids) were used to address thesetechnical challenges, but it was recognized that the discharge of cuttings with adhering diesel or oil-based muds might cause adverse environmental impacts.
Less harmful low-toxicity mineral oil fluids (Group II, with reduced aromatic content) and later moresophisticated drilling fluids (Group III, with low to negligible aromatic content) were developed to deliverhigh drilling performance while ensuring that any discharges of drilling fluids adhering to cuttings orwhole mud posed minimal threat to the marine environment.
Non-aqueous drilling fluids (NADF) contain more than 30% non-aqueous base fluid (NABF) as acontinuous phase (typically 50%–80% by volume). The remainder consists of brine, barite and othermaterials such as gels and emulsifiers.
The data gathered for this report relate to NABF adhering to cuttings that are discharged to the marineenvironment. NADFs as such are not directly discharged.
Figure 36 provides a regional view of adhered base fluid quantities on cuttings discharged to the sea whiledrilling with NADFs. Absolute values rather than normalised values are shown in Figure 36, becausedrilling activity is not directly linked to hydrocarbon production. The number of wells drilled in a given yearis influenced by many factors including the prices of oil and natural gas as well as other economicfactors. Absolute volumes reported can also vary with the number or mix of companies contributingcuttings-related data between years.
Information on NABF discharges in 2018 has been provided by 21 of the 30 companies that reportedoffshore hydrocarbon production.
Analysis shows, for the companies reporting NABF retained on cuttings in 2018, that most cuttingsdischarges included Group III fluids (4763 tonnes, 89% of the total reported), whereas discharges ofcuttings with Group II fluids were limited (7% of the total reported). No discharges of cuttings with Group Ifluids were reported.
IOGP environmental performance indicators – 2018 data
/ 34

Figure 36:
Note: NABF discharges were reported by [22] of the [26] companies that reported offshore hydrocarbon production in 2018.
[No Group 1 NABF discharges to the sea were reported in the years 2008–2017].
2016
2017
2018
2016
2017
2018
2016
2017
2018
2016
2017
2018
2016
2017
2018
2016
2017
2018
2016
2017
2018
2016
2017
2018
Africa
Asia/
Australasia
Europe
MiddleEast
NorthAmerica
Russia&
CentralAsia
South&
CentralAmerica
OVERALL(All
regions)
0 2000 4000 6000 8000 10000 12000 14000Tonnes
462
257
319
5225
3508
1207
110
2227
7
0
0
0
600
859
2351
96
23
0
10322
2026
1439
8900
5323
Total base fluid (NABF) retainedon cuttings discharged to the sea by region (2018)
NABF Group II NABF Group III NABF Unspecified Sum Total
IOGP environmental performance indicators – 2018 data
/ 35
6. SpillsSpills are an important environmental performance indicator for the oil and gas industry since they canhave a significant and visible impact on the environment. The environmental impact is highly dependenton the nature of the release, where it occurred, and how it was subsequently managed. Most oilexploration and production companies have spill contingency plans and measures in place to respond toand mitigate spills.
For the purpose of this report, a spill is defined as any loss of containment from which the releasedmaterial reaches the environment (i.e., is not retained within secondary or other containment). Thevolume reported represents the total volume that reached the environment, irrespective of quantity ofreleased material that may be recovered.
Spills may have a number of causes such as equipment failure (including corrosion), operating errors,and unlawful third party damage such as sabotage, terrorism and theft.
The majority of spills reported by IOGP member companies are oil spills, which include spills of crude,condensate and processed oil.
For this report ‘onshore’ refers to operations that take place within a landmass, including swamps, lakes,rivers and estuaries, but excluding major inland seas.
For this report ‘offshore’ refers to operations that take place at sea, including inland seas directlyconnecting to oceans. Operations in bays, in major inland seas, e.g., the Caspian Sea, or in other inlandseas directly connected to oceans are counted as offshore.
IOGP environmental performance indicators – 2018 data
/ 36

6.1 Oil spills
In 2018, companies reported a total of 7292 oil spills. Of these, 6170 (84%) were spills of less than onebarrel in volume, amounting to a total of 81 tonnes of oil.
Because of the small cumulative volume involved and, as some companies do not report spills less than 1barrel in size, these <1 barrel size spills are not included in the detailed analysis provided below.
In 2018, 1122 spills greater than 1 barrel in size were reported, representing a total of 5205 tonnes of oil.87% of the reported oil spills greater than 1 barrel in size (4586 tonnes) occurred “onshore” (i.e., fromassets supporting production of onshore reservoirs) and 9% occurred “offshore” (i.e., from assetssupporting production from offshore reservoirs) (414 tonnes). The location was not specified for theremaining 4% (206 tonnes).
Figure 37 shows the total number of oil spills normalised per unit of hydrocarbon production onshore andoffshore. The normalized rate for 2018 was 0.5 oil spills per million tonnes of production (0.5 in 2017, 0.4in 2016). The normalized rate of spills offshore is lower than that onshore.
Figure 37:
Onshore Offshore Unspecified OVERALL0
0.5
1
1.5
2
2.5
Oil
spills
per
milli
on to
nnes
pro
duct
ion
Number of oil spills >1 barrel in size per unit of hydrocarbon production(2014–2018)
2014 2015 2016 2017 2018
IOGP environmental performance indicators – 2018 data
/ 37

Figure 38 shows the number of oil spills normalised per unit hydrocarbon production by region.
Figure 38:
The quantity of oil spilled per unit of hydrocarbon production in 2018 shown in Figure 39.
Figure 39:
Africa Asia/
Australasia
Europe MiddleEast
NorthAmerica
Russia&
CentralAsia
South&
CentralAmerica
0
0.2
0.4
0.6
0.8
1
1.2
1.4
1.6
1.8
2
Oil
spills
per
milli
on to
nnes
pro
duct
ion
Number of oil spills >1 barrel in size per unit of hydrocarbon production by region(2016–2018)
2016 2017 2018 2018 overall
Onshore Offshore Unspecified OVERALL0
2
4
6
8
10
12
14
16
18
20
Tonn
es o
f oil
spille
d pe
r milli
on to
nnes
pro
duct
ion
Quantity of oil spilled per unit of hydrocarbon production(2014–2018)
2014 2015 2016 2017 2018
IOGP environmental performance indicators – 2018 data
/ 38

Figure 40:
Figure 41:
Africa Asia/
Australasia
Europe MiddleEast
NorthAmerica
Russia&
CentralAsia
South&
CentralAmerica
0
2
4
6
8
10
12
14
Tonn
es o
f oil
spille
d pe
r milli
on to
nnes
pro
duct
ion
Quantity of oil spilled per unit of hydrocarbon production by region(2016–2018)
2016 2017 2018 2018 overall
1-10barrel
10-100barrel
>100barrel
Unspecified(excl.spills
<1bbl)
0
100
200
300
400
500
600
700
800
Num
ber o
f spi
lls
Number of oil spills by location and spill size(2018)
Onshore Offshore Unspecified
IOGP environmental performance indicators – 2018 data
/ 39

Figure 42 shows the distribution of oil spills larger than 1 barrel in terms of number of spills in each sizecategory for 2018. In terms of number of events, the distribution is dominated by the number of spillsbetween 1 and 10 barrels in size. However, as indicated in Figure 45, the quantity released overall (forthose spills where a size category was specified) is dominated by a few relatively large events; spills >100barrels in size resulted in 70% of the oil volume reported spilled in 2018 for spills >1 barrel.
In addition to the data shown in Figure 42, a total of 6170 oil spills (3737 onshore, 2432 offshore and 1unspecified location) of less than 1 barrel in size were reported by participating companies. These werenot included in the analyses for the reasons stated previously.
Figure 42:
1-10barrel
10-100barrel
>100barrel
Unspecifiedsize
0
500
1000
1500
2000
2500
3000
3500
4000
Qua
ntity
of s
pills
Quantity of oil spilled by location and spill size(2018)
Onshore Offshore Unspecified
IOGP environmental performance indicators – 2018 data
/ 40

6.1.1 Oil spills greater than 100 barrels in size
In 2018, participating companies reported 69 spills in which a volume of more than 100 barrels of oil wasreleased (67 onshore, 2 offshore and 0 unspecified location), collectively amounting to 3662 tonnesreleased. Participating companies provided incident descriptions for all of the 69 individual incidents.
The 2 largest of the 69 were:
292 tonnes (~2181 barrels) of crude oil was spilled as the result of third party damage (sabotage,theft, vandalism, etc) in Africa.271 tonnes (~2022 barrels) of crude oil was spilled as the result of Unknown in North America.
Cause (excluding intentional third party damage)
A specific cause was provided for 69 of the oil spills >100 barrels in size in 2018.
Excluding those categorized as third party damage, the remaining 39 spills >100 barrels in size werecollectively associated with 58% of the total oil spilled in the larger incidents for which the cause wasreported.
Figure 43 shows the distribution of cause, where reported, for operational spill incidents >100 barrels insize for 2018.
Corrosion was the leading cause reported for 2018 of larger operational spills that were not induced bythird parties.
Figure 43:
Intentional third party damage (sabotage, theft, vandalism, etc)
Incidents caused by third party damage account for 30 (43%) of the oil spills >100 barrels in size where thecause was reported in 2018. These third party induced spills represent 42% of the oil spills >100 barrels insize for which the cause was reported, and 29% of the total volume reported for all spills >1 barrel in sizein 2018.
Operational oil spills >100 barrels in size by causeexcluding third party damage
as % of oil spill incidents >100 barrelswhere cause was indicated
(2018)
Equipment failure(excluding corrosion)
8 %
Corrosion74 %
'Operator ortechnical error'
8 %
Other10 %
IOGP environmental performance indicators – 2018 data
/ 41

6.1.2 Oil spills between 10 and 100 barrels in sizeIn 2018, 238 oil spills between 10 and 100 barrels in size were reported in total (214 onshore, 21 offshoreand 3 unspecified location), representing 996 tonnes of oil.
Participating companies provided a specific cause for 236 (99%) of the 238 individual incidents.
Cause (excluding intentional third party damage)
78% of the 236 oil spills in the 10-100 barrels size category with a specific cause identified wereoperational spills not induced by third party damage, and they collectively represent 764 tonnes of oilspilled.
For spills in the 10-100 bbl size range, corrosion was the leading cause reported.
Figure 44 shows the distribution of cause, where the cause was reported, for operational oil spill incidentsbetween 10 and 100 barrels in size for 2018.
Figure 44:
Intentional third party damage (sabotage, theft, vandalism, etc.)
Incidents caused by third party damage account for 51 (22%) of the spills 10-100 barrels in size where thecause was reported in 2018. These spills caused by third parties represent 226 tonnes of oil, or 23% of thevolume reported for cause-specified events in this spill size category.
Operational oil spills 10-100 barrels in size by causeexcluding third party damage
as % of oil spill incidents 10-100 barrelswhere cause was indicated
(2018)
Equipment failure(excluding corrosion)
14 %
Corrosion59 %
'Operator ortechnical error'
16 %
Other11 %
IOGP environmental performance indicators – 2018 data
/ 42

6.2 Chemical spills
In the E&P sector chemical spills with release to the external environment occur less frequently andquantities released are generally small.
In 2018 participating companies reported 302 chemical spills greater than 1 barrel in size, totalling 3045tonnes. Data for these are presented in Tables A.32 and A.33 in Appendix A. Included in these data forsome reporting companies are spills of produced water.
Figure 45 shows the total number of chemical spills normalised per unit of hydrocarbon productiononshore and offshore. The normalised rate for 2018 was 0.2 chemical spills per million tonnes ofproduction (0.2 in 2017, 0.2 in 2016).
Figure 45:
Onshore Offshore Unspecified OVERALL0
0.1
0.2
0.3
0.4
0.5
0.6
0.7
0.8
0.9
1
Che
mic
al s
pills
per
milli
on to
nnes
pro
duct
ion
Number of Chemical spills >1 barrel in size per unit of hydrocarbon production(2014–2018)
2014 2015 2016 2017 2018
IOGP environmental performance indicators – 2018 data
/ 43

7. Fresh waterThe definition of fresh water varies in accordance with local statutes and regulations. Where it is notdefined by local regulations, fresh water is defined for reporting purposes as non-brackish water and mayinclude drinking water, potable water, water used in agriculture, etc. The total dissolved solids (TDS)concentration of this water type is up to 2000 mg/l.
Normalised results for fresh water withdrawn for the purpose of use per unit of hydrocarbon productionare shown in Figures 46 and 47.
Participating companies reported a total of 1.8 billion cubic metres of freshwater withdrawn for use. Thisequates to 112.9 cubic metres of fresh water for every thousand tonnes of hydrocarbon produced, asshown in Figure 48.
Figure 46:
In 2018 regional averages for quantity of fresh water withdrawn for the purpose of use expressed per unitof production varied from 4.1 to 488.2 cubic metres per thousand tonnes of hydrocarbon production. Theincrease in 2017 in the Russia & Central Asia region is attributable to the introduction of new data.
2014 2015 2016 2017 20180
20
40
60
80
100
120
140
Cub
ic m
etre
s fre
sh w
ater
per t
hous
and
tonn
es p
rodu
ctio
n
Fresh water withdrawn for the purpose of useper unit of hydrocarbon production
(2014–2018)
IOGP environmental performance indicators – 2018 data
/ 44

Figure 47:
28 of the 36 companies that provided water withdrawal data in 2018 provided data broken down by source(33 in 2017, 23 in 2016, 15 in 2015 and 14 in 2014). This represents 90% of the total reported fresh waterwithdrawn in 2018 (82% in 2017, 77% in 2016, 93% in 2015 and 89% in 2014). See Figure 48.
Figure 48:
Africa Asia/
Australasia
Europe MiddleEast
NorthAmerica
Russia&
CentralAsia
South&
CentralAmerica
0
100
200
300
400
500
600
Cub
ic m
etre
s fre
sh w
ater
per t
hous
and
tonn
es p
rodu
ctio
nFresh water withdrawn for the purpose of useper unit of hydrocarbon production - by region
(2014–2018)
2016 2017 2018 2018 Overall
2014 2015 2016 2017 20180 %
20 %
40 %
60 %
80 %
100 %
Sum
of f
resh
wat
erw
ithdr
awn
from
the
envi
ronm
ent
Fresh water withdrawn for the purpose of use - by source(2014–2018)
Treated municipal wastewaterCaptured rainwaterOther sourcesMunicipal water suppliesGroundwaterSurface water
IOGP environmental performance indicators – 2018 data
/ 45

Appendix A: Data tables
Scope of data submissions
Table A.1: Production associated with IOGP database and 2018 production in BP StatisticalReview of World Energy 2019 - by region (Figures 3 and 4)
Production (Mt) = Million tonnes hydrocarbon production
NB: Production figures given in this report relate to ‘gross production’ whereas world data extracted from the BP Statistical Review of World Energy
represent ‘net production’. Thus the data are not directly comparable, but the ‘percentage of world production’ figures are given as indicative of the
relative regional contributions in the database.
2018 Africa 349.00 592 59%
2018 Asia / Australasia 304.00 905 34%
2018 Europe 316.00 378 83%
2018 Middle East 464.00 2,081 22%
2018 North America 301.00 1,933 16%
2018 Russia & Central Asia 143.00 1,424 10%
2018 South & Central America 254.00 487 52%
2018 SUM TOTAL 2,131.00 7,800 27%
2017 Africa 328.00 577 57%
2017 Asia / Australasia 291.00 898 32%
2017 Europe 305.00 371 82%
2017 Middle East 451.00 2,049 22%
2017 North America 307.00 1,735 18%
2017 Russia & Central Asia 134.00 1,401 10%
2017 South & Central America 256.00 522 49%
2017 SUM TOTAL 2,073.00 7,552 27%
2016 Africa 304.00 562 54%
2016 Asia / Australasia 294.00 905 32%
2016 Europe 315.00 383 82%
2016 Middle East 472.00 2,071 23%
2016 North America 298.00 1,753 17%
2016 Russia & Central Asia 106.00 1,378 8%
2016 South & Central America 243.00 544 45%
2016 SUM TOTAL 2,032.00 7,595 27%
Year RegionProduction in this
report (Mt)Production in BP Statistical Review of
world Energy (Mt)Production as % of production in BP Statistical
Review of World Energy
IOGP environmental performance indicators – 2018 data
/ 46

Detailed review
Gaseous emissions
Table A.2: Emissions per unit of hydrocarbon production
Prod'n Mt = Million tonnes hydrocarbon production, t/1000t = tonnes per thousand tonnes
NB: Data only included where gas quantity and production level are both reported.
Table A.3: Gross emissions of gasses by region
2018 129 2126 0.73 2082 0.40 2005 0.21 2114 0.33 2125 148
2017 133 2061 0.75 1989 0.44 1902 0.20 1990 0.37 1999 151
2016 129 2028 0.89 1984 0.43 1922 0.18 1986 0.35 1986 151
2015 129 2124 0.87 2077 0.42 2009 0.20 2077 0.38 2080 151
2014 134 2081 0.91 2033 0.50 1930 0.19 1994 0.44 2030 157
YearCO2 CH4 NMVOC SO2 NOX GHG*
t/1000t Prod'n Mt t/1000t Prod'n Mt t/1000t Prod'n Mt t/1000t Prod'n Mt t/1000t Prod'n Mt t/1000t
2018 Africa 59.02 67.76 349.68 138.66 18.61 135.44
2018 Asia / Australasia 58.44 65.40 278.56 100.76 13.70 112.69
2018 Europe 26.61 29.33 108.70 63.12 6.85 86.15
2018 Middle East 29.94 31.22 51.05 95.80 334.08 77.92
2018 North America 59.99 70.75 430.28 159.98 30.91 157.70
2018 Russia & Central Asia 14.17 18.44 170.96 13.09 25.93 30.21
2018 South & Central America 28.11 31.63 140.80 228.07 16.09 121.75
2018 OVERALL (All regions) 276.28 314.53 1,530.03 799.49 446.18 721.85
Year RegionMillion tonnes Thousand tonnes
CO2 GHG* CH4 NMVOC SO2 NOX
IOGP environmental performance indicators – 2018 data
/ 47

Table A.4: Emissions per unit of production
NB: Data only included where gas quantity and production level are both reported.
South & Central America CO2 110.26 111.21 112.00 252 256 243
South & Central America CH4 0.56 0.57 0.64 252 253 243
South & Central America NMVOC 0.99 0.86 0.72 231 221 209
South & Central America SO2 0.06 0.07 0.08 252 221 209
South & Central America NOX 0.47 0.58 0.43 252 221 209
South & Central America GHG 124.26 125.46 128.00
Russia & Central Asia CO2 96.63 101.84 99.19 143 128 106
Russia & Central Asia CH4 1.19 0.61 0.38 143 128 106
Russia & Central Asia NMVOC 0.08 0.09 0.08 120 105 106
Russia & Central Asia SO2 0.18 0.23 0.18 143 128 106
Russia & Central Asia NOX 0.20 0.24 0.22 143 128 106
Russia & Central Asia GHG 126.38 117.09 108.69
North America CO2 198.85 204.32 201.42 301 307 298
North America CH4 1.43 1.67 2.41 301 282 298
North America NMVOC 0.53 0.45 0.55 301 282 298
North America SO2 0.10 0.12 0.15 301 282 298
North America NOX 0.52 0.58 0.56 301 282 298
North America GHG 234.60 246.07 261.67
Middle East CO2 64.47 68.93 48.41 464 449 472
Middle East CH4 0.11 0.12 0.10 464 449 472
Middle East NMVOC 0.22 0.27 0.30 442 429 452
Middle East SO2 0.72 0.62 0.50 462 449 472
Middle East NOX 0.17 0.16 0.11 464 449 472
Middle East GHG 67.22 71.93 50.91
Europe CO2 84.10 83.22 87.80 316 305 315
Europe CH4 0.34 0.36 0.42 316 305 315
Europe NMVOC 0.20 0.24 0.26 316 305 315
Europe SO2 0.02 0.02 0.02 316 305 315
Europe NOX 0.27 0.32 0.35 316 305 315
Europe GHG 92.60 92.22 98.30
Asia / Australasia CO2 192.27 183.86 173.70 304 291 294
Asia / Australasia CH4 1.07 1.31 1.40 260 247 249
Asia / Australasia NMVOC 0.39 0.73 0.49 258 244 247
Asia / Australasia SO2 0.05 0.04 0.07 302 289 291
Asia / Australasia NOX 0.37 0.44 0.42 302 289 291
Asia / Australasia GHG 219.02 216.61 208.70
Africa CO2 169.73 182.60 205.78 347 324 300
Africa CH4 1.01 0.96 1.09 347 324 300
Africa NMVOC 0.41 0.46 0.53 338 315 295
Africa SO2 0.05 0.04 0.05 338 315 295
Africa NOX 0.38 0.39 0.44 347 324 295
Africa GHG 194.98 206.60 233.03
Region EmissionsTonnes per thousand tonnes Million tonnes production**
2018 2017 2016 2018 2017 2016
IOGP environmental performance indicators – 2018 data
/ 48

Table A.5: Emissions by source
Table A.6: Gas emissions in production activities per unit of hydrocarbon production – onshoreand offshore
Prod'n Mt = Million tonnes hydrocarbon production, t/1000t = tonnes per thousand tonnes
NB: Data only included where gas quantity and production level are both reported.
*GHG: Total greenhouse gases (CO2 + CH4 expressed in CO2 equivalent: GHG = CO2 + (25 x CH4))**"Production for [gas] normalization (Mt)" = production included in calculation of [gas] per unit of production (million tonnes)
2018 Energy/Fuel combustion 128.02 130.26 89.70 27.61 422.24
2018 Flare 42.27 48.08 232.74 107.48 21.64
2018 Process vents 9.47 26.87 695.95 380.66 0.77
2018 Fugitive losses 0.05 4.69 185.55 70.84 0.02
2018 Other/Unspecified E&P 96.48 104.63 326.08 212.91 277.18
2018 SUM TOTAL 276.28 314.53 1,530.03 799.49 721.85
2017 Energy/Fuel combustion 123.55 125.70 85.97 19.37 439.64
2017 Flare 44.11 48.77 186.23 103.22 19.52
2017 Process vents 11.50 26.05 581.89 262.05 0.03
2017 Fugitive losses 1.53 7.58 241.90 109.42 2.87
2017 Other/Unspecified E&P 93.68 103.70 400.69 343.34 297.55
2017 SUM TOTAL 274.37 311.78 1,496.68 837.39 759.61
2016 Energy/Fuel combustion 113.61 115.55 77.46 52.46 393.00
2016 Flare 42.57 47.53 198.75 106.62 20.94
2016 Process vents 9.67 24.49 592.90 208.37 0.23
2016 Fugitive losses 0.04 6.13 243.28 91.64 0.01
2016 Other/Unspecified E&P 96.34 112.81 658.74 362.56 295.25
2016 SUM TOTAL 262.23 306.51 1,771.13 821.65 709.43
Year SourceMillion tonnes Thousand tonnes
CO2 GHG* CH4 NMVOC NOX
2018 Offshore 115 1073 0.62 1028 0.44 1019 0.08 1064 0.35 1072 131
2018 Onshore 133 870 0.88 870 0.38 803 0.41 867 0.30 869 149
2017 Offshore 116 1039 0.63 996 0.44 987 0.09 1030 0.37 1039 134
2017 Onshore 140 832 0.90 828 0.37 749 0.37 794 0.36 794 158
2016 Offshore 120 1038 0.67 994 0.35 987 0.08 1033 0.36 1033 149
2016 Onshore 131 854 1.15 854 0.52 799 0.33 817 0.35 817 160
2015 Offshore 122 1039 0.58 993 0.34 987 0.12 1030 0.37 1033 137
2015 Onshore 135 910 1.16 910 0.52 847 0.33 872 0.39 872 150
2014 Offshore 121 1043 0.57 1000 0.44 973 0.10 1017 0.43 1028 141
2014 Onshore 151 842 1.33 838 0.63 761 0.33 782 0.47 807 171
Year RegionCO2 CH4 NMVOC SO2 NOX GHG*
t/1000t Prod'n Mt t/1000t Prod'n Mt t/1000t Prod'n Mt t/1000t Prod'n Mt t/1000t Prod'n Mt t/1000t
IOGP environmental performance indicators – 2018 data
/ 49

Energy consumption
Table A.7: Energy consumed per unit of hydrocarbon production (Figure 25)
Production (Mt) = Million tonnes hydrocarbon production
NB: Data only included where energy and production level are both reported.
Production is the total hydrocarbon production for data sets where one of onsite, purchased or unspecified energy is reported.
Table A.8: Gross energy consumption – by region
2018 78% 7% 15% 1.48 2,118
2017 78% 6% 15% 1.45 1,883
2016 77% 8% 15% 1.44 2,030
2015 77% 8% 15% 1.43 2,124
YearPercent Total energy consumption
(Gigajoules per tonne) Production (Mt)Onsite combustion Purchased Unspecified
2018 Africa 404 5 94 504
2018 Asia / Australasia 329 23 183 535
2018 Europe 365 41 6 411
2018 Middle East 118 81 4 203
2018 North America 780 60 105 945
2018 Russia & Central Asia 145 9 55 209
2018 South & Central America 318 6 11 334
2018 OVERALL (Sum of regions) 2,458 226 457 3,142
2017 Africa 391 4 88 484
2017 Asia / Australasia 321 23 159 503
2017 Europe 347 39 8 393
2017 Middle East 104 50 5 159
2017 North America 776 47 98 921
2017 Russia & Central Asia 118 13 49 181
2017 South & Central America 95 0 10 105
2017 OVERALL (Sum of regions) 2,152 176 417 2,746
2016 Africa 378 20 85 482
2016 Asia / Australasia 346 24 133 502
2016 Europe 360 42 6 408
2016 Middle East 87 46 12 145
2016 North America 770 82 143 994
2016 Russia & Central Asia 91 1 52 144
2016 South & Central America 235 18 11 263
2016 OVERALL (Sum of regions) 2,267 231 440 2,938
Year RegionMillion Gigajoules
Onsite combustion Purchased Unspecified Total
IOGP environmental performance indicators – 2018 data
/ 50

Table A.9: Energy consumption per unit of hydrocarbon production – by region (Figure 26)
Production (Mt) = Million tonnes hydrocarbon production
NB: Data only included where energy and production level are both reported.
Production is the total hydrocarbon production for data sets where one of onsite, purchased or unspecified energy is reported.
Table A.10: Energy consumption per unit of hydrocarbon production – onshore and offshore
Production (Mt) = Million tonnes hydrocarbon production
NB: Data only included where energy and production level are both reported.
Production is the total hydrocarbon production for data sets where one of onsite, purchased or unspecified energy is reported.
2018 Africa 80% 1% 19% 1.45 347
2018 Asia / Australasia 62% 4% 34% 1.77 302
2018 Europe 89% 10% 1% 1.30 316
2018 Middle East 58% 40% 2% 0.44 462
2018 North America 83% 6% 11% 3.15 300
2018 Russia & Central Asia 68% 4% 27% 1.42 143
2018 South & Central America 96% 2% 3% 1.33 248
2018 OVERALL (All regions) 78% 7% 15% 1.48 2,118
2017 Africa 81% 1% 18% 1.48 324
2017 Asia / Australasia 64% 5% 32% 1.73 290
2017 Europe 88% 10% 2% 1.29 305
2017 Middle East 65% 32% 3% 0.35 451
2017 North America 84% 5% 11% 3.28 281
2017 Russia & Central Asia 65% 8% 28% 1.32 134
2017 South & Central America 90% 0% 10% 1.07 98
2017 OVERALL (All regions) 78% 6% 15% 1.45 1,883
2016 Africa 78% 4% 18% 1.58 304
2016 Asia / Australasia 69% 5% 27% 1.71 293
2016 Europe 88% 10% 1% 1.30 315
2016 Middle East 60% 32% 8% 0.30 472
2016 North America 77% 8% 14% 3.35 297
2016 Russia & Central Asia 62% 1% 37% 1.31 106
2016 South & Central America 89% 7% 4% 1.08 243
2016 OVERALL (All regions) 77% 8% 15% 1.44 2,030
Year Region
Percent Total energyconsumption
(Gigajoules per tonne) Production (Mt)Onsite combustion Purchased Unspecified
2018 Onshore (All regions) 74% 13% 13% 1.65 862
2018 Offshore (All regions) 90% 2% 8% 1.27 1,072
2018 Unspecified (All regions) 49% 4% 47% 1.86 183
2018 OVERALL (All regions) 78% 7% 15% 1.48 2,118
2017 Onshore (All regions) 74% 10% 16% 1.71 819
2017 Offshore (All regions) 88% 2% 10% 1.21 899
2017 Unspecified (All regions) 63% 6% 31% 1.53 165
2017 OVERALL (All regions) 78% 6% 15% 1.45 1,883
2016 Onshore (All regions) 69% 11% 19% 1.74 856
2016 Offshore (All regions) 87% 4% 9% 1.19 1,038
2016 Unspecified (All regions) 74% 9% 18% 1.50 136
2016 OVERALL (All regions) 77% 8% 15% 1.44 2,030
Year Location
Percent Total energyconsumption
(Gigajoules per tonne) Production (Mt)Onsite combustion Purchased Unspecified
IOGP environmental performance indicators – 2018 data
/ 51

IOGP environmental performance indicators – 2018 data
/ 52

Flaring
Table A.11: Hydrocarbon flared per unit of production (Figure 27)
Production (Mt) = Million tonnes hydrocarbon production, t/1000t = Tonnes per thousand tonnes
NB: Data only included where flaring and production level are both reported.
Production is the total hydrocarbon production for data sets where flaring is reported.
2018 10.51 2125
2017 12.07 2057
2016 12.94 2028
2015 13.61 2097
2014 14.84 2076
Year Total flared (t/1000t) Production (Mt)
IOGP environmental performance indicators – 2018 data
/ 53

Table A.12: Flaring per unit of hydrocarbon production – by region (Figure 28)
Production (Mt) = Million tonnes hydrocarbon production, t/1000t = Tonnes per thousand tonnes
NB: Data only included where flaring and production level are both reported.
Production is the total hydrocarbon production for data sets where flaring is reported.
2018 Africa 29.55 347
2018 Asia / Australasia 14.34 304
2018 Europe 3.24 316
2018 Middle East 4.14 464
2018 North America 7.92 301
2018 Russia & Central Asia 5.84 143
2018 South & Central America 6.30 251
2018 OVERALL (All Regions) 10.51 2125
2017 Africa 35.64 324
2017 Asia / Australasia 19.56 288
2017 Europe 2.87 305
2017 Middle East 5.03 451
2017 North America 6.48 307
2017 Russia & Central Asia 7.78 128
2017 South & Central America 5.98 253
2017 OVERALL (All Regions) 12.07 2057
2016 Africa 41.00 301
2016 Asia / Australasia 22.48 294
2016 Europe 3.60 315
2016 Middle East 3.34 472
2016 North America 6.95 298
2016 Russia & Central Asia 7.03 106
2016 South & Central America 7.42 243
2016 OVERALL (All Regions) 12.94 2028
Year Region Total flared (t/1000t) Production (Mt)
IOGP environmental performance indicators – 2018 data
/ 54

Produced water
Table A.13: Oil discharged per unit of produced water discharged (Figure 29)
NB: Data only included where oil in produced water and produced water quantity are both reported.
Table A.14: Oil content of produced water discharged (Figures 30 and 31)
NB: Data only included where oil discharges and produced water discharges are both reported
Table A.15: Oil discharged per unit of hydrocarbon production (Figure 32)
NB: Data only included where oil discharges and produced water discharges are both reported.
Onshore 10.26 8.46 5.84 3.89 5.22
Offshore 12.88 13.48 12.32 17.88 18.33
Unspecified 5.04 5.80 12.31 10.82 5.75
OVERALL 12.31 12.70 11.43 15.20 16.07
Milligrammes oil per litre of produced water discharged
2014 2015 2016 2017 2018
2018 Africa 18.64 16.26 5.99 14.58 10.73 109.31 26.54 146.57
2018 Asia / Australasia 8.27 13 35.96 12.85 8.1 239.39 0.03 247.52
2018 Europe 0 11.39 0.55 11.17 2.6 196.67 1.34 200.62
2018 Middle East 2.64 6.44 no data 2.99 94.94 9.44 no data 104.38
2018 North America 15.23 15.14 no data 15.15 3.35 22.2 no data 25.55
2018 Russia & Central Asia no data 45.73 no data 45.73 no data 0.02 no data 0.02
2018 South & Central America 34.68 40.83 0 40.74 1.92 135.37 0.03 137.32
2018 OVERALL (All regions) 5.22 18.33 5.75 16.07 121.64 712.41 27.93 861.98
2017 Africa 16.84 22.59 11.19 19.82 6 96.43 28.79 131.21
2017 Asia / Australasia 4.39 13.27 0 12.01 54.72 330.35 0.02 385.09
2017 Europe 0 11.78 1.85 11.56 2.46 178.38 1.09 181.93
2017 Middle East 2.03 8.17 no data 2.22 102.4 3.42 no data 105.81
2017 North America 14.42 13.65 no data 13.75 4.3 30.27 no data 34.57
2017 Russia & Central Asia no data 25.06 no data 25.06 no data 0.08 no data 0.08
2017 South & Central America 25.66 35.1 0 34.93 2.34 134.81 0.04 137.19
2017 OVERALL (All regions) 3.89 17.88 10.82 15.2 172.22 773.73 29.93 975.88
2016 Africa 7.73 15.39 13 13.98 16.51 96.05 31.8 144.37
2016 Asia / Australasia 2.23 12.28 no data 10.13 98.23 360.2 no data 458.43
2016 Europe 0.1 11.85 0.31 11.67 1.67 226.77 1.92 230.36
2016 Middle East 0 6.71 no data 6.64 0.03 3.05 no data 3.09
2016 North America 19.31 12.07 0 14.75 22.32 37.71 0.03 60.06
2016 Russia & Central Asia no data 41.13 no data 41.13 no data 0.41 no data 0.41
2016 South & Central America 15.27 11.08 48.97 11.21 3.48 128.52 0.04 132.04
2016 OVERALL (All regions) 5.84 12.32 12.31 11.43 142.26 852.71 33.79 1028.76
Year RegionOil discharged (t/Mt) Produced water (Mt)
Onshore Offshore Unspecified OVERALL Onshore Offshore Unspecified OVERALL
Onshore 2.04 1.36 1.38 0.86 0.78
Offshore 11.53 10.99 10.15 13.33 12.32
Unspecified 1.31 1.43 3.12 1.99 0.90
OVERALL 7.49 6.90 6.63 7.48 6.75
Tonnes per million tonnes
2014 2015 2016 2017 2018
IOGP environmental performance indicators – 2018 data
/ 55

Table A.16: Oil discharged per unit of hydrocarbon production – by region (Figures 33, 34)
NB: Data only included where oil discharges and produced water discharges are both reported
Table A.17: Percent of produced water re-injected overall (expressed as percent total producedwater generated*) (Figure 35)
* Total produced water generated: produced water discharged + produced water re-injected.
2018 Africa 2.86 10.3 1.53 6.16 70 172 104 346
2018 Asia / Australasia 0.91 18 0.02 10.97 73 172 43 289
2018 Europe 0 8.67 0.02 7.32 17 258 30 306
2018 Middle East 0.81 0.48 no data 0.71 315 126 no data 441
2018 North America 0.25 4.32 no data 1.39 200 77 no data 277
2018 Russia & Central Asia 0 0.02 no data 0.01 78 64 no data 143
2018 South & Central America 1.08 29.66 no data 22.55 61 186 no data 248
2018 OVERALL (All regions) 0.78 12.32 0.9 6.75 816 1059 178 2054
2017 Africa 2.45 12.07 3.25 8.11 41 180 99 320
2017 Asia / Australasia 3.16 23.32 0 15.96 76 188 25 289
2017 Europe 0 8.7 0.06 7.14 17 241 35 294
2017 Middle East 0.67 0.23 no data 0.55 307 121 no data 428
2017 North America 0.31 5.89 no data 1.77 197 70 no data 267
2017 Russia & Central Asia 0 0.04 no data 0.02 77 51 no data 128
2017 South & Central America 0.93 25.45 0 18.94 64 186 2 253
2017 OVERALL (All regions) 0.86 13.33 1.99 7.48 781 1038 162 1983
2016 Africa 3.44 8.36 4.78 6.72 37 176 86 300
2016 Asia / Australasia 2.37 22.78 0 15.97 92 194 3 290
2016 Europe 0.01 10.89 0.02 8.84 18 246 39 304
2016 Middle East 0 0.16 no data 0.07 171 124 no data 296
2016 North America 2.58 6.62 no data 3.75 167 68 no data 236
2016 Russia & Central Asia 0 0.32 no data 0.16 51 53 no data 105
2016 South & Central America 0.81 8.4 0.53 6.19 65 170 3 239
2016 OVERALL (All regions) 1.38 10.15 3.12 6.63 604 1035 133 1773
Year RegionOil discharged (t/Mt) Produced water (Mt)
Onshore Offshore Unspecified OVERALL Onshore Offshore Unspecified OVERALL
Onshore 86% 86% 72% 85% 82%
Offshore 32% 27% 25% 26% 27%
Unspecified 45% 86% 81% 45% 46%
OVERALL 57% 59% 46% 55% 53%
Percent of produced water re-injected
2018 2017 2016 2015 2014
IOGP environmental performance indicators – 2018 data
/ 56

Table A.18: Percent of produced water re-injected (expressed as percent total produced watergenerated*) – by region
2018 Africa 68% 33% 42% 68%
2018 Asia / Australasia 50% 34% 97% 50%
2018 Europe 96% 26% 71% 96%
2018 Middle East 54% 85% no data 54%
2018 North America 98% 7% no data 98%
2018 Russia & Central Asia 100% 100% no data 100%
2018 South & Central America 99% 13% 0% 99%
2018 OVERALL (All regions) 86% 32% 45% 57%
2017 Africa 74% 48% 53% 74%
2017 Asia / Australasia 43% 21% 100% 43%
2017 Europe 96% 26% 73% 96%
2017 Middle East 51% 92% no data 51%
2017 North America 100% 7% 100% 100%
2017 Russia & Central Asia 100% 99% no data 100%
2017 South & Central America 99% 13% no data 99%
2017 OVERALL (All regions) 86% 27% 86% 59%
2016 Africa 29% 43% 47% 29%
2016 Asia / Australasia 16% 17% no data 16%
2016 Europe 97% 24% 31% 97%
2016 Middle East 54% 94% no data 54%
2016 North America 80% 5% 100% 80%
2016 Russia & Central Asia 100% 94% no data 100%
2016 South & Central America 98% 13% no data 98%
2016 OVERALL (All regions) 72% 25% 81% 46%
Year RegionPercent of produced water re-injected
Onshore Offshore Unspecified OVERALL
IOGP environmental performance indicators – 2018 data
/ 57

Table A.19: Produced water re-injected per unit of hydrocarbon production – by region
Table A.20: Total oil discharged (discharges + spills) per unit of hydrocarbon production
2018 Africa 0.33 0.32 0.18 0.27 68 122 104 294
2018 Asia / Australasia 0.13 0.73 0.02 0.47 63 155 43 262
2018 Europe 5.14 0.27 0.21 0.5 15 258 33 306
2018 Middle East 0.34 0.42 no data 0.36 335 127 no data 462
2018 North America 1.26 0.02 no data 0.87 152 71 no data 223
2018 Russia & Central Asia 1.64 0.21 no data 1.08 78 51 no data 129
2018 South & Central America 3.97 0.11 no data 1.12 65 184 no data 249
2018 OVERALL (All regions) 1.03 0.32 0.15 0.59 777 967 180 1924
2017 Africa 0.53 0.37 0.26 0.36 43 105 72 221
2017 Asia / Australasia 0.23 0.6 0.5 0.52 38 139 4 181
2017 Europe 4.87 0.25 0.17 0.49 15 234 38 288
2017 Middle East 0.33 0.34 no data 0.33 327 121 no data 448
2017 North America 2.17 0.03 3.46 1.82 121 47 25 193
2017 Russia & Central Asia 3.52 0.2 no data 1.78 36 39 no data 75
2017 South & Central America 3.87 0.11 no data 1.12 67 182 no data 248
2017 OVERALL (All regions) 1.33 0.29 0.82 0.74 647 867 140 1654
2016 Africa 0.18 0.31 0.27 0.27 38 105 63 207
2016 Asia / Australasia 0.25 0.49 no data 0.43 44 141 no data 185
2016 Europe 3.57 0.28 0.11 0.48 20 237 42 300
2016 Middle East 0.28 0.38 no data 0.31 346 125 no data 470
2016 North America 1.15 0.02 no data 0.78 94 46 no data 140
2016 Russia & Central Asia 0.1 0.16 no data 0.15 12 42 no data 54
2016 South & Central America 3.42 0.12 no data 1.08 68 166 no data 234
2016 OVERALL (All regions) 0.85 0.28 0.21 0.5 623 862 105 1590
Year RegionProduced water re-injected (t/t) Production (Mt)
Onshore Offshore Unspecified OVERALL Onshore Offshore Unspecified OVERALL
2018 Onshore 6 816
2018 Offshore 13 1029
2018 Unspecified 2 178
2018 OVERALL 9 2023
2017 Onshore 5 755
2017 Offshore 14 1032
2017 Unspecified 6 163
2017 OVERALL 10 1950
2016 Onshore 5 597
2016 Offshore 11 1033
2016 Unspecified 4 133
2016 OVERALL 8 1764
Year Location discharged per unit production (t/Mt) Hydrocarbon production (Mt)
IOGP environmental performance indicators – 2018 data
/ 58

Non-aqueous drilling fluids retained on cuttings discharged to sea
Table A.21: Total base fluid (NABF) retained on cuttings discharged to sea (tonnes) – by region(Figure 36)
NB: Data only included where oil in produced water and produced water quantity are both reported.
2018 Africa 0 222 97 0 319
2018 Asia / Australasia 0 0 1207 0 1207
2018 Europe 0 7 0 0 7
2018 Russia & Central Asia 0 0 0 0 0
2018 Middle East 0 0 0 0 0
2018 North America 0 119 2232 0 2351
2018 South & Central America 0 18 1227 194 1439
2018 OVERALL (All regions) 0 366 4763 194 5323
2017 Africa 0 75 182 0 257
2017 Asia / Australasia 0 357 3151 0 3508
2017 Europe 0 4 2223 0 2227
2017 Russia & Central Asia 0 0 23 0 23
2017 Middle East 0 0 0 0 0
2017 North America 0 0 859 0 859
2017 South & Central America 0 0 2026 0 2026
2017 OVERALL (All regions) 0 436 8464 0 8900
2016 Africa 0 134 328 0 462
2016 Asia / Australasia 0 182 5043 0 5225
2016 Europe 0 4 89 17 110
2016 Russia & Central Asia 0 0 96 0 96
2016 Middle East 0 0 0 0 0
2016 North America 0 0 600 0 600
2016 South & Central America 0 73 10249 0 10322
2016 OVERALL (All regions) 0 393 16405 17 16815
Year RegionTonnes
Group I Group II Group III Unspecified SUM TOTAL
IOGP environmental performance indicators – 2018 data
/ 59

Spills
Table A.22: Number of oil spills >1 barrel in size and quantity spilled per unit of hydrocarbonproduction (Figures 37, 39)
NB: Data only included where quantity of oil spilt and production level are both reported.
Excludes spills <1 barrel in size.
2018 Onshore 1.12 5.26 870
2018 Offshore 0.09 0.4 1028
2018 Unspecified 0.27 1.14 180
2018 OVERALL 0.54 2.5 2079
2017 Onshore 0.9 4.04 788
2017 Offshore 0.09 0.24 1032
2017 Unspecified 1.08 17.49 188
2017 OVERALL 0.5 3.34 2007
2016 Onshore 0.8 3.02 850
2016 Offshore 0.09 0.49 1035
2016 Unspecified 0.49 1.11 136
2016 OVERALL 0.41 1.6 2021
2015 Onshore 1.54 8.43 890
2015 Offshore 0.09 0.32 1023
2015 Unspecified 0.25 0.79 174
2015 OVERALL 0.72 3.82 2087
2014 Onshore 1.91 7.65 796
2014 Offshore 0.13 0.37 1009
2014 Unspecified 0.42 0.84 144
2014 OVERALL 0.88 3.38 1948
Year LocationNumber of spills per
million tonnes Quantity spilled (tonnes/million tonnes) Production (million tonnes)
IOGP environmental performance indicators – 2018 data
/ 60

Table A.23: Number of oil spills >1 barrel in size and quantity spilled per unit of hydrocarbonproduction – by region (Figures 38, 39, 40)
2018 Africa Onshore 2.17 29.95 70
2018 Africa Offshore 0.11 0.21 174
2018 Africa Unspecified 0.39 1.9 104
2018 Africa OVERALL 0.61 6.69 349
2018 Asia / Australasia Onshore 0.23 1.03 74
2018 Asia / Australasia Offshore 0.21 0.53 173
2018 Asia / Australasia Unspecified 0.05 0.01 43
2018 Asia / Australasia OVERALL 0.19 0.58 290
2018 Europe Onshore 2.44 1.93 24
2018 Europe Offshore 0.1 0.24 256
2018 Europe Unspecified 0.15 0.23 33
2018 Europe OVERALL 0.29 0.37 313
2018 Middle East Onshore 0.2 0.93 335
2018 Middle East Offshore 0 0 127
2018 Middle East OVERALL 0.15 0.67 462
2018 North America Onshore 2.18 5.79 224
2018 North America Offshore 0.11 3.72 57
2018 North America OVERALL 1.76 5.37 281
2018 Russia & Central Asia Onshore 1.64 8.58 78
2018 Russia & Central Asia Offshore 0 0 55
2018 Russia & Central Asia OVERALL 0.96 5.03 133
2018 South & Central America Onshore 0.95 1.26 65
2018 South & Central America Offshore 0.04 0.03 187
2018 South & Central America OVERALL 0.28 0.35 252
2017 Africa Onshore 2.07 39.99 45
2017 Africa Offshore 0.12 0.72 180
2017 Africa Unspecified 0.29 3.14 99
2017 Africa OVERALL 0.44 6.89 324
2017 Asia / Australasia Onshore 0.18 0.05 78
2017 Asia / Australasia Offshore 0.09 0.08 188
2017 Asia / Australasia Unspecified 0.12 0.06 26
2017 Asia / Australasia OVERALL 0.12 0.07 291
2017 Europe Onshore 2.88 1.19 26
2017 Europe Offshore 0.15 0.32 241
2017 Europe Unspecified 0.11 9.36 35
2017 Europe OVERALL 0.38 1.46 302
2017 Middle East Onshore 0.22 0.89 309
2017 Middle East Offshore 0.01 0.01 121
2017 Middle East OVERALL 0.16 0.64 431
2017 North America Onshore 1.77 4.68 212
2017 North America Offshore 0.12 0.13 64
2017 North America Unspecified 6.68 105.67 25
2017 North America OVERALL 1.83 12.09 301
2017 Russia & Central Asia Onshore 0.11 0.2 54
2017 Russia & Central Asia Offshore 0.02 0.03 51
2017 Russia & Central Asia OVERALL 0.07 0.11 105
Year Region LocationNumber of spills
per million tonnesQuantity spilled (tonnes/million
tonnes)Production (million
tonnes)
IOGP environmental performance indicators – 2018 data
/ 61

Year Region LocationNumber of spills
per million tonnesQuantity spilled (tonnes/million
tonnes)Production (million
tonnes)
NB: Data only included for production level where oil quantities spilled and production are reported. If no spill count (including zeros) is provided,
the data are excluded from the analysis. This analysis could yield inflated values of spill intensity as some reporters may not report zeros for
datasets where no spill occurred. Excludes spills <1 barrel in size.
Table A.24: Quantity of oil spilled per spill onshore and offshore (tonnes) – by region
NB: Data only included where quantity of oil spilt and production level are both reported.
Excludes spills <1 barrel in size.
2017 South & Central America Onshore 1.22 1.23 64
2017 South & Central America Offshore 0.06 0.06 186
2017 South & Central America Unspecified 0 0 3
2017 South & Central America OVERALL 0.35 0.35 253
2016 Africa Onshore 1.98 22.19 41
2016 Africa Offshore 0.14 0.35 177
2016 Africa Unspecified 0.73 1.73 86
2016 Africa OVERALL 0.55 3.68 304
2016 Asia / Australasia Onshore 0.17 0.33 95
2016 Asia / Australasia Offshore 0.06 0.03 193
2016 Asia / Australasia Unspecified 1.01 0.26 4
2016 Asia / Australasia OVERALL 0.11 0.13 292
2016 Europe Onshore 2.8 3.13 25
2016 Europe Offshore 0.13 0.53 247
2016 Europe Unspecified 0 0 42
2016 Europe OVERALL 0.33 0.67 315
2016 Middle East Onshore 0.19 0.86 346
2016 Middle East Offshore 0.02 0.01 125
2016 Middle East OVERALL 0.15 0.63 471
2016 North America Onshore 1.5 4.22 229
2016 North America Offshore 0.12 4.26 69
2016 North America OVERALL 1.18 4.23 298
2016 Russia & Central Asia Onshore 0.19 0.15 53
2016 Russia & Central Asia Offshore 0.04 0.21 54
2016 Russia & Central Asia OVERALL 0.11 0.18 106
2016 South & Central America Onshore 1.42 4.57 62
2016 South & Central America Offshore 0.06 0.03 170
2016 South & Central America Unspecified 0 0 4
2016 South & Central America OVERALL 0.42 1.22 236
2018 Onshore 4.7 4585
2018 Offshore 4.1 414
2018 Unspecified 4.3 206
2018 OVERALL 4.6 5205
2017 Onshore 4.5 3184
2017 Offshore 2.5 245
2017 Unspecified 16.2 3285
2017 OVERALL 6.7 6713
2016 Onshore 3.8 2578
2016 Offshore 5.9 548
2016 Unspecified 2.2 151
2016 OVERALL 3.9 3277
Year Location Average size (tonnes) Quantity spilled (tonnes)
IOGP environmental performance indicators – 2018 data
/ 62

Table A.25: Distribution of oil spills onshore and offshore by size (Figures 41, 42)
2018 Onshore <1 barrel 3737 55
2018 Onshore 1-10 barrel 673 290
2018 Onshore 10-100 barrel 214 882
2018 Onshore >100 barrel 67 3386
2018 Onshore Unspecified (excl. spills <1bbl) 20 28
2018 Onshore OVERALL 4711 4640
2018 Offshore <1 barrel 2432 26
2018 Offshore 1-10 barrel 77 31
2018 Offshore 10-100 barrel 21 107
2018 Offshore >100 barrel 2 276
2018 Offshore Unspecified (excl. spills <1bbl) 0 0
2018 Offshore OVERALL 2532 439
2018 Unspecified <1 barrel 1 0
2018 Unspecified 1-10 barrel 7 2
2018 Unspecified 10-100 barrel 3 8
2018 Unspecified >100 barrel 0 0
2018 Unspecified Unspecified (excl. spills <1bbl) 38 196
2018 Unspecified OVERALL 49 206
2018 OVERALL <1 barrel 6170 81
2018 OVERALL 1-10 barrel 757 323
2018 OVERALL 10-100 barrel 238 996
2018 OVERALL >100 barrel 69 3662
2018 OVERALL Unspecified (excl. spills <1bbl) 58 224
2018 OVERALL OVERALL 7292 5286
2017 Onshore <1 barrel 4027 58
2017 Onshore 1-10 barrel 511 221
2017 Onshore 10-100 barrels 151 742
2017 Onshore >100 barrels 32 2207
2017 Onshore Unspecified (excl. spills <1bbl) 16 13
2017 Onshore OVERALL 4737 3242
2017 Offshore <1 barrel 404 6
2017 Offshore 1-10 barrel 62 27
2017 Offshore 10-100 barrels 28 80
2017 Offshore >100 barrels 3 137
2017 Offshore Unspecified (excl. spills <1bbl) 3 0
2017 Offshore OVERALL 500 251
2017 Unspecified <1 barrel 246 5
2017 Unspecified 1-10 barrel 132 46
2017 Unspecified 10-100 barrels 25 83
2017 Unspecified >100 barrels 16 2773
2017 Unspecified Unspecified (excl. spills <1bbl) 30 382
2017 Unspecified OVERALL 449 3290
2017 OVERALL <1 barrel 4677 69
2017 OVERALL 1-10 barrel 705 294
2017 OVERALL 10-100 barrels 204 906
2017 OVERALL >100 barrels 51 5118
2017 OVERALL Unspecified (excl. spills <1bbl) 49 396
2017 OVERALL OVERALL 5686 6782
Year Location Size Number of spills Quantity spilled (tonnes)
IOGP environmental performance indicators – 2018 data
/ 63

Year Location Size Number of spills Quantity spilled (tonnes)
NB: Overall excludes spills <1 barrel in size.
2016 Onshore <1 barrel 3276 48
2016 Onshore 1-10 barrel 452 210
2016 Onshore 10-100 barrels 173 666
2016 Onshore >100 barrels 35 1667
2016 Onshore Unspecified (excl. spills <1bbl) 22 35
2016 Onshore OVERALL 3958 2627
2016 Offshore <1 barrel 446 6
2016 Offshore 1-10 barrel 70 24
2016 Offshore 10-100 barrels 17 78
2016 Offshore >100 barrels 4 445
2016 Offshore Unspecified (excl. spills <1bbl) 2 0
2016 Offshore OVERALL 539 554
2016 Unspecified <1 barrel 0 0
2016 Unspecified 1-10 barrel 15 7
2016 Unspecified 10-100 barrels 2 9
2016 Unspecified >100 barrels 1 34
2016 Unspecified Unspecified (excl. spills <1bbl) 49 102
2016 Unspecified OVERALL 67 151
2016 OVERALL <1 barrel 3722 54
2016 OVERALL 1-10 barrel 537 241
2016 OVERALL 10-100 barrels 192 753
2016 OVERALL >100 barrels 40 2146
2016 OVERALL Unspecified (excl. spills <1bbl) 73 137
2016 OVERALL OVERALL 4564 3331
IOGP environmental performance indicators – 2018 data
/ 64

Table A.26: Distribution of oil spills by size - by region
2018 Africa <1 barrel 20 1
2018 Africa 1-10 barrel 73 33
2018 Africa 10-100 barrel 58 264
2018 Africa >100 barrel 31 1836
2018 Africa Unspecified (excl. spills <1bbl) 51 207
2018 Africa OVERALL 233 2341
2018 Asia / Australasia <1 barrel 2204 24
2018 Asia / Australasia 1-10 barrel 45 14
2018 Asia / Australasia 10-100 barrel 7 30
2018 Asia / Australasia >100 barrel 3 124
2018 Asia / Australasia Unspecified (excl. spills <1bbl) 0 0
2018 Asia / Australasia OVERALL 2259 192
2018 Europe <1 barrel 2394 28
2018 Europe 1-10 barrel 68 19
2018 Europe 10-100 barrel 15 82
2018 Europe >100 barrel 0 0
2018 Europe Unspecified (excl. spills <1bbl) 7 16
2018 Europe OVERALL 2484 145
2018 Middle East <1 barrel 15 1
2018 Middle East 1-10 barrel 56 36
2018 Middle East 10-100 barrel 9 28
2018 Middle East >100 barrel 3 246
2018 Middle East Unspecified (excl. spills <1bbl) 0 0
2018 Middle East OVERALL 83 311
2018 North America <1 barrel 648 11
2018 North America 1-10 barrel 374 142
2018 North America 10-100 barrel 99 366
2018 North America >100 barrel 21 1001
2018 North America Unspecified (excl. spills <1bbl) 0 0
2018 North America OVERALL 1142 1521
2018 Russia & Central Asia <1 barrel 99 4
2018 Russia & Central Asia 1-10 barrel 87 56
2018 Russia & Central Asia 10-100 barrel 35 183
2018 Russia & Central Asia >100 barrel 10 433
2018 Russia & Central Asia Unspecified (excl. spills <1bbl) 0 0
2018 Russia & Central Asia OVERALL 231 676
2018 South & Central America <1 barrel 790 13
2018 South & Central America 1-10 barrel 54 22
2018 South & Central America 10-100 barrel 15 43
2018 South & Central America >100 barrel 1 22
2018 South & Central America Unspecified (excl. spills <1bbl) 0 0
2018 South & Central America OVERALL 860 101
2017 Africa <1 barrel 88 4
2017 Africa 1-10 barrel 47 26
2017 Africa 10-100 barrels 35 175
2017 Africa >100 barrels 19 1966
2017 Africa Unspecified (excl. spills <1bbl) 43 67
2017 Africa OVERALL 232 2238
Year Region Size Number of spills Quantity spilled (tonnes)
IOGP environmental performance indicators – 2018 data
/ 65

Year Region Size Number of spills Quantity spilled (tonnes)
2017 Asia / Australasia <1 barrel 110 2
2017 Asia / Australasia 1-10 barrel 26 9
2017 Asia / Australasia 10-100 barrels 5 12
2017 Asia / Australasia >100 barrels 0 0
2017 Asia / Australasia Unspecified (excl. spills <1bbl) 3 0
2017 Asia / Australasia OVERALL 144 23
2017 Europe <1 barrel 2548 31
2017 Europe 1-10 barrel 92 27
2017 Europe 10-100 barrels 19 41
2017 Europe >100 barrels 1 43
2017 Europe Unspecified (excl. spills <1bbl) 3 328
2017 Europe OVERALL 2663 470
2017 Middle East <1 barrel 27 1
2017 Middle East 1-10 barrel 44 27
2017 Middle East 10-100 barrels 20 113
2017 Middle East >100 barrels 5 135
2017 Middle East Unspecified (excl. spills <1bbl) 0 0
2017 Middle East OVERALL 96 276
2017 North America <1 barrel 1293 20
2017 North America 1-10 barrel 415 176
2017 North America 10-100 barrels 110 494
2017 North America >100 barrels 26 2973
2017 North America Unspecified (excl. spills <1bbl) 0 0
2017 North America OVERALL 1844 3663
2017 Russia & Central Asia <1 barrel 55 1
2017 Russia & Central Asia 1-10 barrel 4 2
2017 Russia & Central Asia 10-100 barrels 3 10
2017 Russia & Central Asia >100 barrels 0 0
2017 Russia & Central Asia Unspecified (excl. spills <1bbl) 0 0
2017 Russia & Central Asia OVERALL 62 13
2017 South & Central America <1 barrel 556 10
2017 South & Central America 1-10 barrel 77 27
2017 South & Central America 10-100 barrels 12 61
2017 South & Central America >100 barrels 0 0
2017 South & Central America Unspecified (excl. spills <1bbl) 0 0
2017 South & Central America OVERALL 645 99
2016 Africa <1 barrel 94 3
2016 Africa 1-10 barrel 54 22
2016 Africa 10-100 barrels 27 140
2016 Africa >100 barrels 20 838
2016 Africa Unspecified (excl. spills <1bbl) 70 124
2016 Africa OVERALL 265 1127
2016 Asia / Australasia <1 barrel 114 2
2016 Asia / Australasia 1-10 barrel 24 10
2016 Asia / Australasia 10-100 barrels 6 15
2016 Asia / Australasia >100 barrels 0 0
2016 Asia / Australasia Unspecified (excl. spills <1bbl) 1 13
2016 Asia / Australasia OVERALL 145 39
2016 Europe <1 barrel 2324 26
IOGP environmental performance indicators – 2018 data
/ 66

Year Region Size Number of spills Quantity spilled (tonnes)
NB: Overall excludes spills <1 barrel in size.
Table A.27: Oil spills > 100 barrels in size (where cause was indicated) – by cause – 2018 (Figure43)
NB: Quantity of oil recovered is not reported for all spills.
2016 Europe 1-10 barrel 83 31
2016 Europe 10-100 barrels 16 57
2016 Europe >100 barrels 2 121
2016 Europe Unspecified (excl. spills <1bbl) 2 0
2016 Europe OVERALL 2427 236
2016 Middle East <1 barrel 16 0
2016 Middle East 1-10 barrel 43 26
2016 Middle East 10-100 barrels 26 90
2016 Middle East >100 barrels 3 187
2016 Middle East Unspecified (excl. spills <1bbl) 0 0
2016 Middle East OVERALL 88 304
2016 North America <1 barrel 658 12
2016 North America 1-10 barrel 255 114
2016 North America 10-100 barrels 84 330
2016 North America >100 barrels 13 815
2016 North America Unspecified (excl. spills <1bbl) 0 0
2016 North America OVERALL 1010 1271
2016 Russia & Central Asia <1 barrel 209 3
2016 Russia & Central Asia 1-10 barrel 10 6
2016 Russia & Central Asia 10-100 barrels 3 22
2016 Russia & Central Asia >100 barrels 1 27
2016 Russia & Central Asia Unspecified (excl. spills <1bbl) 0 0
2016 Russia & Central Asia OVERALL 223 58
2016 South & Central America <1 barrel 307 8
2016 South & Central America 1-10 barrel 68 31
2016 South & Central America 10-100 barrels 30 99
2016 South & Central America >100 barrels 1 159
2016 South & Central America Unspecified (excl. spills <1bbl) 0 0
2016 South & Central America OVERALL 406 296
Equipment failure (excluding corrosion) 3 298.284 298.284
Corrosion 29 1170.5181 302.5184
Operator or technical error 3 122.074 120.332
Third party damage (sabotage, theft, vandalism, etc) 30 1527.135 25.862
Other 4 543.8403 33.902
SUM TOTAL 69 3661.8515 780.8984
Cause Number of spillsQuantity spilled to theenvironment (tonnes)
Quantity recovered (ifreported) (tonnes)
IOGP environmental performance indicators – 2018 data
/ 67

Table A.28: Oil spills 10–100 barrels (where cause was indicated) – by cause – 2018 (Figure 44)
NB: Quantity of oil recovered is not reported for all spills.
Table A.29: Oil spills 10–100 barrels (where cause was indicated) – by material spilled – 2018(Figure 44)
NB: Quantity of oil recovered is not reported for all spills.
Table A.30: Oil spills 10–100 barrels (where cause was indicated) – by region – 2018
NB: Quantity of oil recovered is not reported for all spills.
Table A.31: Oil spills 10–100 barrels (where cause was indicated) – by location – 2018
NB: Quantity of oil recovered is not reported for all spills.
Equipment failure (excluding corrosion) 25 87.7311 24.4952
Corrosion 110 475.905 158.254
Operator or technical error 29 104.3927 32.964
Third party damage (sabotage, theft, vandalism, etc) 51 226.1719 5.0625
Other 21 95.747 32.3771
Cause Number of spillsQuantity spilled to theenvironment (tonnes)
Quantity recovered (ifreported) (tonnes)
Excluding third party damage Crude oil 142 572 196
Excluding third party damage Condensate 16 85 29
Excluding third party damage Processed oil 14 53 24
Excluding third party damage Unspecified oil 15 61 3
Excluding third party damage SUM TOTAL 187 770 252
Third party damage Crude oil 49 220 5
Third party damage Condensate 1 2 0
Third party damage Processed oil 1 5 0
Third party damage SUM TOTAL 51 226 5
Material Number of spillsQuantity spilled to theenvironment (tonnes)
Quantity recovered (ifreported) (tonnes)
Excluding third party damage Africa 14 58 12
Excluding third party damage Asia / Australasia 4 19 0
Excluding third party damage Europe 13 76 2
Excluding third party damage Middle East 9 28 27
Excluding third party damage North America 97 362 208
Excluding third party damage Russia & Central Asia 35 183 3
Excluding third party damage South & Central America 15 43 0
Third party damage Africa 44 206 1
Third party damage Asia / Australasia 3 10 4
Third party damage Europe 2 6 0
Third party damage North America 2 4 0
Region Number of spillsQuantity spilled to theenvironment (tonnes)
Quantity recovered (ifreported) (tonnes)
Excluding third party damage Onshore 133 541 271
Excluding third party damage Offshore 14 71 0
Excluding third party damage Unspecified 1 3 3
Third party damage Onshore 35 271 12
Location Number of spillsQuantity spilled to theenvironment (tonnes)
Quantity recovered (ifreported) (tonnes)
IOGP environmental performance indicators – 2018 data
/ 68

Table A.32: Number of chemical spills >1 barrel in size and quantity spilled per unit ofhydrocarbon production (Figure 45)
NB: Quantity of material recovered is not reported for all spills.
Table A.33: Chemical spills onshore and offshore – by region
2018 Onshore 0.29 2.05 666
2018 Offshore 0.13 2.04 821
2018 Unspecified 0.01 0.01 159
2018 OVERALL 0.18 1.85 1646
2017 Onshore 0.23 0.68 532
2017 Offshore 0.14 1.62 828
2017 Unspecified 0.63 1.02 188
2017 OVERALL 0.23 1.22 1548
2016 Onshore 0.2 0.94 516
2016 Offshore 0.17 0.79 759
2016 Unspecified 0.05 0.33 105
2016 OVERALL 0.17 0.81 1380
Year LocationNumber of spills per
million tonnesQuantity spilled to the environment
(tonnes/million tonnes) Production (million tonnes)
2018 Africa Onshore 0.27 2
2018 Africa Offshore 1.51 1
2018 Africa Unspecified no data 0
2018 Asia / Australasia Onshore 9.56 86
2018 Asia / Australasia Offshore 0.83 4
2018 Asia / Australasia Unspecified no data 0
2018 Europe Onshore 1.02 1
2018 Europe Offshore 17.36 850
2018 Europe Unspecified 2.07 2
2018 Middle East Onshore 1.35 1
2018 Middle East Offshore no data 0
2018 North America Onshore 5.56 750
2018 North America Offshore 53.48 588
2018 Russia & Central Asia Onshore 4.2 21
2018 Russia & Central Asia Offshore no data 0
2018 South & Central America Onshore 16.19 501
2018 South & Central America Offshore 5.6 235
2018 South & Central America Unspecified no data 0
2018 OVERALL (ALL regions) Onshore 7.07 1364
2018 OVERALL (ALL regions) Offshore 15.55 1679
2018 OVERALL (ALL regions) Unspecified 2.07 2
2018 OVERALL (ALL regions) OVERALL 10.09 3045
2017 Africa Onshore 12.6 25
2017 Africa Offshore 10.81 10
2017 Africa Unspecified no data 0
2017 Asia / Australasia Onshore 0.53 2
2017 Asia / Australasia Offshore 2.14 17
2017 Asia / Australasia Unspecified 3.23 12
2017 Europe Onshore 3 2
Year Region Location Average size (tonnes)Quantity spilled to the environment
(tonnes)
IOGP environmental performance indicators – 2018 data
/ 69

Year Region Location Average size (tonnes)Quantity spilled to the environment
(tonnes)
NB: Excludes spills <1 barrel in size.
2017 Europe Offshore 20.42 1163
2017 Europe Unspecified no data 0
2017 Middle East Onshore 10.97 21
2017 Middle East Offshore 22.99 22
2017 North America Onshore 2.14 188
2017 North America Offshore 0.9 13
2017 North America Unspecified 1.55 178
2017 Russia & Central Asia Onshore 0.72 2
2017 Russia & Central Asia Offshore no data 0
2017 South & Central America Onshore 5.35 117
2017 South & Central America Offshore 3.2 115
2017 South & Central America Unspecified no data 0
2017 OVERALL (ALL regions) Onshore 2.96 360
2017 OVERALL (ALL regions) Offshore 11.38 1343
2017 OVERALL (ALL regions) Unspecified 1.61 191
2017 OVERALL (ALL regions) OVERALL 5.28 1895
2016 Africa Onshore 0.2 0
2016 Africa Offshore 4.76 14
2016 Africa Unspecified 3.02 3
2016 Asia / Australasia Onshore 6.81 34
2016 Asia / Australasia Offshore 5.81 52
2016 Asia / Australasia Unspecified 0.47 0
2016 Europe Onshore 0.4 0
2016 Europe Offshore 3.81 289
2016 Europe Unspecified 15.5 31
2016 Middle East Onshore no data 0
2016 Middle East Offshore 2 2
2016 North America Onshore 4.6 289
2016 North America Offshore 4.64 37
2016 Russia & Central Asia Onshore no data 0
2016 Russia & Central Asia Offshore no data 0
2016 South & Central America Onshore 4.74 161
2016 South & Central America Offshore 7.33 278
2016 South & Central America Unspecified no data 0
2016 OVERALL (ALL regions) Onshore 4.67 485
2016 OVERALL (ALL regions) Offshore 4.99 673
2016 OVERALL (ALL regions) Unspecified 6.99 34
2016 OVERALL (ALL regions) OVERALL 4.89 1193
IOGP environmental performance indicators – 2018 data
/ 70

Fresh water
Table A.34: Fresh water withdrawn for the purpose of use cubic metres per thousand tonnesproduction – by region (Figures 46 and 47)
NB: Data only included where oil in produced water and produced water quantity are both reported.
2018 Africa 52.85
2018 Asia / Australasia 78.61
2018 Europe 38.31
2018 Middle East 4.09
2018 North America 488.19
2018 Russia & Central Asia 128.3
2018 South & Central America 102.67
2018 OVERALL (All regions) 112.94
2017 Africa 47.57
2017 Asia / Australasia 101.45
2017 Europe 48.16
2017 Middle East 4.63
2017 North America 461.7
2017 Russia & Central Asia 371.45
2017 South & Central America 95.92
2017 OVERALL (All regions) 125.29
2016 Africa 50.27
2016 Asia / Australasia 62.38
2016 Europe 41.84
2016 Middle East 3.14
2016 North America 360.14
2016 Russia & Central Asia 16.57
2016 South & Central America 111.42
2016 OVERALL (All regions) 90.02
Year RegionFresh water withdrawn (cubic metres per thousand tonnesproduction)
IOGP environmental performance indicators – 2018 data
/ 71

Table A.35: Fresh water withdrawn - by source (Figures 46 and 47)
NB: Data only included where oil in produced water and produced water quantity are both reported.
2016 Groundwater 43386062
2016 Surface water 66688387
2016 Municipal water supplies 8850552
2016 Treated municipal wastewater 36714
2016 Captured rainwater 3602626
2016 Other sources 7432313
2016 Unspecified 38395902
2016 SUM TOTAL 168392559
2017 Groundwater 80857923
2017 Surface water 92467978
2017 Municipal water supplies 10094581
2017 Treated municipal wastewater 4935
2017 Captured rainwater 2775400
2017 Other sources 4503526
2017 Unspecified 40457024
2017 SUM TOTAL 231161369
2018 Groundwater 60505509
2018 Surface water 82230746
2018 Municipal water supplies 9629847
2018 Treated municipal wastewater 461038
2018 Captured rainwater 6043058
2018 Other sources 4764622
2018 Unspecified 17734676
2018 SUM TOTAL 181369499
Year Source Fresh water withdrawn (cubic metres)
IOGP environmental performance indicators – 2018 data
/ 72

Glossary
APIAmerican Petroleum Institute.
Barrel, BblIn the energy industry, a barrel is 42 US gallons measured at 60° Fahrenheit. This is approximately 159litres.
Base fluidThe continuous phase or suspending medium of a drilling fluid formulation.
CHMethane, the principal constituent of natural gas. One of the primary greenhouse gases.
COCarbon dioxide, a colourless, odourless, and nonflammable gas. CO emissions occur from thecombustion of fossil fuels. CO is a primary greenhouse gas.
Crude oilA mixture of hydrocarbons that exists as a liquid in natural underground reservoirs and remains liquid atatmospheric pressure after passing through surface separating facilities. Crude oil is the raw materialthat is refined into gasoline, heating oil, jet fuel, propane, petrochemicals, and other products.
CuttingsThe particles generated by drilling into subsurface geologic formations and carried out from the wellborewith the drilling fluid. Examples of drill cuttings include small pieces of rock varying in size and texturefrom fine silt to gravel.
Drilling fluidThe circulating fluid (also called ‘mud’) used in the rotary drilling of wells to clean and condition the holeand to counterbalance formation pressure. See definitions for ‘water-based drilling fluid’ and ‘non-aqueous drilling fluid’ below.
E&PExploration and Production (of hydrocarbons).
Emission rateEmissions of gases per unit of hydrocarbon production.
Energy intensityEnergy consumed per unit of hydrocarbon production.
4
2
2
2
IOGP environmental performance indicators – 2018 data
/ 73

ExplorationStudy of geological formations to detect the presence of hydrocarbons.
Flare (as an atmospheric emission source category)Includes emissions generated by burning of gases (or in some cases liquids) in a thermal destructiondevice, including E&P flaring of associated gas (and in some cases liquids) from oil production or welltesting. Typical equipment sources in this category include:
FlaresThermal Oxidizers
FlaringThe controlled burning of natural gas produced in association with oil in the course of oil and gasexploration and production operations. It also includes the controlled and safe burning of gas whichcannot be used for commercial or technical reasons.
Fresh waterThe definition varies in accordance with local statutes and regulations. Where it is not defined by localregulations, fresh water is defined for reporting purposes as nonbrackish water and may include drinkingwater, potable water, water used in agriculture, etc. The total dissolved solids (TDS) concentration of thiswater type is up to 2000 mg/l.
Fuel combustion (as an atmospheric emission source category)Includes emissions generated through the consumption of fuel. Typical fuel-consuming equipment typesin E&P operations include:
Turbines (e.g., driving compressors, generators and pumps)Internal Combustion EnginesHeatersBoilers / ReboilersMobile sources under company’s operational control (see IPIECA/API/IOGP Petroleum industryguidelines for reporting greenhouse gas emissions)
Fugitive emission, fugitive lossesUnintended emissions released to the air, other than those from stacks or vents from the processing,transmission, and/or transportation of fossil fuels. They are often due to equipment leaks and evaporativeprocesses.
Gaseous emissionGaseous emissions to the atmosphere from flaring and venting, process and turbine combustion.Includes fugitive losses from pumps, valves, flanges, pipes, etc.
Gas-oil ratioThe volume of gas at atmospheric pressure produced per unit volume of oil produced.
IOGP environmental performance indicators – 2018 data
/ 74

Greenhouse gasA gas that contributes to the natural greenhouse effect. The primary six greenhouse gases (GHGs)produced by human activities are: carbon dioxide, methane, nitrous oxide, hydrofluorocarbons,perfluorocarbons and sulphur hexafluoride. For the purpose of this report GHG considers only CO andCH .
HydrocarbonAn organic chemical compound of hydrogen and carbon (see petroleum).
Hydrocarbon productionQuantity of hydrocarbon gas and/or liquids produced.
IPIECAThe global oil and gas industry association for environmental and social issues.
MudCommon term for drilling fluid.
Nitrogen Oxides (NO )Nitrogen Oxides represent the sum of nitric oxide (NO) and nitrogen dioxide (NO ) expressed as NOequivalent. Nitrous oxide (N O) is not included as a component of NO . NO emissions occur from thecombustion of fossil fuels for industry and transport and are a function of the type and quantity of fuelburned and the type of combustion device in which they are burned.
NMVOCNon-methane volatile organic compounds: all hydrocarbons other than methane that can vaporise atnormal temperature and pressure.
Non-aqueous drilling fluid (NADF)A drilling fluid in which the continuous phase is a waterimmiscible fluid such as an oleaginous material(e.g., mineral oil, enhanced mineral oil, paraffinic oil, or synthetic material such as olefins and vegetableesters). NADFs serve many purposes under difficult drilling conditions. NADFs are usually reused.
NormalizationTo compare emissions from different regions or sources it is useful to relate them to the size of theactivity causing the emission. For example, tonnes of CO can be presented by their ratio to tonnes of oiland gas produced. This procedure is called normalization.
OffshoreFor this report ‘offshore’ refers to operations that take place at sea, including inland seas directlyconnecting to oceans. Operations in bays, in major inland seas, e.g., the Caspian Sea, or in other inlandseas directly connected to oceans are counted as offshore.
OnshoreFor this report ‘onshore’ refers to operations that take place within a landmass, including swamps, lakes,rivers and estuaries, but excluding major inland seas.
2
4
X
2 2
2 X X
2
IOGP environmental performance indicators – 2018 data
/ 75

On-site combustionThe local combustion of fuels by E&P companies to produce energy for their operations.
OperatorTerm used to describe a company appointed by venture stakeholders to take primary responsibility forday-to-day operations for a specific plant or activity.
ProcessingThe separation of oil, gas, and natural gas liquids and the removal of impurities.
Produced water (PW)The water (generally brine) brought up from the hydrocarbon-bearing strata during the extraction of oiland gas, including formation water, injection water, and any chemicals added downhole or during theoil/water separation process. For the purposes of this report produced water discharges from crude oiland natural gas facilities are categorised by the source of production and not the location where theyoccur, i.e., where production is offshore and discharges are generated from an onshore facility, thedischarges are reported as offshore.
ProductionAll production activities including production drilling, process and treatment, flaring and venting, in-fieldpipeline transport, and terminal operations. (see Hydrocarbon production)
Purchased energyEnergy purchased in the form of electricity or steam.
SOSulphur dioxide (SO ) can result from the combustion of H S and other sulphur containing compounds. Inthis report ‘SO ‘ refers to the sum of sulphur dioxide and sulphur trioxide (SO ) expressed as SOequivalent.
Source of emissionsIn the case of gaseous emissions refers to the process by which the emissions are released. Sourcecategories are Energy, Flare, Vent, Fugitive losses and Unspecified.
SpillAny loss of containment from which the released material reaches the environment (i.e., is not retainedwithin secondary or other confinement), irrespective of the quantity recovered. The volume of a spillrepresents the gross volume reaching the environment, not a net volume remaining in the environmentafter response. Spills occurring from support and standby vessels are included but spills of producedwater or process waste water are excluded. Includes loss of containment resulting from acts of sabotage(such as theft of oil from pipelines and storage, or vandalism); excludes loss as a result of ‘acts ofterrorism’/attacks on infrastructure.
Synthetic-based drilling fluidA drilling fluid that has a synthetic material as its continuous phase with water as the dispersed phase.Synthetic-based drilling fluids are a subset of nonaqueous drilling fluids.
2
2 2
2 2 2
IOGP environmental performance indicators – 2018 data
/ 76

SyntheticsSynthetic material as applied to synthetic-based drilling fluid means material produced by the reaction ofspecific purified chemical feedstock, as opposed to the traditional base fluids such as diesel and mineraloil which are derived from crude oil solely through physical separation processes.
TonneA metric tonne; equivalent to 1,000 kilograms or 2,205 pounds.
TransportThe transfer of hydrocarbons from the site of production to the point of commercial metering or terminalor offshore loading device.
Upstream industryThose operations within the industry to the point where the produced resource is metered into thetransportation system. This includes Exploration and Production.
VentingThe controlled release of unburned gas to the atmosphere.
Water-based drilling fluid (mud)A drilling fluid in which water or a water miscible fluid is the continuous phase and the suspendingmedium for solids, whether or not oil is present.
IOGP environmental performance indicators – 2018 data
/ 77

Registered OfficeCity TowerLevel 1440 Basinghall StreetLondon EC2V 5DEUnited Kingdom
T +44 (0)20 3763 [email protected]
Brussels OfficeAvenue de Tervuren 188AB-1150 BrusselsBelgium
T +32 (0)2 790 [email protected]
Houston Office19219 Katy FreewaySuite 175Houston, TX 77094USA
T +1 (713) 261 [email protected]
www.iogp.org
The International Association of Oil and GasProducers (IOGP) has collected environmentaldata from its member companies every yearsince 1999.
The objective of this programme has been toallow member companies to compare theirperformance with other companies in thesector leading, it is hoped, to improved andmore efficient performance. The programmealso contributes to the industry’s wish to bemore transparent about its operations.
This report summarizes information onexploration and production (E&P) activitiescarried out by contributing IOGP membercompanies in .
www.data.iogp.org
IOGP environmental performance indicators – 2018 data
/ 78