ge energy session 12 post-disturbance operation of vg … · energy session 12 post-disturbance...
TRANSCRIPT

GEEnergy
Session 12Post-Disturbance Operation of VG Plants
UVIG Short Course 2014Portland, Oregon
Jason MacDowell

Wind Turbine Fault Tolerance

3 /
Ride-Thru Capabilities
Remains on-line and feeds reactive power through system disturbances
Meets present and emerging grid requirement with Low/Zero Voltage Ride Through (LVRT/ZVRT) capability
Meets transmission reliability standards similar to thermal generators
Active Power
Reactive Power
Voltage
Apparent Power
Zero
Voltage
Event
GE's Standard WindRIDE-THRU Offerings
0
20
40
60
80
100
120
-1.0 0.0 1.0 2.0 3.0 4.0 5.0 6.0
Time (seconds)
Vo
lta
ge a
t Po
int o
f
Inte
rco
nn
ectio
n (P
erc
en
t)
200 ms
LVRT
ZVRT

4 /
LVRT reduces amount of generation lost during faults
• Improves system stability
• Reduces likelihood of cascaded tripping
• Reduces likelihood of system collapse
LVRT enables a WTG to continue operation during faults
• Improves system availability and reliability
• Increases annual energy yield
• Increases revenues from energy sales
• Prevents overloading of other parts of the network
• Enables meeting the spinning reserve requirements
LVRT Advantages

5GE Energy Consulting – Nicholas W Miller
GE Proprietary Information
Ride-Thru Capabilities
Medium voltage bus drops to 0.0
Power recovers to pre-disturbance level in <200ms
GE's Standard WindRIDE-THRU Offerings
0
20
40
60
80
100
120
-1.0 0.0 1.0 2.0 3.0 4.0 5.0 6.0
Time (seconds)
Vo
lta
ge a
t Po
int o
f
Inte
rco
nn
ectio
n (P
erc
en
t)
200 ms
LVRT
ZVRT
3-phase zero retained voltage, 200ms fault:
(GE Standard ZVRT offering) P, Q (Mw,Mvar)
Field Test Results (2.5 unit)

6GE Energy Consulting – Nicholas W Miller
GE Proprietary Information
3-phase 18.5% retained voltage, 700ms fault:P, Q (Mw,Mvar)
Reactive Power well behaved: supports grid
during voltage depression
Field Test Results (2.5 unit)

Transient Stability

8 /
Transient Stability
DFAG wind farms are more stable than conventional synchronous generators.

9 /
Transient Stability
In fact, wind farms will survive some disturbances that trip conventional synchronous generators.

10 /
Induction vs DFAG Dynamics
• Recovery of induction generators from severe faults can involve more than LVRT
• Post-fault dynamics can result in loss of synchronism and tripping
• Wind plants with power electronic enabled WTGs can be more stable (than conventional synchronous generators.)
LVRT keeps
machines on
during fault
Inadequate post-fault voltage
recovery causes induction
machine to accelerate and lose
synchronism
Induction machine
would trip on
overspeed

Wind Turbine Active Power Control

12 /
Active Power Controls for Disturbances
Advanced plant controls power response to variations in wind and system frequency
Frequency Droop – React to changes in system frequency
GE Energy, May 2006/ 12

13 /
Active Power Controls
Wind Plant Rating:
45 x 1.5MW Turbines
40 Turbines available during commissioning tests
60MW @0.95 Pf19.7 MVAR
14 /
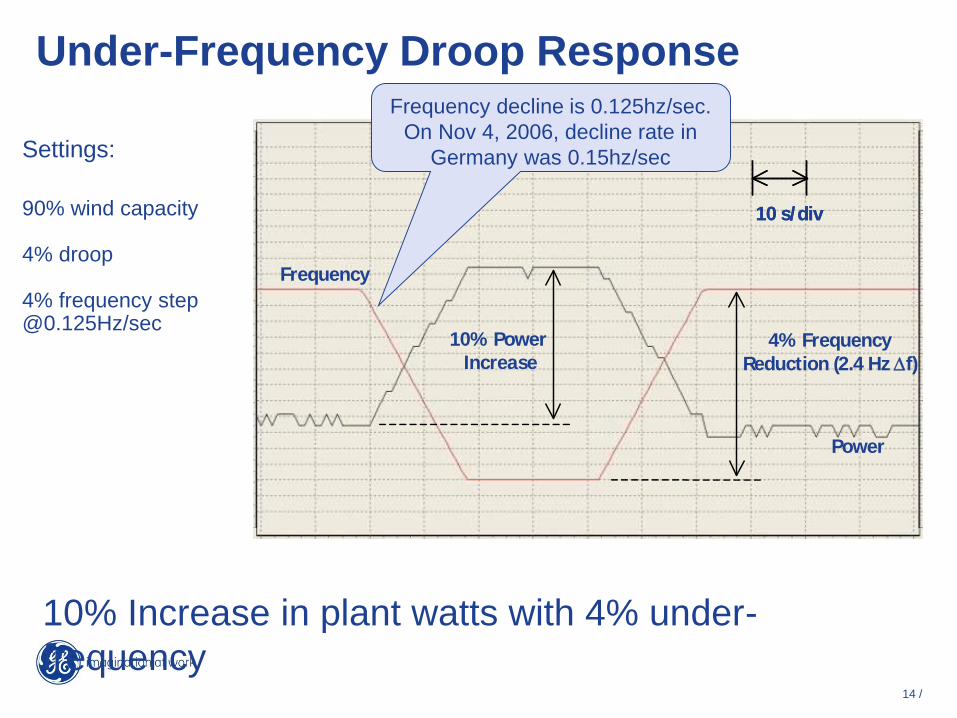
Under-Frequency Droop Response
Settings:
90% wind capacity
4% droop
4% frequency [email protected]/sec
10% Increase in plant watts with 4% under-
frequency
10% Power
Increase
10 s/div
4% Frequency
Reduction (2.4 Hz f)
Frequency
Power
10% Power
Increase
10 s/div10 s/div
4% Frequency
Reduction (2.4 Hz f)
Frequency
Power
Frequency decline is 0.125hz/sec.
On Nov 4, 2006, decline rate in
Germany was 0.15hz/sec

15 /
Over-Frequency Droop Response
Settings:
4% Droop
2% Frequency [email protected]/sec
50% reduction in plant watts with 2% over-frequency
2% Frequency
Increase
(1.2 Hz f)
50% Power Reduction
Frequency
Power
10 s/div
2% Frequency
Increase
(1.2 Hz f)
50% Power Reduction
Frequency
Power
10 s/div10 s/div

Wind Turbine Inertial Control

17 /
Why Inertial Response: System Needs
• Increasing Dependence on Wind Power
– Large Grids with Significant Penetration of Wind Power
• Modern variable speed wind turbine-generators do not contribute to system inertia
• System inertia declines as wind generation displaces synchronous generators (which are de-committed)
• Result is deeper frequency excursions for system disturbances
• Increased risk of
– Under-frequency load shedding (UFLS)
– Cascading outagesInertial response will increase system security
and aid large scale integration of wind power

18 /
Control Concept
• Use controls to extract stored inertial energy
• Provide incremental energy contribution during the 1st 10 seconds of grid events;
– Allow time for governors and other controls to act
• Target incremental energy similar to that provided by a synchronous turbine-generator with inertia (H constant) of 3.5 pu-sec.
• Focus on functional behavior and grid response: do not try to exactly replicate synchronous machine behavior

19 /
Constraints
• Not possible to increase wind speed
• Slowing wind turbine reduces aerodynamic lift:
– Must avoid stall
• Must respect WTG component ratings:
– Mechanical loading
– Converter and generator electrical ratings
• Must respect other controls:
– Turbulence management
– Drive-train and tower loads management

20 /
How does it work?
Basic components of a GE Double-fed Asynchronous Wind Turbine Generator:
Wind Turbine
frotor
Protor
fnet
Pstator
3 f AC Windings
Converter
P rotor
F rotor
P conv
F network
Electrical Power Delivered to Grid
Wound-Rotor
Generator
Machine Terminals
Wind

21 /
How does it work? Part 2
ema TTTdt
dJ
Electrical
Torque, TeMechanical
Torque, Tm
Basic machine equations for all rotating machines
base
2mo
VA
J
2
1H
baseVA
sec)-(Watt RotortheinStoredEnergyKineticH
Basic Notation:
J is the inertia of the entire drive-
train in physical
units
H is the inertia
constant – it is scaled to the size of
the machine.
A typical synchronous
turbine-generator
has an H of about 3.5
MW-sec/MW.

22 /
How does it work? Part 3
Electrical
Torque, TeMechanical
Torque, Tm
So what?
• In steady-state, torques must be balanced
• When electrical torque is greater than mechanical torque, the rotation slows extracting stored inertial energy from the rotating mass

23 /
What’s Different?
Synchronous Generator
Wind Turbine*
Mechanical power
Governor Response / Fuel Flow Control
Pitch Control / Uncontrolled Wind Speed
Electrical Power
Machine Angle (d-q Axis) / passive
Converter Control / active
Inertial Response
Inherent / Uncontrolled
By Control Action
* Variable speed, pitch controlled WTGs

24 /
How does it work? Part 4
Wind
Electrical Torque is a function of:
(1) Converter Control
(2) Commands from Turbine Control
Mechanical Torque is a function of:
(1) Wind Speed
(2) Blade Pitch
(3) Blade Speed ( ά Rotor Speed)
WindINERTIA uses controls to increase electric
power during the initial stages of a significant
downward frequency event
25 /
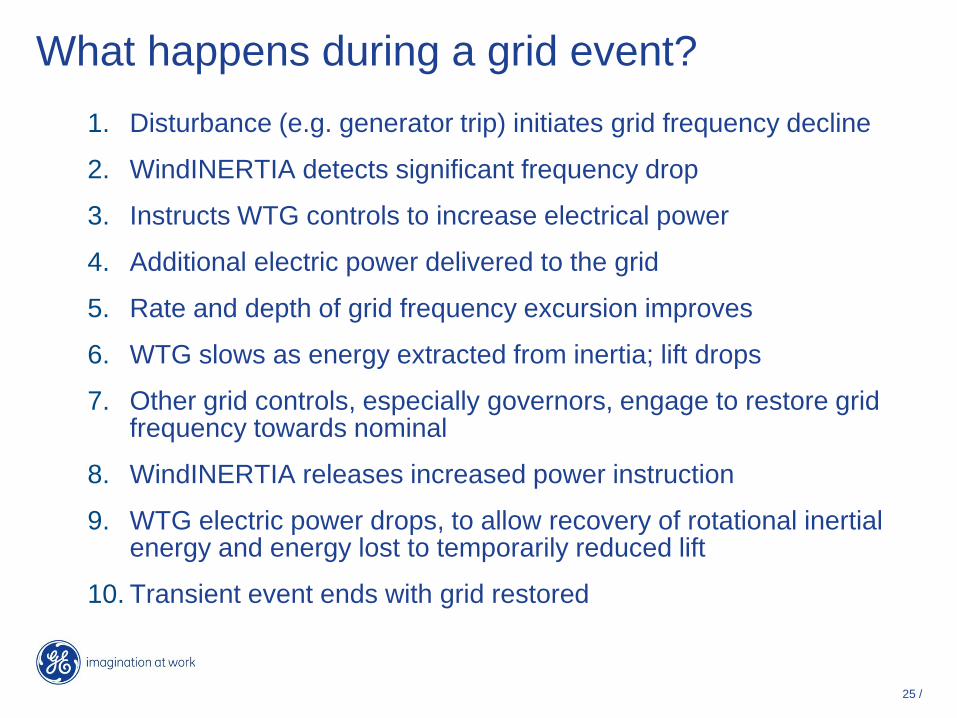
What happens during a grid event?
1. Disturbance (e.g. generator trip) initiates grid frequency decline
2. WindINERTIA detects significant frequency drop
3. Instructs WTG controls to increase electrical power
4. Additional electric power delivered to the grid
5. Rate and depth of grid frequency excursion improves
6. WTG slows as energy extracted from inertia; lift drops
7. Other grid controls, especially governors, engage to restore grid frequency towards nominal
8. WindINERTIA releases increased power instruction
9. WTG electric power drops, to allow recovery of rotational inertial energy and energy lost to temporarily reduced lift
10. Transient event ends with grid restored
26 /
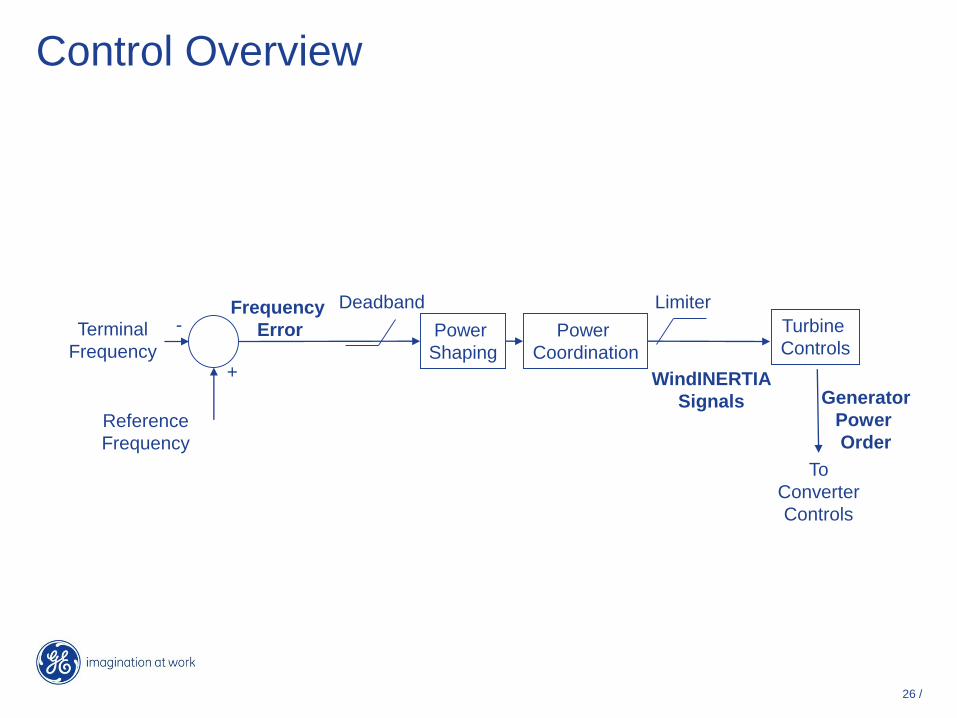
Terminal
Frequency
Reference
Frequency
Power
Shaping
Power
Coordination
DeadbandFrequency
Error
Generator
Power
Order
Limiter
To
Converter
Controls
+
-
WindINERTIA
Signals
Turbine
Controls
Control Overview

27 /
58.0
58.5
59.0
59.5
60.0
60.5
0 10 20 30
Time (Seconds)
Win
d P
lan
t PO
I B
us
Fre
qu
en
cy (H
z)
1000 MW Synchronous Machine
1000 MW Wind without WindINERTIA
1000 MW Wind with Simple WindINERTIA Model (Rated Wind Speed)
Reference Case
Without WindINERTIA frequency
excursion is ~4% worse
With WindINERTIA
frequency excursion is
~21% better
An Example: 14GW, mostly hydro system, for trip of a large generator
Minimum frequency is the critical performance concern for reliability

28 /
58.0
58.5
59.0
59.5
60.0
60.5
0 10 20 30
Time (Seconds)
Win
d P
lan
t P
OI B
us F
req
uen
cy (
Hz)
1000 MW Synchronous Machine
1000 MW Wind without WindINERTIA
1000 MW Wind with Simple WindINERTIA (Wind Speed above Rated)
1000 MW Wind with Simple WindINERTIA Model (Rated Wind Speed)
With WindINERTIA
frequency excursion is
~21-23% better
An Example (continued) :
Range of possible
recovery
characteristics
Performance is a function of wind and other conditions: not perfectly deterministic like synchronous machine inertial response

29 /
• Not possible to drive grid frequency
• Controls driven with an external frequency signal– (very similar to frequency of previous example)
• Performance a function of wind speed– (also, not possible to hold wind speed constant during tests)
• Since WTG must respect other controls
– Turbulence & drivetrain and tower loads management affect performance of individual WTGs at any particular instant
– Exact performance of single WTG for a single test is not too meaningful
– Aggregate behavior of interest to grid
Field Tests Approach and Constraints:
WindINERTIA validation tests: Multiple tests over varying wind conditions

30 /
Field Tests Results:
Test count:
8 m/s - 19 tests
10 m/s – 19 tests
14 m/s – 52 tests
0
300
600
900
1200
1500
1800
0 10 20 30 40 50 60 70 80
Time (Seconds)
Po
wer
(kW
)
8 m/s Avg Meas 10 m/s Avg Meas 14 m/s Avg Meas

31 /
Simulations:
WindINERTIA simulations capture key aspects
of observed field performance
0
300
600
900
1200
1500
1800
0 10 20 30 40 50 60 70 80 90
Time (Seconds)
Po
we
r (k
W)
8 m/s Avg Meas 10 m/s Avg Meas 14 m/s Avg Meas
8 m/s PSLF 10 m/s PSLF 14 m/s PSLF

32 /
Summary & Conclusions
• Need and demand for inertial response from WTGs has been growing
• GE now offers a new, grid friendly feature to meet this need
• The feature has been field tested; a dynamic model has been created
• Fundamental physical differences in WTGs mean that inertial behavior is not identical to synchronous machines
• Future grid codes may require inertial response; they must recognize physical reality & constraints
WindINERTIATM - another aid to the continued
successful large scale integration of wind power


Back-up

Damping

36 /
Copyright© 2005 IEEE
G1
G2 G4
G3
Load 1
West Area East Area
Load 2
G1
WT G4
G3
Load 1 Load 2
Conventional Generator
Wind Turbine Generator
DFG wind farms don’t tend to aggravate
system oscillations
Damping

37 /
PSS Study System
G1
G2 G4
G3
Load 1
West Area East Area
Load 2
G1
WT G4
G3
Load 1 Load 2
Conventional Generator
Wind Turbine Generator
Copyright© 2005 IEEE

38 /
Inter Area Mode vs. Power Transfer
Copyright© 2005 IEEE

39 /
Inter-Area Mode Damping
• G2 is WTG
• G2 is Synchronous Generator
Copyright© 2005 IEEE
40 /
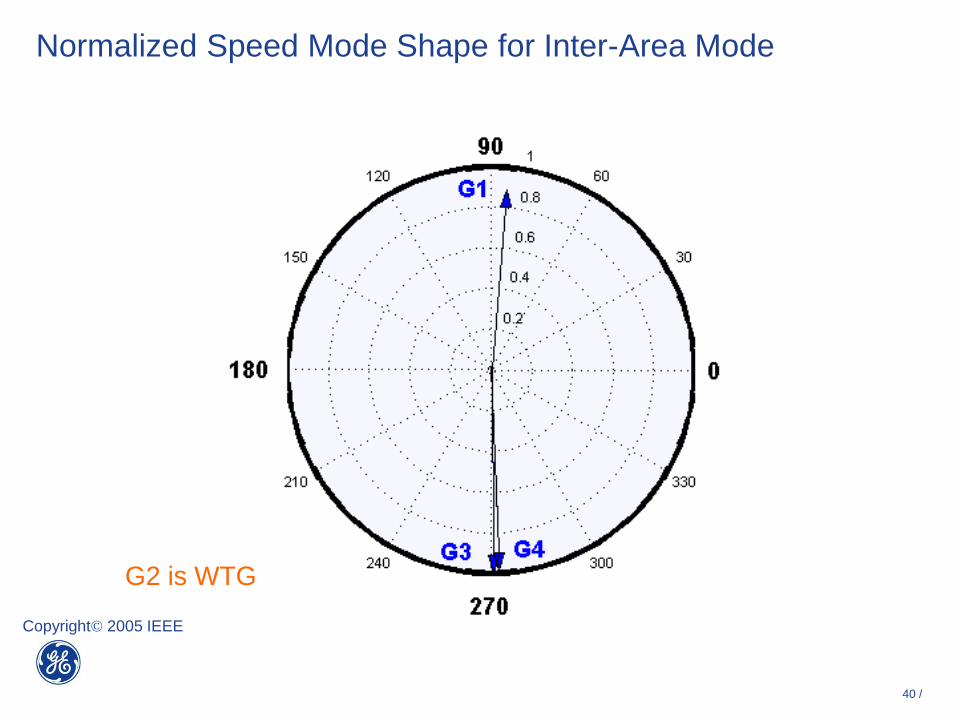
Normalized Speed Mode Shape for Inter-Area Mode
G2 is WTG
Copyright© 2005 IEEE

41 /
G2 is Synchronous Generator
Local Modes
G2 is WTG
WTGs Do Not Require Power System Stabilizers!
Copyright© 2005 IEEE

42 /
Impact of Wind Generation on System Dynamic Performance
• Fault at Marcy 345 kV bus
• Severe contingency for overall system stability
• Simulation assumes vector-controlled wind turbines
• Wind generation improves post-fault response of interconnected power grid
Marcy 345kV Bus Voltage (pu)
Total East Interface Flow (MW)
Without Wind
With Wind
With Wind
Without Wind