gecko 2.0 metabolic models with enzymatic constraints
TRANSCRIPT
Page 1/28
Reconstruction of a catalogue of genome-scalemetabolic models with enzymatic constraints usingGECKO 2.0Iván Domenzain
Chalmers University of Technology https://orcid.org/0000-0002-5322-2040Benjamín Sánchez
Technical University of Denmark https://orcid.org/0000-0001-6093-4110Mihail Anton
Chalmers University of Technology https://orcid.org/0000-0002-7753-9042Eduard J Kerkhoven
Chalmers University of Technology https://orcid.org/0000-0002-3593-5792Aarón Millán-Oropeza
INRAE, Micalis InstituteCéline Henry
INRA https://orcid.org/0000-0002-2355-1791Verena Siewers
Chalmers University of Technology https://orcid.org/0000-0002-9502-9804John Morrissey
UCC https://orcid.org/0000-0001-7960-2001Nikolaus Sonnenschein
Technical University of DenmarkJens Nielsen ( [email protected] )
Chalmers University of Technology https://orcid.org/0000-0002-9955-6003
Article
Keywords: genome-scale metabolic models, GECKO, enzyme constraints
Posted Date: April 1st, 2021
DOI: https://doi.org/10.21203/rs.3.rs-351350/v1
License: This work is licensed under a Creative Commons Attribution 4.0 International License. Read Full License
Page 2/28
AbstractGenome-scale metabolic models (GEMs) have been widely used for quantitative exploration of therelation between genotype and phenotype. Streamlined integration of enzyme constraints and proteomicsdata into GEMs was �rst enabled by the GECKO method, allowing the study of phenotypes constrained byprotein limitations. Here, we upgraded the GECKO toolbox in order to enhance models with enzyme andproteomics constraints for any organism with an available GEM reconstruction. With this, enzyme-constrained models (ecModels) for the budding yeasts Saccharomyces cerevisiae, Yarrowia lipolytica andKluyveromyces marxianus were generated, aiming to study their long-term adaptation to several stressfactors by incorporation of proteomics data. Predictions revealed that upregulation and high saturationof enzymes in amino acid metabolism were found to be common across organisms and conditions,suggesting the relevance of metabolic robustness in contrast to optimal protein utilization as a cellularobjective for microbial growth under stress and nutrient-limited conditions. The functionality of GECKOwas further developed by the implementation of an automated framework for continuous and version-controlled update of ecModels, which was validated by producing additional high-quality ecModels forEscherichia coli and Homo sapiens. These efforts aim to facilitate the utilization of ecModels in basicscience, metabolic engineering and synthetic biology purposes.
IntroductionGenome-scale metabolic models (GEMs) have become an established tool for systematic analyses ofmetabolism for a wide variety of organisms1–6. Their myriads of applications span from model-drivendevelopment of e�cient cell factories3,7−9, to their utilization for understanding mechanisms underlyingcomplex human diseases10–12. One of the most common simulation techniques for enabling phenotypepredictions with these models is �ux balance analysis (FBA), which assumes that there is balancing of�uxes around each metabolite in the metabolic network. This means that �uxes are constrained bystoichiometries of the biochemical reactions in the network, and that cells have evolved in order tooperate their metabolism according to optimality principles13,14. Quantitative determination ofbiologically meaningful �ux distribution pro�les is a major challenge for constraint-based methods, asoptimal phenotypes can be attained by alternate �ux distribution pro�les15, caused by the presence ofnetwork redundancies that provide organisms with robustness to environmental and geneticperturbations. This limitation is often addressed by incorporation of experimental measurements ofexchange �uxes (secretion of byproducts and uptake of substrates) as numerical �ux constraints for theFBA problem. However, such measurements are not readily available for a wide variety of conditions andorganisms.
In order to overcome these limitations, the concept of enzymatic limitations on metabolic reactions hasbeen explored and incorporated by several constraint-based methods. Some of these have modelledenzyme demands of metabolic reactions by constraining metabolic networks with kinetic parameters andphysiological limitations of cells, such as a crowded intracellular volume16–18, a �nite membrane surface
Page 3/28
area for expression of transporter proteins19 and a bounded total protein mass available for metabolicenzymes20–25. All of these modelling frameworks have been successful at expanding the range ofpredictions of classical FBA, providing explanations for over�ow metabolism and cellular growth ondiverse environments for Escherichia coli16–19, 21,23,25, Saccharomyces cerevisiae22,25,26, Lactococuslactis27 and even human cells20,24. However, these modelling approaches were applied to metabolicnetworks of extensively studied model organisms, which are usually well represented in specializedresources for kinetic parameters such as the BRENDA28 and SABIO RK29 databases. Furthermore,collecting the necessary parameters for the aforementioned models was mostly done manually; therefore,no generalized model parameterization procedure was provided as an integral part of these methods.
Enzyme limitations have also been introduced into models of metabolism by other formalisms, forinstance, Metabolic and gene Expression models (ME-models), implemented on reconstructions for E.coli30–33, Thermotoga maritima34 and Lactococus lactis35; and resource balance analysis models (RBA),on reconstructions for E. coli36 and Bacillus subtilis36,37. These formalisms succeeded at merginggenome-scale metabolic networks together with comprehensive representations of macromolecularexpression processes, enabling detailed exploration of the constraints that govern cellular growth ondiverse environments. Despite the great advances for understanding cell physiology, provided by thesemodelling formalisms, accuracy on phenotype predictions is compromised by the large number ofparameters that are required (rate constants for transcriptional, translational, protein folding anddegradation processes), with most of these not being readily available in the literature. Moreover, thesemodels encompass processes that differ radically in their temporal scales (e.g., protein synthesis vs.metabolic rates) and their mathematical representation (presence of non-linear expressions in ME-models), requiring the implementation of more elaborate techniques for numerical simulation.
GECKO, a method for enhancement of GEMs with Enzymatic Constraints using Kinetic and Omics data,was developed in 2017 and applied to the consensus GEM for S. cerevisiae, Yeast738. This methodextends the classical FBA approach by incorporating a detailed description of the enzyme demands forthe metabolic reactions in a network, accounting for all types of enzyme-reaction relations, includingisoenzymes, promiscuous enzymes and enzymatic complexes. Moreover, GECKO enables directintegration of proteomics abundance data, if available, as constraints for individual protein demands,represented as enzyme usage pseudo-reactions, whilst all of the unmeasured enzymes in the network areconstrained by a pool of remaining protein mass. Additionally, this method incorporates a hierarchicaland automated procedure for retrieval of kinetic parameters from the BRENDA database, which yielded ahigh coverage of kinetic constraints for the S. cerevisiae network. The resulting enzyme-constrainedmodel, ecYeast7, was used for successful prediction of the Crabtree effect in wild-type and mutant strainsof S. cerevisiae and cellular growth on diverse environments and genetic backgrounds, but also provideda simple framework for prediction of protein allocation pro�les and study of proteomics data in ametabolic context. Furthermore, the model formed the basis for modeling yeast growth at differenttemperatures39.
Page 4/28
Since the �rst implementation of the GECKO method38, its principles of enzyme constraints have beenincorporated into GEMs for B. subtilis40, E. coli41, B. coagulans42, Streptomyces coelicolor43 and even fordiverse human cancer cell-lines2, showing the applicability of the method even for non-model organisms.Despite the rapid adoption of the method by the constraint-based modelling community, there is still aneed for automating the model generation and enabling identi�cation of kinetic parameters for lessstudied organisms. Here we wanted to build GECKO models for several organisms, and we thereforeupdated the GECKO toolbox to its 2.0 version. Among other improvements, we generalized its structure tofacilitate its applicability to a wide variety of GEMs, and we improved its parameterization procedure toensure high coverage of kinetic constraints, even for poorly studied organisms. Additionally, weincorporated simulation utility functions, and developed an automated virtual pipeline for update ofenzyme-constrained models (ecModels), named ecModels container. This container is directly connectedto the original sources of version-controlled GEMs and the GECKO toolbox, offering a continuouslyupdated catalogue of diverse ecModels.
ResultsCommunity development of GECKOTo ensure wide application and enable future development by the research community, weestablished the GECKO toolbox as open-source software, mostly encoded in MATLAB. Itintegrates modules for enhancement of GEMs with kinetic and proteomics constraints,automated retrieval of kinetic parameters from the BRENDA database (python module), as wellas simulation utilities and export of ecModel files compatible with both the COBRAtoolbox44 and the COBRApy package45. The development of GECKO has been continuouslytracked in a public repository (https://github.com/SysBioChalmers/GECKO) since 2017,providing a platform for open and collaborative development. The generation of output modelfiles in .txt and SBML L3V1 FBC246 formats enabled the utilization of ecYeastGEM1 structureas a standard test to track the effects of any modifications in the toolbox algorithm through theuse of the Git version control system, contributing to reproducibility of results and backwardscompatibility of code. Interaction with users of the GECKO toolbox and the ecYeastGEM model has also beenfacilitated through the use of the GECKO repository, allowing users to raise issues related withthe programming of the toolbox or even about conceptual assumptions of the method, whichhas guided cumulative enhancements. Additionally, technical support for installation andutilization of the toolbox and ecYeastGEM is now provided through an open community chatroom (available at: https://gitter.im/SysBioChalmers/GECKO), reinforcing transparent andcontinuous communication between users and developers. New additions to the GECKO toolbox
Page 5/28
The first implementation of the GECKO method significantly improved phenotype predictionsfor S. cerevisiae’s metabolism under a wide variety of genetic and environmentalperturbations38. However, its development underscored some issues, in particular thatquantitative prediction of the critical dilution rate and exchange fluxes at fermentativeconditions are highly sensitive to the distribution of incorporated kinetic parameters. AlthoughS. cerevisiae is one of the most studied eukaryal organisms, not all reactions included in itsmodel have been kinetically characterized. Therefore, a large number of kcat numbers
measured for other organisms (48.35%), or even non-specific to their reaction mechanism(56.03% of kcat values found by introduction of wild cards into E.C. numbers) were needed to
be incorporated, in order to fill the gaps in the available data for the reconstruction of the firstS. cerevisiae ecModel, ecYeast7. Moreover, detailed manual curation of kcat numbers was
needed for several key enzymes in order to achieve biologically meaningful predictions. As the BRENDA database47 is the main source of kinetic parameters for GECKO, all of theavailable kcat and specific activity entries for non-mutant enzymes were retrieved. In total,
38,280 entries for 4,130 unique E.C. numbers were obtained and classified according tobiochemical mechanisms, phylogeny of host organisms and metabolic context (Supp. file 1), inorder to assess significant differences in distributions of kinetic parameters. This analysisshowed that not all organisms have been equally studied. Whilst entries for H. sapiens, E. coli,R. norvegicus and S. cerevisiae account for 24.02% of the total, very few kinetic parameters areavailable for most of the thousands of organisms present in the database, showing a median of2 entries per organism (Fig. 1A, Supp. file 1). The analysis also showed that kinetic activity candiffer drastically, spanning several orders of magnitude even for families of enzymes withclosely related biochemical mechanisms (Fig. 1B). Finally, it was also observed that kcat
distributions for enzymes in the central carbon and energy metabolism differ significantly fromthose in other metabolic contexts across phylogenetic groups of host organisms (life kingdoms,according to the KEGG phylogenetic tree48), even without filtering the dataset for entriesreported exclusively for natural substrates, as previously done by other studies49 (Fig. 1C). As kcat numbers depend on biochemical mechanisms, metabolic context and phylogeny of host
organisms, a modified set of hierarchical kcat matching criteria was implemented as part of
GECKO 2.0. The modified parameterization procedure enables the incorporation of kineticparameters that have been reported as specific activities in BRENDA when no kcat is found for
a given query (as the specific activity of an enzyme is defined as its kcat over its molecular
weight), adding 8,118 new entries to the catalogue of kinetic parameters in the toolbox. Aphylogenetic distance-based criterion, based on the phylogenetic tree available in the KEGGdatabase48, was introduced for cases in which no organism-specific entries are available for a
Page 6/28
given query in the kinetic parameters dataset. A comparison of the new kcat matching criteria
with their predecessor set is shown in Supp. file 2. In order to assess the impact of the modified kcat assignment algorithm on an ecModel,
ecYeast7 was reconstructed using both the first and the new version of the GECKO toolbox(GECKO 2.0). A classification of the matched kcat numbers according to the different levels of
the new matching algorithm is provided in Fig. 1D. The incorporation of specific activity valuesin the parameter catalogue increased the number of kinetic parameters matched to completeE.C. numbers (no added wild cards) from 1432 to 2696 (Fig. 1E). Moreover, theimplementation of the phylogenetic distance-based criterion yielded a distribution of kineticparameters that showed no significant differences when compared to the values reported inBRENDA for all fungi species, in contrast to the kinetic profile matched by the previousalgorithm (p-values <10-10 and <10-7, when compared to the BRENDA fungi and S.cerevisiae distributions, respectively, under a Kolmogorov-Smirnov test) (Fig. 1F). The qualityof phenotype predictions for the ecYeast7 model enhanced by GECKO2.0 was evaluated bysimulation of batch growth in 19 different environments, with an average relative error of23.97% when compared to experimental data (Fig. 1G), in contrast, its GECKO1.0 counterpartyielded an average relative error of 32.07%. The introduction of manually curated kcat numbers in a metabolic network has been proven to
increase the quality of phenotype predictions for S. cerevisiae22,25,38; nevertheless, this is anintensive and time consuming procedure that is hard to ensure for a large number of modelssubject to continuous modifications. In order to ensure applicability of the GECKO method toany standard GEM, a unified procedure for curation of kinetic parameters was developedbased on parameter sensitivity analysis. For automatically generated ecModels that are notable to reach the provided experimental value for maximum batch growth rate, an automaticmodule performs a series of steps in which the top enzymatic limitation on growth rate isidentified through the quantification of enzyme control coefficients. For such enzymes, the E.C.number is obtained and then its correspondent kcat value is substituted by the highest one
available in BRENDA for the given enzyme class. This procedure iterates until the specificgrowth rate predicted by the model reaches the provided experimental value. Finally, as the first version of the toolbox relied on the structure and nomenclature of themodel Yeast7, its applicability to other reconstructions was not possible in a straightforwardway. In order to provide compatibility with any other GEM, based on COBRA44 orRAVEN50 formats, all of the organism-specific parameters required by the method(experimental growth rate, total protein content, organism name, names and identifiers for
Page 7/28
some key reactions, etc.) can be provided in a single MATLAB initialization script, minimizingthe modifications needed for the generation of a new ecModel. ecModels container: an automatically updated repositorySeveral GEMs that have been published are still subject to continuous development andmaintenance1–3,5,6, this renders GEMs to be dynamic structures that can change rapidly. Inorder to integrate such continuous updates into the enzyme constrained version of a model inan organized way, an automated pipeline named ecModels container was developed. The ecModels container is a continuous integration implementation whose main functionality isto provide a catalogue of ecModels for several relevant organisms that are automaticallyupdated every time a modification is detected either in the original GEM source repository orin the GECKO toolbox, i.e. new releases in their respective repositories. The pipeline generatesecModels in different formats, including the standard SBML and MATLAB files, and storesthem in a container repository (https://github.com/SysBioChalmers/ecModels) in a versioncontrolled way, requiring minimal human interaction and maintenance. The GECKO toolboxensures the creation of functional and calibrated ecModels that are compatible with theprovided experimental data (maximum batch growth rate, total protein content of cells andexchange fluxes at different dilution rates as an optional input). This whole computationalpipeline is illustrated in Fig. 2. Further description of the ecModels container pipelinefunctioning is included in in the Materials and Methods section. A catalogue of new ecModelsFollowing the aforementioned additions to the GECKO toolbox, that have allowed itsgeneralization, we used the toolbox for the reconstruction of four new ecModels frompreviously existing high-quality metabolic network reconstructions: iYali4, for the oleaginous
yeast Yarrowia lipolytica5; iSM996, for the thermotolerant yeast Kluyveromyces marxianus6;
iML1515, for the widely studied bacterium E. coli4; and Human1, being the latest and largestnetwork reconstruction available for studying H. sapiens metabolism2. For the microbialmodels, all model parameters were calibrated according to the provided experimental data,generated by independent studies4,51–53, yielding functional ecModels ready for simulations.Size metrics for these models can be seen in Table 1. These ecModels, together with ecYeastGEM, are hosted in the ecModels container repositoryfor their continuous and automated update every time that a version change is detected eitherin the original model source or in the GECKO repository. In the case of microbial species, twodifferent model structures are provided: ecModel, which has unbounded individual enzymeusage reactions ready for incorporation of proteomics data; and ecModel_batch in which allenzyme usage reactions are connected to a shared protein pool. This pool is then constrained
Page 8/28
by experimental values of total protein content, and calibrated for batch simulations usingexperimental measurements of maximum batch growth rates on minimal glucose media, thusproviding a functional ecModel structure ready for simulations. For ecHumanGEM just the unbounded ecModel files are provided, as this is a general networkof human metabolism, containing all reactions from any kind of human tissue or cell type forwhich evidence is available, and therefore not suitable for numerical simulation. As H. sapiensis the most represented organism in the BRENDA database, accounting for 11% of the totalnumber of available kcat values (Supp. file 1), kinetic parameters from other organisms were
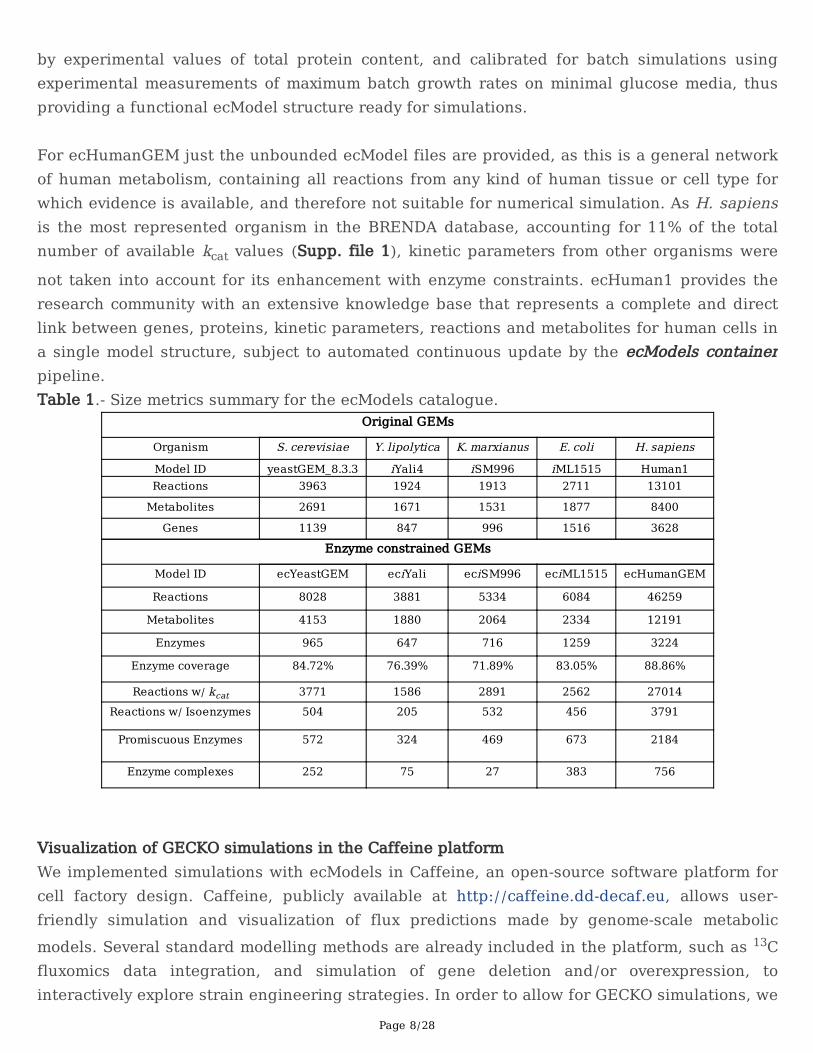
not taken into account for its enhancement with enzyme constraints. ecHuman1 provides theresearch community with an extensive knowledge base that represents a complete and directlink between genes, proteins, kinetic parameters, reactions and metabolites for human cells ina single model structure, subject to automated continuous update by the ecModels containerpipeline.Table 1.- Size metrics summary for the ecModels catalogue.
Original GEMs
Organism S. cerevisiae Y. lipolytica K. marxianus E. coli H. sapiens
Model ID yeastGEM_8.3.3 iYali4 iSM996 iML1515 Human1Reactions 3963 1924 1913 2711 13101
Metabolites 2691 1671 1531 1877 8400
Genes 1139 847 996 1516 3628
Enzyme constrained GEMs
Model ID ecYeastGEM eciYali eciSM996 eciML1515 ecHumanGEM
Reactions 8028 3881 5334 6084 46259
Metabolites 4153 1880 2064 2334 12191
Enzymes 965 647 716 1259 3224
Enzyme coverage 84.72% 76.39% 71.89% 83.05% 88.86%
Reactions w/ kcat 3771 1586 2891 2562 27014Reactions w/ Isoenzymes 504 205 532 456 3791
Promiscuous Enzymes 572 324 469 673 2184
Enzyme complexes 252 75 27 383 756
Visualization of GECKO simulations in the Caffeine platformWe implemented simulations with ecModels in Caffeine, an open-source software platform forcell factory design. Caffeine, publicly available at http://caffeine.dd-decaf.eu, allows user-friendly simulation and visualization of flux predictions made by genome-scale metabolicmodels. Several standard modelling methods are already included in the platform, such as 13Cfluxomics data integration, and simulation of gene deletion and/or overexpression, tointeractively explore strain engineering strategies. In order to allow for GECKO simulations, we

Page 9/28
added a new feature to the platform for uploading enzyme-constrained models and absoluteproteomics data. Additionally, we added a simulation algorithm that recognizes said models,and overlays the selected proteomics data on them, leaving out data that makes the modelunable to grow at a pre-specified growth rate. After these inclusions to the platform, enzymeusage can now be computed on the fly and visualized on metabolic maps (Fig. 2B), to identifypotential metabolic bottlenecks in a given condition. The original proteomics data can bevisualized as well, to identify if the specific bottleneck is due to a lack of enzyme availability, orinstead due to an inefficient kinetic property. This will suggest different metabolic engineeringstrategies to the user: if the problem lies in the intracellular enzyme levels, the user caninterpret this as a recommendation for overexpressing the corresponding gene, whereas if theproblem lies in the enzyme efficiency, the user could assess introducing a heterologous enzymeas an alternative. GECKO simulation utilitiesAs ecModels are defined in an irreversible format and incorporate additional elements such asenzymes (as new pseudo-metabolites) and their usages (represented as pseudo-reactions), theymight sometimes not be directly compatible with all of the functionalities offered by currentlyavailable constraint-based simulation software44,45,50,54,55. We therefore added several newfeatures to the GECKO toolbox that allow the exploration and exploitation of ecModels. Theseinclude utilities for: 1) basic simulation and analysis purposes, 2) accessible retrieval of kineticparameters, 3) automated generation of condition-dependent ecModels with proteomicabundance constraints, 4) comparative flux variability analysis between a GEM and its ecModelcounterpart, and 5) prediction of metabolic engineering targets for enhanced production withan implementation of the FSEOF method56 for ecModels. Detailed information about the inputsand outputs for each utility can be found on their respective documentation, availableat: https://github.com/SysBioChalmers/GECKO/tree/master/geckomat/utilities. All of theseutilities were developed in MATLAB due to their dependency on some RAVEN toolboxfunctions50. Predicting microbial proteome allocation in multiple environmentsIn order to test the quality of the phenotype predictions of an ecModel automatically generatedby the ecModels container pipeline, batch growth under 11 different carbon sources wassimulated with eciML1515 for E. coli. Figure 3A shows that, for all carbon sources, growthrates were predicted at the same order of magnitude as their corresponding experimentalmeasurements, with the most accurate predictions obtained for growth on D-glucose, mannoseand D-glucosamine. Furthermore, batch growth rate and protein allocation predictions, usingno exchange flux constraints, were compared between eciML1515 and the iJL1678 ME-model32, the latter accounting for both metabolism and macromolecular expression processes.The sum squared error (SSE) for batch growth rate predictions across the 11 carbon sources
Page 10/28
using eciML1515 was 0.27, a drastic improvement when compared to the 1.21 SSE of iJL1678ME-model predictions32. Figure 3B shows the predicted total proteome needed by cells tosustain the provided experimental growth rates for the same 11 environments. NotablyeciML1515 predicts values that lie within the range of predictions of the iJL1678 ME-model(from the optimal to the generalist case) for 10 out of the 11 carbon sources (see Materialesand Methods for simulation details). This shows that the new version of the GECKO toolboxensures the generation of functional ecModels that can be readily used for simulation ofmetabolism, due to its systematic parameter flexibilization step which reduces the need ofextensive manual curation for new ecModels. Furthermore, iML1515 is a model available as astatic file at the BiGG models repository57; therefore, its integration to the ecModels containerfor continuous update demonstrates the flexibility of our pipeline, regarding compatibility withoriginal GEM sources, which can be provided as a link to their git-based repositories or even asstatic URLs. Proteomics constraints refine phenotype predictions for multiple organisms and conditions The previously mentioned module for integration of proteomics data generates a condition-dependent ecModel with proteomics constraints for each condition/replicate in a provideddataset of absolute protein abundances [mmol/gDw]. Even though absolute quantification ofproteins is becoming more accessible and integrated into systems biology studies58–62, a majorcaveat of using proteomics data as constraints for quantitative models is their intrinsic highbiological and technical variability63, therefore some of the incorporated data constraints needto be loosened in order to obtain functional ecModels. When needed, additional condition-dependent exchange fluxes of byproducts can also be used as constraints in order to limit thefeasible solution space. A detailed description of the proteomics integration algorithmimplemented in GECKO is given in Supp. file 2. The new proteomics integration module was tested on the three ecModels for budding yeastsavailable in ecModels container (ecYeastGEM, eciYali, eciSM996). We measured absoluteprotein abundances for S. cerevisiae, Y. lipolytica and K. marxianus, grown in chemostats at0.1 h-1 dilution rate and subject to several experimental conditions (high temperature, low pHand osmotic stress with KCl)64, and incorporated these data into the ecModels as upper boundsfor individual enzyme usage pseudo-reactions. Then, exchange fluxes for CO2 and oxygen
corresponding to the same chemostat experiments were used as a comparison basis to evaluatequality of phenotype predictions. For each organism-condition pair, 3 models were generatedand compared in terms of predictions: a pure stoichiometric metabolic model, an enzyme-constrained model with a limited shared protein pool, and an enzyme-constrained model withproteomics constraints. It was found that the addition of the enzyme pool constraint enablesmajor reduction of the relative error in prediction of gaseous exchange fluxes in some of thestudied conditions. Additionally, the incorporation of individual protein abundance constraints
Page 11/28
improves even further the predictive accuracy of gaseous exchanges, for 10 out of the 11evaluated cases (Fig. 4A-C). The impact of incorporating enzyme and proteomics constraints on intracellular fluxpredictions was further assessed by mapping all condition-dependent flux distributions fromthe tested ecModels to their corresponding reactions in the original GEMs. In general,metabolic flux distributions showed high similarity when comparing ecModel to GEMpredictions (Fig. S1), as 70-90% of the active fluxes were predicted within the interval of 0.5 <
fold-change < 2 across all conditions (Fig. S2 A-C, Supp. file 3). In addition,principal component analysis on absolute enzyme usage profiles predicted by ecModelsrevealed that, at low dilution rates, predictions of enzyme demands are mostly defined by theselected set of imposed constraints (shared protein pool vs. proteomics constraints) rather thanby environmental condition, i.e. exchange fluxes (Fig. S2 D-F). However, more straightfrowardcomparison of the models’ predictions, by pairwise comparison of predicted absolute enzymeusage profiles, showed that 60 – 80% of the predicted enzyme usages lie within a range of 0.5< fold-change < 2, when comparing ecModels predictions with and without proteomicsconstraints, across organisms and conditions (Fig. 4D, Fig. S2 G-I and Supp. file 3). It wasobserved that the incorporation of proteomics constraints induces a drastic differential use fora considerable amount of enzymes, as 12-21% of enzyme usages were predicted as eitherenabled or disabled by these constraints across all the simulated conditions, showing slightenrichment for enabled alternative isoenzymes for already active reactions (Supp. file 3). Thissuggests that upper bounds on enzyme usages induce differentiated utilization of isoenzymes,reflecting well why isoenzymes have been maintained throughout evolution.The explicit inclusion of enzymes into GEMs by the GECKO method enables prediction ofenzyme demands at the protein, reaction and pathway levels. Total protein burden valuespredicted by ecModels for several relevant metabolic superpathways (central carbon andenergy metabolism, amino acid metabolism, lipid and fatty acid metabolism, cofactor andvitamin metabolism and nucleotide metabolism, according to the KEGG metabolicsubsystems48), showed that central carbon and energy metabolism is the most affected sectorin the ecYeastGEM network by integration of proteomics constraints, as protein burdenpredictions were higher, at least by 20%, for 3 out the 4 simulated conditions when comparedwith predictions of the ecYeastGEM without proteomics data (Fig. 4E). Relative enzyme usages, estimated as predicted absolute enzyme usage over enzyme
abundance for all of the measured enzymes in an ecModel , can be understood as thesaturation level of enzymes in a given condition. In order to analyze the metabolic mechanismsunderlying long-term adaptation to stress in budding yeasts, relative enzyme usage profileswere computed from all the previous simulations of ecModels with proteomics constraints.
Page 12/28
Enzymes that display fold-changes higher than 1 for both absolute abundance and theirsaturation level, when comparing predicted usage profiles between stress and referenceconditions, suggest regulatory mechanisms on individual proteins that contribute to cellgrowth on the anlyzed stress condition. Figure 4F shows all of the enzymes that wereidentified as responsive to environmental stress in this study, displaying enrichment for enzymes involved in biosynthesis of diverse amino acids and folate metabolism.A further mapping of all enzymes in these ecModels to a list of 2,959 single copy protein-coding gene orthologs across the three yeast species64 found 310 core proteins across theseecModels. Principal component analysis revealed that variance on absolute enzyme usages andabundance profiles for these core proteins is mostly explained by differences in the metabolicnetworks of the different species rather than by environmental conditions (Fig. S3 B-C),reinforcing previous results suggesting that, despite being phylogenetically related, their long-term stress responses at the molecular level have evolved independently after their divergencein evolutionary history64. Exploring the solution space reductionA major limitation in the use of GEMs is the high variability of flux distributions for a givencellular objective when implementing flux balance analysis, as this requires solving largelyunderdetermined linear systems through optimization algorithms15,65. This limitation hasusually been overcome with incorporation of measured exchange fluxes as constraints.However, these data are typically sparse in the literature. Previous studies explored the drasticreduction in flux variability ranges of ecModels for S. cerevisiae and 11 human cell-lines whencompared to their original GEMs due to the addition of enzyme constraints1,2,38. However, theirreversible format of ecModels (forward and backwards reactions are split in order to accountfor enzyme demands of both directions) hinders their compatibility with the flux variabilityanalysis (FVA) functions already available in COBRA44 and RAVEN50 toolboxes. As a solution tothis, an FVA module was integrated to the utilities repertoire in GECKO, whose applicability
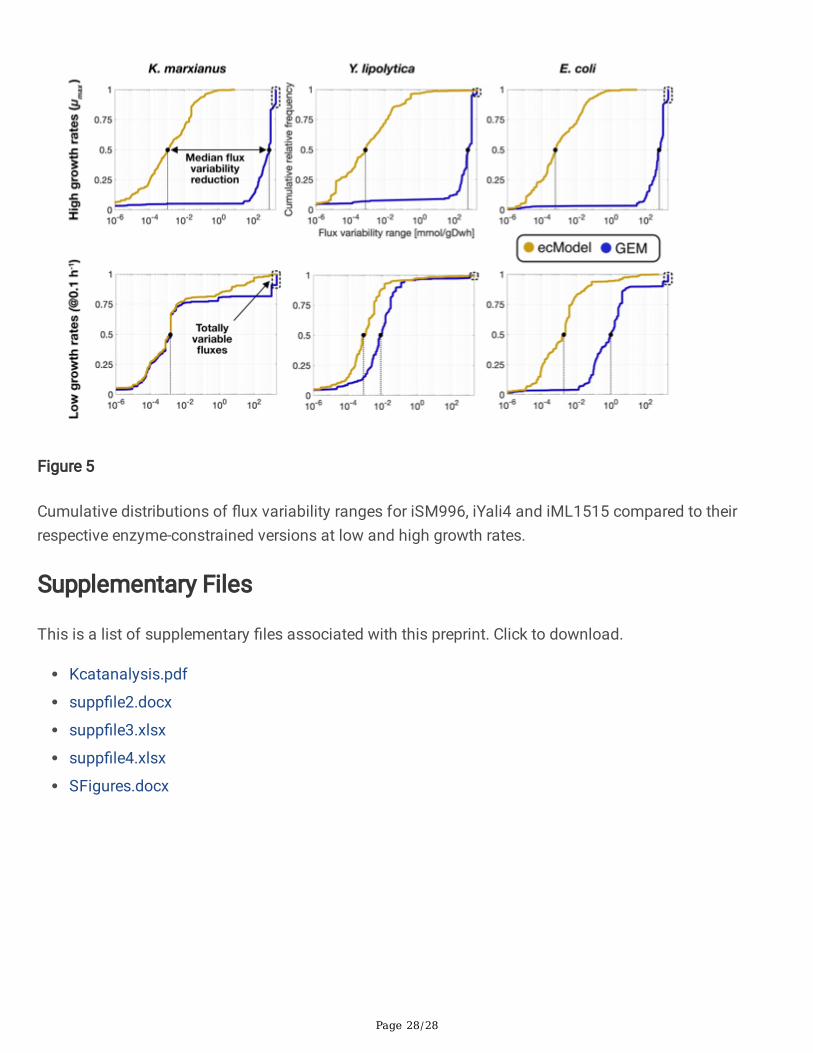
has been previously tested on studies with ecModels for S. cerevisiae1 and human cell lines2.This module contains the necessary functions to perform FVA on any set of reactions of anecModel, enabling also a direct comparison of flux variability ranges between an ecModel andits GEM counterpart in a consistent way (see Supp. file 2). The FVA utility was applied on three different ecModels of microbial metabolism and theircorrespondent GEMs (iML1515, iYali4 and iSM996). In all cases the FVA comparisons werecarried out for both chemostat and batch growth conditions in order to span different degreesof constraining of the metabolic networks (0.1 h-1 dilution rate and minimal glucose uptakerate fixed for chemostat conditions; biomass production fixed to experimental measurementsof and unconstrained uptake of minimal media components, for batch conditions). Cumulativedistributions for flux variability ranges for all explored ecModels and GEMs are shown
Page 13/28
in Figure 5, in which it can be seen that median flux variability ranges are much reduced forall ecModels and conditions, especially at high growth rates where enzyme constraints reducethe variability range 5-6 orders of magnitude when compared to pure GEMs. The cumulativedistributions also show a major reduction in the amount of totally variable fluxes (reactionsthat can carry any flux between -1000 to 1000 mmol/gDw h), which are an indicator ofundesirable futile cycles present in the network due to lack of thermodynamic and enzyme costinformation66–68. For high growth rates, the amount of totally variable fluxes accounts for 3-12% of the active reactions in the analysed GEMs, in contrast to their corresponding ecModelsin which such extreme variability ranges are completely absent. Further analysis of the FVA results revealed that a reduction of at least 95% of the variabilityrange was achieved for more than 90% of all active fluxes at high growth rates in all ecModel.Interestingly, the aforementioned flux variability metrics were overall improved even for thechemostat conditions, despite a higher degree of constraining (fixed low growth rate andoptimal uptake rate), which restrains these models to an energy efficient respiratory mode(Supp. file 4).
DiscussionHere we demonstrated how enzyme constrained models for diverse species signi�cantly improvesimulation performance compared to traditional GEMs. Furthermore, to enable the community to easilyadapt this modelling approach, we upgraded the GECKO toolbox for enhancement of genome-scalemodels with enzyme and omics constraints to its version 2.0. Major improvements on the kcat matchingalgorithm were incorporated into the toolbox, based on phylogenetic distance between the modeledorganism and the host organisms for data queries, and an automated curation of kcat numbers for over-constrained models were incorporated into the toolbox. Major refactoring of the GECKO toolbox enableda generalization of the method, allowing the creation of high-quality ecModels for any providedfunctional GEM with minimal need for case-speci�c introduction of new code. Additionally, several utilityfunctions were integrated into the toolbox in order to enable basic simulation purposes, accessibleretrieval of enzyme parameters, integration of proteomics data as constraints, �ux variability analysisand prediction of gene targets for enhanced production of metabolites. Overall, it was shown that theseenhancements to the GECKO toolbox improve the incorporation of kinetic parameters into a metabolicmodel, yielding ecModels with biologically meaningful kinetic pro�les without compromising accuracy onphenotype predictions.
Two major limitations of the �rst version of the GECKO toolbox were its speci�c customization to the S.cerevisiae model, Yeast7, and the need of extensive manual curation for generating an ecModel suited forFBA simulations; thus, its applicability to other GEMs was not a straightforward procedure. To overcomethese limitations, we generalized the code with the aim of making GECKO a model-agnostic tool. Thedevelopment of a procedure for automatic curation of kinetic parameters enabled the generation of

Page 14/28
functional ecModels with minimal requirements for experimental data. Recently, ecModels for 11 humancancer cell-lines were generated with this automated procedure, using Human1 as a model input andRNAseq datasets together with the tINIT algorithm10 to generate cell-line speci�c networks2. TheseecModels were used for the prediction of cellular growth and metabolite exchange rates at different levelsof added constraints, resulting in remarkable improvements in accuracy when compared with predictionsof their original GEMs. This highlights one of the main advantages of ecModels: their capability ofyielding biologically meaningful phenotype predictions without an excessive dependency on exchange�uxes as constraints.
In order to further showcase the functionality of the GECKO toolbox 2.0, a family of new high-qualityecModels were generated for E. coli, Y. lipolytica, K. marxianus and H. sapiens, based on the originalGEMs iML1515, iYali4, iSM996 and Human1, respectively. Furthermore, we generated a self-hostedpipeline for continuous and automated generation and update of ecModels, ecModels container, so thateach of the currently available ecModels (ecYeastGEM, eciML1515, eciYali, eciSM996 and ecHuman1)are integrated to it, providing a version-controlled and continuously updated repository for high-qualityecModels.
Absolute proteomics measurements for the budding yeasts S. cerevisiae, K. marxianus and Y. lipolyticagrown under multiple environmental conditions, were incorporated as constraints into their ecModels byusing the proteomics integration module added to the GECKO toolbox. Analysis of metabolic �uxdistributions revealed that net reaction �uxes predicted by GEMs are not signi�cantly affected by theincorporation of kinetic and proteomics constraints, however the explicit integration of enzymes intoecModels extends the range of predictions of classical FBA and enables computation of enzymedemands at the reaction and pathway levels. It was found that incorporation of proteomics constraintsdoes not affect enzyme demand predictions signi�cantly for most of the active enzymes at low dilutionrates across the simulated conditions. However, we observed that a diversi�ed utilization of isoenzymes,enforced by proteomics constraints, increases the predicted total protein mass allocated to central carbonand energy metabolism, in comparison to optimal enzyme allocation pro�les. This result suggests therelevance of metabolic robustness in contrast to optimal protein utilization for microbial growth underenvironmental stress and nutrient-limited conditions.
Incorporation of proteomics data allows the use of ecModels as scaffolds for systems-level studies ofmetabolism, providing a tool for uncovering metabolic readjustments induced by genetic andenvironmental perturbations, which might be di�cult to elucidate by purely data-driven approaches,specially at conditions of relatively low changes at the transcript69 and protein levels64. For all studiedstress conditions in this study, we identi�ed upregulated proteins (increased abundance) that are neededto operate at high saturation levels in stress conditions, while showing low usage at reference conditions,creating lists of potential gene ampli�cation targets for enhancing stress tolerance in three industriallyrelevant yeast species (Supp. �le 3). Upregulation and high saturation of enzymes in amino acid andfolate metabolism were found to be common across the studied organisms and stress conditions (Fig.S3 D and Supp. �le 3). These results suggests that yeast cells display enzyme expression pro�les that

Page 15/28
provide them with metabolic robustness for microbial growth under stress and nutrient-limited conditions,in contrast to an optimal protein allocation strategy that prioritizes expression of the most e�cient andnon-redundant enzymes.
Our results on drastic reduction of median �ux variability ranges and the number of totally unbounded�uxes for eciYali, eciSM996 and eciML1515, together with previous studies1,2,38, suggest that a majorreduction of the solution space of metabolic models to a more biologically meaningful subspace is ageneral property of ecModels. However, �ux variability is an intrinsic characteristic of metabolism;therefore, metabolic models with highly constrained solution spaces may exclude some biologicalcapabilities of organisms, which are not compatible with the set of constraints used for the analysis(exchange �uxes, growth rates and even pro�les of kinetic parameters, considered as condition-independent in ecModels).
Here, the predictive capabilities of eciML1515 and iJL1678 ME-model (both for E. coli) for cellular growthand global protein demands on diverse environments were compared. The major improvement inpredicted maximum growth rates, together with a comparable performance on quanti�cation of proteindemands, shown by eciML1515 suggest that, despite its mathematical and conceptual simplicity, theGECKO formalism is a suitable framework for quantitative probing of metabolic capabilities, compatiblewith the widely used FBA method and without the need of excessive complexity or computational power.Nevertheless, ME-models provide a much wider range of predictions that explore additional processes incell physiology with great detail. Direct comparison between the predictions of these modellingformalisms, suggest that ME-models performance can be improved by incorporation of either curated orsystematically retrieved kinetic parameters that are suitable for the modelled organisms.
Simpler modelling frameworks that account for protein or enzyme constraints in metabolism, such as�ux balance analysis with molecular crowding (FBAwMC)16,17, metabolic modelling with enzyme kinetics(MOMENT)23 and constrained allocation �ux balance analysis (CAFBA)21, have also been developed andused to explore microbial cellular growth16,17,21 and over�ow metabolism16,23. These methods haveovercome the lack of reported parameters for some speci�c reactions either by incorporation ofproteomics measurements and prior �ux distributions23, manual curation and sampling procedures16,17
or even by lumping protein demands by functionally related proteome groups. In contrast, the new versionof the GECKO toolbox provides a systematic and robust parameterization procedure, leveraging the vastlyaccumulated knowledge of biochemistry research stored in public databases, ensuring the incorporationof biologically meaningful kinetic parameters even for poorly studied reactions and organisms.
The applicability of these other simple modelling formalisms to models for diverse species is limited asnone of these methods has been provided as part of a generalized model-agnostic softwareimplementation. Recently, a simpli�ed variant of the MOMENT method (sMOMENT) was developed andembedded into an automated pipeline for generation and calibration of enzyme-constrained models ofmetabolism (AutoPACMEN)70. The pipeline was tested on the generation of an enzyme-constrainedversion of the iJO1366 metabolic reconstruction for E. coli, which also showed consistency with
Page 16/28
experimental data. This work represented a step forward in the �eld of constrain-based metabolicmodelling, as it contributed to standardization of model generation and facilitating their utilization andapplicability to other cases. However, due to the intrinsic trade-off between model simplicity anddescriptive representation, a limitation of the sMOMENT method is its simpli�cation of redundancies inmetabolism, which just accounts for the optimal way of catalysing a given biochemical reaction,discarding the representation of alternative isoforms that might be relevant under certain conditions. InGECKO ecModels, all enzymes for which a gene-E.C. number relationship exists are included in the modelstructure. As traditional FBA simulations rely on optimality principles one could, in principle, expect thesame predicted �ux distributions by sMOMENT and GECKO ecModels. Nonetheless, the explicitincorporation of all enzymes in a metabolic network enables explanation of protein expression pro�lesthat deviate from optimality in order to gain robustness to changes in the environment, as it has beenrecently shown by the integration of a regulatory nutrient-signalling Boolean network together with anecModel for S. cerevisiae’s central carbon metabolism71.
In conclusion, GECKO2.0 together with the development of the automated pipeline ecModels containerfacilitates the generation, standardization, utilization, exchange and community development ofecModels through a transparent version-controlled environment. This tool provides a dynamic, andpotentially increasing, catalogue of updated ecModels trying to close the gap between model developersand �nal users and reduce the time-consuming tasks of model maintenance. We are con�dent that thiswill enable wide use of ecModels in basic science for obtaining novel insight into the function ofmetabolism as well as in synthetic biology and metabolic engineering for design of strains with improvedfunctionalities, e.g., for high-level production of valuable chemicals.
Material And MethodsAutomation pipeline and version-controlled hosting of the ecModels container
The ecModels repository is used to version-control the pipeline code and the resulting models. Thepipeline is restricted to 2 short Python �les, whose role is to decide when models need to be updatedbased on a con�guration �le con�g.ini, and to consequently invoke the use of GECKO for each model.Updates are deemed necessary when either the underlying dependencies (i.e., GECKO, RAVEN and COBRAtoolboxes, the Gurobi solver, and libSMBL) or the source GEMs are independently updated to a newversion (release) in their respective repositories.
The pipeline is designed be automatic and to not require supervision. It was developed to work with bothversion-controlled GEMs and GEMs downloadable from a URL, updating the version in the con�gurationafter a new ecModel is obtained. For easy review, the pipeline log is publicly available under the Actionstab of the GitHub repository. The computation is performed through a self-hosted GitHub runner, furtherleveraging the transparent nature of the GitHub platform and the git version-control system. The resultingecModel and updated con�guration are committed to the repository, with the changes being madeavailable for review through a pull request. Additionally, the GECKO output is also replicated in the pull

Page 17/28
request body. The ecModels container thus continues the transparency and reproducibility of the sourcemodels.
Quanti�cation of absolute protein concentrations for S. cerevisiae, Y. lipolytica and K. marxianus
Total protein extraction for the strains Saccharomyces cerevisiae CEN.PK113-7D (standard, low pH, hightemperature, osmotic stress), Kluyveromyces marxianus CBS6556 (standard, low pH, high temperature,osmotic stress) and Yarrowia lipolytica W29 (standard, low pH, high temperature) was conducted asdescribed in Supp. �le 2. Three reference samples (hereafter, ‘bulk’ samples), one per strain, wereconstructed by pooling 5 µg of each experimental sample. Aliquots of 15 µg of total protein extract fromeach sample (3 strains x 4 conditions x 3 replicates) and the three bulks were separated on one-dimensional SDS-PAGE short-migration gels (1x1 cm lanes, Invitrogen, NP321BOX). Yeast proteinsdigestion was performed on excised bands from gel gradient and digested peptides of UPS2 (Sigma)were used as external standards for absolute protein quanti�cation (more details in Supp. �le 2). Four μlof the different peptide mixtures (800 ng for yeast peptides and 949 ng for bulks) were analyzed using anOrbitrap Fusion™ Lumos™ Tribrid™ mass spectrometer (Thermo Fisher Scienti�c).
Protein identi�cation was performed using the open-source search engine X!Tandem pipeline 3.4.472.Data �ltering was set to peptide E-value < 0.01 and protein log(E-value) < –3. Relative quanti�cation ofprotein abundances was carried out using the Normalized Spectral Abundance Factor (NSAF)73 and theNSAF values obtained from UPS2 proteins in bulk samples were used to determine the suitableregression curves that allowed the conversion from relative protein abundance into absolute terms. Theregression curves parameters for protein abundance quanti�cation are shown in Supp. �le 2. MS data isavailable online on public databases via the PRIDE repository74 with the dataset identi�er PXD012836.
Simulation of condition-dependent �ux distributions
Simulation of cellular phenotypes for conditions of environmental stress at low dilution rates with GEMswere performed by �rst setting bounds on measured glucose uptake and byproduct secretion ratesaccording to experimental data from previous studies on chemostats64. Then the biomass productionrate was constrained (both upper and lower bounds) with the experimental dilution rate (0.1 h-1).Maximization of the non-growth associated maintenance pseudo-reaction was set as an objectivefunction for the parsimonious FBA problem as a representation of the additional energy demands forregulation of cellular growth at non-optimal conditions. The same procedure was followed forsimulations with ecModels constrained by a total protein pool. For the case of ecModels with proteomicsconstraints, the same set of constraints was used but the objective function was set as minimization ofthe total usage of unmeasured proteins, assuming that the regulatory machinery for stress tolerance isrepresented by the condition-speci�c protein expression pro�le.
Page 18/28
Prediction of microbial batch growth rates
Batch cellular growth was simulated by allowing unconstrained uptake of all nutrients present in minimalmineral media, enabling a speci�c carbon source uptake reaction for each case while blocking the rest ofthe uptake reactions and allowing unconstrained secretion rates for all exchangeable metabolites.Maximization of the biomass production rate was used as an objective function for the resulting FBAproblem. For prediction of total protein demands on unlimited nutrient conditions, media constraints wereset as expressed above and experimental batch growth rate values were �xed as both lower and upperbounds for the biomass production pseudo-reaction. The total protein pool exchange pseudo-reactionwas then unconstrained and set as an objective function to minimize, assuming that when exposed tounlimited availability of nutrients the total mass of protein available for catalyzing metabolic reactionsbecomes the limiting resource for cells. The solveLP function, available in the RAVEN toolbox, was usedfor solving all FBA problems in this study.
DeclarationsCode availability
The source code of the updated GECKO toolbox is available at:https://github.com/SysBioChalmers/GECKO. The code for ecModels container and the whole catalogueof updated ecModel �les can be accessed at: https://github.com/SysBioChalmers/ecModels. All customscripts for simulations included in this study can be found at:https://github.com/SysBioChalmers/GECKO2_simulations. All the necessary scripts for reproducing thekcat parameters analysis in Supplementary �le 2 are available at:https://github.com/SysBioChalmers/Enzyme-parameters-analysis. All of these repositories are public andopen to collaborative continuous development.
Acknowledgements
We are grateful to Feiran Li, Raphaël Ferreira, Jonathan Robinson and all the GECKO users that haveprovided feedback for improving our toolbox and extending its range of applications and to the CHASSYproject consortium for having motivated and supported this work. This project has received funding fromthe European Union’s Horizon 2020 Framework Programme for Research and Innovation – GrantAgreements No. 720824 and 686070. This work was also supported by the Knut and Alice WallenbergFoundation and The Novo Nordisk Foundation - Grant no NNF10CC1016517.
References
Page 19/28
1. Lu, H. et al. A consensus S. cerevisiae metabolic model Yeast8 and its ecosystem forcomprehensively probing cellular metabolism. Nat. Commun. (2019). doi:10.1038/s41467-019-11581-3
2. Robinson, J. L. et al. An atlas of human metabolism. Sci. Signal. (2020).doi:10.1126/scisignal.aaz1482
3. Tiukova, I. A., Prigent, S., Nielsen, J., Sandgren, M. & Kerkhoven, E. J. Genome-scale model ofRhodotorula toruloides metabolism. Biotechnol. Bioeng. (2019). doi:10.1002/bit.27162
4. Monk, J. M. et al. iML1515, a knowledgebase that computes Escherichia coli traits. NatureBiotechnology 35, 904–908 (2017).
5. Kerkhoven, E. J., Pomraning, K. R., Baker, S. E. & Nielsen, J. Regulation of amino-acid metabolismcontrols �ux to lipid accumulation in Yarrowia lipolytica. npj Syst. Biol. Appl. 2, 16005 (2016).
�. Marcišauskas, S., Ji, B. & Nielsen, J. Reconstruction and analysis of a Kluyveromyces marxianusgenome-scale metabolic model. BMC Bioinformatics (2019). doi:10.1186/s12859-019-3134-5
7. Meadows, A. L. et al. Rewriting yeast central carbon metabolism for industrial isoprenoid production.Nature (2016). doi:10.1038/nature19769
�. Chen, X. et al. Fumaric acid production by Torulopsis glabrata: Engineering the urea cycle and thepurine nucleotide cycle. Biotechnol. Bioeng. (2015). doi:10.1002/bit.25334
9. Mishra, P. et al. Genome-scale model-driven strain design for dicarboxylic acid production in Yarrowialipolytica. BMC Syst. Biol. (2018). doi:10.1186/s12918-018-0542-5
10. Agren, R. et al. Identi�cation of anticancer drugs for hepatocellular carcinoma through personalizedgenome-scale metabolic modeling. Mol. Syst. Biol. (2014). doi:10.1002/msb.145122
11. Mardinoglu, A. et al. Genome-scale metabolic modelling of hepatocytes reveals serine de�ciency inpatients with non-alcoholic fatty liver disease. Nat. Commun. 5, 1–11 (2014).
12. Gatto, F., Miess, H., Schulze, A. & Nielsen, J. Flux balance analysis predicts essential genes in clearcell renal cell carcinoma metabolism. Sci. Rep. (2015). doi:10.1038/srep10738
13. Orth, J. D., Thiele, I. & Palsson, B. Ø. What is �ux balance analysis? Nat. Biotechnol. 28, 245–248(2010).
14. Ibarra, R. U., Edwards, J. S. & Palsson, B. O. Escherichia coli K-12 undergoes adaptive evolution toachieve in silico predicted optimal growth. Nature (2002). doi:10.1038/nature01149
15. Mahadevan, R. & Schilling, C. H. The effects of alternate optimal solutions in constraint-basedgenome-scale metabolic models. Metab. Eng. 5, 264–276 (2003).
1�. Beg, Q. K. et al. Intracellular crowding de�nes the mode and sequence of substrate uptake byEscherichia coli and constrains its metabolic activity. Proc. Natl. Acad. Sci. U. S. A. 104, 12663–12668 (2007).
17. Vazquez, A. et al. Impact of the solvent capacity constraint on E. coli metabolism. BMC Syst. Biol. 2,7 (2008).

Page 20/28
1�. Molenaar, D., van Berlo, R., de Ridder, D. & Teusink, B. Shifts in growth strategies re�ect tradeoffs incellular economics. Mol. Syst. Biol. 5, 323 (2009).
19. Zhuang, K., Vemuri, G. N. & Mahadevan, R. Economics of membrane occupancy and respiro-fermentation. Mol. Syst. Biol. 7, (2011).
20. Shlomi, T., Benyamini, T., Gottlieb, E., Sharan, R. & Ruppin, E. Genome-scale metabolic modelingelucidates the role of proliferative adaptation in causing the warburg effect. PLoS Comput. Biol. 7, 1–8 (2011).
21. Mori, M., Hwa, T., Martin, O. C., De Martino, A. & Marinari, E. Constrained Allocation Flux BalanceAnalysis. PLoS Comput. Biol. 12, (2016).
22. Nilsson, A. & Nielsen, J. Metabolic Trade-offs in Yeast are Caused by F1F0-ATP synthase. Sci. Rep. 6,1–11 (2016).
23. Adadi, R., Volkmer, B., Milo, R., Heinemann, M. & Shlomi, T. Prediction of microbial growth rate versusbiomass yield by a metabolic network with kinetic parameters. PLoS Comput. Biol. 8, (2012).
24. Nilsson, A., Björnson, E., Flockhart, M., Larsen, F. J. & Nielsen, J. Complex I is bypassed during highintensity exercise. Nat. Commun. (2019). doi:10.1038/s41467-019-12934-8
25. Chen, Y. & Nielsen, J. Energy metabolism controls phenotypes by protein e�ciency and allocation.Proc. Natl. Acad. Sci. U. S. A. (2019). doi:10.1073/pnas.1906569116
2�. van Hoek, M. J. A. & Merks, R. M. H. Redox balance is key to explaining full vs. partial switching tolow-yield metabolism. BMC Syst. Biol. (2012). doi:10.1186/1752-0509-6-22
27. Van Hoek, M. J. & Merks, R. M. Redox balance is key to explaining full vs. partial switching to low-yield metabolism. BMC Syst. Biol. 6, 22 (2012).
2�. Jeske, L., Placzek, S., Schomburg, I., Chang, A. & Schomburg, D. BRENDA in 2019: A European ELIXIRcore data resource. Nucleic Acids Res. (2019). doi:10.1093/nar/gky1048
29. Wittig, U., Rey, M., Weidemann, A., Kania, R. & Müller, W. SABIO-RK: An updated resource for manuallycurated biochemical reaction kinetics. Nucleic Acids Res. (2018). doi:10.1093/nar/gkx1065
30. O’Brien, E. J., Lerman, J. A., Chang, R. L., Hyduke, D. R. & Palsson, B. Genome-scale models ofmetabolism and gene expression extend and re�ne growth phenotype prediction. Mol. Syst. Biol. 9,(2013).
31. O’Brien, E. J. & Palsson, B. O. Computing the functional proteome: Recent progress and futureprospects for genome-scale models. Curr. Opin. Biotechnol. 34, 125–134 (2015).
32. Yang, L. et al. Principles of proteome allocation are revealed using proteomic data and genome-scalemodels. Sci. Rep. (2016). doi:10.1038/srep36734
33. King, Z. A., O’Brien, E. J., Feist, A. M. & Palsson, B. O. Literature mining supports a next-generationmodeling approach to predict cellular byproduct secretion. Metab. Eng. (2017).doi:10.1016/j.ymben.2016.12.004
34. Lerman, J. A. et al. In silico method for modelling metabolism and gene product expression atgenome scale. Nat. Commun. (2012). doi:10.1038/ncomms1928

Page 21/28
35. Chen, Y. et al. Proteome constraints reveal targets for improving microbial �tness in nutrient-rich 1environments 2 3 Author list. bioRxiv (2020).
3�. Bulović, A. et al. Automated generation of bacterial resource allocation models. Metab. Eng. (2019).doi:10.1016/j.ymben.2019.06.001
37. Goelzer, A. et al. Quantitative prediction of genome-wide resource allocation in bacteria. Metab. Eng.32, (2015).
3�. Sánchez, B. J. et al. Improving the phenotype predictions of a yeast genome-scale metabolic modelby incorporating enzymatic constraints. Mol. Syst. Biol. 13, 935 (2017).
39. Li, G. et al. Bayesian genome scale modelling identi�es thermal determinants of yeast metabolism.Nat. Commun. 12, 190 (2021).
40. Massaiu, I. et al. Integration of enzymatic data in Bacillus subtilis genome-scale metabolic modelimproves phenotype predictions and enables in silico design of poly-γ-glutamic acid productionstrains. Microb. Cell Fact. (2019). doi:10.1186/s12934-018-1052-2
41. Ye, C. et al. Improving lysine production through construction of an Escherichia coli enzyme-constrained model. Biotechnol. Bioeng. 117, 3533–3544 (2020).
42. Chen, Y. et al. Genome-scale modeling for Bacillus coagulans to understand the metaboliccharacteristics. Biotechnol. Bioeng. (2020). doi:10.1002/bit.27488
43. Sulheim, S. et al. Enzyme-Constrained Models and Omics Analysis of Streptomyces coelicolor RevealMetabolic Changes that Enhance Heterologous Production. iScience (2020).doi:10.1016/j.isci.2020.101525
44. Heirendt, L. et al. Creation and analysis of biochemical constraint-based models using the COBRAToolbox v.3.0. Nat. Protoc. 14, 639–702 (2019).
45. Ebrahim, A., Lerman, J. A., Palsson, B. O. & Hyduke, D. R. COBRApy: COnstraints-BasedReconstruction and Analysis for Python. BMC Syst. Biol. (2013). doi:10.1186/1752-0509-7-74
4�. Olivier, B. G. & Bergmann, F. T. The Systems Biology Markup Language (SBML) Level 3 Package: FluxBalance Constraints. J. Integr. Bioinform. 12, 269 (2015).
47. Placzek, S. et al. BRENDA in 2017: New perspectives and new tools in BRENDA. Nucleic Acids Res.45, D380–D388 (2017).
4�. Kanehisa, M., Furumichi, M., Sato, Y., Ishiguro-Watanabe, M. & Tanabe, M. KEGG: integrating virusesand cellular organisms. Nucleic Acids Res. (2020). doi:10.1093/nar/gkaa970
49. Bar-Even, A. et al. The moderately e�cient enzyme: Evolutionary and physicochemical trendsshaping enzyme parameters. Biochemistry 50, 4402–4410 (2011).
50. Wang, H. et al. RAVEN 2.0: A versatile toolbox for metabolic network reconstruction and a case studyon Streptomyces coelicolor. PLOS Comput. Biol. 14, e1006541 (2018).
51. Ochoa-Estopier, A. & Guillouet, S. E. D-stat culture for studying the metabolic shifts from oxidativemetabolism to lipid accumulation and citric acid production in Yarrowia lipolytica. J. Biotechnol.(2014). doi:10.1016/j.jbiotec.2013.11.008
Page 22/28
52. Aggelis, G. & Komaitis, M. Enhancement of single cell oil production by Yarrowia lipolytica growing inthe presence of Teucrium polium L. aqueous extract. Biotechnol. Lett. (1999).doi:10.1023/A:1005591127592
53. Overkamp, K. M. et al. In vivo analysis of the mechanisms for oxidation of cytosolic NADH bySaccharomyces cerevisiae mitochondria. J. Bacteriol. (2000). doi:10.1128/JB.182.10.2823-2830.2000
54. Li, M. & Borodina, I. Application of synthetic biology for production of chemicals in yeastSaccharomyces cerevisiae. FEMS Yeast Research 15, (2015).
55. Rocha, I. et al. OptFlux: An open-source software platform for in silico metabolic engineering. BMCSyst. Biol. (2010). doi:10.1186/1752-0509-4-45
5�. Choi, H. S., Lee, S. Y., Kim, T. Y. & Woo, H. M. In silico identi�cation of gene ampli�cation targets forimprovement of lycopene production. Appl. Environ. Microbiol. 76, 3097–3105 (2010).
57. Norsigian, C. J. et al. BiGG Models 2020: Multi-strain genome-scale models and expansion acrossthe phylogenetic tree. Nucleic Acids Res. 48, (2020).
5�. Björkeroth, J. et al. Proteome reallocation from amino acid biosynthesis to ribosomes enables yeastto grow faster in rich media. Proc. Natl. Acad. Sci. 117, 21804 LP – 21812 (2020).
59. Yu, R. et al. Nitrogen limitation reveals large reserves in metabolic and translational capacities ofyeast. Nat. Commun. (2020). doi:10.1038/s41467-020-15749-0
�0. Campbell, K. et al. Building blocks are synthesized on demand during the yeast cell cycle. Proc. Natl.Acad. Sci. U. S. A. (2020). doi:10.1073/pnas.1919535117
�1. Lahtvee, P. J. et al. Absolute Quanti�cation of Protein and mRNA Abundances DemonstrateVariability in Gene-Speci�c Translation E�ciency in Yeast. Cell Syst. 4, 495–504.e5 (2017).
�2. Di Bartolomeo, F. et al. Absolute yeast mitochondrial proteome quanti�cation reveals trade-offbetween biosynthesis and energy generation during diauxic shift. Proc. Natl. Acad. Sci. U. S. A.(2020). doi:10.1073/pnas.1918216117
�3. Sánchez, B. J. et al. Benchmarking accuracy and precision of intensity-based absolute quanti�cationof protein abundances in Saccharomyces cerevisiae. Proteomics n/a, 2000093 (2021).
�4. Doughty, T. W. et al. Stress-induced expression is enriched for evolutionarily young genes in diversebudding yeasts. Nat. Commun. (2020). doi:10.1038/s41467-020-16073-3
�5. Kauffman, K. J., Prakash, P. & Edwards, J. S. Advances in �ux balance analysis. Current Opinion inBiotechnology (2003). doi:10.1016/j.copbio.2003.08.001
��. Teusink, B. et al. Analysis of growth of Lactobacillus plantarum WCFS1 on a complex medium usinga genome-scale metabolic model. J. Biol. Chem. (2006). doi:10.1074/jbc.M606263200
�7. Beard, D. A., Liang, S. D. & Qian, H. Energy balance for analysis of complex metabolic networks.Biophys. J. (2002). doi:10.1016/S0006-3495(02)75150-3
��. Maurice Cheung, C. Y., George Ratcliffe, R. & Sweetlove, L. J. A method of accounting for enzymecosts in �ux balance analysis reveals alternative pathways and metabolite stores in an illuminated
Page 23/28
arabidopsis leaf. Plant Physiol. (2015). doi:10.1104/pp.15.00880
�9. Patil, K. R. & Nielsen, J. Uncovering transcriptional regulation of metabolism by using metabolicnetwork topology. Proc. Natl. Acad. Sci. U. S. A. (2005). doi:10.1073/pnas.0406811102
70. Bekiaris, P. S. & Klamt, S. Automatic construction of metabolic models with enzyme constraints. BMCBioinformatics (2020). doi:10.1186/s12859-019-3329-9
71. Österberg, L. et al. A novel yeast hybrid modeling framework integrating Boolean and enzyme-constrained networks enables exploration of the interplay between signaling and metabolism.bioRxiv 2020.09.11.290817 (2020). doi:10.1101/2020.09.11.290817
72. Langella, O. et al. X!TandemPipeline: A Tool to Manage Sequence Redundancy for Protein Inferenceand Phosphosite Identi�cation. J. Proteome Res. 16, (2017).
73. Zybailov, B. et al. Statistical analysis of membrane proteome expression changes in Saccharomycescerevisiae. J. Proteome Res. (2006). doi:10.1021/pr060161n
74. Vizcaíno, J. A. et al. 2016 update of the PRIDE database and its related tools. Nucleic Acids Res. 44,(2016).
Figures
Figure 1
Page 24/28
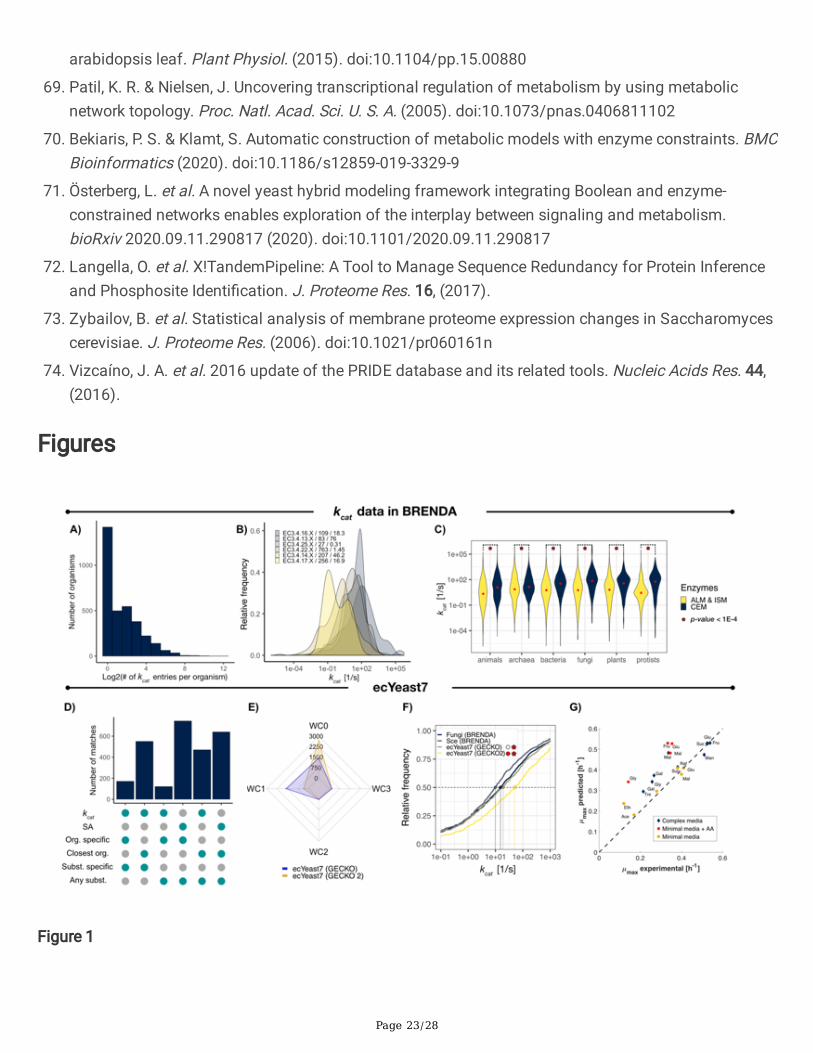
kcat distributions in BRENDA and ecYeast7. A) Number of kcat entries in BRENDA per organism. B) kcatdistributions for closely related enzyme families. Sample size and median values (in s-1) are shown aftereach family identi�er. C) kcat distributions for enzymes in BRENDA by metabolic context and lifekingdoms. Median values are indicated by red dots in each distribution, statistical signi�cance (under aKolmogorov-Smirnov test) is indicated by red stars for each pair of distributions for a given kingdom.CEM – central carbon and energy metabolism; ALM – Amino acid and lipid metabolism; ISM –Intermediate and secondary metabolism. D) Number of kcat matches in ecYeast7 per assignmentcategory (GECKO 2.0). E) Comparison of the number of kcat matches for E.C. numbers with 0, 1, 2 and 3introduced wild-cards by GECKO 2.0 and GECKO kcat matching algorithms. F) Cumulative kcatdistributions for: all S. cerevisiae entries in BRENDA, all entries for fungi in BRENDA, ecYeast7 enhancedby GECKO and ecYeast7 enhanced by GECKO 2.0. Colored points and vertical dashed lines indicate thevalue for the median value for each distribution. Statistical signi�cance under a Kolmogorov-Smirnov testof the matched kcat distributions when compared to all entries for S. cerevisiae and fungi, is shown withred circles and stars, respectively. p-values below 1x10⁻² are indicated with red. G) Prediction of batchmaximum growth rates on diverse media with ecYeast7 enhanced by GECKO 2.0. Glu – glucose, Fru –fructose, Suc – sucrose, Raf – ra�nose, Mal – maltose, Gal – galactose, Tre – trehalose, Gly – glycerol,Ace – acetate, Eth – ethanol.

Page 25/28
Figure 2
Extending utilization of ecModels. A) ecModels container: Integrated pipeline for continuous andautomated update of ecModels. B) Implementation of GECKO simulations in the Caffeine platform(https://caffeine.dd-decaf.eu/) for visualization of enzyme usage. The color of the arrows corresponds tothe value of the corresponding �uxes. Genes or reactions connected to enzymes with a usage above 90%
Page 26/28
are highlighted with a glow around the corresponding text or arrow, respectively. The chosen usagethreshold to highlight can be tuned with the slider on the right.
Figure 3
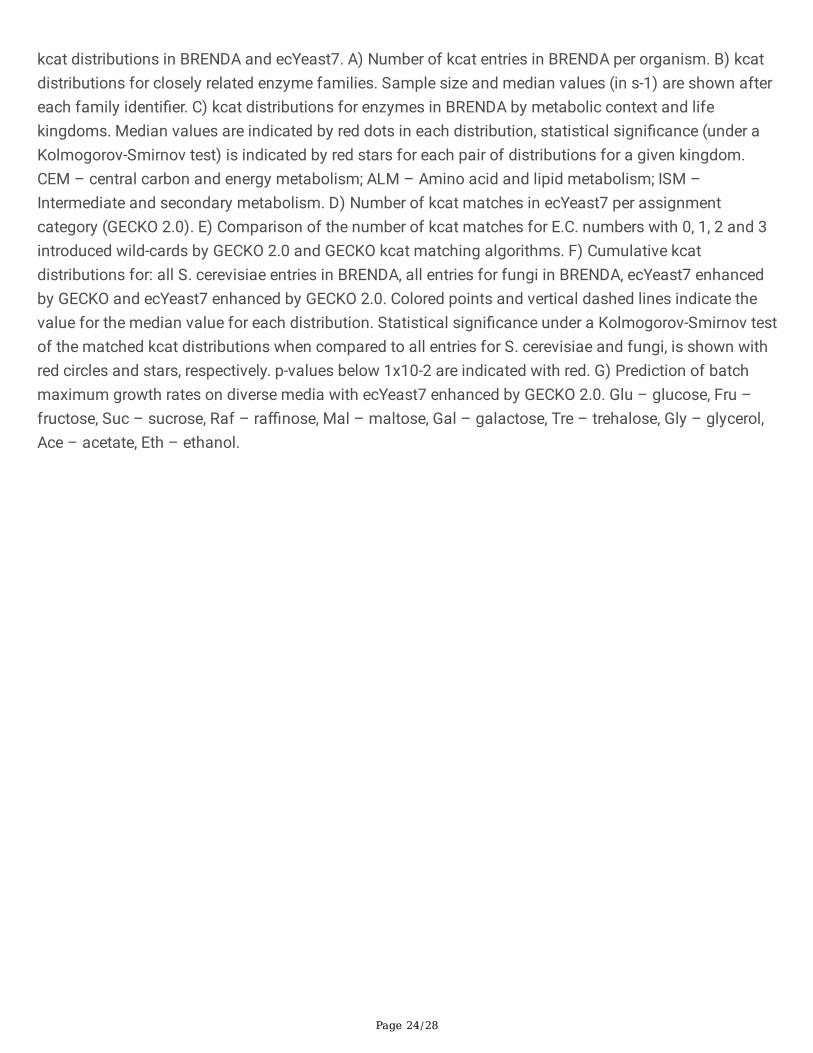
Comparison of predictive capabilities between eciML1515 and ME-iJL1678 for E. coli. A) Maximum batchgrowth rate predictions on minimal media with diverse carbon sources. Squared-sum errors whencompared to experimental values are shown for both eciML1515 and ME-iJL1678. B) Prediction of totalprotein content in the cell by eciML1515 and ME-iJL1678 using the optimal and generalist approaches.
Page 27/28
Figure 4
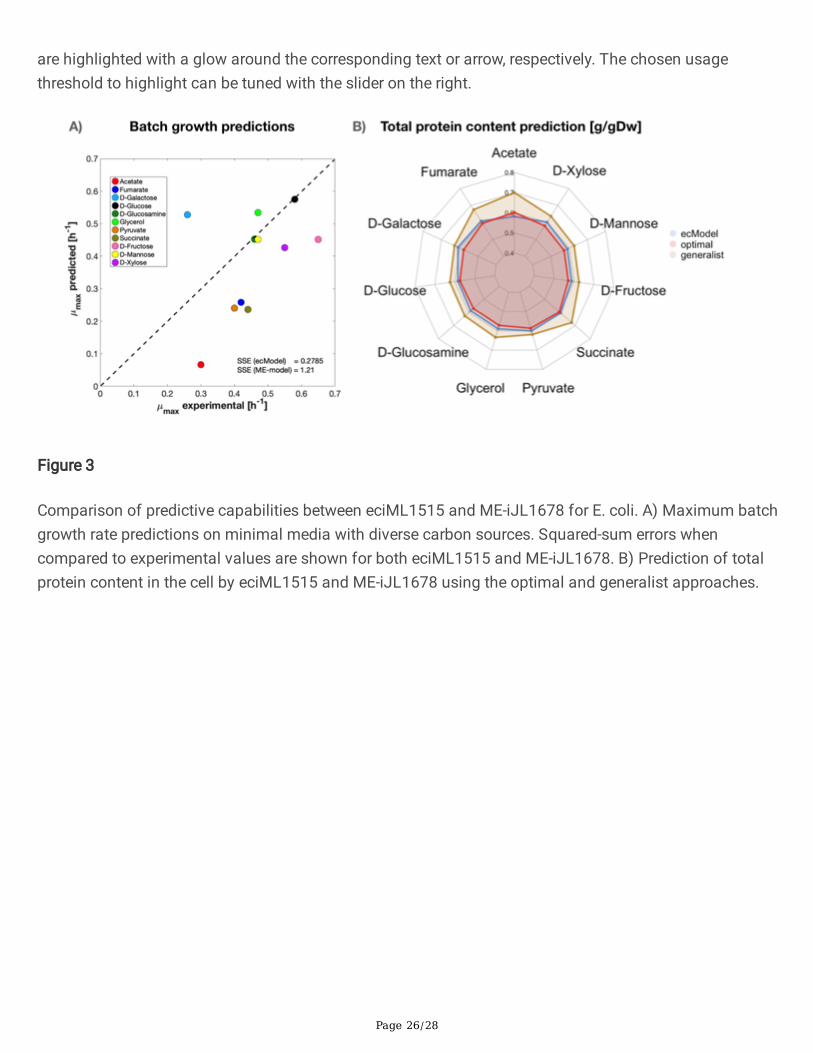
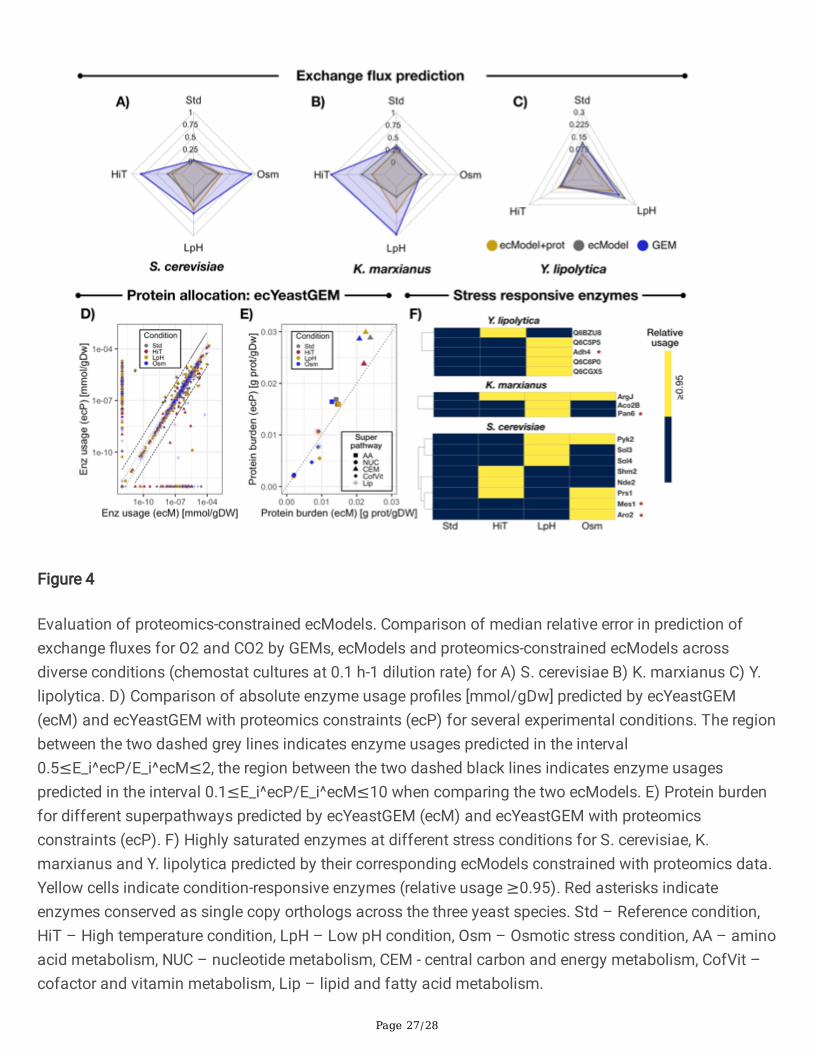
Evaluation of proteomics-constrained ecModels. Comparison of median relative error in prediction ofexchange �uxes for O2 and CO2 by GEMs, ecModels and proteomics-constrained ecModels acrossdiverse conditions (chemostat cultures at 0.1 h-1 dilution rate) for A) S. cerevisiae B) K. marxianus C) Y.lipolytica. D) Comparison of absolute enzyme usage pro�les [mmol/gDw] predicted by ecYeastGEM(ecM) and ecYeastGEM with proteomics constraints (ecP) for several experimental conditions. The regionbetween the two dashed grey lines indicates enzyme usages predicted in the interval0.5≤E_i^ecP/E_i^ecM≤2, the region between the two dashed black lines indicates enzyme usagespredicted in the interval 0.1≤E_i^ecP/E_i^ecM≤10 when comparing the two ecModels. E) Protein burdenfor different superpathways predicted by ecYeastGEM (ecM) and ecYeastGEM with proteomicsconstraints (ecP). F) Highly saturated enzymes at different stress conditions for S. cerevisiae, K.marxianus and Y. lipolytica predicted by their corresponding ecModels constrained with proteomics data.Yellow cells indicate condition-responsive enzymes (relative usage ≥0.95). Red asterisks indicateenzymes conserved as single copy orthologs across the three yeast species. Std – Reference condition,HiT – High temperature condition, LpH – Low pH condition, Osm – Osmotic stress condition, AA – aminoacid metabolism, NUC – nucleotide metabolism, CEM - central carbon and energy metabolism, CofVit –cofactor and vitamin metabolism, Lip – lipid and fatty acid metabolism.
Page 28/28
Figure 5
Cumulative distributions of �ux variability ranges for iSM996, iYali4 and iML1515 compared to theirrespective enzyme-constrained versions at low and high growth rates.
Supplementary Files
This is a list of supplementary �les associated with this preprint. Click to download.
Kcatanalysis.pdf
supp�le2.docx
supp�le3.xlsx
supp�le4.xlsx
SFigures.docx