gel electrophoresis. technique used for separation of –deoxyribonucleic acid (dna) –ribonucleic...
TRANSCRIPT

Gel Electrophoresis

Gel Electrophoresis
• Technique used for separation of– Deoxyribonucleic acid (DNA)– Ribonucleic acid (RNA)– Protein molecules
• Using an electric current applied to a gel matrix
Gel Electrophoresis
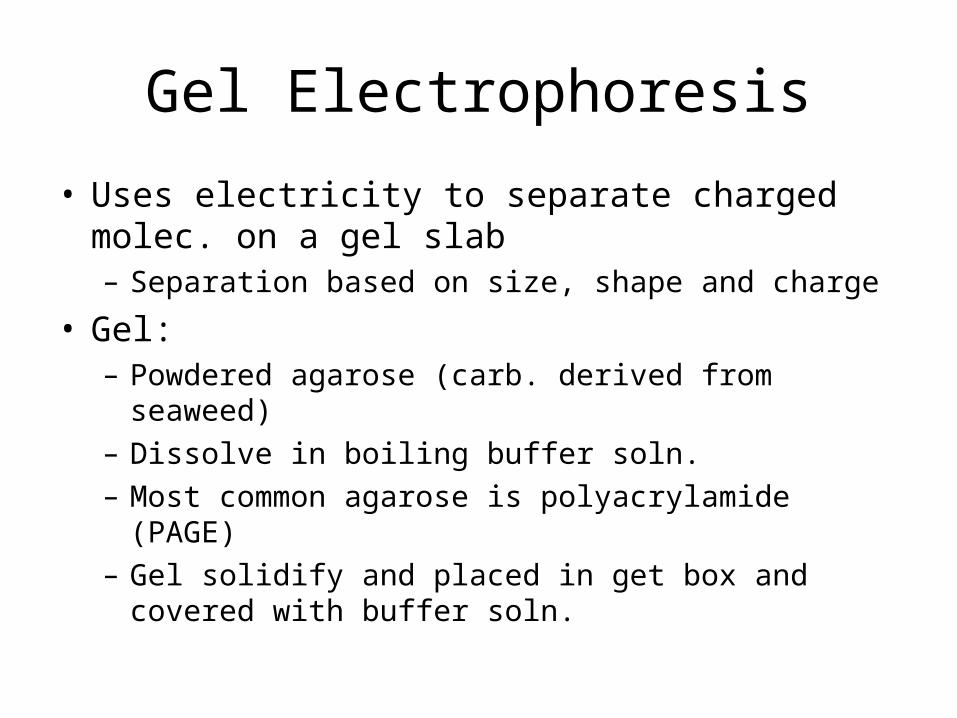
• Uses electricity to separate charged molec. on a gel slab– Separation based on size, shape and charge
• Gel:– Powdered agarose (carb. derived from seaweed)– Dissolve in boiling buffer soln. – Most common agarose is polyacrylamide (PAGE)– Gel solidify and placed in get box and covered with
buffer soln.
Gel Electrophoresis

Gel Electrophoresis
Separation
• “Gel” refers to matrix used to contain, then separate target molecules– Gel is a crosslinked polymer whose composition and porosity is
chosen based on specific weight and composition of target to be analyzed
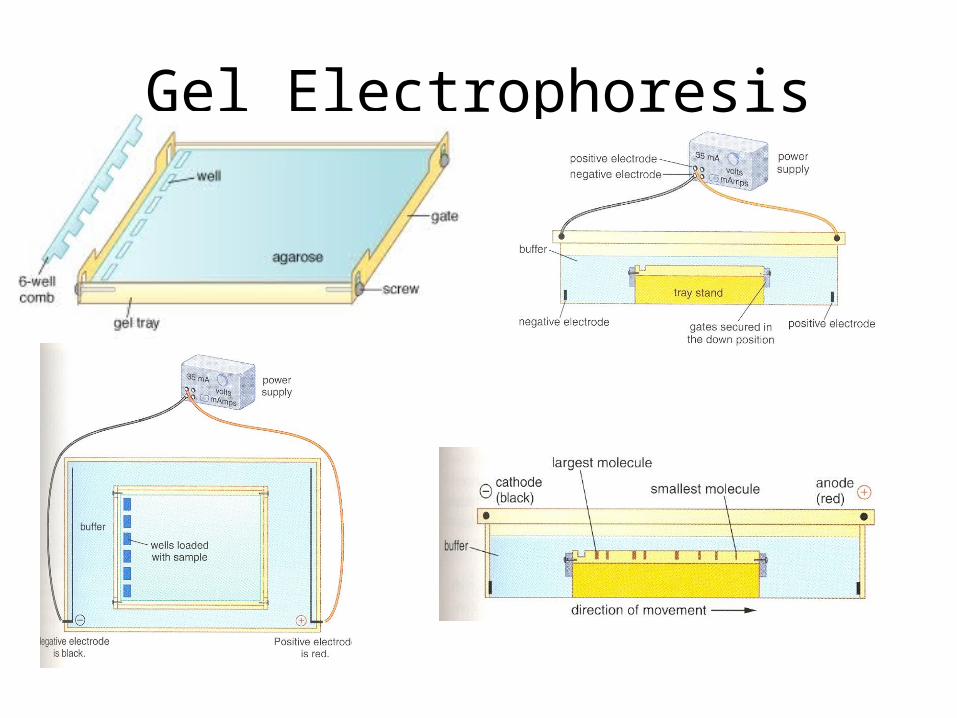
• "Electrophoresis" refers to electromotive force (EMF) that is used to move molecules through gel matrix– By placing molecules in wells in gel and applying an electric
current, molecules will move through matrix at different rates– Usually determined by mass
• Toward the positive anode if negatively charged• Toward the negative cathode if positively charged

Visualization After Electrophoresis Is Complete….
• Molecules in gel can be stained to make them visible– Ethidium bromide– Silver Stain– Coomassie blue dye
• Other methods may also be used to visualize separation of mixture's components on gel– If analyte molecules fluoresce under ultraviolet light, a
photograph can be taken of gel under ultraviolet lighting conditions

Visualization After Electrophoresis Is Complete….
• If several mixtures have initially been injected next to each other, they will run parallel in individual lanes
• Depending on number of different molecules– Each lane shows separation of components
from original mixture as one or more distinct bands
– One band per component
Visualization After Electrophoresis Is Complete….
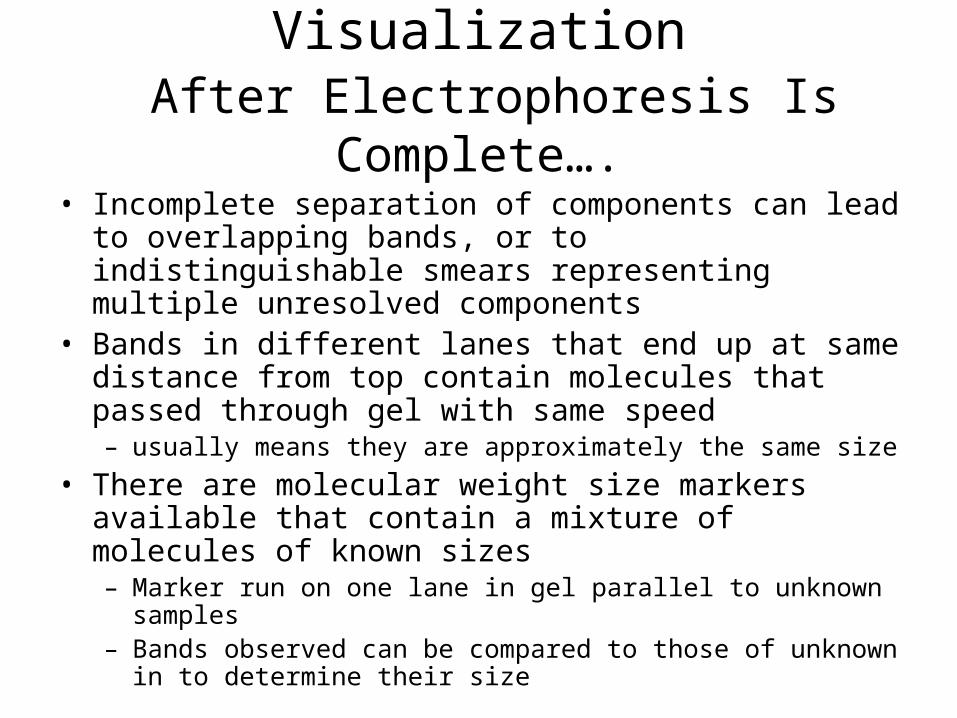
• Incomplete separation of components can lead to overlapping bands, or to indistinguishable smears representing multiple unresolved components
• Bands in different lanes that end up at same distance from top contain molecules that passed through gel with same speed– usually means they are approximately the same size
• There are molecular weight size markers available that contain a mixture of molecules of known sizes– Marker run on one lane in gel parallel to unknown samples– Bands observed can be compared to those of unknown in to
determine their size

Visualization After Electrophoresis Is Complete….
Agarose gel prepared for DNA analysis• The first lane contains a DNA ladder for sizing• Other four lanes show variously-sized DNA fragments that are
present in some but not all of the samples
Applications
• Gel electrophoresis is used in:– Forensics– Molecular biology– Genetics– Microbiology– Biochemistry
• Results can be analyzed quantitatively by visualizing gel with UV light and a gel imaging device
Nucleic acids
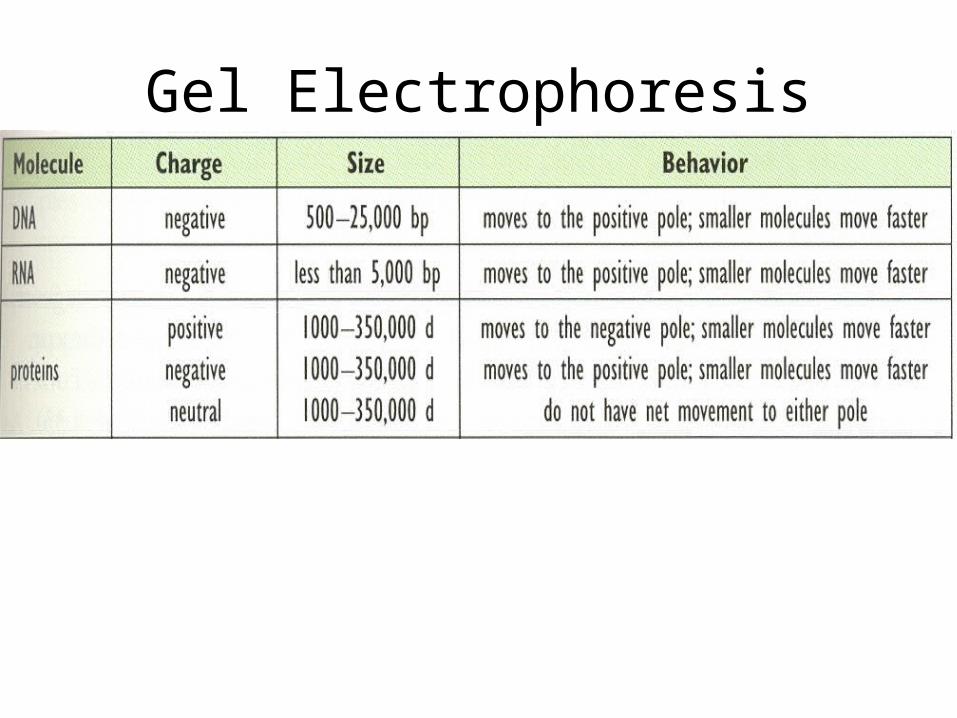
• Direction of migration– From negative to positive electrodes– Due to naturally-occurring negative charge
carried by their sugar-phosphate backbone
• Gel electrophoresis of large DNA or RNA is usually done by agarose gel electrophoresis

Proteins
• Proteins, unlike nucleic acids, can have varying charges and complex shapes– They may not migrate into gel at similar rates, or at all, when
placing a negative to positive EMF on sample
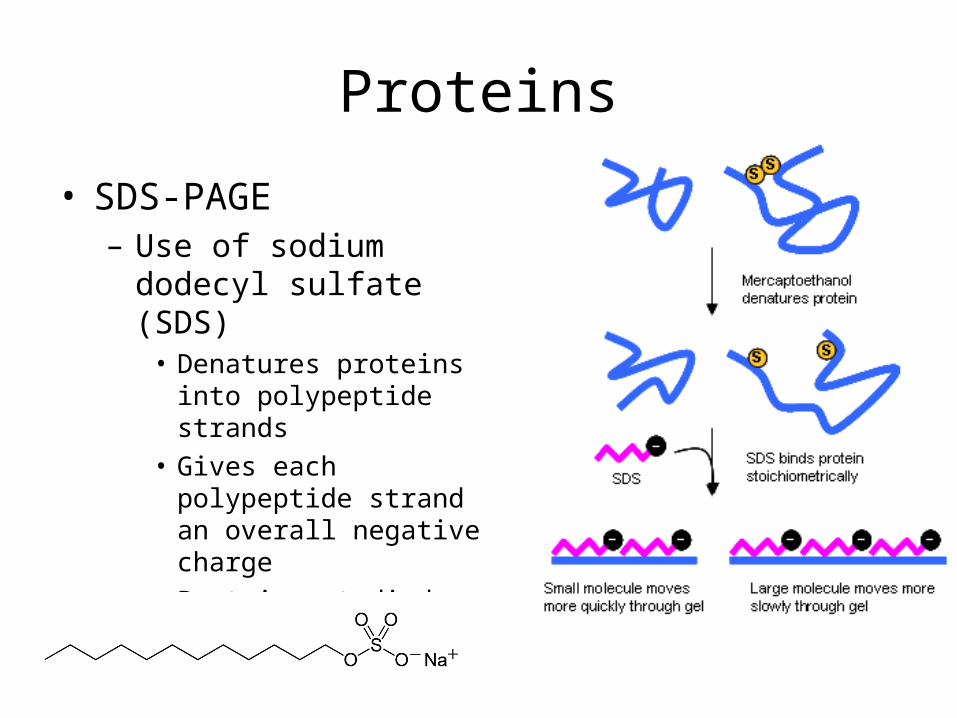
• Proteins are usually denatured in presence of a detergent such as sodium dodecyl sulfate (SDS)– SDS coats proteins with a negative charge– Amount of SDS bound is relative to size of protein (usually 1.4g
SDS per gram of protein), so that resulting denatured proteins have an overall negative charge
• Proteins are usually analyzed by sodium dodecyl sulfate polyacrylamide gel electrophoresis (SDS-PAGE)
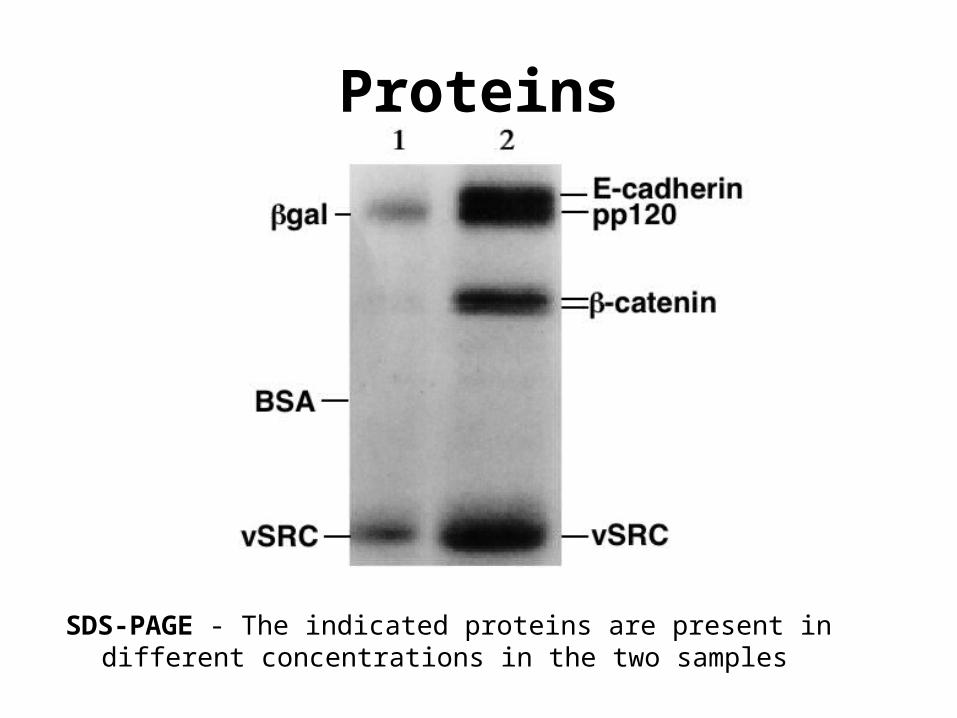
Proteins
SDS-PAGE - The indicated proteins are present in different concentrations in the two samples
DNA Electrophoresis
• Analytical technique used to separate DNA fragments by size
• An electric field forces fragments to migrate through a gel
• DNA molecules normally migrate from negative to positive potential due to net negative charge of phosphate backbone of DNA chain
• At scale of the length of DNA molecules– Gel looks much like a random, intricate network– Longer molecules migrate more slowly because they are more
easily 'trapped' in network• After separation is completed
– Fractions of DNA fragments of different length are often visualizing a fluorescent dye specific for DNA
– Ex: ethidium bromide

DNA electrophoresis• Fragment size is usually reported in "nucleotides", "base
pairs" or "kb"– Fragment size determination is typically done by comparison to
commercially available DNA ladders containing linear DNA fragments of known length
• Types of gel most commonly used for DNA electrophoresis are:– Agarose (for relatively long DNA molecules)– Polyacrylamide (for high resolution of short DNA molecules)
• Gels have conventionally been run in a "slab" format• DNA strand is cut into smaller fragments using DNA
endonuclease– Samples of DNA solution (DNA sample and buffer) are placed in
wells of gel and allowed to run for some time– The less the voltage of electophoresis, the longer time for DNA
sample to run through gel, and this results in a more accurate separation
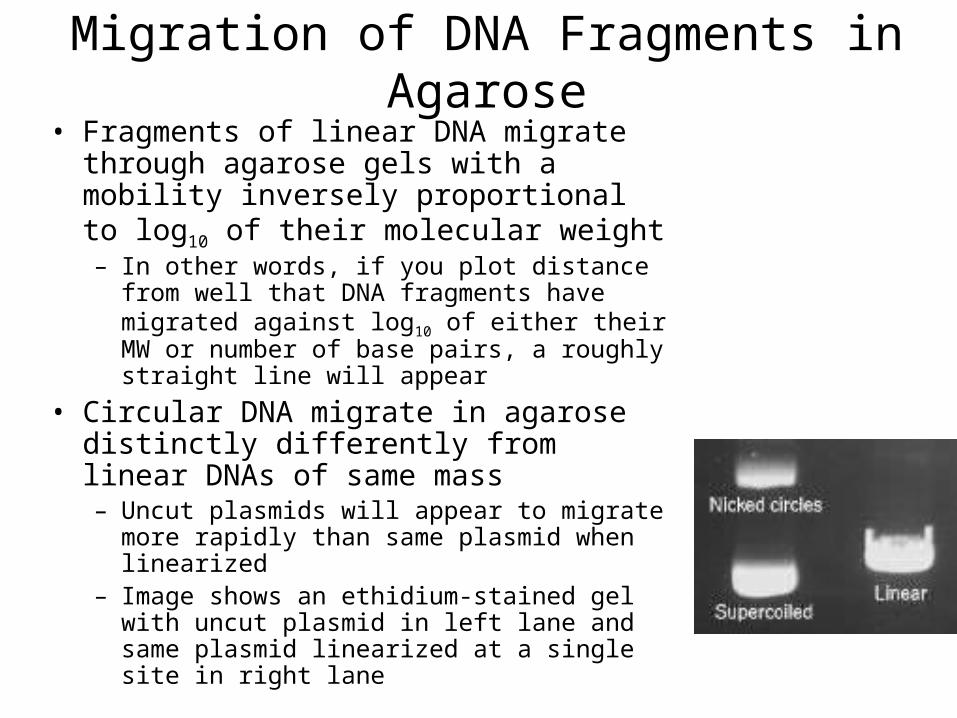
Migration of DNA Fragments in Agarose• Fragments of linear DNA migrate through
agarose gels with a mobility inversely proportional to log10 of their molecular weight– In other words, if you plot distance from well
that DNA fragments have migrated against log10 of either their MW or number of base pairs, a roughly straight line will appear
• Circular DNA migrate in agarose distinctly differently from linear DNAs of same mass– Uncut plasmids will appear to migrate more
rapidly than same plasmid when linearized– Image shows an ethidium-stained gel with
uncut plasmid in left lane and same plasmid linearized at a single site in right lane
Migration of DNA Fragments in Agarose
• Several additional factors have important effects on mobility of DNA fragments in agarose gels:– 1. Agarose Concentration– 2. Voltage– 3. Electrophoresis Buffer– 4. Effects of Ethidium Bromide
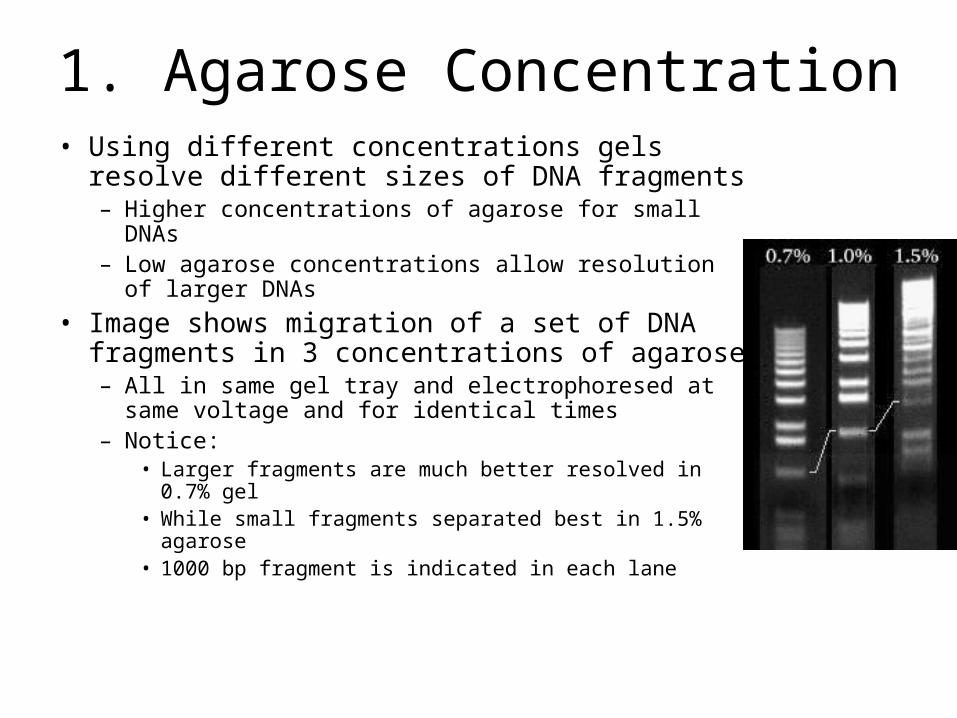
1. Agarose Concentration• Using different concentrations gels resolve
different sizes of DNA fragments– Higher concentrations of agarose for small DNAs– Low agarose concentrations allow resolution of
larger DNAs
• Image shows migration of a set of DNA fragments in 3 concentrations of agarose– All in same gel tray and electrophoresed at same
voltage and for identical times– Notice:
• Larger fragments are much better resolved in 0.7% gel
• While small fragments separated best in 1.5% agarose
• 1000 bp fragment is indicated in each lane

2. Voltage
• As voltage applied to a gel is increased, larger fragments migrate proportionally faster that small fragments– So, for best resolution of fragments larger
than about 2 kb is attained by applying no more than 5 volts per cm to gel
– The cm value is distance between two electrodes, not the length of the gel

3. Electrophoresis Buffer
• Several different buffers have been recommended for electrophoresis of DNA– Most commonly used for DNA are:– TAE (Tris-acetate-EDTA) and TBE (Tris-borate-EDTA)
• DNA fragments will migrate at somewhat different rates in these two buffers due to differences in ionic strength
• Buffers not only establish a pH, but provide ions to support conductivity– If you mistakenly use water instead of buffer, there will be
essentially no migration of DNA in the gel– If you use concentrated buffer (e.g. a 10X stock solution),
enough heat may be generated in gel to melt it.

4. Effects of Ethidium Bromide
• Ethidium bromide is a fluorescent dye that intercalates between bases of nucleic acids and allows very convenient detection of DNA fragments in gels– It can be incorporated into agarose gels, or
added to samples of DNA before loading to enable visualization of fragments within gel
– Binding of ethidium bromide to DNA alters its mass and rigidity, and therefore its mobility

Agarose & Polyacrylamide
• Most commonly used support matrices• Provide a means of separating molecules by size
(porous gels)• Porous gel may act as a sieve by retarding, or in some
cases completely obstructing, movement of large macromolecules while allowing smaller molecules to migrate freely– Dilute agarose gels are generally more rigid and easy to handle
than polyacrylamide of same concentration– Agarose is used to separate larger macromolecules such as
nucleic acids, large proteins and protein complexes– Polyacrylamide, which is easy to handle and to make at higher
concentrations, is used to separate most proteins and small oligonucleotides that require a small gel pore size for retardation
Agarose & Polyacrylamide
• Handout
Separation of Proteins and Nucleic Acids
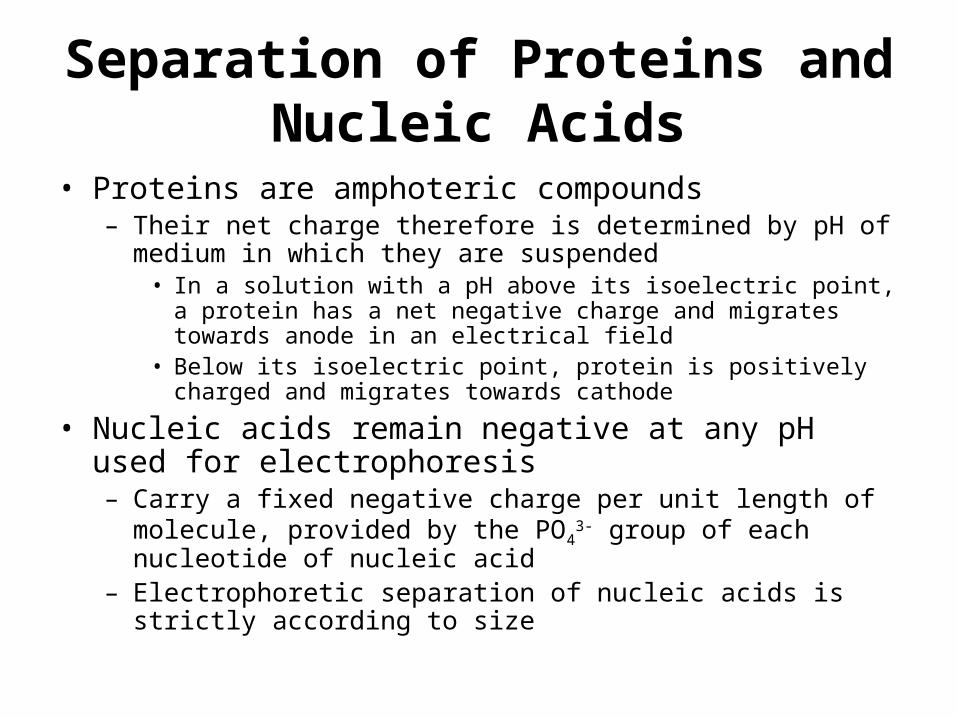
• Proteins are amphoteric compounds– Their net charge therefore is determined by pH of medium in
which they are suspended• In a solution with a pH above its isoelectric point, a protein has a net
negative charge and migrates towards anode in an electrical field• Below its isoelectric point, protein is positively charged and migrates
towards cathode
• Nucleic acids remain negative at any pH used for electrophoresis– Carry a fixed negative charge per unit length of molecule,
provided by the PO43- group of each nucleotide of nucleic acid
– Electrophoretic separation of nucleic acids is strictly according to size
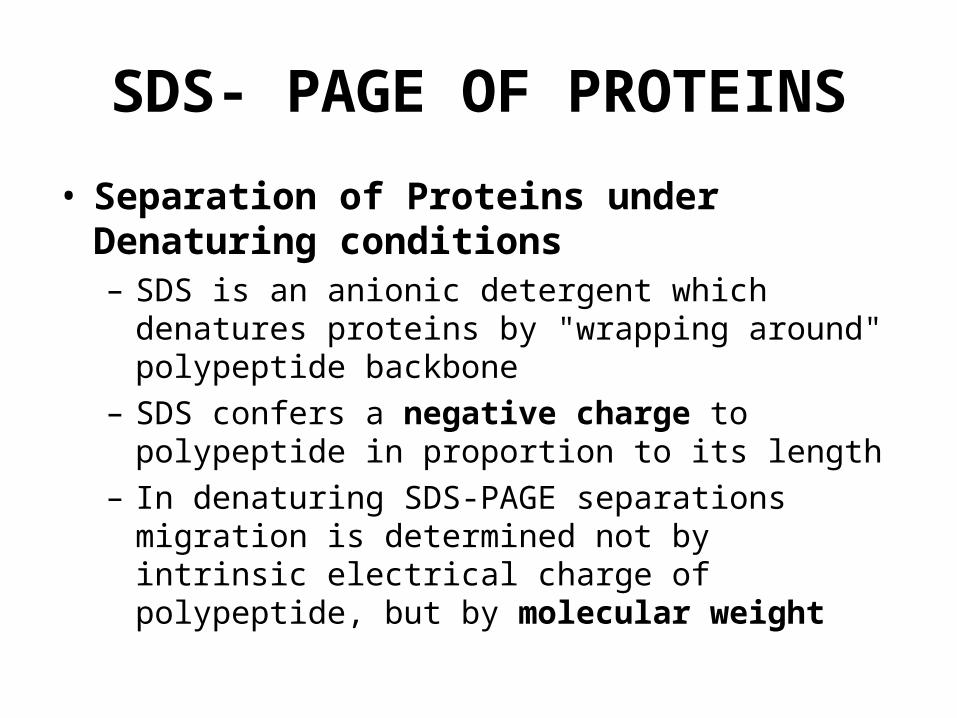
SDS- PAGE OF PROTEINS
• Separation of Proteins under Denaturing conditions– SDS is an anionic detergent which denatures proteins
by "wrapping around" polypeptide backbone– SDS confers a negative charge to polypeptide in
proportion to its length– In denaturing SDS-PAGE separations migration is
determined not by intrinsic electrical charge of polypeptide, but by molecular weight
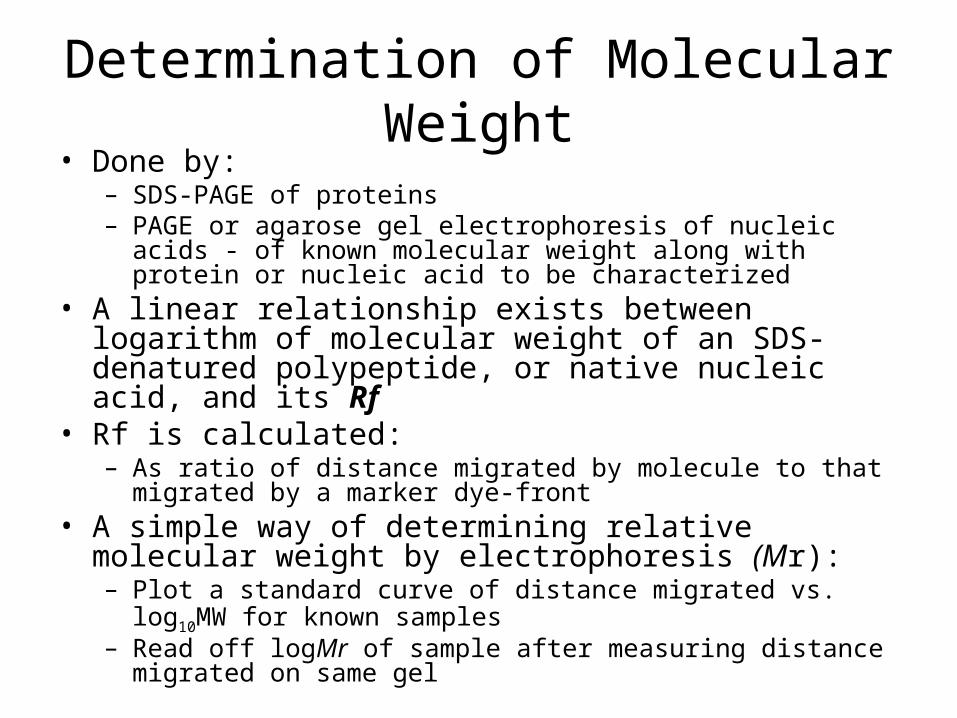
Determination of Molecular Weight• Done by:
– SDS-PAGE of proteins– PAGE or agarose gel electrophoresis of nucleic acids - of known
molecular weight along with protein or nucleic acid to be characterized
• A linear relationship exists between logarithm of molecular weight of an SDS-denatured polypeptide, or native nucleic acid, and its Rf
• Rf is calculated:– As ratio of distance migrated by molecule to that migrated by a
marker dye-front• A simple way of determining relative molecular weight by
electrophoresis (Mr):– Plot a standard curve of distance migrated vs. log10MW for
known samples– Read off logMr of sample after measuring distance migrated on
same gel
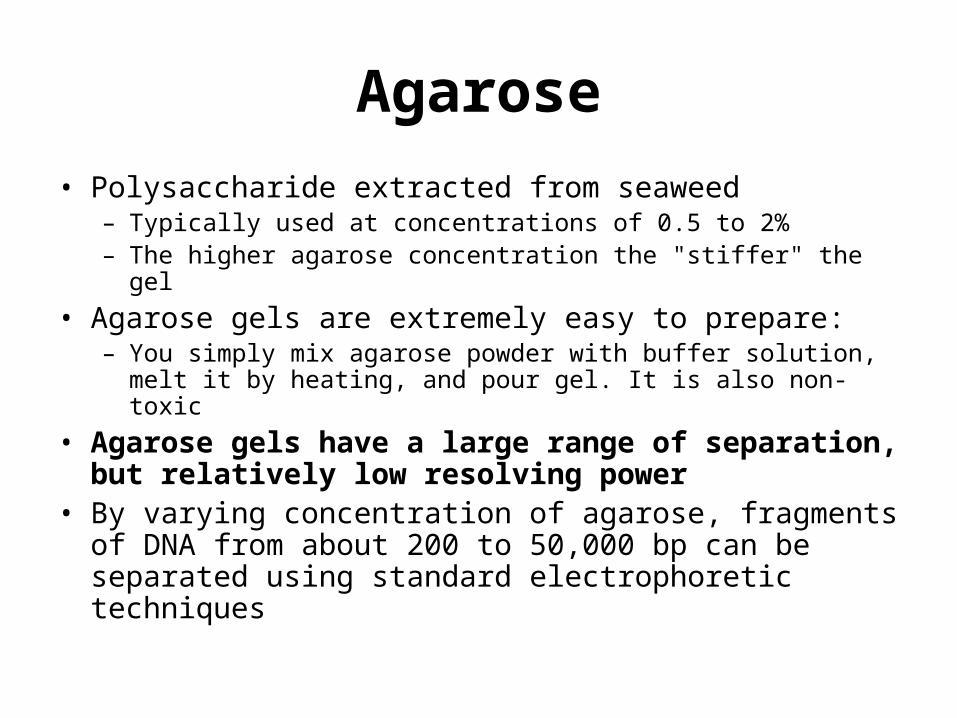
Agarose
• Polysaccharide extracted from seaweed– Typically used at concentrations of 0.5 to 2%– The higher agarose concentration the "stiffer" the gel
• Agarose gels are extremely easy to prepare:– You simply mix agarose powder with buffer solution, melt it by
heating, and pour gel. It is also non-toxic
• Agarose gels have a large range of separation, but relatively low resolving power
• By varying concentration of agarose, fragments of DNA from about 200 to 50,000 bp can be separated using standard electrophoretic techniques

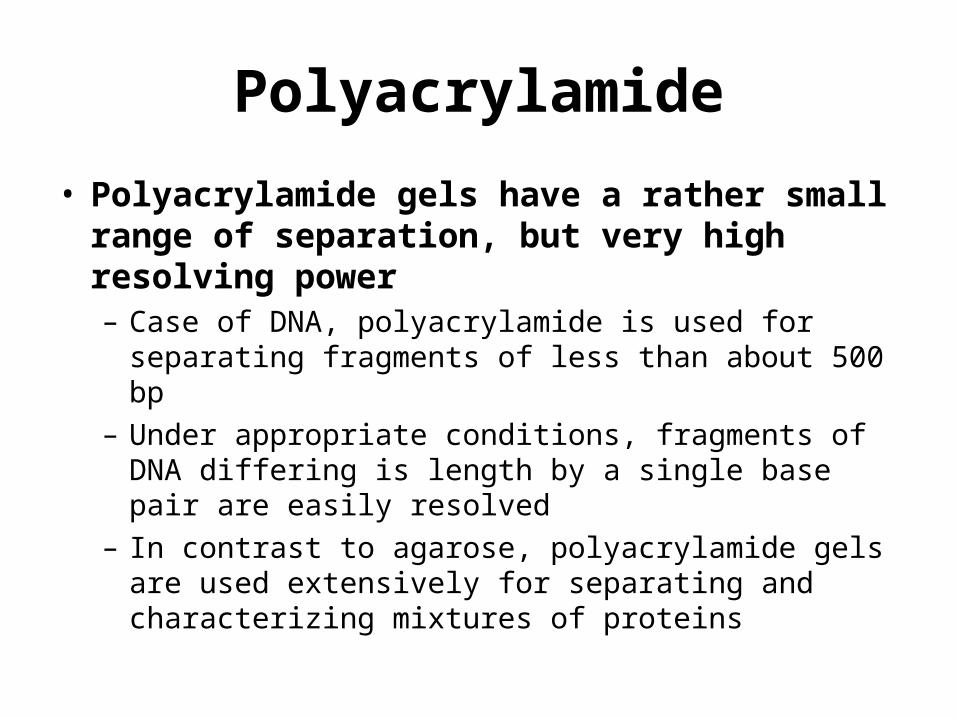
Polyacrylamide
• Cross-linked polymer of acrylamide– length of polymer chains is dictated by the concentration of
acrylamide used– Typically between 3.5 and 20%
• Polyacrylamide gels are more annoying to prepare than agarose gels– Because oxygen inhibits polymerization process, they must be
poured between glass plates (or cylinders)
• Acrylamide is a potent neurotoxin and should be handled with care!– Polyacrylamide is considered to be non-toxic, but
polyacrylamide gels should also be handled with gloves due to possible presence of free acrylamide
Polyacrylamide
• Polyacrylamide gels have a rather small range of separation, but very high resolving power– Case of DNA, polyacrylamide is used for separating
fragments of less than about 500 bp– Under appropriate conditions, fragments of DNA
differing is length by a single base pair are easily resolved
– In contrast to agarose, polyacrylamide gels are used extensively for separating and characterizing mixtures of proteins
Gel Electrophoresis
Gel Electrophoresis
Gel Electrophoresis
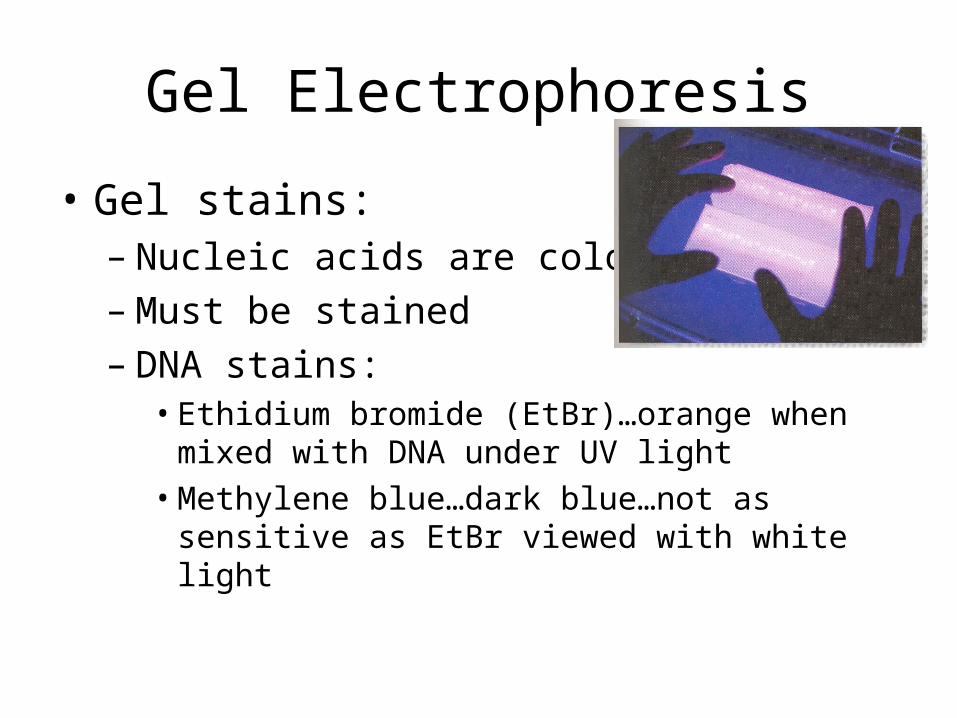
• Gel stains:– Nucleic acids are colorless– Must be stained– DNA stains:
• Ethidium bromide (EtBr)…orange when mixed with DNA under UV light
• Methylene blue…dark blue…not as sensitive as EtBr viewed with white light
Gel Electrophoresis
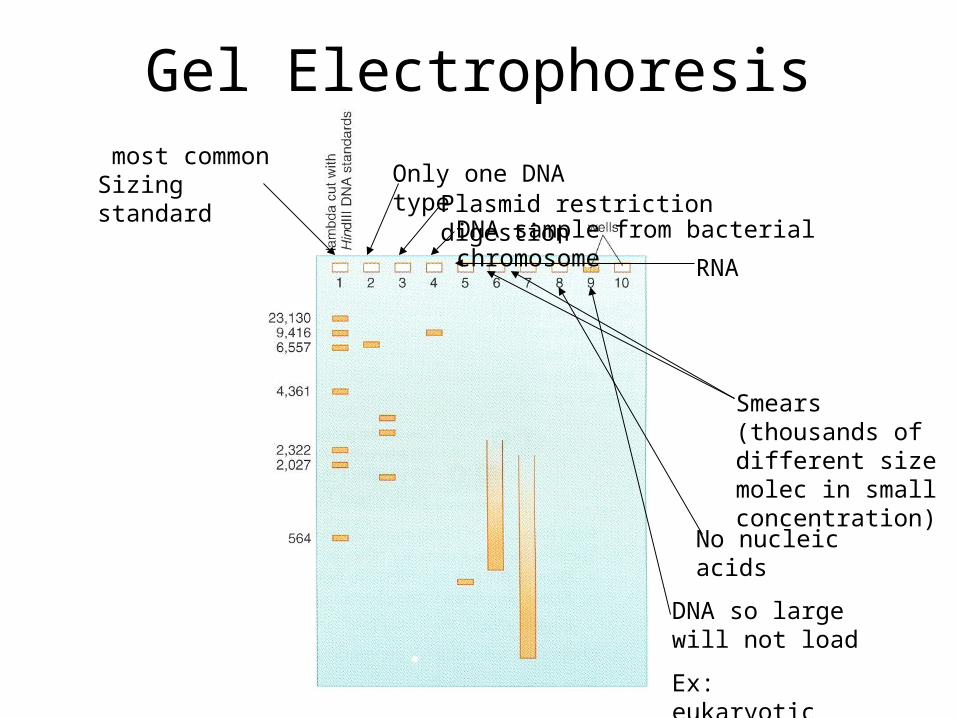
Only one DNA type
most common Sizing standard
Plasmid restriction digestionDNA sample from bacterial
chromosome RNA
Smears (thousands of different size molec in small concentration)
No nucleic acids
DNA so large will not load
Ex: eukaryotic genome
Proteins
• Companies that produce protein products or study proteins must be able to:– Separate the protein of interest– Determine that amount of protein present.
• Characteristics of proteins that make it possible to achieve either one of both points above:– Overall charge, size, shape, and solubility
Proteins
• SDS-PAGE– Gel electrophoresis allows for the separation
of proteins based on charge, size, and shape.– Polyacrylamide gel electrophoresis is utilized
(PAGE).• Allows for better resolution• 4-18% gels most commonly used
– Higher concentration for smaller proteins
• When protein size unknown gradient gels can be used.
– Less concentrated at the top than the bottom
Proteins
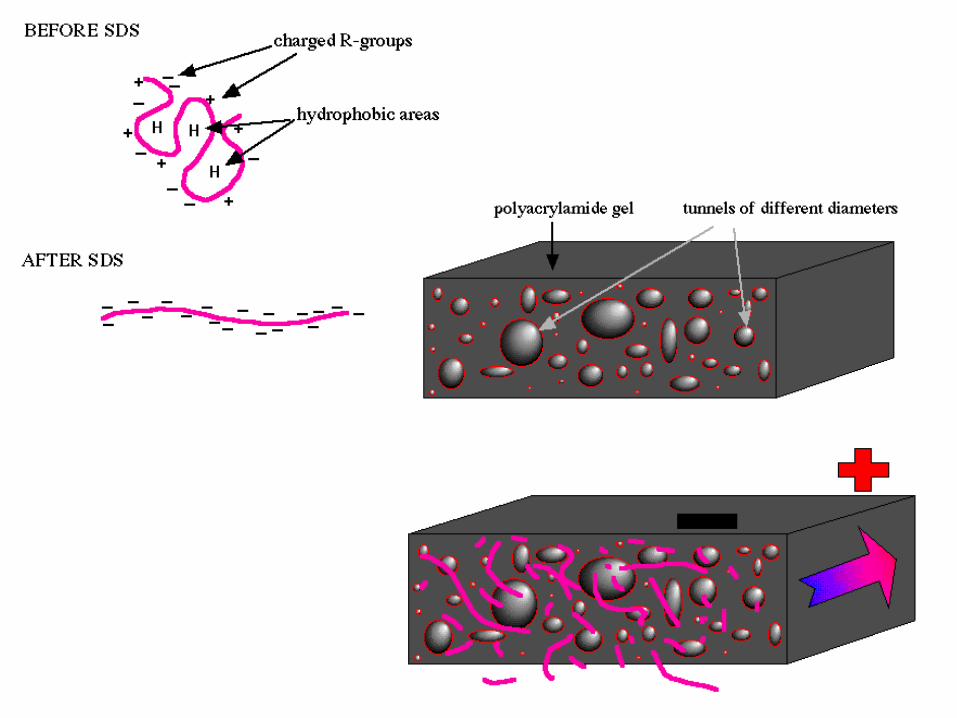
• SDS-PAGE– Use of sodium dodecyl
sulfate (SDS)• Denatures proteins into
polypeptide strands• Gives each polypeptide
strand an overall negative charge
• Proteins studied are strictly being separated by size

Proteins
• SDS-PAGE– Visualization of proteins in
gel• Coomassie Blue
– Milligram amounts of protein.
• Silver stain– Microgram amounts of
protein.
– Size of unknown bands can be determined from comparison to protein molecular weight standard

This project is funded by a grant awarded under the President’s Community Based Job Training Grant as implemented by the U.S. Department of Labor’s Employment and Training Administration (CB-15-162-06-60). NCC is an equal opportunity employer and does not discriminate on the following basis: •against any individual in the United States, on the basis of race, color, religion, sex, national origin, age disability, political affiliation or belief; and•against any beneficiary of programs financially assisted under Title I of the Workforce Investment Act of 1998 (WIA), on the basis of the beneficiary’s citizenship/status as a lawfully admitted immigrant authorized to work in the United States, or his or her participation in any WIA Title I-financially assisted program or activity.
“This workforce solution was funded by a grant awarded under the President’s Community-Based Job Training Grants as implemented by the U.S. Department of Labor’s Employment and Training Administration. The solution was created by the grantee and does not necessarily reflect the official position of the U.S. Department of Labor. The Department of Labor makes no guarantees, warranties, or assurances of any kind, express or implied, with respect to such information, including any information on linked sites and including, but not limited to, accuracy of the information or its completeness, timeliness, usefulness, adequacy, continued availability, or ownership. This solution is copyrighted by the institution that created it. Internal use by an organization and/or personal use by an individual for non-commercial purposes is permissible. All other uses require the prior authorization of the copyright owner.”