gemini project: air quality and greenhouse gas assessment
TRANSCRIPT

Gemini Project: Air Quality and
Greenhouse Gas Assessment
Prepared for:
Magnetic South Pty Ltd
October 2019
Final
Prepared by:
Katestone Environmental Pty Ltd
ABN 92 097 270 276
Ground Floor, 16 Marie Street | PO Box 2217
Milton, Brisbane, Queensland, 4064, Australia
www.katestone.global
Ph +61 7 3369 3699

Disclaimer
https://katestone.global/report-disclaimer/
Copyright
This document, electronic files or software are the copyright property of Katestone Environmental Pty. Ltd. and the information contained therein is solely for the use of the authorised recipient and may not be used, copied or reproduced in whole or part for any purpose without the prior written authority of Katestone Environmental Pty. Ltd. Katestone Environmental Pty. Ltd. makes no representation, undertakes no duty and accepts no responsibility to any third party who may use or rely upon this document, electronic files or software or the information contained therein.
© Copyright Katestone Environmental Pty. Ltd.
Document Control
Deliverable #: D16063-3
Title: Gemini Project: Air Quality and Greenhouse Gas Assessment
Version: 1.0 (Final)
Client: Magnetic South Pty Ltd
Document reference: D16063-3_AQ_Gemini_V1.0.docx
Prepared by: Natalie Shaw, Daniel Gallagher and Lisa Smith
Reviewed by: Natalie Shaw
Approved by:
Natalie Shaw
02/10/2019

Katestone Environmental Pty Ltd D16063-3 Magnetic South Pty Ltd – Gemini Project: Air Quality and Greenhouse Gas Assessment –
Final
2 October 2019
Page i
Contents
Executive summary ......................................................................................................................................... v 1. Introduction ....................................................................................................................................... 1 2. Project description ........................................................................................................................... 2
3. Air quality assessment ...................................................................................................................... 5 3.1 Regulatory framework for air quality in Queensland ....................................................................... 5 3.2 Methodology ...................................................................................................................................... 6
3.2.1 Surrounding environment ................................................................................................... 6 3.2.2 Site-specific meteorology................................................................................................... 6 3.2.3 Assessment scenarios.......................................................................................................... 6 3.2.4 Dust emission rates .............................................................................................................. 7 3.2.5 Dispersion modelling ........................................................................................................... 7 3.2.6 Limitations of dispersion modelling .................................................................................... 7 3.2.7 Cumulative impacts ........................................................................................................... 8 3.2.8 Presentation of results ......................................................................................................... 8
3.3 Existing environment ........................................................................................................................... 9 3.3.1 Local terrain and land-use ................................................................................................. 9 3.3.2 Sensitive receptors .............................................................................................................. 9 3.3.3 Existing air quality .............................................................................................................. 11
3.4 Emissions to the atmosphere ............................................................................................................ 15 3.4.1 Overview ........................................................................................................................... 15 3.4.2 Standard mitigation measures ......................................................................................... 15 3.4.3 Additional mitigation measures ....................................................................................... 16 3.4.4 Emissions inventory ............................................................................................................ 16
3.5 Air quality impact assessment ......................................................................................................... 22 3.5.1 Year 2 ................................................................................................................................. 22 3.5.2 Year 8 ................................................................................................................................. 25 3.5.3 Year 15 ............................................................................................................................... 29
3.6 Mitigation .......................................................................................................................................... 34 4. Greenhouse gas assessment ......................................................................................................... 35
4.1 Background....................................................................................................................................... 35 4.2 Regulatory Framework for Greenhouse Gas Emissions .................................................................. 35
4.2.1 National policy .................................................................................................................. 35 4.2.2 National Greenhouse and Energy Reporting (NGER) .................................................... 36
4.3 Methodology .................................................................................................................................... 36 4.3.1 Emissions ............................................................................................................................ 36 4.3.2 Emissions estimation .......................................................................................................... 38
4.4 Results ................................................................................................................................................ 38 4.4.1 Scope 1 and 2 GHG emissions and energy use summary ............................................. 38 4.4.2 Regulatory obligations – NGER and the safeguard mechanism .................................. 42 4.4.3 GHG mitigation and management ................................................................................ 42
5. Conclusions ..................................................................................................................................... 43
6. References ...................................................................................................................................... 44 Appendix A Modelling methodology .................................................................................................. 69
A1 Meteorology...................................................................................................................................... 69 A1.1 TAPM meteorological modelling ..................................................................................... 69 A1.2 CALMET meteorological modelling ................................................................................. 69 A1.3 Analysis of dispersion meteorology ................................................................................. 70
A2 CALPUFF dispersion modelling ......................................................................................................... 76 A2.1 Source configuration ........................................................................................................ 76
Appendix B Activity data ...................................................................................................................... 77

Katestone Environmental Pty Ltd D16063-3 Magnetic South Pty Ltd – Gemini Project: Air Quality and Greenhouse Gas Assessment –
Final
2 October 2019
Page ii
Tables
Table 1 Relevant ambient air quality objectives (Air EPP) ................................................................................ 6 Table 2 Sensitive receptors surrounding the Project ........................................................................................ 10 Table 3 2017 - 2018 Annual NPI dust emissions existing coal mines surrounding the Project ........................ 12 Table 4 Ambient background concentrations used to assess cumulative impacts ..................................... 14 Table 5 Standard dust control measures and relative reduction in emissions .............................................. 15 Table 6 Emissions inventory for year 2, year 8 and year 15 ............................................................................. 17 Table 7 Predicted ground-level concentrations of TSP, PM10, PM2.5 and dust deposition rates at sensitive
receptors during year 2 using standard mitigation measures ........................................................... 23 Table 8 Number of days per year predicted to exceed in year 2 ................................................................. 24 Table 9 Predicted ground-level concentrations of TSP, PM10, PM2.5 and dust deposition rates at sensitive
receptors during year 8 using standard mitigation measures ........................................................... 27 Table 10 Number of days per year predicted to exceed in year 8 ................................................................. 28 Table 11 Predicted ground-level concentrations of TSP, PM10, PM2.5 and dust deposition rates at sensitive
receptors during year 15 using standard mitigation measures ......................................................... 31 Table 12 Number of days per year predicted to exceed in year 15 ............................................................... 32 Table 13 NGER annual reporting thresholds – greenhouse gas emissions and energy use ........................... 36 Table 14 Summary of GHG emission sources by year of mining operations ................................................... 37 Table 15 Emission factors and energy content for GHG emission sources ...................................................... 38 Table 16 Summary of GHG emissions by year of mining operations ................................................................ 39 Table 17 Summary of energy use (GJ/y) by year of operations for the life of mining operations ................. 40
Table A1 CALPUFF area source characteristics ................................................................................................. 76
Table B1 Summary of activity data used in emissions calculations .................................................................. 77
Figures
Figure 1 Project Location...................................................................................................................................... 3 Figure 2 Proposed Project Layout ........................................................................................................................ 4 Figure 3 Study area terrain (contours in metres above sea-level) .................................................................... 9 Figure 4 Location of sensitive receptors ............................................................................................................ 11 Figure 5 Timeseries of 24-hour average PM10 for Blackwater ........................................................................... 13 Figure 6 Timeseries of 24-hour average PM2.5 for Blackwater .......................................................................... 13 Figure 7 Year 2 - Dust emission source areas .................................................................................................... 19 Figure 8 Year 8 - Dust emission source areas .................................................................................................... 20 Figure 9 Year 15 - Dust emission source areas .................................................................................................. 21 Figure 10 Year 2 – Timeseries of 24-hour average PM10 at SR09 including additional mitigation (when required)
............................................................................................................................................................... 24 Figure 11 Year 2 - Timeseries of 24-hour average PM10 at SR18 including additional mitigation (when required)
............................................................................................................................................................... 25 Figure 12 Year8 – Timeseries of 24-hour average PM10 at SR09 including additional mitigation (when required)
............................................................................................................................................................... 28 Figure 13 Year 8 – Timeseries of 24-hour average PM10 at SR18 including additional mitigation (when required)
............................................................................................................................................................... 29 Figure 14 Year 15 - Timeseries of 24-hour average PM10 at SR18 including additional mitigation (when required)
............................................................................................................................................................... 32 Figure 15 Year 15 – Timeseries of 24-hour average PM10 at SR22 including additional mitigation (when required)
............................................................................................................................................................... 33 Figure 16 Summary of GHG emissions by scope ................................................................................................ 41

Katestone Environmental Pty Ltd D16063-3 Magnetic South Pty Ltd – Gemini Project: Air Quality and Greenhouse Gas Assessment –
Final
2 October 2019
Page iii
Figure A1 Annual distribution of winds at the Project site predicted by TAPM/CALMET .................................. 71 Figure A2 Seasonal distribution of winds at the Project site predicted by TAPM/CALMET ............................... 72 Figure A3 Diurnal distribution of winds at the Project site predicted by TAPM/CALMET .................................. 73 Figure A4 Diurnal stability class at the Project site predicted by TAPM/CALMET .............................................. 74 Figure A5 Diurnal mixing height at the Project site predicted by TAPM/CALMET ............................................. 75
Contour Plates
Plate 1 Year 2 - Predicted annual average cumulative ground-level concentration of TSP using standard
mitigation measures ............................................................................................................................. 45 Plate 2 Year 2 - Predicted maximum 24-hour average cumulative ground-level concentration of PM10 using
standard mitigation measures ............................................................................................................. 46 Plate 3 Year 2 - Predicted annual average cumulative ground-level concentration of PM10 using standard
mitigation measures ............................................................................................................................. 47 Plate 4 Year 2 - Predicted maximum 24-hour average cumulative ground-level concentration of PM2.5 using
standard mitigation measures ............................................................................................................. 48 Plate 5 Year 2 - Predicted annual average cumulative ground-level concentration of PM2.5 using standard
mitigation measures ............................................................................................................................. 49 Plate 6 Year 2 - Predicted maximum monthly cumulative dust deposition rate using standard mitigation
measures ............................................................................................................................................... 50 Plate 7 Year 2 - Predicted maximum 24-hour average cumulative ground-level concentration of PM10 using
standard mitigation measures and additional mitigation when necessary .................................... 51 Plate 8 Year 2 - Predicted annual average cumulative ground-level concentration of PM10 using standard
mitigation measures and additional mitigation when necessary .................................................... 52 Plate 9 Year 8 - Predicted annual average cumulative ground-level concentration of TSP using standard
mitigation measures ............................................................................................................................. 53 Plate 10 Year 8 - Predicted maximum 24-hour average cumulative ground-level concentration of PM10 using
standard mitigation measures ............................................................................................................. 54 Plate 11 Year 8 - Predicted annual average cumulative ground-level concentration of PM10 using standard
mitigation measures ............................................................................................................................. 55 Plate 12 Year 8 - Predicted maximum 24-hour average cumulative ground-level concentration of PM2.5 using
standard mitigation measures ............................................................................................................. 56 Plate 13 Year 8 - Predicted annual average cumulative ground-level concentration of PM2.5 using standard
mitigation measures ............................................................................................................................. 57 Plate 14 Year 8 - Predicted maximum monthly cumulative dust deposition rate using standard mitigation
measures ............................................................................................................................................... 58 Plate 15 Year 8 - Predicted maximum 24-hour average cumulative ground-level concentration of PM10 using
standard mitigation measures and additional mitigation when necessary .................................... 59 Plate 16 Year 8 - Predicted annual average cumulative ground-level concentration of PM10 using standard
mitigation measures and additional mitigation when necessary .................................................... 60 Plate 17 Year 15 - Predicted annual average cumulative ground-level concentration of TSP using standard
mitigation measures ............................................................................................................................. 61 Plate 18 Year 15 - Predicted maximum 24-hour average cumulative ground-level concentration of PM10 using
standard mitigation measures ............................................................................................................. 62 Plate 19 Year 15 - Predicted annual average cumulative ground-level concentration of PM10 using standard
mitigation measures ............................................................................................................................. 63 Plate 20 Year 15 - Predicted maximum 24-hour average cumulative ground-level concentration of PM2.5
using standard mitigation measures ................................................................................................... 64 Plate 21 Year 15 - Predicted annual average cumulative ground-level concentration of PM2.5 using standard
mitigation measures ............................................................................................................................. 65 Plate 22 Year 15 - Predicted maximum monthly cumulative dust deposition rate using standard mitigation
measures ............................................................................................................................................... 66 Plate 23 Year 15 - Predicted maximum 24-hour average cumulative ground-level concentration of PM10 using
standard mitigation measures and additional mitigation when necessary .................................... 67 Plate 24 Year 15 - Predicted annual average cumulative ground-level concentration of PM10 using standard
mitigation measures and additional mitigation when necessary .................................................... 68

Katestone Environmental Pty Ltd D16063-3 Magnetic South Pty Ltd – Gemini Project: Air Quality and Greenhouse Gas Assessment –
Final
2 October 2019
Page iv
Glossary
Term Definition
% percentage
µg/m3 micrograms per cubic metre
m3 cubic metre
g/s gram per second
ha hectare
kg/year Kilogram per year
km kilometre
km/h kilometre per hour
L/m2/hour litres per metre square per hour
m metre
m/s metre per second
µm micrometre (micron)
mg/m2/day milligram per square metre per day
Mtpa million tonnes per annum
t tonne (metric)
tCO2-e tonnes of carbon dioxide equivalents
VKT vehicle kilometre travelled
Nomenclature Definition
PM10 particulate matter with an equivalent aerodynamic diameter of 10 µm or less
PM2.5 particulate matter with an equivalent aerodynamic diameter of 2.5 µm or less
TSP total suspended particles
Abbreviations Definition
Air EPP Environmental Protection (Air) Policy 2019
CHPP Coal Handling and Processing Plant
DES Department of Environment and Science
E East
EA Environmental Authority
EF Emission Factor
EHP Department of Environment and Heritage Protection
EP Act Environmental Protection Act 1994
GHG Greenhouse Gas
MIA Mine Infrastructure Area
ML Mining Lease
MLA Mining Lease Application
N North
NGER Act National Greenhouse and Energy Reporting Act 2007
NPI National Pollutant Inventory
OB Overburden
Project Gemini Project
ROM Run of Mine
SE Southeast
SSE South-southeast
SSW South-southwest
TLO Train loadout facility
US EPA United States Environmental Protection Agency

Katestone Environmental Pty Ltd D16063-3 Magnetic South Pty Ltd – Gemini Project: Air Quality and Greenhouse Gas Assessment –
Final
2 October 2019
Page v
EXECUTIVE SUMMARY
Katestone Environmental Pty Ltd (Katestone) was commissioned by Magnetic South Pty Ltd on behalf of
Magnetic South Pty Ltd to conduct an air quality and greenhouse gas assessment of the proposed Gemini
Project (the Project).
The Project involves the development of an open cut coal mine located approximately 3 km west of the township
of Dingo and 35 kilometres east of Blackwater in Central Queensland.
This air quality assessment has investigated the potential for the Project to affect air quality in the region. Three
operational scenarios have been considered that represent the worst-case potential for dust emissions over the
life of the Project, given the proposed mining schedule and proximity of sensitive receptors. The assessment
has used site-specific meteorological data and industry standard dispersion modelling techniques to predict
ground-level concentrations of particulate matter (TSP, PM10 and PM2.5) and dust deposition rates due to the
Project.
The air quality assessment has considered the potential impacts of the Project in isolation and with the inclusion
of representative background levels of dust. Predicted ground-level concentrations of dust have been presented
across a 20 x 20 kilometre domain and at identified sensitive receptors. Predictions have been compared with
the relevant air quality objectives and guidelines.
The findings of the cumulative impact assessment are as follows:
• Predicted annual average concentrations of TSP comply with the relevant air quality objective at all
sensitive receptors using standard mitigation measures
• Predicted maximum 24-hour and annual average concentrations of PM10 comply with the relevant air
quality objective at all sensitive receptors using standard mitigation measures and additional mitigation
when necessary
• Predicted 24-hour and annual average concentrations of PM2.5 comply with the relevant air quality
objectives at all sensitive receptors using standard mitigation measures
• Predicted monthly dust deposition rates comply with the relevant air quality guideline at all sensitive
receptors using standard mitigation measures.
The greenhouse gas assessment of the Project found the following:
• Maximum annual greenhouse gas emissions associated with Scope 1 and 2 from the Project are
estimated to be 205 kt CO2-e (Year 16)
• Greenhouse gas emissions from the Project are predominantly due to diesel use (67.9%), electricity
generation (indirect emissions) (10.4%) and fugitive methane releases (20.4%)
• Compared to national and state greenhouse gas inventory levels, the maximum annual GHG emissions
from the Project would account for approximately 0.04% and 0.13%, respectively.
It is recommended that Magnetic South manages potential particulate matter impacts of the Project at sensitive
receptors by:
• Developing and implementing an ambient air quality monitoring program
• Developing and implementing an Air Quality Management Plan
• As appropriate, consult with surrounding landholders in relation to appropriate mitigation measures or
property purchases.

Katestone Environmental Pty Ltd D16063-3 Magnetic South Pty Ltd – Gemini Project: Air Quality and Greenhouse Gas Assessment –
Final
2 October 2019
Page vi
It is also recommended the Magnetic South monitor, manage and assess Project related greenhouse gas
emissions.

Katestone Environmental Pty Ltd D16063-3 Magnetic South Pty Ltd – Gemini Project: Air Quality and Greenhouse Gas Assessment –
Final
2 October 2019
Page 1
1. INTRODUCTION
Magnetic South Pty Ltd (Magnetic South) is the project proponent and the applicant for the Mining Lease (ML) and
Environmental Authority (EA) to develop the Gemini Project, a greenfield open cut mine to produce Pulverised Coal
Injection (PCI) coal and Coking Coal products for export for steel production. The Project term is anticipated to be
25 years from grant of the ML with this term including initial construction, mine operation and rehabilitation activities.
Katestone Environmental Pty Ltd (Katestone) was commissioned by Magnetic South to conduct the air quality and
greenhouse assessments for the Project.
The scope of works for the air quality and greenhouse assessment includes:
Air quality
• A description of the Project with a focus on elements pertaining to impacts to air quality
• A description of regulatory requirements relevant to the Project, including air quality objectives and
indicators in the Environmental Protection (Air) Policy 2019
• A description of the environmental values in and surrounding the Project areas including sensitive
receptors, site topography and built environment, background levels of air pollutants, and an assessment
of meteorology
• A description of onsite sources of air pollutants and production of an air pollutant emission inventory for
three worst-case scenarios of the mine
• A dispersion modelling assessment to predict ground-level concentrations of air pollutants associated with
each scenario for the mine
• Analysis of incremental and cumulative concentrations of air pollutants associated with the mine against
the relevant air quality criteria and objectives for dust deposition and suspended particulates
• A discussion of proposed management and mitigation measures for minimising air quality impacts.
Greenhouse gas
• Determine obligations under the Commonwealth National Greenhouse and Energy Reporting Act 2007
(NGER Act)
• Provide an inventory of projected annual emissions of greenhouse gases (GHG) in terms of tonnes of
carbon dioxide equivalents (tCO2-e)
• Assess the potential impacts of the Project on the state and national greenhouse gas inventories and
propose greenhouse gas abatement measures.
This report presents the findings of an air quality and greenhouse gas impact assessment conducted for the Project.

Katestone Environmental Pty Ltd D16063-3 Magnetic South Pty Ltd – Gemini Project: Air Quality and Greenhouse Gas Assessment –
Final
2 October 2019
Page 2
2. PROJECT DESCRIPTION
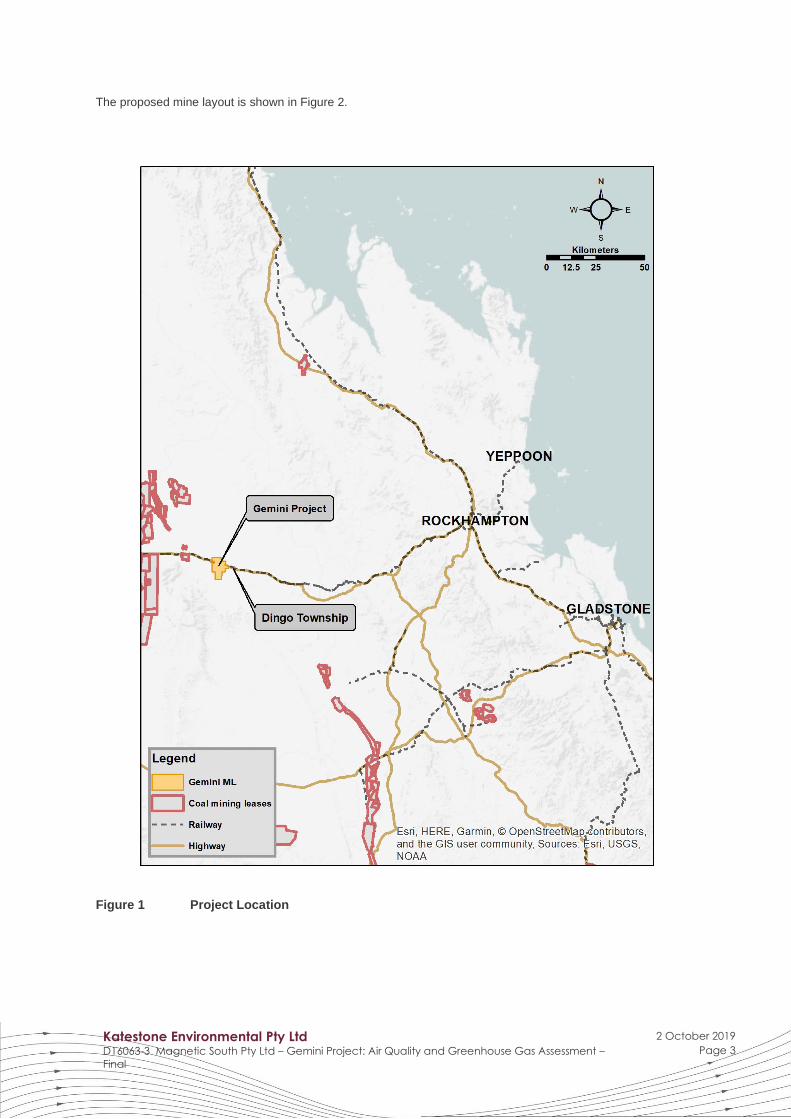
The Gemini Project is located in the Queensland Central Highlands, approximately 3 kilometres west of the
township of Dingo and 15 kilometres east of the town of Bluff (refer Figure 1).
The main activities associated with the Project include:
• Exploration activities continuing in order to support mine planning
• Development of a Mine Infrastructure Area (MIA) including mine offices, bathhouse, crib rooms,
warehouse/stores, workshop, fuel storage, refuelling facilities, wash bay, laydown area, sewage, effluent and
liquid waste storage, and heli-pad
• Construction and operation of a Coal Handling Preparation Plant (CHPP) and coal handling facilities adjacent
to the MIA (including Run-of-Mine (ROM) coal and product stockpiles, and rejects bin/overflow [coarse and
fine rejects])
• Construction and operation of a surface conveyor from the product stockpiles to a Train Load Out (TLO) facility
and rail loop connecting to the Blackwater-Gladstone Branch Rail to transport product coal to coal terminals
at Gladstone for export
• Construction of access roads from the Capricorn Highway to the MIA, and from the accommodation facility to
the TLO facility
• Installation of a raw water supply pipeline to connect to the Blackwater Pipeline network
• Construction of a 66 kV transmission line and switching/substation to connect to the existing regional network
• Other associated minor infrastructure, plant, equipment and activities
• Development of mine areas (open cut pits) and out-of-pit waste rock emplacements
• Drilling and blasting of competent waste material
• Mine operations using conventional surface mining equipment (excavators, front end loaders, rear dump
trucks, dozers)
• Mining up to 1.9 Mtpa ROM Coal – average 1.8 Mtpa for a construction/production period of approximately
20 years
• Progressive placement of waste rock in:
- Emplacements, adjacent to and near the open cut voids
- Mine voids, behind the advancing open cut mining operations
• Progressive rehabilitation of waste rock emplacement areas and mined voids
• Progressive establishment of soil stockpiles, laydown area and borrow pits (for road base and civil works).
Material will be sourced from local quarries where required
• Disposal of CHPP rejects (coarse and fine rejects) in out of pit spoil dumps, and in-pit behind the mining void
• Progressive development of internal roads and haul roads including a causeway over Charlevue Creek to
enable coal haulage and pit access
• Development of water storage dams and sediment dams, and the installation of pumps, pipelines, and other
water management equipment and structures including temporary levees, diversions and drains.
Katestone Environmental Pty Ltd D16063-3 Magnetic South Pty Ltd – Gemini Project: Air Quality and Greenhouse Gas Assessment –
Final
2 October 2019
Page 3
The proposed mine layout is shown in Figure 2.
Figure 1 Project Location

Katestone Environmental Pty Ltd D16063-3 Magnetic South Pty Ltd – Gemini Project: Air Quality and Greenhouse Gas Assessment – Final
2 October 2019
Page 4
Figure 2 Proposed Project Layout

Katestone Environmental Pty Ltd D16063-3 Magnetic South Pty Ltd – Gemini Project: Air Quality and Greenhouse Gas Assessment –
Final
2 October 2019
Page 5
3. AIR QUALITY ASSESSMENT
3.1 Regulatory framework for air quality in Queensland
The Environmental Protection Act 1994 (EP Act) provides for the management of the air environment in
Queensland. The EP Act gives the Department of Environment and Science (DES) the power to create
Environmental Protection Policies that identify, and aim to protect, environmental values of the atmosphere that
are conducive to the health and well-being of humans and biological integrity. The Environmental Protection (Air)
Policy (Air EPP) was made under the EP Act and gazetted in 1997; the Air EPP was revised and reissued in 2019.
The objective of the Air EPP is:
...to identify the environmental values of the air environment to be enhanced or protected and to achieve
the objective of the Environmental Protection Act 1994, i.e. ecologically sustainable development.
The environmental values to be enhanced or protected under the Air EPP are the qualities of the environment that
are conducive to:
• protecting health and biodiversity of ecosystems
• human health and wellbeing
• protecting the aesthetics of the environment, including the appearance of building structures and other
property
• protecting agricultural use of the environment.
The administering authority must consider the requirements of the Air EPP when it decides an application for an
environmental authority, amendment of a licence or approval of a draft environmental management plan. Schedule
1 of the Air EPP specifies air quality indicators and objectives for approximately 93 contaminants that may be
present in the air environment.
The Air EPP air quality objectives relevant to the key air pollutants that may be generated from the Project are
presented in Table 1.
Also relevant is the DES's Application requirements for activities with impacts to air, which outlines the information
to be provided to DES as part of the application process for environmentally relevant activities and how the
information is used. This outlines how the proposed activity will be assessed by comparison with the requirements
stipulated in the EP Act.
In particular, this requires an application to include, if applicable:
• Description of the site and surrounding areas, including topography, prevailing winds and ambient air
quality (Section 3.3 and Appendix A1)
• Identification of any nearby sensitive places must be identified and assessed appropriately
(Section 3.3.2)
• Identification and evaluation of possible impacts on air quality (Section 3.5)
• Proposed management (Section 3.4).
This air quality assessment has been conducted in accordance with the application requirements.

Katestone Environmental Pty Ltd D16063-3 Magnetic South Pty Ltd – Gemini Project: Air Quality and Greenhouse Gas Assessment –
Final
2 October 2019
Page 6
Table 1 Relevant ambient air quality objectives (Air EPP)
Pollutant Environmental
Value Averaging
Period Air Quality Objective
Number exceedances allowed per year
TSP
Health and wellbeing
1 year 90 μg/m3 None
PM10 a
24 hours 50 μg/m3 None
1 year 25 μg/m3 None
PM2.5 b
24 hours 25 μg/m3 None
1 year 8 μg/m3 None
Dust deposition c,d Amenity 1 month 120 mg/m²/day None
Table note:
a PM10 are particles that have aerodynamic diameters that are less than 10 μm.
b PM2.5 are particles that have aerodynamic diameters that are less than 2.5 μm.
c Applies to total insoluble solids.
d Value provided for dust deposition is a DES recommended design objective rather than Air EPP objective.
3.2 Methodology
The following sections describe the modelling methodology that was adopted for the air quality assessment. The
methodology uses standard industry dispersion models suitable for use in Australia and regulatory approved
assessment techniques to predict ground-level concentrations of air pollutants in the areas surrounding the Project.
3.2.1 Surrounding environment
The location of the Project and surrounding environment has been described in terms of land use, terrain features
and sensitive receptor locations. Details are provided in Section 3.3.
3.2.2 Site-specific meteorology
Site-specific meteorological data was generated by coupling the prognostic model TAPM (version 4.0.5) (The Air
Pollution Model) with the diagnostic meteorological model CALMET (version 6.5.0). The coupled TAPM/CALMET
modelling system was developed to enable high resolution modelling capabilities for regulatory and environmental
assessments. The modelling system incorporates synoptic, mesoscale and local atmospheric conditions, detailed
topographic and land use categorisation schemes to simulate synoptic and regional scale meteorology for input
into pollutant dispersion models such as CALPUFF.
The assessment was conducted using the most recent versions of TAPM and CALMET available at the time of
undertaking the study.
Technical details of the TAPM and CALMET model configurations are provided in Appendix A.
3.2.3 Assessment scenarios
Based on a review of the proposed mining schedule, annual production schedule and the relative location of the
closest sensitive receptors, Year 2, Year 8, and Year 15 of the Project were identified as being likely to generate
the worst-case potential for dust impacts over the life of the Project.
Katestone Environmental Pty Ltd D16063-3 Magnetic South Pty Ltd – Gemini Project: Air Quality and Greenhouse Gas Assessment –
Final
2 October 2019
Page 7
3.2.4 Dust emission rates
To assess potential air quality impacts due to the Project, potential dust emissions from individual mining activities
for the modelling scenario were accounted for and have been explicitly modelled. Specific activity information used
to calculate dust emission rates associated with individual mining activities were provided or confirmed by Magnetic
South.
Dust emission rates were estimated using the base equation:
𝐸𝑅 = 𝐴 × 𝐸𝐹 × (1 − 𝐶𝐹)
where:
ER emission rate
A activity / operations data
EF emission factor
CF reduction in emissions due to the implementation of control measures.
Emissions of TSP, PM10 and PM2.5 from mining activities were estimated using recognised and accepted methods
of dust emissions estimation. These include approximation of emission rates from NPI emissions estimation
technique handbooks and the United States Environmental Protection Agency (US EPA) AP42 emission
handbooks (US EPA, 1998; US EPA, 2006; NPI, 2012).
The emissions estimation techniques applied in this assessment are based on standard methods that are applied
throughout Australia and in the United States. These methods are consistent with those adopted for other air quality
assessments conducted for other coal mines in Australia. The size distribution of dust particles was derived from
the emission rates estimated for TSP, PM10, and PM2.5.
A dust emission inventory for years 2, 8, and 15 is detailed in Section 3.4. The activity data that were used to
estimate dust emissions are detailed in Appendix B.
3.2.5 Dispersion modelling
Source characteristics and dust emission rates for each scenario were incorporated into a dispersion modelling
study conducted using a standard and regulated model developed by Earth Tech, Inc., namely, the CALPUFF
dispersion model (version 7.2.1).
CALPUFF is an advanced non-steady-state air quality modelling system. The meteorological data generated by
TAPM/CALMET was used as input for CALPUFF in order to include all weather conditions likely to be experienced
in the region during a typical year. This system has been used to predict ground-level particulate concentrations
and dust deposition rates at nearby sensitive receptor locations and across a cartesian grid representing the Project
region.
Dust emissions have been modelled over a 365-day year, assuming 24-hour mine operation with the exception of
haulage of ROM that will occur for 15 hours per day and blasting that will only occur during daylight hours.
Technical details of the CALPUFF model configuration are provided in Appendix A.
3.2.6 Limitations of dispersion modelling
This study relies on the accuracy of a number of datasets including, but not limited to:
• Meteorological information
• Calculation of emission rates from mining activities.

Katestone Environmental Pty Ltd D16063-3 Magnetic South Pty Ltd – Gemini Project: Air Quality and Greenhouse Gas Assessment –
Final
2 October 2019
Page 8
It is important to note that numerical models are based on an approximation of governing equations that represent
complex natural processes. These will inherently be associated with some degree of uncertainty. The more
complex the physical model, the greater the number of physical processes that must be included. Where
uncertainty exists in characterising important properties of the environment or activities associated with the Project,
this study has erred on the side of caution and selected conservative inputs.
3.2.7 Cumulative impacts
In order to assess the potential impacts of the Project upon the surrounding environment, representative ambient
levels of particulate matter and dust deposition have been added to dispersion modelling predictions for the Project.
These levels are derived in Section 3.3.3.
3.2.8 Presentation of results
Modelling results for particulate matter are presented as ground-level concentrations or dust deposition rates at
sensitive receptors as well as contours across the modelling domain and are presented in Section 3.5.

Katestone Environmental Pty Ltd D16063-3 Magnetic South Pty Ltd – Gemini Project: Air Quality and Greenhouse Gas Assessment –
Final
2 October 2019
Page 9
3.3 Existing environment
3.3.1 Local terrain and land-use
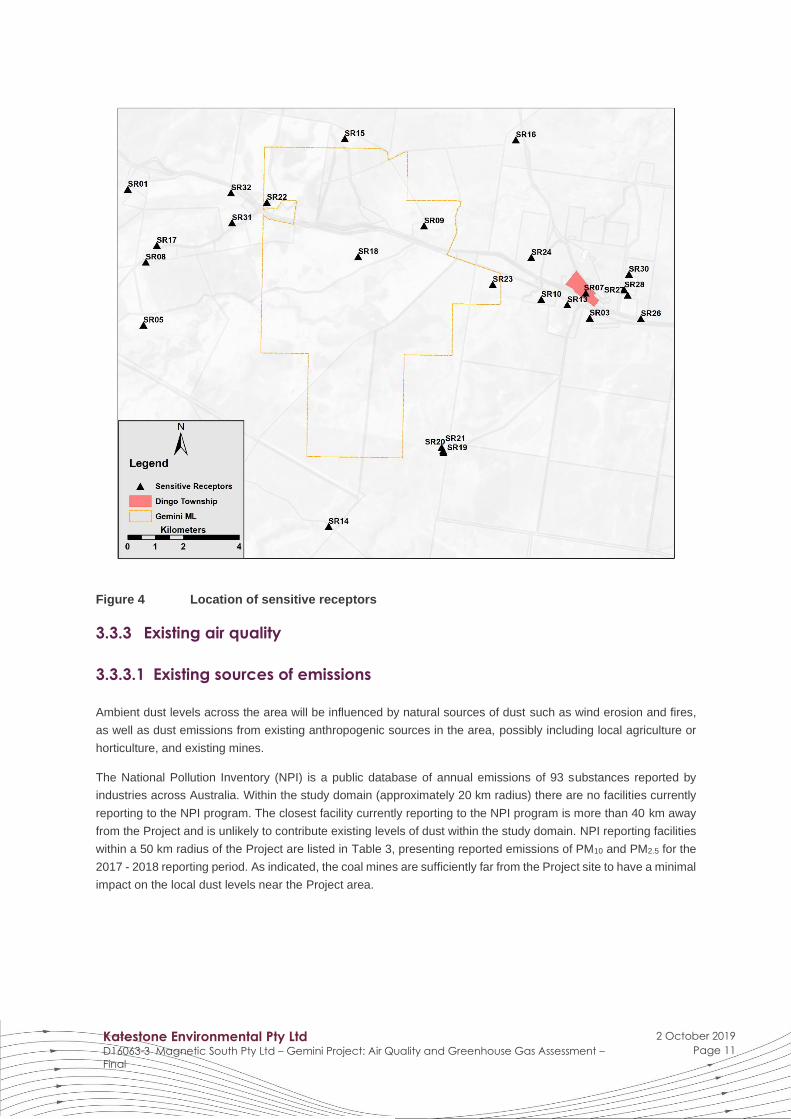
Figure 3 illustrates the area considered in the air quality impact assessment of the Project. The study area covers
approximately 400 km2 and extends beyond the borders of the proposed Mining Lease Application (MLA) in order
to assess the potential impact of the Project on the air quality of the wider community and, in particular, the sensitive
receptors in the region as shown in Figure 4 and Table 2.
The terrain and land-use in the surrounding area is primarily flat open and agricultural bush and shrubland. Other
features include Taunton National Park to the north of the proposed MLA, established as conservation land for the
endangered Bridled Nailtail Wallaby, and Blackdown Tablelands National Park approximately 9 km south-west of
the Project ML boundary.
Figure 3 Study area terrain (contours in metres above sea-level)
3.3.2 Sensitive receptors
Sensitive receptors considered in the assessment are presented in Table 2 and Figure 4, encompassing
residences, businesses, and recreational areas.

Katestone Environmental Pty Ltd D16063-3 Magnetic South Pty Ltd – Gemini Project: Air Quality and Greenhouse Gas Assessment –
Final
2 October 2019
Page 10
Table 2 Sensitive receptors surrounding the Project
Receptor ID
Receptor type Property name Easting
(m)
Northing
(m)
Location relative to
ML boundary
SR01 Residential Unknown 721380 7386940 4.8 km W
SR03 Residential Unknown 737915 7382328 3.2 km E
SR05 Residential Charlevue 721937 7382077 4.2 km W
SR07
Residential, facilities (sports oval, tennis
court, school) & businesses (Post
Office, hotel, shops, sawmills, etc.)
Dingo Township 737777 (town
centre)
7383220 (town centre)
2.3 km E (from point closest to
the Project)
SR08 Residential Dunkerinn 722022 7384327 4.2 km W
SR09 Residential Ellesmere 731988 7385624 Within ML
SR10 Residential Fairview Park 736181 7382995 1.4 km E
SR13 Residential Fairview Park 737113 7382802 2.3 km E
SR14 Residential Glenwood 728569 7374873 2.5 km S
SR15 Residential Gum Flat 729144 7388750 0.3 km N
SR16 Residential Lanlea 735273 7388705 3 km NE
SR17 Residential Myimbarr 722415 7384928 3.9 km W
SR18 Residential Namoi Hills 729626 7384531 Within ML
SR19 Residential Namoi Hills 732684 7377515 1.5 km SE
SR20 Residential Namoi Hills 732671 7377581 1.5 km SE
SR21 Residential Namoi Hills 732614 7377700 1.4 km SE
SR22 Residential and Accommodation
Facility Redrock Park 726358 7386469 Within ML
SR23 Residential Rubina 734446 7383534 Within ML
SR24 Residential Shark Park/Springton Villa 735824 7384500 1.2 km NE
SR26 Residential The Lazy H and Hopevale 739747 7382306 5 km E
SR27 Residential The Lazy H and Hopevale 739278 7383145 4.5 km E
SR28 Residential The Lazy H and Hopevale 739157 7383337 4.4 km E
SR30 Residential The Lazy H and Hopevale 739319 7383894 4.6 km E
SR31 Residential Unknown 725109 7385743 1.1 km NW
SR32 Residential Unknown 725075 7386813 1.2 km NW
At the time of report preparation, Magnetic South is the landowner of Lot 2, HT138, on which sensitive receivers
SR19, SR20 and SR21 are located. Discussions between Magnetic South and landowners of properties located
within the ML are ongoing.
Katestone Environmental Pty Ltd D16063-3 Magnetic South Pty Ltd – Gemini Project: Air Quality and Greenhouse Gas Assessment –
Final
2 October 2019
Page 11
Figure 4 Location of sensitive receptors
3.3.3 Existing air quality
3.3.3.1 Existing sources of emissions
Ambient dust levels across the area will be influenced by natural sources of dust such as wind erosion and fires,
as well as dust emissions from existing anthropogenic sources in the area, possibly including local agriculture or
horticulture, and existing mines.
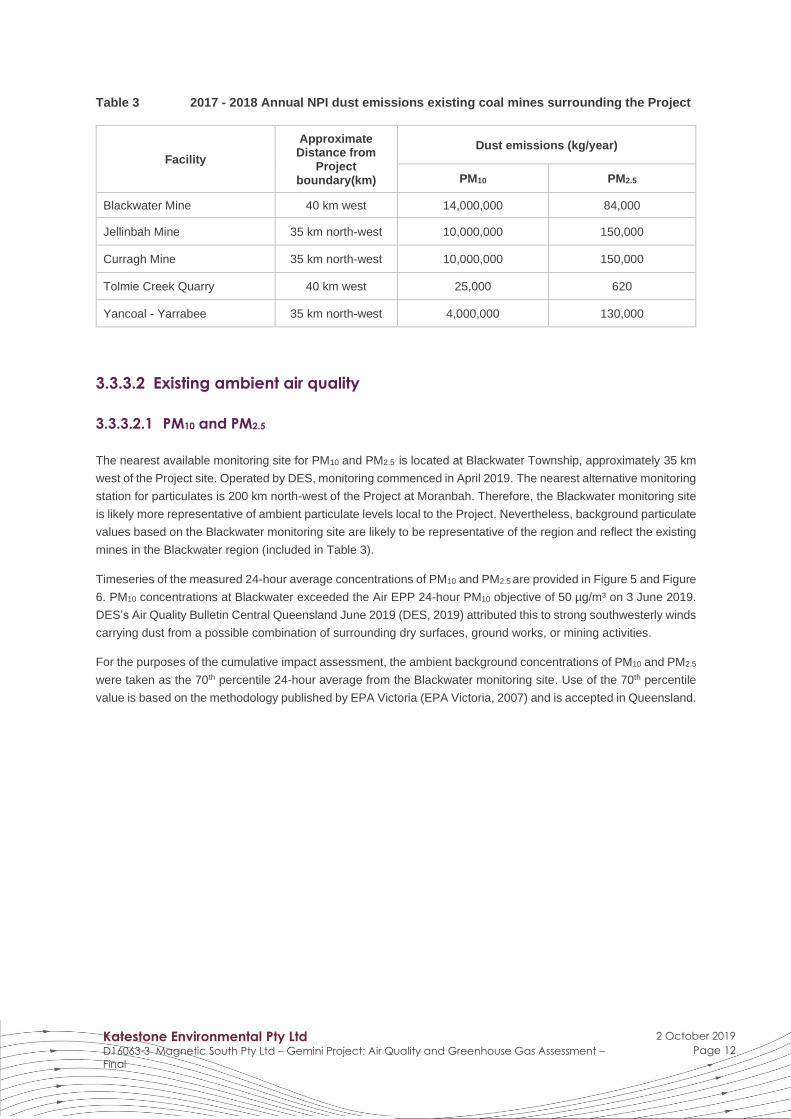
The National Pollution Inventory (NPI) is a public database of annual emissions of 93 substances reported by
industries across Australia. Within the study domain (approximately 20 km radius) there are no facilities currently
reporting to the NPI program. The closest facility currently reporting to the NPI program is more than 40 km away
from the Project and is unlikely to contribute existing levels of dust within the study domain. NPI reporting facilities
within a 50 km radius of the Project are listed in Table 3, presenting reported emissions of PM10 and PM2.5 for the
2017 - 2018 reporting period. As indicated, the coal mines are sufficiently far from the Project site to have a minimal
impact on the local dust levels near the Project area.
Katestone Environmental Pty Ltd D16063-3 Magnetic South Pty Ltd – Gemini Project: Air Quality and Greenhouse Gas Assessment –
Final
2 October 2019
Page 12
Table 3 2017 - 2018 Annual NPI dust emissions existing coal mines surrounding the Project
Facility
Approximate Distance from
Project boundary(km)
Dust emissions (kg/year)
PM10 PM2.5
Blackwater Mine 40 km west 14,000,000 84,000
Jellinbah Mine 35 km north-west 10,000,000 150,000
Curragh Mine 35 km north-west 10,000,000 150,000
Tolmie Creek Quarry 40 km west 25,000 620
Yancoal - Yarrabee 35 km north-west 4,000,000 130,000
3.3.3.2 Existing ambient air quality
3.3.3.2.1 PM10 and PM2.5
The nearest available monitoring site for PM10 and PM2.5 is located at Blackwater Township, approximately 35 km
west of the Project site. Operated by DES, monitoring commenced in April 2019. The nearest alternative monitoring
station for particulates is 200 km north-west of the Project at Moranbah. Therefore, the Blackwater monitoring site
is likely more representative of ambient particulate levels local to the Project. Nevertheless, background particulate
values based on the Blackwater monitoring site are likely to be representative of the region and reflect the existing
mines in the Blackwater region (included in Table 3).
Timeseries of the measured 24-hour average concentrations of PM10 and PM2.5 are provided in Figure 5 and Figure
6. PM10 concentrations at Blackwater exceeded the Air EPP 24-hour PM10 objective of 50 µg/m³ on 3 June 2019.
DES’s Air Quality Bulletin Central Queensland June 2019 (DES, 2019) attributed this to strong southwesterly winds
carrying dust from a possible combination of surrounding dry surfaces, ground works, or mining activities.
For the purposes of the cumulative impact assessment, the ambient background concentrations of PM10 and PM2.5
were taken as the 70th percentile 24-hour average from the Blackwater monitoring site. Use of the 70th percentile
value is based on the methodology published by EPA Victoria (EPA Victoria, 2007) and is accepted in Queensland.

Katestone Environmental Pty Ltd D16063-3 Magnetic South Pty Ltd – Gemini Project: Air Quality and Greenhouse Gas Assessment –
Final
2 October 2019
Page 13
Figure 5 Timeseries of 24-hour average PM10 for Blackwater
Figure 6 Timeseries of 24-hour average PM2.5 for Blackwater

Katestone Environmental Pty Ltd D16063-3 Magnetic South Pty Ltd – Gemini Project: Air Quality and Greenhouse Gas Assessment –
Final
2 October 2019
Page 14
3.3.3.2.2 TSP and dust deposition
DES does not conduct monitoring for TSP and dust deposition at its Blackwater site and publicly available data for
the region is limited. Therefore, background levels of TSP have been derived from the measured PM10 data at
Blackwater. Dust deposition rates have been based on typical dust deposition rates for rural areas.
3.3.3.2.3 Summary of background levels
Representative background levels of TSP, PM10, PM2.5 and dust deposition for the region, as derived in the
preceding sections, are summarised in Table 4. These values have been used to assess potential cumulative
impacts of the Project in the context of the existing environment.
Table 4 Ambient background concentrations used to assess cumulative impacts
Pollutant Averaging Period Concentration Source
TSP Annual 32.8 µg/m3 Calculated from the average PM10
data measured at Blackwater using PM10/TSP ratio of 0.5
PM10
24-hour 18.2 µg/m3 70th percentile of monitoring data at Blackwater
Annual 16.4 µg/m3 Average of monitoring data at
Blackwater
PM2.5
24-hour 4.7 µg/m3 70th percentile of monitoring data
at Blackwater
Annual 4.2 µg/m3 Average of monitoring data at
Blackwater
Dust deposition Monthly 30 mg/m²/day Typical value

Katestone Environmental Pty Ltd D16063-3 Magnetic South Pty Ltd – Gemini Project: Air Quality and Greenhouse Gas Assessment –
Final
2 October 2019
Page 15
3.4 Emissions to the atmosphere
Dust emissions will be generated over the life of the Project as a result of material extraction, handling, haulage
and wind erosion of exposed mine areas. Emissions of oxides of nitrogen, sulfur dioxide and carbon monoxide
would also occur due to blasting activities and vehicle movements (combustion of fuels) on site. However, these
emissions are transient (contained within the haul road corridor and open-cut pits) and low in magnitude, Their
impact outside of the Project site likely to be negligible. For these reasons, dust (and associated particulate matter)
is the critical air pollutant for this assessment.
Odour is unlikely to be emitted from typical mining activities. Spontaneous combustion is a potential source of
odour from mining activities but the potential for this is low and, therefore, odour has not been assessed further in
this assessment.
The following sections provide an inventory of dust emissions for the assessment scenarios and a description of
dust mitigation measures proposed by Magnetic South.
3.4.1 Overview
Key dust-generating activities associated with the Project include:
• Drilling and blasting
• Material extraction and handling (overburden and ROM coal)
• Bulldozer activity
• Material haulage (overburden and ROM coal)
• Road grading
• Wind erosion of exposed mine areas.
3.4.2 Standard mitigation measures
Dust mitigation and operational controls have been included in the Project design to minimise dust emissions from
mining activities, including application of water to haul roads. Standard efficiency factors for these control measures
are presented in Table 5.
Table 5 Standard dust control measures and relative reduction in emissions
Activity Control measure Reduction
ROM coal haulage Watering 85%
Overburden haulage Watering 85%
Drilling Drill dust suppression sprays 70%
ROM unloading at CHPP Water sprays 70%
Crushing Enclosure 70%
Product stockpile Wet from CHPP 50%
Train loading Telescopic chute with water spray 85%
Conveyor Enclosure 70%
Conveyor Uncovered 0%

Katestone Environmental Pty Ltd D16063-3 Magnetic South Pty Ltd – Gemini Project: Air Quality and Greenhouse Gas Assessment –
Final
2 October 2019
Page 16
3.4.3 Additional mitigation measures
For the Project, there will be ongoing implementation of the standard dust control measures. Application of
additional mitigation measures will occur under adverse meteorological conditions that are conducive to dust
impacts, when necessary. Additional mitigation measures may include but are not limited to the modification of
activity rate or ceasing of certain operations. Specific measures are detailed in section 3.5.
3.4.4 Emissions inventory
A breakdown of the total dust emission rates estimated for years 2, 8, and 15 of the Project is presented in Table
6. The corresponding emission areas are illustrated schematically in Figure 7, Figure 8, and Figure 9. Emissions
have been estimated as described in Section 3.2.4 and are presented inclusive of standard mitigation control
factors described in Table 5.

Katestone Environmental Pty Ltd D16063-3 Magnetic South Pty Ltd – Gemini Project: Air Quality and Greenhouse Gas Assessment – Final
2 October 2019
Page 17
Table 6 Emissions inventory for year 2, year 8 and year 15
Activity
Year 2 (kg/year) Year 8 (kg/year) Year 15 (kg/year)
TSP PM10 PM2.5 TSP PM10 PM2.5 TSP PM10 PM2.5
Active Pit
Drilling 2,936 1,543 88 2,240 1,177 67 2,055 1,080 62
Blasting 46,090 23,883 1,383 35,211 18,246 1,056 32,263 16,718 968
Bulldozer assist after blasting - coal 79,839 27,072 1,756 63,871 21,657 1,405 159,678 54,144 3,513
Bulldozer assist after blasting - OB 24,267 4,607 2,548 24,267 4,607 2,548 24,267 4,607 2,548
Excavator - ROM removal 146 69 10 193 91 14 184 87 13
Excavator overburden removal 9,281 4,390 665 10,625 5,025 761 10,187 4,818 730
Truck loading /dumping overburden 9,281 4,390 665 10,625 5,025 761 10,187 4,818 730
Bulldozer on overburden spoil 16,178 3,071 1,699 16,178 3,071 1,699 16,178 3,071 1,699
Bulldozer on rehabilitation 24,267 4,607 2,548 24,267 4,607 2,548 8,089 1,536 849
CHPP/TLO
Processing activities (crushing/screening) 31,050 11,207 2,578 32,731 11,814 2,718 31,211 11,265 2,592
Truck dumping ROM 55 26 4 58 27 4 55 26 4
Load to CHPP 91 43 7 96 46 7 92 43 7
Dozer reclaim from product stockpile to conveyor 205 97 15 205 97 15 210 99 15
Transfer from conveyor to surge bin 45 21 3 45 21 3 45 21 3
Train loading from surge bin 68 32 5 68 32 5 68 32 5
Truck loading reject coal 41 19 3 51 24 4 38 18 3
Conveying 234 110 17 234 110 17 234 110 17
HAULS
ROM haulage 231,494 65,986 6,599 304,744 86,866 8,687 365,959 104,315 10,432
Overburden haulage 1,310,944 373,679 37,368 1,186,931 338,330 33,833 1,627,043 463,782 46,378
Rejects haulage 105,330 47,954 27,366 128,159 36,531 3,653 191,356 54,545 5,455
GRADING - ROM hauls 87,410 16,772 2,710 128,565 24,669 3,986 124,168 23,825 3,849
GRADING - other hauls 74,722 41,173 6,652 33,567 6,441 1,041 37,964 7,285 1,177

Katestone Environmental Pty Ltd D16063-3 Magnetic South Pty Ltd – Gemini Project: Air Quality and Greenhouse Gas Assessment – Final
2 October 2019
Page 18
Activity
Year 2 (kg/year) Year 8 (kg/year) Year 15 (kg/year)
TSP PM10 PM2.5 TSP PM10 PM2.5 TSP PM10 PM2.5
WIND EROSION
Exposed mine area 53,908 26,954 4,043 62,677 31,339 4,701 46,560 23,280 3,492
Coal stockpiles 150,331 75,166 11,275 150,331 75,166 11,275 150,331 75,166 11,275
Active rehabilitation areas 89,353 44,677 6,702 91,910 45,955 6,893 75,365 37,682 5,652
Rehabilitated areas NA NA NA 81,779 40,889 6,133 222,157 111,079 16,662
Overburden dump areas 164,270 82,135 12,320 90,871 45,436 6,815 163,211 81,605 12,241
Total 2,511,837 859,684 129,027 2,480,498 807,299 100,648 3,299,153 1,085,058 130,368

Katestone Environmental Pty Ltd D16063-3 Magnetic South Pty Ltd – Gemini Project: Air Quality and Greenhouse Gas
Assessment – Final
2 October 2019
Page 19
Figure 7 Year 2 - Dust emission source areas

Katestone Environmental Pty Ltd D16063-3 Magnetic South Pty Ltd – Gemini Project: Air Quality and Greenhouse Gas
Assessment – Final
2 October 2019
Page 20
Figure 8 Year 8 - Dust emission source areas

Katestone Environmental Pty Ltd D16063-3 Magnetic South Pty Ltd – Gemini Project: Air Quality and Greenhouse Gas
Assessment – Final
2 October 2019
Page 21
Figure 9 Year 15 - Dust emission source areas

Katestone Environmental Pty Ltd D16063-3 Magnetic South Pty Ltd – Gemini Project: Air Quality and Greenhouse Gas
Assessment – Final
2 October 2019
Page 22
3.5 Air quality impact assessment
This section presents the results of the dispersion modelling assessment of the Project. As outlined in Section
3.2.6, this study has erred on the side of caution and selected conservative inputs and, therefore, the predicted
concentrations of dust are conservative overestimates. Results have been presented for mining years 2, 8, and 15
as ground-level concentrations or deposition rates at the sensitive receptors as well as contours across the
modelling domain. These results are subject to the standard mitigation measures outlined in Section 3.4.2.
Background dust levels have been added to the incremental model predictions in order to estimate the potential
cumulative impacts of the Project with existing sources of dust in the region. Results have been assessed by
comparing the cumulative concentrations and dust deposition rates with the air quality objectives described in
Section 3.1.
When interpreting the results, it is important to note that the predictions are not contemporaneous. The values
presented are the maximum concentration predicted independently at each sensitive receptor or grid point for the
entire modelling period and thus constitute a worst-case or near worst-case result. These values do not necessarily
occur at the same time or under the same meteorological conditions.
3.5.1 Year 2
Table 7 presents the predicted ground-level concentrations of TSP, PM10 and PM2.5 as well as dust deposition
rates at the sensitive receptors due to the Project in year 2 in isolation and with a background. The corresponding
contours for each cumulative scenario are presented in Plate 1 to Plate 6.
The results show that using standard mitigation measures:
• Predicted annual average concentrations of TSP comply with the relevant air quality objective at all
sensitive receptors (Plate 1)
• Predicted 24-hour average concentrations of PM10 comply with the relevant air quality objective at most
sensitive receptors with the exception of SR03, SR07 (Dingo Township), SR09, SR13, SR18, SR19,
SR20, SR21, SR22, SR23 and SR32 (Plate 2)
• Predicted annual average concentrations of PM10 comply with the relevant air quality objective at all
sensitive receptors with the exception of SR18 (within Project ML) (Plate 3)
• Predicted 24-hour and annual average concentrations of PM2.5 comply with the relevant air quality
objectives at all sensitive receptors (Plate 4 and Plate 5)
• Predicted monthly dust deposition rates comply with the relevant air quality guideline at all sensitive
receptors using standard mitigation measures (Plate 6).
Table 8 presents the number of days per year when 24-hour average concentrations of PM10 are predicted to
exceed the Air EPP objective due to the Project operating with standard mitigation. With the exception of SR09
and SR18, predicted 24-hour average concentrations of PM10 are only expected to exceed at most one to three
days per year.
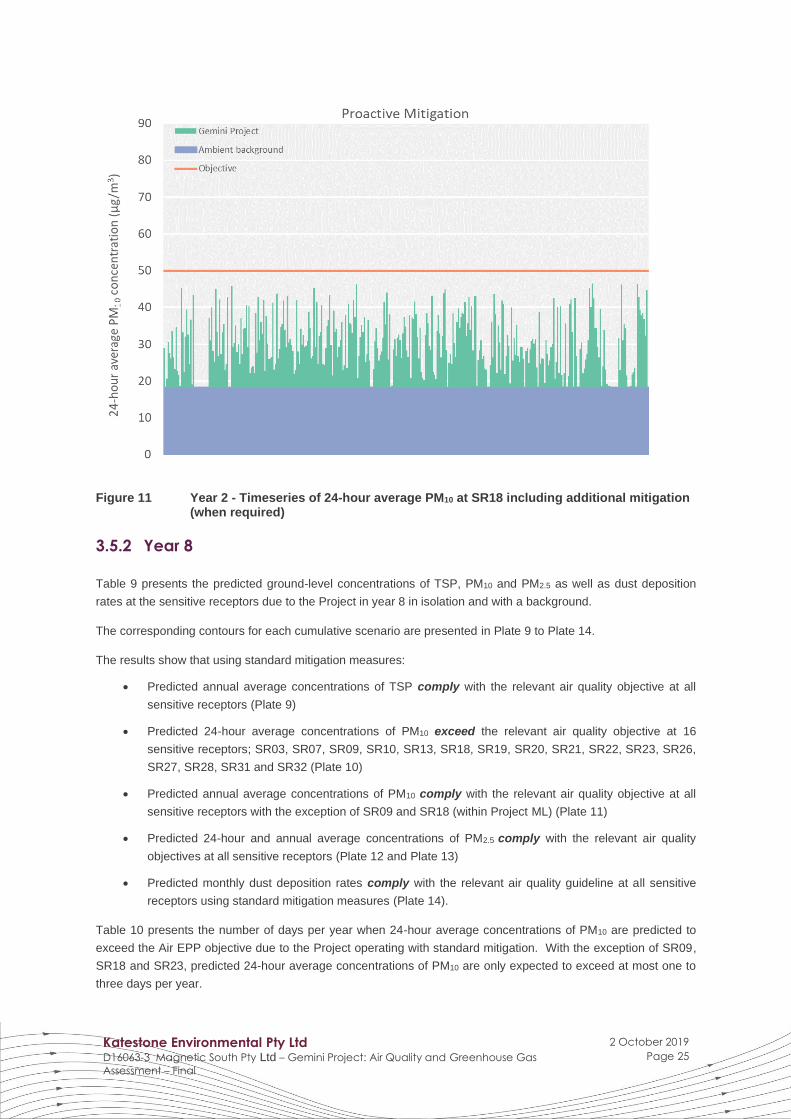
Using standard and, when necessary, additional mitigation measures predicted 24-hour average and annual
average concentrations of PM10 comply with the relevant air quality objective at all sensitive receptors. (Plate 7
and Plate 8). Additional mitigation measures include restricting overburden and ROM haul to between 7am and
6pm on days when 24-hour averaged maximum PM10 is predicted to exceed 50 µg/m3.
Figure 10 and Figure 11 illustrate a timeseries of predicted 24-hour average PM10 concentrations at SR09 and
SR18 when standard and additional mitigation is applied when necessary. Compliance at SR18 and SR09 would
result in compliance at all other sensitive receptors.

Katestone Environmental Pty Ltd D16063-3 Magnetic South Pty Ltd – Gemini Project: Air Quality and Greenhouse Gas Assessment – Final
2 October 2019
Page 23
Table 7 Predicted ground-level concentrations of TSP, PM10, PM2.5 and dust deposition rates at sensitive receptors during year 2 using standard mitigation measures
Label
PM10(µg/m3) PM2.5 (µg/m3) TSP (µg/m3) Dust deposition rate
(mg/m2/day)
Maximum 24-hour Annual Maximum 24-hour Annual Annual Maximum monthly
Project With bkgd Project With bkgd Project With bkgd Project With bkgd Project With bkgd Project With bkgd
SR01 12.1 30.3 1.0 17.4 3.4 8.1 0.2 4.4 1.2 34.0 3.0 33.0
SR03 32.6 50.8 0.9 17.3 5.1 9.8 0.1 4.3 1.0 33.8 3.5 33.5
SR05 7.6 25.8 1.0 17.4 2.0 6.7 0.2 4.4 1.3 34.1 2.1 32.1
SR07 51.0 69.2 0.7 17.1 4.8 9.5 0.1 4.3 0.8 33.6 3.3 33.3
SR08 14.1 32.3 1.2 17.6 3.8 8.5 0.3 4.5 1.4 34.2 3.1 33.1
SR09 61.4 79.6 6.9 23.3 7.9 12.6 1.0 5.2 9.7 42.5 17.7 47.7
SR10 25.8 44.0 0.9 17.3 3.9 8.6 0.1 4.3 1.2 34.0 4.3 34.3
SR13 40.8 59.0 0.9 17.3 5.8 10.5 0.1 4.3 1.2 34.0 4.7 34.7
SR14 15.0 33.2 0.7 17.1 3.4 8.1 0.1 4.3 0.9 33.7 2.7 32.7
SR15 23.4 41.6 4.6 21.0 4.2 8.9 0.8 5.0 5.3 38.1 11.5 41.5
SR16 24.8 43.0 1.1 17.5 4.7 9.4 0.2 4.4 1.2 34.0 1.1 31.1
SR17 15.9 34.1 1.4 17.8 4.3 9.0 0.3 4.5 1.6 34.4 3.9 33.9
SR18 70.2 88.4 17.4 33.8 12.4 17.1 2.6 6.8 28.6 61.4 50.9 80.9
SR19 39.4 57.6 2.4 18.8 6.8 11.5 0.4 4.6 3.0 35.8 5.8 35.8
SR20 40.0 58.2 2.4 18.8 6.9 11.6 0.4 4.6 3.1 35.9 6.1 36.1
SR21 40.6 58.8 2.5 18.9 6.7 11.4 0.4 4.6 3.3 36.1 6.5 36.5
SR22 32.2 50.4 3.9 20.3 5.5 10.2 0.8 5.0 4.6 37.4 5.8 35.8
SR23 42.8 61.0 1.8 18.2 7.3 12.0 0.3 4.5 2.5 35.3 6.0 36.0
SR24 26.5 44.7 0.9 17.3 4.0 8.7 0.1 4.3 1.1 33.9 2.3 32.3
SR26 23.0 41.2 0.5 16.9 4.0 8.7 0.1 4.3 0.5 33.3 1.7 31.7
SR27 30.6 48.8 0.5 16.9 4.7 9.4 0.1 4.3 0.6 33.4 2.3 32.3
SR28 29.7 47.9 0.5 16.9 4.7 9.4 0.1 4.3 0.6 33.4 2.2 32.2
SR30 16.4 34.6 0.4 16.8 2.6 7.3 0.1 4.3 0.5 33.3 1.5 31.5
SR31 29.5 47.7 3.1 19.5 6.7 11.4 0.6 4.8 3.5 36.3 5.9 35.9
SR32 38.8 57.0 2.8 19.2 7.4 12.1 0.6 4.8 3.3 36.1 4.4 34.4
Objective - 50 - 25 - 25 - 8 - 90 - 120

Katestone Environmental Pty Ltd D16063-3 Magnetic South Pty Ltd – Gemini Project: Air Quality and Greenhouse Gas
Assessment – Final
2 October 2019
Page 24
Table 8 Number of days per year predicted to exceed in year 2
ID Number of days above 50 µg/m3
SR03 Residential 1
SR07 Dingo Township 1
SR09 Residential (within ML) 14
SR13 Residential 1
SR18 Residential (within ML) 54
SR19 Residential 2
SR20 Residential 2
SR21 Residential 2
SR22 Residential and Accommodation Facility (within ML) 1
SR23 Residential (within ML) 3
SR32 Residential 1
Figure 10 Year 2 – Timeseries of 24-hour average PM10 at SR09 including additional mitigation (when required)
Katestone Environmental Pty Ltd D16063-3 Magnetic South Pty Ltd – Gemini Project: Air Quality and Greenhouse Gas
Assessment – Final
2 October 2019
Page 25
Figure 11 Year 2 - Timeseries of 24-hour average PM10 at SR18 including additional mitigation (when required)
3.5.2 Year 8
Table 9 presents the predicted ground-level concentrations of TSP, PM10 and PM2.5 as well as dust deposition
rates at the sensitive receptors due to the Project in year 8 in isolation and with a background.
The corresponding contours for each cumulative scenario are presented in Plate 9 to Plate 14.
The results show that using standard mitigation measures:
• Predicted annual average concentrations of TSP comply with the relevant air quality objective at all
sensitive receptors (Plate 9)
• Predicted 24-hour average concentrations of PM10 exceed the relevant air quality objective at 16
sensitive receptors; SR03, SR07, SR09, SR10, SR13, SR18, SR19, SR20, SR21, SR22, SR23, SR26,
SR27, SR28, SR31 and SR32 (Plate 10)
• Predicted annual average concentrations of PM10 comply with the relevant air quality objective at all
sensitive receptors with the exception of SR09 and SR18 (within Project ML) (Plate 11)
• Predicted 24-hour and annual average concentrations of PM2.5 comply with the relevant air quality
objectives at all sensitive receptors (Plate 12 and Plate 13)
• Predicted monthly dust deposition rates comply with the relevant air quality guideline at all sensitive
receptors using standard mitigation measures (Plate 14).
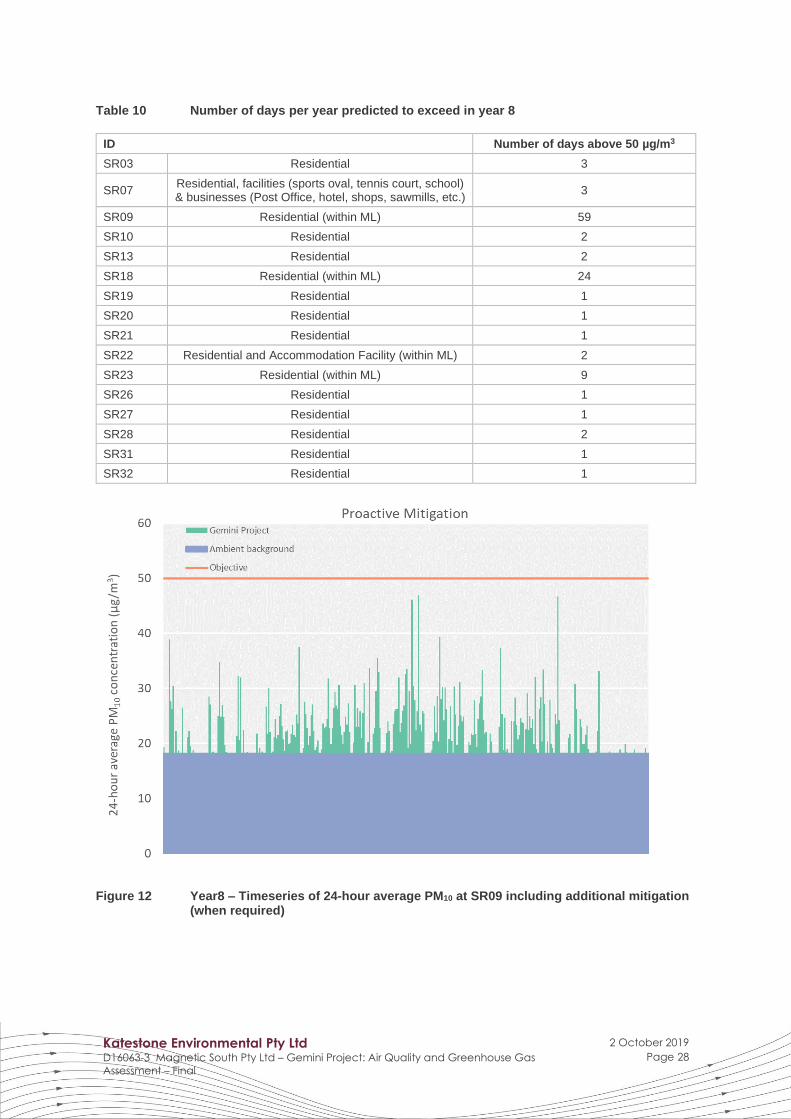
Table 10 presents the number of days per year when 24-hour average concentrations of PM10 are predicted to
exceed the Air EPP objective due to the Project operating with standard mitigation. With the exception of SR09,
SR18 and SR23, predicted 24-hour average concentrations of PM10 are only expected to exceed at most one to
three days per year.

Katestone Environmental Pty Ltd D16063-3 Magnetic South Pty Ltd – Gemini Project: Air Quality and Greenhouse Gas
Assessment – Final
2 October 2019
Page 26
Using standard and, when necessary, additional mitigation measures predicted 24-hour average and annual
average concentrations of PM10 comply with the relevant air quality objective at all sensitive receptors. (Plate 15
and Plate 16). Additional mitigation measures may include restricting overburden and ROM haul to between 7am
and 6pm on days when 24-hour averaged maximum PM10 is predicted to exceed 50 µg/m3.
Figure 12 and Figure 13 illustrate a timeseries of predicted 24-hour average PM10 concentrations at SR09 and
SR18 when standard and when necessary additional mitigation is applied. Compliance at SR18 and SR09 would
result in compliance at all other sensitive receptors.

Katestone Environmental Pty Ltd D16063-3 Magnetic South Pty Ltd – Gemini Project: Air Quality and Greenhouse Gas Assessment – Final
2 October 2019
Page 27
Table 9 Predicted ground-level concentrations of TSP, PM10, PM2.5 and dust deposition rates at sensitive receptors during year 8 using standard mitigation measures
Label
PM10(µg/m3) PM2.5 (µg/m3) TSP (µg/m3) Dust deposition rate
(mg/m2/day)
Maximum 24-hour Annual Maximum 24-hour Annual Annual Maximum monthly
Project With bkgd Project With bkgd Project With bkgd Project With bkgd Project With bkgd Project With bkgd
SR01 9.1 27.3 0.8 17.2 2.8 7.5 0.2 4.4 0.9 33.7 2.2 32.2
SR03 72.4 90.6 1.1 17.5 11.6 16.3 0.2 4.4 1.2 34.0 3.2 33.2
SR05 7.1 25.3 0.9 17.3 1.9 6.6 0.2 4.4 1.0 33.8 1.4 31.4
SR07 37.6 55.8 0.9 17.3 6.2 10.9 0.1 4.3 1.0 33.8 2.9 32.9
SR08 10.7 28.9 1.0 17.4 3.2 7.9 0.2 4.4 1.1 33.9 1.9 31.9
SR09 100.4 118.6 12.8 29.2 14.1 18.8 1.9 6.1 15.5 48.3 23.0 53.0
SR10 40.4 58.6 1.1 17.5 5.7 10.4 0.2 4.4 1.4 34.2 3.9 33.9
SR13 52.8 71.0 1.3 17.7 7.7 12.4 0.2 4.4 1.5 34.3 4.6 34.6
SR14 12.6 30.8 0.6 17.0 2.7 7.4 0.1 4.3 0.7 33.5 1.5 31.5
SR15 20.7 38.9 3.6 20.0 4.1 8.8 0.7 4.9 3.8 36.6 5.1 35.1
SR16 29.9 48.1 1.3 17.7 5.6 10.3 0.3 4.5 1.4 34.2 1.2 31.2
SR17 11.4 29.6 1.2 17.6 3.5 8.2 0.3 4.5 1.3 34.1 2.6 32.6
SR18 69.8 88.0 12.6 29.0 10.2 14.9 2.0 6.2 19.3 52.1 35.6 65.6
SR19 41.8 60.0 2.0 18.4 6.3 11.0 0.3 4.5 2.3 35.1 2.9 32.9
SR20 43.8 62.0 2.1 18.5 6.5 11.2 0.4 4.6 2.3 35.1 3.1 33.1
SR21 48.8 67.0 2.2 18.6 7.2 11.9 0.4 4.6 2.5 35.3 3.3 33.3
SR22 44.6 62.8 3.2 19.6 8.6 13.3 0.7 4.9 3.7 36.5 4.4 34.4
SR23 56.7 74.9 2.4 18.8 9.6 14.3 0.4 4.6 3.1 35.9 6.1 36.1
SR24 31.4 49.6 1.0 17.4 4.6 9.3 0.2 4.4 1.2 34.0 2.1 32.1
SR26 50.0 68.2 0.6 17.0 8.8 13.5 0.1 4.3 0.7 33.5 1.7 31.7
SR27 34.6 52.8 0.6 17.0 5.0 9.7 0.1 4.3 0.7 33.5 1.8 31.8
SR28 35.1 53.3 0.6 17.0 5.6 10.3 0.1 4.3 0.7 33.5 1.8 31.8
SR30 23.8 42.0 0.4 16.8 3.9 8.6 0.1 4.3 0.5 33.3 1.2 31.2
SR31 33.2 51.4 2.5 18.9 8.2 12.9 0.6 4.8 2.8 35.6 4.4 34.4
SR32 37.4 55.6 2.3 18.7 7.8 12.5 0.5 4.7 2.6 35.4 3.2 33.2
Objective - 50 - 25 - 25 - 8 - 90 - 120
Katestone Environmental Pty Ltd D16063-3 Magnetic South Pty Ltd – Gemini Project: Air Quality and Greenhouse Gas
Assessment – Final
2 October 2019
Page 28
Table 10 Number of days per year predicted to exceed in year 8
ID Number of days above 50 µg/m3
SR03 Residential 3
SR07 Residential, facilities (sports oval, tennis court, school) & businesses (Post Office, hotel, shops, sawmills, etc.)
3
SR09 Residential (within ML) 59
SR10 Residential 2
SR13 Residential 2
SR18 Residential (within ML) 24
SR19 Residential 1
SR20 Residential 1
SR21 Residential 1
SR22 Residential and Accommodation Facility (within ML) 2
SR23 Residential (within ML) 9
SR26 Residential 1
SR27 Residential 1
SR28 Residential 2
SR31 Residential 1
SR32 Residential 1
Figure 12 Year8 – Timeseries of 24-hour average PM10 at SR09 including additional mitigation (when required)

Katestone Environmental Pty Ltd D16063-3 Magnetic South Pty Ltd – Gemini Project: Air Quality and Greenhouse Gas
Assessment – Final
2 October 2019
Page 29
Figure 13 Year 8 – Timeseries of 24-hour average PM10 at SR18 including additional mitigation (when required)
3.5.3 Year 15
Table 11 presents the predicted ground-level concentrations of TSP, PM10 and PM2.5 as well as dust deposition
rates at the sensitive receptors due to the Project in year 15 in isolation and with a background.
The corresponding contours for each cumulative scenario are presented in Plate 17 to Plate 22.
The results show that using standard mitigation measures:
• Predicted annual average concentrations of TSP comply with the relevant air quality objective at all
sensitive receptors (Plate 17)
• Predicted 24-hour average concentrations of PM10 exceed the relevant air quality objective at 8 sensitive
receptors; SR14, SR18, SR19, SR20, SR21, SR22, SR31 and SR32 (Plate 18)
• Predicted annual average concentrations of PM10 comply with the relevant air quality objective at all
sensitive receptors with the exception of SR22 (Plate 19)
• Predicted 24-hour and annual average concentrations of PM2.5 comply with the relevant air quality
objectives at all sensitive receptors (Plate 20 and Plate 21)
• Predicted monthly dust deposition rates comply with the relevant air quality guideline at all sensitive
receptors using standard mitigation measures (Plate 22).
Table 12 presents the number of days per year when 24-hour average concentrations of PM10 are predicted to
exceed the Air EPP objective due to the Project operating with standard mitigation. The greatest number of
exceedances are expected for SR18 and SR22.

Katestone Environmental Pty Ltd D16063-3 Magnetic South Pty Ltd – Gemini Project: Air Quality and Greenhouse Gas
Assessment – Final
2 October 2019
Page 30
Using standard and, when necessary, additional mitigation measures predicted 24-hour average and annual
average concentrations of PM10 comply with the relevant air quality objective at all sensitive receptors. (Plate 23
and Plate 24). Additional mitigation measures may include restricting overburden and ROM haul to between 7am
and 6pm on days when 24-hour averaged maximum PM10 is predicted to exceed 50 µg/m3.
Figure 14 and Figure 15 illustrate a timeseries of predicted 24-hour average PM10 concentrations at SR18 and
SR22 when standard and when necessary additional mitigation is applied. Compliance at SR18 and SR22 would
result in compliance at all other sensitive receptors.

Katestone Environmental Pty Ltd D16063-3 Magnetic South Pty Ltd – Gemini Project: Air Quality and Greenhouse Gas Assessment – Final
2 October 2019
Page 31
Table 11 Predicted ground-level concentrations of TSP, PM10, PM2.5 and dust deposition rates at sensitive receptors during year 15 using standard mitigation measures
Label
PM10(µg/m3) PM2.5 (µg/m3) TSP (µg/m3) Dust deposition rate
(mg/m2/day)
Maximum 24-hour Annual Maximum 24-hour Annual Annual Maximum monthly
Project With bkgd Project With bkgd Project With bkgd Project With bkgd Project With bkgd Project With bkgd
SR01 10.8 29.0 1.5 17.9 2.8 7.5 0.3 4.5 1.7 34.5 2.9 32.9
SR03 5.8 24.0 0.2 16.6 1.0 5.7 0.0 4.2 0.3 33.1 0.8 30.8
SR05 9.3 27.5 1.3 17.7 1.9 6.6 0.3 4.5 1.6 34.4 3.9 33.9
SR07 7.7 25.9 0.3 16.7 1.2 5.9 0.1 4.3 0.3 33.1 0.7 30.7
SR08 16.0 34.2 1.8 18.2 4.4 9.1 0.4 4.6 2.1 34.9 4.2 34.2
SR09 25.7 43.9 1.6 18.0 4.4 9.1 0.3 4.5 1.9 34.7 1.9 31.9
SR10 9.0 27.2 0.4 16.8 1.7 6.4 0.1 4.3 0.5 33.3 1.0 31.0
SR13 9.2 27.4 0.3 16.7 1.4 6.1 0.1 4.3 0.4 33.2 0.8 30.8
SR14 53.7 71.9 3.0 19.4 9.0 13.7 0.5 4.7 3.8 36.6 11.9 41.9
SR15 21.5 39.7 1.3 17.7 3.7 8.4 0.2 4.4 1.4 34.2 1.9 31.9
SR16 19.8 38.0 0.5 16.9 3.9 8.6 0.1 4.3 0.5 33.3 0.5 30.5
SR17 26.7 44.9 2.2 18.6 4.7 9.4 0.5 4.7 2.5 35.3 4.4 34.4
SR18 63.8 82.0 7.6 24.0 9.9 14.6 1.2 5.4 11.8 44.6 26.9 56.9
SR19 55.0 73.2 2.2 18.6 7.8 12.5 0.3 4.5 2.9 35.7 8.2 38.2
SR20 52.2 70.4 2.2 18.6 7.4 12.1 0.3 4.5 2.9 35.7 8.3 38.3
SR21 46.6 64.8 2.2 18.6 6.6 11.3 0.3 4.5 2.8 35.6 8.5 38.5
SR22 53.5 71.7 11.1 27.5 10.0 14.7 1.9 6.1 12.5 45.3 12.5 42.5
SR23 22.5 40.7 0.7 17.1 3.7 8.4 0.1 4.3 0.8 33.6 1.7 31.7
SR24 12.3 30.5 0.4 16.8 1.9 6.6 0.1 4.3 0.5 33.3 0.9 30.9
SR26 5.2 23.4 0.2 16.6 0.9 5.6 0.0 4.2 0.2 33.0 0.7 30.7
SR27 5.1 23.3 0.2 16.6 0.8 5.5 0.0 4.2 0.2 33.0 0.6 30.6
SR28 5.2 23.4 0.2 16.6 0.8 5.5 0.0 4.2 0.2 33.0 0.6 30.6
SR30 5.7 23.9 0.2 16.6 0.9 5.6 0.0 4.2 0.2 33.0 0.5 30.5
SR31 46.2 64.4 7.6 24.0 8.1 12.8 1.4 5.6 8.5 41.3 8.0 38.0
SR32 49.6 67.8 8.4 24.8 8.5 13.2 1.5 5.7 9.3 42.1 7.0 37.0
Objective - 50 - 25 - 25 - 8 - 90 - 120

Katestone Environmental Pty Ltd D16063-3 Magnetic South Pty Ltd – Gemini Project: Air Quality and Greenhouse Gas
Assessment – Final
2 October 2019
Page 32
Table 12 Number of days per year predicted to exceed in year 15
ID Number of days above 50 µg/m3
SR14 Residential 6
SR18 Residential (within ML) 22
SR19 Residential 9
SR20 Residential 9
SR21 Residential 8
SR22 Residential and Accommodation Facility (within ML) 29
SR31 Residential 5
SR32 Residential 9
Figure 14 Year 15 - Timeseries of 24-hour average PM10 at SR18 including additional mitigation (when required)

Katestone Environmental Pty Ltd D16063-3 Magnetic South Pty Ltd – Gemini Project: Air Quality and Greenhouse Gas
Assessment – Final
2 October 2019
Page 33
Figure 15 Year 15 – Timeseries of 24-hour average PM10 at SR22 including additional mitigation (when required)

Katestone Environmental Pty Ltd D16063-3 Magnetic South Pty Ltd – Gemini Project: Air Quality and Greenhouse Gas
Assessment – Final
2 October 2019
Page 34
3.6 Mitigation
Dust management and mitigation measures will be implemented for the Project. It is recommended that Magnetic
South implement the following measures:
1. Develop and implement an ambient air quality monitoring program at sites representative of surrounding
sensitive receptors
2. Develop an Air Quality Management Plan (AQMP) and include a range of available measures to be
implemented as necessary to ensure compliance with approval conditions. Measures that would be
considered for inclusion in the AQMP include:
• Use of real-time measurement of dust levels and meteorological conditions
• Nomination of triggers (e.g. based on complaints and/or real-time dust and meteorological
measurement) and a range of additional measures which will be implemented, as necessary, for
example:
o applying additional at-source and/or at-receptor dust controls
o increasing the intensity of dust controls
o modifying certain operations
• Procedures to investigate, if monitoring indicates unexpected exceedances of air quality objectives.
3. Enter into discussions and, as appropriate, commercial arrangements with surrounding landholders which
could include:
o measures (e.g. purchase or relocation) which result in homesteads no longer being considered
a sensitive receptor
o installation of receptor-side mitigation (e.g. air conditioners / purifiers in affected residences).

Katestone Environmental Pty Ltd D16063-3 Magnetic South Pty Ltd – Gemini Project: Air Quality and Greenhouse Gas
Assessment – Final
2 October 2019
Page 35
4. GREENHOUSE GAS ASSESSMENT
4.1 Background
The term greenhouse gases (GHG) comes from the ‘greenhouse effect’, which refers to the natural process that
warms the Earth’s surface. GHG in the atmosphere absorb the solar radiation released by the Earth’s surface and
then radiate some heat back towards the ground, increasing the surface temperature. Human activity, especially
burning fossil fuels and deforestation, is increasing the concentration of GHG in the atmosphere and hence
increasing the absorption of outgoing heat energy. Even a small increase in long-term average surface
temperatures has numerous direct and indirect consequences for climate.
Australia is a signatory to United Nations Framework Convention on Climate Change (UNFCCC), the associated
Kyoto Protocol signalling its commitment to reducing GHG emissions at a national level. Under the Paris
Agreement, the most recent progression of the UNFCCC, Australia has set an ambitious target to reduce emissions
by 26-28 per cent below 2005 levels by 2030, building on the 2020 target of reducing emissions by five per cent
below 2000 levels.
The main GHG associated with the Project is carbon dioxide (CO2), with smaller contributions from methane (CH4)
and nitrous oxide (N2O). These gases vary in effect and longevity in the atmosphere, however a system named
Global Warming Potential (GWP) allows them to be described in terms of CO2 (the most prevalent greenhouse
gas) called carbon dioxide equivalents (CO2-e). A unit of one tonne of CO2-e is the basic unit used in carbon
accounting. In simple terms the greenhouse gas emissions associated with the Project can be expressed as the
sum of the emission rate of each greenhouse gas multiplied by its associated GWP (denoted in squares). For
example:
tonnes CO2-e = tonnes CO2 x 1 + tonnes CH4 x 25 + tonnes N2O x 310
While few, if any, individual Projects would make a noticeable change to the Earth’s climate, the summation of
human activities increasing the concentrations of GHG in the upper atmosphere does. Climate change is an
environmental concern at a global level. Governments and the global scientific community have established
conventions for accounting for GHG emissions to enable the transparent and verifiable assessment of GHG
emissions among all global jurisdictions. This assessment employs these established conventions so that the
relative impact of the Project can be assessed and understood.
4.2 Regulatory Framework for Greenhouse Gas Emissions
4.2.1 National policy
Australia will meet its targets through the Government’s Direct Action Plan. The Emissions Reduction Fund (ERF)
is a central component of the Direct Action policies that is made up of an element to credit emissions reductions, a
fund to purchase emissions reductions, and a Safeguard Mechanism.
The Safeguard Mechanism has been put in place to ensure that emissions reductions purchased by the
Government through the ERF are not offset by significant increases in emissions by large emitters elsewhere in
the economy. The Safeguard Mechanism commenced on 1 July 2016 and requires Australia’s largest emitters to
keep emissions within baseline levels. It applies to around 140 large businesses that have facilities with direct
emissions (Scope 1 Emissions) of more than 100,000 tonnes of carbon dioxide equivalent (t CO2-e) a year and is
expected to cover approximately half of Australia’s emissions.
Direct emissions associated with the Project are anticipated to exceed 100,000 t CO2-e for all years with the
exception of the first year of operation (2020). As a result, the Project will be subject to the requirements of the
Safeguard Mechanism.

Katestone Environmental Pty Ltd D16063-3 Magnetic South Pty Ltd – Gemini Project: Air Quality and Greenhouse Gas
Assessment – Final
2 October 2019
Page 36
4.2.2 National Greenhouse and Energy Reporting (NGER)
The National Greenhouse and Energy Reporting Act 2007 (NGER Act) established a national framework for
corporations to report GHG emissions and energy consumption.
The NGER Regulation recognises Scope 1 and Scope 2 emissions as follows:
• Scope 1 emissions – in relation to a facility, means the release of GHG into the atmosphere as a direct
result of an activity or series of activities (including ancillary activities) that constitute the facility.
• Scope 2 emissions – in relation to a facility, means the release of GHG into the atmosphere as a direct
result of one or more activities that generate electricity, heating, cooling or steam that is consumed by the
facility but that do not form part of the facility.
Registration and reporting is mandatory for corporations that have energy production, energy use or GHG
emissions that exceed specified thresholds. GHG emission thresholds include Scope 1 and Scope 2 emissions.
NGER reporting thresholds are summarised in Table 13.
Table 13 NGER annual reporting thresholds – greenhouse gas emissions and energy use
Threshold level Threshold type
GHG (kt CO2-e) Energy consumption (TJ)
Facility 25 100
Corporate 50 200
Note:
kt CO2-e = kilotonnes of carbon dioxide equivalent. TJ = terajoules.
With annual emissions (Scope 1 + Scope 2) ranging from 18 kt CO2-e to 211kt CO2-e, Magnetic South will have
reporting obligations associated with the Project under the NGER Scheme, including estimating and reporting their
GHG emissions on an annual basis.
4.3 Methodology
Pollutants of importance to climate change, associated with the Project, are carbon dioxide, methane and nitrous
oxide. This study will assess the emissions of greenhouse gases from the Project during construction and operation
based on activity data representative of the proposed activities and the methods described in the following
resources:
• The National Greenhouse Accounts, July 2017 (Commonwealth Department of the Environment and
Energy, 2017)
• National Greenhouse and Energy Reporting (Measurement) Determination 2008
• The Greenhouse Gas Protocol
• FullCAM – Full Carbon Accounting Model (used to account for GHG emissions from land clearing).
4.3.1 Emissions
Scope 1 and 2 greenhouse gas emissions will be estimated on an annual basis for the Project. This will include
emissions from:

Katestone Environmental Pty Ltd D16063-3 Magnetic South Pty Ltd – Gemini Project: Air Quality and Greenhouse Gas
Assessment – Final
2 October 2019
Page 37
Scope 1 GHG emissions
• Diesel combustion
o Heavy machinery and equipment
o Haulage vehicles
• Fugitive emissions of methane from mining of coal deposits – also referred to as waste mine gas
• Explosives use
Scope 2 GHG Emissions
• Electricity usage
o Conveyors
o Coal processing plant
o Amenities.
A summary of emission sources associated with the both the construction phase and mining production is provided
in Table 14. Emissions sources would reduce during the post production/rehabilitation phase of the mine.
Table 14 Summary of GHG emission sources by year of mining operations
Year ROM Coal
(t) Product Coal
(t) Diesel
(kL) Electricity
(MWh) Explosives
(t/yr)
Year 1 - - 6,200,000 2,000,000 -
Year 2 900,000 868,000 56,911,490 22,527,890 19,867
Year 3 1,900,000 1,831,000 37,531,815 22,527,890 11,234
Year 4 1,900,000 1,831,000 40,987,689 22,527,890 12,409
Year 5 1,900,000 1,831,000 45,413,261 22,527,890 14,139
Year 6 1,900,000 1,831,000 38,148,132 22,527,890 11,431
Year 7 1,900,000 1,831,000 48,778,289 22,527,890 13,622
Year 8 1,900,000 1,831,000 51,109,310 22,527,890 15,185
Year 9 1,900,000 1,831,000 38,913,541 22,527,890 11,004
Year 10 1,900,000 1,831,000 38,107,769 22,527,890 11,100
Year 11 1,900,000 1,831,000 37,030,381 22,527,890 10,689
Year 12 1,900,000 1,831,000 40,218,955 22,527,890 12,094
Year 13 1,800,000 1,735,465 43,619,124 22,527,890 13,982
Year 14 1,800,000 1,756,341 46,218,509 22,527,890 14,316
Year 15 1,800,000 1,744,742 45,322,232 22,527,890 13,913
Year 16 1,800,000 1,742,282 54,648,151 22,527,890 16,330
Year 17 1,800,000 1,732,307 44,877,181 22,527,890 11,846
Year 18 1,800,000 1,737,463 54,606,897 22,527,890 16,239
Year 19 1,593,048 1,536,368 26,028,185 22,527,890 5,744

Katestone Environmental Pty Ltd D16063-3 Magnetic South Pty Ltd – Gemini Project: Air Quality and Greenhouse Gas
Assessment – Final
2 October 2019
Page 38
4.3.2 Emissions estimation
GHG emissions associated with the Project have been considered on an annual basis for the life of the Project.
A summary of estimated emissions associated with mining operations, expressed as tonnes per annum expressed
in terms of CO2-e is presented. Reporting obligations based on a conservative estimate of annual GHG emissions
are summarised, along with measures to mitigate GHG emissions through avoidance and minimisation.
The methodologies used to estimate the GHG emissions resulting from the Project are consistent with:
1. National Greenhouse and Energy Reporting (Measurement) Determination 2008
2. The National Greenhouse Accounts, July 2017 (Commonwealth Department of the Environment and
Energy, 2017)
3. The Greenhouse Gas Protocol.
In particular, the methodology is consistent with a Method 1 approach as detailed in the National Greenhouse and
Energy Reporting (Measurement) Determination.
The emission factors and energy content for each of the emissions sources that have been used in the assessment
are summarised in Table 15.
Table 15 Emission factors and energy content for GHG emission sources
Emission source Scope Energy
content Units
Emission
factor Units
Diesel 1 38.6 GJ/kL 70.2 kg CO2-e/GJ
Fugitive methane (Qld – open cut) 1 - - 0.02 t CO2-e/t ROM
Explosives (Ammonium Nitrate
Fuel Oil [ANFO]) 1 2.4 GJ/t 0.17 t CO2-e/t ANFO
Electricity (Queensland) 2 3.6 MJ/kWh 0.81 kg CO2-e/kWh
Coking coal 3 30 GJ/t 92 kg CO2-e/GJ
Sources: National Greenhouse and Energy Reporting (Measurement) Determination, National Greenhouse Accounts Factors (July 2019),
NGA Workbook (January 2008).
Note:
GJ/kL = gigajoules per kilolitres. GJ/t = gigajoules per tonne. MJ/kWh = megajoules per kilowatt hour.
Kg CO2-e/GJ = kilograms of carbon dioxide equivalent per gigajoule. T CO2-e/t ROM = tonnes of carbon dioxide equivalent
per tonne of ROM coal. T CO2-e/t ANFO = tonnes of carbon dioxide equivalent per tonne of ANFO. Kg CO2-e/kWh =
kilograms of carbon dioxide equivalent per kilowatt hour.
4.4 Results
4.4.1 Scope 1 and 2 GHG emissions and energy use summary
A summary of anticipated annual GHG emissions, by scope, along with estimated energy consumption
corresponding with the mining years are summarised in Table 16 and Table 17.

Katestone Environmental Pty Ltd D16063-3 Magnetic South Pty Ltd – Gemini Project: Air Quality and Greenhouse Gas
Assessment – Final
2 October 2019
Page 39
Table 16 Summary of GHG emissions by year of mining operations
Year
GHG Emissions (t CO2-e/yr)
Scope 1 Scope 2 TOTAL
(Scope 1 & 2) Fugitive methane
Diesel usage Explosives Electricity
usage
Year 1 - 16,800 - 1,620 18,420
Year 2 18,000 154,214 3,377 18,248 193,839
Year 3 38,000 101,701 1,910 18,248 159,858
Year 4 38,000 111,065 2,110 18,248 169,422
Year 5 38,000 123,057 2,404 18,248 181,708
Year 6 38,000 103,371 1,943 18,248 161,562
Year 7 38,000 132,176 2,316 18,248 190,739
Year 8 38,000 138,492 2,581 18,248 197,321
Year 9 38,000 105,445 1,871 18,248 163,563
Year 10 38,000 103,261 1,887 18,248 161,396
Year 11 38,000 100,342 1,817 18,248 158,407
Year 12 38,000 108,982 2,056 18,248 167,286
Year 13 36,000 118,196 2,377 18,248 174,820
Year 14 36,000 125,239 2,434 18,248 181,920
Year 15 36,000 122,811 2,365 18,248 179,423
Year 16 36,000 148,081 2,776 18,248 205,105
Year 17 36,000 121,605 2,014 18,248 177,866
Year 18 36,000 147,969 2,761 18,248 204,978
Year 19 31,861 70,529 977 18,248 121,614
Total 645,861 2,153,336 39,975 330,077 3,169,248

Katestone Environmental Pty Ltd D16063-3 Magnetic South Pty Ltd – Gemini Project: Air Quality and Greenhouse Gas
Assessment – Final
2 October 2019
Page 40
Table 17 Summary of energy use (GJ/y) by year of mining operations
Year
Energy use (GJ/y)
Diesel usage Explosives Electricity usage TOTAL
Year 1 239,320 - 7,200 246,520
Year 2 2,196,784 48,112 81,100 2,325,996
Year 3 1,448,728 27,205 81,100 1,557,033
Year 4 1,582,125 30,050 81,100 1,693,276
Year 5 1,752,952 34,239 81,100 1,868,291
Year 6 1,472,518 27,682 81,100 1,581,301
Year 7 1,882,842 32,987 81,100 1,996,930
Year 8 1,972,819 36,772 81,100 2,090,691
Year 9 1,502,063 26,649 81,100 1,609,812
Year 10 1,470,960 26,879 81,100 1,578,940
Year 11 1,429,373 25,886 81,100 1,536,359
Year 12 1,552,452 29,288 81,100 1,662,840
Year 13 1,683,698 33,858 81,100 1,798,657
Year 14 1,784,034 34,667 81,100 1,899,802
Year 15 1,749,438 33,693 81,100 1,864,232
Year 16 2,109,419 39,546 81,100 2,230,065
Year 17 1,732,259 28,688 81,100 1,842,047
Year 18 2,107,826 39,325 81,100 2,228,252
Year 19 1,004,688 13,910 81,100 1,099,699
The relative influence of the emissions sources on GHG emissions over the Project life is summarised in Figure
16. A similar breakdown of GHG by emissions scopes and emission sources is observed for individual years of
operations. Over half of the GHG emissions associated with the Project are associated with diesel combustion for
heavy machinery, mining equipment, haulage and other onsite vehicles as well as supplementary electricity
generation. Fugitive methane and electricity have also been identified as significant sources of GHG emissions.

Katestone Environmental Pty Ltd D16063-3 Magnetic South Pty Ltd – Gemini Project: Air Quality and Greenhouse Gas
Assessment – Final
2 October 2019
Page 41
Figure 16 Summary of GHG emissions by scope
For comparative purposes the latest GHG inventory estimates for Australia and Queensland (excluding emissions
from Land Use, Land Use Change and Forestry [LULUCF]) are 538 Mt CO2-e and 162 Mt CO2-e, respectively
(Commonwealth of Australia, 2019a and Commonwealth of Australia, 2019b). With maximum annual GHG
emissions of 205 kt CO2-e in Year 16, the Project could contribute up to 0.04% of national emissions and 0.13%
of state emissions.

Katestone Environmental Pty Ltd D16063-3 Magnetic South Pty Ltd – Gemini Project: Air Quality and Greenhouse Gas
Assessment – Final
2 October 2019
Page 42
4.4.2 Regulatory obligations – NGER and the safeguard mechanism
As detailed in Table 16, the annual GHG emissions of the Project range from:
• Scope 1: 17 – 187 kt CO2-e/y
• Scope 2: 2 – 18 kt CO2-e/y
• Total: 18 – 205 kt CO2-e/y
Based on the NGER Reporting thresholds detailed in Table 13, Magnetic South Pty Ltd will have ongoing reporting
obligations associated with the Project including annual assessment of GHG emissions as set out by the NGER
Act and the National Greenhouse and Energy Reporting (Measurement) Determination.
In all years apart from Year 1 Scope 1 emissions exceed 100 kt CO2-e/y. Under the current Safeguard Mechanism
facilities with Scope 1 emissions of more than 100 kt CO2-e/y are required to keep their emissions within baseline
levels. This Safeguard Mechanism would apply to the Project, however the exact implications of this would need
to be reviewed on an annual basis in communication with the regulator.
4.4.3 GHG mitigation and management
A range of options for Magnetic South Pty Ltd to manage Project related GHG emissions include:
General
• Continuous improvement approach through ongoing monitoring and reporting GHG emissions and
identifying opportunities to reduce GHG emissions
Diesel
• Reduce mine equipment diesel consumption through equipment selection, load optimisation, route
optimisation and production scheduling as well as reduced idle time
• Maintain equipment based on manufacturer/supplier guidelines and recommendations
Electricity
• On site power factor correction optimised to minimise the usage of grid electricity
• Use of solar-powered lighting to reduce electricity demand
• Adjust peak demand through production scheduling to allow for optimal and well utilised diesel power
generation capacity.
Katestone Environmental Pty Ltd D16063-3 Magnetic South Pty Ltd – Gemini Project: Air Quality and Greenhouse Gas
Assessment – Final
2 October 2019
Page 43
5. CONCLUSIONS
Katestone Environmental Pty Ltd (Katestone) was commissioned by Magnetic South Pty Ltd on behalf of Magnetic
South Pty Ltd to conduct an air quality and greenhouse gas assessment of the proposed Gemini Project (the
Project).
The Project involves the development of an open cut coal mine located approximately 3 km west of the township
of Dingo and 35 kilometres east of Blackwater in Central Queensland.
This air quality assessment has investigated the potential for the Project to affect air quality in the region. Three
operational scenarios have been considered that represent the worst-case potential for dust emissions over the
life of the Project, given the proposed mining schedule and proximity of sensitive receptors. The assessment has
used site-specific meteorological data and industry standard dispersion modelling techniques to predict ground-
level concentrations of particulate matter (TSP, PM10 and PM2.5) and dust deposition rates due to the Project.
The air quality assessment has considered the potential impacts of the Project in isolation and with the inclusion of
representative background levels of dust. Predicted ground-level concentrations of dust have been presented
across a 20 x 20 kilometre domain and at identified sensitive receptors. Predictions have been compared with the
relevant air quality objectives and guidelines.
The findings of the cumulative impact assessment are as follows:
• Predicted annual average concentrations of TSP comply with the relevant air quality objective at all
sensitive receptors using standard mitigation measures.
• Predicted maximum 24-hour and annual average concentrations of PM10 comply with the relevant air
quality objective at all sensitive receptors using standard mitigation measures and additional mitigation
when necessary.
• Predicted 24-hour and annual average concentrations of PM2.5 comply with the relevant air quality
objectives at all sensitive receptors using standard mitigation measures.
• Predicted monthly dust deposition rates comply with the relevant air quality guideline at all sensitive
receptors using standard mitigation measures.
The greenhouse gas assessment of the Project found the following:
• Maximum annual greenhouse gas emissions associated with Scope 1 and 2 from the Project are
estimated to be 205 kt CO2-e (Year 16)
• Greenhouse gas emissions from the Project are predominantly due to diesel use (67.9%), electricity
generation (indirect emissions) (10.4%) and fugitive methane releases (20.4%)
• Compared to national and state greenhouse gas inventory levels, the maximum annual GHG emissions
from the Project would account for approximately 0.04% and 0.13%, respectively
It is recommended that Magnetic South manages potential particulate matter impacts of the Project at sensitive
receptors by:
• Developing and implementing an ambient air quality monitoring program
• Developing and implementing an Air Quality Management Plan
• As appropriate, consult with surrounding landholders in relation to appropriate mitigation measures or
property purchases.
It is also recommended the Magnetic South monitor, manage and assess Project related greenhouse gas
emissions.
Katestone Environmental Pty Ltd D16063-3 Magnetic South Pty Ltd – Gemini Project: Air Quality and Greenhouse Gas
Assessment – Final
2 October 2019
Page 44
6. REFERENCES
Ambient air quality monitoring dataset from Moranbah Station 2011-2017, 2018, available for downland at
Queensland Data (https://data.qld.gov.au/) (accessed November 2018).
Commonwealth of Australia, 2007, National Greenhouse and Energy Reporting Act
Commonwealth of Australia, 2008 National Greenhouse and Energy Reporting (Measurement) Determination
Commonwealth of Australia, 2019a. Quarterly Update of Australia’s National Greenhouse Gas Inventory: June
2017. Available online: https://www.environment.gov.au/climate-change/climate-science-data/greenhouse-gas-
measurement/publications/quarterly-update-australias-nggi-mar-2019
Commonwealth of Australia, 2019b. State and Territory Greenhouse Gas Inventories 2017. Available
online: http://www.environment.gov.au/system/files/resources/917a98ab-85cd-45e4-ae7a-
bcd1b914cfb2/files/state-territory-inventories-2017.pdf
Department of Environment and Energy (DEE), 2019. National Greenhouse Accounts (NGA) Factors, Australia
National Greenhouse Accounts, Australian Government
Department of Environment and Heritage Protection, 2017. Application requirements for activities with impacts to
air.
EPA Victoria, 200,7 Protocol for Environmental Management, State Environment Protection Policy (Ambient Air
Quality) Mining and Extractive Industries (PEM), Publication 1191.
National Pollutant Inventory (NPI), 2012, Emission Estimation Technique Manual for Mining version 3.1. National
Environment Protection Council.
Peer Review Committee (PRC), 2002, National Environment Protection (Ambient Air Quality) Measure Technical
Paper No. 8, Annual Reports, National Environment Protection Council.
Queensland Government 1994. Environmental Protection Act.
Queensland Government 2019. Environmental Protection (Air) Policy 2019.
United States Environmental Protection Agency (USEPA), 1998, Western surface coal mining, AP42 Chapter 11.9,
USEPA Office of Air Quality Planning and Standards.
United States Environmental Protection Agency (USEPA), 2006, Aggregate handling and storage piles, AP42
Chapter 13.2.4, USEPA Office of Air Quality Planning and Standards.
World Resources Institute/World Business Council for Sustainable Development, 2004, The Greenhouse Gas
Protocol – A Corporate Accounting and Reporting Standard Revised Edition March 2004. Available
online: http://www.ghgprotocol.org/corporate-standard.
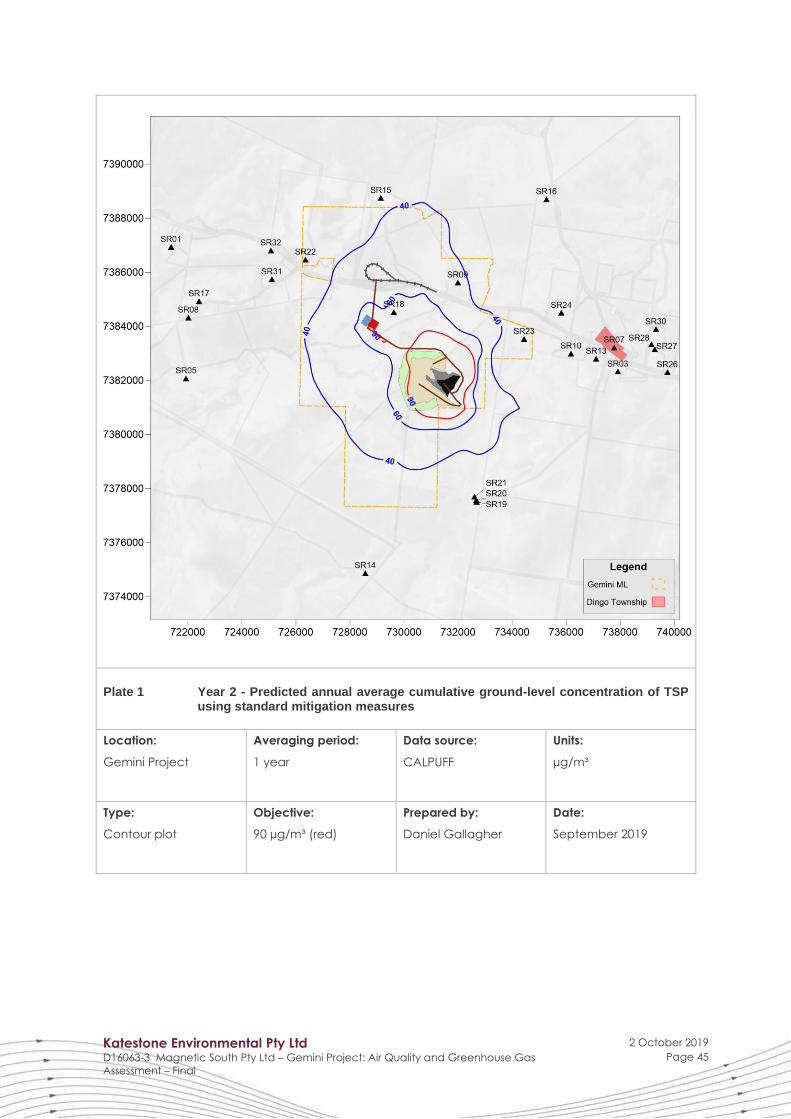
Katestone Environmental Pty Ltd D16063-3 Magnetic South Pty Ltd – Gemini Project: Air Quality and Greenhouse Gas
Assessment – Final
2 October 2019
Page 45
Plate 1 Year 2 - Predicted annual average cumulative ground-level concentration of TSP using standard mitigation measures
Location:
Gemini Project
Averaging period:
1 year
Data source:
CALPUFF
Units:
µg/m³
Type:
Contour plot
Objective:
90 µg/m³ (red)
Prepared by:
Daniel Gallagher
Date:
September 2019
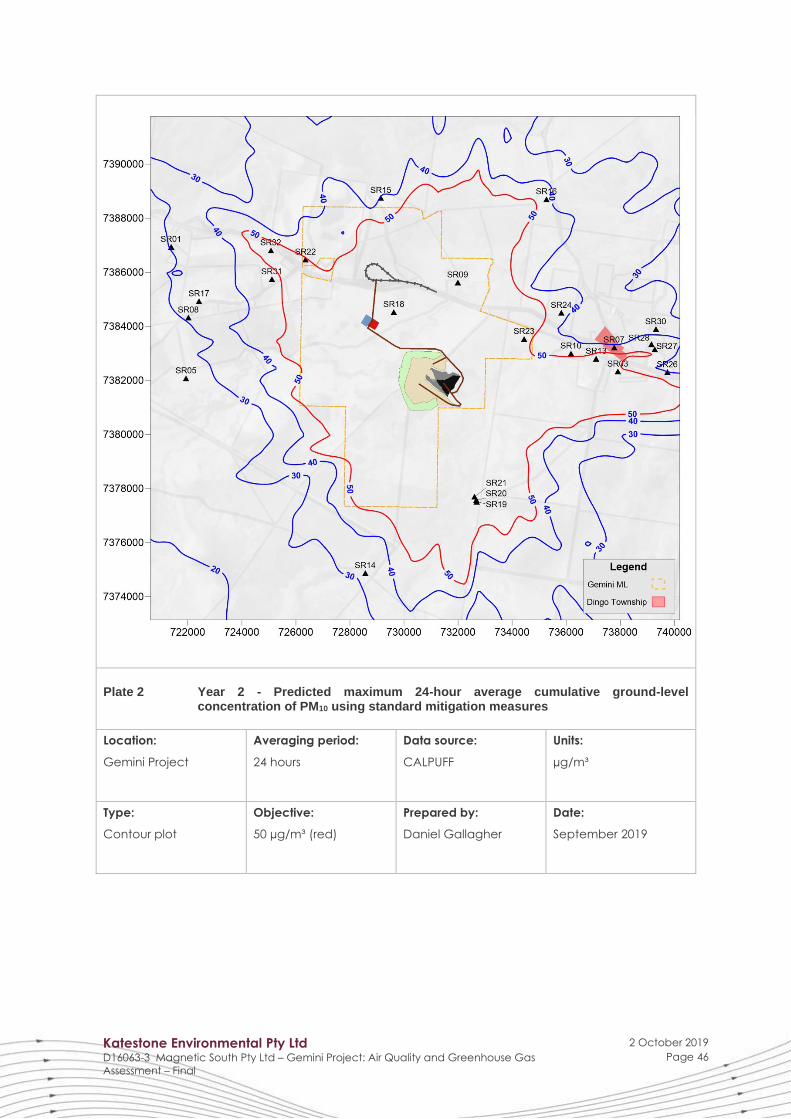
Katestone Environmental Pty Ltd D16063-3 Magnetic South Pty Ltd – Gemini Project: Air Quality and Greenhouse Gas
Assessment – Final
2 October 2019
Page 46
Plate 2 Year 2 - Predicted maximum 24-hour average cumulative ground-level concentration of PM10 using standard mitigation measures
Location:
Gemini Project
Averaging period:
24 hours
Data source:
CALPUFF
Units:
µg/m³
Type:
Contour plot
Objective:
50 µg/m³ (red)
Prepared by:
Daniel Gallagher
Date:
September 2019

Katestone Environmental Pty Ltd D16063-3 Magnetic South Pty Ltd – Gemini Project: Air Quality and Greenhouse Gas
Assessment – Final
2 October 2019
Page 47
Plate 3 Year 2 - Predicted annual average cumulative ground-level concentration of PM10 using standard mitigation measures
Location:
Gemini Project
Averaging period:
24 hours
Data source:
CALPUFF
Units:
µg/m³
Type:
Contour plot
Objective:
25 µg/m³ (red)
Prepared by:
Daniel Gallagher
Date:
September 2019

Katestone Environmental Pty Ltd D16063-3 Magnetic South Pty Ltd – Gemini Project: Air Quality and Greenhouse Gas
Assessment – Final
2 October 2019
Page 48
Plate 4 Year 2 - Predicted maximum 24-hour average cumulative ground-level concentration of PM2.5 using standard mitigation measures
Location:
Gemini Project
Averaging period:
24 hours
Data source:
CALPUFF
Units:
µg/m³
Type:
Contour plot
Objective:
25 µg/m³ (red)
Prepared by:
Daniel Gallagher
Date:
September 2019

Katestone Environmental Pty Ltd D16063-3 Magnetic South Pty Ltd – Gemini Project: Air Quality and Greenhouse Gas
Assessment – Final
2 October 2019
Page 49
Plate 5 Year 2 - Predicted annual average cumulative ground-level concentration of PM2.5 using standard mitigation measures
Location:
Gemini Project
Averaging period:
1 year
Data source:
CALPUFF
Units:
µg/m³
Type:
Contour plot
Objective:
8 µg/m³ (red)
Prepared by:
Daniel Gallagher
Date:
September 2019

Katestone Environmental Pty Ltd D16063-3 Magnetic South Pty Ltd – Gemini Project: Air Quality and Greenhouse Gas
Assessment – Final
2 October 2019
Page 50
Plate 6 Year 2 - Predicted maximum monthly cumulative dust deposition rate using standard mitigation measures
Location:
Gemini Project
Averaging period:
1 month
Data source:
CALPUFF
Units:
µg/m³
Type:
Contour plot
Guideline:
120 mg/m2/day (red)
Prepared by:
Daniel Gallagher
Date:
September 2019

Katestone Environmental Pty Ltd D16063-3 Magnetic South Pty Ltd – Gemini Project: Air Quality and Greenhouse Gas
Assessment – Final
2 October 2019
Page 51
Plate 7 Year 2 - Predicted maximum 24-hour average cumulative ground-level concentration of PM10 using standard mitigation measures and additional mitigation when necessary
Location:
Gemini Project
Averaging period:
24 hours
Data source:
CALPUFF
Units:
µg/m³
Type:
Contour plot
Objective:
50 µg/m³ (red)
Prepared by:
Daniel Gallagher
Date:
September 2019

Katestone Environmental Pty Ltd D16063-3 Magnetic South Pty Ltd – Gemini Project: Air Quality and Greenhouse Gas
Assessment – Final
2 October 2019
Page 52
Plate 8 Year 2 - Predicted annual average cumulative ground-level concentration of PM10 using standard mitigation measures and additional mitigation when necessary
Location:
Gemini Project
Averaging period:
1 year
Data source:
CALPUFF
Units:
µg/m³
Type:
Contour plot
Objective:
25 µg/m³ (red)
Prepared by:
Daniel Gallagher
Date:
September 2019
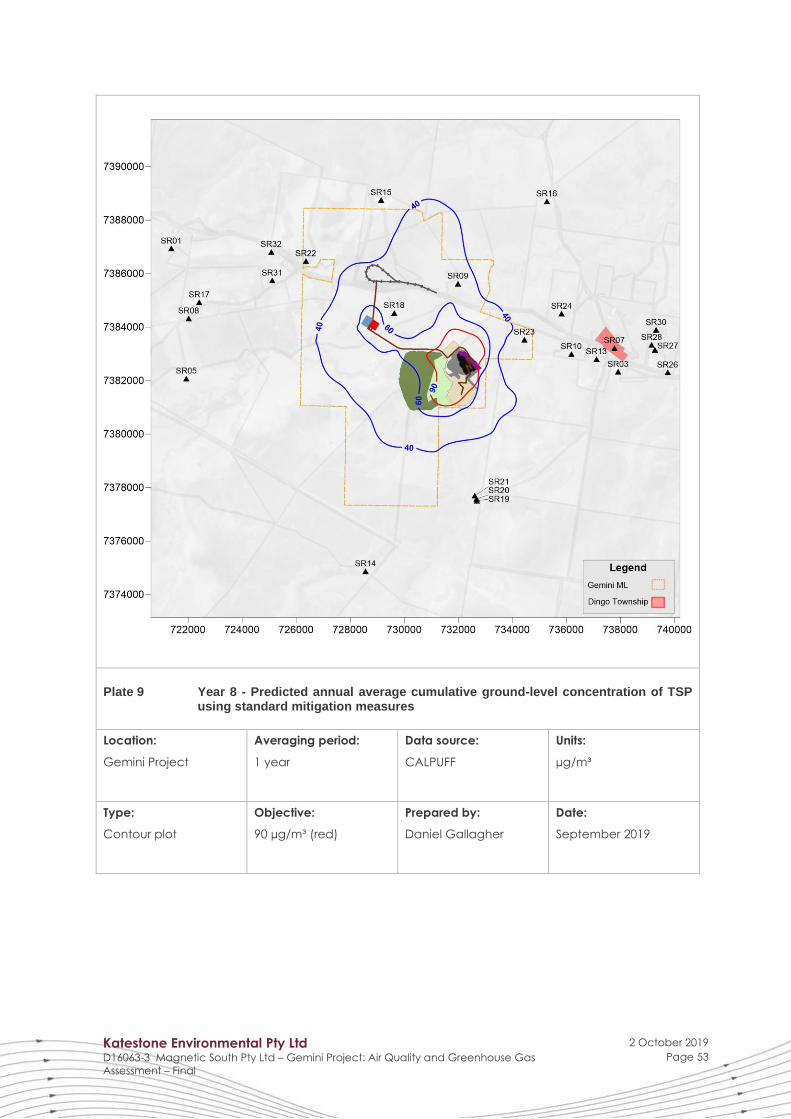
Katestone Environmental Pty Ltd D16063-3 Magnetic South Pty Ltd – Gemini Project: Air Quality and Greenhouse Gas
Assessment – Final
2 October 2019
Page 53
Plate 9 Year 8 - Predicted annual average cumulative ground-level concentration of TSP using standard mitigation measures
Location:
Gemini Project
Averaging period:
1 year
Data source:
CALPUFF
Units:
µg/m³
Type:
Contour plot
Objective:
90 µg/m³ (red)
Prepared by:
Daniel Gallagher
Date:
September 2019

Katestone Environmental Pty Ltd D16063-3 Magnetic South Pty Ltd – Gemini Project: Air Quality and Greenhouse Gas
Assessment – Final
2 October 2019
Page 54
Plate 10 Year 8 - Predicted maximum 24-hour average cumulative ground-level concentration of PM10 using standard mitigation measures
Location:
Gemini Project
Averaging period:
24 hours
Data source:
CALPUFF
Units:
µg/m³
Type:
Contour plot
Objective:
50 µg/m³ (red)
Prepared by:
Daniel Gallagher
Date:
September 2019
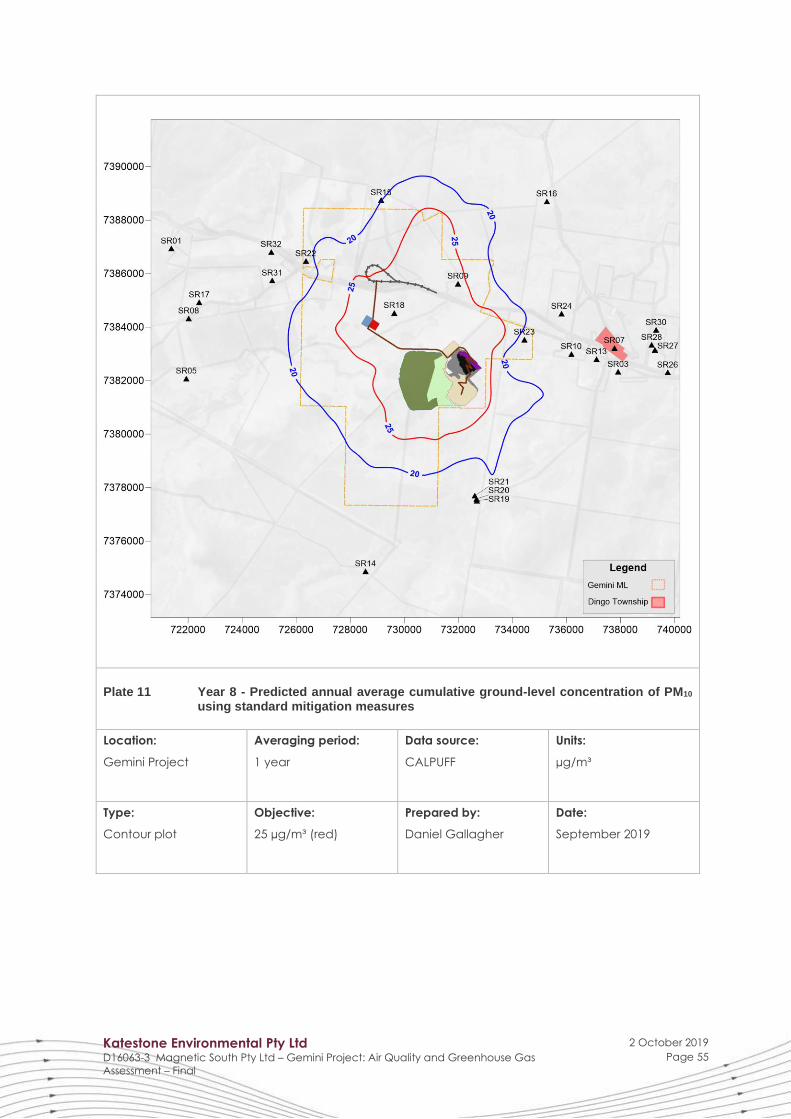
Katestone Environmental Pty Ltd D16063-3 Magnetic South Pty Ltd – Gemini Project: Air Quality and Greenhouse Gas
Assessment – Final
2 October 2019
Page 55
Plate 11 Year 8 - Predicted annual average cumulative ground-level concentration of PM10 using standard mitigation measures
Location:
Gemini Project
Averaging period:
1 year
Data source:
CALPUFF
Units:
µg/m³
Type:
Contour plot
Objective:
25 µg/m³ (red)
Prepared by:
Daniel Gallagher
Date:
September 2019
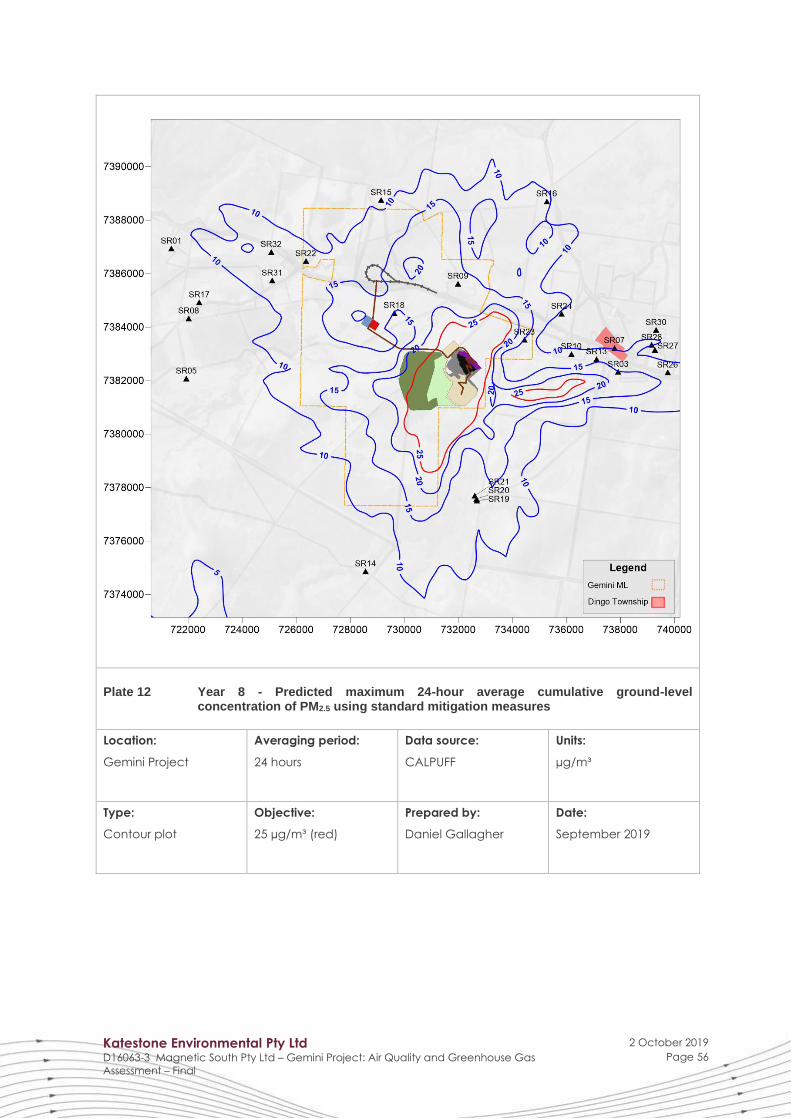
Katestone Environmental Pty Ltd D16063-3 Magnetic South Pty Ltd – Gemini Project: Air Quality and Greenhouse Gas
Assessment – Final
2 October 2019
Page 56
Plate 12 Year 8 - Predicted maximum 24-hour average cumulative ground-level concentration of PM2.5 using standard mitigation measures
Location:
Gemini Project
Averaging period:
24 hours
Data source:
CALPUFF
Units:
µg/m³
Type:
Contour plot
Objective:
25 µg/m³ (red)
Prepared by:
Daniel Gallagher
Date:
September 2019

Katestone Environmental Pty Ltd D16063-3 Magnetic South Pty Ltd – Gemini Project: Air Quality and Greenhouse Gas
Assessment – Final
2 October 2019
Page 57
Plate 13 Year 8 - Predicted annual average cumulative ground-level concentration of PM2.5 using standard mitigation measures
Location:
Gemini Project
Averaging period:
1 year
Data source:
CALPUFF
Units:
µg/m³
Type:
Contour plot
Objective:
8 µg/m³ (red)
Prepared by:
Daniel Gallagher
Date:
September 2019

Katestone Environmental Pty Ltd D16063-3 Magnetic South Pty Ltd – Gemini Project: Air Quality and Greenhouse Gas
Assessment – Final
2 October 2019
Page 58
Plate 14 Year 8 - Predicted maximum monthly cumulative dust deposition rate using standard mitigation measures
Location:
Gemini Project
Averaging period:
1 month
Data source:
CALPUFF
Units:
µg/m³
Type:
Contour plot
Guideline:
120 mg/m2/day (red)
Prepared by:
Daniel Gallagher
Date:
September 2019

Katestone Environmental Pty Ltd D16063-3 Magnetic South Pty Ltd – Gemini Project: Air Quality and Greenhouse Gas
Assessment – Final
2 October 2019
Page 59
Plate 15 Year 8 - Predicted maximum 24-hour average cumulative ground-level concentration of PM10 using standard mitigation measures and additional mitigation when necessary
Location:
Gemini Project
Averaging period:
24 hours
Data source:
CALPUFF
Units:
µg/m³
Type:
Contour plot
Objective:
50 µg/m³ (red)
Prepared by:
Daniel Gallagher
Date:
September 2019

Katestone Environmental Pty Ltd D16063-3 Magnetic South Pty Ltd – Gemini Project: Air Quality and Greenhouse Gas
Assessment – Final
2 October 2019
Page 60
Plate 16 Year 8 - Predicted annual average cumulative ground-level concentration of PM10 using standard mitigation measures and additional mitigation when necessary
Location:
Gemini Project
Averaging period:
1 year
Data source:
CALPUFF
Units:
µg/m³
Type:
Contour plot
Objective:
25 µg/m³ (red)
Prepared by:
Daniel Gallagher
Date:
September 2019

Katestone Environmental Pty Ltd D16063-3 Magnetic South Pty Ltd – Gemini Project: Air Quality and Greenhouse Gas
Assessment – Final
2 October 2019
Page 61
Plate 17 Year 15 - Predicted annual average cumulative ground-level concentration of TSP using standard mitigation measures
Location:
Gemini Project
Averaging period:
1 year
Data source:
CALPUFF
Units:
µg/m³
Type:
Contour plot
Objective:
90 µg/m³ (red)
Prepared by:
Daniel Gallagher
Date:
September 2019
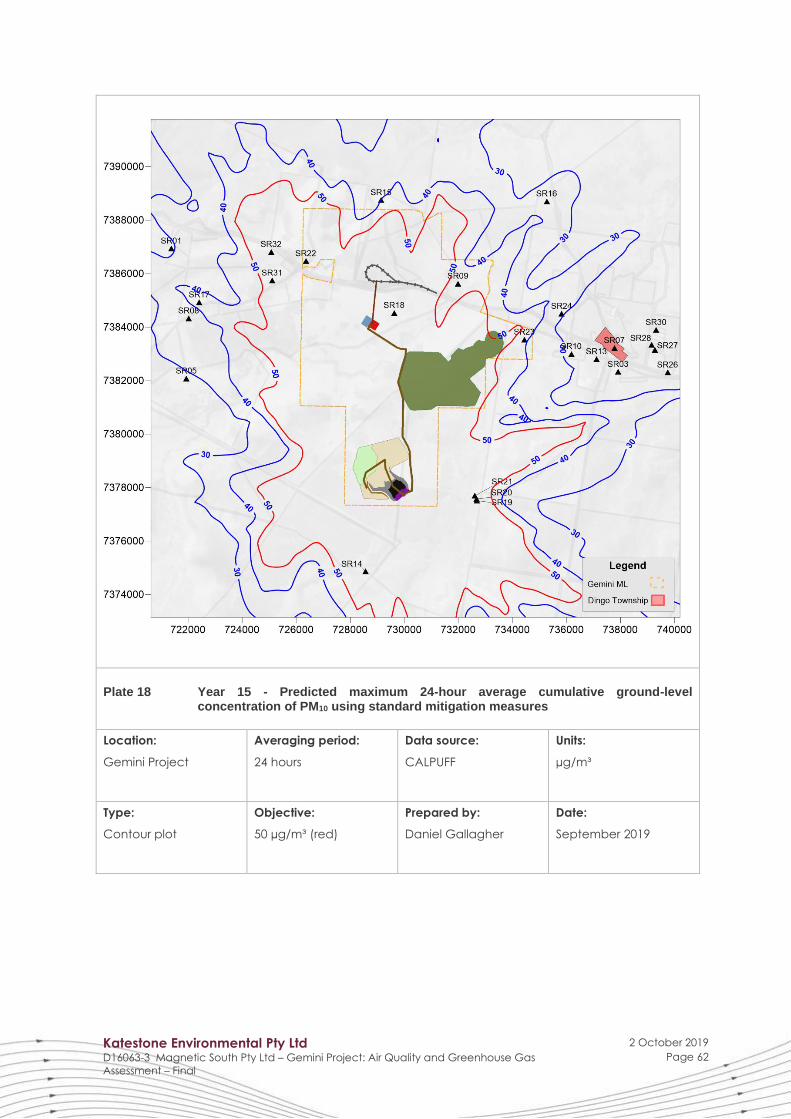
Katestone Environmental Pty Ltd D16063-3 Magnetic South Pty Ltd – Gemini Project: Air Quality and Greenhouse Gas
Assessment – Final
2 October 2019
Page 62
Plate 18 Year 15 - Predicted maximum 24-hour average cumulative ground-level concentration of PM10 using standard mitigation measures
Location:
Gemini Project
Averaging period:
24 hours
Data source:
CALPUFF
Units:
µg/m³
Type:
Contour plot
Objective:
50 µg/m³ (red)
Prepared by:
Daniel Gallagher
Date:
September 2019
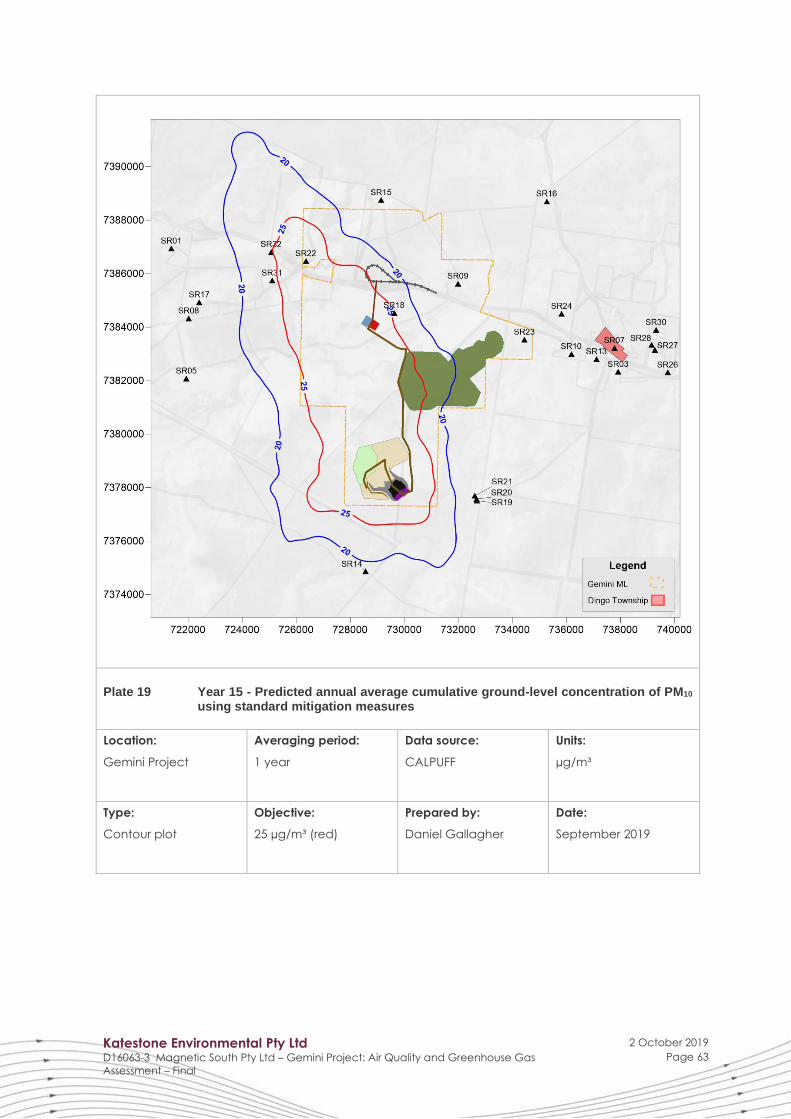
Katestone Environmental Pty Ltd D16063-3 Magnetic South Pty Ltd – Gemini Project: Air Quality and Greenhouse Gas
Assessment – Final
2 October 2019
Page 63
Plate 19 Year 15 - Predicted annual average cumulative ground-level concentration of PM10 using standard mitigation measures
Location:
Gemini Project
Averaging period:
1 year
Data source:
CALPUFF
Units:
µg/m³
Type:
Contour plot
Objective:
25 µg/m³ (red)
Prepared by:
Daniel Gallagher
Date:
September 2019

Katestone Environmental Pty Ltd D16063-3 Magnetic South Pty Ltd – Gemini Project: Air Quality and Greenhouse Gas
Assessment – Final
2 October 2019
Page 64
Plate 20 Year 15 - Predicted maximum 24-hour average cumulative ground-level concentration of PM2.5 using standard mitigation measures
Location:
Gemini Project
Averaging period:
24 hours
Data source:
CALPUFF
Units:
µg/m³
Type:
Contour plot
Objective:
25 µg/m³ (red)
Prepared by:
Daniel Gallagher
Date:
September 2019

Katestone Environmental Pty Ltd D16063-3 Magnetic South Pty Ltd – Gemini Project: Air Quality and Greenhouse Gas
Assessment – Final
2 October 2019
Page 65
Plate 21 Year 15 - Predicted annual average cumulative ground-level concentration of PM2.5 using standard mitigation measures
Location:
Gemini Project
Averaging period:
1 year
Data source:
CALPUFF
Units:
µg/m³
Type:
Contour plot
Objective:
8 µg/m³ (red)
Prepared by:
Daniel Gallagher
Date:
September 2019

Katestone Environmental Pty Ltd D16063-3 Magnetic South Pty Ltd – Gemini Project: Air Quality and Greenhouse Gas
Assessment – Final
2 October 2019
Page 66
Plate 22 Year 15 - Predicted maximum monthly cumulative dust deposition rate using standard mitigation measures
Location:
Gemini Project
Averaging period:
1 month
Data source:
CALPUFF
Units:
µg/m³
Type:
Contour plot
Guideline:
120 mg/m2/day (red)
Prepared by:
Daniel Gallagher
Date:
September 2019

Katestone Environmental Pty Ltd D16063-3 Magnetic South Pty Ltd – Gemini Project: Air Quality and Greenhouse Gas
Assessment – Final
2 October 2019
Page 67
Plate 23 Year 15 - Predicted maximum 24-hour average cumulative ground-level concentration of PM10 using standard mitigation measures and additional mitigation when necessary
Location:
Gemini Project
Averaging period:
24 hours
Data source:
CALPUFF
Units:
µg/m³
Type:
Contour plot
Objective:
50 µg/m³ (red)
Prepared by:
Daniel Gallagher
Date:
September 2019
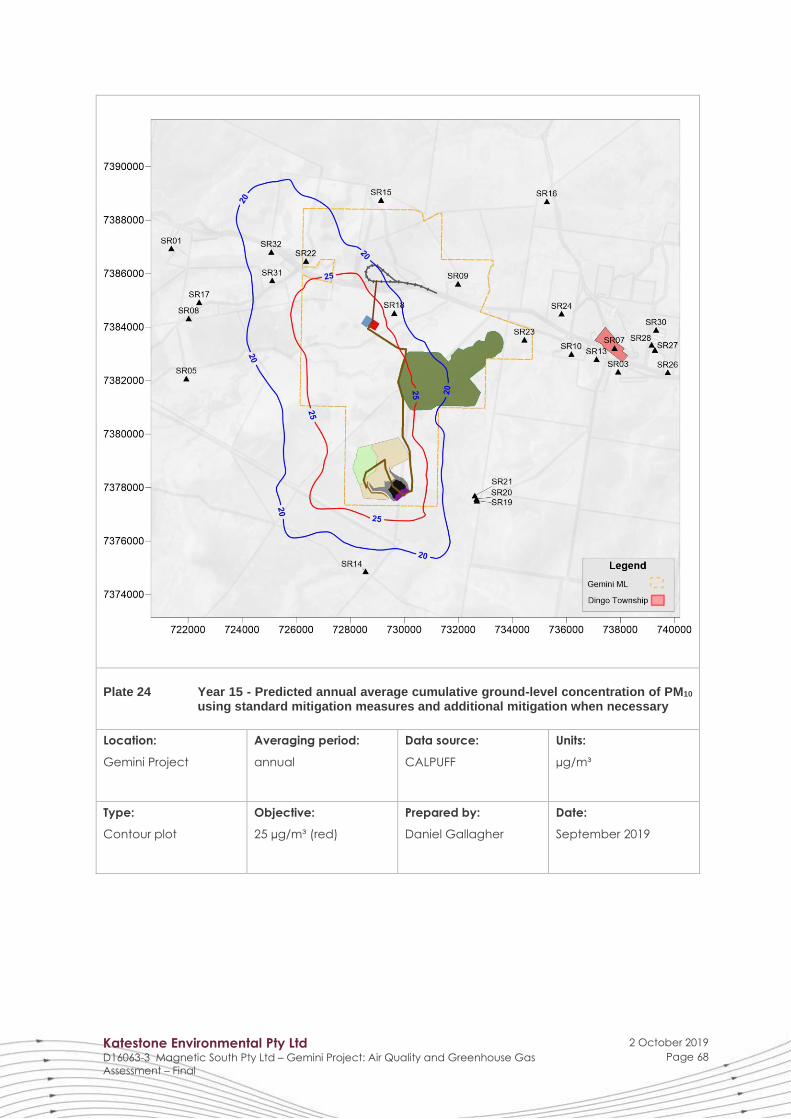
Katestone Environmental Pty Ltd D16063-3 Magnetic South Pty Ltd – Gemini Project: Air Quality and Greenhouse Gas
Assessment – Final
2 October 2019
Page 68
Plate 24 Year 15 - Predicted annual average cumulative ground-level concentration of PM10 using standard mitigation measures and additional mitigation when necessary
Location:
Gemini Project
Averaging period:
annual
Data source:
CALPUFF
Units:
µg/m³
Type:
Contour plot
Objective:
25 µg/m³ (red)
Prepared by:
Daniel Gallagher
Date:
September 2019

Katestone Environmental Pty Ltd D16063-3 Magnetic South Pty Ltd – Gemini Project: Air Quality and Greenhouse Gas
Assessment – Final
2 October 2019
Page 69
APPENDIX A MODELLING METHODOLOGY
A1 METEOROLOGY
A1.1 TAPM meteorological modelling
TAPM (The Air Pollution Model) was developed by the CSIRO and has been validated by the CSIRO, Katestone
and others for many locations in Australia, in south-east Asia and in North America (CSIRO, 2008). Katestone has
extensive experience with TAPM for sites throughout Australia and in parts of America, Bangladesh, New
Caledonia and Vietnam. The model performs well in simulating regional wind patterns and has proven to be a
useful tool for simulating meteorology in locations where monitoring data is unavailable.
TAPM is a prognostic meteorological model which predicts the flows important to regional and local scale
meteorology, such as sea breezes and terrain-induced flows from the larger-scale meteorology provided by the
synoptic analyses. TAPM solves the fundamental fluid dynamics equations to predict meteorology at a mesoscale
(20 km to 200 km) and at a local scale (down to a few hundred metres). TAPM includes parameterisations for
cloud/rain micro-physical processes, urban/vegetation canopy and soil, and radiative fluxes.
TAPM requires synoptic meteorological information for the region. This information is generated by a global model
similar to the large-scale models used to forecast the weather. The data were supplied on a grid resolution of
approximately 75km, and at elevations of 100m to 5km above the ground. TAPM uses this synoptic information,
along with specific details of the location such as surrounding terrain, land-use, soil moisture content and soil type
to simulate the meteorology of a region as well as at a specific location.
TAPM version 4.0.4 was configured with the following parameters:
• Modelling period from 1 January to 31 December 2016
• 50 x 50 grid point domain with nesting resolutions of 10 km, 3 km, and 10 km
• 25 vertical levels
• Grid centred on latitude -23° 39’, longitude 149° 15’
• Geoscience Australia 9 second DEM terrain data
• TAPM default land cover data and sea surface temperature
• Default options selected for advanced meteorological inputs.
A1.2 CALMET meteorological modelling
CALMET is an advanced non-steady-state diagnostic 3D meteorological model with micro-meteorological modules
for overwater and overland boundary layers. It is the meteorological pre-processor for the CALPUFF modelling
system. CALMET can read hourly meteorological data as data assimilation from multiple sites within the modelling
domain; it can also be initialised with the gridded three-dimensional prognostic output from other meteorological
models such as TAPM. This can improve dispersion model output, particularly over complex terrain as the near
surface meteorological conditions are calculated for each grid point.
CALMET was used to simulate meteorological conditions in the region. The CALMET simulation was initialised
with the gridded TAPM 3D wind field data from the 1 km grid. CALMET treats the prognostic model output as the
initial guess field for the CALMET diagnostic model wind fields. The initial guess field is then adjusted for the
kinematic effects of terrain, slope flows, blocking effects and 3D divergence minimisation.

Katestone Environmental Pty Ltd D16063-3 Magnetic South Pty Ltd – Gemini Project: Air Quality and Greenhouse Gas
Assessment – Final
2 October 2019
Page 70
CALMET version 6.5.0 was configured with default options and parameters, with the following exceptions:
• Modelling period from 1 January to 31 December 2016
• 94 x 94 grid point domain with 0.5 km resolution, nested within the TAPM inner domain
• 12 vertical levels at heights of 20, 60, 100, 150, 200, 250, 350, 500, 800, 1600, 2600 and 4600 metres
• Prognostic wind fields generated by TAPM input as MM5/3D.DAT at surface and upper air for “initial
guess” field (no-observations mode)
• Gridded cloud cover from prognostic relative humidity at all levels
• No extrapolation of surface wind observations to upper layers
• Terrain radius of influence of 7 km
• Terrain radius of influence for temperature interpolation of 500 km.
A1.3 Analysis of dispersion meteorology
The following sections provide a description of the meteorological parameters that are important for dispersion of
air pollutants in the atmosphere, namely wind speed and direction, atmospheric stability and mixing layer height.
These parameters have been extracted from the TAPM/CALMET dataset at the Project site.
A1.3.1 Wind speed and wind direction
The annual, seasonal and diurnal distributions of winds predicted by TAPM/CALMET for 2016 are presented in
Figure A1, Figure A2, and Figure A3 respectively. The winds are generally light to moderate and occur almost
exclusively from the eastern quadrants with an average wind speed of 2.02 m/s (Figure A1). The distribution of
winds is predominantly from the south-east (Figure A4). Winds are weaker during even hours (6 pm to 6 am), and
stronger during daylight hours (6 am to 6 pm) (Figure A3).

Katestone Environmental Pty Ltd D16063-3 Magnetic South Pty Ltd – Gemini Project: Air Quality and Greenhouse Gas
Assessment – Final
2 October 2019
Page 71
Figure A1 Annual distribution of winds at the Project site predicted by TAPM/CALMET

Katestone Environmental Pty Ltd D16063-3 Magnetic South Pty Ltd – Gemini Project: Air Quality and Greenhouse Gas
Assessment – Final
2 October 2019
Page 72
Figure A2 Seasonal distribution of winds at the Project site predicted by TAPM/CALMET
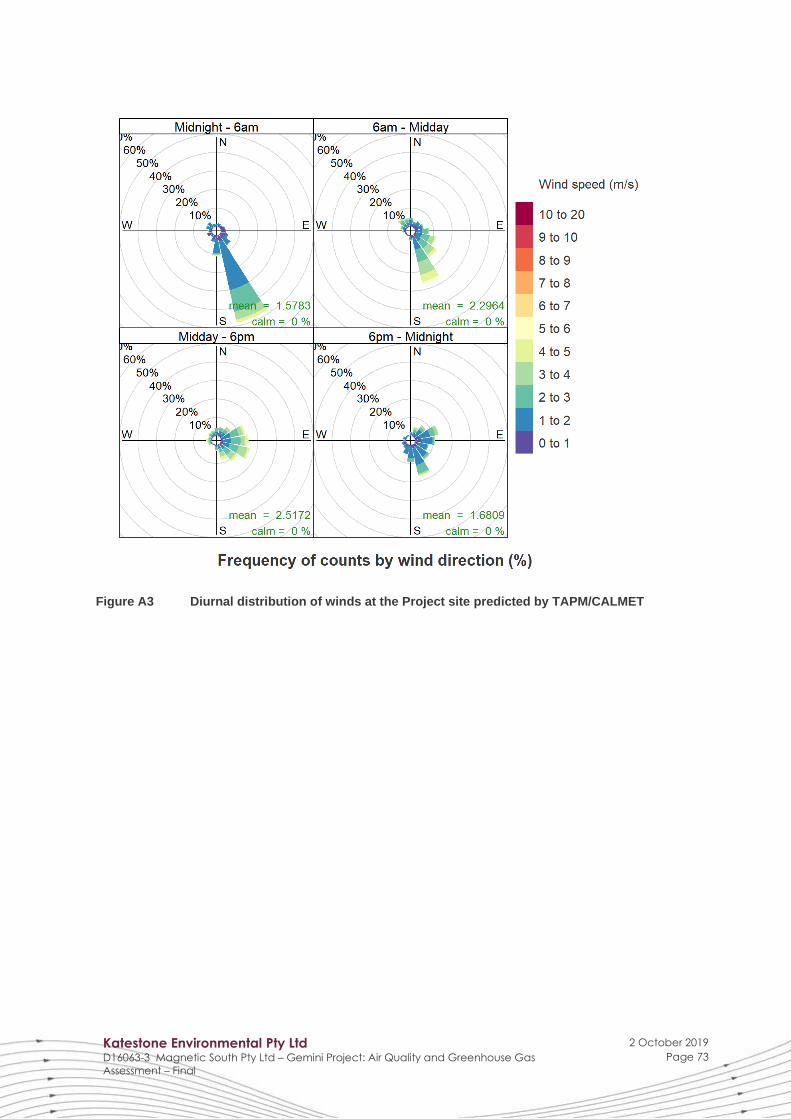
Katestone Environmental Pty Ltd D16063-3 Magnetic South Pty Ltd – Gemini Project: Air Quality and Greenhouse Gas
Assessment – Final
2 October 2019
Page 73
Figure A3 Diurnal distribution of winds at the Project site predicted by TAPM/CALMET
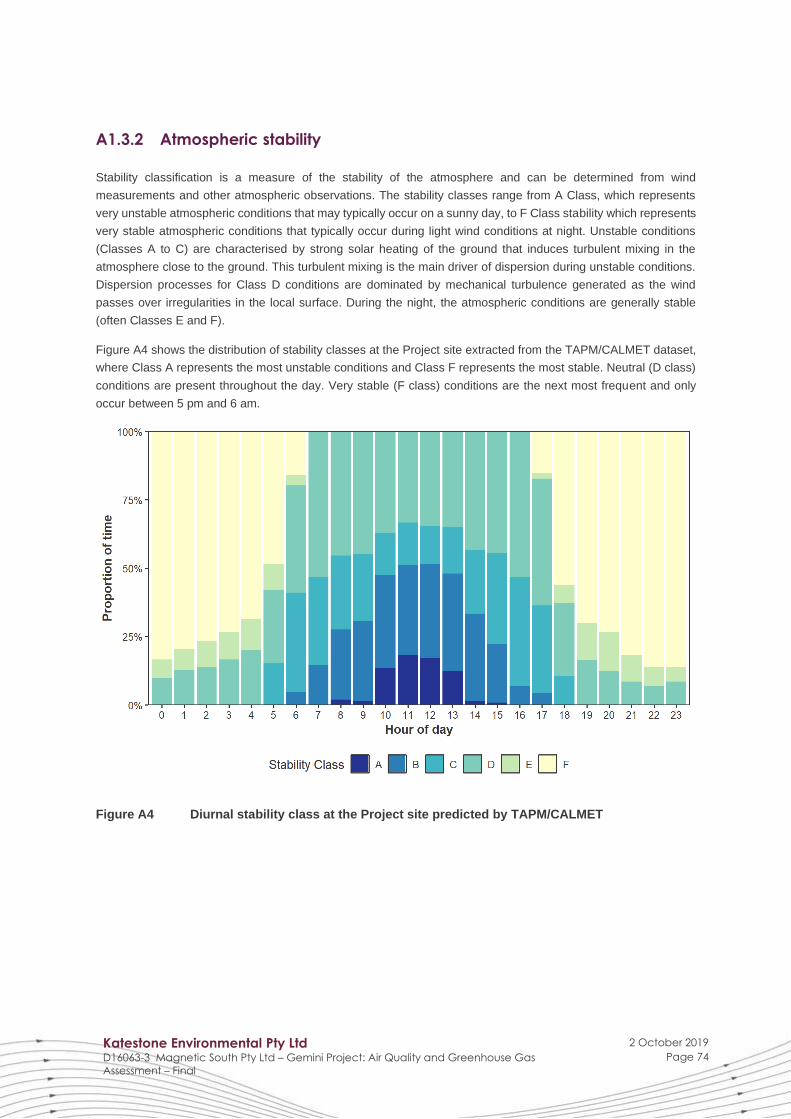
Katestone Environmental Pty Ltd D16063-3 Magnetic South Pty Ltd – Gemini Project: Air Quality and Greenhouse Gas
Assessment – Final
2 October 2019
Page 74
A1.3.2 Atmospheric stability
Stability classification is a measure of the stability of the atmosphere and can be determined from wind
measurements and other atmospheric observations. The stability classes range from A Class, which represents
very unstable atmospheric conditions that may typically occur on a sunny day, to F Class stability which represents
very stable atmospheric conditions that typically occur during light wind conditions at night. Unstable conditions
(Classes A to C) are characterised by strong solar heating of the ground that induces turbulent mixing in the
atmosphere close to the ground. This turbulent mixing is the main driver of dispersion during unstable conditions.
Dispersion processes for Class D conditions are dominated by mechanical turbulence generated as the wind
passes over irregularities in the local surface. During the night, the atmospheric conditions are generally stable
(often Classes E and F).
Figure A4 shows the distribution of stability classes at the Project site extracted from the TAPM/CALMET dataset,
where Class A represents the most unstable conditions and Class F represents the most stable. Neutral (D class)
conditions are present throughout the day. Very stable (F class) conditions are the next most frequent and only
occur between 5 pm and 6 am.
Figure A4 Diurnal stability class at the Project site predicted by TAPM/CALMET

Katestone Environmental Pty Ltd D16063-3 Magnetic South Pty Ltd – Gemini Project: Air Quality and Greenhouse Gas
Assessment – Final
2 October 2019
Page 75
A1.3.3 Mixing height
The mixing height defines the height of the mixed atmosphere above the ground (mixed layer), which varies
diurnally. Particulate matter, or other pollutants released at or near the ground, will become dispersed within the
mixed layer. During stable atmospheric conditions, the mixing height is often quite low and particulate dispersion
is limited to within this layer. During the day, solar radiation heats the ground and causes the air above it to warm,
resulting in convection and an increase to the mixing height. The growth of the mixing height is dependent on how
well the warmer air from the ground can mix with the cooler upper level air and, therefore, depends on
meteorological factors such as the intensity of solar radiation and wind speed. Strong winds cause the air to be
well mixed, resulting in a high mixing height.
Mixing height information extracted from the TAPM/CALMET dataset at the Project site is presented in Figure A5
as a diurnal frequency (box and whisker) plot. The data shows that, on average, the mixing height develops around
6 am and peaks at 3-4 pm before descending rapidly until 6 pm.
Figure A5 Diurnal mixing height at the Project site predicted by TAPM/CALMET
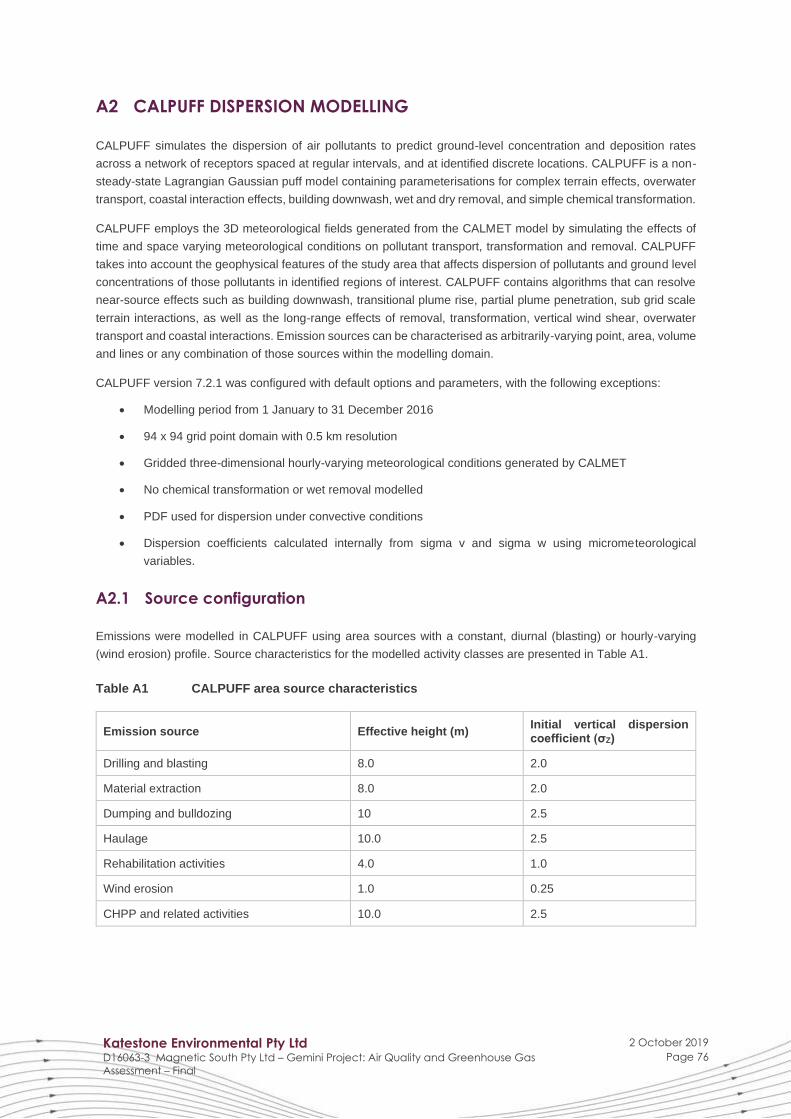
Katestone Environmental Pty Ltd D16063-3 Magnetic South Pty Ltd – Gemini Project: Air Quality and Greenhouse Gas
Assessment – Final
2 October 2019
Page 76
A2 CALPUFF DISPERSION MODELLING
CALPUFF simulates the dispersion of air pollutants to predict ground-level concentration and deposition rates
across a network of receptors spaced at regular intervals, and at identified discrete locations. CALPUFF is a non-
steady-state Lagrangian Gaussian puff model containing parameterisations for complex terrain effects, overwater
transport, coastal interaction effects, building downwash, wet and dry removal, and simple chemical transformation.
CALPUFF employs the 3D meteorological fields generated from the CALMET model by simulating the effects of
time and space varying meteorological conditions on pollutant transport, transformation and removal. CALPUFF
takes into account the geophysical features of the study area that affects dispersion of pollutants and ground level
concentrations of those pollutants in identified regions of interest. CALPUFF contains algorithms that can resolve
near-source effects such as building downwash, transitional plume rise, partial plume penetration, sub grid scale
terrain interactions, as well as the long-range effects of removal, transformation, vertical wind shear, overwater
transport and coastal interactions. Emission sources can be characterised as arbitrarily-varying point, area, volume
and lines or any combination of those sources within the modelling domain.
CALPUFF version 7.2.1 was configured with default options and parameters, with the following exceptions:
• Modelling period from 1 January to 31 December 2016
• 94 x 94 grid point domain with 0.5 km resolution
• Gridded three-dimensional hourly-varying meteorological conditions generated by CALMET
• No chemical transformation or wet removal modelled
• PDF used for dispersion under convective conditions
• Dispersion coefficients calculated internally from sigma v and sigma w using micrometeorological
variables.
A2.1 Source configuration
Emissions were modelled in CALPUFF using area sources with a constant, diurnal (blasting) or hourly-varying
(wind erosion) profile. Source characteristics for the modelled activity classes are presented in Table A1.
Table A1 CALPUFF area source characteristics
Emission source Effective height (m) Initial vertical dispersion coefficient (σZ)
Drilling and blasting 8.0 2.0
Material extraction 8.0 2.0
Dumping and bulldozing 10 2.5
Haulage 10.0 2.5
Rehabilitation activities 4.0 1.0
Wind erosion 1.0 0.25
CHPP and related activities 10.0 2.5

Katestone Environmental Pty Ltd D16063-3 Magnetic South Pty Ltd – Gemini Project: Air Quality and Greenhouse Gas Assessment – Final
2 October 2019
Page 77
APPENDIX B ACTIVITY DATA
Operational parameters and activity data for the Project, used as input for the emissions calculations, are provided in Table B1.
Table B1 Summary of activity data used in emissions calculations
Activity Values Year
2 Values Year
8 Values Year
15 Units Information source
Operations
Days per year 363 363 363 Days/year
MAGNETIC SOUTH Standard hours of operation 24 24 24 hours/day
Blasting hours 8 8 8 hours/day
Hours on rehabilitation 8 8 8 hours/day
Throughput
Total ROM coal 900,000 1,830,000 1,800,000 tonnes
MAGNETIC SOUTH Total product coal 673,000 1,383,000 1,383,000 tonnes
Overburden - truck and shovel 29,093,000 29,869,000 28,638,000 tonnes
Drilling and blasting
Blasting frequency 53 40 37 blasts/year
MAGNETIC SOUTH Holes drilled per blast (average) 313 313 313 holes/blast
Blast area (average) 25,000 25,000 25,000 m2
Mine areas
Active pit area 308,872 272,321 226,162 ha Calculated
ROM stockpile 4 4 4 ha MAGNETIC SOUTH
Product stockpile 1.5 1.5 1.5 ha MAGNETIC SOUTH
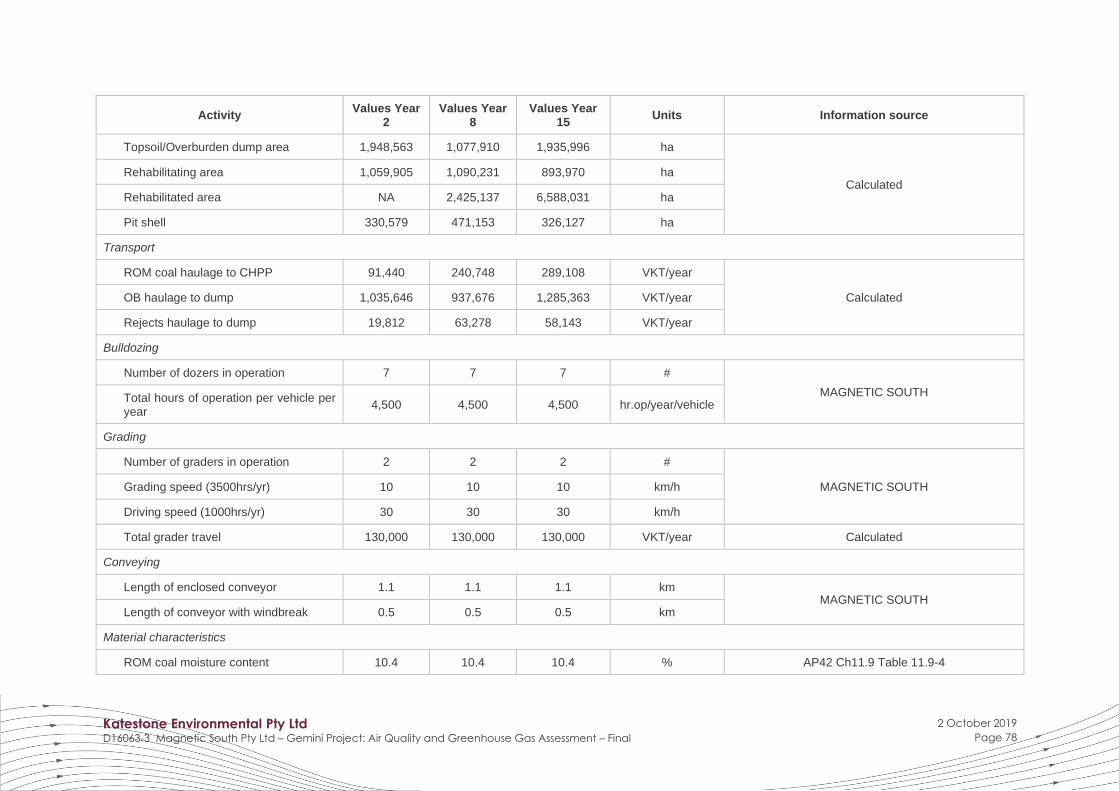
Katestone Environmental Pty Ltd D16063-3 Magnetic South Pty Ltd – Gemini Project: Air Quality and Greenhouse Gas Assessment – Final
2 October 2019
Page 78
Activity Values Year
2 Values Year
8 Values Year
15 Units Information source
Topsoil/Overburden dump area 1,948,563 1,077,910 1,935,996 ha
Calculated Rehabilitating area 1,059,905 1,090,231 893,970 ha
Rehabilitated area NA 2,425,137 6,588,031 ha
Pit shell 330,579 471,153 326,127 ha
Transport
ROM coal haulage to CHPP 91,440 240,748 289,108 VKT/year
Calculated OB haulage to dump 1,035,646 937,676 1,285,363 VKT/year
Rejects haulage to dump 19,812 63,278 58,143 VKT/year
Bulldozing
Number of dozers in operation 7 7 7 #
MAGNETIC SOUTH Total hours of operation per vehicle per year
4,500 4,500 4,500 hr.op/year/vehicle
Grading
Number of graders in operation 2 2 2 #
MAGNETIC SOUTH Grading speed (3500hrs/yr) 10 10 10 km/h
Driving speed (1000hrs/yr) 30 30 30 km/h
Total grader travel 130,000 130,000 130,000 VKT/year Calculated
Conveying
Length of enclosed conveyor 1.1 1.1 1.1 km MAGNETIC SOUTH
Length of conveyor with windbreak 0.5 0.5 0.5 km
Material characteristics
ROM coal moisture content 10.4 10.4 10.4 % AP42 Ch11.9 Table 11.9-4
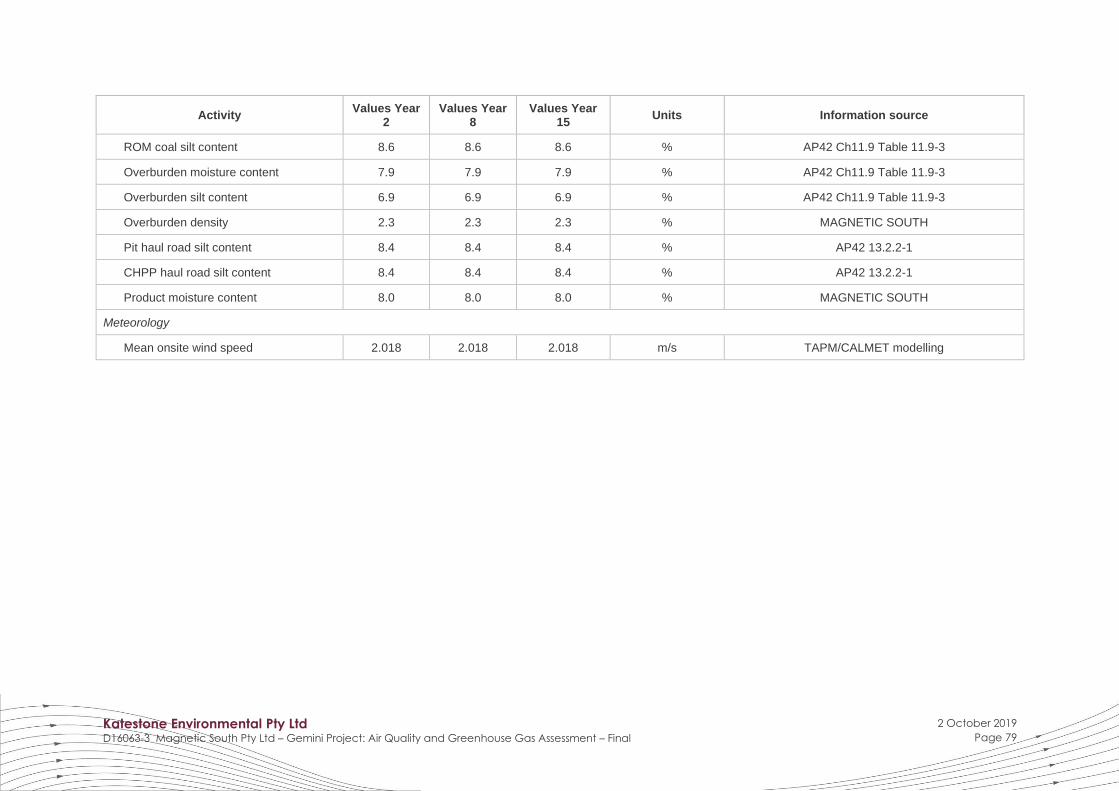
Katestone Environmental Pty Ltd D16063-3 Magnetic South Pty Ltd – Gemini Project: Air Quality and Greenhouse Gas Assessment – Final
2 October 2019
Page 79
Activity Values Year
2 Values Year
8 Values Year
15 Units Information source
ROM coal silt content 8.6 8.6 8.6 % AP42 Ch11.9 Table 11.9-3
Overburden moisture content 7.9 7.9 7.9 % AP42 Ch11.9 Table 11.9-3
Overburden silt content 6.9 6.9 6.9 % AP42 Ch11.9 Table 11.9-3
Overburden density 2.3 2.3 2.3 % MAGNETIC SOUTH
Pit haul road silt content 8.4 8.4 8.4 % AP42 13.2.2-1
CHPP haul road silt content 8.4 8.4 8.4 % AP42 13.2.2-1
Product moisture content 8.0 8.0 8.0 % MAGNETIC SOUTH
Meteorology
Mean onsite wind speed 2.018 2.018 2.018 m/s TAPM/CALMET modelling