gender differences in absenteeism in nineteenth-century us
TRANSCRIPT
Gender Differences in Absenteeism in Nineteenth-Century US Manufacturing
Joyce Burnette Wabash College
While discussions of the gender pay gap have often discussed how women’s shorter
tenure discouraged human capital formation or discouraged firms from offering them delayed
compensation contracts (Polachek 1981; Goldin 1986), few studies have examined gender
differences in absences from work. Employers care about absenteeism, and policymakers have at
times worried about women’s high absence rates (Karlsson 2016), but economists have paid it
little attention. There has been a surge in interest in absenteeism in development economics,
where experiments have helped to determine what incentives work best for encouraging work
attendance (Chaudhury et. al 2006; Banerjee and Duflo 2006). However, the field of labor
economics neglects absences.
While most discussions of gender differences in pay ignore absenteeism, the data
consistently show that women are more likely to be absent than men, and there is a small
literature that seeks to explain this difference. Ichino and Moretti (2009) conclude that absences
induced by the menstrual cycle explain 14 percent of the gender earnings gap. Leigh (1983) finds
that if women had the same individual and job characteristics as men they would not have higher
absence rates. Mastekaasa and Olsen (1998), however, are not able to fully explain the gender
gap in absences and conclude that differences in job characteristics explain only a small portion
of the difference. While there is a negative relationship between pay and absences, it is hard to
say whether pay affects absences or absences affect pay.
There is very little quantitative historical evidence on absenteeism. Greenlees (2007)
demonstrates that in the US and UK factory workers were not at work every day, but worked on
average about twenty days per month. Murray (2005) examines absences due to sickness and
finds that the percent of days lost due to illness stayed at about 2 percent over the past century.
Men lost more days than women in the 1890s, but by the 1980s women lost more days than men.
Karlsson (2016) reports that British studies during both world wars found higher absence rates
for women.

This paper examines whether women had higher rates of absenteeism than men in late
nineteenth-century US manufacturing. I use two different types of data, each with its own
strengths and weaknesses. I begin with survey data collected by state labor bureaus. A few of
these surveys asked workers how many days they lost during the year, due to lack of work,
sickness, or other reasons. The advantage of these surveys is that they cover a wide variety of
occupations, and include important demographic information about the workers. However, they
have the disadvantage that workers might not correctly report their absences, and that differences
across the genders might be a response to different job characteristics. I also examine wage
accounts of two nineteenth-century New England textile firms, Pepperell Mfrg. Co in Maine and
Lyman Mills in Massachusetts. Since workers were paid based on these records, I am more
confident they were accurate. Also, by examining workers within the same factory, working at
the same task, I control for differences in absenteeism that are induced by job characteristics.
These data also allow me to examine temporal patterns of absence. However, these records cover
only one occupation and do not include demographic information.
I conclude that women had higher absences than men. In the state surveys the overall
male-female difference is not statistically significant, but women with dependents had
significantly more absences. I also find higher absences among females in the factory wage
accounts. Comparison across time at Lyman Mills shows that absence rates declined between
1850 and 1883. Comparing Lyman and Pepperell in 1883, I find that Pepperell had much higher
absence rates than Lyman. Absences were generally higher in the summer than in the winter,
and were slightly higher on Saturdays than on other days of the week. Absence rates were high
near holidays, particularly for a few days after the holiday.
State Surveys
Surveys of workers conducted by California, Kansas, Maine, and Michigan during the
late nineteenth century asked workers how many days during the year they “lost”. The
California, Kansas, and Maine surveys report the total number of days lost during the year in
three categories: days lost due to lack of work, days lost due to sickness, and days lost due to
other reasons. Days missed due to lack of work are really days of unemployment rather than
absences, and I call these days demand-side days lost. Other reasons for missing work are
specific to the worker, and I call these supply-side days lost. The Michigan survey includes the

total number of days lost plus a variable listing the reason; for Michigan I group all the reasons
given in to demand-side and supply-side reasons.1 Table 1 shows the average number of days
lost per year for each sex. In California, Kansas, and Maine men lost significantly more days
than women due to lack of work, but the same is not true among Michigan furniture workers.
None of the gender differences in voluntary time lost are statistically significant. The remainder
of this section examines only supply-side days lost, which I will call simply absences.
I combine the data from the four surveys into one large data set. Table 2 presents
descriptive statistics for this combined data set. I combine the data sets to increase the number of
observations, but not all variables are available in all states. Experience and union membership
are available in only three states. Daily wages are available in all four states, but there are a
substantial number of missing variables, reducing the sample size. Only ten percent of the
workers in the sample are female. The simple average suggests that women were absent about
one more day per year than men.
Reported absences show evidence of heaping. Figure 1 graphs the percent of workers
(among all four surveys) reporting one to 60 days of absences. The graph shows peaks at one,
two, three, and five weeks, and at one and two months (26 and 52 days).2 170 men reported
being absent 52 days while only five men reported being absence 53 days. I conclude that there
is some error in the data due to imperfect recall.
The distribution of absences was heavily skewed. The modal number of absences was
zero, but a small number of workers were absent more than 100 days in the year. Figure 2 shows
the distribution of absences for men and women. The first category is zero, and subsequent
categories are for weekly (six-day) intervals (1–6 days, 7–12, etc.). This grouping serves to
smooth out the heaping. The majority of workers of both sexes, and more men than women,
reported zero absences. Men, however, were more likely to have had more than 120 days of
absence. Women were less likely than men to report zero absences, and more likely to report
one to six days of absence. Women were also more likely to report being absent more than 120
days in the year. Men, on the other hand, were more likely to report three to five weeks of
1 A few workers gave more than one reason, but don’t say how many days were lost to each reason. When multiple reasons are given I divide the absences equally among the given reasons. 2 Strangely, though, more men report 13 days of absence than 12 days.

absence. Unfortunately, in this data it is not possible to know if this was the result of longer
spells of absence or to more frequent spells.
I try to explain the number of absences using individual characteristics of the workers.
Because the majority of the sample reported no absences, I use Tobit estimation. Table 3 shows
the results. Controlling for state fixed effects, females had fewer absences than males but the
difference was not statistically significant. Absences increased with age, peaking at age 72, or
near the maximum age in the sample, in regression 2. Marriage and dependents had different
effects for men and women. Generally men with family responsibilities had fewer absences, and
women with family responsibilities had more absences. Since the sample contains few married
women, the effect of the interaction of Married and Female is not statistically significant. If
married women did have higher absence rates this would not be a surprise; Karlsson (2016) finds
that married women had higher absence rates than single women in Sweden. However, the
interaction between the Number of Dependents and Female is statistically significant. Women
who had more dependents also had more absences, suggesting that women and men responded
very differently to their family responsibilities. These patterns are robust to controls for
earnings, experience, and union membership. Absences had a negative correlation with daily
earnings, though not significantly so. A negative correlation could be either a response on the
worker's side (a higher wage means a higher opportunity cost of a day off) or on the firm's side
(rewarding more reliable employees). Controlling for age, workers with more experience in the
occupation had lower absences. As with wages this could be the result of the worker's decision
(the opportunity cost of an absence is higher) or the result of the firm's decision (workers who
are often absent lose their jobs). Union membership increased absences, but the effect was only
marginally significant. Union membership might provide job security that reduces the cost of
absences.
While the simple averages suggest that women had higher absence rates than men, the
effect turns negative once we control for state fixed effects. One of the few statistically
significant relationship I find is that women with families had higher absences than women
without families or men with families.
Wage Accounts

Moving from survey data to firm account data, we can observe exactly which days
workers missed. I collect data on days worked from the time books of two textile firms, Lyman
Mills in Holyoke, Mass., and Pepperell Mfrg. Co. in Biddeford, Maine.3 In both cases I examine
the attendance of workers in a particular weaving room, so all the workers were either weavers
or their supervisors.4 For Pepperell I have the calendar year 1883. For Lyman Mills I have three
sample periods: June 1, 1850 to May 3, 1851, the calendar year 1860, and Nov 27, 1882 to Dec
1, 1883.
Distinctions between demand-side and supply-side absences are based on the number of
workers absent on the same day. When all or nearly all of the workers are absent on the same
day, I assume that the mill was closed. If most workers were in attendance, I assume the
absences were voluntary.5 Between 1850 and 1883 there was an increase in the number of days
taken as holidays. At Pepperell holidays are easily identified because no one worked on those
days. There were six holidays at Pepperell: January 1, April 19 (Patriot's Day), May 30, July 4,
November 29, and December 25. At Lyman Mills a few of the overseers are paid for full or
partial days of work on the holidays. It is not possible to tell whether these individuals actually
showed up for work, or whether they received a paid holiday. During the period June 1850 to
May 1851, workers at Lyman took four holidays, July 4, Oct. 5, Nov. 28, and April 10.6 No one
was paid for July 4. On Oct. 5 ten people out of a workforce of 130 were paid, on Nov. 28 three
3 Baker Library Historical Collections, Lyman Mills collection LC-24, LC-30, and LC-42, and Pepperell Manufacturing Company collection EE-1 through EE-4. 4 Since I only have the records of part of the firm, absence rates would be affected if workers moved from one section of the mill to another. Since I have complete records of all the workers at Pepperell in March, 1883, I can check whether it was a common practice for workers to change rooms. Among the 1957 workers at the firm in March 1883 there are 64 cases where workers of the same name appear in different rooms. In 39 (61%) of these cases the two workers could not possibly be the same person because together they work more days than are available in a month. There are only 25 cases where it is possible that the same person worked in two different rooms, meaning that, at a maximum, 1.3 percent of workers moved rooms. I conclude that, if workers did move within the factory, it was relatively rare. In any case nineteenth-century mills did not have centralized hiring. The foreman for each room hired his own workers, so if a worker moved from one room to another it was like getting a new job. A worker at the Amoskeag mill reported that if you were fired by a supervisor in one of the firm's 12 mills, you could get a job in one of the other mills also owned by Amoskeag. "If you were fired, you'd have to go to some other mill – Amoskeag had twelve mills, you know – but you'd find a job. You see, your old boss wouldn't hire you back right away." (Mary Cunion, quoted in Hareven and Langenbach, 1978, p. 47.) 5 McHugh (1988, p. 27) makes the same assumption. 6 Yorke (1945, p. 17) reports that Pepperell took three holidays in 1845: "Fast Day (in April), Fourth of July, and Thanksgiving." April 10 thus appears to be Fast Day, a holiday celebrated in New England. I have not identified the reason for the October 5 holiday.

people out of a workforce of 118 were paid, and on April 10 ten workers were paid for a total of
4.5 days of work, out of a workforce of 72. Christmas Day saw a number of absences (45 out of
a workforce of 124), but the mill was clearly open for business. January 1, 1851, did not even
see an unusually number of absences; only 11 people were absent that day. In 1860 there were
also four holidays: April 5, July 4, Nov. 29 and Dec. 25. By 1883 the number of holidays had
increased to six and a half, with January 1 being a half holiday.7 In 1883 the Fourth-of-July
holiday was extended to three days, July 2, 3, and 4. While Pepperell and Lyman took different
days off in 1883, they had approximately the same number of holidays.
The other possible reason for supply-side absences is that the mills went on short-time
due to lack of demand. Lyman Mills appears to go on short time in 1861. For example, in July
1861 all workers except for two overseers work only three days the first week, and only four
days in the second, third, and fourth weeks of the month. I interpret this as the mill running on
short time. For this reason I don't measure absences at Lyman in 1861. For the years used in
this paper, there is no evidence of restrictions in hours available except at the holidays mentioned
above.
In the wage accounts it is sometimes difficult to distinguish absences from quits because
we observe workers who work, and then do not work for weeks or even months at a time, and
then return to work. For example Mary Shevernell worked at Pepperell continuously from
January 2 until Feb. 24. She then took a two-week break, returned to work on March 12, and
worked until March 30. She did not work again until Oct. 29 and then worked continuously
through December. While it seems reasonable to call the two-week period an absence, the
seven-month absence seems too long to label as absenteeism. What about Millie Salvier who
worked on August 25 but didn’t appear again until seven weeks later? To distinguish workers
who were absent from those who quit and were re-hired, I count any worker who is gone more
than four weeks as having separated from the firm for that period, and breaks of four weeks or
less are counted as absences. This definition is somewhat arbitrary, but I have also calculated
absences rates using two weeks or six weeks as the maximum absence, and these assumptions
affect the levels of the absence rates but not the patterns of gender differences.
7 On January 1, 1883, six workers were paid for a full days, 71 were paid for a half day, and 13 were absent the entire day.

Table 4 gives absence rates for males and females at the two firms. I divide the weaving
room workers into overseers and weavers, as grouped in the wage accounts, since these groups
might behave differently. Most of the weavers were female, but three of the four samples
contain male weavers. I report two measures of absences which vary in how they treat half days.
The first is the "full day" absence rate, which counts a worker as absent only if they were gone
the whole day. The absence rate is the number of absences divided by the number of days the
worker was considered to be employed at the firm (days worked plus absences). The second
absence rate includes partial absences. Workers who work half days are counted as absent half
the day.8 These rates are thus slightly higher than the full-day absence rates. I also report the
average number of days missed per absence spell.
Within each sample female absence rates were consistently higher than male absence
rates. Among weavers, female full-day absence rates were 26 percent higher than male rates in
1850-51, nearly three times as high as male rates at Lyman in 1883, and 51 percent higher than
male rates at Pepperell. Only Pepperell had female overseers, and there were few of them, but
their absence rate was more than twice the rate of the male overseers.
Overall the absence rates in Table 4 are higher than absence rates in the current labor
market. Absence rates reported by the US Bureau of Labor Statistics are not comparable,
because only workers absent for a whole week are counted as absent, but Ichino and Riphahn
(2005, p. 125) report absence rates from an Italian bank. They report that women averaged 0.09
days absent per week. If we assume that women were scheduled to work five days a week, this
implies an absence rate of 1.8 percent, which is comparable to the lowest male absence rates in
Table 5. Ichino and Riphahn report even lower rates for men: 0.05 days per week, or an absence
rate of approximately one percent. They also report an average spell length of 2.4 days, which is
lower than the spell lengths in Table 4 for everyone except male at Lyman in 1883. Ichino and
Riphahn report only absences "due to illness", so if we added other causes for absences the
modern rates would likely be higher. However, other causes of absences would have to be much
larger than absences due to sickness in order to get up to the 5-10 percent absence rates of
women in the nineteenth-century textile factories. Absence rates in Table 4 are also higher than
those implied by the state surveys. Table 2 reports that workers in these surveys averaged 9.75
8 Workers also sometimes worked one-quarter or three-quarters days. Lyman Mills in 1883 recorded hours worked, with 10 hours being the standard day, so I count less than ten hours as a partial absence.

days of voluntary absences per year. If we assume a working year of 306 days, this implies an
absences rate of 3.19, which is lower than the absence rates of female weavers in all four factory
samples. Cotton weavers seem to have had relatively high absence rates.
The three samples from Lyman Mills allow me to look for changes over time in absence
rates. There was a substantial drop in absence rates between 1850 and 1860. Absence rates of
male overseers fell by more than half, and absence rates of female weavers fell by about 16
percent. This may have been the result of efforts by the firm to enforce attendance. Starting in
1852 we see notes in the wage book about workers who left the firm. In February 1832 four
weavers were "Discharged for staying out," and in April 1832 one worker who left the firm was
described as "very unsteady out without liberty". If Lyman began to fire workers who had poor
attendance records, this may explain why absence rates fell. Between 1860 and 1883 there were
further declines in female absence rates at Lyman, though absence rates of male overseers rose
slightly.
Table 4 also allows us to compare two different firms at the same date. Pepperell clearly
has higher absence rates than Lyman in 1883. One contributor to Pepperell's absence rate was
the fact that the new catholic church was dedicated on May 9, 1883, and three-fifths of
Pepperell's labor force was absent that day.9 Could Pepperell's high absence rates be due to this
random event? To check this, I calculate what the full-day absence rate would be if we ignored
all the absences on May 9. Results are reported in Table 4 as "Absence Rate not counting May
9". Absence rates fall slightly, but this event is clearly not sufficient to explain why Pepperell
had higher absence rates than Lyman.
Both firms seem to have had high demand for their product. At Pepperell sales of cloth
increased 47 percent between 1879 and 1883 (Yorke, 1945, p. 114). At Lyman, letters from the
agent to the owners in late 1882 suggest that he was having trouble finding sufficient employees.
The agent writes "Am for gaining any in Weavers. It is bad to have so many looms idle" in Oct.
1882, and in Nov. 1882 "I am sorry to see so many looms reported ideal last week in No. 2."10
These reactions suggest that weavers at Lyman were not in fear of losing their jobs. Pepperell's 9 “The dedication of St. Joseph’s church on Elm street, which occurred Wednesday, rendered that day one of the most memorable in the clerical history of Biddeford. The city had never before contained such an assemblage of eminent and distinguished expounders of the Roman Catholic faith, and a recurrence is not within the bounds of probability.” Biddeford Weekly Journal, May 11, 1883. Thanks to Renee DesRoberts of the McArthur Public Library for this reference. 10 Lyman Mills collection PA-1, pages 807 and 832.

location, in a smaller town and farther from other mills, may have made it more difficult to find
workers and thus increased worker's power. However, the fact that Lyman was desperate for
workers in late 1882 suggests that Lyman workers also had some market power at this time, so
this was probably not the reason for the difference in absence rates.
The explanation for the different absence rates at Lyman and Pepperell may lie in the
worker-management relations at the two firms. There are suggestions that Lyman used both the
carrot and the stick to improve attendance. As noted above, Lyman may have fired workers who
had high absence rates. However, the firm's efforts to maintain good working conditions and
good labor relations probably contributed as well. Greenlees (2011, p. 265) claims that Lyman
had "good labor relations. The firm responded to strikes elsewhere in the state by giving its own
workers a small wage increase." In early 1880 Lyman management claimed that "the mills are
not run on selfish principles only, the welfare of those employed is carefully considered" (quoted
in Greenlees, 2011, p. 265). The most measurable aspect of working conditions, the wage,
certainly supports the story that Lyman treated their workers well. Table 5 shows average daily
earnings in March of 1883 at both firms.11 Female weavers at Lyman earned fourteen percent
more than those at Pepperell. There are other suggestions that Lyman managers kept workers
happy where they could. In 1883 Lyman provided the same number of holidays as Pepperell, but
in a different configuration. Lyman was on holiday July 2–4, and July 1 was a Sunday, so
workers had a four-day break. If the longer holiday was in response to worker demand, then it
demonstrates attention to the welfare of the workers. If in fact Lyman managed to establish a
gift-exchange relationship with its workers, this might explain why it had lower absence rates
than Pepperell.
An advantage of the wage book data is that I can examine temporal patterns of absences.
I begin by looking monthly averages. I expect absences to be higher in the summer months. In
1845 an observer noted that “in the summer season, when it is desirable to ramble in the county,
many Eastern factories have one third of their machinery standing idle for want of hands.”12
Greenlees (2011, p. 253) suggests that absenteeism was a problem in the summer, when the mills
were hot. Besides enjoying leisure or avoiding the heat of the factories, workers may have had
opportunities for alternative seasonal employment during the summer, though such opportunities
11 Overseers were paid time-rate wages, but nearly all the weavers were paid piece-rate wages. 12 W. Greg, Essays on Domestic Industry, Charleston: 1845, as quoted by Greenlees, 2007, p. 64.

were probably greater for men then for women. Figure 3 shows the average absence rate,
including part-day absences, by calendar month in each sample. Absences were generally higher
in the summer, though there appears to be much random variation. In 1850-51 July and August
had the highest absence rates. In 1860 July was highest, but February was the second highest.
Similarly, in 1883 at Lyman July had the highest absence rate, and January has the second
highest. At Pepperell absences were highest in April, May, July, and August, but for some
reason June was lower. The occasional high absence rates in the winter were not expected, but
could reflect bad weather which kept workers at home.
Pre-industrial workers are known for taking off “St. Monday”, and Voth (2000) finds
evidence that, in eighteenth-century London, individuals were more likely to be engaged in
leisure activities on Monday than any other day except Sunday. Weekly patterns could also
emerge if women were taking off do to housework that had a definite weekly pattern. To check
for any such weekly patterns in absences I find the number of absences by day of the week.
Figure 4 shows the average absence rate on each day of the week, in each of my four samples.
The 1850–51 sample is different from the others in that Monday, rather than Saturday, had the
highest absence rate. Absences on Monday were 14 percent higher than on Tuesday. At Lyman
in 1883 Monday absences were four percent higher than on Tuesday, and in the other samples
absence rates on Monday and Tuesday were approximately equal. Saturdays had a high number
of absences in all of the samples At Lyman Saturday's absence rate was 20 percent higher than
Thursday's in 1850-1, 13 percent higher in 1860, and 14 percent higher in 1883. Pepperell's
weekly pattern is affected by the May 9 church dedication, when that absence rate was 61
percent on a Wednesday. If we remove May 9, Wednesday drops below Tuesday and Thursday.
This leaves Pepperell with the flattest weekly profile, since its Saturday absence rate was only
eight percent higher than Thursday's absence rate.
Causes
I cannot ask the factory workers why they missed work, but in 1923 the Women’s Bureau
did just that for a sample of mill women. They interviewed 2354 women who had been absent
from work at textile mills in 1922 and asked them the reasons for their absences (Women's
Bureau, 1926). Table 6 summaries the explanations the women gave for their absences.
Approximately 21 percent of days lost were lost due to demand-side reasons. Most of these
involved shut-down of the entire mill, but women also reported instances were they were laid off
or no work was available. Women who missed a half or whole day because they were late and
were not admitted once the gates shut are included under “penalty” (p. 66). Most of the women
interviewed reported supply-side reasons for missing work. Illness and family duties were the
most common causes. Reasons for absences given in the Women's Bureau survey are consistent
with the evidence on absences from the state surveys and factory wage books.
One important reason for missing work was sickness. Three of the state surveys (all but
Michigan) distinguish between days lost due to sickness and days lost for "other reasons."
Overall 52 percent of male absences and 63 percent of female absences were attributed to
sickness. If we assume a working year of 306 days, then days lost due to sickness were 2.3
percent of workdays, which is similar to the rates reported by Murray (2005), who reports that
the percent of the work day lost to sickness was consistently around two percent from 1892 until
2002. Females with no dependents reported lower rates of sickness (1.8 percent) and females
with dependents reported higher rates (3.2 percent). As is generally the case, it is hard to tell
whether workers who self-report their illnesses were really sick. If the probability of being sick
was in fact around 2 percent, then male workers at Lyman in 1860 and 1883 seem to have taken
off only when sick, but women, and men at Pepperell in 1883 or at Lyman in 1850-51, seem to
have been absent when they were not sick.
Family responsibilities were also an important reason for absences. Evidence from the
state survey confirms that family responsibilities were an important reason for female absences,
since women with dependents had significantly more absences. While I do not know the family
status of individual workers in the factory wage accounts, I know that in general many of the
women working in textile factories were wives and mothers. The Women’s Bureau (1926, p. 34)
found that 39 percent of the women it interviewed in 1923 were mothers, and 41 percent were
wives. This may be an overestimate since they seem to have over-sampled married women.13
Still, it is clear that many of the women working in mills did have dependents and may have lost
work for that reason.
We can also use patterns of absences to confirm that leisure was one of the causes of
absences. The weekly pattern of absences presented in Figure 4 are consistent with leisure
13 Forty percent of the women in their sample were married, compared to 27 percent of women in the textile industry.
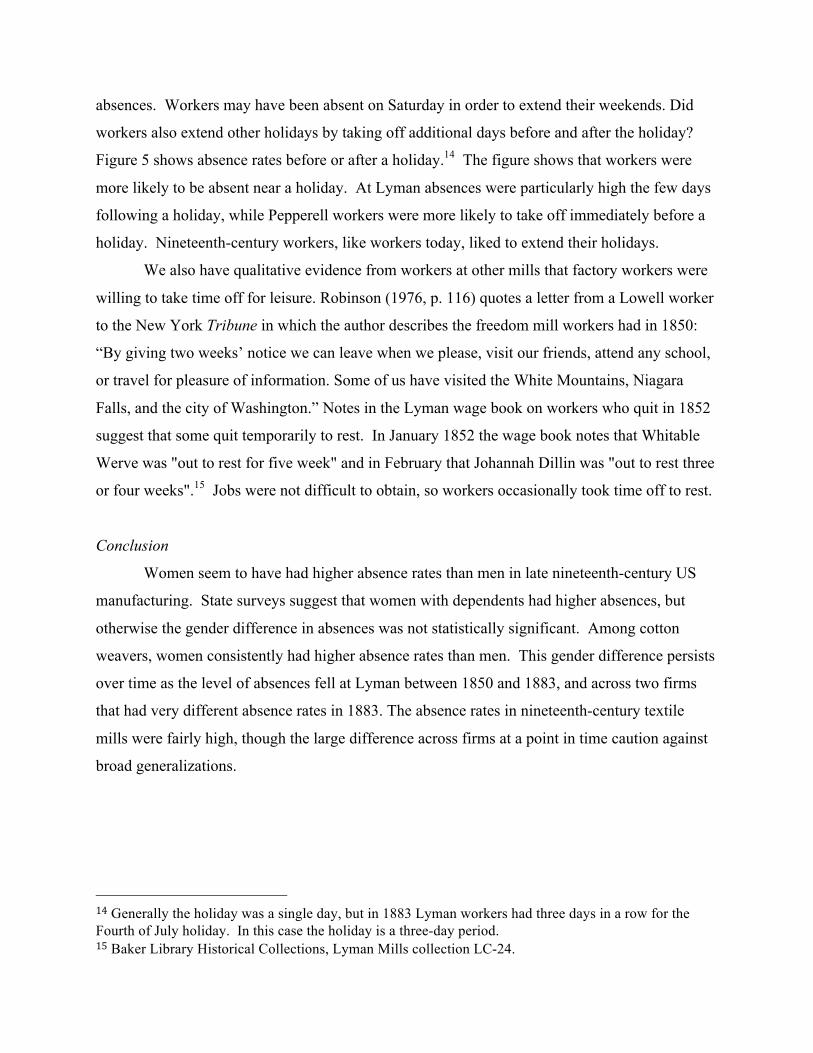
absences. Workers may have been absent on Saturday in order to extend their weekends. Did
workers also extend other holidays by taking off additional days before and after the holiday?
Figure 5 shows absence rates before or after a holiday.14 The figure shows that workers were
more likely to be absent near a holiday. At Lyman absences were particularly high the few days
following a holiday, while Pepperell workers were more likely to take off immediately before a
holiday. Nineteenth-century workers, like workers today, liked to extend their holidays.
We also have qualitative evidence from workers at other mills that factory workers were
willing to take time off for leisure. Robinson (1976, p. 116) quotes a letter from a Lowell worker
to the New York Tribune in which the author describes the freedom mill workers had in 1850:
“By giving two weeks’ notice we can leave when we please, visit our friends, attend any school,
or travel for pleasure of information. Some of us have visited the White Mountains, Niagara
Falls, and the city of Washington.” Notes in the Lyman wage book on workers who quit in 1852
suggest that some quit temporarily to rest. In January 1852 the wage book notes that Whitable
Werve was "out to rest for five week" and in February that Johannah Dillin was "out to rest three
or four weeks".15 Jobs were not difficult to obtain, so workers occasionally took time off to rest.
Conclusion
Women seem to have had higher absence rates than men in late nineteenth-century US
manufacturing. State surveys suggest that women with dependents had higher absences, but
otherwise the gender difference in absences was not statistically significant. Among cotton
weavers, women consistently had higher absence rates than men. This gender difference persists
over time as the level of absences fell at Lyman between 1850 and 1883, and across two firms
that had very different absence rates in 1883. The absence rates in nineteenth-century textile
mills were fairly high, though the large difference across firms at a point in time caution against
broad generalizations.
14 Generally the holiday was a single day, but in 1883 Lyman workers had three days in a row for the Fourth of July holiday. In this case the holiday is a three-day period. 15 Baker Library Historical Collections, Lyman Mills collection LC-24.

Bibliography Banerjee, A. and E. Duflo (2006), “Addressing Absence,” Journal of Economic Perspectives,
20:117-132. Carter, Susan, Roger Ransom, Richard Sutch, and Hongcheng Zhao, 1993. A Survey of 1084
Workers in Maine, 1890. Historical Labor Statistics Project, Univ. of California, Berkeley. Chaudhury, N. et.al. (2006), “Missing in Action: Teacher and Health Worker Absence in
Developing Countries,” Journal of Economic Perspectives, 20:90-116. Goldin, C. (1986), “Monitoring Costs and Occupational Segregation by Sex: A Historical
Analysis”, Journal of Labor Economics, 4: 1-27 Greenlees, J. (2007) Female Labour Power: Women Workers' Influence on Business Practices in
the British and American Cotton Industries, 1780–1860, Ashgate. Greenlees, J. (2011) "Technological Choice and Environmental Inequalities: The New England
Textile Industry, 1880-1930," in G. Massard-Guilbaud and R. Roger eds., Environmental and Social Justice in the City: Historical Perspectives, Cambridge: White Horse Press.
Hareven, T., and R. Langenbach (1978) Amoskeag: Life and Work in an American Factory-City, Pantheon Books.
Ichino, A., and E. Moretti (2009) “Biological Gender Differences, Absenteeism, and the Earnings Gap,” American Economic Journal: Applied Economics, 1, 183-218.
Ichino, A. and R. Riphahn (2005) "The Effect of Employment Protection on Worker Effort: Absenteeism during and after Probation," Jnl. of the European Economic Association, 3:120–143.
Karlsson, T. (2016), "Gender Differences in Absence from Work: Lessons from Two World Wars," Institute for Evaluation of Labour Market and Education Policy Working Paper
Leigh, J. Paul (1983), "Sex Differences in Absenteeism," Industrial Relations, 22:349–361.
Mastekaasa, A. and K. M. Olsen (1998), “Gender, Absenteeism, and Job Characteristics” Work and Occupations, 25:195–228
McHugh, C. (1988), Mill Family: The Labor System in the Southern Cotton Textile Industry 1880-1915, Oxford Univ. Press.
Murray, John E. (2005), "A Century of Absenteeism from American Workplaces," Rhoades College, mimeo.
Polachek, S.W. (1981), “Occupational Self-Selection: A Human Capital Approach to Sex Differences in Occupational Structure," Review of Economics and Statistics, 63: 60-69.
Robinson, Harriet, [1898] 1976. Loom and Spindle or Life Among the Early Mill Girls. Press Pacifica, Kailua.
Voth, Hans-Joachim (2000) Time and Work in England, 1750-1830, Oxford: Clarendon Press. Women’s Bureau (1926) Lost Time and Labor Turnover in Cotton Mills: A Study of Cause and
Extent. Government Printing Office, Washington. Yorke, Dane, 1945. The Men and Times of Pepperell. Pepperell Manufacturing Co., Boston.

Table 1: Average Absences By Gender, State Surveys Days Lost per Year State California Kansas Maine Michigan Combined Year 1892 1899 1890 1889 Industry Various Various Various Furniture Time Lost - Demand Males 27.1
(52.2) 15.9
(40.0) 39.1
(43.3) 21.5
(32.1) 24.9
(41.9) Females 11.8
(31.0) 8.2
(36.8) 9.6
(24.2) 23.9
(26.8) 14.6
(32.7) t-ratio for M-F difference 9.71 2.22 9.34 –1.28 Time Lost - Supply Males 10.9
(25.2) 17.4
(34.6) 20.5
(26.2) 5.5
(20.4) 9.7
(24.6) Females 9.6
(25.9) 18.5
(47.2) 25.4
(29.6) 4.8
(21.1) 10.5
(27.8) t-ratio for M-F difference 1.15 –0.26 –1.37 0.48 Observations Males 2824 927 1012 5203 9976 Females 634 131 72 216 1052
Source: Carter, et. al. 1993. Table 2: Descriptive Statistics: Combined Data
Mean SD Min Max N Absences 9.75 24.88 0 286 11028 Absences, Men Only 9.67 24.55 0 286 9976 Absences, Women Only 10.50 27.81 0 220 1052 Ever Absent 0.29 0.45 0 1 11028 Female 0.10 0.29 0 1 11028 Age 29.87 11.60 10 76 10948 Married 0.46 0.50 0 1 11023 Number of dependents 1.46 1.92 0 13 11025 Daily earnings 1.63 0.93 0.01 1.20 9746 Experience 7.38 8.40 0 58 9116 Union Member 0.38 0.49 0 1 4710

Table 3: Tobit Estimations of Total Absences 1 2 3 5 6 Female –2.719
(2.360) –0.393 (2.653)
–0.893 (2.908)
–3.833 (3.145)
–3.443 (3.156)
Age 0.900 (0.342)
1.168 (0.376)
1.988 (0.429)
0.321 (0.448)
Age Squared/100 –0.626 (0.441)
–0.903 (0.480)
–1.801 (0.557)
–0.030 (0.558)
Married –0.637 (2.186)
–1.137 (2.288)
–0.655 (2.669)
–1.602 (2.470)
Married x Female 9.612 (11.352)
14.391 (11.643)
–3.800 (18.005)
9.893 (10.398)
Number of Dependents
–0.927 (0.540)
–1.116 (0.560)
––0.718 (0.661)
–0.706 (0.620)
No. Dependents x Female
6.292 (2.412)
7.178 (2.504)
7.471 (2.854)
5.143 (2.226)
Daily earnings –1.353 (1.061)
Experience –0.596 (0.131)
Union Member 2.211 (1.777)
Kansas 14.215 (2.334)
11.831 (2.389)
13.862 (3.267)
3.996 (3.015)
9.803 (2.198)
Maine 31.080 (2.230)
28.606 (2.273)
24.944 (2.406)
NA 24.878 (2.116)
Michigan –32.216 (1.718)
–30.722 (5.887)
–32.748 (2.159)
–39.294 (2.076)
NA
Pseudo-R2 0.02 0.03 0.03 0.02 0.01 N 11,028 10,943 9,695 9049 4644 Standard errors in parentheses.

Table 4: Absence Rates in Weaving Rooms of Lyman Mills and Pepperell Manufacturing Company
Male Overseers
Female Overseers
Male Weavers
Female Weavers
Lyman 1850–51 Absence Rate, Full Days 3.78 7.38 9.31 Absence Rate, Including Part Day 4.81 10.28 11.79 Days Per Spell 5.00 2.54 2.97 N 26 0 56 311 Lyman 1860 Absence Rate, Full Days 1.67 7.78 Absence Rate, Including Part Day 1.70 8.33 Days Per Spell 6.25 4.35 N 8 0 0 150 Lyman 1883 Absence Rate, Full Days 2.35 1.77 5.18 Absence Rate, Including Part Day 3.26 3.12 5.95 Days Per Spell 2.17 1.75 4.31 N 15 0 21 197 Pepperell 1883 Absence Rate, Full Days 6.26 14.95 6.42 9.69 Absence Rate not counting May 9 6.14 14.67 6.16 9.53 Absence Rate, Including Part Day 6.65 15.51 6.79 10.16 Days Per Spell 4.10 4.09 4.23 4.36 N 79 4 96 551
Source: Baker Library Historical Collections, Lyman Mills collection LC-24, LC-30, and LC-42, and Pepperell Manufacturing Company collection EE-1 through EE-4. Note: The absence rate is the total number of absences divided by days worked plus absences. A worker who is gone more than four weeks in a row is counted as separated rather than absent. Rates are based June 1, 1850 to May 3, 1851 Lyman 1850-51.
Table 5: Average Daily Earnings in March 1883 ($)
Lyman Pepperell Ratio Male Overseers 1.71 1.41 1.21 Male Weavers 1.18 1.10 1.07 Female Weavers 1.16 1.02 1.14 F/M Ratio Weavers 0.98 0.93

Table 6: Causes of Absences Among Women Interviewed in 1922
Percent of Days Lost
Percent of Supply-Side Absences
Demand 20.75 Shutdown 10.95 Strike or Dispute 0.88 Weather 0.18 Laid off 5.73 Penalty 0.15 No Work 2.86 Illness 25.34 25.34 31.98 31.98 Family 30.50 38.49 Pregnancy 8.79 11.09 Illness of other 10.03 12.66 Marriage 0.55 0.69 Home duties 11.07 13.97 Religion 0.06 0.07 Other Work 9.64 12.17 Another job 7.93 10.01 Business 0.66 0.83 Education 1.05 1.33 Leisure 13.06 16.48 Rest 5.32 6.72 Recreation 4.74 5.98 Vacation 3.00 3.78 Other 0.70 0.88 Source: Women’s Bureau, “Lost Times and Labor Turnover in Cotton Mills: A Study of Cause and Extent,” Bulletin of the Women’s Bureau, No. 52, Washington: Government Printing Office, 1926. Days missing due to death are excluded from the calculation.
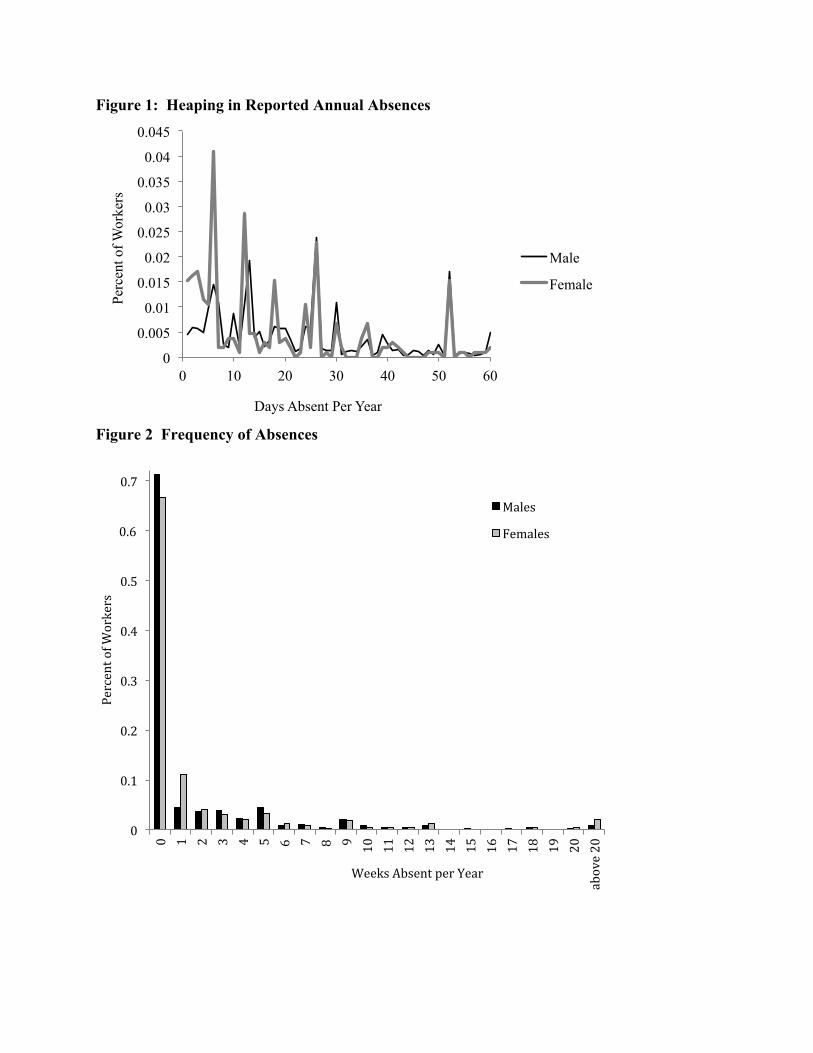
Figure 1: Heaping in Reported Annual Absences
Figure 2 Frequency of Absences
0
0.005
0.01
0.015
0.02
0.025
0.03
0.035
0.04
0.045
0 10 20 30 40 50 60
Perc
ent o
f Wor
kers
Days Absent Per Year
Male
Female
0
0.1
0.2
0.3
0.4
0.5
0.6
0.7
0 1 2 3 4 5 6 7 8 9 10
11
12
13
14
15
16
17
18
19
20
above 20
Percent of W
orkers
Weeks Absent per Year
Males
Females
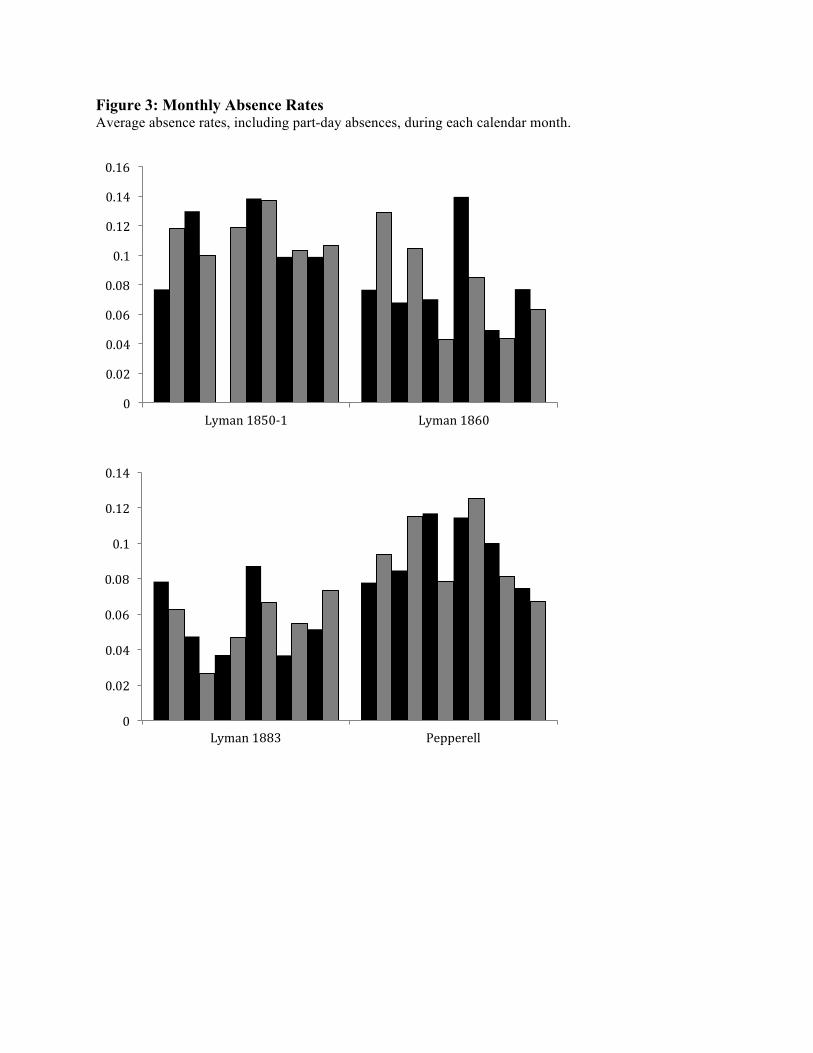
Figure 3: Monthly Absence Rates Average absence rates, including part-day absences, during each calendar month.
0
0.02
0.04
0.06
0.08
0.1
0.12
0.14
0.16
Lyman 1850-‐1 Lyman 1860
0
0.02
0.04
0.06
0.08
0.1
0.12
0.14
Lyman 1883 Pepperell

Figure 4: Weekly Absence Rates Average absence rates, including part-day absences, by day of the week.
Figure 5: Absences Near Holidays
0
0.02
0.04
0.06
0.08
0.1
0.12
0.14
Lyman 1850-‐1 Lyman 1860
0
0.02
0.04
0.06
0.08
0.1
0.12
Lyman 1883 Pepperell
0
0.05
0.1
0.15
0.2
H-‐6 H-‐5 H-‐4 H-‐3 H-‐2 H-‐1 H H+1 H+2 H+3 H+4 H+5 H+6
Lyman 1850-1

0
0.02
0.04
0.06
0.08
0.1
0.12
0.14
H-‐6 H-‐5 H-‐4 H-‐3 H-‐2 H-‐1 H H+1 H+2 H+3 H+4 H+5 H+6
Lyman 1860
0
0.02
0.04
0.06
0.08
0.1
H-‐6 H-‐5 H-‐4 H-‐3 H-‐2 H-‐1 H H+1 H+2 H+3 H+4 H+5 H+6
Lyman 1883
0
0.02
0.04
0.06
0.08
0.1
0.12
0.14
H-‐6 H-‐5 H-‐4 H-‐3 H-‐2 H-‐1 H H+1 H+2 H+3 H+4 H+5 H+6
Pepperell 1883