gene expression analysis in cardiac and adipose derived
TRANSCRIPT
Catarina Máximo Serpa Carvalho Licensed in Biomedical Engineering
Gene Expression Analysis in Cardiac and Adipose Derived Fibroblasts: potential influence of origin and
in vitro culture
Dissertation for a Master’s Degree in Biomedical Engineering
Orientadora: Doutora Maria Alexandra Núncio de Carvalho Ramos Fernandes,
Departamento de Ciências da Vida, Faculdade de Ciências e
Tecnologia, Universidade Nova de Lisboa
Co-
orientador:
Priv.-Doz. Ph.D. Harald Lahm, Department of Cardiovascular
Surgery, Division of Experimental Surgery, German Heart Center
Munich, Technische Universität München
Júri :
Presidente: Doutora Célia Maria Reis Henriques
Arguentes: Doutor Pedro Miguel Ribeiro Viana Baptista
Vogais: Doutora Maria Alexandra Núncio de Carvalho
Ramos Fernandes

ii

iii
Gene Expression Analysis in Cardiac and Adipose Derived Fibroblasts: potential influence of origin and in vitro culture
Copyright © Catarina Máximo Serpa Carvalho, Faculdade de Ciências e Tecnologia,
Universidade Nova de Lisboa.
A Faculdade de Ciências e Tecnologia e a Universidade Nova de Lisboa têm o direito, perpétuo
e sem limites geográficos, de arquivar e publicar esta dissertação através de exemplares
impressos reproduzidos em papel ou de forma digital, ou por qualquer outro meio conhecido ou
que venha a ser inventado, e de a divulgar através de repositórios científicos e de admitir a sua
cópia e distribuição com objectivos educacionais ou de investigação, não comerciais, desde
que seja dado crédito ao autor e editor.

iv

v
ACKNOWLEDGEMENTS
Foremost, I would like to thank Ph.D. Alexandra Fernandes who stood by me as my supervisor
at Faculdade de Ciências e Tecnologia, Universidade Nova de Lisboa, with advice and support,
during the research process and writing of this master thesis.
I would also like to thank Priv.-Doz. Ph.D. Harald Lahm, my external supervisor, who guided me
through both practical work, as well as the writing and analysis.
Furthermore, I must express my gratitude to Priv.-Doz. MD Markus Krane for welcoming me at
the German Heart Centre Munich and endorsing this new interesting project. I’m also thankful
for all the collaborations of the Experimental Surgery Unit at the German Heart Centre Munich,
who were always available, and provided exceptional practical help. Thanks to them, my
scientific and social skills in the laboratory were improved.
I would like to acknowledge Ph.D. Salomé Almeida, whose help in the genetics analysis part of
this work was invaluable. I am gratefully indebted to her, for her very valuable comments on this
thesis, as well as her patient guidance, encouragement and advice.
In particular, I am grateful to Ph.D. Sofia Duque, who introduced me to research, strongly
contributing to this project choice.
I would like to specially thank FCT UNL for giving me the opportunity to do this Erasmus
internship abroad, accomplishing this work as my masters’ project, pushing me to try harder,
and motivating me to pursue research in the future.
Last but not least, thank you to my family, who provided me with unfailing support and
continuous encouragement in my studies in Lisbon, and abroad, throughout these years. Thank
you for always supporting me in every way, this accomplishment would not have been possible
without you.

vi
vii
ABSTRACT
Cardiac fibroblasts represent one major cell population in the heart, and are responsible for
many important cardiac functions. They also arise from different cardiac lineages, suggesting
that they are primed to transdifferentiation, and may be directly involved in cardiogenesis.
The objective of this study was to achieve a detailed analysis of the transcriptional activity of
human cardiac fibroblasts, derived from right and left atrium, assuming a possible contribution
of the fibroblast population in cardiac development.
Cardiac samples were collected, both from adult patients, suffering from coronary and valvular
heart disease, and from infant patients suffering from congenital heart disease. Control
fibroblasts from adipose tissue, of the same patient, were cultured as a reference. Gene
expression was evaluated by reverse transcriptase quantitative polymerase chain reaction (RT-
qPCR), and subsequently subjected to data analysis. The gene expression was compared
between cardiac, and adipose-derived fibroblasts. In addition, the results were analysed
according to age, and different cell passages.
Gene expression comparison between atrial cardiac fibroblasts (CF) and their respective
adipose tissue fibroblasts (AF), show that certain cardiac transcription factors, such as GATA5,
are only expressed in CFs and absent in AFs. Only in children, the same occurs for GATA4 and
WT1. However, typical fibroblast markers like CD90 or DDR2, seem to have a higher
expression level in AFs. Age-dependent effects are small if any. Passage 0 (P0) fibroblasts,
usually show higher gene expression levels than passage 2 (P2) fibroblasts.
Interestingly, in vitro cell culture appears to affect gene expression. Therefore, it is important to
use unbiased approaches for gene expression analysis such as directly use ex vivo purified
cardiac fibroblasts. Further gene expression studies, focused on diagnoses, may contribute to
gene interference in cell culture differences. The eventual possibility of using fibroblasts in
cardiac regeneration strongly encourages further research in this area.
Keywords
Fibroblasts; Cardiac; Transcription factors; Gene Expression; Heart Disease

viii

ix
RESUMO
Os fibroblastos cardíacos são a principal população de células no coração, e são responsáveis
por muitas funções cardíacas importantes. Também são provenientes de linhagens cardíacas
diferentes, sugerindo que estão predispostos para a transdiferenciação e podem estar
diretamente envolvidos na cardiogénese.
O objectivo deste estudo foi realizar uma análise detalhada da actividade transcripcional dos
fibroblastos cardíacos humanos, provenientes da aurícula direita e esquerda, assumindo uma
possível contribuição da população de fibroblastos no desenvolvimento cardíaco.
Foram recolhidas amostras cardíacas, provenientes de doentes adultos, com patologia de
doença coronária e valvular, e de crianças com patologias cardíacas congénitas. Tendo sido
usados como referência, fibroblastos de controle de tecido adiposo do mesmo doente.
Relativamente à metodologia usada, após os testes de reacção de transcriptase reversa RT-
qPCR (quantitative Reverse Transcriptase Polymerase Chain Reaction), procedeu-se a uma
análise de dados. Finalmente, foi efectuada uma comparação do padrão de expressão entre
fibroblastos cardíacos (CF) e de tecido adiposo (AF). Os resultados foram comparados tendo
em conta os grupos etários, e as diferentes passagens.
Em relação ao perfil de análise de expressão genética dos CF de crianças e adultos, em
comparação com os respectivos AF, os resultados mostram que certos factores de transcrição,
como o GATA5, é apenas expresso em CFs e não nos AFs. O mesmo acontece apenas em
amostras de crianças para GATA4 e WT1. No entanto, os marcadores de fibroblastos típicos,
como CD90 ou DDR2, parecem ter um nível maior expressão nos AFs. Os efeitos dependentes
da idade são baixos, não sendo significativos. Os fibroblastos da passagem 0 (P0), mostram
geralmente níveis de expressão mais elevadas do que os da passagem 2 (P2).
Curiosamente, a cultura in vitro parece afectar a expressão genética, pelo que, futuramente, a
análise da expressão dos genes, deverá ser efectuada ex vivo, usando directamente,
fibroblastos cardíacos purificados. Estudos futuros de expressão genética, focados nos
diagnósticos, poderão contribuir para uma melhor compreensão da interferência genética na
cultura de células. A eventual possibilidade do uso de fibroblastos na regeneração cardíaca,
incita a uma maior investigação nesta área.
Palavras-Chave
Fibroblastos; Cardíaco; Factores de Transcrição; Expressão Genética; Doença Cardíaca

x
xi
TABLE OF CONTENTS
ACKNOWLEDGEMENTS .............................................................................................. V
ABSTRACT .................................................................................................................. VII
RESUMO ....................................................................................................................... IX
TABLE OF CONTENTS ................................................................................................ XI
LIST OF FIGURES ...................................................................................................... XIII
LIST OF TABLES ........................................................................................................ XV
LIST OF EQUATIONS ............................................................................................... XVII
LIST OF ABBREVIATIONS ........................................................................................ XIX
1. INTRODUCTION ..................................................................................................... 11.1 Heart Development ..................................................................................................... 11.2 Fibroblasts ................................................................................................................... 2
1.2.1. Cardiac Fibroblasts ..................................................................................................... 31.2.2. Fibroblasts Markers .................................................................................................... 5
1.3 Heart Disease ............................................................................................................. 51.3.1 Congenital Heart Disease ............................................................................................ 61.3.2. Heart Disease in Adults .............................................................................................. 8
1.4 Scope .......................................................................................................................... 82. MATERIALS ......................................................................................................... 11
2.1. Chemicals and Reagents ................................................................................................ 112.2. Equipment ....................................................................................................................... 122.3. Kits ................................................................................................................................... 132.4. Produced Media and Solutions ........................................................................................ 132.5. Antibodies and Serum Used ............................................................................................ 142.6. Biological material ........................................................................................................... 14
3. METHODS ............................................................................................................ 153.1. Establishment of primary cardiac and adipose fibroblast cultures ................................... 15
3.1.1. Cell Culture ............................................................................................................... 153.1.2. Protocol used ............................................................................................................ 163.1.3. Cell passaging .......................................................................................................... 17
3.2. RNA Extraction ................................................................................................................ 183.3. cDNA synthesis ............................................................................................................... 193.4. Polymerase Chain Reaction ............................................................................................ 21
xii
3.5. Reverse Transcriptase - Quantitative Polymerase Chain Reaction (RT-qPCR) with SybrGreen .............................................................................................................................. 21
3.5.1. Principle of RT-qPCR ............................................................................................... 213.5.2. Quantification of RT-qPCR samples by means of Standard Curves ........................ 233.5.3. Normalisation with housekeeping gene b-Actin ........................................................ 233.5.4. Agarose Gel Electrophoresis .................................................................................... 243.5.5. Data Analysis ............................................................................................................ 25
3.6. Immunostaining ............................................................................................................... 253.6.1. Immunocytochemistry ............................................................................................... 263.6.2. Immunohistochemistry .............................................................................................. 26
4. RESULTS .............................................................................................................. 294.1. Primary cardiac and control fibroblast cultures ................................................................ 294.2. Immunostaining ............................................................................................................... 304.3. Gene expression ............................................................................................................. 33
4.3.1. Comparison between AF and CF ............................................................................. 394.3.2. Comparison between Passages zero and two ......................................................... 414.3.3. Comparison between Children and Adults ............................................................... 46
5. DISCUSSION ........................................................................................................ 495.1. Analysis of Comparison between AF and CF .................................................................. 495.2. Analysis of Comparison between Passages zero and two .............................................. 515.3. Comparison between Children and Adults ...................................................................... 53
6. CONCLUSION ...................................................................................................... 636.1. AF vs. CF ......................................................................................................................... 636.2. Culture ............................................................................................................................. 656.3. Children vs. Adults ........................................................................................................... 66
REFERENCES ............................................................................................................. 69
ATTACHMENTS .......................................................................................................... 75Attachment A - List of consumables, software and used primers ........................................... 75Attachment B - Standard curve for CD90 ............................................................................... 77Attachment C - RT-qPCR Gene Expression Results ............................................................. 79Attachment D – Review of 14 studied genes .......................................................................... 83Attachment E – Some future studies suggestions .................................................................. 85
xiii
LIST OF FIGURES
Figure 1.1 - Photograph of AF at P0 from a child after 4 days in culture, .................................... 3
Figure 1.2 - Experimental procedure representation .................................................................... 9
Figure 3.1 - Cell Culture Procedure ............................................................................................ 15
Figure 3.2 - Diagram of cover glass with three slices of tissue and the stainings performed in
IHC. .................................................................................................................................... 27
Figure 4.1 - Photograph of confluent AF at P0 after a week in culture from a child sample, ..... 29
Figure 4.2 - Photographs of AF (A) and CF (B, right atrium) at P0 after 3 days of culture from a
child. .................................................................................................................................. 30
Figure 4.3 - Immunocytochemistry results ................................................................................. 31
Figure 4.4 - Immunohistochemistry results ................................................................................ 32
Figure 4.5 - Graphs of CF/AF ratio for P0, for cardiac genes. .................................................... 39
Figure 4.6 - Graphs of CF/AF ratio for P0, for epicardial genes. ................................................ 40
Figure 4.7 - Graphs of CF/AF ratio for P0, for fibroblasts markers. ............................................ 40
Figure 4.8 - Graphs of CF/AF ratio for P0, for endothelial and mesenchymal markers. ............ 41
Figure 4.9 - Graphs of P0/P2 ratio for AF, for cardiac genes. .................................................... 42
Figure 4.10 - Graphs of P0/P2 ratio for CF, for cardiac genes. .................................................. 43
Figure 4.11 - Graphs of P0/P2 ratio for AF, for epicardial genes. .............................................. 44
Figure 4.12 - Graphs of P0/P2 ratio for CF, for epicardial genes. .............................................. 44
Figure 4.13 - Graphs of P0/P2 ratio for AF, for fibroblasts markers. .......................................... 45
Figure 4.14 - Graphs of P0/P2 ratio for CF, for fibroblasts markers. .......................................... 45
Figure 4.15 - Graphs of P0/P2 ratio for AF, for endothelial and mesenchymal markers ............ 46
Figure 4.16 - Graphs of P0/P2 ratio for CF, for endothelial and mesenchymal markers ............ 46
Figure 5.1 - Heatmap of gene expression of all tested genes in all patients .............................. 49
Figure 5.2 – Gene Interaction ..................................................................................................... 54
Figure 5.3 – Heatmap of gene expression of cardiac genes in all patients ................................ 55
Figure 5.4 - Heatmap of gene expression of epicardial genes in all patients ............................. 57

xiv
Figure 5.5 - Heatmap of gene expression of fibroblasts markers in all patients ......................... 59
Figure 5.6 - Heatmap of gene expression of endothelial and mesenchymal markers in all
patients .............................................................................................................................. 60

xv
LIST OF TABLES
Table 2-1 - Chemicals and reagents .......................................................................................... 11
Table 2-2 - Equipment ................................................................................................................ 12
Table 2-3 - Kits ........................................................................................................................... 13
Table 2-4 - Produced Media and Solutions ................................................................................ 13
Table 2-5 - Antibodies and serum used ..................................................................................... 14
Table 3-1 - List of the diagnosis of the collected samples .......................................................... 16
Table 3-2 - cDNA synthesis protocol. ......................................................................................... 20
Table 3-3 - Mastermix composition for a RT-qPCR, for one sample. ......................................... 22
Table 3-4- RT-qPCR Operating conditions ................................................................................ 22
Table 3-5 - Dilution series for a standard curve ......................................................................... 23
Table 3-6 - Composition List ...................................................................................................... 24
Table 4-1 - Results of ratio analysis between tissue and passages, for cardiac genes. ............ 35
Table 4-2 - Results of ratio analysis between tissue and passages, for epicardial genes. ........ 36
Table 4-3 - Results of ratio analysis between tissue and passages, for fibroblasts markers ..... 37
Table 4-4 - Results of ratio analysis between tissue and passages, for other markers. ............ 38
Table 5-1 - Age dependent gene expression patterns found. .................................................... 52

xvi

xvii
LIST OF EQUATIONS
Equation 3-1 - RNA Volume per sample .................................................................................... 20
Equation 3-2 - Amplified PCR-products ..................................................................................... 23
Equation 3-3 - Target Genes / Reference Genes ....................................................................... 24

xviii
xix
LIST OF ABBREVIATIONS
ACVB Aorto-coronary vein bypass
AF adipose derived fibroblasts
aq. bidest double distilled water
ASD Atrial Septal Defect
ASDII Atrial Septal Defect Secundum
AVR Aortic valve replacement
CAVSD Complete Atrium Ventricle Septum Defect
CD105 Cluster of Differentiation 105
CD90 Cluster of Differentiation 90
cDNA complementary DNA
CF cardiac fibroblasts
CHD Congenital Heart Disease
CoA Coarctation of the aorta
DDR2 Discoidin domain-containing receptor 2
DMEM Dulbecco´s Modified Eagle Medium
DNA Deoxyribonucleic acid
dNTP deoxyribose nucleoside triphosphate
EDTA Ethylenediamine tetraacetic acid
EMT Epithelial-to-mesenchymal transformation
EPDC Epicardium-derived cell
FCS Fetal Calf Serum
GATA4 GATA-binding protein 4
GATA5 GATA-binding protein 5
GATA6 GATA-binding protein 6
HBSS Hank’s balanced saline solution

xx
HKG House Keeping Gene
HLHS Hypoplastic left heart syndrome
ICC Immunocytochemical staining
IHC Immunohistochemical staining
M-MLV-RT Moloney Murine Leukemia Virus Reverse Transcriptase
MVR Mitral valve repair
P Passage
PBS Phosphate buffered saline
PDGRFΑ Platelet Derived Growth Factor Alpha
Pen/Strep Penicillin/Streptomycin
PFA Paraformaldehyde
POSTN Periostin
RNA Ribonucleic acid
RPMI Roswell Park Memorial Institute Medium
RT-qPCR Reverse Transcriptase Quantitative Polymerase Chain Reaction
TBE Tris/Borate/EDTA
TBX18 T-box Transcription factor 18
TBX20 T-box Transcription factor 20
TBX5 T-box Transcription factor 5
TCF21 Transcription factor 21
VIM Vimentin
WT1 Wilms’ Tumor 1

1
1. INTRODUCTION
The cardiovascular system is one of the most important systems in the human body, as it is
essential for the distribution of nutrients and oxygen to all cells of the body. During embryonic
development, the heart is the first organ to develop. Cardiogenesis is a complex, well-
orchestrated series of processes, including specification, proliferation, migration, and
differentiation (1). Accordingly,, cardiac development is exquisitely sensitive, as any
perturbation in the cells involved in this process leads to cardiac malformations. These
frequently result in the death of the embryo (2). If, instead, the child is born, congenital
abnormalities in cardiac growth, contractility and vascularity, will affect the child wellbeing,
leading to an early life filled with medical interventions and a poor quality of life. If the
malformations are too extreme death will occur (3).
1.1 Heart Development
Heart development has been considerably studied in mice, towards understandingt this
process, to determine the biological pathways and responsible genes involved, as well as
lineage tracing (1).
Cardiac development starts with the formation of the precardiac mesoderm. At embryonic day
6.5 (E6.5), gastrulation takes place and mesoderm cells migrate anteriolaterally to form
bilaterally paired heart fields. At E7.75 the two fields meet, forming the cardiac crescent, also
denominated as the first heart field (1). In this location, primary cardiac progenitor cells will
contribute to left ventricle and atria (3). The second heart field is derived from the pharyngeal
mesoderm, and contributes primarily to the right ventricle and outflow tract (4). They also
contribute a majority of cells to the atria (5). Both halves of the cardiac crescent migrate to build
the linear heart tube by E8. By E9.5, the heart looping occurs, in which the primitive heart tube
loops asymmetrically. This rightward looping, and differential growth, brings the primitive heart
chambers into alignment before their future integration. This process ends, when the main
regional divisions of the mature heart and primordium of the great arterial trunks become
established preceding septation, by E10.5 (1). The four-chambered heart starts to form,
beginning with neural crest cells migrating into the heart. Resulting from a derivation of cells
from cardiac muscle cells, the development of the conduction system follows. Cardiac chamber
is formed (atria and ventricles), and septa construction occurs, a process in which atrial and
ventricular septum are generated and organized, to separate these four enclosed cavities within
the heart (6). Along with smooth muscle cells, the venous and arterial vasculature is modulated.
Finally, valves and endocardium, originated by endothelial cells, are formed (3).
Examples of transcription factors, expressed by primary cardiac progenitor cells, are GATA
Binding Protein 4/5/6 (GATA4/5/6), and T-box transcription factor 5/20 (TBX5/20) will be studied
in this project in further detail.
2
The GATA family factors constitute a family of zinc finger DNA binding proteins that control the
development of diverse tissue-specific profiles by activating or repressing transcription (7) (8).
These transcriptional factors control gene expression and differentiation in a variety of cell
types, along with cellular maturation; proliferation and survival (9) (10).
GATA4 encodes a transcriptional activator that plays a key role in cardiac development. It is
expressed in adult heart and during embryonic development it is expressed from E7.5
(formation of first heart field) until E10.5 (when the four-chambered heart is formed) (11).
GATA5 is required during cardiovascular development and is known for playing an important
role in smooth muscle cell diversity. Regarding GATA6, it is expressed during early
embryogenesis and localizes to endo- and mesodermally derived cells during later
embryogenesis, around E13.5 (12) (13) (14). Other than the heart it also plays an important role
in gut and lung development. Highest levels of expression were seen in smooth muscle cells of
the aorta and pulmonary artery, but also in atrial and ventricular myocardium (12).
TBX5 plays a role in heart development and specification of limb identity. It encodes a DNA-
binding protein that regulates the transcription of several genes and is involved in heart
development and limb pattern formation. TBX5 is expressed in the embryonic heart from E8,
when the cardiac crescent migrates to form the linear heart tube, to E10.5, when the four-
chambered heart is formed (7). TBX20 is present in the cardiac progenitor differentiation
pathway and heart development. It plays a role in endoderm formation and branching involved
in blood vessel morphogenesis (15) (16).
These five transcription factors act interactively and collaboratively in cardiac development. This
regulatory network of transcription factors controls the responses to intrinsic, and extrinsic
inductive factors, which establish patterns, and guide morphogenesis (17).
1.2 Fibroblasts
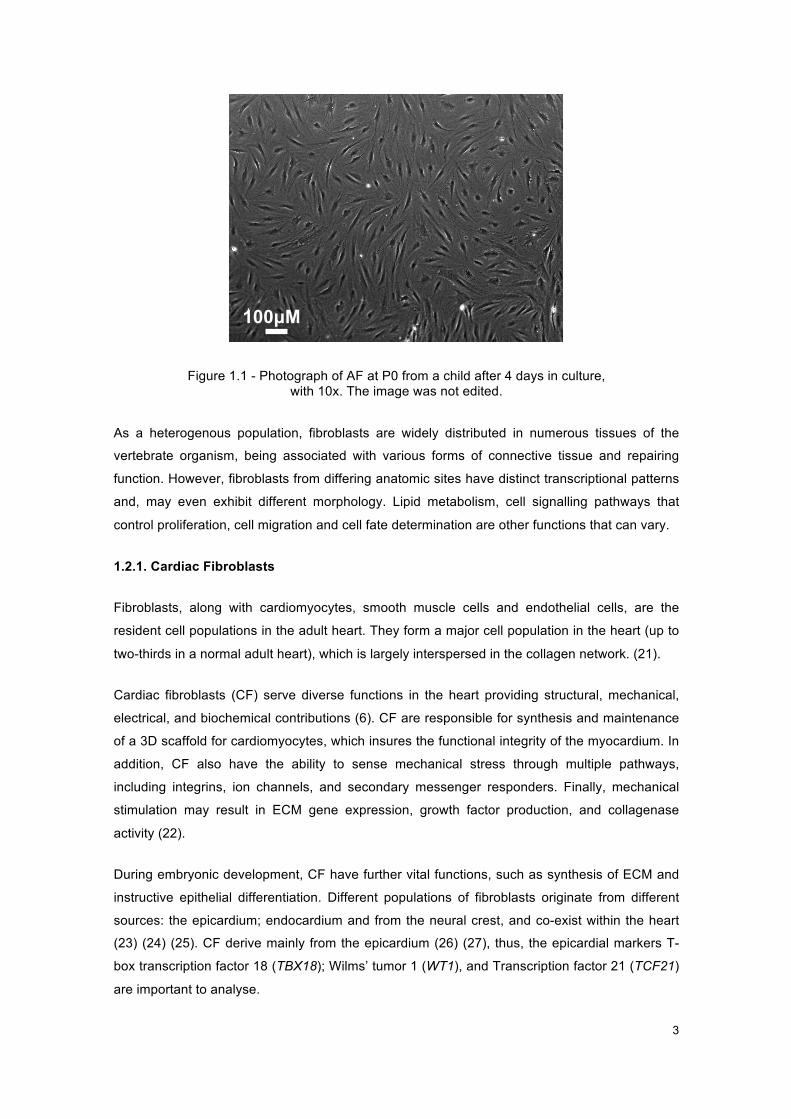
Fibroblasts are typically identified by their spindle-shaped flattened morphology and ability to
adhere to culture plates, as seen in figure 1.1. Fibroblasts synthesize most of the extra cellular
matrix (ECM) of connective tissue (fibrillar collagens and fibronectin). Their nuclei are large and
euchromatic and, possess prominent nucleoli. Fibroblasts are characterized as being
nonvascular, non-epithelial, and non-inflammatory cells (18). Other than their main function,
structural, these cells are also known for their part in inflammation regulation, and wound
healing (19) (20).
3
Figure 1.1 - Photograph of AF at P0 from a child after 4 days in culture, with 10x. The image was not edited.
As a heterogenous population, fibroblasts are widely distributed in numerous tissues of the
vertebrate organism, being associated with various forms of connective tissue and repairing
function. However, fibroblasts from differing anatomic sites have distinct transcriptional patterns
and, may even exhibit different morphology. Lipid metabolism, cell signalling pathways that
control proliferation, cell migration and cell fate determination are other functions that can vary.
1.2.1. Cardiac Fibroblasts
Fibroblasts, along with cardiomyocytes, smooth muscle cells and endothelial cells, are the
resident cell populations in the adult heart. They form a major cell population in the heart (up to
two-thirds in a normal adult heart), which is largely interspersed in the collagen network. (21).
Cardiac fibroblasts (CF) serve diverse functions in the heart providing structural, mechanical,
electrical, and biochemical contributions (6). CF are responsible for synthesis and maintenance
of a 3D scaffold for cardiomyocytes, which insures the functional integrity of the myocardium. In
addition, CF also have the ability to sense mechanical stress through multiple pathways,
including integrins, ion channels, and secondary messenger responders. Finally, mechanical
stimulation may result in ECM gene expression, growth factor production, and collagenase
activity (22).
During embryonic development, CF have further vital functions, such as synthesis of ECM and
instructive epithelial differentiation. Different populations of fibroblasts originate from different
sources: the epicardium; endocardium and from the neural crest, and co-exist within the heart
(23) (24) (25). CF derive mainly from the epicardium (26) (27), thus, the epicardial markers T-
box transcription factor 18 (TBX18); Wilms’ tumor 1 (WT1), and Transcription factor 21 (TCF21)
are important to analyse.
100µM
4
TBX18 gene codes for a member of a family of transcription factors that plays a crucial role in
embryonic development (28). It is expressed in epicardium. In the heart, it contributes to
formation of the sinus horn myocardium at the venous pole of the heart (29). In adults, TBX18 is
found in differentiated smooth muscle of the coronary vessels; including the coronary arteries,
and in some coronary vascular smooth muscle cells development (28).
The zinc finger transcription factor encoded by the WT1 carries a mutation in Wilm’s tumor
patients, cancer of the kidneys that usually affects children and rarely adults. This gene is
expressed in epicardium, among other locations in the heart and kidney (25).
Transcription factor 21 is a member of the class basic helix-loop-helix (bHLH) family of
transcription factors that manage cell-fate specification. It promotes cardiac fibroblasts identity
and persists in differentiated cardiac interstitial and adventitial fibroblasts in the postnatal and
adult heart. TCF21 is mainly required for epicardial development and fibroblast lineage. Besides
the epicardium, it is expressed in kidney, lung and reproductive tract (27) (30).
As for the endothelial lineage; most mesenchymal cells are derived from endothelial-to-
mesenchymal transition (EMT) of a subset of endocardial cells, making this a compelling
candidate for the source for the endothelially derived fibroblasts in myocardium (23). Markers
such as Cluster of Differentiation 105 (CD105) (an endothelial marker), Platelet-derived growth
factor receptor α (PDGRFA) and Periostin (POSTN) (both mesenchymal markers) are important
for endothelial/mesenchymal lineage.
Indeed, the Endoglin gene, CD105, encodes a homodimeric transmembrane glycoprotein of the
vascular endothelium involved in angiogenesis and regulation of endothelial cell proliferation
(31) (32). In an immunohistochemical study, CD105 is expressed in the human foetal heart at
the 9th (in endocardium) and 10th week (in epicardial and myocardial vessels), throughout
gestation, and postnatally. This embryonic human heart development stage would correspond
to E14.5 of the mouse (33). Mutation of CD105 causes hereditary hemorrhagic telangiectasia,
an autosomal dominant inherited vascular dysplasia (34).
Tyrosine kinase receptor PDGRFA is a mesenchymal marker involved in the arrangement and
development of the cardiovascular system. The fact that fibroblast main function is structural,
synthesising most of the extra cellular matrix of connective tissue, PDGRFA comprehensively
marks fibroblasts generally, as it found to stimulate collagen synthesis (35). Other than cardiac
fibroblasts, in normal heart, it also marks smooth muscle cells and cardiomyocytes. (23).
POSTN, codes a TGFβ superfamily-responsive matricellular protein, which is secreted
throughout cardiovascular morphogenesis and postnatal cardiac homeostasis. It is required for
maturation and extracellular matrix stabilization of noncardiomyocyte lineages of the heart (36).
It is expressed in the periosteum and periodontal ligament, injured vessels, metastatic cancer

5
cells, and in cells undergoing EMT. It is used to mark CF population but, since it is an
extracellular protein, it has limitations in fibroblast labelling by means of antibodies (22). It is
expressed in small part of adult heart (6).
1.2.2. Fibroblasts Markers
CF have been extensively studied in respect to their origin, to determine when and where
distinct fibroblasts are generated, their lineage, and how they move to the final position in the
heart. For this, it is crucial to adjust cell-staining techniques to identify fibroblasts. In the late 19th
century, fibroblasts would be identified only by their structure. Nowadays immunostaining also
allows identification of fibroblasts, and lineage tracing permits the divination of the path of origin
of a specific fibroblast, thus permitting the understanding of CF lineages, above mentioned (37).
There are several fibroblast markers, however none is exclusive or expressed by all types of
fibroblasts. The lack of specific fibroblasts markers is one of the main problems concerning the
study and purification of these cells. Nevertheless, Cluster of Differentiation 90 (CD90),
Discoidin domain receptor 2 (DDR2) and Vimentin (VIM) have been analysed.
CD90, or Thymocyte antigen 1 (Thy-1), codes a cell surface membrane glycoprotein. It is known
to label subsets of fibroblasts as well as immune and endothelial lineages (6) (23). It is also
involved in the biological process of angiogenesis, and expressed mainly in smooth muscle
cells.
DDR2 encodes a tyrosine kinase receptor protein (38). Representing a cell surface receptor
(39), it is used to mark fibroblasts; however, it only identifies subsets of fibroblasts (22).
Nevertheless, DDR2 is also expressed by smooth muscle cells, epithelial cells, and bone
marrow-derived cells (39).
The intermediate filament protein coding gene, VIM, is part of the cytoskeleton. It is mostly used
to label cardiac fibroblasts, but it also labels endothelial, immune system cells, and
mesenchymal-derived cells (38). However, the staining is mostly comprehensive, i.e. all CF are
marked positive (6).
1.3 Heart Disease
Cardiac disease is nowadays a worldwide public health problem. Therefore, the study of the
heart and the mechanisms during development are very important to potentially develop
treatment and prevention therapies. A major part of this condition comprises acquired heart
disease, which develop during life and is manifested in adults. In contrast, precocious
congenital heart disease affects the embryonic development, leading to major and severe

6
cardiac malformations. In many cases the aetiology of congenital heart disease remains largely
unknown.
1.3.1 Congenital Heart Disease
The heart is the first functional organ during embryogenesis. Unfortunately, approximately 4 to
14 per 1.000 live births are diagnosed with congenital heart disease (CHD), a condition, in
which malformations of the heart anatomy occur disturbing the circulatory system. The
underlying malformations range from small atrial or ventricular septal defects to highly complex
malformations, resulting in serious hemodynamic changes. Hypoplastic left heart syndrome
(HLHS) and Tetralogy of Fallot are major and most severe clinical malformations (40).
CHD is the most common birth defect as it is estimated that 2% of live births have it (41).
Furthermore, the incidence of this disease may be more than 10 times greater in nonviable
embryos (i.e., spontaneously aborted foetuses or still-births) and these malformations contribute
to advanced heart failure in the paediatric and adult population (1), (41) (42) (43).
Regarding aetiology and pathogenesis; 90% of cases are unknown and in the 10% of cases the
environmental and genetic factors may lead to CHD. There are single gene mutations,
chromosomal deletion or additions and single gene mutations that affect proteins of
transcription factors.
The diagnosed CHDs in this project are presented in the following paragraphs.
HYPOPLASTIC LEFT HEART SYNDROME
HLHS results from a defective development by a stenotic or atretic aortic and/or mitral valve, a
high-grade hypoplasia of the ascending aorta and a highly hypoplastic or even completely
missing left ventricle. Because of the abnormal circulation, the ductus arteriosus and foramen
ovale are patent and the right atrium, right ventricle, and pulmonary artery are enlarged. Until
recently, HLHS was a uniformly fatal pathologic condition (40).
Severe atrial septal leads to obstruction to left ventricular outflow, causing hypoplasia of the left
ventricle and ascending aorta.
HLHS can be caused by mutation in the Gap Junction Protein, Alpha-1 gene (GJA1) gene and
in the NK2 Homeobox 5 gene (NKX2-5) gene. This last gene is essential in cardiac
development and its mutation causes various congenital heart malformations. Cardiac
expression of NKX2-5 continues throughout development and into adult life (44). However, this
gene interacts with the genes GATA4, TBX5 and TBX20 (45), (46), (47), (17).

7
CO-ARCTATION OF THE AORTA
The aortic co-arctation (CoA) is an obstructive congenital anomaly described by the narrowing
of part of the aorta causing obstruction of blood flow to the body. The obstruction of the left
ventricular outflow results in pressure hypertrophy of the left ventricle.
No particular gene has been directly associated with this clinical diagnosis.
ATRIAL SEPTAL DEFECT
ASD I (Atrial Septal Defect Primum), consists of a cardiac septal defect. It occurs less than 10%
of ASD cases and is next to AV valves, mitral cleft. ASD has some variations, which can be
distinguished by its clinical synopsis.
ASD II (Atrial Septal Defect secundum type), for instance is described clinically when the
patient exhibits (beyond the atrial septal defect) pulmonary valve thickening or stenosis and, in
some patients, even ventricular septal defects and atrioventricular septal defect. In comparison
to ASDI it usually occurs 90% of ASD cases and is distinguished by a defective fossa ovalis.
This variation is known to be caused by a mutation in the GATA4 gene. (48) (49) (50) (51)
ASD has other variations (52), like ASD4 and ASD9 are caused by mutation in the TBX20 (53)
and GATA6 gene (54), respectively. There is no description of clinical synopsis for ASD4, but
characteristics of ASD9 consist of atrial septal defect, ostium secundum type and in some
patients: tricuspid valve disease; pulmonary valve disease and pulmonary artery hypertension.
COMPLETE ATRIOVENTRICULAR SEPTAL DEFECT
The term 'atrioventricular septal defect' (AVSD) covers a spectrum of congenital heart
malformations characterized by a common atrioventricular junction coexisting with deficient
atrioventricular septation. In ostium primum atrial septal defect (ASD) there are separate
atrioventricular valvar orifices despite a common junction, whereas in complete AVSD (CAVSD)
the valve itself is also shared (55).
The 2 syndromes most frequently associated with AVSD are Down syndrome, in which AVSD is
the most frequent congenital heart defect, and Ivemark syndrome (56). Other variations like
AVSD4, which is caused by mutation in the GATA4 gene (57) (58), and AVSD5 caused by
mutation in the GATA6 gene (12), are not rare.
8
1.3.2. Heart Disease in Adults
Cardiovascular diseases (CVDs) are a group of disorders of the heart and blood vessels. CVDs
are the number 1 cause of death globally: more people die annually from CVDs than from any
other cause (59).
In adults, coronary heart disease is a type of cardiovascular disease that affects the blood
vessels supplying the heart muscle, causing myocardial ischemia, due to reduction in the
coronary blood flow, as a result of obstructive atherosclerosis in the coronary artery. Aorto-
coronary Vein Bypass (ACVB) consists of the establishment of a bypass by using veins from the
aorta to the coronary vessels (59).
Valvular heart disease consists of the malfunctioning of a valve in the heart. Aortic Valve
Replacement (AVR), consists in the replacement of the aortic valve in case of stenosis or
regurgitation. As for Mitral Valve Repair (MVR), it consists in the repair of the mitral valve also in
case of stenosis or regurgitation. This clinical diagnosis, in the case of mitral prolapse, is
associated with connective tissue disorders like Marfan syndrome (autosomal dominant) (59).
In adults, there is a weak contribution that genes may have in heart diseases, since a somatic
cause is more expected. However, they may be used as an indicative. Age, the medication
history, and clinical history (risk factors like smoking, obesity or lack of exercise, poor diet and
excessive alcohol consumption) are the main responsible factors of these diseases.
1.4 Scope
The main objective of this project is to identify the expression patterns of primary CF from
children and adults. Relative gene expression patterns are also compared between culture
passages at time zero and after two passages with the purpose to see whether if culture
conditions would change the gene expression profile.
Cardiac samples were collected, from adult patients, suffering from coronary and valvular heart
disease, and from children suffering from congenital heart disease (Figure 1.2). Control
fibroblasts, from adipose tissue of the same patient, were used as a reference. These cells were
cultured for two passages. Gene expression of passage zero (P0) and passage two (P2) was
evaluated by reverse transcriptase quantitative polymerase chain reaction (RT-qPCR) and
subsequently subjected to data analysis. The gene expression was compared between cardiac
and adipose-derived fibroblasts. In addition, the results were analysed according to the age,
different cell passages and diagnosis. Cultured fibroblasts of passage one (P1) were used for

9
extra staining assays, immunocytochemical (ICC) and immunohistochemical (IHC), to confirm
the analysis of fibroblasts only and not of other cells.
Genes that are relevant during cardiac development were used in this work. Besides those
genes, some fibroblast markers were also included.
Figure 1.2 - Experimental procedure representation
Abbreviations: P0, passage zero; P1, passage one; P2, passage two; ICC,
immunocytochemical staining; IHC, immunohistochemical staining; RNA, ribonucleic acid;
cDNA, complementary deoxyribonucleic acid; RT-qPCR, quantitative reverse transcriptase
polymerase chain reaction.

10
This page was intentionally left blank

11
2. MATERIALS
A list of all the materials used in this work such as chemicals and reagents, equipment, kits,
produced medium, produced solutions is presented in the next sections.
2.1. Chemicals and Reagents
The tables containing the consumables, primers and software, were displaced to Attachment A
– “List of consumables, software and used primers”.
All chemicals and reagents used in this work are listed in table 2.1.
Table 2-1 - Chemicals and reagents Designation Item number Manufacturer Bovine Serum Albumin (BSA) B14 Thermo Scientific
DMEM (4,5g/l Glucose, with L-Glu (stable)) FG-0435 Merck Millipore
EDTA (0,5M) CN06.2 Carl Roth GmbH & Co. KG Ethanol (>99,8%) K928.1 Carl Roth GmbH & Co. KG Fetal Bovin Serum (FCS) (ESC-qualified) 10270-106 Invitrogen
GeneRuler 50bp DNA Ladder (0,5µg/µl) SM0371 Thermo Scientific
H2O (double distilled) R91051 H. Kerndl GmbH PeqGold Universal Agarose Powder 35-1020 Peqlab
Trypsin/EDTA- solution (0,25%) 25200-056 Life Technologies
Dithiothreitol (DTT) (0,1M) P/N Y00147 Invitrogen DNA Loading buffer (6x) R0611 Fermentas dNTPs (10mM) R0181 MBI Fermentas First strand buffer (5x) P/N Y02321 Invitrogen Collagenase Type2 LS004176 Worthington L-ascorbic acid -2 – phosphate (5g) A8960 Sigma Aldricht
M-MLV Reverse Transcriptase (200U/µl) 28025-013 Invitrogen
Sodium pyruvate (100mM) 11360-039 Life Technologies Random hexamer Primers (250ng/µl) 48190-011 Invitrogen
SybrGreen Quantitect 204145 Qiagen Tris (99%) T 6066 Sigma Aldrich

12
2.2. Equipment
Next, table 2.2 follows listing all the equipment used in the lab.
Table 2-2 - Equipment Device Manufacturer Analytical Balance EW600-2M Kern & Sohn GmbH CO2-Incubator AutoFlow CO2 Water Jacket (37°C, 5% CO2) NuAire
Battery powered pipette filler- Pipetus Hirschmann Fluorescencemicroscope Axiovert 200M ZEISS Electrophoresis Gel Device - Power Supply Gel Bio-Rad
Gel Imaging System – ChemDoc XR Bio-Rad Gel Chambers (50ml, 150ml) Bio-Rad Fridge 4°C Liebherr Fridge -20°C Liebherr Fridge -80°C Thermo Scientific Hemocytometer Carl Roth GmbH & Co. KG Microwave MW 7849 900W Severin NanoDrop 2000 Spectrophotometer Thermo Scientific Pipetes (various) Eppendorf Research Safety workbench Class II NuAire Thermomixer comfort Eppendorf Thermocycler C1000 BIO-RAD Table Centrifuge 5417R Eppendorf Vortex device Scientific Industries Water bath (37°C) Memmert Medium bench centrifuge – Heraeus Megafuge 2.0R Thermo
ABI PRISM 7000 Applied Biosystems Cryostat Leica CM1850 Leica Biosystems Precellys® 24 Peqlab
13
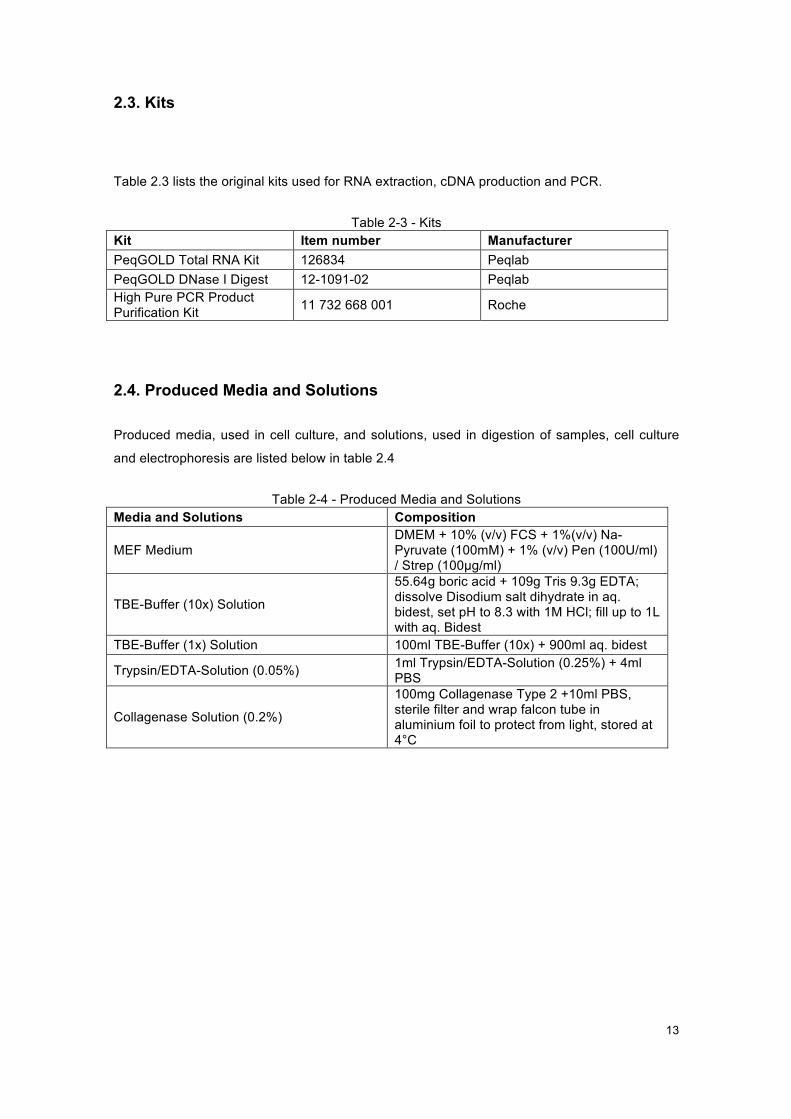
2.3. Kits
Table 2.3 lists the original kits used for RNA extraction, cDNA production and PCR.
Table 2-3 - Kits Kit Item number Manufacturer PeqGOLD Total RNA Kit 126834 Peqlab PeqGOLD DNase I Digest 12-1091-02 Peqlab High Pure PCR Product Purification Kit 11 732 668 001 Roche
2.4. Produced Media and Solutions
Produced media, used in cell culture, and solutions, used in digestion of samples, cell culture
and electrophoresis are listed below in table 2.4
Table 2-4 - Produced Media and Solutions Media and Solutions Composition
MEF Medium DMEM + 10% (v/v) FCS + 1%(v/v) Na-Pyruvate (100mM) + 1% (v/v) Pen (100U/ml) / Strep (100µg/ml)
TBE-Buffer (10x) Solution
55.64g boric acid + 109g Tris 9.3g EDTA; dissolve Disodium salt dihydrate in aq. bidest, set pH to 8.3 with 1M HCl; fill up to 1L with aq. Bidest
TBE-Buffer (1x) Solution 100ml TBE-Buffer (10x) + 900ml aq. bidest
Trypsin/EDTA-Solution (0.05%) 1ml Trypsin/EDTA-Solution (0.25%) + 4ml PBS
Collagenase Solution (0.2%)
100mg Collagenase Type 2 +10ml PBS, sterile filter and wrap falcon tube in aluminium foil to protect from light, stored at 4°C

14
2.5. Antibodies and Serum Used
A list of the serum and antibodies used in Immunocytochemistry (ICC) and
Immunohistochemistry (IHC) staining assays are listed below in table 2.5. Dilution used is also
presented as well as the fluorescence of the 2nd antibody, Alexa Fluor 555 and Alexa Fluor 488,
corresponding to red and green respectively.
Table 2-5 - Antibodies and serum used
Staining Antibody Manufacturer, number Dilution Fluorescence
ICC
1st Anti-Vimentin: rabbit polyclonal IgG
Abcam ab45939
1:500 -
1st Anti-DDR2: rabbit polyclonal IgG
LSBio, LS-C99151
1:10 -
2nd Goat anti rabbit IgG Abcam ab150078
1:500 Alexa Fluor 555
IHC
1st Anti-α-Actinin: mouse monoclonal sarcomere
antibody
Abcam, ab9465
1:100 -
2nd Goat anti mouse IgG Abcam, ab150114
1:500 Alexa Fluor 555
1st Anti-Vimentin: rabbit polyclonal IgG
Abcam ab45939
1:500 -
1st Anti-DDR2: rabbit polyclonal IgG
LSBio, LS-C99151
1:50 -
2nd Goat anti rabbit IgG Abcam ab150078
1:500 Alexa Fluor 488
Staining Serum Dilution Fluorescence ICC/IHC - Goat Serum Abcam - -
2.6. Biological material
All donors have signed an informed consent and the procedure was approved by the local
ethical committee of the medical faculty of the Technical University of Munich.
15
3. METHODS
3.1. Establishment of primary cardiac and adipose fibroblast cultures
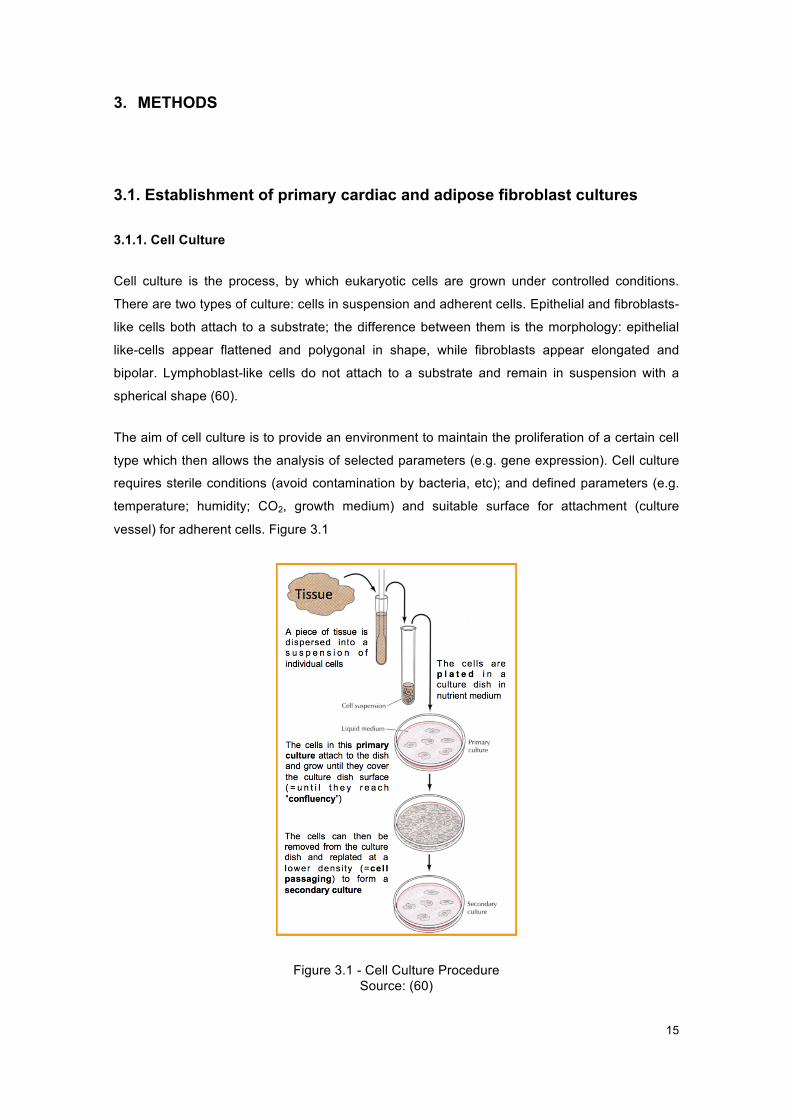
3.1.1. Cell Culture
Cell culture is the process, by which eukaryotic cells are grown under controlled conditions.
There are two types of culture: cells in suspension and adherent cells. Epithelial and fibroblasts-
like cells both attach to a substrate; the difference between them is the morphology: epithelial
like-cells appear flattened and polygonal in shape, while fibroblasts appear elongated and
bipolar. Lymphoblast-like cells do not attach to a substrate and remain in suspension with a
spherical shape (60).
The aim of cell culture is to provide an environment to maintain the proliferation of a certain cell
type which then allows the analysis of selected parameters (e.g. gene expression). Cell culture
requires sterile conditions (avoid contamination by bacteria, etc); and defined parameters (e.g.
temperature; humidity; CO2, growth medium) and suitable surface for attachment (culture
vessel) for adherent cells. Figure 3.1
Figure 3.1 - Cell Culture Procedure Source: (60)

16
Regarding the sterile conditions, all work is done in a laminar flow. Cultures are incubated (with
defined temperature, gas mixture and humidity level, usually: 37ºC; 5% CO2 in air and more
than 95% humidity, with these last two helping stabilizing pH).
Cell culture media, chemically defined, have a neutral pH (7.2-7.4), contain essential amino
acids, vitamins, inorganic salts, and glucose, among others. The most commonly used media
are Dulbecco’s Modified Eagle Media (DMEM) and Roswell Park Memorial Institute Medium
(RPMI). Usually they are supplemented with antibiotics (penicillin, streptomycin, etc.) to inhibit
the growth of contaminants. Media are sterile and stored at 4ºC.
Cell culture vessels used for fibroblasts culture (adherent cells) are T-flasks (T-25, T-75 - the
number indicates cm2 of surface area) and multiwell plates, which come in various sizes. The
ones used in this project are 12-well plates (60).
Cell cultures from 5 children and 5 adults with congenital or acquired coronary and valvular
heart disease were established. The surgical intervention or the type of diagnosis of each
patient is listed in table 3.1. Right atrium (RA) was the type of cardiac tissue harvested for all
patients, except for one adult patient with the MVR diagnosis, whose cardiac tissue harvested
and analysed was left atrium (LA).
Table 3-1 - List of the diagnosis of the collected samples
Age Group Patient Intervention/Diagnosis Cardiac Tissue
Children
1 Coarctation of Aorta (CoA) RA 2 Complete Atrium Ventricle Septum Defect (CAVSD) RA 3 Atrium Septum Defect (ASD) RA 4 Hypoplastic Left Heart Syndrome (HLHS) RA 5 Atrium Septum Defect Secundum (ASDII) RA
Adults
6 Aortic Valve Replacement (AVR) RA 7 Aortic Valve Replacement (AVR) RA 8 Mitral Valve Repair (MVR) LA 9 Aorto-coronary Vein Bypass (ACVB) RA
10 Mitral Valve Repair (MVR) RA
3.1.2. Protocol used
Human cardiac biopsies or subcutaneous adipose tissue are transferred on ice from the
operating room to the lab in phosphate-buffered saline (PBS). The sample is cut into small
fragments (approx. 1mm3) using scalpels. A small part of the sample is snap frozen in liquid
nitrogen and kept at -80ºC. This will serve as a tissue control. The remaining tissue is digested
with 0.2% collagenase II in PBS for approximately 1h with vigorous shaking at 37ºC.

17
Optionally, the digested tissues may be filtered through a 70µm filter to remove larger
undigested pieces. Cells are centrifuged for 10min at 300xg and resuspended in MEF Medium
(DMEM high glucose, 1% sodium-pyruvate, 10% FCS and 1% Pen/Strep). Depending on the
size, the cells are distributed into a T25 flask or in 3 wells of a 12-well plate in the same
medium. T-flasks and multiwell plates were labeled with project name (fibroblasts project), and
patient number (differing samples from children and adults, and cardiac and adipose tissue).
Date of seeding is also present, as well as passage number. Dates of medium changing and
passaging were noted.
After overnight incubation, fibroblasts should have attached to the plastic surface. To get rid of
cellular debris and non-attached cells the wells are then washed and receive fresh medium.
After 5 to 7 days, P0 cultures should present the typical fibroblast morphology and are ready for
the next culture passages, namely the P1 to be used for downstream experiments and P2 for
further procedures.
All cell culture work was done under sterile conditions in the laminar flow. Unsterile solutions
were filtered; material and devices were sprayed with 70% (v/v) ethanol before use. Cells are
incubated at 37°C and 5% (v/v) CO2 in a atmosphere with circa 95% (v/v) of humidity.
3.1.3. Cell passaging
Cell lines cannot be kept in culture indefinitely due to the gradual rise in toxic metabolites, use
of nutrients limitation and increase in cell number (avoid inhibition due to contact). The aim is to
keep the cells actively and healthily growing and expand the number of cells, which leads to the
necessity to subculture at regular intervals (cell passaging). For adherent cells, it involves
breaking the bonds or cellular ‘glue’ that attaches the cells to the substrate and to each other.
The use of proteolytic enzymes, like trypsin, breaks down proteins that facilitate adhesion.
When the fibroblasts reach 80% confluence (referring to the proportion of the surface of the
flask, which is covered by cells, usually cells are cultured only until 80% confluence, and not
100%, to avoid contact inhibition), medium is aspirated and the plate wells are washed with
sterile phosphate-buffered saline (PBS). This PBS pre-rinse step is made, due some confluent
cultures being more difficult to detach. Thus, it will remove the serum, which neutralizes the
action of the trypsin, from the well. Cells were detached from the plastic with Trypsin (1:4,
Trypsin/EDTA: PBS), as it stripped proteins from the cell surface, after a 5-minute incubation at
37ºC (trypsin’s operating temperature). Incubation time and concentration were chosen
carefully, as incubating cells (with too high a trypsin concentration) for too long will damage cell
membranes and kill the cells. After inspecting cells under the microscope, and making some
they are already detached, trypsinized cells, with a round shape, as they now are suspended,
were pipetted to a 15mL falcon tube. Trypsin strips proteins from the cell surface and will

18
continue to act as a proteinase until an inhibitor, such as serum, neutralizes it, thus MEF
medium was added, inactivating trypsin, due to the FCS content. Afterwards cells were
centrifuged for 5 min at 1500 rpm. The supernatant was aspirated and the cells were
resuspended with MEF medium.
Cells were distributed in 3 new wells in a 12-well plate, designated passage one. These cells
were again passaged and grown to 80% confluence (passage two, P2).
3.2. RNA Extraction
RNA extraction consists on the purification of RNA from biological samples, and is used to
generate complementary DNA (cDNA), and afterwards amplify this cDNA with primers, specific
for the gene of interest in quantitative Reverse Transcriptase Polymerase Chain Reaction (RT-
qPCR).
However, why chose this technique, when DNA can be purified and amplified with quantitative
Polymerase Chain Reaction (qPCR), saving work? In order to distinguish a few particular genes
of interest, among all other coding and non-coding sequences, which are sitting in the nucleus,
the only one possible way is to follow the messenger RNA (mRNA), corresponding to the genes
of interest. When extracting a particular mRNA, its corresponding gene is being expressed (or
productive) in the moment of extraction. The coding DNA is present in all nucleated cells,
whereas the coding mRNA is expressed only in those cells that are actively synthesizing the
protein. Therefore, if interested only in the cells that are active, i.e. expressing the RNA, RNA
extraction has to be accomplished.
The RNA extraction was performed with the peqGOLD Total RNA Kit (Peqlab). For the cultured
fibroblast, medium was aspirated and 400µL of RNA Lysis buffer were added directly to the
confluent cells. The culture surface was rinsed multiple times with the lysis buffer to capture as
many cells as possible. The lysate was collected with a pipette and added to a 1.5mL
Eppendorf tube. The lysates were promptly stored at -20°C until further use.
Regarding the tissue control, samples were retrieved from -80ºC on dry ice. Samples were
transferred to 2 mL tubes with 1.4mm ceramic (zirconium oxide) beads, designed for soft tissue
homogenization, which were put on ice. 400µL of the previously used RNA Lysis are buffer is
added. Lysates placed in the Precellys® 24, piece of benchtop equipment dedicated to the
grinding, lysis, and homogenization of biological samples. With 3D speed and motion, the beads
crush the biological sample to release the desired RNA. The settings parameters were
6500rpm-2x20-005; (velocity - 6500rpm; number of digestion intervals -2; duration of digestion
19
intervals – 20s and the pauses between digestion intervals – 005s). After homogenization, the
tubes were put on ice until RNA extraction.
RNA isolation from fibroblasts samples and tissue samples, was performed accordingly to the
manufacturer’s instructions, (PeqGOLD Total RNA Kit, #126834).
The lysate was transferred into a DNA removing column, placed in a 2ml tube. After 1min
centrifugation at 10,700rpm at room temperature, it was transferred to a new 1.5ml tube. An
equal volume (400μl) 70% Ethanol was added to the lysate and mixed by vortexing, preventing
hydrolysis of the RNA. A RNA binding column was placed in a new 2ml tube. The lysate was
added directly to the membrane of the column. It was centrifuged at 10,700rpm for 1min and the
tube containing the flow-through liquid was discarded. In the first washing step, the RNA binding
column was placed in a new 2ml tube. 500μl of RNA wash buffer I was added, and the lysate
was centrifuged at 10,700rpm for 15sec.The flow-through liquid was discarded, but the tube
was reused. DNase digestion step followed, to remove DNA. A 75μL reaction mix for each
column was prepare, containing 73.5μL of DNase I Digestion Buffer and 1.5 μL of RNase-free
DNase I (20 Kunitz units/μl). The DNase digestion reaction mix, was added to the column,
directly onto the membrane. After a 15min incubation at room temperature, the columns were
placed into a new 2ml tube. 400μl RNA Wash Buffer I was added and a 5min incubation at
benchtop followed. After a 15sec centrifugation at 10,700rpm, the flow-through was discarded.
In the second washing step, 600μl of completed RNA wash buffer II was added and the column
was centrifuged for 15sec at 10,700rpm. The flow-through liquid was discarded and the step
was repeated, discarding again the low-through liquid. In the drying step, the column was
centrifuged at 10,700rpm for 2min. Finally, in the elution step, the last step, the column was
placed into a new 1.5ml tube. 50μL of sterile RNase-free dH20 (DEPC-water) were added
directly to the membrane of the column and it was centrifuged for 1min for 6,900rpm to elute
RNA.
After RNA extraction, purified samples are frozen at -20°C until further use.
.
3.3. cDNA synthesis
Complementary DNA (cDNA) is synthesized from purified RNA. It consists of a double-stranded
DNA synthesized from a single stranded purified RNA (mRNA) template in a reaction catalysed
by the enzyme reverse transcriptase.
Prior to reverse transcription, the RNA concentration must be measured at 260nm using the
NanoDrop 2000 Spectrophotometer.

20
Firstly 1.5µL random hexamer primers (250ng/µL), 1.5µL of deoxyribonucleotide triphosphates
(dNTPs) (10mM), 100ng RNA from sample are added to a tube which is filled up with RNase-
free water to a final volume of 20.5µL. The mix is pipetted into a tube and briefly centrifuged.
The mixture is incubated for 5 min at 65°C and chilled on ice.
In the second step 6µL of first strand buffer (5x) and 3µL of DTT (100mM) are added, gently
mixed and incubated at 37°C for 2 min.
After cooling the mix down on ice for some minutes, 0.5 µL of the enzyme Moloney Murine
Leukemia Virus Reverse Transcriptase (M-MLV RT) (200 units) is added and mixed. The
mixture is incubated (10 min at 25°C), followed by a 50-min incubation at 37°C. Finally, the
enzyme is inactivated at 75°C for 10 min. The samples are frozen at -20°C until further use.
In table 3.2, a typical approach to produce cDNA is shown. The values for RNA and water are
not fixed (depend on the RNA concentration value). Thus, being X represented in the volume of
RNA per sample.
Table 3-2 - cDNA synthesis protocol.
Steps Reagents Volume per sample [µL]
Conditions Duration Temperature
1st step
RNA (100ng) X
5min 65°C
dNTPs (10mM) 1,5 Random Primers (250ng/µL)
1,5
DEPC Water *
2nd step First Strand Buffer (5x) 6
2min 37°C
DTT (100mM) 3
3rd step M-MLV RT (200U/µL) 1
10min 25°C 50min 37°C 15min 75°C
The volume of RNA per sample is denominated X as it depends on RNA concentration.
The RNA concentration will determine the volume of RNA per sample, in equation 3.1, and the
volume of diethyl pyrocarbonate (DEPC) water, used to inactivate RNase enzymes.
100𝑅𝑁𝐴𝑐𝑜𝑛𝑐𝑒𝑛𝑡𝑟𝑎𝑡𝑖𝑜𝑛𝑣𝑎𝑙𝑢𝑒
= 𝑅𝑁𝐴𝑣𝑜𝑙𝑢𝑚𝑒𝑝𝑒𝑟𝑠𝑎𝑚𝑝𝑙𝑒
Equation 3-1 - RNA Volume per sample
𝑅𝑁𝐴𝑣𝑜𝑙𝑢𝑚𝑒𝑝𝑒𝑟𝑠𝑎𝑚𝑝𝑙𝑒 + 𝐷𝐸𝑃𝐶𝑊𝑎𝑡𝑒𝑟𝑣𝑜𝑙𝑢𝑚𝑒𝑝𝑒𝑟𝑠𝑎𝑚𝑝𝑙𝑒 = 17.5µ𝐿

21
The sum of RNA and RNase-free water must be 17.5 µL. Thus, if the RNA concentration
measured is too low, the maximum volume added is 17.5 µL and no water is added.
3.4. Polymerase Chain Reaction
With the help of Polymerase Chain Reaction (PCR) it is possible to amplify specific DNA-
fragments. In this process, a DNA-polymerase synthesizes a new DNA strand complementary
to a single-stranded nucleic acid template, starting in the sequences where the primers will
specifically bind. Primers are oligonucleotides (small sequences of specific base-pairs) that
serve as starter molecules, which are complementary to parts of the templates and defining the
sections of the template that will be amplified. When they bind specifically to the original region
that will be synthesized, they allow the DNA-polymerase to start amplification, following a
sequence of three main steps: denaturation, annealing and polymerisation.
In denaturation, usually using high temperature, the separation of complementary molecules of
the DNA chain occurs. The next step is annealing occurring at a low temperature and allowing
the primers to bind to the specific regions that will give the order to start the following step,
polymerisation. This last step occurs at a specific temperature in order to allow the polymers to
make a copy of the template sequences (normal and complementary, 5’ and 3’), from the first
(forward) primer until the second (reverse) one.
This sequence of steps will be repeated several times, duplicating the material at the end of
each cycle. This means that after the first cycle, there will be two copies of the template
molecule, for the second cycles it will duplicate, making it four, for the third cycle it will make 8
and so on, progressing in an exponential manner (2x), where x represents the number of cycles
that will be performed. Each cycle will run for a specific time, accordingly to the protocol used.
This is the crucial principle of PCR, where the cyclic repetition of the reaction steps allows the
DNA-strand to be exponentially amplified.
3.5. Reverse Transcriptase - Quantitative Polymerase Chain Reaction (RT-qPCR) with SybrGreen
3.5.1. Principle of RT-qPCR
The expression of endogenous genes is verified and demonstrated through RT-qPCR using
cDNA as a template.
RT-qPCR is based on the principle that after each amplification cycle the fluorescence of the
sample is measured. The more cDNA is amplified, the stronger the fluorescence signal. The dye
SYBR Green intercalates with the double stranded cDNA and fluoresces. The signal rises
proportionally to the amount of cDNA in the sample.
22
Tissue samples were used as a control to differential gene expression. Cardiac, epicardial,
fibroblast and other genes, such as GATA4/5/6; TBX5/18/20; CD90/105; VIM; WT1; TCF21
DDR2; POSTN and PDGRFA were tested. The whole heart control gene expression is
presented in the results.
At the end of the program, quantification of the fluorescence signal is applied over the number
of cycles. The threshold value defines the number of cycles, after which the fluorescent signal
exceeds the background signal (i.e., the CT value). The threshold value was set to 0.2 in all
evaluations.
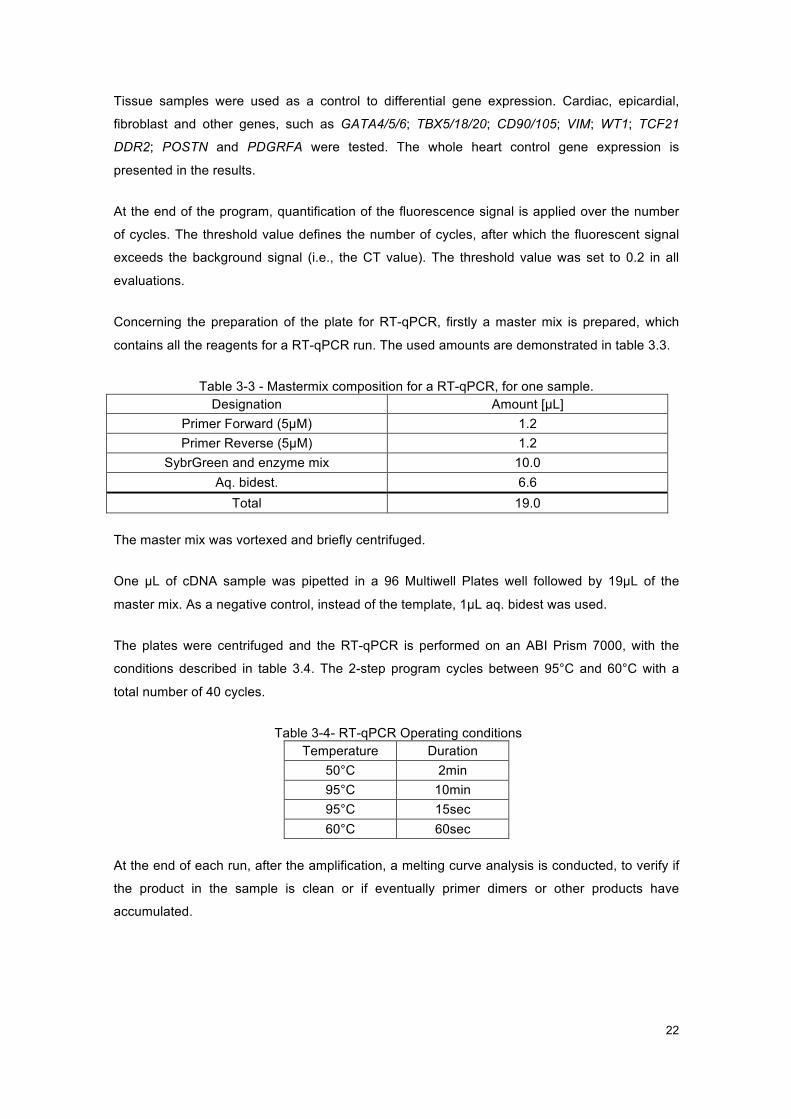
Concerning the preparation of the plate for RT-qPCR, firstly a master mix is prepared, which
contains all the reagents for a RT-qPCR run. The used amounts are demonstrated in table 3.3.
Table 3-3 - Mastermix composition for a RT-qPCR, for one sample. Designation Amount [µL]
Primer Forward (5µM) 1.2 Primer Reverse (5µM) 1.2
SybrGreen and enzyme mix 10.0 Aq. bidest. 6.6
Total 19.0
The master mix was vortexed and briefly centrifuged.
One µL of cDNA sample was pipetted in a 96 Multiwell Plates well followed by 19µL of the
master mix. As a negative control, instead of the template, 1µL aq. bidest was used.
The plates were centrifuged and the RT-qPCR is performed on an ABI Prism 7000, with the
conditions described in table 3.4. The 2-step program cycles between 95°C and 60°C with a
total number of 40 cycles.
Table 3-4- RT-qPCR Operating conditions Temperature Duration
50°C 2min 95°C 10min 95°C 15sec 60°C 60sec
At the end of each run, after the amplification, a melting curve analysis is conducted, to verify if
the product in the sample is clean or if eventually primer dimers or other products have
accumulated.

23
3.5.2. Quantification of RT-qPCR samples by means of Standard Curves
Regarding quantification of relative gene expression, in the respective RT-qPCR sample,
standard curves are generated for the target genes. Therefore, from a positive sample, which
contains the target gene, a dilution series is accomplished. The value of undiluted samples is
arbitrarily set to 106 arbitrary units (AU), the further log (10)-dilutions correspondingly less, as
presented on table 3.5.
Table 3-5 - Dilution series for a standard curve Sample Dilution Arbitrary Units (AU) per µL
1 Not diluted (1:1) 1x10⁶
2 1:10 1x10⁵ 3 1:100 1x10⁴ 4 1:1.000 1x10³ 5 1:10.000 1x10² 6 1:100.000 1x101 7 1:1.000.000 1x100
Each sample will be measured as a duplicate in the RT-qPCR. The standard curves result from
the Ct-values of the measured samples plotted against the logarithm of the arbitrary units.
From the slope and the intersection with the y-axis of the standard curve the relative number of
amplified PCR-products can be determined as indicated in equation 3.2.
𝐴𝑈 = 𝑒BCDEFCGHIGJCKLFMKCNODPQKI
IRLSG
Equation 3-2 - Amplified PCR-products
In attachment B, an example of a standard curve is exemplified for CD90 gene.
3.5.3. Normalisation with housekeeping gene b-Actin
Gene expression is the process by which information from a gene used in synthesis of a
functional gene product, often a protein. Some specific genes, for each cell type, have a
constant expression, designated housekeeping genes. Others are up-regulated (i.e. become
expressed, switched on, or productive) in particular cellular conditions - normal physiological
(development, aging, fertilization) or pathological (apoptosis, inflammation, mutations, etc).
Gene expression, of a gene of interest, is usually compared toward the expression (or
production) of a housekeeping gene, which is accepted as a constant.

24
For each sample, a RT-qPCR run was performed with primers specific for the β-Actin gene. β-
Actin is expressed more or less constantly to a certain level at any time in the cell; it is therefore
referred to as a housekeeping gene.
This β-Actin specific PCR allows to determine whether the sample contains amplifiable cDNA
and the values of β-Actin of the RT-qPCR run serve as reference to normalize the values of the
target genes.
This allows to compare different independent samples and to determine the relative frequency
of gene expression in the samples.
Subsequently, the relationship between the target genes and reference gene, and thus the
relative gene expression can be determined with the following equation 3.3.
𝑟𝑒𝑙𝑎𝑡𝑖𝑣𝑒𝑒𝑥𝑝𝑟𝑒𝑠𝑠𝑖𝑜𝑛 = 𝐴𝑈(𝑡𝑎𝑟𝑔𝑒𝑡𝑔𝑒𝑛𝑒)
𝐴𝑈(𝑟𝑒𝑓𝑒𝑟𝑒𝑛𝑐𝑒𝑔𝑒𝑛𝑒)
Equation 3-3 - Target Genes / Reference Genes
3.5.4. Agarose Gel Electrophoresis
The principle of gel electrophoresis consists in the migration of the DNA fragments through the
pores of the gel towards the anode, due to its negative charge, upon application of a voltage.
The size of the gel’s pores varies depending on agarose concentration. For a 3% agarose gel,
1,5g of agarose powder were weighed in an Erlenmeyer flask and heated with 50ml TBE-buffer
(1x) in the microwave, until dissolved completely.
Subsequently 10µL of ethidium bromide (EtBr) (500µg/ml) were added and mixed with the gel.
EtBr intercalates between the bases of DNA, which becomes visible under UV-light.
The liquid gel was poured in the gel chamber and incubated for 30min at RT, until the gel was
polymerized.
The samples applied to gel, were first mixed with 4µL Loading buffer (6x) and afterwards
pipetted into the wells of the solidified gel. Additionally, a molecular weight marker, which
consists of different DNA fragments of known size (50bp), was added to the gel.
The exact composition is listed in the table 3.6 below.
Table 3-6 - Composition List Designation Volume [µL] per well DNA molecular weight-marker (0.5µg/µl) 5µL Sample 20µL Loading buffer 4µL

25
The DNA-fragment separation was done at 120V and 400mA for 35min. The gel is
photographed under UV-light with the gel documentation device Molecular Imager Gel Doc XR
System.
3.5.5. Data Analysis
Some outliers and extreme values were not used due to a defected b-actin value measurement,
which ended up affecting all complementary lysates for that value. Regarding descriptive
statistics, all the collected data, (relative gene expression in relation to age, passage and cell
type) by means of an exploratory data analysis (determination of averages, standard deviations,
medians, 95% confidence intervals, extreme values), was examined and assessed.
Three main analysis were made. The first only compares the mean results of children and
adults, without any concern for the different pathologies (a heatmap is presented later in Figure
5.1). The second one takes into account the different diseases, being gene by gene analysis
(regarding AF vs. CF and P0 vs. P2), considering each result by itself (heatmaps are presented
in Figures 5.3, 5.4, 5.5 and 5.6) The third analysis does not consider any values. Instead, a ratio
calculus was performed, in order to understand if there is an increase or decrease of
expression, regarding AF vs. CF, P0 vs. P2 (for both tissues) and, children vs adults. Only the
last analysis is considered for this project. The first one was ruled out due to the pathology
(gene) influence, and the second one due to not being statistically viable.
3.6. Immunostaining
Immunostaining is used to detect the distribution and localization of specific proteins within
individual cells or tissues, by the use of specific antibodies (AB) to detect a single target protein.
Detection of antigens in cultured cells is referred to as immunocytochemistry (ICC), whereas
their detection in paraffin tissue sections is generally referred to as immunohistochemistry (IHC).
Both methods involve exposure of fixed cells or tissues to primary antibodies directed against
one or more proteins of interest. Bound antibodies are then detected using commercially
available secondary antibodies directed against the invariant heavy chain portion of the primary
antibody. Immunostaining is used in cell biology to study differential protein expression,
localization and distribution at the tissue, cellular, and subcellular level (41).
Antibodies are typically developed in mouse or rabbit and have high affinity for specific proteins.
Only specific antibodies may be used to detect the antigenic protein in fixed samples of animal
tissue and within fixed individual mammalian cells (61).

26
3.6.1. Immunocytochemistry
Cells were grown on gelatine-coated cover slips. They were fixed in ice-cold acetone at -20ºC,
for 15min and washed with PBS afterwards. Permeabilisation follows by adding 0.1% Triton-
X100 in PBS for 15min at RT. This step will open the pores of the cellular membrane allowing
the inside of the cell to be stained, as Vimentin binds inside the cell and only DDR2 binds to the
surface of the cell. Unspecific binding sites were blocked by incubation with 5% of goat serum
for 1h at room temperature. After 1h incubation at 37ºC with the first antibody (Anti-Vimentin
and Anti-DDR2) and a washing step, the secondary antibody (Goat anti rabbit) was added for
1h at room temperature in the dark. Thereafter, the cells were washed, air-dried and mounted in
a medium containing DAPI to stain the nuclei followed by analysis under a fluorescence
microscope.
3.6.2. Immunohistochemistry
Immunohistochemistry (IHC) is a common technique for morphological characterization. It
separates itself from ICC by detecting and analysing protein expression while maintaining the
composition, cellular characteristics and structure of native tissue. This process can be divided
in four steps: fixation, cryo embedding, cutting and staining.
Firstly, human cardiac tissue was transferred on ice from the operating room to the lab in PBS.
Tissues were fixed using paraformaldehyde to prevent degradation while preserving the
morphology of the specimen for 1h at RT by 4% PFA. After washing the sample 3 times with
PBS, it stayed overnight at 4°C in 30% Sucrose: OCT (2:1).
The sample was carefully (avoiding the formation of bubbles) cryo-embedded into OCT in an
embedding shape mould. This mould was on top of a metal tray, which had liquid nitrogen
underneath. After the OCT had turned white, the sample was removed from the mould and
placed on an appropriately labelled (sample number; date) Petri dish. The sample was stored
rapidly at -80°C until further use.
The slicing step follows. Firstly, the temperature was set to -20°C in the Cryostat Leica CM1850
device, since each tissue has a preferred temperature for processing, according to the device’s
manual. Heart tissue may be sectioned between -15°C and -25°C. The cryostat is a device with
a microtome, a slicer capable of slicing sections as thin as 1 µm, inside a freezer.
Cryocompound was applied to the specimen disc at room temperature and the sample was
positioned thereon. The specimen disc was frozen and placed back onto the device.
A glass cover slip was positioned at the end of the specimen disc and a precooled blade was
placed in the knife holder and clamped. The knife angle was adjusted as well as the thickness
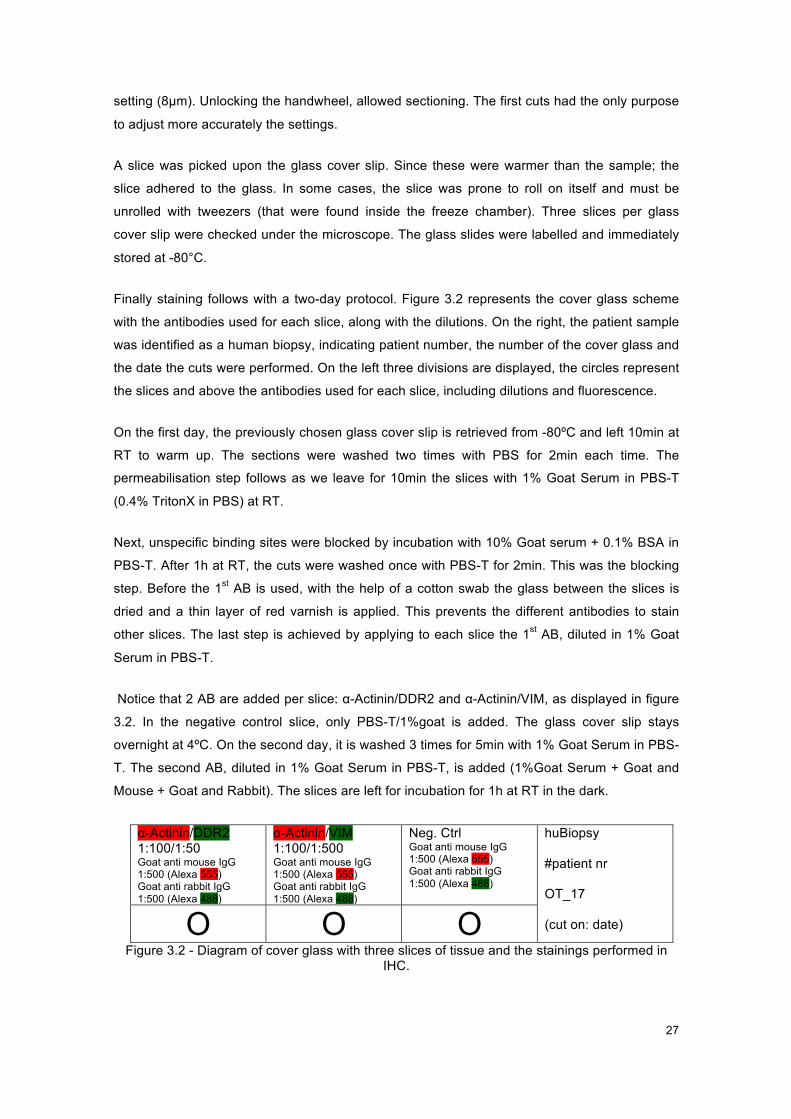
27
setting (8µm). Unlocking the handwheel, allowed sectioning. The first cuts had the only purpose
to adjust more accurately the settings.
A slice was picked upon the glass cover slip. Since these were warmer than the sample; the
slice adhered to the glass. In some cases, the slice was prone to roll on itself and must be
unrolled with tweezers (that were found inside the freeze chamber). Three slices per glass
cover slip were checked under the microscope. The glass slides were labelled and immediately
stored at -80°C.
Finally staining follows with a two-day protocol. Figure 3.2 represents the cover glass scheme
with the antibodies used for each slice, along with the dilutions. On the right, the patient sample
was identified as a human biopsy, indicating patient number, the number of the cover glass and
the date the cuts were performed. On the left three divisions are displayed, the circles represent
the slices and above the antibodies used for each slice, including dilutions and fluorescence.
On the first day, the previously chosen glass cover slip is retrieved from -80ºC and left 10min at
RT to warm up. The sections were washed two times with PBS for 2min each time. The
permeabilisation step follows as we leave for 10min the slices with 1% Goat Serum in PBS-T
(0.4% TritonX in PBS) at RT.
Next, unspecific binding sites were blocked by incubation with 10% Goat serum + 0.1% BSA in
PBS-T. After 1h at RT, the cuts were washed once with PBS-T for 2min. This was the blocking
step. Before the 1st AB is used, with the help of a cotton swab the glass between the slices is
dried and a thin layer of red varnish is applied. This prevents the different antibodies to stain
other slices. The last step is achieved by applying to each slice the 1st AB, diluted in 1% Goat
Serum in PBS-T.
Notice that 2 AB are added per slice: α-Actinin/DDR2 and α-Actinin/VIM, as displayed in figure
3.2. In the negative control slice, only PBS-T/1%goat is added. The glass cover slip stays
overnight at 4ºC. On the second day, it is washed 3 times for 5min with 1% Goat Serum in PBS-
T. The second AB, diluted in 1% Goat Serum in PBS-T, is added (1%Goat Serum + Goat and
Mouse + Goat and Rabbit). The slices are left for incubation for 1h at RT in the dark.
α-Actinin/DDR2 1:100/1:50 Goat anti mouse IgG 1:500 (Alexa 555) Goat anti rabbit IgG 1:500 (Alexa 488)
α-Actinin/VIM 1:100/1:500 Goat anti mouse IgG 1:500 (Alexa 555) Goat anti rabbit IgG 1:500 (Alexa 488)
Neg. Ctrl Goat anti mouse IgG 1:500 (Alexa 555) Goat anti rabbit IgG 1:500 (Alexa 488)
huBiopsy #patient nr OT_17 (cut on: date) O O O
Figure 3.2 - Diagram of cover glass with three slices of tissue and the stainings performed in IHC.

28
Afterwards they are washed again 3 times for 5min with 1% Goat Serum in PBS-T and one time
rinsed with water. The excess of the washing reagent is carefully removed with a cotton swab.
One to 3 drops of anti-fade mounting Medium with DAPI (previously retrieved from 4ºC and
placed upside-down) are added to each slice. It was let absorb for 3min. A cover glass was
placed thereon and the cuts are ready to visualize fluorescence under the microscope.

29
4. RESULTS
4.1. Primary cardiac and control fibroblast cultures
For this project, ten samples were collected: 5 from children and 5 from adults. During this work,
more than 30 samples were digested and cultured. However, it was not always possible to
obtain both adipose and cardiac samples from the OR, due to restrictions during the operation.
In addition, not all samples from children biopsies grew in culture, probably, due to the limited
size of samples.
In Figure 4.1 an example of a 100% confluent well culture of adipose tissue fibroblasts, at a 10x
magnification, from a child is shown. The typical fibroblast morphology, as a branched
cytoplasm surrounding an elliptical (22), is observed. Speckled nuclei, that typically have 1 or 2
nucleoli, are visible at a higher magnification.
Figure 4.1 - Photograph of confluent AF at P0 after a week in culture from a child sample, with 10x. The image was not edited.
In Figure 4.2 a comparison of AF (Fig. 4.2 A) and CF (Fig. 4.2 B) from the same patient (child) is
presented. While fibroblasts from different anatomical sites have similar morphology, they have
their own gene-expression profile and characteristic phenotypes in different locations. Thus,
they synthesize extracellular matrix proteins and cytokines in a site-specific manner (62). The
main morphological difference observed between these two types of fibroblasts is that adipose
tissue fibroblasts tend to be more elongated while cardiac ones appear shorter.
In comparison to Figure 4.1, an observation can be made, that the cells have not reached
100% confluence. However, AF appeared to reach confluence faster than CF, also noticeable in
Figure 4.1. This comparison was easily made as both samples (from the same patient) would be
cultured in the same day. This may be due to the fact that the received cardiac samples from
100µM
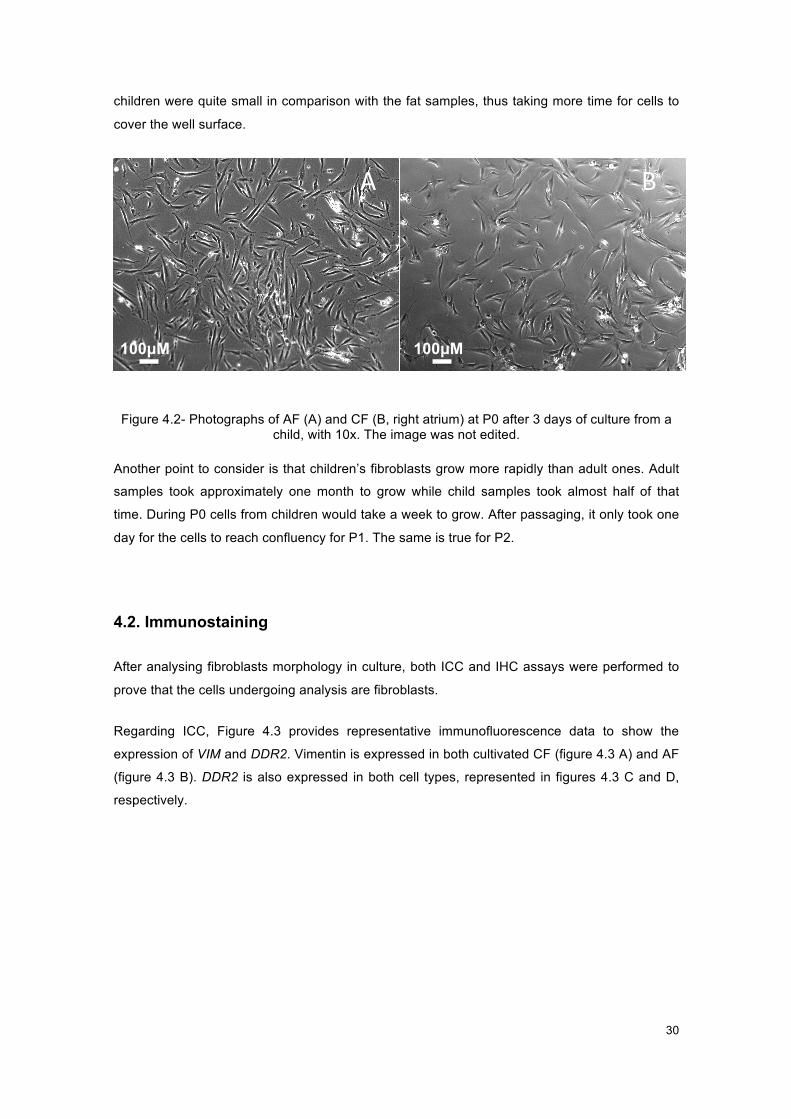
30
children were quite small in comparison with the fat samples, thus taking more time for cells to
cover the well surface.
Figure 4.2 - Photographs of AF (A) and CF (B, right atrium) at P0 after 3 days of culture from a
child. Figure 4.2- Photographs of AF (A) and CF (B, right atrium) at P0 after 3 days of culture from a
child, with 10x. The image was not edited.
Another point to consider is that children’s fibroblasts grow more rapidly than adult ones. Adult
samples took approximately one month to grow while child samples took almost half of that
time. During P0 cells from children would take a week to grow. After passaging, it only took one
day for the cells to reach confluency for P1. The same is true for P2.
4.2. Immunostaining
After analysing fibroblasts morphology in culture, both ICC and IHC assays were performed to
prove that the cells undergoing analysis are fibroblasts.
Regarding ICC, Figure 4.3 provides representative immunofluorescence data to show the
expression of VIM and DDR2. Vimentin is expressed in both cultivated CF (figure 4.3 A) and AF
(figure 4.3 B). DDR2 is also expressed in both cell types, represented in figures 4.3 C and D,
respectively.
A B
100µM 100µM

31
Figure 4.3 - Immunocytochemistry results
Figure 4.3 A. Right atrium CF from P1, from an adult sample stained with VIM (1:500), Alexa
Fluor 555, DAPI, with 40x. B. AF from P1, from an adult sample, stained with VIM (1:500), Alexa
Fluor 555, DAPI, with 40x.C. Right Atrium CF from P1, from adult sample, stained with DDR2
(1:10), Alexa Fluor 555, DAPI, with 40x. D. AF from P1, from adult sample, stained with DDR2
(1:10), Alexa Fluor 555, DAPI, with 40x. No images were edited.
ICC was performed to show where the tested proteins are expressed: within the cell, like the
nucleus, or on the extracellular matrix or even on the surface of the cell. In this case, VIM and
DDR2 markers were chosen because they are established indicators of the fibroblast
phenotype. These two markers (red) are expressed in the fibroblasts. As described in the
introduction, the VIM gene is a structural constituent of cytoskeleton, thus the VIM gene marker
marks structural filaments of the fibroblasts, which are visible in figures 4.3 A and B. DDR2, on
the other hand, functions as cell surface receptor for fibrillar collagen, one of the main
components of the fibroblast, thus being the filaments not marked, as shown in figures 4.3 C
and D.
It is also important to mention that at this magnification, fibroblast morphology is more
distinguishable than in figures 4.1 and 4.2, since the nuclei (counterstained with DAPI - blue),
are now visible.
Regarding IHC, a histological analysis of cardiac tissue (right atrium) from adult was performed,
to show the location of the fibroblasts in the heart. Both fibroblast markers DDR2 and VIM were

32
tested along with a-Actinin and DAPI. The results are presented in figures 4.4 A and B
respectively.
Figure 4.4 - Immunohistochemistry results
Figure 4.4 A. Immunohistochemistry results. Right atrium histological cut, from an adult sample
stained with DDR2 (1:50) and Alexa Fluor 488, a-Actinin (1:100) and Alexa Fluor 555 and DAPI,
with 40x. B. Right atrium histological cut, from an adult sample, stained with VIM (1:500) and
Alexa Fluor 488, a-Actinin (1:200) and Alexa Fluor 555 and DAPI, with 40x. No images were
edited.
The presence of the fibroblasts markers DDR2 is shown in figure 4.4A and VIM in figure 4.4B.
In figure 4.4 A and B, a-Actinin (red) labels cardiomyocytes, which clearly stand out with their
distinct morphology. These cells consist of a basic contractile unit (the sarcomere), a group of
actin-, and myosin-filaments (myofibrils). Myofibrils are seen as transverse-tubules (t-tubules),
which run on the transverse axis, and are aligned normally along the radial axis of the
cardiomyocytes (63).
This assay not only validates the sample being cardiac for the existence of cardiomyocytes but
also allows the distinction of cardiac fibroblasts from other cell types in the heart (stained with
DDR2 and VIM, already stained in CF in ICC).
Despite the accuracy and reliability of the IHC, results depend on the specificity and sensitivity
of the antibodies used. Combined with ICC, IHC is a powerful approach for evaluating cell
populations within a tissue. In this case, fibroblasts (previously stained by ICC) can be
distinguished from cardiomyocytes.

33
4.3. Gene expression
After lysis, RNA extraction and cDNA production, a RT-qPCR was performed in order to identify
potentially unique genes expressed in cardiac and adipose tissue fibroblasts. Normalization to
the expression values of β-Actin, a house-keeping gene, was performed. This is explained in
detail in methods 3.5.3.
Low values
In most cases the obtained values were used to analyse the expressiveness of genes. But gene
expression is not comparable between genes, because the level of expression is different in
different types of tissue and also during stages of development, i.e. during embryonic
development these genes may be highly expressed in cardiac tissue and have a residual (or
very low) expression in a formed individual, an adult. In this sense, there are genes that,
besides of exhibiting values very close to zero, still are considered.
From another point of view, the gene expression of cultured adipose and cardiac fibroblasts is
compared with whole heart tissue. The results show that, for instance for some cardiac genes,
expression is absent in adipose tissue but present in both cardiac fibroblasts and heart tissue,
as seen in attachment F. Other populations of cardiac cells, like smooth muscle cells or
cardiomyocytes, that may express the same genes, exist in the heart tissue. Thus, what is
expressed by fibroblasts may only be a part of what is expressed in the heart tissue. Therefore,
even though the gene expression values in fibroblasts are low, they cannot be disregarded.
Also, RNA corresponds to what is expressed in the cell. As, when extracting a particular mRNA,
its corresponding gene is being expressed (or productive) in the moment of extraction, actively
synthesizing a protein, for instance. Since cDNA was produced from the extracted RNA, if there
is gene material it will be measure in the RT-qPCR. Hence low values could be considered.
Another point to take into consideration concerns to the gene functions in the cell, i.e. a
functional gene product, often a protein, is produced. However, genes could up-regulated (i.e.
become expressed, switched on, or productive) in particular cellular conditions. These
conditions are related or influenced by other gene’s expression, and when the cell expresses
the gene, depending on its necessity, it may have a higher or lower expression, thus having
more or less mRNA available. Is the expression always low, or is it derived from the diagnostic?
This angle allows the possible explanation for the low gene expression.
Control
Concerning the topic of relative gene expression, it would suggest that, for it to be relative gene
expression of the patients, it would have to be compared to gene expression of people with no
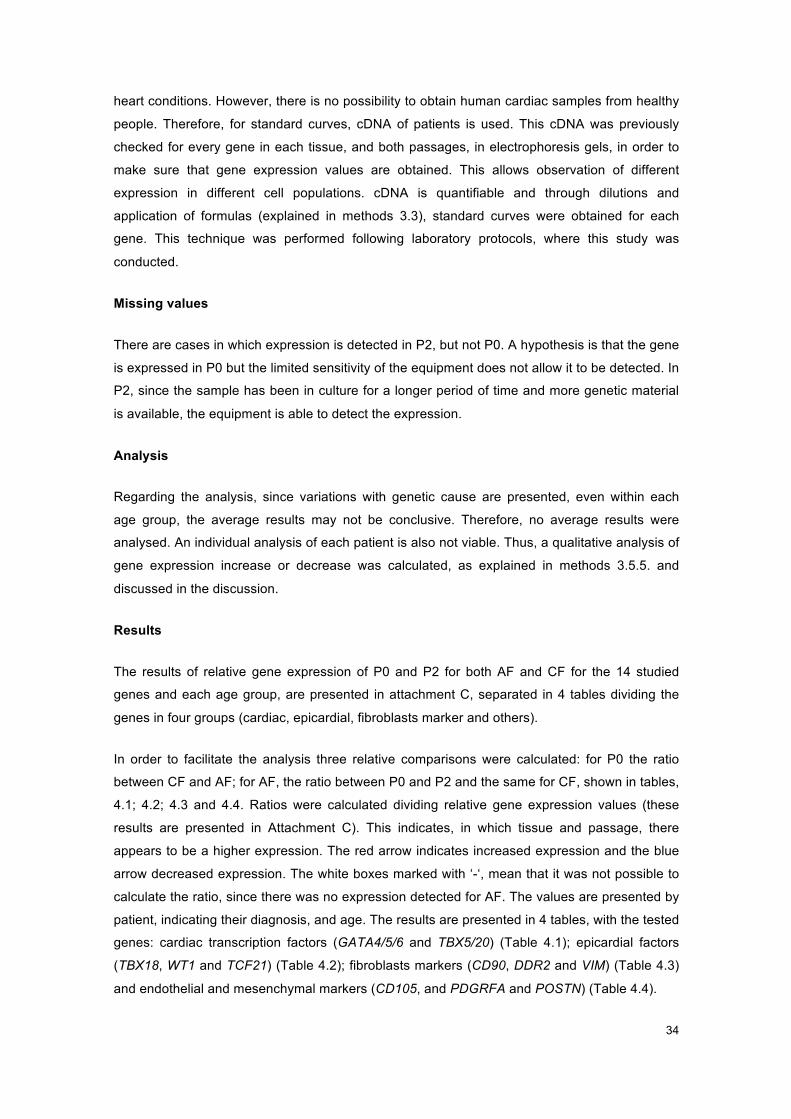
34
heart conditions. However, there is no possibility to obtain human cardiac samples from healthy
people. Therefore, for standard curves, cDNA of patients is used. This cDNA was previously
checked for every gene in each tissue, and both passages, in electrophoresis gels, in order to
make sure that gene expression values are obtained. This allows observation of different
expression in different cell populations. cDNA is quantifiable and through dilutions and
application of formulas (explained in methods 3.3), standard curves were obtained for each
gene. This technique was performed following laboratory protocols, where this study was
conducted.
Missing values
There are cases in which expression is detected in P2, but not P0. A hypothesis is that the gene
is expressed in P0 but the limited sensitivity of the equipment does not allow it to be detected. In
P2, since the sample has been in culture for a longer period of time and more genetic material
is available, the equipment is able to detect the expression.
Analysis
Regarding the analysis, since variations with genetic cause are presented, even within each
age group, the average results may not be conclusive. Therefore, no average results were
analysed. An individual analysis of each patient is also not viable. Thus, a qualitative analysis of
gene expression increase or decrease was calculated, as explained in methods 3.5.5. and
discussed in the discussion.
Results
The results of relative gene expression of P0 and P2 for both AF and CF for the 14 studied
genes and each age group, are presented in attachment C, separated in 4 tables dividing the
genes in four groups (cardiac, epicardial, fibroblasts marker and others).
In order to facilitate the analysis three relative comparisons were calculated: for P0 the ratio
between CF and AF; for AF, the ratio between P0 and P2 and the same for CF, shown in tables,
4.1; 4.2; 4.3 and 4.4. Ratios were calculated dividing relative gene expression values (these
results are presented in Attachment C). This indicates, in which tissue and passage, there
appears to be a higher expression. The red arrow indicates increased expression and the blue
arrow decreased expression. The white boxes marked with ‘-‘, mean that it was not possible to
calculate the ratio, since there was no expression detected for AF. The values are presented by
patient, indicating their diagnosis, and age. The results are presented in 4 tables, with the tested
genes: cardiac transcription factors (GATA4/5/6 and TBX5/20) (Table 4.1); epicardial factors
(TBX18, WT1 and TCF21) (Table 4.2); fibroblasts markers (CD90, DDR2 and VIM) (Table 4.3)
and endothelial and mesenchymal markers (CD105, and PDGRFA and POSTN) (Table 4.4).

35
Table 4.1 - Gene expression AF/CF in P0 and P0/P2 in both tissues comparison ratio for
cardiac genes in children and adults.
Table 4-1 - Results of ratio analysis between tissue and passages, for cardiac genes. P0 AF CF P0 AF CF
Gene Age Group Diagnosis Age CF/AF P0/P2 P0/P2 CF/AF P0/P2 P0/P2
GATA4
Children
1 - CoA 6d - - 0.28 - - ê
2 - CAVSD 7d - - 1.10 - - é
3 - ASD 33m - - 0.28 - - ê
4 - HLHS 54m - - 0.58 - - ê
5 - ASD2 8y - - 2.17 - - é
Adults
6 - AVR 60y 144.61 11.06 0.12 é é ê
7 - AVR 60y 116.61 0.48 0.31 é ê ê
8 - MVR 66y - - 3.22 - - é
9 - ACVB 69y 4.00 4.32 0.46 é é ê
10 - MVR 73y 58.84 0.63 0.95 é ê ê
GATA5
Children
1 - CoA 6d - - 0.12 - - ê
2 - CAVSD 7d - - 1.13 - - é
3 - ASD 33m - - 0.47 - - ê
4 - HLHS 54m - - 0.78 - - ê
5 - ASD2 8y - - 1.39 - - é
Adults
6 - AVR 60y - - - - - - 7 - AVR 60y - - 1.28 - - é
8 - MVR 66y - - - - - - 9 - ACVB 69y - - 1.55 - - é
10 - MVR 73y - - 1.38 - - é
GATA6
Children
1 - CoA 6d 4.20 0.46 0.26 é ê ê
2 - CAVSD 7d 2.75 0.55 1.56 é ê é
3 - ASD 33m 3.56 0.82 0.74 é ê ê
4 - HLHS 54m 0.48 17.81 0.84 ê é ê
5 - ASD2 8y 1.12 3.97 1.39 é é é
Adults
6 - AVR 60y 0.68 2.38 0.49 ê é ê
7 - AVR 60y 0.94 0.60 0.61 ê ê ê
8 - MVR 66y 2.99 1.60 0.83 é é ê
9 - ACVB 69y 0.72 1.69 0.79 ê é ê
10 - MVR 73y 1.34 0.44 0.86 é ê ê
TBX5
Children
1 - CoA 6d 0.41 0.59 0.44 ê ê ê
2 - CAVSD 7d 0.54 0.92 0.69 ê ê ê
3 - ASD 33m 0.22 1.11 0.39 ê é ê
4 - HLHS 54m 0.14 13.84 2.14 ê é é
5 - ASD2 8y 0.20 4.94 2.50 ê é é
Adults
6 - AVR 60y 0.60 10.50 0.46 ê é ê
7 - AVR 60y 0.14 1.68 0.43 ê é ê
8 - MVR 66y 0.34 3.19 1.00 ê é ê
9 - ACVB 69y 0.18 1.30 1.19 ê é é
10 - MVR 73y 14.70 0.14 1.07 é ê é
TBX20
Children
1 - CoA 6d 535.28 - 0.38 é - ê
2 - CAVSD 7d 29162.82 0.00 1.60 é ê é
3 - ASD 33m - 0.00 0.44 - ê ê
4 - HLHS 54m - 0.00 0.99 - ê ê
5 - ASD2 8y 549.07 0.28 3.66 é ê é
Adults
6 - AVR 60y 313.93 0.19 0.21 é ê ê
7 - AVR 60y 570.88 - 0.55 é - ê
8 - MVR 66y - - 1.52 - - é
9 - ACVB 69y 2.20 2.14 0.74 é é ê
10 - MVR 73y 27.71 0.87 1.15 é ê é

36
Table 4.2 - Gene expression AF/CF in P0 and P0/P2 in both tissues comparison ratio for
epicardial genes in children and adults.
Table 4-2 - Results of ratio analysis between tissue and passages, for epicardial genes. P0 AF CF P0 AF CF
Gene Age Group Diagnosis Age CF/AF P0/P2 P0/P2 CF/AF P0/P2 P0/P2
TBX18
Children
1 - CoA 6d 1.43 0.51 0.29 é ê ê
2 - CAVSD 7d 1.21 0.93 0.86 é ê ê
3 - ASD 33m 0.49 3.27 0.60 ê é ê
4 - HLHS 54m - 0.00 0.37 - ê ê
5 - ASD2 8y 0.87 3.78 2.31 ê é é
Adults
6 - AVR 60y 1.54 0.48 16.56 é ê é
7 - AVR 60y 0.89 1.13 0.46 ê é ê
8 - MVR 66y 0.31 0.85 0.30 ê ê ê
9 - ACVB 69y 0.28 1.36 0.77 ê é ê
10 - MVR 73y 0.77 1.14 0.59 ê é ê
WT1
Children
1 - CoA 6d - - 0.78 - - ê
2 - CAVSD 7d - - 0.92 - - ê
3 - ASD 33m - - 0.62 - - ê
4 - HLHS 54m - - 0.54 - - ê
5 - ASD2 8y - - 1.90 - - é
Adults
6 - AVR 60y - 0.00 - - ê - 7 - AVR 60y 0.97 0.73 0.38 ê ê ê
8 - MVR 66y - - 1.04 - - é
9 - ACVB 69y 0.52 1.91 1.38 ê é é
10 - MVR 73y 2.70 0.89 1.05 é ê é
TCF21
Children
1 - CoA 6d 27.15 2.81 0.27 é é ê
2 - CAVSD 7d - 0.00 5.44 - ê é
3 - ASD 33m 92.44 1.33 2.50 é é é
4 - HLHS 54m 0.82 - 1.59 ê - é
5 - ASD2 8y 17.17 2.48 3.67 é é é
Adults
6 - AVR 60y 0.15 4.37 0.44 ê é ê
7 - AVR 60y 0.74 0.69 0.90 ê ê ê
8 - MVR 66y 0.94 8.18 0.70 ê é ê
9 - ACVB 69y 1.93 3.66 0.91 é é ê
10 - MVR 73y 5.07 0.63 1.90 é ê é

37
Table 4.3 - Gene expression AF/CF in P0 and P0/P2 in both tissues comparison ratio for
fibroblasts markers in children and adults.
Table 4-3 - Results of ratio analysis between tissue and passages, for fibroblasts markers P0 AF CF P0 AF CF
Gene Age Group Diagnosis Age CF/AF P0/P2 P0/P2 CF/AF P0/P2 P0/P2
CD90
Children
1 - CoA 6d 0.53 0.66 0.33 ê ê ê
2 - CAVSD 7d 0.50 1.62 0.81 ê é ê
3 - ASD 33m 0.30 2.03 0.59 ê é ê
4 - HLHS 54m 0.09 14.82 0.79 ê é ê
5 - ASD2 8y 0.35 4.57 1.74 ê é é
Adults
6 - AVR 60y 0.32 3.30 0.33 ê é ê
7 - AVR 60y 0.39 1.31 0.94 ê é ê
8 - MVR 66y 0.43 4.23 0.53 ê é ê
9 - ACVB 69y 0.11 6.01 0.80 ê é ê
10 - MVR 73y 0.69 0.67 1.10 ê ê é
DDR2
Children
1 - CoA 6d 0.60 0.65 0.32 ê ê ê
2 - CAVSD 7d 0.79 0.73 0.85 ê ê ê
3 - ASD 33m 0.58 1.54 0.78 ê é ê
4 - HLHS 54m 0.12 16.52 1.47 ê é é
5 - ASD2 8y 0.46 5.14 4.02 ê é é
Adults
6 - AVR 60y 0.58 0.90 0.25 ê ê ê
7 - AVR 60y 0.32 1.19 1.31 ê é é
8 - MVR 66y 0.69 2.36 0.56 ê é ê
9 - ACVB 69y 0.07 3.69 1.35 ê é é
10 - MVR 73y 1.21 0.55 1.43 é ê é
VIM
Children
1 - CoA 6d 0.93 0.29 0.24 ê ê ê
2 - CAVSD 7d 0.69 1.04 0.62 ê é ê
3 - ASD 33m 0.65 0.98 0.49 ê ê ê
4 - HLHS 54m 0.08 8.58 0.78 ê é ê
5 - ASD2 8y 0.43 3.42 1.44 ê é é
Adults
6 - AVR 60y 0.90 1.15 2.55 ê é é
7 - AVR 60y 1.26 0.31 0.63 é ê ê
8 - MVR 66y 0.41 3.21 0.67 ê é ê
9 - ACVB 69y 0.22 1.68 0.59 ê é ê
10 - MVR 73y 1.16 0.92 0.69 é ê ê
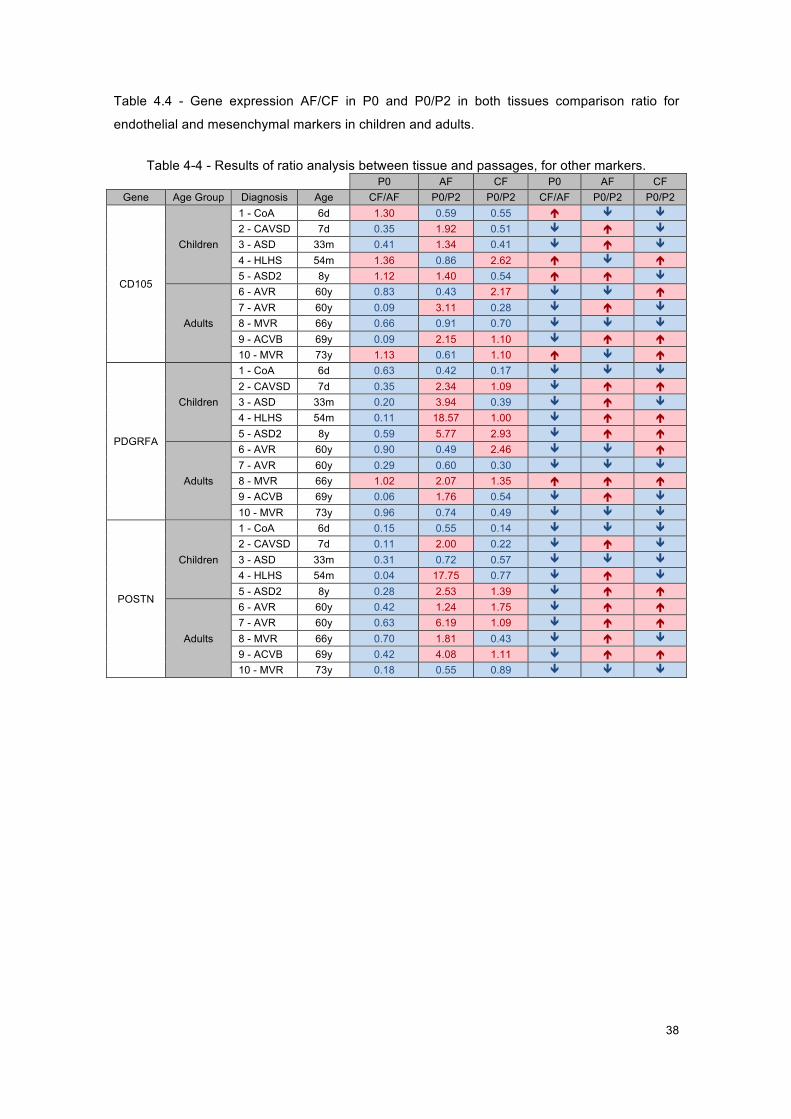
38
Table 4.4 - Gene expression AF/CF in P0 and P0/P2 in both tissues comparison ratio for
endothelial and mesenchymal markers in children and adults.
Table 4-4 - Results of ratio analysis between tissue and passages, for other markers. P0 AF CF P0 AF CF
Gene Age Group Diagnosis Age CF/AF P0/P2 P0/P2 CF/AF P0/P2 P0/P2
CD105
Children
1 - CoA 6d 1.30 0.59 0.55 é ê ê
2 - CAVSD 7d 0.35 1.92 0.51 ê é ê
3 - ASD 33m 0.41 1.34 0.41 ê é ê
4 - HLHS 54m 1.36 0.86 2.62 é ê é
5 - ASD2 8y 1.12 1.40 0.54 é é ê
Adults
6 - AVR 60y 0.83 0.43 2.17 ê ê é
7 - AVR 60y 0.09 3.11 0.28 ê é ê
8 - MVR 66y 0.66 0.91 0.70 ê ê ê
9 - ACVB 69y 0.09 2.15 1.10 ê é é
10 - MVR 73y 1.13 0.61 1.10 é ê é
PDGRFA
Children
1 - CoA 6d 0.63 0.42 0.17 ê ê ê
2 - CAVSD 7d 0.35 2.34 1.09 ê é é
3 - ASD 33m 0.20 3.94 0.39 ê é ê
4 - HLHS 54m 0.11 18.57 1.00 ê é é
5 - ASD2 8y 0.59 5.77 2.93 ê é é
Adults
6 - AVR 60y 0.90 0.49 2.46 ê ê é
7 - AVR 60y 0.29 0.60 0.30 ê ê ê
8 - MVR 66y 1.02 2.07 1.35 é é é
9 - ACVB 69y 0.06 1.76 0.54 ê é ê
10 - MVR 73y 0.96 0.74 0.49 ê ê ê
POSTN
Children
1 - CoA 6d 0.15 0.55 0.14 ê ê ê
2 - CAVSD 7d 0.11 2.00 0.22 ê é ê
3 - ASD 33m 0.31 0.72 0.57 ê ê ê
4 - HLHS 54m 0.04 17.75 0.77 ê é ê
5 - ASD2 8y 0.28 2.53 1.39 ê é é
Adults
6 - AVR 60y 0.42 1.24 1.75 ê é é
7 - AVR 60y 0.63 6.19 1.09 ê é é
8 - MVR 66y 0.70 1.81 0.43 ê é ê
9 - ACVB 69y 0.42 4.08 1.11 ê é é
10 - MVR 73y 0.18 0.55 0.89 ê ê ê
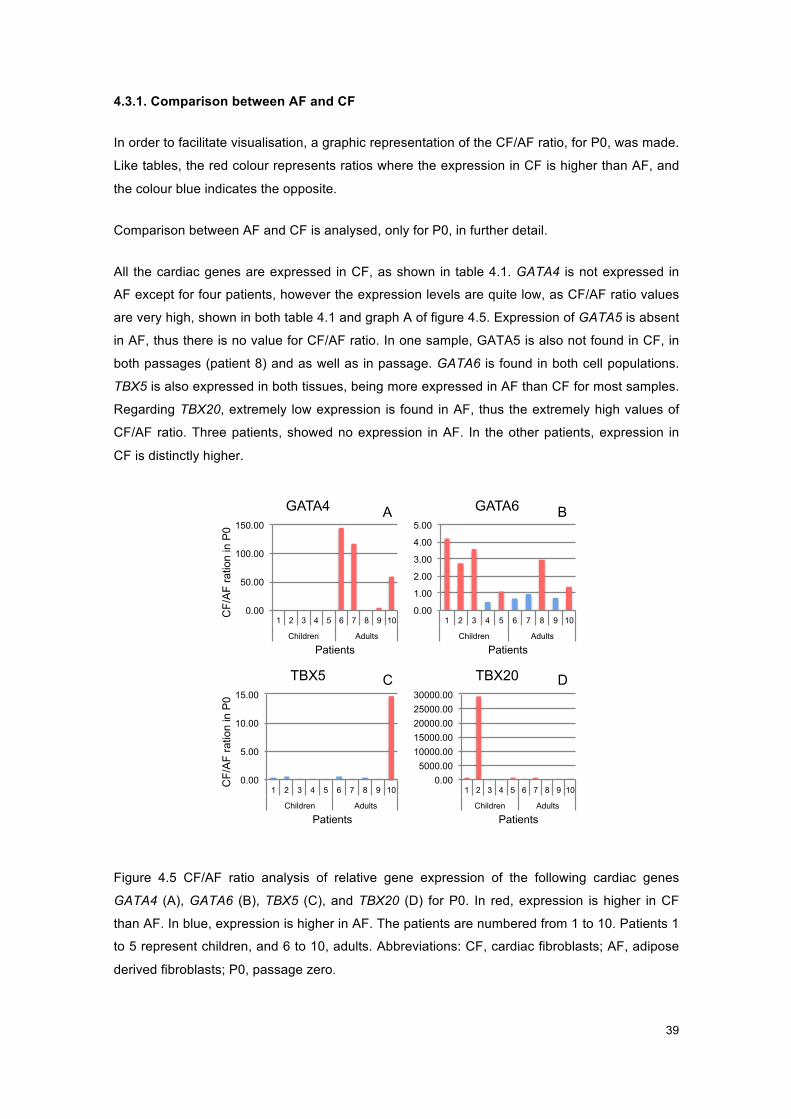
39
4.3.1. Comparison between AF and CF
In order to facilitate visualisation, a graphic representation of the CF/AF ratio, for P0, was made.
Like tables, the red colour represents ratios where the expression in CF is higher than AF, and
the colour blue indicates the opposite.
Comparison between AF and CF is analysed, only for P0, in further detail.
All the cardiac genes are expressed in CF, as shown in table 4.1. GATA4 is not expressed in
AF except for four patients, however the expression levels are quite low, as CF/AF ratio values
are very high, shown in both table 4.1 and graph A of figure 4.5. Expression of GATA5 is absent
in AF, thus there is no value for CF/AF ratio. In one sample, GATA5 is also not found in CF, in
both passages (patient 8) and as well as in passage. GATA6 is found in both cell populations.
TBX5 is also expressed in both tissues, being more expressed in AF than CF for most samples.
Regarding TBX20, extremely low expression is found in AF, thus the extremely high values of
CF/AF ratio. Three patients, showed no expression in AF. In the other patients, expression in
CF is distinctly higher.
Figure 4.5 - Graphs of CF/AF ratio for P0, for cardiac genes.
Figure 4.5 CF/AF ratio analysis of relative gene expression of the following cardiac genes
GATA4 (A), GATA6 (B), TBX5 (C), and TBX20 (D) for P0. In red, expression is higher in CF
than AF. In blue, expression is higher in AF. The patients are numbered from 1 to 10. Patients 1
to 5 represent children, and 6 to 10, adults. Abbreviations: CF, cardiac fibroblasts; AF, adipose
derived fibroblasts; P0, passage zero.
A B
C D
0.00
50.00
100.00
150.00
1 2 3 4 5 6 7 8 9 10
Children Adults
CF/
AF
ratio
n in
P0
Patients
GATA4
0.00
1.00
2.00
3.00
4.00
5.00
1 2 3 4 5 6 7 8 9 10
Children Adults
Patients
GATA6
0.00 5000.00
10000.00 15000.00 20000.00 25000.00 30000.00
1 2 3 4 5 6 7 8 9 10
Children Adults
Patients
TBX20
0.00
5.00
10.00
15.00
1 2 3 4 5 6 7 8 9 10
Children Adults
CF/
AF
ratio
n in
P0
Patients
TBX5

40
Concerning the gene expression of epicardial genes, the results may be seen in table 4.2. They
are expressed in both cell populations. TBX18, represented in graph A of figure 4.6, is more
highly expressed in AF than CF; however, there is a patient that has no expression detected in
AF. As for WT1 it is mostly absent in AF, as seen in graph B of figure 4.6, with the exception of
three patients, who show expression. Expression of TCF21 is present in both cell populations
with the exception of one patient, where it is absent. Most of the samples show a higher
expression in CF than in AF, as shown in graph C of figure 4.6.
Figure 4.6 - Graphs of CF/AF ratio for P0, for epicardial genes.
Figure 4.6 - CF/AF ratio analysis of relative gene expression of the following epicardial genes
TBX18 (A), WT1 (B), and TCF21 (C), for P0. In red, expression is higher in CF than AF. In blue,
expression is higher in AF. The patients are numbered from 1 to 10. Patients 1 to 5 represent
children, and 6 to 10, adults. Abbreviations: CF, cardiac fibroblasts; AF, adipose derived
fibroblasts; P0, passage zero.
Moving on to fibroblasts markers, CD90, DDR2 and VIM, shown in table 4.3, they are all
expressed in both cell populations but more highly expressed in AF, as seen in Figure 4.7.
Figure 4.7 - Graphs of CF/AF ratio for P0, for fibroblasts markers.
Figure 4.7 - CF/AF ratio analysis of relative gene expression of the following fibroblasts markers
CD90 (A), DDR2 (B), and VIM (C), for P0. In red, expression is higher in CF than AF. In blue,
expression is higher in AF. The patients are numbered from 1 to 10. Patients 1 to 5 represent
A B C
0.00
0.50
1.00
1.50
2.00
1 2 3 4 5 6 7 8 9 10
Children Adults
CF/
AF
ratio
n in
P0
Patients
TBX18
0.00 0.50 1.00 1.50 2.00 2.50 3.00
1 2 3 4 5 6 7 8 9 10
Children Adults
Patients
WT1
0.00
20.00
40.00
60.00
80.00
100.00
1 2 3 4 5 6 7 8 9 10
Children Adults
Patients
TCF21
A B C
0.00 0.10 0.20 0.30 0.40 0.50 0.60 0.70 0.80
1 2 3 4 5 6 7 8 9 10
Children Adults
CF/
AF
ratio
n in
P0
Patients
CD90
0.00 0.20 0.40 0.60 0.80 1.00 1.20 1.40
1 2 3 4 5 6 7 8 9 10
Children Adults
Patients
DDR2
0.00 0.20 0.40 0.60 0.80 1.00 1.20 1.40
1 2 3 4 5 6 7 8 9 10
Children Adults
Patients
VIM

41
children, and 6 to 10, adults. Abbreviations: CF, cardiac fibroblasts; AF, adipose derived
fibroblasts; P0, passage zero.
Finally, consulting table 4.4 and figure 4.8., regarding the results of gene expression of both
endothelial (CD105) and mesenchymal (PDGRFA and POSTN) markers, it may be concluded
that, similarly to the previous group of markers, they are all expressed in both cell populations
and to a higher extent in AF.
Figure 4.8 - Graphs of CF/AF ratio for P0, for endothelial and mesenchymal markers.
Figure 4.8 - CF/AF ratio analysis of relative gene expression of the following endothelial and
mesenchymal markers CD90 (A), DDR2 (B), and VIM (C), for P0. In red, expression is higher in
CF than AF. In blue, expression is higher in AF. The patients are numbered from 1 to 10.
Patients 1 to 5 represent children, and 6 to 10, adults. Abbreviations: CF, cardiac fibroblasts;
AF, adipose derived fibroblasts; P0, passage zero.
4.3.2. Comparison between Passages zero and two
In order to facilitate visualisation, a graphic representation of the P0/P2 ratio, for AF and CF,
was made. Like tables, the red colour represents ratios where the expression in CF is higher
than AF, and the colour blue indicates the opposite.
Starting with the cardiac gene GATA4, since there is no expression in AF there is no difference
in expression in the two passages, as it is shown in table 4.1, and graph A of figure 4.9. As for
CF, expression diminishes with culture in most of the patients, as shown in graph A of figure
4.10. GATA5 is absent in all AF, thus no difference in expression in the two passages is shown
in table 4.1. GATA5 is not found in both passages of CF of patient 8 (MVR) and in P0 of patient
6 (AVR). Considering CF, expression of GATA5 tends to decrease with culture, as shown in
graph B of figure 4.10. Concerning the expression of GATA6, in AF half of the samples
increase, and the other half decreases, as shown in graph B of figure 4.9, thus no conclusions
were made. There is an overall increase of expression in CF, for GATA6, as seen in graph C of
figure 4.10. As for TBX5, a decrease of expression is mostly detected in AF (graph C figure
4.9), and the opposite in CF (graph D figure 4.10). As for TBX20, it was absent in AF samples of
A B C
0.0
0.5
1.0
1.5
1 2 3 4 5 6 7 8 9 10
Children Adults
CF/
AF
ratio
n in
P0
Patients
CD105
0.0 0.2 0.4 0.6 0.8 1.0 1.2
1 2 3 4 5 6 7 8 9 10
Children Adults
Patients
PDGRFA
0.0 0.1 0.2 0.3 0.4 0.5 0.6 0.7 0.8
1 2 3 4 5 6 7 8 9 10
Children Adults Patient
POSTN
42
two children and one adult, thus there is not a significant difference in expression in the two
passages, as it is shown in table 4.1 and graph D of figure 4.9. The expression of the remaining
genes, mostly rises with culture in AF, and in most of CF samples as well (graph E of figure
4.10).
Figure 4.9 - Graphs of P0/P2 ratio for AF, for cardiac genes.
Figure 4.9 – P0/P2 ratio analysis of relative gene expression of the following cardiac genes
GATA4 (A), GATA6 (B), TBX5 (C), and TBX20 (D), for AF. In red, expression is higher in CF
than AF. In blue, expression is higher in AF. The patients are numbered from 1 to 10. Patients 1
to 5 represent children, and 6 to 10, adults. Abbreviations: P0, passage zero; P2, passage two;
AF, adipose derived fibroblasts.
A B
C D
0.0 2.0 4.0 6.0 8.0
10.0 12.0
1 2 3 4 5 6 7 8 9 10
Children Adults
P0/
P2
Rat
io fo
r AF
Patients
GATA4
0.0
5.0
10.0
15.0
20.0
1 2 3 4 5 6 7 8 9 10
Children Adults
Patients
GATA6
0.0 2.0 4.0 6.0 8.0
10.0 12.0 14.0 16.0
1 2 3 4 5 6 7 8 9 10
Children Adults
P0/
P2
Rat
io fo
r AF
Patients
TBX5
0.0
0.5
1.0
1.5
2.0
2.5
1 2 3 4 5 6 7 8 9 10
Children Adults
Patients
TBX20

43
Figure 4.10 - Graphs of P0/P2 ratio for CF, for cardiac genes.
Figure 4.10 - P0/P2 ratio analysis of relative gene expression of the following cardiac genes
GATA4 (A), GATA5 (B), GATA6 (C), TBX5 (D), and TBX20 (E), for CF. In red, expression is
higher in CF than AF. In blue, expression is higher in AF. The patients are numbered from 1 to
10. Patients 1 to 5 represent children, and 6 to 10, adults. Abbreviations: P0, passage zero; P2,
passage two; CF, cardiac fibroblasts.
Taking a closer look at the expression change, in culture, of epicardial genes, presented in table
4.2, concerning TBX18, there is an overall rise of expression in both cell populations, AF and
CF, as seen in both graphs A of figures 4.11 and 4.12. There is no expression of WT1 in more
than half of the samples, thus not exhibiting a difference between the two passages in AF,
shown in graph B of figure 4.11. In CF, graph B of figure 4.12, expression tends to rise in more
than half of the samples with culture. TCF21 presents a higher expression in P0 in most
samples in AF, as seen in graph C of figure 4.11. However, in CF, graph C of figure 4.12, half of
the samples rise with culture and the other half decreases.
0.0
0.5
1.0
1.5
2.0
1 2 3 4 5 6 7 8 9 10
Children Adults
Patients
GATA6 A B C
D E
0.0 0.5 1.0 1.5 2.0 2.5 3.0 3.5
1 2 3 4 5 6 7 8 9 10
Children Adults
P0/
P2
Rat
io fo
r CF
Patients
GATA4
0.0
0.5
1.0
1.5
2.0
1 2 3 4 5 6 7 8 9 10
Children Adults
Patients
GATA5
0.0 0.5 1.0 1.5 2.0 2.5 3.0
1 2 3 4 5 6 7 8 9 10
Children Adults
P0/
P2
Rat
io fo
r CF
Patients
TBX5
0.0 0.5 1.0 1.5 2.0 2.5 3.0 3.5 4.0
1 2 3 4 5 6 7 8 9 10
Children Adults
Patients
TBX20
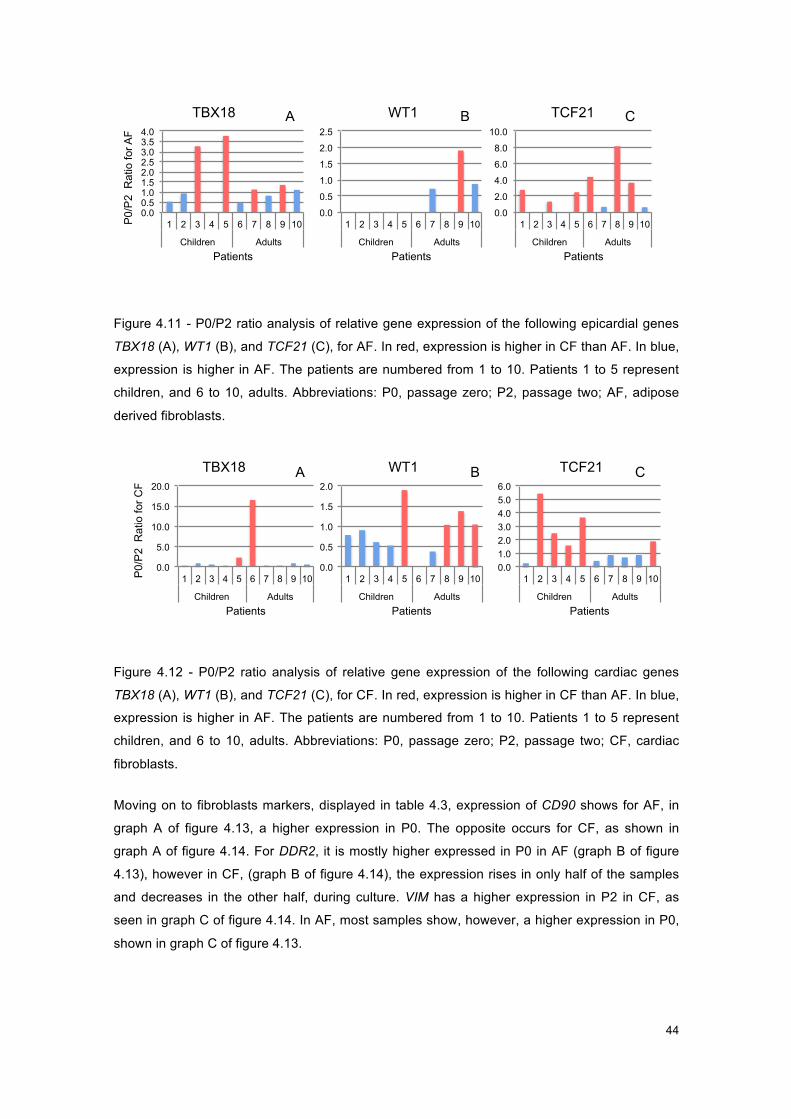
44
Figure 4.11 - Graphs of P0/P2 ratio for AF, for epicardial genes.
Figure 4.11 - P0/P2 ratio analysis of relative gene expression of the following epicardial genes
TBX18 (A), WT1 (B), and TCF21 (C), for AF. In red, expression is higher in CF than AF. In blue,
expression is higher in AF. The patients are numbered from 1 to 10. Patients 1 to 5 represent
children, and 6 to 10, adults. Abbreviations: P0, passage zero; P2, passage two; AF, adipose
derived fibroblasts.
Figure 4.12 - Graphs of P0/P2 ratio for CF, for epicardial genes.
Figure 4.12 - P0/P2 ratio analysis of relative gene expression of the following cardiac genes
TBX18 (A), WT1 (B), and TCF21 (C), for CF. In red, expression is higher in CF than AF. In blue,
expression is higher in AF. The patients are numbered from 1 to 10. Patients 1 to 5 represent
children, and 6 to 10, adults. Abbreviations: P0, passage zero; P2, passage two; CF, cardiac
fibroblasts.
Moving on to fibroblasts markers, displayed in table 4.3, expression of CD90 shows for AF, in
graph A of figure 4.13, a higher expression in P0. The opposite occurs for CF, as shown in
graph A of figure 4.14. For DDR2, it is mostly higher expressed in P0 in AF (graph B of figure
4.13), however in CF, (graph B of figure 4.14), the expression rises in only half of the samples
and decreases in the other half, during culture. VIM has a higher expression in P2 in CF, as
seen in graph C of figure 4.14. In AF, most samples show, however, a higher expression in P0,
shown in graph C of figure 4.13.
A B C
0.0 0.5 1.0 1.5 2.0 2.5 3.0 3.5 4.0
1 2 3 4 5 6 7 8 9 10
Children Adults
P0/
P2
Rat
io fo
r AF
Patients
TBX18
0.0
0.5
1.0
1.5
2.0
2.5
1 2 3 4 5 6 7 8 9 10
Children Adults
Patients
WT1
0.0
2.0
4.0
6.0
8.0
10.0
1 2 3 4 5 6 7 8 9 10
Children Adults
Patients
TCF21
0.0
0.5
1.0
1.5
2.0
1 2 3 4 5 6 7 8 9 10
Children Adults
Patients
WT1 A B C
0.0
5.0
10.0
15.0
20.0
1 2 3 4 5 6 7 8 9 10
Children Adults
P0/
P2
Rat
io fo
r CF
Patients
TBX18
0.0 1.0 2.0 3.0 4.0 5.0 6.0
1 2 3 4 5 6 7 8 9 10
Children Adults
Patients
TCF21
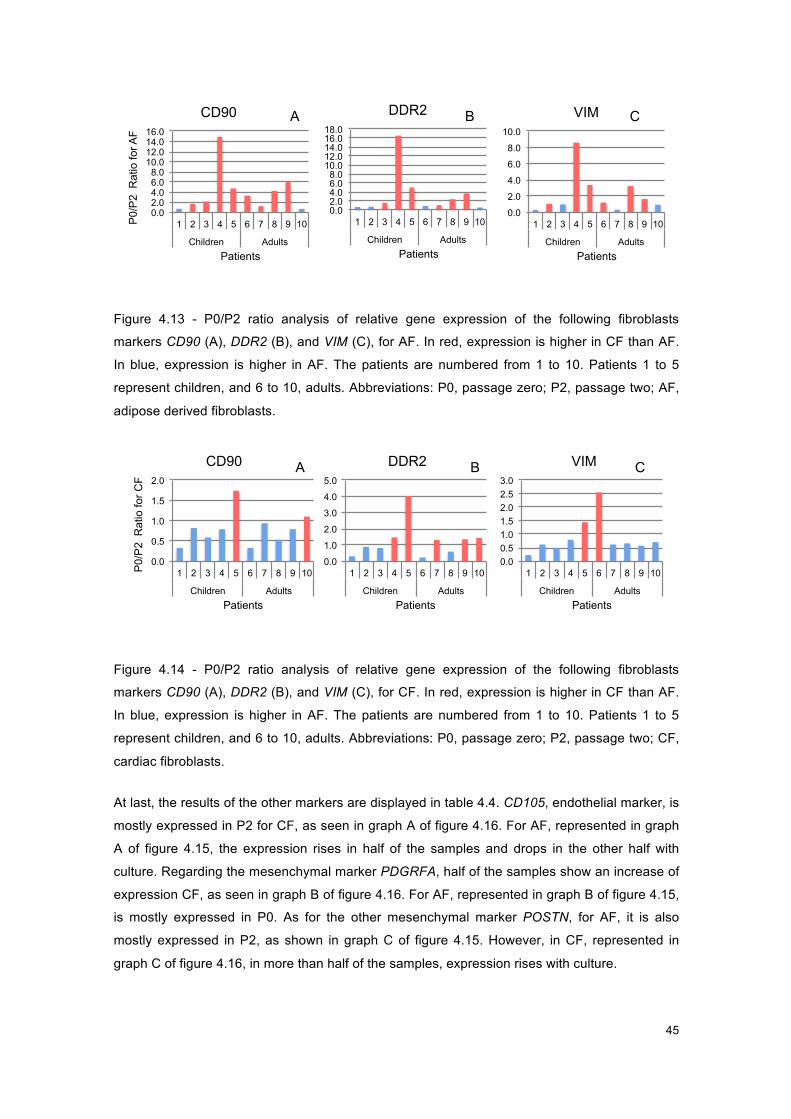
45
Figure 4.13 - Graphs of P0/P2 ratio for AF, for fibroblasts markers.
Figure 4.13 - P0/P2 ratio analysis of relative gene expression of the following fibroblasts
markers CD90 (A), DDR2 (B), and VIM (C), for AF. In red, expression is higher in CF than AF.
In blue, expression is higher in AF. The patients are numbered from 1 to 10. Patients 1 to 5
represent children, and 6 to 10, adults. Abbreviations: P0, passage zero; P2, passage two; AF,
adipose derived fibroblasts.
Figure 4.14 - Graphs of P0/P2 ratio for CF, for fibroblasts markers.
Figure 4.14 - P0/P2 ratio analysis of relative gene expression of the following fibroblasts
markers CD90 (A), DDR2 (B), and VIM (C), for CF. In red, expression is higher in CF than AF.
In blue, expression is higher in AF. The patients are numbered from 1 to 10. Patients 1 to 5
represent children, and 6 to 10, adults. Abbreviations: P0, passage zero; P2, passage two; CF,
cardiac fibroblasts.
At last, the results of the other markers are displayed in table 4.4. CD105, endothelial marker, is
mostly expressed in P2 for CF, as seen in graph A of figure 4.16. For AF, represented in graph
A of figure 4.15, the expression rises in half of the samples and drops in the other half with
culture. Regarding the mesenchymal marker PDGRFA, half of the samples show an increase of
expression CF, as seen in graph B of figure 4.16. For AF, represented in graph B of figure 4.15,
is mostly expressed in P0. As for the other mesenchymal marker POSTN, for AF, it is also
mostly expressed in P2, as shown in graph C of figure 4.15. However, in CF, represented in
graph C of figure 4.16, in more than half of the samples, expression rises with culture.
A B C
0.0 2.0 4.0 6.0 8.0
10.0 12.0 14.0 16.0
1 2 3 4 5 6 7 8 9 10
Children Adults
P0/
P2
Rat
io fo
r AF
Patients
CD90
0.0 2.0 4.0 6.0 8.0
10.0 12.0 14.0 16.0 18.0
1 2 3 4 5 6 7 8 9 10
Children Adults
Patients
DDR2
0.0
2.0
4.0
6.0
8.0
10.0
1 2 3 4 5 6 7 8 9 10
Children Adults
Patients
VIM
0.0
0.5
1.0
1.5
2.0
1 2 3 4 5 6 7 8 9 10
Children Adults
P0/
P2
Rat
io fo
r CF
Patients
CD90 A B C
0.0
1.0
2.0
3.0
4.0
5.0
1 2 3 4 5 6 7 8 9 10
Children Adults
Patients
DDR2
0.0 0.5 1.0 1.5 2.0 2.5 3.0
1 2 3 4 5 6 7 8 9 10
Children Adults
Patients
VIM
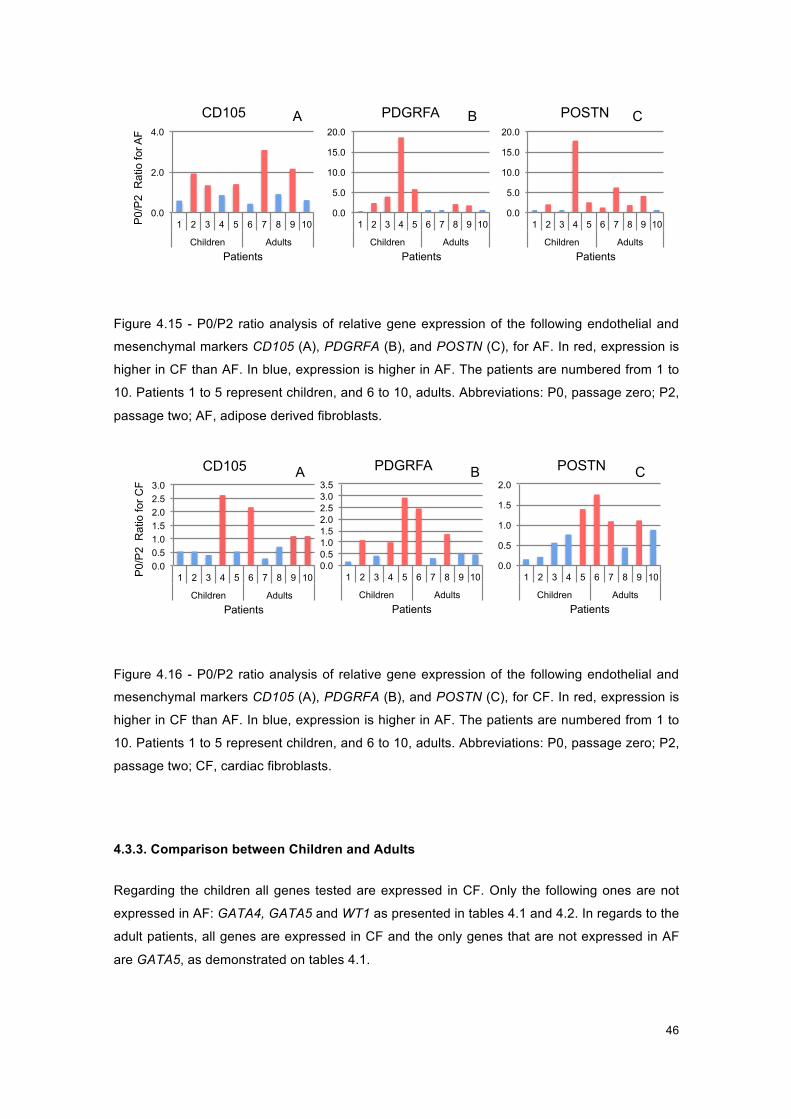
46
Figure 4.15 - Graphs of P0/P2 ratio for AF, for endothelial and mesenchymal markers
Figure 4.15 - P0/P2 ratio analysis of relative gene expression of the following endothelial and
mesenchymal markers CD105 (A), PDGRFA (B), and POSTN (C), for AF. In red, expression is
higher in CF than AF. In blue, expression is higher in AF. The patients are numbered from 1 to
10. Patients 1 to 5 represent children, and 6 to 10, adults. Abbreviations: P0, passage zero; P2,
passage two; AF, adipose derived fibroblasts.
Figure 4.16 - Graphs of P0/P2 ratio for CF, for endothelial and mesenchymal markers
Figure 4.16 - P0/P2 ratio analysis of relative gene expression of the following endothelial and
mesenchymal markers CD105 (A), PDGRFA (B), and POSTN (C), for CF. In red, expression is
higher in CF than AF. In blue, expression is higher in AF. The patients are numbered from 1 to
10. Patients 1 to 5 represent children, and 6 to 10, adults. Abbreviations: P0, passage zero; P2,
passage two; CF, cardiac fibroblasts.
4.3.3. Comparison between Children and Adults
Regarding the children all genes tested are expressed in CF. Only the following ones are not
expressed in AF: GATA4, GATA5 and WT1 as presented in tables 4.1 and 4.2. In regards to the
adult patients, all genes are expressed in CF and the only genes that are not expressed in AF
are GATA5, as demonstrated on tables 4.1.
A B C
0.0
2.0
4.0
1 2 3 4 5 6 7 8 9 10
Children Adults
P0/
P2
Rat
io fo
r AF
Patients
CD105
0.0
5.0
10.0
15.0
20.0
1 2 3 4 5 6 7 8 9 10
Children Adults Patients
PDGRFA
0.0
5.0
10.0
15.0
20.0
1 2 3 4 5 6 7 8 9 10
Children Adults Patients
POSTN
0.0
0.5
1.0
1.5
2.0
1 2 3 4 5 6 7 8 9 10
Children Adults Patients
POSTN A B C
0.0 0.5 1.0 1.5 2.0 2.5 3.0
1 2 3 4 5 6 7 8 9 10
Children Adults
P0/
P2
Rat
io fo
r CF
Patients
CD105
0.0 0.5 1.0 1.5 2.0 2.5 3.0 3.5
1 2 3 4 5 6 7 8 9 10
Children Adults Patients
PDGRFA
47
Concerning cardiac genes GATA4 is not expressed in AF samples from children. It is expressed
in AF samples from adults, but the values are rather low, as shown in table 4.1 and graph A
from figure 4.5. GATA5 is not expressed in AF samples from either age group. GATA6 appears
to be more expressed in CF in children and in AF in adults, as seen in graph B of figure 4.5.
Regarding epicardial genes, TBX18, represented in graph A of figure 4.6, is mainly highly
expressed in AF than CF, in adults. As for WT1 it is absent in all AF samples from children, as
seen in graph B of figure 4.6, and two from adult patients. In CF, expression tends to rise in
mainly children samples, during culture (graph B figure 4.12) Expression of TCF21, is lower in
AF children samples, resulting in high CF/AF ratio values, shown in graph C of figure 4.6 and in
table 4.2. Regarding expression of TCF21 in CF, shown in graph B of figure 4.12, adult samples
rise with culture and children samples decrease.
Regarding fibroblasts markers, for DDR2, as far as expression is concerned, it is mostly higher
in P0 in AF (graph B of figure 4.13), however in CF, (graph B of figure 4.14), the expression of
mainly children samples increases with culture, as the of most adult samples decreases.
Concerning mesenchymal marker, POSTN, in CF, represented in graph C of figure 4.16, in
more than half of the samples expression rises with culture (in most child samples it is more
highly expressed in P2, and the adult samples in P0).
Genes not mentioned above were analysed but did not present conclusive results regarding this
comparison of different age groups.

48
This page was intentionally left blank
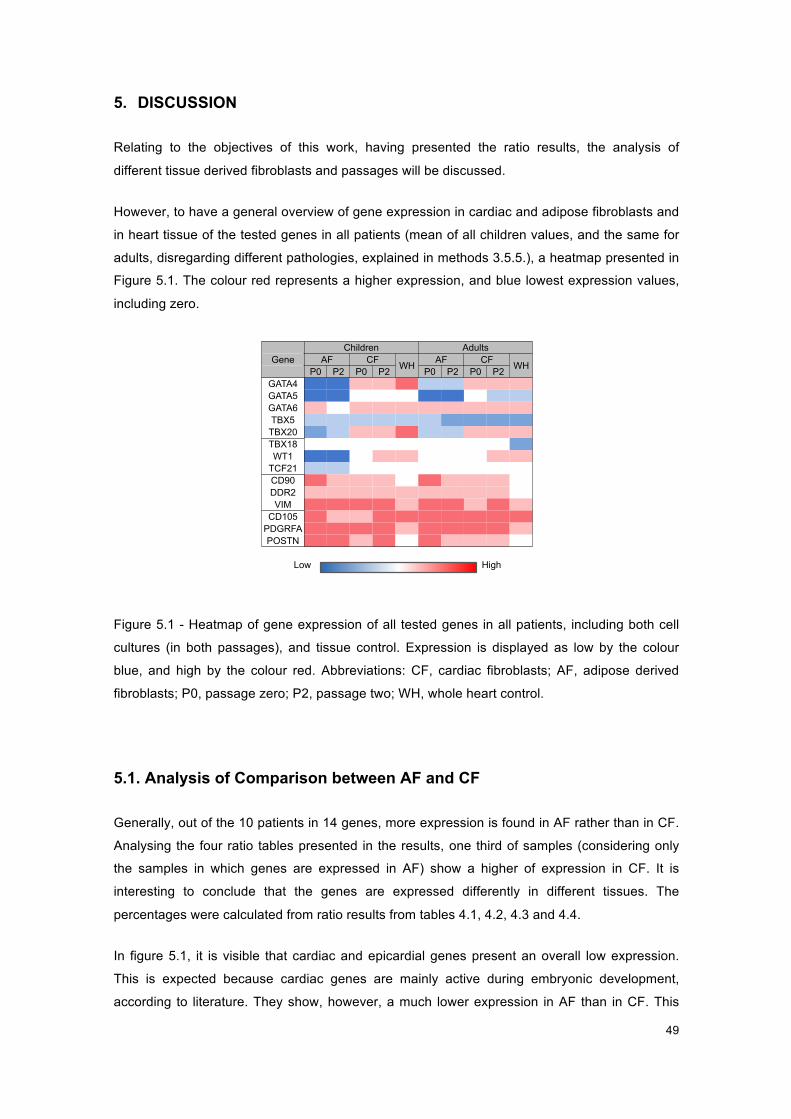
49
5. DISCUSSION
Relating to the objectives of this work, having presented the ratio results, the analysis of
different tissue derived fibroblasts and passages will be discussed.
However, to have a general overview of gene expression in cardiac and adipose fibroblasts and
in heart tissue of the tested genes in all patients (mean of all children values, and the same for
adults, disregarding different pathologies, explained in methods 3.5.5.), a heatmap presented in
Figure 5.1. The colour red represents a higher expression, and blue lowest expression values,
including zero.
Figure 5.1 - Heatmap of gene expression of all tested genes in all patients
Figure 5.1 - Heatmap of gene expression of all tested genes in all patients, including both cell
cultures (in both passages), and tissue control. Expression is displayed as low by the colour
blue, and high by the colour red. Abbreviations: CF, cardiac fibroblasts; AF, adipose derived
fibroblasts; P0, passage zero; P2, passage two; WH, whole heart control.
5.1. Analysis of Comparison between AF and CF
Generally, out of the 10 patients in 14 genes, more expression is found in AF rather than in CF.
Analysing the four ratio tables presented in the results, one third of samples (considering only
the samples in which genes are expressed in AF) show a higher of expression in CF. It is
interesting to conclude that the genes are expressed differently in different tissues. The
percentages were calculated from ratio results from tables 4.1, 4.2, 4.3 and 4.4.
In figure 5.1, it is visible that cardiac and epicardial genes present an overall low expression.
This is expected because cardiac genes are mainly active during embryonic development,
according to literature. They show, however, a much lower expression in AF than in CF. This
Children Adults Gene AF CF WH AF CF WH P0 P2 P0 P2 P0 P2 P0 P2
GATA4 GATA5 GATA6 TBX5
TBX20 TBX18 WT1
TCF21 CD90 DDR2 VIM
CD105 PDGRFA POSTN
High Low

50
was expected, as these genes are expressed in the heart, they were not expected to be present
in AF. However, GATA6 and TBX18 have a slight higher expression in AF. WT1 and GATA4
stand out as being present only in half of samples. GATA5 is absent in all AF samples.
Regarding table 4.1, of cardiac genes, more less half of the genes present a higher expression
in CF. Note that GATA5 is not expressed in AF in both age groups and GATA4 is absent in AF
in children. Not having values to compare with, because they are null, as they are dark blue in
the heatmap of figure 5.1, this percentage is only considering the samples in which genes are
expressed in both AF and CF, thus bringing TBX20 a bigger contribution to gene expression.
TBX5, on the other hand, exhibits a higher expression in AF.
Expression of all cardiac genes was expected in CF, but not in AF. However, GATA6, TBX5,
TBX20 and GATA4 are expressed in AF. TBX20 presents extremely low expression values, that
could be considered null. However, having a specific peak at Ct 37 there is low expression and
the activity may still be sufficient. Another point to consider is that these genes are mainly active
during embryonic cardiac development, and their function postnatal is not yet known. This could
explain the low expression values of genes of this group. In a study, samples from adult patients
that underwent coronary artery bypass surgery were collected (64). A qualitative analysis was
performed and results are in good agreement with the results for GATA5 and GATA6 in the
present analysis. In contrast, a general expression of GATA4 in all samples was found, which
may be due to their approach, which only shows the endpoint of the PCR analysis but does not
include a quantitative analysis (64).
As for the epicardial genes, less than half present a higher expression in CF, as shown in table
4.2. Note that WT1 is not expressed in AF from children.
Epicardial genes were tested to analyse the different CF epicardial lineage, as both have
important functions in cardiogenesis. Expression values of epicardial genes are higher,
compared to cardiac genes. This could be a clue for a further understanding of fibroblasts
function, since they express, in different levels, the cardiac genes, meaning that they may play
other roles in cardiac tissue than being just fibroblasts.
Comparing cardiac and epicardial markers to the rest of the genes - fibroblasts, endothelial and
mesenchymal markers – a difference is visible in figure 5.1. They display a higher expression,
as mostly squares are red and light red. Most even are higher expressed in AF than in CF, in
contrast to cardiac and epicardial markers, except DDR2. This was expected because these are
usually used to mark fibroblasts and the others are described as cardiac markers, not fibroblast
markers.

51
Fibroblasts markers show that only 3 samples are more expressed in CF than in AF, as
presented in table 4.3. As for endothelial and mesenchymal markers, shown in table 4.4, 5
samples are higher expressed in CF.
These two groups of genes were tested due to their ability to mark fibroblasts, regardless of
their histogenic origin, since they mostly encode proteins present in the cell membrane,
cytoplasm and ECM (table 5.1). In comparison, cardiac and epicardial genes, which are only
present in the nucleus, were tested to compare their expression in CF. However, regarding
fibroblasts, endothelial and masenchymal markers, it is interesting to observe that an overall
higher expression is noticeable in AF. Besides similar morphology, this shows that fibroblasts
exhibit topographical differentiation. And general fibroblasts markers, present in most fibroblast
cells, gene expression patterns vary, depending on location, genes involved in lipid metabolism,
cell signalling pathways that control proliferation, cell migration, and cell fate determination (22).
5.2. Analysis of Comparison between Passages zero and two
Generally, out of the 10 patients in 14 genes, more expression is found in P2 rather than in P0.
Analysing the four ratio tables presented in the results, in AF, particularly 40% of samples
(considering only the samples in which genes are expressed in AF) show a rise of expression
when culturing the cells. In contrast, in CF (considering only the samples in which genes are
expressed in CF), 60% show a rise of expression from P0 to P2. It is interesting to conclude that
the different types of cell populations respond differently to culture in vitro. The percentages
were calculated from ratio results from tables 4.1, 4.2, 4.3 and 4.4.
In figure 5.1, regarding the comparison between P0 and P2, there is not much variation
between passages for cardiac and epicardial genes in children in both cell populations. With the
exception of TCF21, that rises during culture in AF and TBX20 and TCF21, that drop from P0 to
P2 in CF. In adults’ samples in AF do not show colour variation. In CF, there are more evident
variations between the two passages, except for GATA5 and TBX5.
Taking a closer look at the cardiac gene group, displayed in table 4.1, there is not a significant
difference between AF and CF, having 50% and 60% respectively, where expression rises with
culture. In AF, the main contributor for this percentage is TBX20, although most values are very
low and 3 samples do not show expression at all. TBX5, on the other hand, brings an opposite
contribution as almost all samples a higher expression of this gene in P0. It’s worth noting that
GATA5 is not expressed in any AF sample and GATA4 expression is absent in all AF cultures
derived from children. In CF, all genes contribute quite evenly to this result, unless we take both
age groups into consideration. Then, adults from GATA4 and GATA6 seem to strengthen
expression with culture.
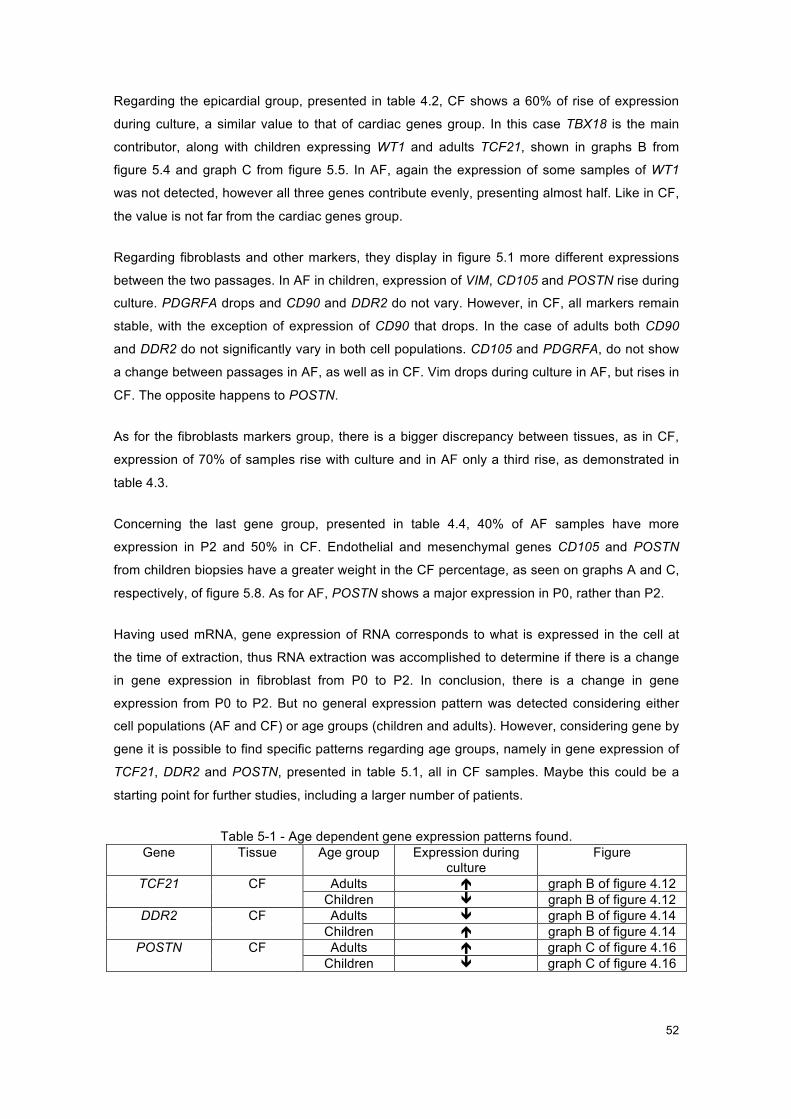
52
Regarding the epicardial group, presented in table 4.2, CF shows a 60% of rise of expression
during culture, a similar value to that of cardiac genes group. In this case TBX18 is the main
contributor, along with children expressing WT1 and adults TCF21, shown in graphs B from
figure 5.4 and graph C from figure 5.5. In AF, again the expression of some samples of WT1
was not detected, however all three genes contribute evenly, presenting almost half. Like in CF,
the value is not far from the cardiac genes group.
Regarding fibroblasts and other markers, they display in figure 5.1 more different expressions
between the two passages. In AF in children, expression of VIM, CD105 and POSTN rise during
culture. PDGRFA drops and CD90 and DDR2 do not vary. However, in CF, all markers remain
stable, with the exception of expression of CD90 that drops. In the case of adults both CD90
and DDR2 do not significantly vary in both cell populations. CD105 and PDGRFA, do not show
a change between passages in AF, as well as in CF. Vim drops during culture in AF, but rises in
CF. The opposite happens to POSTN.
As for the fibroblasts markers group, there is a bigger discrepancy between tissues, as in CF,
expression of 70% of samples rise with culture and in AF only a third rise, as demonstrated in
table 4.3.
Concerning the last gene group, presented in table 4.4, 40% of AF samples have more
expression in P2 and 50% in CF. Endothelial and mesenchymal genes CD105 and POSTN
from children biopsies have a greater weight in the CF percentage, as seen on graphs A and C,
respectively, of figure 5.8. As for AF, POSTN shows a major expression in P0, rather than P2.
Having used mRNA, gene expression of RNA corresponds to what is expressed in the cell at
the time of extraction, thus RNA extraction was accomplished to determine if there is a change
in gene expression in fibroblast from P0 to P2. In conclusion, there is a change in gene
expression from P0 to P2. But no general expression pattern was detected considering either
cell populations (AF and CF) or age groups (children and adults). However, considering gene by
gene it is possible to find specific patterns regarding age groups, namely in gene expression of
TCF21, DDR2 and POSTN, presented in table 5.1, all in CF samples. Maybe this could be a
starting point for further studies, including a larger number of patients.
Table 5-1 - Age dependent gene expression patterns found. Gene Tissue Age group Expression during
culture Figure
TCF21 CF Adults é graph B of figure 4.12 Children ê graph B of figure 4.12
DDR2 CF Adults ê graph B of figure 4.14 Children é graph B of figure 4.14
POSTN CF Adults é graph C of figure 4.16 Children ê graph C of figure 4.16

53
5.3. Comparison between Children and Adults
In culture, a difference between child and adult samples is already established, as children’s
fibroblasts grow more rapidly than adult ones, due to cellular metabolism. Having this in mind,
gene expression in children and adults is compared and analysed.
Concerning cardiac genes, GATA4 is not expressed in AF samples from children. It is
expressed in AF samples from adults, but the values are rather low, as shown in table 4.1 and
graph A from figure 4.5. In a study, a general expression of GATA4 in all samples was found,
however only adult samples were used (64). Expression of this cardiac gene was only expected
in CF, however in adults, it is expressed in AF. This could mean that this gene may have a
function in AF in adults. The zinc-finger transcription factor coding gene GATA6, is higher
expressed regarding other cardiac genes. It also appears to be higher expressed in CF in
children and in AF in adults, as seen in graph B of figure 4.5.
Regarding epicardial genes, WT1 it is absent in all AF samples from children, as seen in graph
B of figure 4.6, and two from adult patients. Expression of TCF21, is lower in AF children
samples, resulting in high CF/AF ratio values, shown in graph C of figure 4.6 and in table 4.2.
CHD are complex multifactorial diseases, in which the environment and genes interact. Purely
genetic diseases are however caused by gene mutations and are generally simpler than
multifactorial ones. However, in congenital disease, gene contribution weighs more than
environment. Note that this may be due to a specific gene, or other genes that interact or
influence the first one. Thus, it is expected to see more interesting results in children, than in
adults. Even tough, in most cases, the genetic reasons are also still completely unknown, due to
a variability of cardiac gene mutations and interactions with other genes, some genes are
already known to be associated to certain CHDs, like GATA4 for ASDII, for instance (48) (49)
(50) (51). However still in many cases, the mutated genes are unknown and causal association
has not been fully proven yet.
Regarding adult samples, the clinical diagnosis is important, since coronary and valvular heart
disease are also multifactorial diseases, but heavily influenced by the environment, associated
with aging and risk factors like high blood pressure (65), diabetes (66), high blood cholesterol
(67) obesity or lack of exercise (68), poor diet, smoking (69) and excessive alcohol consumption
(70). There is also an influence of the genetic background, that predispose people to suffer from
coronary heart disease, though the exact variations remain poorly understood.
Considering the used genes, and taking into account the literature review, in the introduction,
since some genes are associated with a couple of diagnoses, in particular of the children, it was
decided to detail a heatmap for each of the cases. Considering these interrelationships, and the
fact that CHDs are complex and more genes may be involved, a diagram, shown in figure 5.2,

54
depicts a brief overview of subsets of interaction of transcription factors and proteins of this
study. The genes were divided into groups with distinct colouring.
Figure 5.2 – Gene Interaction
Figure 5.2. – Genes coloured in red are cardiac factors that drive cardiac differentiation during
embryonic development. GATA4 interacts with NKX2-5; TBX5; TBX20 and GATA6. The pink
genes represent epicardial factors. WT1 interacts with TCF21 and TBX18 interacts with NKX2-5
and GATA4. The blue genes represent mesenchymal markers and the yellow one an
endothelial marker. Green stands for known fibroblasts markers. It is worth noting that the
asterisk for NKX2-5 means that this gene was not used in this study. However, since it has
interactions with other tested genes, it was decided to include it in the diagram.
These interactions are included in the table in attachment D, complemented by more
information from consulted literature. The table 5.1 presents a literature review of what each
gene encodes, its role and cellular location. It also shows what types of cells or where in the
body the gene is expressed. Also to which disease the gene is associated and with what other
genes it interacts. Finally, for the genes expressed in the heart, it is shown at what embryonic
stage it is expressed during cardiac development.
However, this work does not go into the molecular gene-to-gene detail, just simple finding that
there is expression. Since this expression may be different in CF and AF and may present
different values for each patient, it was considered interesting to detail the initial heatmap,
shown in figure 5.1, and present information for all patients. For the sake of better visualisation,
the heatmap was divided into groups of genes: cardiac, epicardial, and fibroblast, endothelial,
NKX2-5*
TBX5
TBX20
GATA4
GATA5
GATA6
TBX18
CD90
DDR2 POSTN
PDGRFA
CD105 TCF21
WT1

55
and mesenchymal markers, corresponding to figures 5.3, 5.4, 5.5 and 5.6, respectively. Adults
and children were considered, with the respective diagnoses. Differences found were marked
with green circles.
In attachment E, are presented some suggestions for future studies, discussed in the next
paragraphs.
Cardiac genes
Figure 5.3 – Heatmap of gene expression of cardiac genes in all patients
Figure 5.3 – Heatmap of gene expression of cardiac genes in all patients, considering their
diagnoses. Expression is displayed as low by the colour blue, and high by the colour red. The
green circles mark differences of gene expression found in one gene for different pathologies.
Abbreviations: CF, cardiac fibroblasts; AF, adipose derived fibroblasts; P0, passage zero; P2,
passage two.
Concerning GATA4, all younger patients show in both cell populations, in figure 5.3, a spectrum
of colour that matches the heatmap represented in figure 5.1. As for adults, clear different
expressions are present, especially in AF, for each diagnosis. As for GATA5, dark blue colour
remains for AF in both groups, confirming the absence of this gene. Expression of GATA5 for
children, remains stable overall, matching the white colour, except for patient 5, diagnosed with
ASDII, presenting a lower expression with light blue colour in figure 5.3. Adult results are
generally in agreement with the general heatmap. Concerning GATA6, it is interesting that
HLHS and ASDII stand out with higher expression values. Patient 8, MVR, also is higher
expressed than other patients. Regarding TBX5, both age groups are agreement with figure 5.1,
varying mostly between passages. For TBX20, children’s diagnoses present agreeable results.
In adults, both AVR patients show the same colours relating to general heatmap. Both MVR and
ACVB show differences.

56
Generally, ASD and ASDII show a similar expression of cardiac genes. However, in CF, ASDII
shows a rise of GATA4 and TBX20, shown in values of attachment C. A study demonstrated
that GATA4 and NKX2.5 specifically cooperate in activating atrial natriuretic factor and other
cardiac promoters, and physically interact both in vitro and in vivo (45). Also, GATA4 is known
to be directly associated to ASDII. As presented in figure 5.2, GATA4 does interact with other
cardiac genes like TBX20 (47) (17). It could be possible to justify the different expression of
TBX20 in ASDII due to interaction of GATA4 and TBX20. In the future, further studies of
patients with ASDII could be conducted analysing these genes in parallel.
A different study reported mutations within human TBX20 that were associated with a family
history of CHD and a complex spectrum of developmental anomalies, including defects in
septation, chamber growth, and valvulogenesis (53). Results from another study, present a
significantly enhanced transcriptional activity of TBX20, which was further increased in the
presence of co-transcription factors GATA4/5 and NKX2-5 (47). Another study raised the
possibility that GATA4, NKX2.5, and TBX5 function in a complex to regulate a subset of genes
required for cardiac septal formation (48). Future studies may analyse gene expression of
patients with diagnoses, mainly affecting cardiac chamber formation and septation, like HLHS
and CAVSD, paying closer attention to TBX20, GATA4/5 and NKX2-5. Regarding HLHS, the
patient shows a moderately invariable expression of cardiac genes, having a higher expression
of TBX5 in comparison to other patients it is directly associated with NKX2-5. Although it was
not tested in the present study, this difference could be explained by the interaction of NKX2-5
with TBX5 (46), shown in figure 5.1.
Concerning adult patients, TBX20, shown in figure 5.3, it has more expression in both AVR
patients and in patient 10, diagnosed with MVR. A study on TBX20, by in-vivo cardiac functional
analysis of Tbx20 heterozygous mutant mice, shows that haploinsufficiency of this gene
induced atrial dilation in all adult mice (15). This study points out the question whether it is just
developmental in origin or if also reflects specific adult functions for TBX20. This reminds
researchers and doctors to think of acquired cardiac disease in adults, instead of only behaviour
and environment influence also of a possible a gene influence in the cardiac function. Also, not
to only look to cardiac genes for embryonic development but to study their pathway in the adult
life.
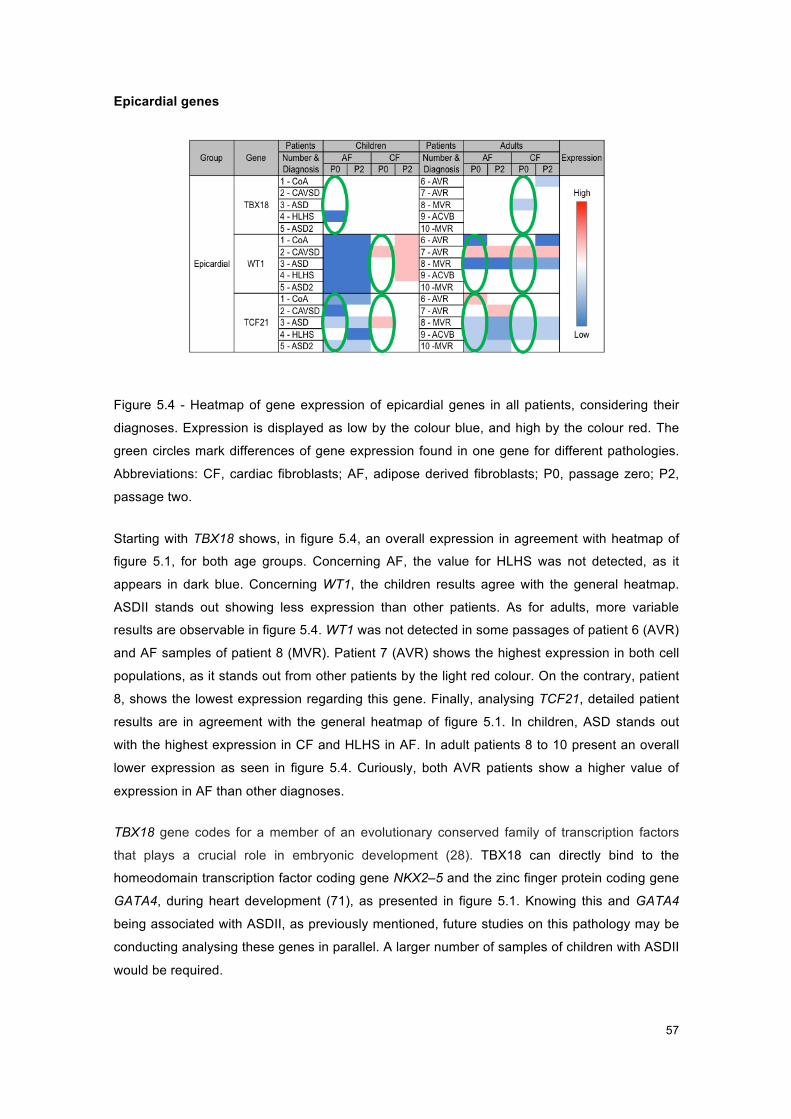
57
Epicardial genes
Figure 5.4 - Heatmap of gene expression of epicardial genes in all patients
Figure 5.4 - Heatmap of gene expression of epicardial genes in all patients, considering their
diagnoses. Expression is displayed as low by the colour blue, and high by the colour red. The
green circles mark differences of gene expression found in one gene for different pathologies.
Abbreviations: CF, cardiac fibroblasts; AF, adipose derived fibroblasts; P0, passage zero; P2,
passage two.
Starting with TBX18 shows, in figure 5.4, an overall expression in agreement with heatmap of
figure 5.1, for both age groups. Concerning AF, the value for HLHS was not detected, as it
appears in dark blue. Concerning WT1, the children results agree with the general heatmap.
ASDII stands out showing less expression than other patients. As for adults, more variable
results are observable in figure 5.4. WT1 was not detected in some passages of patient 6 (AVR)
and AF samples of patient 8 (MVR). Patient 7 (AVR) shows the highest expression in both cell
populations, as it stands out from other patients by the light red colour. On the contrary, patient
8, shows the lowest expression regarding this gene. Finally, analysing TCF21, detailed patient
results are in agreement with the general heatmap of figure 5.1. In children, ASD stands out
with the highest expression in CF and HLHS in AF. In adult patients 8 to 10 present an overall
lower expression as seen in figure 5.4. Curiously, both AVR patients show a higher value of
expression in AF than other diagnoses.
TBX18 gene codes for a member of an evolutionary conserved family of transcription factors
that plays a crucial role in embryonic development (28). TBX18 can directly bind to the
homeodomain transcription factor coding gene NKX2–5 and the zinc finger protein coding gene
GATA4, during heart development (71), as presented in figure 5.1. Knowing this and GATA4
being associated with ASDII, as previously mentioned, future studies on this pathology may be
conducting analysing these genes in parallel. A larger number of samples of children with ASDII
would be required.

58
An interesting detail is that WT1 was not expressed in AF in children, but it was expressed in AF
in adults. In a different study, WT1 expression was found in all of the visceral fat depots in mice,
including epicardial in the thoracic cavity, but it was not detected in the subcutaneous adipose
tissue, which is outside the body cavity (72). So, it is known that WT1 is expressed in adipose
tissue. The possible explanation for this curious absence of WT1 in adipose tissue derived
fibroblasts, is that the samples harvested from children are subcutaneous. The adipose tissue
samples from adults must have been collected from deeper sites of the body, like visceral
depots.
According to a recent study, TCF21 should be used as a visceral white (epididymal) adipose
tissue marker as it has an absolute distinctive ability primary cell culture in mouse (73).
Expression of TCF21 is however very low in AF either in both age groups. An explanation for
that is that gene is more related to the anatomical positioning of a certain tissue, rather than to
its function. Another cause would be the connection to WT1. Studies have demonstrated that
TCF21 expression in the proepicardial organ is dependent on WT1, meaning that in the
absence of WT1, TCF21 is also absent (74) (75). However, this interaction hasn’t been proved
for adipose tissue.
Regarding adults, TCF21 transcription factor plays an important role in cell fate and
differentiation in the developing embryonic coronary vasculature, as presented in table 5.2. This
gene promotes cardiac fibroblast differentiation also in the postnatal and adult heart. (30)
However increased expression of TCF21 after myocardial injury has not been reported (27). In
the present analysis, TCF21 is expressed in all patients. Since the patients that went through
mitral valve repair and most importantly a coronary bypass, stand for diagnosis that may
indicate some art of failure at the coronary level, both these diagnoses may indicate a flaw at
the activation and tissue repairing level once TCF21 is involved in the process of coronary
vascularisation. However, there is no further information available about these patients having
suffered myocardial injury. Nonetheless, further studies on this type of behaviour in different
diagnoses are necessary not only for understanding of the TCF21 regulatory interaction but also
towards repair and healing as this source of cells could enhance coronary revascularization
after cardiac injury.

59
Fibroblasts Markers
Figure 5.5 - Heatmap of gene expression of fibroblasts markers in all patients
Figure 5.5 - Heatmap of gene expression of fibroblasts markers in all patients, considering their
diagnoses. Expression is displayed as low by the colour blue, and high by the colour red. The
green circles mark differences of gene expression found in one gene for different pathologies.
Abbreviations: CF, cardiac fibroblasts; AF, adipose derived fibroblasts; P0, passage zero; P2,
passage two.
Taking a closer look at fibroblasts markers, CD90 expression values for both age group patients
agree with the heatmap of figure 5.1, as it is more highly expressed in AF. DDR2 values are
considerably stable, as presented in figure 5.5. In child patients 4 and 5, diagnosed with HLHS
and ASDII respectively, stand out with higher expression values in AF. The same happens for
adult patients 7 and 9, diagnosed with AVR and ACVB. This last one emerges from the age
group with a lower expression in CF. Lastly, analysing expression of intermediate filament
marker VIM, in children the CoA patients shows a lower expression and the HLHS patient a
much higher expression regarding other patients, in AF, as presented in figure 5.5. Both show a
lower expression in CF. Concerning adults patient 10 (MVR) stands out with an overall lower
expression of VIM.
In conclusion, all three markers present higher expression values for AF than other cardiac and
epicardial genes. Inside the group, DDR2 has the lowest expression, CD90 follows and VIM
shows more expression.
The HLHS patient shows a higher gene expression pattern in AF only, relatively to other
diagnoses. This could be an indicator that these cardiac diseases may interfere with these
genes, not only at cardiac level, but also in fibroblasts from other tissues.

60
Endothelial and Mesenchymal markers
Figure 5.6 - Heatmap of gene expression of endothelial and mesenchymal markers in all
patients
Figure 5.6 - Heatmap of gene expression of endothelial and mesenchymal markers in all
patients, considering their diagnoses. Expression is displayed as low by the colour blue, and
high by the colour red. The green circles mark differences of gene expression found in one
gene for different pathologies. Abbreviations: CF, cardiac fibroblasts; AF, adipose derived
fibroblasts; P0, passage zero; P2, passage two.
Starting with endoglin, it is higher expressed in HLHS and ASDII patients in CF, as presented
on figure 5.6. Regarding adults, expression is agreeable to heatmap from figure 5.1, however
ACVB patient exhibits a lower expression in CF than other patients. Concerning mesenchymal
marker PDGRFA, overall expression matches the one in the general heatmap of figure 5.1. In
children HLHS, present a lower expression in comparison to other patients. In adults, the same
occurs for ACVB patient. In adults, there is a variation in CF regarding passages, as light red
and red colour intercalate in figure 5.6. Finally, regarding periostin, overall expression in
children matches the one in the general heatmap of figure 5.1. As for adults, patients 8 and 9
(MVR and ACVB) show lower expression in AF. In CF, patient 7 (AVR) stands out expressing
higher values of POSTN in comparison to other patients.
The Endoglin gene, is expressed during early gestation (indicating human heart development
and angiogenesis) but is also present during and even after birth (33). In our results, it is
expressed after birth even up to 73 years. ASDII has four times more expression of CD105 than
ASD. This shows how genetic discrepancies at a genetic expression level are important and
can distinguish two diagnostics with the same physical malformation, thus underlining again the
relevance of genetic studies and how significant the malformations range is, even in the same
diagnosis. However more samples would be necessary to withdraw conclusions, since this is
derived that from two single values. Another point of view regarding endoglin, born infants have
their cardiac vasculature already organized, but since they are children and they are still
growing, the gene may still be active to facilitate vascularization. On the other hand, regarding

61
adults, this is a gene that might be activated when necessary to revascularization – in sequence
of any heart condition - repair of cardiac tissue, thus it is expected that the expression in adults
is relatively higher than children.
CD105 encodes a homodimeric transmembrane glycoprotein of the vascular endothelium
involved in angiogenesis and regulation of endothelial cell proliferation (31) and (32). The lower
values in CoA could point out the role exerted by this protein, since this diagnosis affects the
cardiac vasculature, namely the aorta, and this protein is responsible for the formation of
vessels during embryonic cardiac development, as presented in table 5.2.
In a different study, PDGRFA expression and secretion were up-regulated in obese mice and
found to stimulate collagen synthesis (35). It contributed to fibrosis, although, while inflammation
is frequently a major driver of fibrosis, PDGRFA activation was not associated with inflammation
(35). Although last study is directed to patients with obesity, it can be concluded that PDGRFA
stimulates collagen synthesis, the main component of fibroblasts. It is overall expressed in
fibroblasts, especially in AF.
As for adults, in another study, fibroblasts did not seem particularly enriched with PDGRFA
expression compared with whole atrial appendage (human atrium) or ventricular septum
(human ventricle), but it was expressed in both tissues (cardiac and foreskin) (64).
Cardiac expression of POSTN stands out, as it appears to be constant in all diagnosis in
children, figures 5.1, 5.6 and expression values in attachment C. This could be a good marker
for future studies, as it seems that periostin not only is present in the heart but also is not
affected by different pathologies in children. Since lack of POSTN would induce cardiac valve
disease (in mice) (36) we could expect a lack of expression of this gene in CF in HLHS and
CAVSD. However, this is not the case, since it is expressed in all patients. However, these two
diagnoses show the highest values of expression in AF. Other than cardiac development,
POSTN was identified to be potential novel mediator in adipogenesis, however its role has not
been reported yet. Exploring its role in adipocyte biology might provide more insights in
functions of adipocytes and if this gene (not altered in the heart) may be an indicator related to
CHD HLHS.
Expression of POSTN in CF in adults behaves differently than in children. Since lack of POSTN
would induce cardiac valve disease (in mice) (36) we could expect a lower expression of this
gene in CF in AVR and MVR patients, however this doesn’t happen. Again, these patients are
expected to have these diseases due to age and not due to genetic mutation. This ECM
component known fibroblast marker it is expressed in both heart and foreskin cells in another
project (64). This gene encodes a secreted extracellular matrix protein that functions in tissue
development and regeneration, including wound healing (fibroblasts) and ventricular

62
remodelling after myocardial infarction (76), however none of the tested patients had that
diagnosis, thus not showing high levels of expression of activated fibroblasts, but resting ones.

63
6. CONCLUSION
6.1. AF vs. CF
Origin influence
Fibroblasts are heterogeneous and exhibit topographical differentiation, meaning fibroblasts
from different anatomic sites have distinct characteristics and phenotypes, which can
subsequently be maintained in vitro when fibroblasts are isolated from their surrounding
environment and the influence of other cells. Additionally, fibroblasts from different anatomic
sites have distinct transcriptional patterns. Of particular interest, ECM gene expression patterns
can vary based on location of fibroblast harvest, as well as genes involved in lipid metabolism,
cell signalling pathways that control proliferation, cell migration, and cell fate determination (22).
Influence of origin in CF
Cardiac fibroblasts represent one major cell population in the heart, and are responsible for
many important cardiac functions. They also arise from different cardiac lineages, suggesting
that they are primed to transdifferentiation, and may be directly involved in cardiogenesis. The
objective of this study was to achieve a detailed analysis of the transcriptional activity of human
cardiac fibroblasts, derived from right and left atrium, assuming a possible contribution of the
fibroblast population in cardiac development. Of special interest in CF is that they express
certain cardiac genes (GATA4, GATA5, TBX20) but also other markers, like epicardial genes
WT1 or TCF21, which are not or only at a very low level expressed in AF. This clearly
underlines that fibroblasts of different histogenetic origin represent distinct populations, which
are identified by a discrete gene expression profile.
Current problem in fibroblast studies
Regarding fibroblasts, there is a lack of specific markers that complicates the study of this
lineage (6 p. 1) Research focussing on cardiac fibroblast is required to improve our
understanding of cardiac function in normal and pathophysiological states (21). With this,
techniques to model these cells for potential therapeutic applications, specialized therapies to
treat congenital and acquired heart disease may be further developed (3). In conclusion,
fibroblasts are perhaps the most underestimated cell population in the heart, and other tissues
(21).
64
Control
Both tissues are affected by the same pathology, meaning that a heart condition cannot only
affect cardiac derived fibroblasts but also adipose tissue derived fibroblasts. Thus, adipose
samples do not serve as a control. A conclusion is reached towards development of the
relationship between fibroblasts from these two different tissues, also at a cellular maintenance
level, even though they are distinct differentiated cell types as they display distinct and
characteristic transcriptional patterns (77).
Age group
So initially the main goal of this project was to compare fibroblast from adipose tissue and
cardiac tissue from patients of the hospital, both children and adults. However, after using these
genes, in children’s cells, it was detected that, as expected, some were expressed only in CF,
as it is the case for GATA4 and WT1 for children and GATA5 for both age groups, and some in
both cell populations, all the rest of tested genes.
Pathology
The pathology these patients have, especially in congenital heart disease, accuse the gene
responsible for it, like GATA4 for ASDII. And studies have mainly discussed expression of these
cardiac genes in heart tissue, especially during embryonic development, and no other tissues.
As cardiac genes were expected to be expressed only in the heart, and expression in adipose
tissue derived fibroblasts was also found, an interesting proposal for future studies would be to
analyse patterns of these genes in other fibroblast locations in parallel with heart fibroblasts
from patients with the same diagnosis. As these genes may reveal patterns in other locations
than the heart and by behaving differently they may serve as different indicators for the same
pathology. Thus, an adipose tissue sample could be harvested for diagnostic instead of cardiac
tissue. This could have a major impact on clinical; diagnostic or research utility and even later
support therapeutic practice. As a more available tissue can be harvested and invasive
intervention can be prevented. However, in the future, a much higher number of samples of
specific diagnosis is required for this study.
However, in adults it is different. Further analysis of embryonic as well as adult cardiac genes
with respect to their derivation, molecular regulation, and relationships to one another promises
to enhance our understanding of heart function and repair. In the future, potential studies of
gene influence and patterns in the heart may lead to new development of treatments, either of
congenital heart disease and adult cardiac diseases. Since some cardiac genes are present in
adult cardiomyopathies (15), this, questions whether these genes are expressed due to
developmental in origin or if also present in specific adult functions.

65
6.2. Culture
Culture influence
The results have also clearly shown that gene expression may change dramatically during in
vitro culture. With the alteration between P0 and P2, a conclusion is reached that there is in fact
a genetic alteration, in which genes are higher or lower expressed. In AF, there is a tendency
for fibroblasts markers to be higher expressed in P0 than in P2. In cardiac tissue the expression
appears to remain rather stable during culture, however a higher expression in P2 is shown in
the results.
Possible reasons
From P0 to P1, culture is cleaning the toxicity (also at DNA level) of the cells from the coming
tissue, like potential contamination of other types of cells that will not be able to proliferate in
culture as fibroblasts do, or even considering that, such young children that underwent surgery,
must have been heavily medicated, thus cell culture could allow a stabilised medium to
fibroblast growth. In P2, culture is stabilized thus allowing the possibility of having more
biological material for further studies. Only if too many passages were to be done in culture
there would be the risk to introduce DNA level mutations. It makes sense to make culture
because I get stable genetic material and a more cell lineage homegeneity. Since the sample
comes from a patient, and these cells are being grown cultured, the DNA stays the same and
that allows a genetic study of that patient, with a specific diagnostic.
Analysis performed in this project – future studies In this study, CF vs. AF was analysed in P0, since it is the passage closest to the in vivo
situation. Therefore, in the future, it might be useful to obtain the cell population directly by
FACS (Fluorescence-activated cell sorting) sorting ex vivo from a biopsy to determine their in
vivo gene expression profile.
Future specific media optimization
Since the difference of the gene expression between both passages in each cell type is
different, a suggestion for future studies would be to bet on an optimization of specific culture
protocols for both adipose and cardiac tissue fibroblasts. For instance, in culture medium choice
of extra ingredients for specific stimulus for each type of cell could be considered, as well
different growing conditions, if necessary, in order to develop more specific cell lineages.

66
Technique used in this project – future studies
Concerning culture technique used in this project, methodology makes sense if we want to
understand the influence of the gene. The gene is the one that changes culture. The utility of
using methodology to understand gene expression in certain tissues adds value to clinical part.
Cells do not change throughout culture; however, the gene may be more or less expressed
depending on the type of gene (transcription factor, on/off, healing activated, etc.) and the
patient (pathology). Medium and technique was repeated, gene expression is the one that
changes. Testing different genes, because they are expressed in different quantities, times and
tissues. This approach may bring clues to pathologies, analysing different genes for each
diagnosis, since in most CHD cases the genetic reasons are also still not understood or
unknown. Undoubtedly a study with a large number of samples for each diagnosis will have to
be conducted for more consistent results. It makes sense to do cell culture, because, possibly,
there is more availability of gene material and biological material availability, i.e. after analysis
we can conclude that instead of cardiac samples, for some genes there are more accessible
tissue for the same patient, like adipose tissue.
6.3. Children vs. Adults
Age group influence
Most noticeable difference within pathologies is the expression of GATA4 and WT1 for children
and GATA5 for both age groups, only in CF.
For a more detailed study and a bigger number of patients with same diagnostics is needed
independently of the age. Apart from the main objective, there was the opportunity, having
studied all 14 genes in further detail, to link certain pathologies. This interesting differential
expression could bring another instrument to take the study of genetic etiology further.
CHD
Regarding the children, the type of information given by the results, serve as an argument to bet
on genetic studies, in case there is a congenital syndrome with a directly associated gene. In
that way, the different gene expression levels observed could point for candidate genes, or
specific molecular genetic testing (like sequencing or comparative genomic hybridization) and
contribute to understand the genetic disease etiology. Since the diagnostic and treatment are
most of the time clinical if the genetic history is known, therapeutic treatment can be altered and
improved for that specific disease.

67
Nowadays it is known that embryonic heart development is dependent on the regulated and
complex activity of encoding members of the zinc-finger, homoeodomain, T-box and basic
helix–loop–helix domain families (17). Future studies, concerning genetic pathways in the
developing heart can lead to the understanding of the genetic basis of CHD (78). Along with
other methodology and other techniques, networks and pathways that define the complex
cardiac biology and behaviour must be studied and connected in order to better understand the
cardiogenesis and enhance therapies directed toward cardiac repair and regeneration. (1)
An early diagnosis for children with cardiac malformations is another point to take into
consideration. Cardiac anomalies can be detected in pregnant women by echocardiogram or
ecodoppler as a clinical diagnosis. An amniocentesis, a procedure in which amniotic fluid is
sampled for further genetic tests, may help know what type of cardiac malformation the foetus
presents, other than visual clinical diagnosis. This may help regarding interruption of pregnancy
if the diagnosis is severe, also with the child’s life quality. Other than that, it may also inform
parents of a genetic predisposition regarding future pregnancies.
Cardiovascular disease
These gene studies, may also apply to adults. It might bring clues to understand differential
diagnostics in the adult, because genetic changes in children are major and minor in adults, but
they might cause problems later on. Understanding the biology of the heart during
cardiogenesis would allow studies of the adult heart to whether cardiac genes remain in the
postnatal heart or may be reactivated during repair after cardiac injury (18). Especially regarding
direct-reprogramming (79). Taking advantage of the wound healing aspect of fibroblasts,
towards the adult population allowing the treatment for heart disease.

68
This page was intentionally left blank

69
REFERENCES
1. Latif, S., Masino, A., & Garry, D.J. Transcriptional pathways direct cardiac development and regeneration. Trends in cardiovascular medecine. 16(7), 2006, pp. 234-240.
2. Buckingham, M., Meilhac, S., & Zaffran, S. Building the mammalian heart from two sources of myocardial cells. Nature reviews genetics. 6(11), 2005, pp. 826-837.
3. Garry, D.J., & Olson, E.N. A common progenitor at the heart of development. Cell. 127(6), 2006, pp. 1101-1104.
4. Masino, A.M., Gallardo, T.D., Wilcox, C.A., Olson, E.N., Williams, R.S., & Garry, D.J. Transcriptional regulation of cardiac progenitor cell populations. Circulation research. 95(4), 2004, pp. 389-397.
5. Tzahor, E., & Evans, S.M. Pharyngeal mesoderm development during embryogenesis: implications for both heart and head myogenesis. Cardiovascular research. 91(2), 2011, pp. 196-202.
6. Laginess, J.D., & Conway, S.J. Origin, development, and differentiation of cardiac fibroblasts. Journal of molecular and cellular cardiology. 70, 2014, pp. 2-8.
7. Arceci, R. J., King, A., Simon, M. C., Orkin, S. H., & Wilson, D. B. Mouse GATA-4: a retinoic acid-inducible GATA-binding transcription factor expressed in endodermally derived tissues and heart. Molecular and cellular biology. 4, 1993, Vol. 13, pp. 2235-2246.
8. Laitinen, M.P., Anttonen, M., Ketola, I., Wilson, D.B., Ritvos, O., Butzow, R., & Heikiheimo, M. Transcription Factors GATA-4 and GATa.6 and a GATA Family cofactor, FOG-2, Are Expressed in Human Ovary and Sex Cord-Derived Ovarian Tumors 1. The Journal of Clinical Endocrinology & Metabolism. 9, 2000, Vol. 85, pp. 3476-3483.
9. Zheng, R., & Blobel, G. A. (2011). GATA transcription factors and cancer. Genes & cancer. 12, 1 April 2011, Vol. 1, pp. 1178-1188.
10. Molkentin, J.D. The zinc finger-containing transcription factors GATA-4,-5, and -6 ubiquitously expressed regulators of tissue-specific gene expression. Journal of biological chemistry. 275(50), 2000, pp. 38949-38952.
11. Paige, S.L., Plonowska, K., Xu, A., & Wu, S.M. Molecular regulation of cardiomyocyte differentiation. Circulation research. 2, 2015, Vol. 116, pp. 341-353.
12. Maitra, M., Koenig, S.N., Srivastava, D., & Garg, V. Identification of GATA6 sequence variants in patients with congenital heart deffects. Pediatric research. 4, 2010, Vol. 68, pp. 281-285.
13. Suzuki, E., Evans, T., lowry, J., Truong, L., Bell, D.W., Testa, J.R., & Walsh, K. The HumanGATA-6Gene: Structure, Chromosomal location, and Regulation of Expression by Tissue-Specific and mitogen-Responsive Signals. Genomics. 3, 1996, Vol. 38, pp. 283-290.
14. Yorifuji, T., Kawakita, R., Hosokawa, Y., Fujimaru, R., Yamaguchi, E., & Tamagawa, N.,. Dominantly inherited diabetes mellitus caused by GATA6 haploinsufficency: variable intrafamilial presentation. Journal of medical genetics. 10, 2012, Vol. 49, pp. 642-643.
70
15. Stennard, F.A., Costa, M.W., Lai, D., Biben, C., Furtado, M.B., Solloway, M.J., ... & Elliot, D. E. Murine T-box transcription factor Tbx20 acts as a repressor during heart development, and is essential for adult heart integrity, function and adaptation. Development. 10, 2005, Vol. 132, pp. 2451-2462.
16. Meins, M., Henderson, D. J., Bhattacharya, S. S., & Sowden, J. C. Characterization of the human TBX20 gene, a new menber of the T-box gene family closely related to the Drosophila H15 gene. Genomics. 3, 2000, Vol. 67, pp. 317-332.
17. Stennard, F.A., Costa, M.W., Elliott, D.A., Rankin, S., Haast, S.J., Lai, D., ... & Zorn, A. M. Cardiac T-box factor Tbx20 directly interacts with Nkx2-5, GATA4, and GATA5 in regulation of gene expression in the developing heart. Developmental biology. 2, 2003, Vol. 262, pp. 206-224.
18. Snider, Paige, et al. Origin of cardiac fibroblasts and the role of periostin. Circulation research. 105.10, 2009, pp. 934-947.
19. Dobaczewski, M., Gonzalez-Quesada, C., Frangogiannis, N.G. The extracellular matrix as a modulator of the inflammatory and reparative response following myocardial infarction. Journal of molecular and cellular cardiology. 2010, Vol. 48(3), pp. 504-511.
20. Krenning, G., Zeisberg, E.M., & Kalluri, R. The origin of fibroblasts and mechanism of cardiac fibrosis. Journal of cellular physiology. 225(3), 2010, pp. 631-637.
21. Camelliti, P., Borg, T.K., & Kohl, P. Structural and functional chacracterization of cardiac fibroblasts. Cardiovascular research. 65(1), 2005, pp. 40-51.
22. Zeisberg, E:M:, & Kalluri, R. Originis of cardiac fibroblasts. Circulation research. 107811, 2010, pp. 1304-1312.
23. Moore-Morris, T., et al. Resident fibroblast lineages mediate pressure overload-induced cardiac fibrosis. The journal of clinical investigation. 124(7), 2014, pp. 2921-2934.
24. Milgrom-Hoffman, M., Harrelson, Z., Ferrara, N., E., Evans, S.M., & Tzahor, E. The heart endocardium is derived from vascular endothelial progenitors. Development. 138(21), 2011, pp. 4777-4787.
25. Zhou, B., Ma, Q., Rajagopal, S., Wu, S.M., Domian, I., Rivera-Feliciano, J., ... & Pu, W. T. Epicardial proenitors contribute to the cardiomyocyte lineage in the developing heart. Nature. 7200, 2008, Vol. 424, pp. 109-113.
26. Deb, A., Ubil, E. Cardiac fibroblast in development and wound healing. Journal of molecular and cellular cardiology. 70, 2014, pp. 47-55.
27. Braitsch, C.M., Combs, M.D., Quaggin, S.E., & Yutzey, K.E. Pod1/Tcf21 is regulated by retinoic acid signalling and inhibits differentiation of epicardium-derived cells into smooth muscle in the developing heart. Developmental biology. 2, 2012, Vol. 368, pp. 345-357.
28. Cai, C.L., Martin, J.C., Sun, Y., Cui, L., Wang, L., Ouyang, K., ... & Stallcup, W.B. A myocardial lineage derives from Tbx 18 epicardial cells. Nature. 7200, 2008, Vol. 454, pp. 104-108.
29. Christoffels, V.M., Mommersteeg, M.T., Trowe, M.O., Prall, O.W., De Gier-de-Vries, C., Soufan, A.T., ... & Kispert, A. Formation of the venous pole of the heart from an Nkx2-5-

71
negative precursor population requires Tbx18. Circulation research. 12, 2006, Vol. 98, pp. 1555-1563.
30. Braitsch, C.M., & Yutzey, K.E. Transcriptional control of cell lineage development in epicardium-derived cells. Journal of developmental biology. 1(2), 2013, pp. 92-111.
31. Lebrin, F., Goumans, M.J., Jonker, L., Carvalho, R.L., Valdimarsdottir, G., Thorikay, M., ... & ten Djike, P. Endoglin promotes endothelial cell proliferation and TGF-β/ALK1 signal transduction. The EMBO journal. 20, 2004, Vol. 23, pp. 4018-4028.
32. Ríus, C., Smith, J.D., Almendro, N., Langa, C., Botella, L. M., Marchuk, D.A., ... & Bernabéu, C. Cloniing of the promoter region of human endoglin, the target gene for hereditary hemorrahagic telangiectasia type 1. Blood. 12, 1998, Vol. 92, pp. 4677-4690.
33. Valeria, B., Maddalena, G., Enrica, V., Onofrio, T., & Gaetano, B. Endoglin (CD105) expression in the human heart throughout gestation: an immunohistochemical study. Reproductive Sciences. 10, 2008, Vol. 15, pp. 1018-1026.
34. Mallet, C., Lamribet, K., Giraud, S., Dupuis-Girod, S., Feige, J.J., Bailly, S., & Tillet, E. Functional analysis of endoglin mutations from hereditary hemorrhagic telangiectasia type 1 patients reveals different mechanisms for endoglin loss of function. Human molecular genetics. ddu 531, 2014.
35. Marcelin, G., Ferreira, A., Liu, Y., Atlan, M., Aron-Wisnewsky, J., Pelloux, V., ... & Hénégar, C. A PDGFRa-Mediated Switch toward CD9 high Adipocyte Progenitors Controls Obesity-Induced Adipose Tissue Fibrosis. Cell Metabolism. 2017.
36. Snider, Paige, et al. Periostin is required for maturation and extracellular matrix stabilization of noncardiomyocyte lineages of the heart. Circulationn research. 102.7, 2008, pp. 752-760.
37. Doppler, S. A., Carvalho, C., Lahm, H., Deutsch, M. A., Dreßen, M., Puluca, N., ... & Krane, M. Cardiac fibroblasts: more than mechanical support. Journal of thoracic disease, . 9, 2017, Vol. Suppl 1, p. S36.
38. Goldsmith, E.C., Bradshaw, A.D., Zile, M.R., & Spinale, F.G. myocardial fibroblast-matrix interactions and potential therapeutic targets. Journal of molecular and cellular cardiology. 70, 2014, pp. 92-99.
39. Souders, C.A., Bowers, S. L., & Baudin, T.A. Cardiac fibroblasts the renaissance cell. Circulation research. 105(12), 2009, pp. 1164-1176.
40. Lahm, H., Schön, P., Doppler, S., Dressen, M., Cleuziou, J., Deutsch, M., A., ..., & Krane, M. Tetralogy of Fallot and Hydroplastic Left Heart Syndrome-Complex Clinical Phenotypes Meet Complex Genetic Networks. Current genomics. 16(3) , 2015, pp. 141-158.
41. Hoffman, J.I., & Kaplan, S. The incidence of congenital heart disease. Journal of American Colege of Cardiology. 39(12), 2002, pp. 1890-1900.
42. Olson, E. N., & Srivastava, D.,. Molecular pathways controlling heart development. Science. 5262, 1996, Vol. 272, p. 671.
43. Fishman, M.C., & Olson, E.N. Parsing the heart genetic modules for organ assembly. Cell. 2, 1997, Vol. 91, pp. 153-156.
72
44. Komuro, I., & Izumo, S. Csx: a murine homeobox-containing gene specifically expressed in the developing heart. Proceedings of the National Academy of Sciences. 17, 1993, Vol. 90, pp. 8145-8149.
45. Durocher, D., Charron, F., Warren, R., Scwartz, R. J., & Nemer, M. The cardiac transcription factors Nkx2-5 and GATA-4 are mutual cofactors. The EMBO journal. 18, 1997, Vol. 16, pp. 5687-5696.
46. Hiroi, Y., Kudoh, S., monzen, K., Ikeda, Y., Yazaki, Y., Nagai, R., & Komuro, I. Tbx5 associates with Nkx2-5 and synergistically promotes cardiomyocyte differentiation. Nature Genetics. 28, 2001, Vol. 3, pp. 276-280.
47. Posch, M. G., Perrot, A., Berger, F., & Ozcelik, C. molecular genetics of congenital atrial septal defects. Clinical research in cardiology. 3, 2010, Vol. 99, pp. 137-147.
48. Garg, V., Kathiriya, I.S., Barnes, R., Schluterman, M.K., King, I. N., Butler, C.A., ... & Matsuoka, R. GATA4 mutations cause human congenital heart defects and reveal an interaction with TBX5. Nature. 6947, 2003, Vol. 424, pp. 443-447.
49. Hirayama-Yamada, K., Kamisago, M., Akimoto, K., Aotsuka, H., Nakamura, Y., Tomita, H., ... & Matsuoka, R. Phenotypes with GATA4 or NKX2. 5 mutations in familial atrial septal defect. American journal of medical genetics Part A. 1, 2005, Vol. 135, pp. 47-52.
50. Tomita-Mitchell, A., Maslen, C.L., Morris, C. D., Garg, V., & Goldmuntz, E. GATA4 sequence variants in patients with congenital heart disease. Journal of medical genetics. 12, 2007, Vol. 44, pp. 779-783.
51. Chen, Y., Han, Z.Q., Yan, W.D., Tang, C.Z., Xie, J.Y., Chen, H., & Hu, D.Y. A novel mutation in GATA4 gene associated with dominant inherited familial atrial septal defect. The Journal of thoracic and cardiovascular surgery. 3, 2010, Vol. 140, pp. 684-687.
52. Benson, D.W., Sharkey, A., Fatkin, D., Lang, P., Basson, C.T., McDonough, B., ... & Seidman, C.E. Reduced penetrance, variable expressivity, and genetic heterogeneity of familial atrial septal defects. Circulation. 97, 1998, Vol. 20, pp. 2043-2048.
53. Kirk, E.P., Sunde, M., Costa, M.W., Rankin, S.A., Wolstein, O., Castro, M.L., ... & Mackay, J.P. Mutations in cardiac T-box factorgene TBX20 are associated with diverse cardiac pathologies, including defects of sptation and valvulogenesis and cardiomyopathy. The American Journal of Human Genetics. 2, 2007, Vol. 81, pp. 280-291.
54. Lin, X., Huo, Z., liu, X., Zhang, Y., Li, L., Zhao, H., ... & Chen, Y.H. A novel GATA6 mutation in patients with tetralogy of Fallot or atrial septal defect. Journal of human genetics. 10, 2010, Vol. 55, pp. 662-667.
55. Craig, B. Atrioventricular septal defect from fetus to adult. Heart. 12, 2006, Vol. 92, pp. 1879-1885.
56. Carmi, R., Boughman, J.A., & Ferencz, C. endocardial cushion defect further studies of "isolated" versus "syndromic" ocurrence. american journal of medical genetics. 3, 1992, Vol. 43, pp. 569-575.
57. Rajagopal, S. K., Ma, Q., Obler, D., Shen, J., Manichaikul, A., Tomita-Mitchell, A., ... & Goldmuntz, E. Spectrum of heart disease associated with murine and human GATA4 mutation. Journal of molecular and cellular cardiology, . 43, 2007, Vol. 6, pp. 677-685.

73
58. Zhang, W., Li, X., Shen, A., Jiao, W., Guan, X., & Li, Z. GATA4 mutations in 486 Chinese patients with congenital heart disease. European Journal of medical genetics,. 51, 2008, Vol. 6, pp. 527-535.
59. World Health Organization. World Health Organization. [Online] 09 2016. [Cited: 10 12 2016.] http://www.who.int/mediacentre/factsheets/fs317/en/.
60. Cooper, G.M., & Hausman, R.E. The cell: A molecular approach. Washington D.C. : ASM Press, 2004.
61. Maity, B. Sheff, D., & Fisher, R.A. Immunostaining: detection of sgnalling protein location in tissues, cells and subcellular compartments. Methods in cell biology. 113, 2012, pp. 81-105.
62. Wong, T., McGrath, J.A., & Navsaria, H. The role of fibroblasts in tissue engineering and regeneration. British Journal of Dermatology. 156(6), 2007, pp. 1149-1155.
63. Seifter, J., Sloane, D., & Ratner, A. Concepts in medical physiology. s.l. : Lippincott Williams & Wilkins, 2005.
64. Furtado, M.B., Costa, M.W., Pranoto, E.A., Salimova, E., Pinto, A.R., Lam, N.T., ... & Boyd, R. Cardiogenic genes expressed in cardiac fibroblasts contibute to heart development and repair. Circulation research. 114(9), 2014.
65. World Health Organization, WHO. A global brief on hypertension: silent killer, global public health crisis. People. 2017.
66. Peters, S. A., Huxley, R. R., & Woodward, M. Diabetes as risk factor for incident coronary heart disease in women compared with men: a systematic review and meta-analysis of 64 cohorts including 858,507 individuals and 28,203 coronary events. 2014.
67. Varbo, A., Benn, M., Tybjærg-Hansen, A., Jørgensen, A. B., Frikke-Schmidt, R., & Nordestgaard, B. G. Remnant cholesterol as a causal risk factor for ischemic heart disease. Journal of the American College of Cardiology. 61, 2013, Vol. 4, pp. 427-436.
68. Bastien, M., Poirier, P., Lemieux, I., & Després, J. P. Overview of epidemiology and contribution of obesity to cardiovascular disease. Progress in cardiovascular diseases. 56, 2014, Vol. 4, pp. 369-381.
69. Tolstrup, J. S., Hvidtfeldt, U. A., Flachs, E. M., Spiegelman, D., Heitmann, B. L., Bälter, K., … & Pereira, M. Smoking and risk of coronary heart disease in younger, middle-aged, and older adults. . American journal of public health. 104, 2014, Vol. 1, pp. 96-102.
70. Roerecke, M., & Rehm, J. Alcohol consumption, drinking patterns, and ischemic heart disease: a narrative review of meta-analyses and a systematic review and meta-analysis of the impact of heavy drinking occasions on risk for moderate drinkers. BMC. 2014.
71. Farin, H.F., Bussen, M., Schmidt, M.K., Singh, M.K., Schuster-Gossler, K., & Kispert, A. Transcriptional repression by the T-box proteins Tbx18 and Tbx15 depends on Groucho corepressors. Journal of Biological Chemistry. 35, 2007, Vol. 282, pp. 25748-25759.
72. Chau, Y.Y., Bandiera, R., Serrels, A., Martinez-Estrada, O.M., Qing, W., Lee, M., ...& Stimson, R.H. Visceral and subcutaneous fat have different origins and evidence supports a mesothelial source. Nature cell biology. 4, 2014, Vol. 16, pp. 367-375.

74
73. de Jong, J.M., Larson, O., Cannon, B., & Nedergaard, J. A stringent validation of mouse adipose tissue identity markers. American Journal of Physiology-Endocrinology and Metabolism. 12, 2015, Vol. 308, pp. E1085-E1105.
74. Miller, C.L., Anderson, D. R., Kundu, R.K., Rajesdana, A., Nürnberg, S.T., Diaz, R., ... & Schadt, E.E. Disease-related growth factor and embryonic signalling pathways modulate an enhancer of TCF21 expression at the 6q23.2 coronary heart disease locus. PloS Genet. 7, 2013, Vol. 9, p. e 1003652.
75. White, J.T., Zhang, B., Cerqueira, D.M., Tran, U., & Wessely, O. Notch signalling, wt1 and foxc2 are key regulators of the podocyte gene regulatory network in Xenopus. Development. 11, 2010, Vol. 137, pp. 1863-1873.
76. Quinn, K.P., Sullivan, K.E., Liu, Z., Ballard, Z., Siokatas, C., Georgakoudi, I., & Black, L.D. Optical metrics of the extracellular matrixpredict compositional and mechanical changes after myocardial infarction. [Online] 7 November 2016. Sci. Rep. 6, 35823; doi: 10.1038/srep35823 (2016)..
77. Santiago, J.J., Dangerfield, A.L., Rattan, S.G., Bathe, K.L., Cunnington, R.H., Raizman, J.E., ... & dixon, I. Cardiac fibroblast to myofibroblast differentiation in vivo and in vitro. expression of focal adhesion components in neonatal and adult rat ventricular myofibroblasts. Developmental dynamics. 239(6), 2010, pp. 1573-1584.
78. Prall, O. W., Elliott, D. A., & Harvey, R. P. Developmental paradigms in heart disease: insights from tinman. . Annals of medicine. 3, 2002, Vol. 34, pp. 148-156.
79. Ieda, M., Fu, J.D., Delgado-Olguin, P., Vedantham, V., Hayashi, Y., Bruneau, B.G., & Srivastava, D. Direct reprogramming of fibroblasts into functional cardiomyocytes by defined factors. Cell. 142(3), 2010, pp. 375-386.

75
ATTACHMENTS
Attachment A - List of consumables, software and used primers
Consumables Material Manufacturer Disposable gloves (Powder-free 100) Semper Disposable gloves (Purple Nitrile powder-free Kimberly-Clark
Erlenmeyer flasks (200ml, 500ml) Neubert-Glas Filter (30µm, 70µm) BD Falcon Cryo tubes (1ml, sterile) Thermo Scientific Petri dishes (150x15mm) Omnilab Tweezers Cell culture multiwell plates (6 well, 12 well) Greiner Bio One Surgical Disposable Scalpels B.Braun Pipette tips (0,1-10µl S, 0,1-10µl M, 2-20µl, 10-100µl, 100-1000µl) Eppendorf
Safe-Lock Tubes (1,5ml, 2ml) Eppendorf Serological pipettes (sterile, 5ml, 10ml, 25ml) Kisker Syringe (2ml, 5ml, 10ml) B.Braun Sterile filter (0,22µm) Carl Roth GmbH & Co. KG Centrifuge tubes PP (sterile, 15ml, 50ml) Corning Incorporated Cell culture flasks (25cm2, 75cm2) SPL Life Sciences Falcon Tubes (15ml, 50ml) BD Falcon pLenti6.2-GW/EmGFP Expression Control Vector Invitrogen
LightCycler® 480 Multiwell Plates 96 Roche Ceramic Beads Kit 1.4 mm, 2 mL tubes Precellys®
2mL tubes with 1.4mm ceramic (zirconium oxide) beads
Software Designation Manufacturer Axio Vision (Version 4.8.2) ZEISS NanoDrop 2000/2000c Thermo Scientific Quantity One Chemidoc XRS (Version 4.6.9) Bio-Rad ABI Prism 7000 SDS 1.0 Applied Biosystems LightCycler Software (Version 3.5) Roche Microsoft Excel 2010 Microsoft SPSS 22.0 IBM
Primers Used

76
hu β-Actin_F382 5’-CCA ACC GCG AGA AGA TGA-3’ hu β-Actin_F478 5’-CCA GAG GCG TAC AGG GAT AG-3’ hu CD90_F1330 5’-AGG ACG AGG GCA CCT ACA C-3’ hu CD90_R1436 5’-GCC CTC ACA CTT GAC CAG TT-3’ hu CD105_F593 5’-AAT GCC ATC CTT GAA GTC CA-3’ hu CD105_R687 5’-GTG CCA TTT TGC TTG GAT G-3’ hu DDR2_F1528 5’-TAT GGC ACC CAC AAC CTA TG-3’ hu DDR2_R1628 5’-TGG CCA GGA GGA TAA AGA TG-3’ hu GATA4_F1513 5’-GGA AGC CCA AGA ACC TGA AT-3’ hu GATA4_R1607 5’-GCT GGA GTT GCT GGA AGC-3’ hu GATA5_F738 5’-CTC GTT CGG CCT CAG AAG-3’ hu GATA5_R813 5’-TGT TGG TCG TGT GGC AGT-3’ hu GATA6_F1524 5’-GCG GGC TCT ACA GCA AGA T-3’ hu GATA6_R1601 5’-TGG CAC AGG ACA ATC CAA G-3’ hu PDGRFA_F3163 5’-CCA CCT GAG TGA GAT TGT GG -3’ hu PDGRFA_R3245 5’-TCT TCA GGA AGT CCA GGT GAA -3’ hu POSTN_F989 5’-ATG GGA GAC AAA GTG GCT TC-3’ hu POSTN_R1076 5’-CTG CTC CTC CCA TAA TAG ACT CA-3’ hu TBX5_F888 5’-TGA TCA TAA CCA AGG CTG GA-3’ hu TBX5_R953 5’-GAT TAA GGC CCG TCA CCT TC-3’ hu TBX18_F1136 5’-CCT GGA ATT CCC AAG CAA G-3’ hu TBX18_R1236 5’-GAG GAG CCA GAC AAA AGG TG-3’ hu TBX20_F993 5’-AGT CAG ACA ACC CCA AAT CG-3’ hu TBX20_R1086 5’-ACC CAG GAA AAC TGG AAG AAG-3’ hu TCF21_F6 5’-CTC CTC TAC GGC CAC GAC T-3’ hu TCF21_R97 5’-TCG CAG AGT TGT GAG AAG GA-3’ hu VIM_F954 5’-AAA GTG TGG CTG CCA AGA AC-3’ hu VIM_R1027 5’-AGC CTC AGA GAG GTC AGC AA-3’ hu WT1_F1045 5’-GAG GAC GCC CTA CAG CAG-3’ hu WT1_R1133 5’-AGG TGG CTC CTA AGT TCA TCT G-3’

77
Attachment B - Standard curve for CD90

78
This page was intentionally left blank
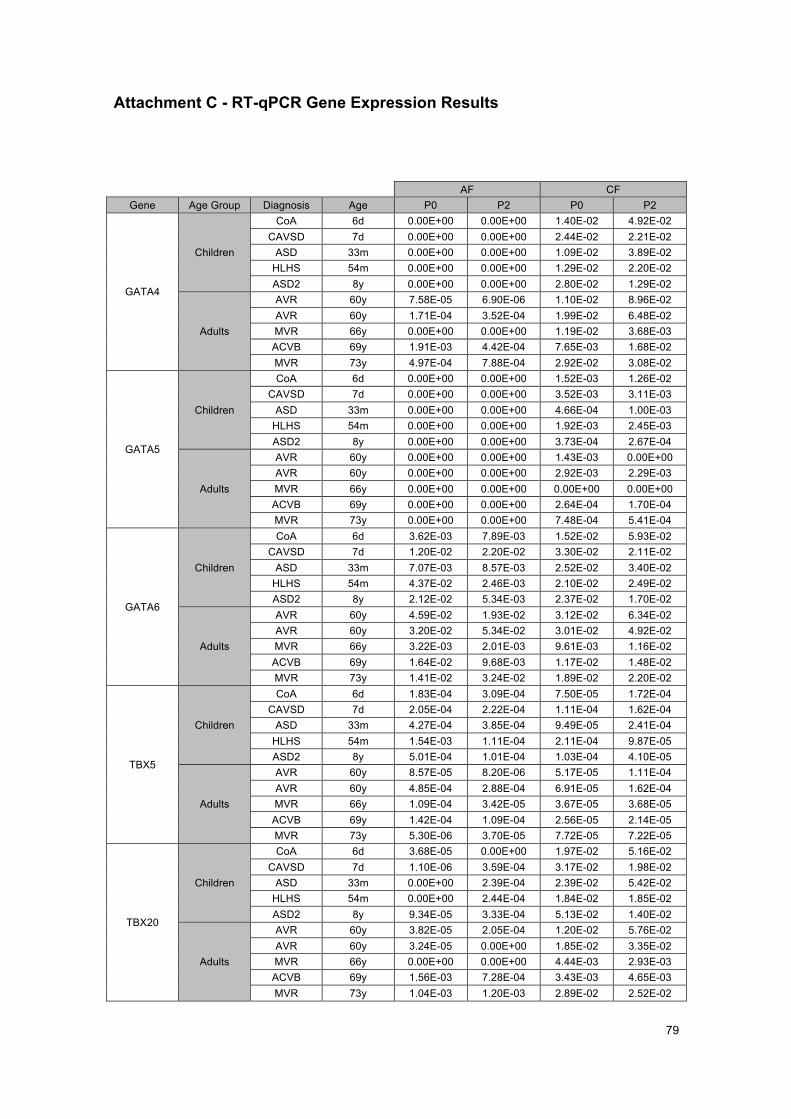
79
Attachment C - RT-qPCR Gene Expression Results
AF CF Gene Age Group Diagnosis Age P0 P2 P0 P2
GATA4
Children
CoA 6d 0.00E+00 0.00E+00 1.40E-02 4.92E-02 CAVSD 7d 0.00E+00 0.00E+00 2.44E-02 2.21E-02
ASD 33m 0.00E+00 0.00E+00 1.09E-02 3.89E-02 HLHS 54m 0.00E+00 0.00E+00 1.29E-02 2.20E-02 ASD2 8y 0.00E+00 0.00E+00 2.80E-02 1.29E-02
Adults
AVR 60y 7.58E-05 6.90E-06 1.10E-02 8.96E-02 AVR 60y 1.71E-04 3.52E-04 1.99E-02 6.48E-02 MVR 66y 0.00E+00 0.00E+00 1.19E-02 3.68E-03 ACVB 69y 1.91E-03 4.42E-04 7.65E-03 1.68E-02 MVR 73y 4.97E-04 7.88E-04 2.92E-02 3.08E-02
GATA5
Children
CoA 6d 0.00E+00 0.00E+00 1.52E-03 1.26E-02 CAVSD 7d 0.00E+00 0.00E+00 3.52E-03 3.11E-03
ASD 33m 0.00E+00 0.00E+00 4.66E-04 1.00E-03 HLHS 54m 0.00E+00 0.00E+00 1.92E-03 2.45E-03 ASD2 8y 0.00E+00 0.00E+00 3.73E-04 2.67E-04
Adults
AVR 60y 0.00E+00 0.00E+00 1.43E-03 0.00E+00 AVR 60y 0.00E+00 0.00E+00 2.92E-03 2.29E-03 MVR 66y 0.00E+00 0.00E+00 0.00E+00 0.00E+00 ACVB 69y 0.00E+00 0.00E+00 2.64E-04 1.70E-04 MVR 73y 0.00E+00 0.00E+00 7.48E-04 5.41E-04
GATA6
Children
CoA 6d 3.62E-03 7.89E-03 1.52E-02 5.93E-02 CAVSD 7d 1.20E-02 2.20E-02 3.30E-02 2.11E-02
ASD 33m 7.07E-03 8.57E-03 2.52E-02 3.40E-02 HLHS 54m 4.37E-02 2.46E-03 2.10E-02 2.49E-02 ASD2 8y 2.12E-02 5.34E-03 2.37E-02 1.70E-02
Adults
AVR 60y 4.59E-02 1.93E-02 3.12E-02 6.34E-02 AVR 60y 3.20E-02 5.34E-02 3.01E-02 4.92E-02 MVR 66y 3.22E-03 2.01E-03 9.61E-03 1.16E-02 ACVB 69y 1.64E-02 9.68E-03 1.17E-02 1.48E-02 MVR 73y 1.41E-02 3.24E-02 1.89E-02 2.20E-02
TBX5
Children
CoA 6d 1.83E-04 3.09E-04 7.50E-05 1.72E-04 CAVSD 7d 2.05E-04 2.22E-04 1.11E-04 1.62E-04
ASD 33m 4.27E-04 3.85E-04 9.49E-05 2.41E-04 HLHS 54m 1.54E-03 1.11E-04 2.11E-04 9.87E-05 ASD2 8y 5.01E-04 1.01E-04 1.03E-04 4.10E-05
Adults
AVR 60y 8.57E-05 8.20E-06 5.17E-05 1.11E-04 AVR 60y 4.85E-04 2.88E-04 6.91E-05 1.62E-04 MVR 66y 1.09E-04 3.42E-05 3.67E-05 3.68E-05 ACVB 69y 1.42E-04 1.09E-04 2.56E-05 2.14E-05 MVR 73y 5.30E-06 3.70E-05 7.72E-05 7.22E-05
TBX20
Children
CoA 6d 3.68E-05 0.00E+00 1.97E-02 5.16E-02 CAVSD 7d 1.10E-06 3.59E-04 3.17E-02 1.98E-02
ASD 33m 0.00E+00 2.39E-04 2.39E-02 5.42E-02 HLHS 54m 0.00E+00 2.44E-04 1.84E-02 1.85E-02 ASD2 8y 9.34E-05 3.33E-04 5.13E-02 1.40E-02
Adults
AVR 60y 3.82E-05 2.05E-04 1.20E-02 5.76E-02 AVR 60y 3.24E-05 0.00E+00 1.85E-02 3.35E-02 MVR 66y 0.00E+00 0.00E+00 4.44E-03 2.93E-03 ACVB 69y 1.56E-03 7.28E-04 3.43E-03 4.65E-03 MVR 73y 1.04E-03 1.20E-03 2.89E-02 2.52E-02

80
AF CF Gene Age Group Diagnosis Age P0 P2 P0 P2
TBX18
Children
CoA 6d 1.43E-03 2.82E-03 2.05E-03 7.11E-03 CAVSD 7d 3.07E-03 3.29E-03 3.72E-03 4.31E-03
ASD 33m 7.01E-03 2.14E-03 3.46E-03 5.72E-03 HLHS 54m 0.00E+00 1.93E-03 1.49E-03 4.01E-03 ASD2 8y 7.12E-03 1.88E-03 6.17E-03 2.68E-03
Adults
AVR 60y 1.32E-03 2.75E-03 2.03E-03 1.23E-04 AVR 60y 4.13E-03 3.65E-03 3.67E-03 7.93E-03 MVR 66y 1.81E-03 2.13E-03 5.65E-04 1.90E-03 ACVB 69y 6.97E-03 5.13E-03 1.93E-03 2.52E-03 MVR 73y 3.11E-03 2.71E-03 2.38E-03 4.06E-03
WT1
Children
CoA 6d 0.00E+00 0.00E+00 9.56E-03 1.23E-02 CAVSD 7d 0.00E+00 0.00E+00 1.16E-02 1.26E-02
ASD 33m 0.00E+00 0.00E+00 6.56E-03 1.07E-02 HLHS 54m 0.00E+00 0.00E+00 6.16E-03 1.14E-02 ASD2 8y 0.00E+00 0.00E+00 8.20E-03 4.31E-03
Adults
AVR 60y 0.00E+00 2.19E-03 6.09E-03 0.00E+00 AVR 60y 2.17E-02 3.00E-02 2.12E-02 5.60E-02 MVR 66y 0.00E+00 0.00E+00 9.02E-05 8.70E-05 ACVB 69y 9.87E-03 5.17E-03 5.11E-03 3.71E-03 MVR 73y 3.47E-03 3.90E-03 9.35E-03 8.92E-03
TCF21
Children
CoA 6d 6.39E-05 2.27E-05 1.73E-03 6.35E-03 CAVSD 7d 0.00E+00 1.92E-03 5.85E-03 1.08E-03
ASD 33m 1.63E-04 1.23E-04 1.51E-02 6.03E-03 HLHS 54m 3.59E-03 0.00E+00 2.93E-03 1.84E-03 ASD2 8y 4.81E-04 1.94E-04 8.26E-03 2.25E-03
Adults
AVR 60y 1.60E-02 3.66E-03 2.46E-03 5.61E-03 AVR 60y 7.10E-03 1.03E-02 5.28E-03 5.88E-03 MVR 66y 2.74E-04 3.35E-05 2.57E-04 3.66E-04 ACVB 69y 3.48E-04 9.52E-05 6.71E-04 7.40E-04 MVR 73y 5.13E-04 8.20E-04 2.60E-03 1.37E-03
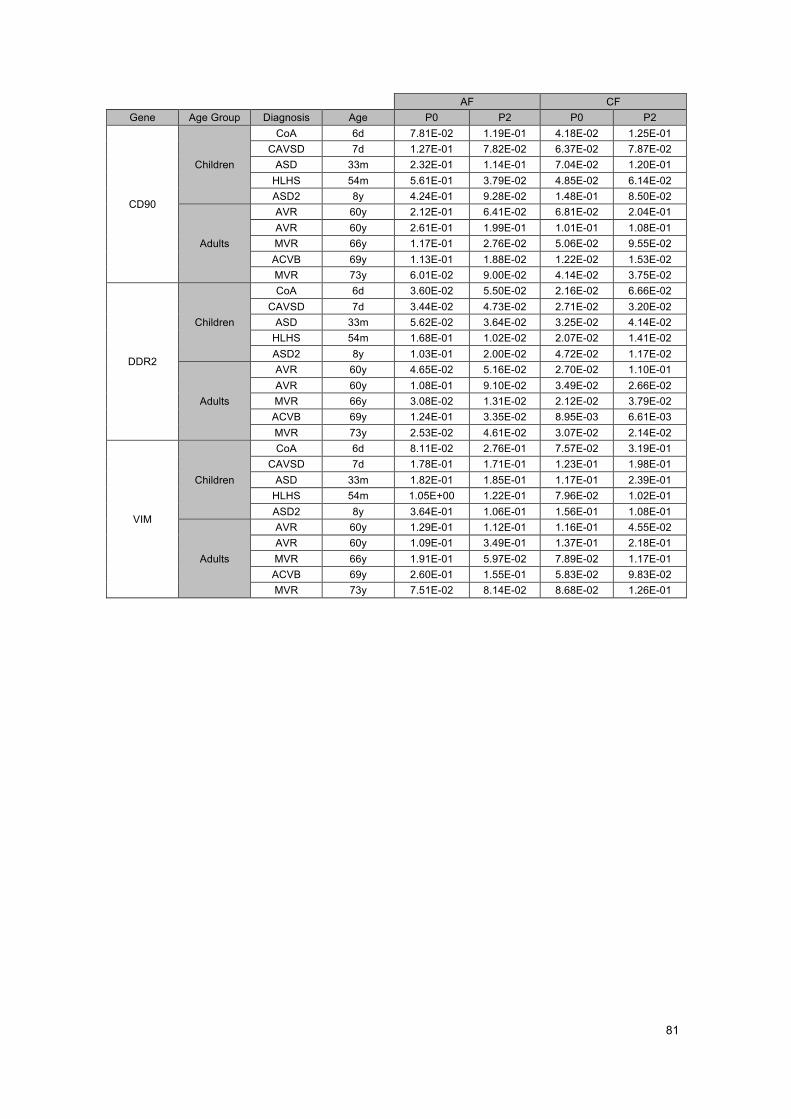
81
AF CF Gene Age Group Diagnosis Age P0 P2 P0 P2
CD90
Children
CoA 6d 7.81E-02 1.19E-01 4.18E-02 1.25E-01 CAVSD 7d 1.27E-01 7.82E-02 6.37E-02 7.87E-02
ASD 33m 2.32E-01 1.14E-01 7.04E-02 1.20E-01 HLHS 54m 5.61E-01 3.79E-02 4.85E-02 6.14E-02 ASD2 8y 4.24E-01 9.28E-02 1.48E-01 8.50E-02
Adults
AVR 60y 2.12E-01 6.41E-02 6.81E-02 2.04E-01 AVR 60y 2.61E-01 1.99E-01 1.01E-01 1.08E-01 MVR 66y 1.17E-01 2.76E-02 5.06E-02 9.55E-02 ACVB 69y 1.13E-01 1.88E-02 1.22E-02 1.53E-02 MVR 73y 6.01E-02 9.00E-02 4.14E-02 3.75E-02
DDR2
Children
CoA 6d 3.60E-02 5.50E-02 2.16E-02 6.66E-02 CAVSD 7d 3.44E-02 4.73E-02 2.71E-02 3.20E-02
ASD 33m 5.62E-02 3.64E-02 3.25E-02 4.14E-02 HLHS 54m 1.68E-01 1.02E-02 2.07E-02 1.41E-02 ASD2 8y 1.03E-01 2.00E-02 4.72E-02 1.17E-02
Adults
AVR 60y 4.65E-02 5.16E-02 2.70E-02 1.10E-01 AVR 60y 1.08E-01 9.10E-02 3.49E-02 2.66E-02 MVR 66y 3.08E-02 1.31E-02 2.12E-02 3.79E-02 ACVB 69y 1.24E-01 3.35E-02 8.95E-03 6.61E-03 MVR 73y 2.53E-02 4.61E-02 3.07E-02 2.14E-02
VIM
Children
CoA 6d 8.11E-02 2.76E-01 7.57E-02 3.19E-01 CAVSD 7d 1.78E-01 1.71E-01 1.23E-01 1.98E-01
ASD 33m 1.82E-01 1.85E-01 1.17E-01 2.39E-01 HLHS 54m 1.05E+00 1.22E-01 7.96E-02 1.02E-01 ASD2 8y 3.64E-01 1.06E-01 1.56E-01 1.08E-01
Adults
AVR 60y 1.29E-01 1.12E-01 1.16E-01 4.55E-02 AVR 60y 1.09E-01 3.49E-01 1.37E-01 2.18E-01 MVR 66y 1.91E-01 5.97E-02 7.89E-02 1.17E-01 ACVB 69y 2.60E-01 1.55E-01 5.83E-02 9.83E-02 MVR 73y 7.51E-02 8.14E-02 8.68E-02 1.26E-01
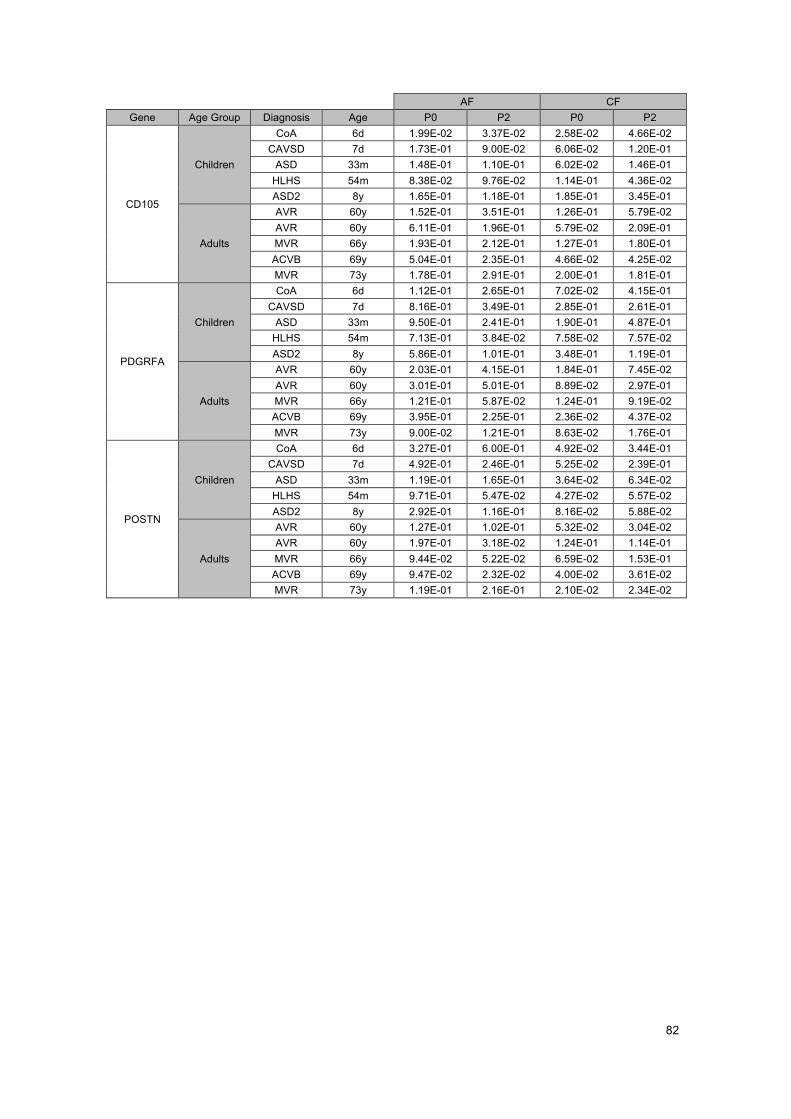
82
AF CF Gene Age Group Diagnosis Age P0 P2 P0 P2
CD105
Children
CoA 6d 1.99E-02 3.37E-02 2.58E-02 4.66E-02 CAVSD 7d 1.73E-01 9.00E-02 6.06E-02 1.20E-01
ASD 33m 1.48E-01 1.10E-01 6.02E-02 1.46E-01 HLHS 54m 8.38E-02 9.76E-02 1.14E-01 4.36E-02 ASD2 8y 1.65E-01 1.18E-01 1.85E-01 3.45E-01
Adults
AVR 60y 1.52E-01 3.51E-01 1.26E-01 5.79E-02 AVR 60y 6.11E-01 1.96E-01 5.79E-02 2.09E-01 MVR 66y 1.93E-01 2.12E-01 1.27E-01 1.80E-01 ACVB 69y 5.04E-01 2.35E-01 4.66E-02 4.25E-02 MVR 73y 1.78E-01 2.91E-01 2.00E-01 1.81E-01
PDGRFA
Children
CoA 6d 1.12E-01 2.65E-01 7.02E-02 4.15E-01 CAVSD 7d 8.16E-01 3.49E-01 2.85E-01 2.61E-01
ASD 33m 9.50E-01 2.41E-01 1.90E-01 4.87E-01 HLHS 54m 7.13E-01 3.84E-02 7.58E-02 7.57E-02 ASD2 8y 5.86E-01 1.01E-01 3.48E-01 1.19E-01
Adults
AVR 60y 2.03E-01 4.15E-01 1.84E-01 7.45E-02 AVR 60y 3.01E-01 5.01E-01 8.89E-02 2.97E-01 MVR 66y 1.21E-01 5.87E-02 1.24E-01 9.19E-02 ACVB 69y 3.95E-01 2.25E-01 2.36E-02 4.37E-02 MVR 73y 9.00E-02 1.21E-01 8.63E-02 1.76E-01
POSTN
Children
CoA 6d 3.27E-01 6.00E-01 4.92E-02 3.44E-01 CAVSD 7d 4.92E-01 2.46E-01 5.25E-02 2.39E-01
ASD 33m 1.19E-01 1.65E-01 3.64E-02 6.34E-02 HLHS 54m 9.71E-01 5.47E-02 4.27E-02 5.57E-02 ASD2 8y 2.92E-01 1.16E-01 8.16E-02 5.88E-02
Adults
AVR 60y 1.27E-01 1.02E-01 5.32E-02 3.04E-02 AVR 60y 1.97E-01 3.18E-02 1.24E-01 1.14E-01 MVR 66y 9.44E-02 5.22E-02 6.59E-02 1.53E-01 ACVB 69y 9.47E-02 2.32E-02 4.00E-02 3.61E-02 MVR 73y 1.19E-01 2.16E-01 2.10E-02 2.34E-02
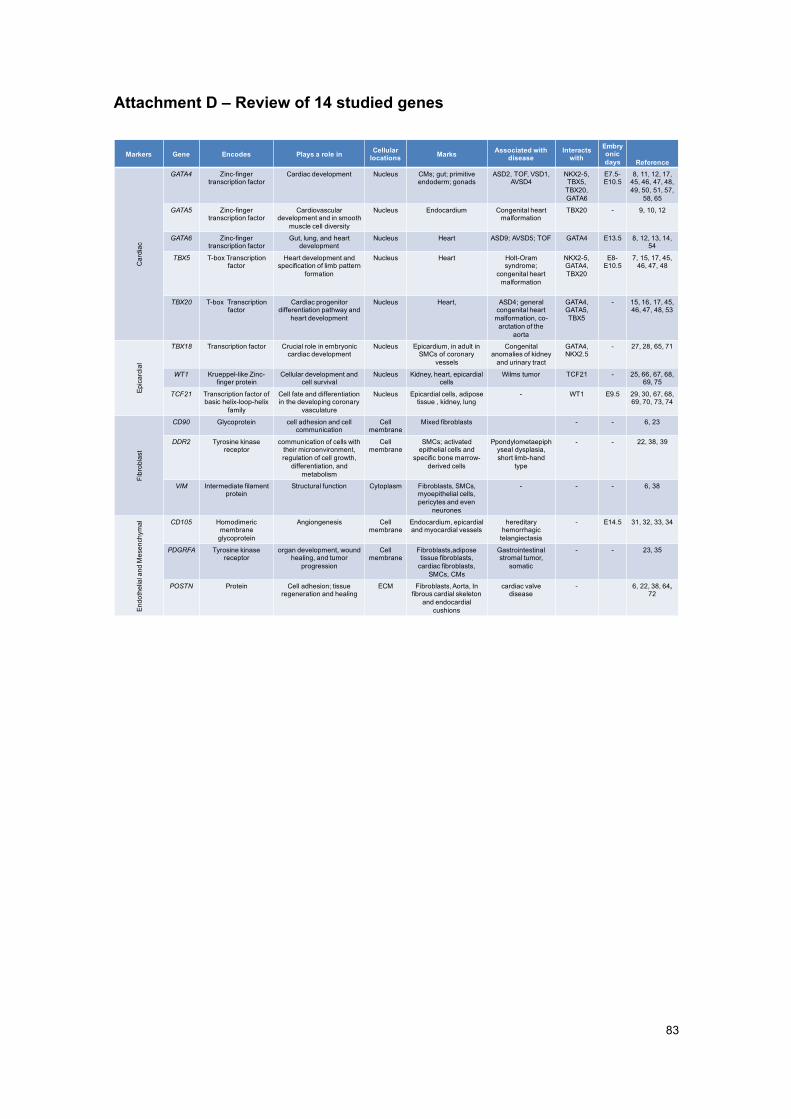
83
Attachment D – Review of 14 studied genes
Markers Gene Encodes Plays a role in Cellular locations Marks Associated with
diseaseInteracts
withEmbryonicdays Reference
Car
diac
GATA4 Zinc-fingertranscription factor
Cardiac development Nucleus CMs; gut; primitive endoderm; gonads
ASD2, TOF, VSD1, AVSD4
NKX2-5, TBX5,
TBX20, GATA6
E7.5-E10.5
8, 11, 12, 17, 45, 46, 47, 48, 49, 50, 51, 57,
58, 65
GATA5 Zinc-fingertranscription factor
Cardiovascular development and in smooth
muscle cell diversity
Nucleus Endocardium Congenital heart malformation
TBX20 - 9, 10, 12
GATA6 Zinc-fingertranscription factor
Gut, lung, and heart development
Nucleus Heart ASD9; AVSD5; TOF GATA4 E13.5 8, 12, 13, 14, 54
TBX5 T-box Transcriptionfactor
Heart development and specification of limb pattern
formation
Nucleus Heart Holt-Oramsyndrome;
congenital heart malformation
NKX2-5,GATA4, TBX20
E8-E10.5
7, 15, 17, 45, 46, 47, 48
TBX20 T-box Transcriptionfactor
Cardiac progenitordifferentiation pathway and
heart development
Nucleus Heart, ASD4; general congenital heart
malformation, co-arctation of the
aorta
GATA4, GATA5, TBX5
- 15, 16, 17, 45, 46, 47, 48, 53
Epic
ardi
al
TBX18 Transcription factor Crucial role in embryonic cardiac development
Nucleus Epicardium, in adult in SMCs of coronary
vessels
Congenital anomalies of kidney
and urinary tract
GATA4, NKX2.5
- 27, 28, 65, 71
WT1 Krueppel-like Zinc-finger protein
Cellular development and cell survival
Nucleus Kidney, heart, epicardialcells
Wilms tumor TCF21 - 25, 66, 67, 68, 69, 75
TCF21 Transcription factor of basic helix-loop-helix
family
Cell fate and differentiation in the developing coronary
vasculature
Nucleus Epicardial cells, adipose tissue , kidney, lung
- WT1 E9.5 29, 30, 67, 68, 69, 70, 73, 74
Fibr
obla
st
CD90 Glycoprotein cell adhesion and cell communication
Cell membrane
Mixed fibroblasts - - 6, 23
DDR2 Tyrosine kinase receptor
communication of cells with their microenvironment,regulation of cell growth,
differentiation, and metabolism
Cell membrane
SMCs; activated epithelial cells and
specific bone marrow-derived cells
Ppondylometaepiphyseal dysplasia, short limb-hand
type
- - 22, 38, 39
VIM Intermediate filament protein
Structural function Cytoplasm Fibroblasts, SMCs, myoepithelial cells, pericytes and even
neurones
- - - 6, 38
Endo
thel
ial a
nd M
esen
chym
al CD105 Homodimericmembrane
glycoprotein
Angiongenesis Cell membrane
Endocardium, epicardialand myocardial vessels
hereditary hemorrhagic
telangiectasia
- E14.5 31, 32, 33, 34
PDGRFA Tyrosine kinase receptor
organ development, wound healing, and tumor
progression
Cell membrane
Fibroblasts,adiposetissue fibroblasts,
cardiac fibroblasts, SMCs, CMs
Gastrointestinal stromal tumor,
somatic
- - 23, 35
POSTN Protein Cell adhesion; tissue regeneration and healing
ECM Fibroblasts, Aorta, In fibrous cardial skeleton
and endocardialcushions
cardiac valve disease
- 6, 22, 38, 64, 72

84
This page was intentionally left blank

85
Attachment E – Some future studies suggestions
Study Gene Diagnosis Age Group Description
1. Periostin POSTN all Children Since same expression level in all pathologies → candidate for fibroblast marker, independent of
diagnosis
2. Tissue availability
Cardiac genes CHD Children Study expression of genes in CF and AF from skin –discover pattern between CF and AF for determined
gene in different pathologies
3. Wilms’ Tumor
WT1 - Children and Adults
More detailed study, about why WT1 is not expressed in AF in children, but is expressed in AF in adults
4. GATA4 GATA4 - Children and Adults
More detailed study, about why GATA4 is not expressed in AF in children, but is expressed in AF in
adults
5. GATA5 GATA5 - Children and Adults
More detailed study, about why GATA5 is expressed in CF but not in AF in children and adults
6. Coronary vasculature
TCF21 Coronary Adults Analysis of revascularisation after myocardial injury
7. Fibroblast marker
TCF21 - - Gene expression analysis in AF (visceral, instead of dermal) and CF
8. Endoglin CD105 CoA, HLHS Children Study gene associated to angiogenesis and its behaviour in CHD which have malformations in the
aorta, for instance
9. Cardiac genes
GATA4, NKX2.5, TBX5, TBX20
and associated genes)
- - How these genes correlate with each other in various CHD (separated) – different locations in the heart
10. Septal formation
GATA4, NKX2.5, TBX5 (and associated
genes)
HLHS,ASD (and
variations), CAVSD, etc
Children Study gene expression in CHD affecting the septum and compare to results of embryonary development (of
other studies)

86
This page was intentionally left blank