gene expression changes associated with … · the accumulation of er proteins and allowing the er...
TRANSCRIPT
GENE EXPRESSION CHANGES ASSOCIATED WITH THE ENDOPLASMIC
RETICULUM STRESS RESPONSE INDUCED BY MICROSOMAL
CYTOCHROME P450 OVERPRODUCTION
Elzbieta Szczesna-Skorupa†§, Ci-Di Chen‡ §, Hong Liu¶ and Byron Kemper† *
†Department of Molecular and Integrative Physiology, University of Illinois at Urbana-
Champaign, Urbana, Illinois 61801; ‡Department of Ophthalmology, University of Minnesota,
Minneapolis, Minnesota 55455; ¶Aventis Pharmaceuticals Inc., Bridgewater, New Jersey 08807
Running title: ER stress response to P450 expression
*Corresponding author: Byron Kemper
University of Illinois at Urbana-Champaign
407 S. Goodwin Ave., Urbana, IL 61801
Tel. (217) 333-1146
Email:[email protected]
1
JBC Papers in Press. Published on January 12, 2004 as Manuscript M312170200
Copyright 2004 by The American Society for Biochemistry and Molecular Biology, Inc.
by guest on September 24, 2018
http://ww
w.jbc.org/
Dow
nloaded from
SUMMARY
Induction of drug metabolizing microsomal cytochromes P450 (P450s) results in a
striking proliferation of the smooth endoplasmic reticulum (ER). Overexpression of P450s in
yeast and cultured cells produces a similar response. The signals mediating this process are not
known, but probably involve signal transduction pathways involved in the unfolded protein
response (UPR) or the ER overload response (EOR). We have examined the temporal response
of specific genes in these pathways and genes globally to overexpression of P450 in cultured
cells. Activity of NFkB, an EOR component, was substantially increased by overexpression of
full length P450 2C2 or a chimera with the 28 amino acid-signal anchor sequence of P450 2C2
in HepG2 cells and the activation correlated temporally with the accumulation of P450 in the
cells. In the UPR pathway, activation of the transcription factor xbp1 by ire1 also correlated with
the accumulation of P450 in the cells, while in contrast, maximum activation of the BiP/grp78
promoter preceded the accumulation. Differential effects of expression of P450 on apoptosis
were observed in non-hepatic COS1 and hepatic HepG2 cells. In COS1 cells, apoptosis was
induced and this correlated with sustained activation of the pro-apoptotic JNK pathway,
induction of CHOP, and an absence of the increased of NFkB activity. In HepG2 cells, JNK was
only transiently activated and CHOP expression was not induced. As assessed by DNA
microarray analysis, upregulation of signaling genes was predominant including those involved
in anti-apoptosis and ER stress. These results suggest that both the EOR and UPR pathways are
2
by guest on September 24, 2018
http://ww
w.jbc.org/
Dow
nloaded from
involved in the cellular response to induction of P450 expression, and that in hepatic cells, genes
are also induced to block apoptosis, which may be a physiologically relevant response to prevent
cell death during xenobiotic-induced expression of P450 in the liver.
INTRODUCTION
The endoplasmic reticulum (ER)1 represents the central organelle of the cell in which the
crucial steps of folding and modification of proteins and selection for transport to other
compartments take place. Conditions that affect ER homeostasis, or ER stress, may have dire
consequences for the survival of cells and may induce one of several signal transduction
pathways. Accumulation of misfolded proteins, increased secretory load, glucose deprivation or
perturbations of calcium homeostasis activate an intracellular signaling pathway referred to as
the unfolded protein response (UPR) (1-3). Although different stress inducers use diverse
pathways to activate selected target genes, there is considerable cross-talk between the
pathways. Common targets include molecular chaperones, folding enzymes and genes with
promoters that contain a cis-acting element known as ERSE (ER stress response element) (1, 2).
In mammalian cells, ER stress-activated signal transduction is mediated by three ER
transmembrane proteins: 1) transcriptional activator ATF6, which upon ER stress is
proteolytically released from the membrane and upregulates ERSE-containing promoters; 2)
translation initiation factor 2 kinase, PERK, which mainly attenuates translation, slowing down
3
by guest on September 24, 2018
http://ww
w.jbc.org/
Dow
nloaded from
the accumulation of ER proteins and allowing the ER to accommodate its cargo load, and 3) the
transmembrane kinase/endoribonuclease ire1 (4-8). The lumenal domain of ire1 is the proximal
sensor of misfolded protein accumulation, which induces activation of ire1 via oligomerization
and autophosphorylation (2). Activation of ire1 upregulates molecular chaperones, but under
severe stress it also activates the Jun amino-terminal kinase (JNK), part of the apoptotic pathway
(9). Similarly to its yeast analog, the cytosolic domain of activated ire1 acts also as an
endonuclease/ligase, splicing the mRNA of the transcriptionally inactive protein xbp1 (x-box
binding protein), leading to the formation of a potent bZIP transcriptional activator (7, 8, 10).
Although in yeast, ire1and its spliced product HAC play a central role in UPR, in mammalian
cells its role in ER stress response is less clear, since in ire1 null cells unimpaired UPR and
upregulation of chaperones occurs (8, 9, 11). Both ire1 and xbp1 null mice show embryonic
lethal phenotypes, implying physiological functions other than the ER stress response function
for these genes (8-13).
ER expansion induced by the increased accumulation of properly folded ER resident
proteins represents a unique case of the ER stress response and is usually referred to as an
endoplasmic reticulum overload response (EOR) (3, 14). Overexpression of certain membrane
proteins, like HMGCoA reductase, induces smooth ER proliferation without UPR activation
(15). On the other hand, overexpression of cytochrome P450 in yeast does induce UPR and
activation of chaperones (16-18). EOR has been shown to activate the transcription factor
4
by guest on September 24, 2018
http://ww
w.jbc.org/
Dow
nloaded from
NFkB (19-21), however, the mechanism connecting the ER overload detection to the
transcriptional activation in the nucleus is not understood and both reactive oxygen species and
ER-released calcium have been suggested as mediators connecting ER stress with the NFkB
activation (1, 19, 20).
Because NFkB plays a major role in inflammatory and immune responses, EOR caused
by accumulation of viral proteins may represent an antiviral immune response (19). Pathological
ER accumulation of non-viral proteins, which occurs in diseases such as cystic fibrosis,
Alzheimer or hereditary emphysema, is often associated with inflammation (21). The
inflammation may be related to activation of NFkB and its role in inflammatory responses.
However, it is not known whether NFkB activation plays a role in ER-nucleus signal
transduction leading to an expansion of the ER in response to physiological stimuli, such as
increased secretory activity or induction of microsomal enzymes.
Microsomal cytochromes P450 (P450) are highly inducible enzymes, whose ER
accumulation results in extensive proliferation of smooth ER membranes (16-18, 22, 23), but the
mechanism and signals involved in this process are not known. It is conceivable that ER
accumulation of P450s activates not only EOR, but also a general ER stress response, like the
UPR. If so, then changes might be expected in expression of genes enhancing ER folding
capacity or in ER-nucleus signal transduction pathway genes that are responsible for membrane
biosynthesis, cell survival and adaptation to the changing size and content of the ER.
5
by guest on September 24, 2018
http://ww
w.jbc.org/
Dow
nloaded from
In the current study we have undertaken several approaches to analyze the cellular
response, and the signals involved, to the accumulation of P450 2C2 in transiently transfected
cells. Based on our biochemical studies and DNA microarray analysis, we conclude that there is
a time-dependent switch from the early activation of ER stress-inducible chaperones and the
JNK pathway followed by a delayed activation of NFkB in HepG2 cells. NFkB may have a role
in regulating apoptosis-related genes to allow cell survival. The kinetics of splicing and
upregulation of transcription factor xbp1 parallels that of the NFkB activation and is correlated
with the kinetics of P450 accumulation, consistent with its possible involvement in sustained ER
expansion. Furthermore, using DNA microarray analysis, we show that a significant number of
the P450 upregulated genes contain in their promoters potential binding sites for NFkB and xbp1.
6
by guest on September 24, 2018
http://ww
w.jbc.org/
Dow
nloaded from
MATERIALS AND METHODS
Materials: Tissue culture materials were purchased from Life Technologies. The EGFP vector
was from Clontech. The pNFkB-luciferase reporter plasmid, which contains five copies of the
NFkB binding site, was from Stratagene. The pBiP-luciferase reporter plasmid (6, 24) contains
the rat grp78 (BiP) promoter region –457 to –39. Construction of all the P450 chimeras was
described previously (25-27). The phRK-TK reporter vector and dual luciferase reporter activity
assay kit were from Promega. P-JNK antibody was from Santa Cruz Biotechnology.
RT-PCR. RNA was prepared from transfected cells cultured on 6-well plates with the Qiagen
RNeasy kit and used in RT-PCR performed with the Omniscript RT kit (Qiagen). The following
sets of primers were used for the PCR amplifications: for BiP:
5’ATCACGCCGTCCTATGTCGC 3’ and 5’TCTCCCCCTCCCTCTTATCC 3’; for actin:
5’TCCTCACCCTGAAGTACCCC 3’ and 5’CTCTTGCTCGAAGTCCAGGG 3’; for CHOP:
5’AGTCATTGCCTTTCTCTTCG 3’ and 5’GGTGCAGATTCACCATTCGG 3’; for xbp1:
5’CCTTGTAGTTGAGAACCAGG 3’ and 5’GGGGCTTGGTATATATGTGG 3’.
Cell culture, transfection and luciferase assay. COS1 and HepG2 cells were grown in DMEM
medium supplemented with 10% fetal bovine serum, 100 unit/ml penicillin, 100 ug/ml
streptomycin and transfected with Lipofectamine, as previously described (26, 27). For luciferase
reporter assays, cells were transfected on 24-well plates with the amounts of DNA indicated in
the figures legends. For mock transfections and to compensate for the differences in the total
7
by guest on September 24, 2018
http://ww
w.jbc.org/
Dow
nloaded from
DNA used, pCMV5 vector DNA was added. The assays were performed using the dual-
luciferase reporter 1000 assay system according to the manufacturer’s (Promega) protocol.
Relative luciferase activity was defined as the ratio of firefly luciferase activity to Renilla
luciferase activity.
JNK activation assay. Cells transfected on 6-well plates were washed with PBS, lysed in RIPA
buffer and the lysates were clarified by 10 min centrifugation. The protein concentration was
measured with MicroBCA reagents (Pierce). Lysates were analyzed by SDS-PAGE followed by
western blots probed with anti-phosphorylated JNK antibody and the HRP SuperSignal
chemiluminescent detection system (Pierce).
Fluorescent protein concentration assay. To measure the concentration of C2/GFP chimera in
transfected cells, cells cultured in 6-well plates were washed with PBS, scraped and collected by
brief centrifugation. After additional washing with PBS, cells were resuspended in 1 ml of PBS
and used for spectrofluorimetry, as described (28).
Analysis of cell viability. Apoptosis in transfected cells was analyzed by assaying plasma
membrane permeability to Hoechst 33342 dye and flow cytometry (29). Transfected cells were
resuspended in 1 ml of PBS and after adding Hoechst 33342 solution to a final concentration of
0.9 ug/ml, were incubated for 3 min. at 370, after which propidium iodide was added to a final
concentration of 0.6 ug/ml and the incubation was continued for 5 min on ice. Cells were
analyzed by flow cytometry with UV excitation at 351 nm, emission band pass filter 450/65, for
8
by guest on September 24, 2018
http://ww
w.jbc.org/
Dow
nloaded from
Hoechst 33342 detection and 488 nm, 630/30 filter, for propidium iodide detection.
cDNA microarray analysis. Total RNA from transfected HepG2 cells was isolated using the
Qiagen RNeasy kit. Double-stranded cDNA was synthesized with 5-8ug of total RNA using the
T7-oligo(dT) primer (Genset Oligos, Boulder, CO) and the SuperScript double-stranded cDNA
synthesis kit (Invitrogen, Carlsbad, CA) following the manufacturers’ protocols. Precipitated
double-stranded cDNA was used as a template for cRNA synthesis with the BioArray RNA
transcript labelling kit with Bio-11-CTP and Bio-16-UTP (Enzo, Farmingdale, NY). Biotin-
labeled cRNA was then purified (RNeasy Mini Kit, Qiagen, Hilden, Germany), fragmented and
hybridized to the HumU133A oligonucleotide microarrays (Affymetrix, Santa Clara, CA). The
arrays were washed and stained with streptavidin-phycoerythrin. Fluorescence intensities were
measured with the GeneArray scanner. Affymetrix chip data (HG-U133A) were generated from
two mock- and two P450-transfected samples from two different transfections. Gene expression
ratios of P450- versus mock-transfected samples for each set were measured by the PFOLD
algorithm (30) that is derived from a Bayesian estimation scheme for estimating the fold-change
of gene expression.
Searching for the transcription factors binding sites in the promoter sequences. Putative
promoters of human transcripts were retrieved from Ensembl (http://www.ensembl.org) based on
their transcript and protein annotation. A putative promoter sequence is defined as a 1.5 kb
upstream sequence including start codon ATG when the ATG is within the first exon. A total of
9
by guest on September 24, 2018
http://ww
w.jbc.org/
Dow
nloaded from
22,867 putative promoter sequences were searched for xbp1 and NFkB binding sites using a
pattern matching program written in Perl (H. Liu, unpublished).
10
by guest on September 24, 2018
http://ww
w.jbc.org/
Dow
nloaded from
RESULTS
1. Activation of NFkB in HepG2 cells.
P450 2C2 is inserted into the ER membranes via its N-terminal signal-anchor sequence,
which also mediates its direct ER retention, leaving the major catalytic domain of the protein on
the cytosolic side of the membrane (31). Using transiently transfected cells and
immunomicroscopy, we have observed that increasing levels of this protein in the ER
membranes, induce significant expansion of this compartment (not shown). Since this process
most likely induces EOR, we first wanted to establish whether in analogy with previously studied
ER retained proteins (19-21), P450 accumulation also activates transcription factor NFkB.
To analyze activation of NFkB in cells expressing P450 2C2, we co-transfected HepG2 cells
with plasmid encoding a firefly luciferase reporter gene fused to five NFkB recognition sites in
the promoter region. We have shown before, using chimeras of different P450 domains and
GFP, that whereas full-length C2/GFP and C1-28/GFP (containing the N-terminal 28 amino
acid signal-anchor transmembrane region) are directly retained in the ER (excluded from the
transport vesicles), C1-21/GFP, with the short juxtamembrane linker region deleted, recycles
through the retrieval pathway (26). We thus also tested whether these P450-GFP chimeras
induce NFkB to the same level.
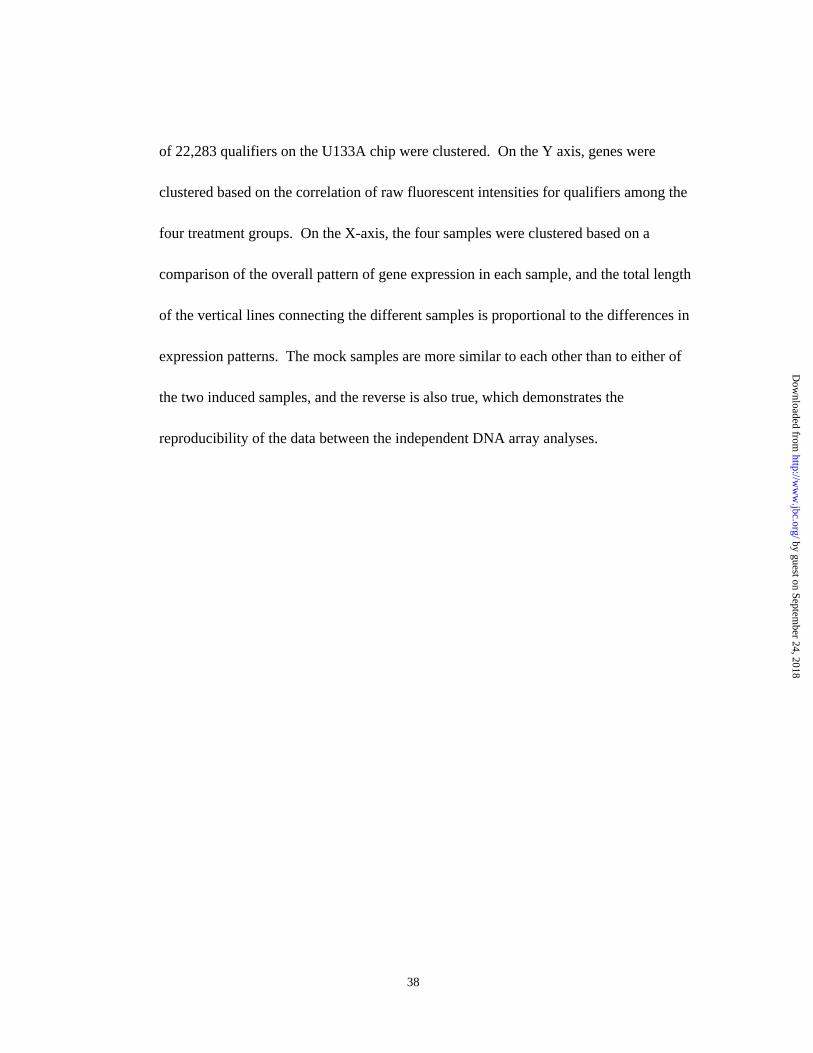
As Fig. 1 shows, 24 hr after transfection, transcriptional activity of NFkB in transfected HepG2
cells was strongly enhanced in a DNA-concentration dependent manner. The level of the
11
by guest on September 24, 2018
http://ww
w.jbc.org/
Dow
nloaded from
activation in cells expressing full-length C2/GFP was the same as in the cells expressing C2(1-
490) without GFP tag, encoded by plasmid C2/CMV5 (31), so that GFP was not responsible for
NFkB activation. Although all three of the chimeras activated NFkB, activation was lowest in
cells expressing C1-21/GFP. This suggests that either the juxtamembrane linker (amino acids
22-28) contributes to the response or that EOR is weaker when proteins accumulating in the ER
undergo transport to the intermediate compartment. Consistent with the second possibility, we
have also observed that activation of NFkB in cells expressing P450 2E1, which unlike P450
2C2 can be packaged into the transport vesicles and enters the retrieval pathway (32), is about
half of that observed with 2C2 (not shown).
The importance of ER retention for NFkB activation is demonstrated by only marginal
upregulation of NFkB in cells expressing the chimera EGC (Fig. 1). This chimera consists of the
ER-targeting secretory signal sequence of epidermal growth factor receptor (EGFR), followed
by GFP and has the 2C2 TM 1-28 at its C-terminus (25). We have shown previously that this
protein is not retained in the ER, but is transported to the cell-surface, since the ER retention
signal of the C2 TM 1-28 is not functional in the C-terminal location (25, 27, 31). These results
establish that whereas ER retention is required for the activation of NFkB, activation is not
dependent on the expression of the full-length enzymatically active P450, as similar
upregulation is observed with chimera containing only C2 TM 1-28, nor on the presence of the
TM 1-28 which is present in EGC. Further, the lack of NFkB activation by the EGC protein,
12
by guest on September 24, 2018
http://ww
w.jbc.org/
Dow
nloaded from
which is transported to the cell-surface, is consistent with the upregulation of NFkB by the
accumulation of an integral ER membrane protein, rather than by an increase in the load of the
secretory pathway.
2. Time-course of NFkB and BiP activation in transfected HepG2 cells.
To establish if activation of NFkB represents an early ER stress response similar to UPR
activated factors, we analyzed the time course of NFkB activation in HepG2 cells transfected
with the full-length P450 2C2. Activation of NFkB was minimal at the early time points (7 hrs
after transfection), but continuously increased after that, reaching a maximum between 24 and 48
hrs after transfection (Fig. 2). In contrast, activation of the ERSE-containing BiP/grp78
promoter (promoter of the rat grp78 gene attached to the luciferase reporter) was already 20% of
its maximum at 7 hrs after transfection, reached a peak by 16 hrs, and subsequently slightly
decreased to about 50% of its peak by 48 hrs (Fig. 2). Induction of the BiP/grp78 promoter is a
general response to ER stress, part of the UPR pathway, and is mostly mediated by the
transcription factor ATF6 (5). ATF6 is activated via proteolysis, which permits a rapid response
to ER stress. This suggests that unlike the rapid induction of UPR, activation of NFkB is delayed
and more closely parallels the increase of P450 levels (Fig. 2), so that it is probably triggered by
a pronounced accumulation of P450 in the ER, as might be expected for an EOR.
3. Activation of CHOP and JNK pathway in HepG2 and COS1 cells.
Continuous stress to cells can trigger apoptosis presumably to protect the organism from
13
by guest on September 24, 2018
http://ww
w.jbc.org/
Dow
nloaded from
deleterious effects of damaged cells. Apoptosis in response to the expansion of ER membrane as
a result of accumulation of pathological proteins, for example, could be beneficial. In the case of
P450 induction, however, a normal protein is accumulated in the ER which is part of a cellular
defense against toxic chemicals in the body. In this case, apoptosis would be counterproductive.
NFkB has been shown to play a role in the regulation of the programmed cell death pathway
(apoptosis) (33), so it seemed possible that its activation in cells overexpressing P450 contributes
to the survival of these cells. Preliminary studies using immunoelectron microscopy showed that
although the expression of P450 in both HepG2 and COS1 cells induces strong ER proliferation,
COS1 cells, but not HepG2 cells, even within 18 hr after transfection, showed morphological
changes characteristic of apoptosis (data not shown). Further analysis by flow cytometry of
transfected COS1 cells in which nuclei were stained with Hoechst 33342 dye and propidium
iodide, demonstrated apoptosis in about 30%-35% of P450- expressing COS1 cells 24 hrs after
transfection. We thus considered the possibility that this effect may be related to a potential
difference in NFkB activation in the two cell lines, if a function of NFkB in the EOR is anti-
apoptotic (33). Indeed, there was no detectable activation of the NFkB promoter in COS1 cells
transfected with P450 (Fig. 3A). In contrast, a dose-dependent activation of the BiP promoter in
transfected COS1 cells was similar to that in HepG2 cells (Fig. 3B). Thus, transfected COS1
cells mount an UPR, but are unable to activate NFkB, which is correlated with increased
apoptosis.
14
by guest on September 24, 2018
http://ww
w.jbc.org/
Dow
nloaded from

During the ER stress response, cells can activate death pathways by activating ER-
localized caspase 12, by activating the JNK signaling pathway, or by inducing the transcription
factor CHOP (also known as gadd153), which is mediated by ATF6 and PERK (1, 3, 14, 34). To
test the apoptotic response after P450 accumulation in the ER, we analyzed two of these
pathways in COS1 and HepG2 cells. Using RT-PCR we compared the level of CHOP mRNA in
transfected COS1 and HepG2 cells expressing P450. There was no induction of CHOP in
HepG2 cells analyzed at either 24 or 48 hrs after transfection, whereas in COS1 cells the level of
this factor was significantly elevated at both time points (Fig. 4 ). These results suggest that in
COS1 cells the induction of CHOP may initiate their apoptotic response.
Ire1 activated by ER stress may also induce apoptosis by activation of the JNK pathway
(9). ER stress-induced oligomerization of ire1 leads to the clustering and binding of the
cytosolic adaptor protein TRAF2 to the ire1 C-terminus which recruits and activates both JNK
and NFkB (9, 35). We assayed JNK activation by western analysis of lysates from transfected
HepG2 and COS1 cells using an anti-PJNK antibody which specifically recognizes
phosphorylated JNK, an active form of JNK during ER stress. In HepG2 cells expressing P450
PJNK was transiently increased 24 hrs after transfection and was only slightly increased after 48
hrs (Fig. 5). In contrast, a sustained increase in PJNK at 24 and 48 hrs was observed in COS1
cells (Fig. 5). NFkB activation has been proposed to be involved in downregulating the
proapoptotic JNK pathway in other systems (3, 14, 21, 34). It is possible then that the persistent
15
by guest on September 24, 2018
http://ww
w.jbc.org/
Dow
nloaded from
elevation of NFkB in HepG2 cells results in suppression of JNK by 48 hrs whereas in COS1
cells, in which NFkB is not activated, JNK activation persists and apoptosis is favored.
4. xbp1 splicing in response to P450 expression.
Induction of the Bip/grp78 promoter and transient activation of the JNK pathway
suggests that P450 overexpression activates both ATF6 and ire1 pathways. The critical step of
the ire1 pathway induced by ER stress is activation of the transcription factor xbp1. Activated
ire1 mediates frame-switching splicing of the xbp1, which results in formation of a potent
transactivator which upregulates its own expression and that of molecular chaperones (7, 8, 10).
To analyze whether P450 accumulation in the ER activates ire1-mediated xbp1 splicing, we
performed RT-PCR on RNAs isolated from transfected cells using primers that permit the
detection of both spliced and unspliced (intron-containing) mRNAs (7). As a positive control,
we treated cells with the calcium-ATPase inhibitor thapsigargin, which is known to rapidly
induce splicing and upregulation of xbp1 (3). In both COS1 and HepG2 cells, the spliced variant
was predominant after thapsigargin treatment (Fig. 6). In mock-transfected HepG2 cells, only a
trace amount of the smaller, i.e., spliced form of xbp1 was detected, and splicing was
substantially increased in P450-transfected cells at 48 hrs, with a modest effect at 24 hrs (Fig. 6).
In COS1 cells, the basal level of xbp1was lower than in HepG2 cells, and although expression of
P450 slightly induced xbp1 splicing 24 hrs after transfection, the spliced form was even lower
than in mock transfected cells at the 48 hrs time point (Fig. 6). A more detailed time course of
16
by guest on September 24, 2018
http://ww
w.jbc.org/
Dow
nloaded from
the increased xbp1 splicing in HepG2 cells showed (Fig. 7) that there was a low level of splicing
at 7 hrs after the transfection, followed by a continuous increase to a maximum at 48 hrs. The
total amount of the xbp1 mRNA was increased about 2- to 2.5-fold in P450 expressing cells at
48 hrs.
Thus, in HepG2 cells the kinetics of xbp1 activation, similar to that of NFkB, correlated
with accumulation of the P450 in the ER, in contrast to BiP induction, which is a marker of the
early stress response. This is more consistent with xbp1 playing a role in ER membrane
expansion, rather than a stress response, as has been suggested (10, 12, 36).
5. Microarray analysis of the P450 expression response.
To better understand genome-wide expression changes associated with the
overexpression of P450, we have utilized DNA microarray analysis. Total RNA from control
and P450-expressing HepG2 cells was prepared 48 hrs after transfection and subjected to
microarray hybridization with the HumU133A oligonucleotide microarrays, which contain
22,283 probe sets (qualifiers) and represent more than 18,000 transcripts derived from human
genes. We chose to focus our studies at the later time point, 48 hrs after transfection, since this is
the time of maximal NFkB activation and the changes in gene expression would more likely be
directly associated with strong P450 accumulation. Affymetrix chip data (HG-U133A) were
generated from two independent experiments (two transfections). As determined by hierarchical
clustering (Fig. 8), global changes in the expression levels detected between control and P450
17
by guest on September 24, 2018
http://ww
w.jbc.org/
Dow
nloaded from
expressing cells in two independent transfections were very similar, indicating good
reproducibility of the two data sets.
Before the pairwise comparison of the P450 samples vs the control samples, data were
filtered for those genes that showed either an “absent” call on the chip (which suggest no
expression) or a low intensity value (<100) across all tested samples. Among 22,283 qualifiers
on the U133A chip, there were 9,851 qualifiers that were eliminated based on these criteria. A
gene was selected as responding to P450 induced ER overload, if its expression showed more
than a two-fold change when compared to both control samples. Based on those criteria we
selected 129 genes whose expression was upregulated , while 72 genes were down regulated by
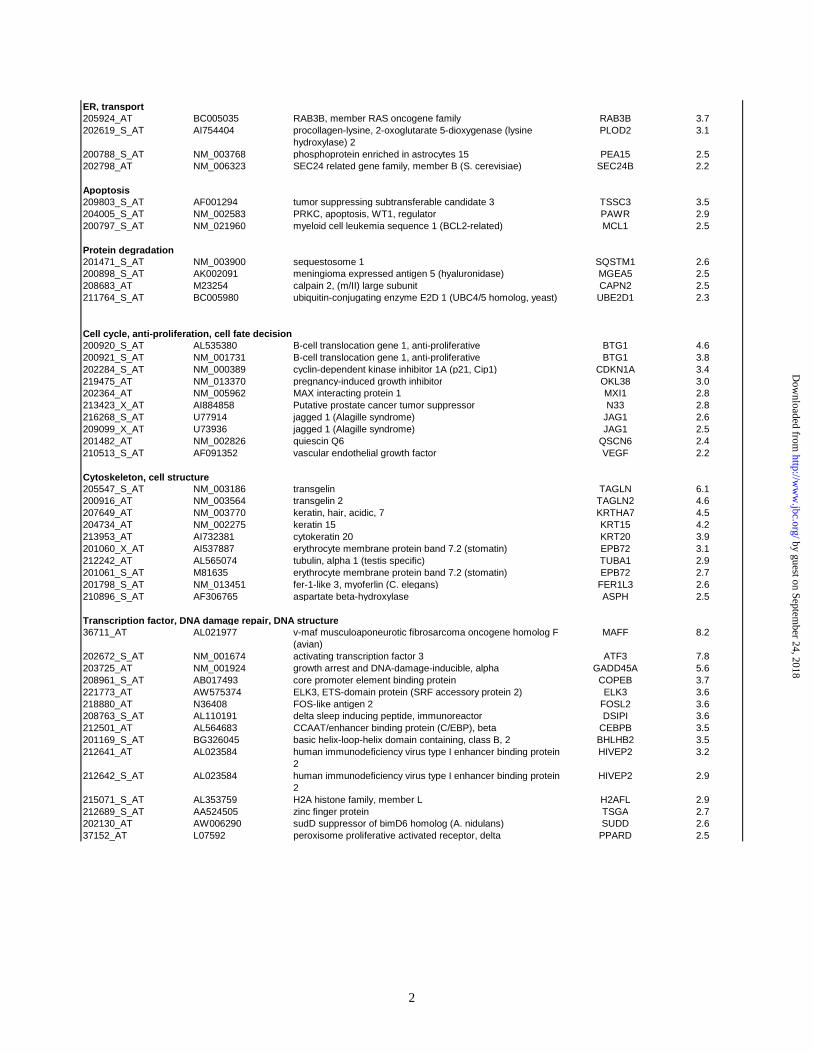
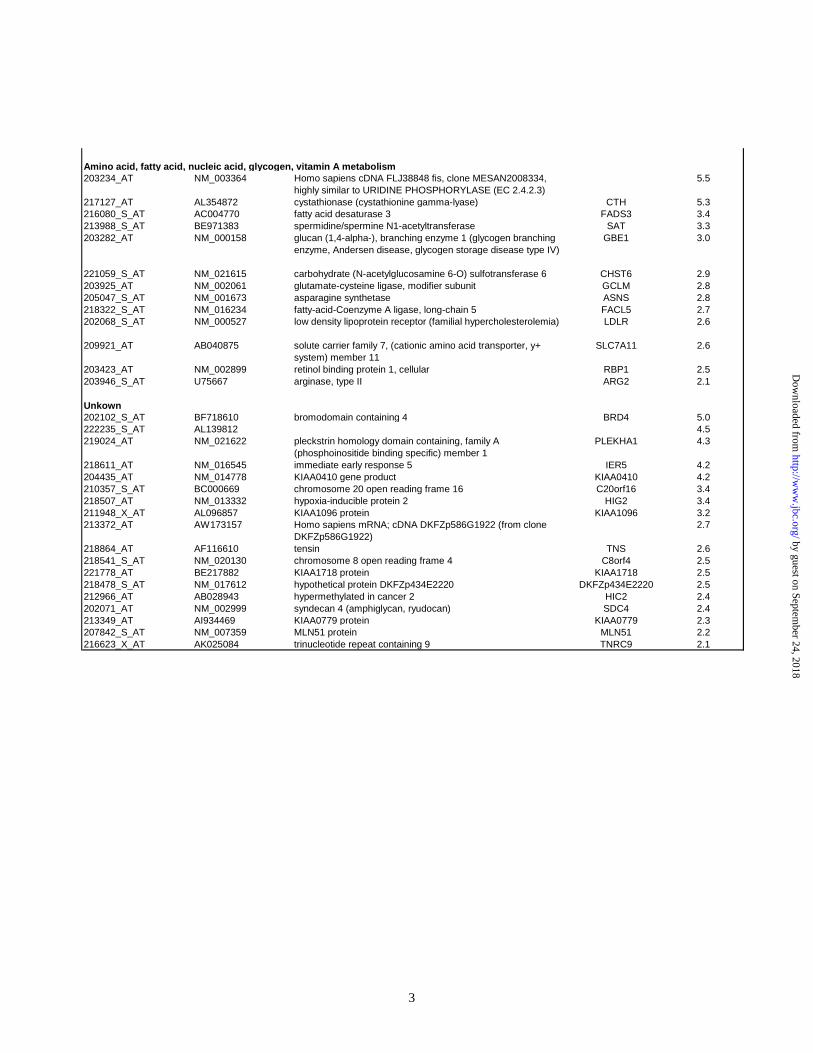
P450 overexpression. Functional classification of the genes was performed using the Gene
Ontology database and literature searches. Table 3 (supplemental data) shows which cellular
pathway or function these upregulated genes belong to.
It appears that P450 overexpression upregulates a large number of cellular pathways and
a detailed understanding of the affected genes will require future analysis. In the present paper
we focus on connections between the different pathways implicated in the UPR or EOR by our
biochemical studies. The major groups of genes implicated in these responses with elevated
expression represent: chaperones and stress response genes, kinases/phosphatases and other
signaling molecules; proteins involved in trafficking and protein degradation; apoptosis and
regulation of cell-cycle; transcription factors, and fatty acid and amino acid metabolism (Table 3
18
by guest on September 24, 2018
http://ww
w.jbc.org/
Dow
nloaded from
in supplemental data). Upregulation of genes involved in amino acid and lipid metabolism would
be consistent with the increased membrane biosynthesis induced by P450 accumulation.
Among the transcription factors, we observed strong upregulation of the gadd45b gene
(growth arrest and DNA damage-inducible gene), and transcription factor ATF3. gadd45b is
known to be induced by NFkB (its promoter has three NFkB binding sites) and it inhibits the
JNK pathway in the anti-apoptotic cascade (37). ATF3 is a stress induced factor, activated via
the ire1 pathway, and is also known as the CHOP repressor, so that its anti-apoptotic action
involves downregulation of the CHOP gene (38-40). Thus, upregulation of these genes is
consistent with our biochemical data, which showed both strong activation of NFkB, lack of
CHOP induction in transfected HepG2 cells, and only transient activation of the JNK pathway
during P450 overexpression. It would thus appear that at least one of the functions of NFkB
activation during P450 induced ER expansion involves inhibition of apoptosis, although other
functions regulating adaptation of cells to the ER expansion are also possible.
6. Motif search.
Recently it has been established that the sequence previously known as an ATF6 binding
motif, TGACGTG/CA/G, is in fact recognized by xbp1 and has been renamed the UPRE motif
(41). Since we have observed significant activation of xbp1 after P450 overexpression, we
searched for the binding motif of this factor in the promoters (defined as 1.5 kb of sequence
upstream of the first ATG) of the upregulated genes. From 129 upregulated genes, putative
19
by guest on September 24, 2018
http://ww
w.jbc.org/
Dow
nloaded from
promoter sequences are available for 89 and of those, 14 genes (16%) contain the xbp1 binding
motif (Table 1), whereas genome-wide search for the same motif showed that in 22,867 putative
promoter sequences, only 6.4% (1,473) of the genes contained that motif. We have also searched
promoters of the downregulated genes and of the 66 available promoters five (7.6%) contained
potential xbp1 binding motif, which is close to 6.4% found in whole genome, further supporting
the significance of the overrepresentation of this motif in the promoters of the upregulated genes.
As Table 1 shows, one of those genes containing a potential xbp1 binding motif is transcription
factor ATF3, previously shown to be activated via the ire1 pathway (40). ATF3 can be induced
by many cellular signals and although it has been shown to be important for liver regeneration
(12, 42), its specific role in the stress response is not understood. The xbp1 binding motif is also
present in the promoter of LDLR, a gene involved in lipid metabolism, a process which most
likely undergoes changes during the expansion of the ER membranes. The activity of LDLR is
regulated by sterol levels, so its upregulation during increased membrane biosynthesis is not
surprising. However, functional studies will be needed to establish whether xbp1 in fact
regulates the expression of the ATF3 or LDLR genes.
The results of a similar search for the NFkB binding site, GGGRNNYYCC, in the
promoters of the upregulated genes are shown in Table 2. We have found that 30 upregulated
genes contain potential NFkB binding sites, which represents 33.7% of the tested genes.
However, this is only a slight overrepresentation when compared with 31% of such genes found
20
by guest on September 24, 2018
http://ww
w.jbc.org/
Dow
nloaded from
in the genome-wide population. Interestingly, we have found 6 potential NFkB binding sites in
the promoter of the xbp1 gene, which raises an intriguing possibility that xbp1gene may be a
downstream target of NFkB.
Although xbp1 and NFkB recognition sites are present in the upregulated genes it is possible that
some of these sites are not functional. Thus, only future functional studies will unequivocally
establish the role of these transcription factors in the upregulated genes expression.
21
by guest on September 24, 2018
http://ww
w.jbc.org/
Dow
nloaded from
DISCUSSION
Our studies show that the cellular response of HepG2 cells to overexpression of P450
involves signaling pathways in both the UPR and EOR. In the UPR response, one set of activated
genes is designed to correct the ER congestion and the presence of abnormal proteins to permit
survival of the cell, while at the same time other genes are activated which lead to cell death.
Whether apoptosis or survival is the ultimate outcome presumably depends on the severity of the
insult and whether it can be corrected before an irreversible commitment to cell death. In the
case of overexpression of P450 in the liver in response to a xenobiotic stimulus, survival of the
hepatocytes is critical to its physiological detoxification function. The activation of NFkB in the
EOR response may be a key response for cell survival in this situation. Based on the induction of
BiP, the HepG2 cell initially mounts a transient UPR response in the first few hours of the
increased expression and later mounts a sustained EOR. NFkB is generally considered to be a
cell-survival factor which activates anti-apoptotic genes and suppresses pro-apoptotic ones
(14). In the HepG2 cells this is expressed as a downregulation of the apoptotic JNK pathway and
repressed expression of the apoptotic gene CHOP. This idea is strongly supported by the
observation that in the non-hepatic COS1 cell line, the early UPR occurs, but activation of
NFkB is absent. The activated JNK pathway is sustained, CHOP expression is induced, and the
cells are directed toward apoptosis. In HepG2 cells, the UPR activates pathways that can lead to
either cell survival or cell death. The further activation of the EOR pathway may have the
important effect of tilting the bias toward cell survival.
22
by guest on September 24, 2018
http://ww
w.jbc.org/
Dow
nloaded from
The activation of NFkB by overexpression of P450 in HepG2 cells correlates with the
accumulation of P450 in the cells. Further, this activation was strictly dependent on retention and
accumulation of the protein in the ER. Similar NFkB induction was observed in cells expressing
either a full length P450 protein or the chimera containing only the N-terminal signal-anchor
TM sequence. This is consistent with earlier observations showing that for several ER retained
proteins the signal for both NFkB activation and ER proliferation, is contained in the membrane
inserting peptide (3, 21, 43). Studies in yeast also concluded that the N-terminal transmembrane
signal-anchor of P450 was sufficient to induce ER membrane proliferation (16).
The dominant role of the ER retention function of the TM, rather than a specific signal
sequence within the TM for ER membrane proliferation, is evident for the chimeric proteins C1-
28/GFP and EGC. Both of the proteins contain the same 28- amino acid membrane spanning
sequence, yet, only C1-28/GFP, which is directly retained in the ER, strongly activates NFkB,
whereas EGC, which is transported to the plasma membrane, shows only minor activation. This
observation is also consistent with NFkB activation in response to the accumulation of the ER
retained membrane protein rather than the increased volume of the ER-Golgi traffic.
Interestingly, we observed that the chimeric protein C1-21/GFP, with the juxtamembrane linker
region deleted, was a much weaker activator of the NFkB than C1-28/GFP although both
proteins accumulate to a very similar level (C1-28/GFP is directly retained in the ER while C1-
21/GFP undergoes recycling between the ER and pre-Golgi (26)). This raises the possibility that
23
by guest on September 24, 2018
http://ww
w.jbc.org/
Dow
nloaded from
the linker region may be involved in EOR signal transduction, which would be reminiscent of the
report that the juxtamembrane region of aldehyde dehydrogenase is important for the ER
membrane proliferation (44). Alternatively, the role of the linker may be to segregate P450 to a
different subdomain of the ER which prevents recycling and results in a stronger stimulus for the
EOR.
Studies in yeast have led to conflicting conclusions concerning the role of the ire1
pathway in P450 induced ER proliferation. Takewaka et al (18) showed that ire1 was necessary
for ER proliferation and P450 accumulation in yeast expressing P450 alk 1 (CYP 52A3).
However, according to other studies, overexpression of P450 52A3 in yeast induced both the
Kar2 gene and membrane proliferation, but membrane proliferation did not depend on the ire1
gene. The authors concluded that induction of chaperone Kar2 in yeast is secondary to the ER
membrane proliferation and maintains the same chaperone concentration in the increased volume
of the ER (17).
Our results, showing that overexpression of P450 2C2 in HepG2 cells leads to the
induction of the BiP/grp78 promoter and splicing of the transcription factor xbp1 are consistent
with the activation of both ATF6 and the ire1 pathways. According to the most recent models
activation of the BiP and xbp1 promoters is mediated by ATF6, whereas the splicing of xbp1
mRNA is the exclusive function of ire1 (7). In contrast to the yeast data, we have observed that
the activation of the UPR chaperone BiP/grp78 promoter occurred as an early stress response,
24
by guest on September 24, 2018
http://ww
w.jbc.org/
Dow
nloaded from
preceding maximal accumulation of the P450 proteins in HepG2 cells, whereas ire1-mediated
activation of the xbp1 paralleled the increase in P450 accumulation. Thus, the kinetics of the
activation of these two UPR mediators is different. This result is consistent with other studies
that indicate that ire1 activation is not required for the UPR response and may be a delayed
response in the UPR which induces ER-associated degradation of proteins (41). Further, xbp1,
which is activated by ire1-mediated splicing of its mRNA, is known to play a role in cellular
adjustments requiring substantial ER expansion, such as hepatocyte development and B-cell
differentiation (12, 13). The ire1 pathway, thus, is a prime candidate for inducing the
proliferation of the ER.
The analysis of global gene changes in response to overexpression of P450 in HepG2
cells by DNA microarray analysis was generally consistent with the activation of both the UPR
and EOR pathways. The most prominent functional group of the upregulated genes is
represented by signaling molecules, suggesting that multiple pathways are involved in adaptation
of cells to the P450-induced EOR. We detected strong upregulation of the anti-apoptotic
gadd45b gene, which is known to be induced by NFkB and whose anti-apoptotic effect may
depend on suppressing the JNK pathway (45). Moreover, one of the strongest activated
transcription factors was stress inducible factor ATF3, which is a negative regulator of CHOP
and p53 and which protects cells from the apoptosis (39). Its significant upregulation in the
HepG2 cells overexpressing P450 may be involved in the suppression of CHOP activation and
25
by guest on September 24, 2018
http://ww
w.jbc.org/
Dow
nloaded from

preventing apoptosis.
Upregulation of mostly cytosolic chaperones (hsp40, hsp70B, dnaJ40), some of which have
potential NFkB binding sites in their promoters, may be related to their role in enhancing the
folding capacity of the ER proteins exposed mostly on the cytosolic side of the membrane, like
microsomal P450s, which essentially lack any lumenal domain.
Upregulation of genes involved in lipid and amino acid metabolism (the latter ones most likely
resulting from the activation of the PERK pathway) is consistent with the expected increase in
membrane synthesis in response to the P450 induced EOR. Significant upregulation of the
LDLR , whose transcription is regulated by the level of sterols, may be related to the increased
demand for cholesterol resulting from the proliferation of the smooth ER membranes. As in
DNA microarray analysis of the UPR in HeLa cells (46) upregulation of most genes involved in
ER protein translocation and transport, was not observed in HepG2 cells. This may be related to
the fact that P450 expression results mainly in expansion of only smooth ER. Interestingly, in
the class of genes involved in the intracellular transport, only sec24B, related to the sec24 gene
family, was induced. Upregulation of sec24 may be of significance in view of the recent data
suggesting that COPII components may be involved in the ER stress response and/or in the
segregation of retained proteins to ER subdomains (47, 48).
We have not detected with microarray analysis upregulation of the xbp1 gene, although
our RT-PCR data showed a 2-2.5 fold increase in the total mRNA level 48 hrs after
26
by guest on September 24, 2018
http://ww
w.jbc.org/
Dow
nloaded from
transfection. Most likely, this is due to the lower sensitivity of the microarray hybridization
procedure and our stringent selection conditions, since xbp1 induction is only border-like for the
required minimal two-fold increase on microarray.
To examine whether the activation of NFkB and ire1-mediated activation of xbp1 by
P450 expression could be detected by analyzing the global expression of target genes for these
transcription factors we analyzed the promoters of the upregulated genes.
Although genes with xbp1 binding motifs were overrepresented in induced genes, those with
NFkB binding sites were not. Interestingly, multiple NFkB sites were present in the xbp1
promoter suggesting a cross- regulation between the EOR and UPR pathways. Several of the
genes with xbp1 binding motifs were candidates for genes involved in ER stress response or
proliferation such as LDLR, ATF3, MCL1, DUSP1, MAP kinase and RAI3. Likewise, induced
genes containing NFkB binding motifs also include genes involved in apoptosis, lipid
metabolism and cytosolic chaperones. Whether any of these genes is in fact transcriptionally
regulated by xbp1 and/or NFkB will require additional studies.
These data are consistent with the following model of the cellular response to the
increasing P450 accumulation in the ER. The early response to the P450 synthesis involves
induction of the UPR and general ER stress response chaperone BiP (ATF6 pathway) and the
ire1 pathway, as indicated by a slight increase in the xbp1 splicing. Continuous P450
accumulation and increasing ER overload result in sustained activation of ire1 and activation of
27
by guest on September 24, 2018
http://ww
w.jbc.org/
Dow
nloaded from
NFkB. Ire1 may have a dual role of inducing ER proliferation and activation of the apoptotic
JNK pathway by recruiting TRAF2. NFkB downregulates the JNK pathway and also
upregulates some anti-apoptotic genes, ensuring survival of the hepatic cells with an expanding
ER compartment which is the desired physiological outcome.
28
by guest on September 24, 2018
http://ww
w.jbc.org/
Dow
nloaded from

ACKNOWLEDGMENTS:
This research was supported by National Institute of Health Grant GM35897. We
acknowledge the Minnesota Lions Macular Degeneration Center and the Minnesota Foundation
for their support.
29
by guest on September 24, 2018
http://ww
w.jbc.org/
Dow
nloaded from

REFERENCES
1. Kaufman, R.J. (2002) J. Clin. Invest. 110, 1389-1398.
2. Patil, C and Walter, P. (2001) Curr. Op. Cell Biol. 13, 349-356.
3. Kaufman, R.J. (1999) Genes Dev. 13, 1211-1233.
4. Mori, K. (2000) Cell 101, 451-454.
5. Yoshida, H., Haze, K., Yanagi, H., Yura, T. and Mori, K. (1998) J. Biol. Chem. 273,
33741-33749.
6. Tirasophon, W., Welihinda, A.A. and Kaufman, R.J. (1998) Genes& Dev. 12. 1812-
1824.
7. Yoshida, H., Matsui, T., Yamamoto, A., Okada, T., and Mori, K. (2001) Cell 107,
881-891.
8. Lee, K., Tirasophon, W., Shen, X., Michalak, M., Prywes, R., Okada, T., Yoshida, H.,
Mori, K. and Kaufman, R.J. (2002) Genes& Dev. 16, 452-466.
9. Urano, F., Wang, X.Z., BertolottiA., Zhang, Y., Chung, P., Harding, H.P. and Ron,
D. (2000) Science 287, 664-666.
10. Calfon, M., Zeng, H., Urano, F., Till, J.H., Hubbard, S.R., Harding, H.P., Clark,
S.G. and Ron, D. (2002) Nature 415, 92-96.
11. Urano, F., Bertolotti, A. and Ron, D. (2000) J. Cell Sci. 113, 3697-3702.
12. Reimold, A.M., Etkin, A., Clauss, I., Perkins, A., Friend, D.S., Zhang, J., Horton,
H.F., Scotty, A., Orkin, S.H., Byrne, M.C., et al. (2000) Genes& Dev. 14, 152-157.
30
by guest on September 24, 2018
http://ww
w.jbc.org/
Dow
nloaded from
13. Reimold, A.M., Iwakoshi, N.N., Vallabhajosyula, P., Szomolanyi-Tsuda, E.,
Gravallese, E.M., Friend, D., Grusby, M.J., Alt, F. and Glimcher, L.H. (2001) Nature
412, 300-307.
14. Cudna, R.E. and Dickson, A. (2002) Biotech.& Bioeng. 81, 56-65.
15. Larson, L.L., Parrish, M.L., Koning, A.J. and Wright, R.L. (2002) Yeasts 19, 373-
393.
16. Menzel,R., Kargel, E., Vogel, F., Bottcher, C. and Schunck, W.H. (1996) Arch.
Biochem.Biophys. 330, 97-109.
17. Menzel, R., Vogel, F., Kargel, E. and Schunck, W.H. (1997) Yeasts 13, 1211-1229.
18. Takewaka, T., Zimmer, T., Hirata, A. and Takagi, M. (1999) J. Biochem. (Tokyo)
125, 507-514
19. Pahl, H.L. and Baeuerle, P.A. (1995) EMBO J. 14, 2580-2588.
20. Mercurio, F. and Manning, A.M. (1999) Oncogene 18, 6163-6171.
21. Pahl, H.L. (1999) Physiol. Rev. 79, 683-701.
22. Jones, A.L. and Fawcett, D.W. (1966) J. Histochem.Cytochem. 14, 215-231.
23. Schunck, W.-H., Vogel, F. and Gross, B., et al. (1991) Eur. J. Biol. 55, 336-345.
24. Chang, S.C., Wooden, S.K., Nakaki, T., Kim, Y.K., Lin, A.Y., Kung, L., Attenello,
J.W. and Lee, A.S. (1987) Proc. Natl. Acad. Sci. USA 84, 1987.
25. Szczesna-Skorupa, E., Chen, C., Rogers, S., and Kemper, B. (1998) Proc. Natl. Acad.
Sci. USA. 95, 14793–14798.
31
by guest on September 24, 2018
http://ww
w.jbc.org/
Dow
nloaded from
26. Szczesna-Skorupa, E., and Kemper, B. (2000) J. Biol. Chem. 275, 19409–19415.
27. Szczesna-Skorupa, E., and Kemper, B. (2001) J. Biol. Chem. 276, 45009-
45014.
28. Szczesna-Skorupa, E., Mallah, B. and Kemper, B. (2003) J. Biol. Chem. 278,
31269-31276.
29. Dive, C., Gregory, C.D., Phipps, D.J., Evans, D.L. Milner, A.E. and Wyllie, A.H.
(1992) Biochem. Biophys. Acta 1133, 275-282.
30. Theilhaber, J., Bushnell, S., Jackson, A. and Fuchs, R. (2001) J. Comput. Biol. 8,
585-614.
31. Szczesna-Skorupa, E., Ahn, K., Chen, C.-D., Doray, B. and Kemper, B. (1995) J.
Biol. Chem. 270, 24327-24333.
32. Szczesna-Skorupa, E., Chen, C.-D. and Kemper, B. (2000) Arch. Biochem. Biophys.
374, 128-136.
33. May, M.J. and Ghosh, S. (1998) Immunol. Today 19, 80-88.
34. Oyadomari, S., Araki, E. and Mori, M. (2002) Apoptosis 7, 335-345.
35. Leonardi, A., Vito, P., Mauro, C., Pacifico, F., Ulianich, L., Consiglio, E.,
Formisano, S. and Di Jeso, B. (2002) Endocrinology 143, 2169-2177.
36. Van Anken, E., Romijn, E.P., Maggioni, C., Mezghrani, A., Sitia, R., Braakman, I.
and Heck, A.J.R. (2003) Immunity 18, 243-253.
32
by guest on September 24, 2018
http://ww
w.jbc.org/
Dow
nloaded from
37. De Smaele, E., Zazzeroni, F., Papa, S., Nguyen, D. U., Jin, R., Jones, J., Cong, and
Franzoso, G. (2001) Nature 414, 308-313, 2001.
38. Fawcett, T.W., Martindale, J.L., Guyton, K.Z., Hai, T., Holbrook, N.J. (1999)
Biochem. J. 339, 135-141.
39. Chen, B.P.C., Wolfgang, C.D. and Hai, T. (1996) Mol. Cell. Biol. 16, 1157-1168.
40. Zhang, C., Kawauchi, J., Adachi, M.T., Hashimoto, Y., Oshiro, S., Aso, T. and
Kitajima, S. (2001) Biochem. Biophys. Res. Commun. 289, 718-724.
41. Yoshida, H., Matsui, T., Hosokawa, N., Kaufman, R.J., Nagata, K. and Mori, K.
(2003) Dev. Cell 4, 265-271.
42. Hsu, J.-C., Laz, T., Mohn, K.L. and Taub, R. (1991) Proc. Natl. Acad. Sci. USA 88,
3511-3515.
43. Vergeres, G., Benedict Yen, T.S., Aggeler, J., Lausier, J. and Waskell, L. (1993) J.
Cell Sci. 106, 249-259.
44. Yamamoto, A., Masaki, R. and Tashiro, Y. (1996) J. Cell Sci. 109, 1727-1738.
45. Karin, M. and Lin, A. (2002) Nature Immunology 3, 221-227.
46. Okada, T., Yoshida, H., Akazawa, R., Negishi, M. and Mori, K. (2002) Biochem. J.
365, 585-594.
47. Higashio, H. and Kohno, K. (2002) Biochem. Biophys. Res. Commun. 296, 568-574.
48. Fu, L. and Sztul, E. (2003) J. Cell Biol. 160, 157-163.
33
by guest on September 24, 2018
http://ww
w.jbc.org/
Dow
nloaded from

FOOTNOTES:
§These authors contributed equally to the presented work
1Abbreviations: P450, cytochrome P450; ER, endoplasmic reticulum; UPR, unfolded protein
response; EOR, endoplasmic reticulum overload response; ERSE, endoplasmic reticulum stress
response element; GFP, green fluorescent protein; TM, transmembrane domain.
34
by guest on September 24, 2018
http://ww
w.jbc.org/
Dow
nloaded from
FIGURES LEGENDS
Figure 1. Transcriptional activation of the NFkB promoter by P450 2C2 chimeras.
HepG2 cells were co-transfected with the reporter plasmid NFkB/luciferase (25 ng),
phRK-Tk (0.1 ng), and the indicated amounts of P450 expression vector DNA. The
relative luciferase activity (expressed as a ratio of firefly luciferase activity to Renilla
luciferase activity) was measured after 24 hrs of transfection . All values represent the
averages of three independent experiments (done in triplicates) with standard deviations
shown (error bars).
Figure 2. Time-course of the transcriptional activation of BiP and NFkB promoters and
of C2/GFP accumulation in transfected HepG2 cells. HepG2 cells were co-transfected
with phRK-Tk (0.1 ng), 25 ng of either NFkB/luciferase vector DNA or BiP/luciferase
vector DNA and 100 ng of C2/GFP vector DNA for luciferase activity assays, or with
100 ng of C2/GFP vector DNA only for fluorescent protein quantification (bottom panel).
At the indicated times after transfection, luciferase activity was measured and presented
as in Figure 1, and the fluorescence of C2/GFP in transfected cells was measured as
described in Methods. Black and grey bars indicate P450- or mock-transfected cells,
respectively.
35
by guest on September 24, 2018
http://ww
w.jbc.org/
Dow
nloaded from
Figure 3. The effect of P450 2C2 overexpression in COS1 cells on the transactivation of
BiP and NFkB. COS1 cells were transfected with the indicated amounts of C2/GFP
vector DNA and the appropriate reporter vector DNA, as in Figure 1. 24 hours after
transfection luciferase activity assays were performed and are presented as described in
the legend to Figure1.
Figure 4. CHOP induction in HepG2 and COS1 cells overexpressing P450 2C2. RNA
was prepared from HepG2 and COS1 cells transfected with C2/CMV5 DNA for either
24 or 48 hours and used for RT-PCR with CHOP, BiP, and actin specific primers as
described in Methods. PCR products were analyzed on 2% agarose gels and detected by
ethidium bromide staining.
Figure 5. JNK activation in P450 expressing cells.
HepG2 and COS1 cells were transfected with 100 ng of C2/CMV5 DNA for either 24 or
48 hrs. Cellular lysates (40 ug of total protein) were analyzed by western blotting, using
antibody specific for phosphorylated JNK.
Figure 6. xbp1 splicing in P450 expressing cells.
HepG2 and COS1 cells were transfected with C2/CMV5 DNA for either 24 or 48 hours.
Untransfected cells were treated with 0.3 uM thapsigargin for 4 hours. Total RNA was
36
by guest on September 24, 2018
http://ww
w.jbc.org/
Dow
nloaded from
prepared from the cells and used for RT-PCR analysis using xbp1 and actin primers.
PCR products were separated on 4% polyacrylamide gels which were stained with
ethidium bromide. The positions of the unspliced (442 bp) and spliced (416 bp) products
are shown as U and S, respectively.
Figure 7. Time-course of xbp1 splicing in HepG2 cells expressing P450 2C2.
HepG2 cells were transfected with C2/CMV5 DNA for the indicated time, after which
total RNA was prepared and used for RT-PCR, as described in Figure 6. Quantification
of the spliced and unspliced forms of xbp1, separated on 4% acrylamide gels, was done
using NIH Image software version 1.23. Background values were subtracted from all
calculations. Average values of three independent experiments are shown. Black and
grey bars indicate P450- or mock-transfected cells, respectively.
Figure 8. Two-way hierarchical clustering analysis of gene expression in mock-
transfected HepG2 cells or cells transfected with P450 expression vectors. To estimate
expression levels of qualifiers, biotinylated cRNA probes were hybridized to the
HumU133A microarrays, the microarrays were stained with streptavidin-phycoerythrin,
and fluorescence intensity for each qualifier was measured as described in Materials and
Methods. The range of fluorescent intensities is represented by colors as shown in the
color scale for raw fluorescent intensities of qualifiers at the bottom of the figure. A total
37
by guest on September 24, 2018
http://ww
w.jbc.org/
Dow
nloaded from
of 22,283 qualifiers on the U133A chip were clustered. On the Y axis, genes were
clustered based on the correlation of raw fluorescent intensities for qualifiers among the
four treatment groups. On the X-axis, the four samples were clustered based on a
comparison of the overall pattern of gene expression in each sample, and the total length
of the vertical lines connecting the different samples is proportional to the differences in
expression patterns. The mock samples are more similar to each other than to either of
the two induced samples, and the reverse is also true, which demonstrates the
reproducibility of the data between the independent DNA array analyses.
38
by guest on September 24, 2018
http://ww
w.jbc.org/
Dow
nloaded from
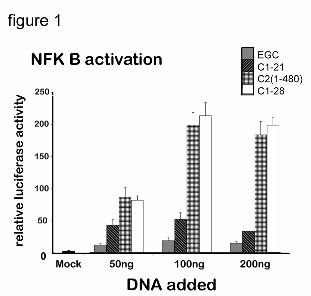
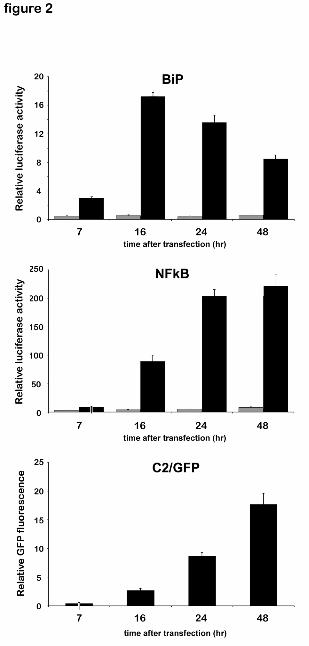
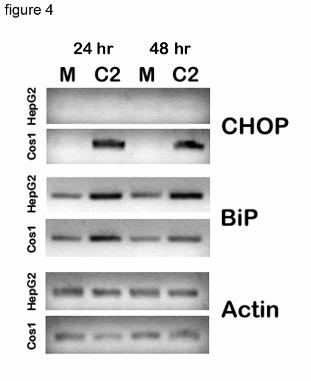
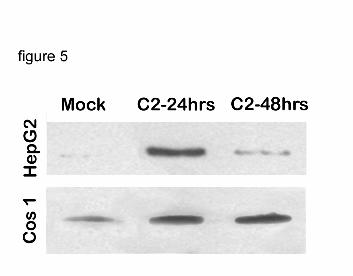
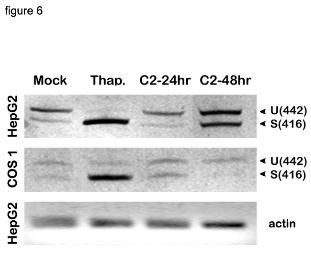
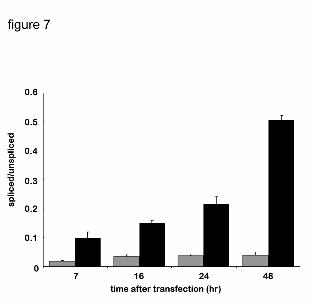
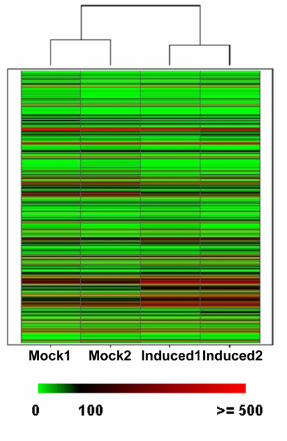
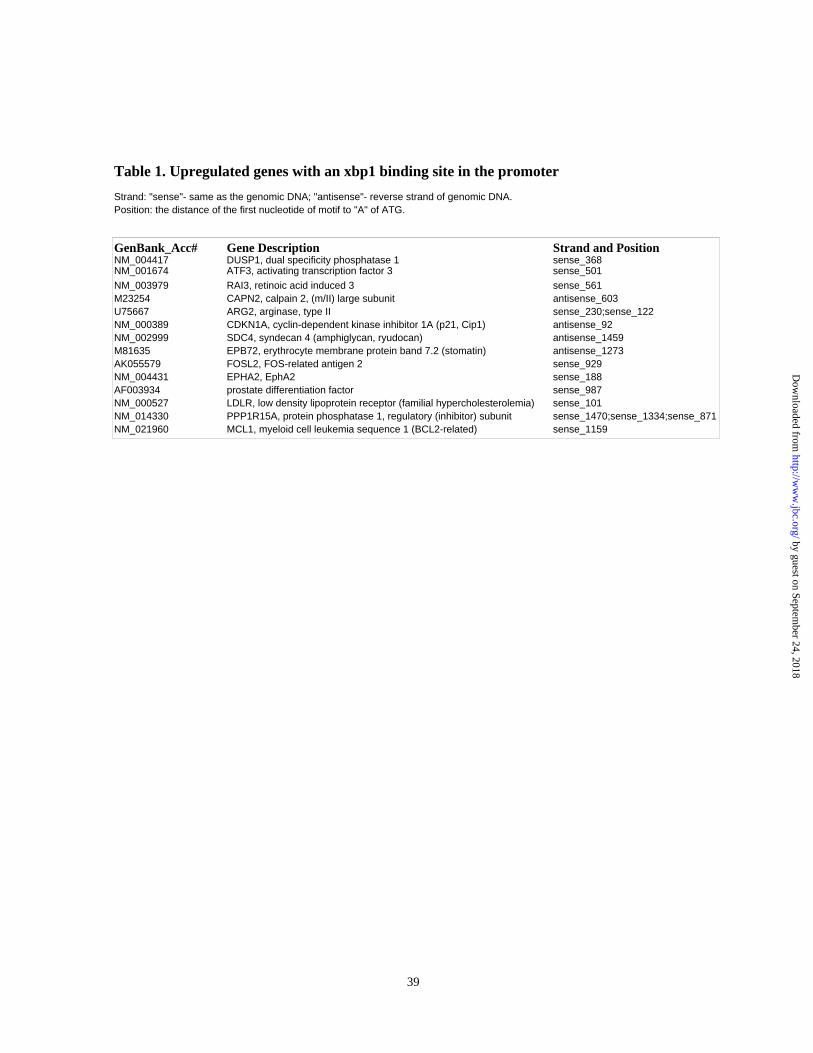
Table 1. Upregulated genes with an xbp1 binding site in the promoter
Strand: "sense"- same as the genomic DNA; "antisense"- reverse strand of genomic DNA. Position: the distance of the first nucleotide of motif to "A" of ATG.
GenBank_Acc# Gene Description Strand and PositionNM_004417 DUSP1, dual specificity phosphatase 1 sense_368NM_001674 ATF3, activating transcription factor 3 sense_501NM_003979 RAI3, retinoic acid induced 3 sense_561M23254 CAPN2, calpain 2, (m/II) large subunit antisense_603U75667 ARG2, arginase, type II sense_230;sense_122NM_000389 CDKN1A, cyclin-dependent kinase inhibitor 1A (p21, Cip1) antisense_92NM_002999 SDC4, syndecan 4 (amphiglycan, ryudocan) antisense_1459M81635 EPB72, erythrocyte membrane protein band 7.2 (stomatin) antisense_1273AK055579 FOSL2, FOS-related antigen 2 sense_929NM_004431 EPHA2, EphA2 sense_188AF003934 prostate differentiation factor sense_987NM_000527 LDLR, low density lipoprotein receptor (familial hypercholesterolemia) sense_101NM_014330 PPP1R15A, protein phosphatase 1, regulatory (inhibitor) subunit sense_1470;sense_1334;sense_871NM_021960 MCL1, myeloid cell leukemia sequence 1 (BCL2-related) sense_1159
39
by guest on September 24, 2018
http://ww
w.jbc.org/
Dow
nloaded from
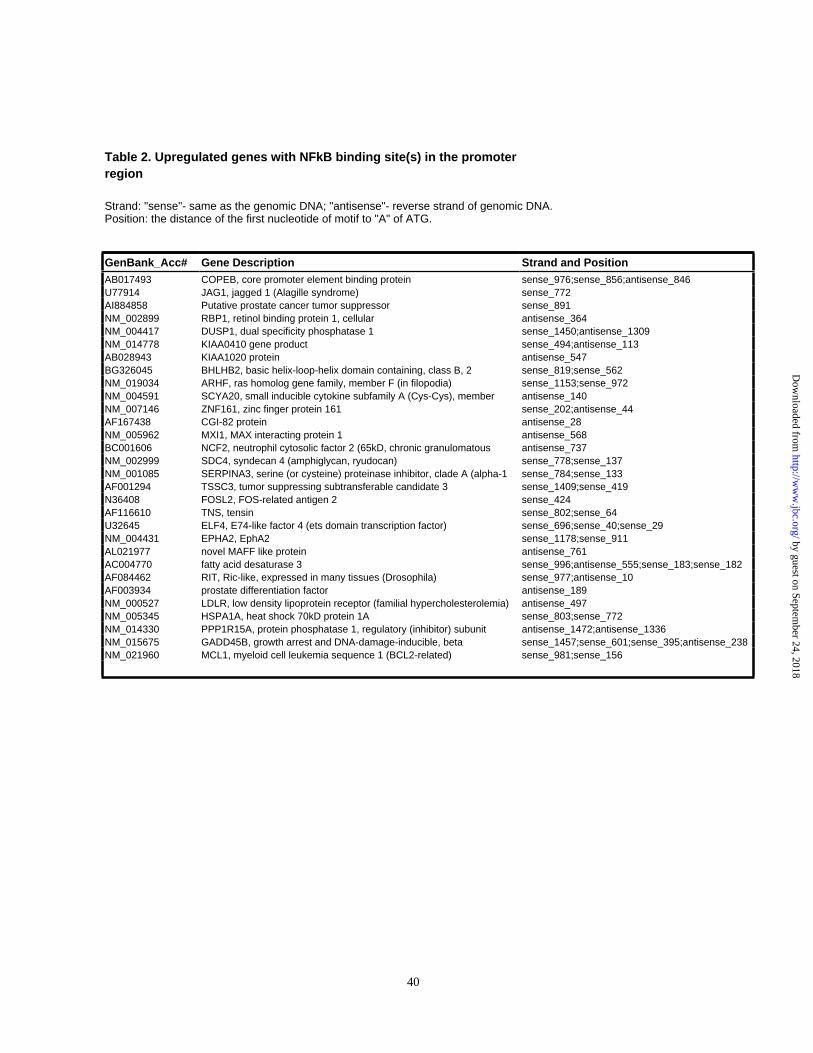
Table 2. Upregulated genes with NFkB binding site(s) in the promoter region
Strand: "sense"- same as the genomic DNA; "antisense"- reverse strand of genomic DNA.Position: the distance of the first nucleotide of motif to "A" of ATG.
GenBank_Acc# Gene Description Strand and PositionAB017493 COPEB, core promoter element binding protein sense_976;sense_856;antisense_846U77914 JAG1, jagged 1 (Alagille syndrome) sense_772AI884858 Putative prostate cancer tumor suppressor sense_891NM_002899 RBP1, retinol binding protein 1, cellular antisense_364NM_004417 DUSP1, dual specificity phosphatase 1 sense_1450;antisense_1309NM_014778 KIAA0410 gene product sense_494;antisense_113AB028943 KIAA1020 protein antisense_547BG326045 BHLHB2, basic helix-loop-helix domain containing, class B, 2 sense_819;sense_562NM_019034 ARHF, ras homolog gene family, member F (in filopodia) sense_1153;sense_972NM_004591 SCYA20, small inducible cytokine subfamily A (Cys-Cys), member antisense_140NM_007146 ZNF161, zinc finger protein 161 sense_202;antisense_44AF167438 CGI-82 protein antisense_28NM_005962 MXI1, MAX interacting protein 1 antisense_568BC001606 NCF2, neutrophil cytosolic factor 2 (65kD, chronic granulomatous antisense_737NM_002999 SDC4, syndecan 4 (amphiglycan, ryudocan) sense_778;sense_137NM_001085 SERPINA3, serine (or cysteine) proteinase inhibitor, clade A (alpha-1 sense_784;sense_133AF001294 TSSC3, tumor suppressing subtransferable candidate 3 sense_1409;sense_419N36408 FOSL2, FOS-related antigen 2 sense_424AF116610 TNS, tensin sense_802;sense_64U32645 ELF4, E74-like factor 4 (ets domain transcription factor) sense_696;sense_40;sense_29NM_004431 EPHA2, EphA2 sense_1178;sense_911AL021977 novel MAFF like protein antisense_761AC004770 fatty acid desaturase 3 sense_996;antisense_555;sense_183;sense_182AF084462 RIT, Ric-like, expressed in many tissues (Drosophila) sense_977;antisense_10AF003934 prostate differentiation factor antisense_189NM_000527 LDLR, low density lipoprotein receptor (familial hypercholesterolemia) antisense_497NM_005345 HSPA1A, heat shock 70kD protein 1A sense_803;sense_772NM_014330 PPP1R15A, protein phosphatase 1, regulatory (inhibitor) subunit antisense_1472;antisense_1336NM_015675 GADD45B, growth arrest and DNA-damage-inducible, beta sense_1457;sense_601;sense_395;antisense_238NM_021960 MCL1, myeloid cell leukemia sequence 1 (BCL2-related) sense_981;sense_156
40
by guest on September 24, 2018
http://ww
w.jbc.org/
Dow
nloaded from

1
Table 3. Identities of genes upregulated by P450 expression in HepG2 cells.
HG-U133 TARGET GenBank_Acc# Gene Description Gene Symbol Fold change
Chaperone, stress response, cellular defense response213418_AT NM_002155 heat shock 70kDa protein 6 (HSP70B') HSPA6 6.7202558_S_AT NM_006948 stress 70 protein chaperone, microsome-associated, 60kDa STCH 4.4202173_S_AT NM_007146 zinc finger protein 161 ZNF161 4.3202581_AT NM_005346 heat shock 70kDa protein 1B HSPA1B 3.9200800_S_AT NM_005345 heat shock 70kDa protein 1A HSPA1A 3.7206584_AT NM_015364 MD-2 protein MD-2 3.6209949_AT BC001606 neutrophil cytosolic factor 2 (65kDa, chronic granulomatous
disease, autosomal 2)NCF2 3.1
201041_S_AT NM_004417 dual specificity phosphatase 1 DUSP1 2.9202171_AT NM_007146 zinc finger protein 161 ZNF161 2.5202557_AT AI718418 stress 70 protein chaperone, microsome-associated, 60kDa STCH 2.3200664_S_AT BG537255 DnaJ (Hsp40) homolog, subfmaily B, member 1 DNAJB1 2.2200799_AT NM_005345 heat shock 70kDa protein 1A HSPA1A 2.1
Kinase, phosphotase, signaling, cytokine202859_X_AT NM_000584 interleukin 8 IL8 17.2203108_AT NM_003979 retinoic acid induced 3 RAI3 11.5209457_AT U16996 dual specificity phosphatase 5 DUSP5 10.0203153_AT NM_001548 interferon-induced protein with tetratricopeptide repeats 1 IFIT1 5.2200730_S_AT BF576710 protein tyrosine phosphatase type IVA, member 1 PTP4A1 5.1211458_S_AT AF180519 GABA(A) receptors associated protein like 3 GABARAPL3 4.7205476_AT NM_004591 chemokine (C-C motif) ligand 20 CCL20 4.4210999_S_AT U66065 growth factor receptor-bound protein 10 GRB10 3.8206029_AT NM_014391 cardiac ankyrin repeat protein CARP 3.7201266_AT NM_003330 thioredoxin reductase 1 TXNRD1 3.6202693_S_AT NM_004760 serine/threonine kinase 17a (apoptosis-inducing) STK17A 3.4209882_AT AF084462 Ras-like without CAAX 1 RIT1 3.3203439_S_AT BC000658 stanniocalcin 2 STC2 3.3202014_AT NM_014330 protein phosphatase 1, regulatory (inhibitor) subunit 15A PPP1R15A 3.2202628_S_AT NM_000602 serine (or cysteine) proteinase inhibitor, clade E (nexin,
plasminogen activator inhibitor type 1), member 1SERPINE1 3.1
202376_AT NM_001085 serine (or cysteine) proteinase inhibitor, clade A (alpha-1 antiproteinase, antitrypsin), member 3
SERPINA3 3.1
37028_AT U83981 protein phosphatase 1, regulatory (inhibitor) subunit 15A PPP1R15A 2.9209369_AT M63310 annexin A3 ANXA3 2.9213506_AT BE965369 coagulation factor II (thrombin) receptor-like 1 F2RL1 2.9212263_AT AF142419 homolog of mouse quaking QKI (KH domain RNA binding
protein)QKI 2.8
217776_AT AF167438 androgen-regulated short-chain dehydrogenase/reductase 1 ARSDR1 2.6209410_S_AT AF000017 growth factor receptor-bound protein 10 GRB10 2.6204235_S_AT AF200715 CED-6 protein CED-6 2.6212723_AT AK021780 phosphatidylserine receptor PSR 2.6202670_AT AI571419 mitogen-activated protein kinase kinase 1 MAP2K1 2.4203499_AT NM_004431 EphA2 EPHA2 2.4213539_AT NM_000732 CD3D antigen, delta polypeptide (TiT3 complex) CD3D 2.4209102_S_AT AF019214 HMG-box containing protein 1 HBP1 2.3209295_AT AF016266 tumor necrosis factor receptor superfamily, member 10b TNFRSF10B 2.3221577_X_AT AF003934 prostate differentiation factor PLAB 2.2205483_S_AT NM_005101 interferon-stimulated protein, 15 kDa ISG15 2.1219045_AT NM_019034 ras homolog gene family, member F (in filopodia) ARHF 2.1204237_AT NM_016315 CED-6 protein CED-6 2.1
by guest on September 24, 2018
http://ww
w.jbc.org/
Dow
nloaded from
2
ER, transport205924_AT BC005035 RAB3B, member RAS oncogene family RAB3B 3.7202619_S_AT AI754404 procollagen-lysine, 2-oxoglutarate 5-dioxygenase (lysine
hydroxylase) 2PLOD2 3.1
200788_S_AT NM_003768 phosphoprotein enriched in astrocytes 15 PEA15 2.5202798_AT NM_006323 SEC24 related gene family, member B (S. cerevisiae) SEC24B 2.2
Apoptosis209803_S_AT AF001294 tumor suppressing subtransferable candidate 3 TSSC3 3.5204005_S_AT NM_002583 PRKC, apoptosis, WT1, regulator PAWR 2.9200797_S_AT NM_021960 myeloid cell leukemia sequence 1 (BCL2-related) MCL1 2.5
Protein degradation201471_S_AT NM_003900 sequestosome 1 SQSTM1 2.6200898_S_AT AK002091 meningioma expressed antigen 5 (hyaluronidase) MGEA5 2.5208683_AT M23254 calpain 2, (m/II) large subunit CAPN2 2.5211764_S_AT BC005980 ubiquitin-conjugating enzyme E2D 1 (UBC4/5 homolog, yeast) UBE2D1 2.3
Cell cycle, anti-proliferation, cell fate decision200920_S_AT AL535380 B-cell translocation gene 1, anti-proliferative BTG1 4.6200921_S_AT NM_001731 B-cell translocation gene 1, anti-proliferative BTG1 3.8202284_S_AT NM_000389 cyclin-dependent kinase inhibitor 1A (p21, Cip1) CDKN1A 3.4219475_AT NM_013370 pregnancy-induced growth inhibitor OKL38 3.0202364_AT NM_005962 MAX interacting protein 1 MXI1 2.8213423_X_AT AI884858 Putative prostate cancer tumor suppressor N33 2.8216268_S_AT U77914 jagged 1 (Alagille syndrome) JAG1 2.6209099_X_AT U73936 jagged 1 (Alagille syndrome) JAG1 2.5201482_AT NM_002826 quiescin Q6 QSCN6 2.4210513_S_AT AF091352 vascular endothelial growth factor VEGF 2.2
Cytoskeleton, cell structure205547_S_AT NM_003186 transgelin TAGLN 6.1200916_AT NM_003564 transgelin 2 TAGLN2 4.6207649_AT NM_003770 keratin, hair, acidic, 7 KRTHA7 4.5204734_AT NM_002275 keratin 15 KRT15 4.2213953_AT AI732381 cytokeratin 20 KRT20 3.9201060_X_AT AI537887 erythrocyte membrane protein band 7.2 (stomatin) EPB72 3.1212242_AT AL565074 tubulin, alpha 1 (testis specific) TUBA1 2.9201061_S_AT M81635 erythrocyte membrane protein band 7.2 (stomatin) EPB72 2.7201798_S_AT NM_013451 fer-1-like 3, myoferlin (C. elegans) FER1L3 2.6210896_S_AT AF306765 aspartate beta-hydroxylase ASPH 2.5
Transcription factor, DNA damage repair, DNA structure36711_AT AL021977 v-maf musculoaponeurotic fibrosarcoma oncogene homolog F
(avian)MAFF 8.2
202672_S_AT NM_001674 activating transcription factor 3 ATF3 7.8203725_AT NM_001924 growth arrest and DNA-damage-inducible, alpha GADD45A 5.6208961_S_AT AB017493 core promoter element binding protein COPEB 3.7221773_AT AW575374 ELK3, ETS-domain protein (SRF accessory protein 2) ELK3 3.6218880_AT N36408 FOS-like antigen 2 FOSL2 3.6208763_S_AT AL110191 delta sleep inducing peptide, immunoreactor DSIPI 3.6212501_AT AL564683 CCAAT/enhancer binding protein (C/EBP), beta CEBPB 3.5201169_S_AT BG326045 basic helix-loop-helix domain containing, class B, 2 BHLHB2 3.5212641_AT AL023584 human immunodeficiency virus type I enhancer binding protein
2HIVEP2 3.2
212642_S_AT AL023584 human immunodeficiency virus type I enhancer binding protein 2
HIVEP2 2.9
215071_S_AT AL353759 H2A histone family, member L H2AFL 2.9212689_S_AT AA524505 zinc finger protein TSGA 2.7202130_AT AW006290 sudD suppressor of bimD6 homolog (A. nidulans) SUDD 2.637152_AT L07592 peroxisome proliferative activated receptor, delta PPARD 2.5
by guest on September 24, 2018
http://ww
w.jbc.org/
Dow
nloaded from
3
Amino acid, fatty acid, nucleic acid, glycogen, vitamin A metabolism203234_AT NM_003364 Homo sapiens cDNA FLJ38848 fis, clone MESAN2008334,
highly similar to URIDINE PHOSPHORYLASE (EC 2.4.2.3)5.5
217127_AT AL354872 cystathionase (cystathionine gamma-lyase) CTH 5.3216080_S_AT AC004770 fatty acid desaturase 3 FADS3 3.4213988_S_AT BE971383 spermidine/spermine N1-acetyltransferase SAT 3.3203282_AT NM_000158 glucan (1,4-alpha-), branching enzyme 1 (glycogen branching
enzyme, Andersen disease, glycogen storage disease type IV)GBE1 3.0
221059_S_AT NM_021615 carbohydrate (N-acetylglucosamine 6-O) sulfotransferase 6 CHST6 2.9203925_AT NM_002061 glutamate-cysteine ligase, modifier subunit GCLM 2.8205047_S_AT NM_001673 asparagine synthetase ASNS 2.8218322_S_AT NM_016234 fatty-acid-Coenzyme A ligase, long-chain 5 FACL5 2.7202068_S_AT NM_000527 low density lipoprotein receptor (familial hypercholesterolemia) LDLR 2.6
209921_AT AB040875 solute carrier family 7, (cationic amino acid transporter, y+ system) member 11
SLC7A11 2.6
203423_AT NM_002899 retinol binding protein 1, cellular RBP1 2.5203946_S_AT U75667 arginase, type II ARG2 2.1
Unkown202102_S_AT BF718610 bromodomain containing 4 BRD4 5.0222235_S_AT AL139812 4.5219024_AT NM_021622 pleckstrin homology domain containing, family A
(phosphoinositide binding specific) member 1PLEKHA1 4.3
218611_AT NM_016545 immediate early response 5 IER5 4.2204435_AT NM_014778 KIAA0410 gene product KIAA0410 4.2210357_S_AT BC000669 chromosome 20 open reading frame 16 C20orf16 3.4218507_AT NM_013332 hypoxia-inducible protein 2 HIG2 3.4211948_X_AT AL096857 KIAA1096 protein KIAA1096 3.2213372_AT AW173157 Homo sapiens mRNA; cDNA DKFZp586G1922 (from clone
DKFZp586G1922)2.7
218864_AT AF116610 tensin TNS 2.6218541_S_AT NM_020130 chromosome 8 open reading frame 4 C8orf4 2.5221778_AT BE217882 KIAA1718 protein KIAA1718 2.5218478_S_AT NM_017612 hypothetical protein DKFZp434E2220 DKFZp434E2220 2.5212966_AT AB028943 hypermethylated in cancer 2 HIC2 2.4202071_AT NM_002999 syndecan 4 (amphiglycan, ryudocan) SDC4 2.4213349_AT AI934469 KIAA0779 protein KIAA0779 2.3207842_S_AT NM_007359 MLN51 protein MLN51 2.2216623_X_AT AK025084 trinucleotide repeat containing 9 TNRC9 2.1
by guest on September 24, 2018
http://ww
w.jbc.org/
Dow
nloaded from

Table 4. Identities of genes down regulated by P450 expression in HepG2 cells.
HG-U133 TARGET
Accession # Gene Name Gene Symbol Fold change
210327_S_AT D13368 alanine-glyoxylate aminotransferase (oxalosis I; hyperoxaluria I; glycolicaciduria; serine-pyruvate aminotransferase)
AGXT -5.3
203240_AT NM_003890 Fc fragment of IgG binding protein FCGBP -4.7205354_AT NM_000156 guanidinoacetate N-methyltransferase GAMT -4.3214640_AT AL021331 Homo sapiens cDNA FLJ34668 fis, clone
LIVER2000775 -4.2
205892_S_AT NM_001443 fatty acid binding protein 1, liver FABP1 -4.0207761_S_AT NM_014033 DKFZP586A0522 protein DKFZP586A05
22-3.7
220133_AT NM_017855 hypothetical protein FLJ20513 FLJ20513 -3.5206651_S_AT NM_016413 carboxypeptidase B2 (plasma,
carboxypeptidase U)CPB2 -3.4
218736_S_AT NM_017734 palmdelphin PALMD -3.4207102_AT NM_005989 aldo-keto reductase family 1, member D1
(delta 4-3-ketosteroid-5-beta-reductase)AKR1D1 -3.3
208450_AT NM_006498 lectin, galactoside-binding, soluble, 2 (galectin 2)
LGALS2 -3.3
206386_AT NM_000354 serine (or cysteine) proteinase inhibitor, clade A (alpha-1 antiproteinase, antitrypsin), member 7
SERPINA7 -3.3
203924_AT NM_000846 glutathione S-transferase A1 GSTA1 -3.2206453_S_AT NM_016250 NDRG family member 2 NDRG2 -3.1207096_AT NM_006512 serum amyloid A4, constitutive SAA4 -3.0216696_S_AT U95090 -3.0210130_S_AT AF096304 transmembrane 7 superfamily member 2 TM7SF2 -3.0202095_S_AT NM_001168 baculoviral IAP repeat-containing 5
(survivin)BIRC5 -2.9
213599_AT BE045993 Opa-interacting protein 5 OIP5 -2.9213587_S_AT AI884867 vacuolar proton-ATPase subunit LOC155066 -2.8204534_AT NM_000638 vitronectin (serum spreading factor,
somatomedin B, complement S-protein)VTN -2.8
209832_S_AT AF321125 DNA replication factor CDT1 -2.8200884_AT NM_001823 creatine kinase, brain CKB -2.8209608_S_AT BC000408 acetyl-Coenzyme A acetyltransferase 2
(acetoacetyl Coenzyme A thiolase)ACAT2 -2.8
211569_S_AT AF001903 L-3-hydroxyacyl-Coenzyme A dehydrogenase, short chain
HADHSC -2.8
208451_S_AT NM_000592 complement component 4B C4B -2.7221520_S_AT BC001651 hypothetical protein FLJ10468 FLJ10468 -2.7211519_S_AT AY026505 kinesin-like 6 (mitotic centromere-
associated kinesin)KNSL6 -2.7
211890_X_AT AF127765 calpain 3, (p94) CAPN3 -2.6
by guest on September 24, 2018
http://ww
w.jbc.org/
Dow
nloaded from
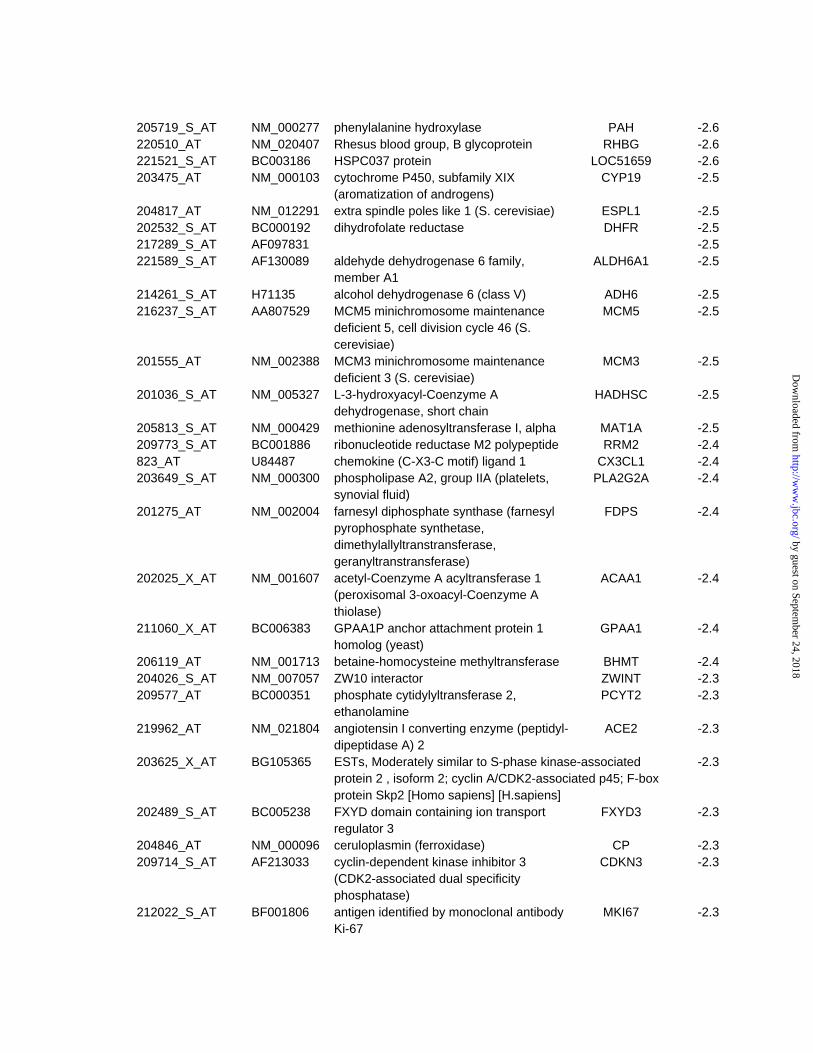
205719_S_AT NM_000277 phenylalanine hydroxylase PAH -2.6220510_AT NM_020407 Rhesus blood group, B glycoprotein RHBG -2.6221521_S_AT BC003186 HSPC037 protein LOC51659 -2.6203475_AT NM_000103 cytochrome P450, subfamily XIX
(aromatization of androgens)CYP19 -2.5
204817_AT NM_012291 extra spindle poles like 1 (S. cerevisiae) ESPL1 -2.5202532_S_AT BC000192 dihydrofolate reductase DHFR -2.5217289_S_AT AF097831 -2.5221589_S_AT AF130089 aldehyde dehydrogenase 6 family,
member A1ALDH6A1 -2.5
214261_S_AT H71135 alcohol dehydrogenase 6 (class V) ADH6 -2.5216237_S_AT AA807529 MCM5 minichromosome maintenance
deficient 5, cell division cycle 46 (S. cerevisiae)
MCM5 -2.5
201555_AT NM_002388 MCM3 minichromosome maintenance deficient 3 (S. cerevisiae)
MCM3 -2.5
201036_S_AT NM_005327 L-3-hydroxyacyl-Coenzyme A dehydrogenase, short chain
HADHSC -2.5
205813_S_AT NM_000429 methionine adenosyltransferase I, alpha MAT1A -2.5209773_S_AT BC001886 ribonucleotide reductase M2 polypeptide RRM2 -2.4823_AT U84487 chemokine (C-X3-C motif) ligand 1 CX3CL1 -2.4203649_S_AT NM_000300 phospholipase A2, group IIA (platelets,
synovial fluid)PLA2G2A -2.4
201275_AT NM_002004 farnesyl diphosphate synthase (farnesyl pyrophosphate synthetase, dimethylallyltranstransferase, geranyltranstransferase)
FDPS -2.4
202025_X_AT NM_001607 acetyl-Coenzyme A acyltransferase 1 (peroxisomal 3-oxoacyl-Coenzyme A thiolase)
ACAA1 -2.4
211060_X_AT BC006383 GPAA1P anchor attachment protein 1 homolog (yeast)
GPAA1 -2.4
206119_AT NM_001713 betaine-homocysteine methyltransferase BHMT -2.4204026_S_AT NM_007057 ZW10 interactor ZWINT -2.3209577_AT BC000351 phosphate cytidylyltransferase 2,
ethanolaminePCYT2 -2.3
219962_AT NM_021804 angiotensin I converting enzyme (peptidyl-dipeptidase A) 2
ACE2 -2.3
203625_X_AT BG105365 ESTs, Moderately similar to S-phase kinase-associated protein 2 , isoform 2; cyclin A/CDK2-associated p45; F-box protein Skp2 [Homo sapiens] [H.sapiens]
-2.3
202489_S_AT BC005238 FXYD domain containing ion transport regulator 3
FXYD3 -2.3
204846_AT NM_000096 ceruloplasmin (ferroxidase) CP -2.3209714_S_AT AF213033 cyclin-dependent kinase inhibitor 3
(CDK2-associated dual specificity phosphatase)
CDKN3 -2.3
212022_S_AT BF001806 antigen identified by monoclonal antibody Ki-67
MKI67 -2.3
by guest on September 24, 2018
http://ww
w.jbc.org/
Dow
nloaded from

203124_S_AT NM_000617 solute carrier family 11 (proton-coupled divalent metal ion transporters), member 2
SLC11A2 -2.3
205576_AT NM_000185 serine (or cysteine) proteinase inhibitor, clade D (heparin cofactor), member 1
SERPIND1 -2.2
206325_AT NM_001756 serine (or cysteine) proteinase inhibitor, clade A (alpha-1 antiproteinase, antitrypsin), member 6
SERPINA6 -2.2
201972_AT AF113129 ATPase, H+ transporting, lysosomal 70kDa, V1 subunit A, isoform 1
ATP6V1A1 -2.2
202592_AT NM_001487 GCN5 general control of amino-acid synthesis 5-like 1 (yeast)
GCN5L1 -2.2
219594_AT NM_016533 ninjurin 2 NINJ2 -2.2222257_S_AT AK026461 angiotensin I converting enzyme (peptidyl-
dipeptidase A) 2ACE2 -2.2
218300_AT NM_024516 hypothetical protein MGC4606 MGC4606 -2.2202954_AT NM_007019 ubiquitin-conjugating enzyme E2C UBE2C -2.2208159_X_AT NM_004399 DEAD/H (Asp-Glu-Ala-Asp/His) box
polypeptide 11 (CHL1-like helicase homolog, S. cerevisiae)
DDX11 -2.2
202589_AT NM_001071 thymidylate synthetase TYMS -2.1205075_AT NM_000934 serine (or cysteine) proteinase inhibitor,
clade F (alpha-2 antiplasmin, pigment epithelium derived factor), member 2
SERPINF2 -2.1
221952_X_AT AB037814 KIAA1393 protein KIAA1393 -2.1215690_X_AT AL157437 GPAA1P anchor attachment protein 1
homolog (yeast)GPAA1 -2.1
205108_S_AT NM_000384 apolipoprotein B (including Ag(x) antigen) APOB -2.0
by guest on September 24, 2018
http://ww
w.jbc.org/
Dow
nloaded from
Elzbieta Szczesna-Skorupa, Ci-Di Chen, Hong Liu and Byron Kemperinduced by microsomal cytochrome P450 overproduction
Gene expression changes associated with the endoplasmic reticulum stress response
published online January 12, 2004J. Biol. Chem.
10.1074/jbc.M312170200Access the most updated version of this article at doi:
Alerts:
When a correction for this article is posted•
When this article is cited•
to choose from all of JBC's e-mail alertsClick here
Supplemental material:
http://www.jbc.org/content/suppl/2004/02/12/M312170200.DC1
by guest on September 24, 2018
http://ww
w.jbc.org/
Dow
nloaded from