gene expression profiling for molecular...
TRANSCRIPT

[CANCER RESEARCH 64, 8558–8565, December 1, 2004]
Gene Expression Profiling for Molecular Characterization of Inflammatory BreastCancer and Prediction of Response to Chemotherapy
Francois Bertucci,1,2,5 Pascal Finetti,1 Jacques Rougemont,6 Emmanuelle Charafe-Jauffret,1,3,5 Valery Nasser,1
Beatrice Loriod,6 Jacques Camerlo,2 Rebecca Tagett,7 Carole Tarpin,2 Gilles Houvenaeghel,4,5 Catherine Nguyen,6
Dominique Maraninchi,2,5 Jocelyne Jacquemier,3 Remi Houlgatte,6 Daniel Birnbaum,1 and Patrice Viens2,5,8
1Departement d’Oncologie Moleculaire, 2Departement d’Oncologie Medicale, 3Departement de Biopathologie, and 4Departement de Chirurgie, Institut Paoli-Calmettes andUMR599 Institut National de la Sante et de la Recherche Medicale (INSERM), IFR137, Marseille, France; 5Faculte de Medecine, Universite de la Mediterranee, Marseille,France; 6Laboratoire TAGC, ERM206 INSERM, Marseille, France; 7Ipsogen SA, Marseille, France; and 8Centre d’Investigation Clinique de Marseille Sainte-Marguerite,Marseille, France
ABSTRACT
Inflammatory breast cancer (IBC) is a rare but aggressive form ofbreast cancer with a 5-year survival limited to �40%. Diagnosis, based onclinical and/or pathological criteria, may be difficult. Optimal systemicneoadjuvant therapy and accurate predictors of pathological responsehave yet to be defined for increasing response rate and survival. UsingDNA microarrrays containing �8,000 genes, we profiled breast cancersamples from 81 patients, including 37 with IBC and 44 with noninflam-matory breast cancer (NIBC). Global unsupervised hierarchical clusteringwas able to some extent to distinguish IBC and NIBC cases and revealedsubclasses of IBC. Supervised analysis identified a 109-gene set the ex-pression of which discriminated IBC from NIBC samples. This molecularsignature was validated in an independent series of 26 samples, with anoverall performance accuracy of 85%. Discriminator genes were associ-ated with various cellular processes possibly related to the aggressivenessof IBC, including signal transduction, cell motility, adhesion, and angio-genesis. A similar approach, with leave-one-out cross-validation, identi-fied an 85-gene set that divided IBC patients with significantly differentpathological complete response rate (70% in one group and 0% in theother group). These results show the potential of gene expression profilingto contribute to a better understanding of IBC, and to provide newdiagnostic and predictive factors for IBC, as well as for potential thera-peutic targets.
INTRODUCTION
Inflammatory breast cancer (IBC) is a rare (�5% of cases) butaggressive form of breast cancer. At diagnosis, a majority of patientsshow axillary lymph node involvement and �35% have distant me-tastases. Although survival has been improved by the introduction ofprimary chemotherapy in the multimodality treatment, prognosis re-mains poor with 5-year survival ranging from 30 to 50% (1). Diag-nosis is based on clinical and/or pathologic criteria. Clinical inflam-matory symptoms arise quickly and involve more than one third of thebreast. The disease is classified as T4d according to the tumor-node-metastasis (TNM)-Union International Contre Cancer (UICC) classi-fication (5th edition). The tumor is often of ductal type, with highhistologic grade, negative for hormone receptors, and highly angio-genic and invasive (1). The presence of tumor emboli in dermallymphatic vessels constitutes the pathologic hallmark of the disease.In some cases non-IBC (NIBC) may be difficult to distinguish, and yet
this distinction is crucial for treatment. Prognostic features (2) remaincontested. Response to primary chemotherapy is a strong, althoughimperfect, indicator of survival (3). Accurate treatment response pre-dictors as well as optimal systemic therapy have to be defined toincrease response rate and survival.
Because of its relative infrequency and the small size of diagnosticsamples, IBC has rarely been investigated at the biological level, andlittle is known about the underlying molecular alterations such asthose that could explain its poor prognosis (4). Most studies havefocused on a single marker or a few markers such as hormonereceptors [ estrogen receptors (ERs), progesterone receptors (PRs)],growth factors (ERBB2, epidermal growth factor receptor) and tumorsuppressors (P53; ref. 5). Experimental models have recently led tothe identification of genes involved in IBC, such as ARHC, coding forthe RhoC GTPase, and WISP3, coding for a S-(2-chloro-1,1,2-triflu-oroethyl)glutathione (CTGF)-related protein (5).
New genomic approaches such as DNA microarrays (6) and serialanalysis of gene expression (SAGE; ref. 7) provide unprecedentedtools to tackle the complexity of cancers. Comprehensive gene ex-pression profiles of NIBC defined with the use of DNA microarrayshave revealed tumor subtypes (8, 9) and expression signatures thatcould improve prognostic classification (9–16). DNA microarrayshave recently been used in IBC to identify genes deregulated by RhoCoverexpression in cell lines (17) but have thus far not been applied toclinical specimens.
We used DNA microarrays for monitoring the RNA expression of�8.000 genes in breast cancer samples from 81 patients, including 37with IBC. Our objective was to investigate the transcriptional profilesof IBC and to search for molecular signatures that correlate with theIBC type and the pathological complete response to primary chemo-therapy.
MATERIALS AND METHODS
Patients and Samples. Eighty-one cancer samples were profiled by usingDNA microarrays. They were obtained from 81 patients with breast adeno-carcinoma who had undergone initial surgery in Institut Paoli-Calmettes. Eachpatient gave written informed consent. Samples were macrodissected and werefrozen in liquid nitrogen within 30 minutes of removal. All of the medicalrecords and tumor sections were de novo reviewed before analysis. Profiledspecimens contained more than 60% tumor cells as assessed before RNAextraction. The 81 samples included 37 pretreatment samples from 37 patientswith IBC, selected by using the following criteria: T4d tumor (TNM-UICCclassification) and/or presence of superficial dermal lymphatic invasion. The44 other samples represented histoclinical forms of NIBC: locally advanced(T3, T4a, T4b, T4c of the TNM-UICC classification, 14 cases), and localizedwith (18 cases) or without (12 cases) pathological axillary lymph node in-volvement. For each of these four clinical forms, samples were consecutiveand selected on the above-cited criteria and on the availability of good qualityRNA. Main histoclinical characteristics of patients are listed in Table 1.Immunohistochemical data collected included ER, PR, and P53 status (posi-tivity cutoff values of 1%), and ERBB2 status (0 to 3� score as illustrated by
Received 7/29/04; revised 9/22/04; accepted 10/1/04.Grant support: Grants from the Ministries of Health and Research (Canceropole) and
from the Association pour le Recherche contre le Cancer (Printemps 2002, N°4719) andLigue Nationale contre le Cancer (label).
The costs of publication of this article were defrayed in part by the payment of pagecharges. This article must therefore be hereby marked advertisement in accordance with18 U.S.C. Section 1734 solely to indicate this fact.
Note: This paper is dedicated to the memory of Dr. Anne-Chantal Braud. Supplemen-tary data for this article can be found at Cancer Research Online (http://cancerres.aacrjour-nals.org).
Requests for reprints: Daniel Birnbaum, Departement d’Oncologie Moleculaire,UMR599 INSERM, IFR137, 27 Boulevard Leı Roure, 13009 Marseille, France. Phone:33-4-91-75-84-07; Fax: 33-4-91-26-03-64; E-mail: [email protected].
©2004 American Association for Cancer Research.
8558
Cancer Research. on September 11, 2018. © 2004 American Association forcancerres.aacrjournals.org Downloaded from

the HercepTest kit (DakoCytomation, Glostrup, Denmark) scoring guidelines:0 to 1�, negative; 2 to 3�, positive). Our series of IBCs displayed charac-teristics similar to those in other series in the literature (1). Seventy-one percentof our patients had clinically palpable axillary lymph nodes. Most tumors wereductal carcinoma, with relatively frequent high Scarff-Bloom-Richardsongrade, negative hormone receptor status, and positive ERBB2 and P53 status.After diagnostic biopsy, IBC patients were treated by using a multimodalityapproach, including anthracycline-based chemotherapy followed by mastec-tomy (for clinically nonprogressive and consenting patients) then radiotherapy.Mastectomy specimens were examined to determine the pathological responseto chemotherapy. Analysis concerned several tissue sections (a minimum of 20per specimen) taken from each quadrant, from the nipple areolar complex, andfrom suspected areas of tumor involvement. Response was scored in fourgrades as described previously (18). Grades 1 and 2 were considered aspathological complete response-positive, and grades 3 and 4 as failures (path-ological complete response-negative). Axillary lymph nodes, when availablepostchemotherapy (for some patients, lymph node dissection was made atdiagnosis before any chemotherapy), were examined to determine the presenceor absence of tumor residue. Response was classified as failure in case of grade1 or 2 response with positive lymph node.
In addition, two RNA samples from normal breast (NB) tissue (Clontech,Palo Alto, CA), representing pools of six (NB1) or four (NB2) whole normalbreasts, were profiled, as well as RNA from 14 cell lines that provided modelsfor cell types of mammary tissues—IBC epithelial (SUM-149), NIBC luminalepithelial (BT-474, MCF-7, MDA-MB-134, SK-BR-3, T47D), NIBC stromal-like epithelial (MDA-MB-231, BT-549), and basal-like epithelial (HME-1)cell lines—and for cell types of nonmammary tissues—endothelial (humanumbilical vein endothelial-cell), fibroblastic (HFFB), lymphocytic B and T(Daudi and T-act, respectively) and macrophage (THP1) cell lines. All of thecell lines were obtained from American Type Culture Collection (Manassas,
VA),9 except for SUM-149 (a kind gift of S. P. Ethier, Department of Radi-ation Oncology, University of Michigan Comprehensive Cancer Center, AnnArbor, MI), and were grown as recommended by the supplier.
RNA Isolation. Total RNA was extracted from frozen samples by usingguanidium isothiocyanate and cesium chloride gradient, as described previ-ously (19). RNA integrity was controlled by denaturing formaldehyde agarosegel electrophoresis and by microanalysis (Agilent Bioanalyzer, Palo Alto, CA).
DNA Microarray Production and Hybridization. Gene expression anal-yses were done with home-made cDNA-spotted nylon microarrays and radio-active detection. Microarrays were produced as described previously (20).Briefly, cDNA clones were polymerase-chain-reaction–amplified in microtiterplates, then spotted onto Hybond-n � 2 � 7 cm2 membranes (Amersham) witha 64-pin print head on a MicroGrid II microarrayer (Apogent Discoveries,Cambridge, England). They contained 8,016 spotted cDNA clones, represent-ing 7,874 IMAGE clones and 142 control clones. The IMAGE clones included6,664 named genes (155 Unigene release), �2,500 selected specifically to berelated to oncogenesis, and 1,210 expressed sequence tags. All of the mem-branes belonged to the same printing batch. Before RNA hybridization, thequality of spotting, including the determination of target DNA amount acces-sible for each spot, was controlled by hybridization with a 33P-oligonucleotidesequence common to all polymerase chain reaction products. After stripping,microarrays were hybridized with 33P-probes made from total RNA (21, 22).To verify the reproducibility of the experiments, six samples (one cell line, twoIBCs, three NIBCs) were hybridized twice on different microarrays, resultingin a total of 103 hybridizations. Probe preparations, hybridizations, and washeswere done as described previously (20). Briefly, 2 �g of total RNA wereretrostranscribed (oligo-dT priming) in the presence of [�-33P]dCTP (Amer-sham Pharmacia Biotech, Little Chalfont, United Kingdom). Hybridizationswere carried out during 48 hours at 68°C in a volume of 500 �L of buffer.After washes, arrays were exposed for 24 to 72 hours to phosphorimagingplates. Signal detection was done with a FUJI BAS 5000 machine at 25-�mresolution (Raytest, Paris, France) and quantification with the ArrayGaugesoftware (Fuji Ltd, Tokyo, Japan). The full list of clones and more details onthe preparation of the microarrays and probes and hybridizations are availableon the web.10
Data Analysis. Before analysis, a filter procedure eliminated noninforma-tive genes; 2,300 genes were retained on the basis of being measured (expres-sion level �2 � background signal) in at least 50% of the samples in at leastone of the three classes (IBC, NIBC, NB). Signal intensities were normalizedfor the amount of spotted DNA (21), then the variability of experimentalconditions were normalized by using a local weighted scatter plot smootheranalysis (LOWESS) for each print-tip group (23). Data were then log2-transformed and were analyzed by unsupervised and supervised methods.Expression data and histoclinical variables of tumor samples, in a formatconforming to the MIAME guidelines11 are available on the WorldwideWeb.10 Unsupervised hierarchical clustering [Cluster program (24)] investi-gated the relationships between the genes and between the samples by usingdata that were median-centered on genes, Pearson correlation, and centroidlinkage clustering. Results were displayed by using the TreeView program(R.D.M. Page, University of Glasgow, Glasgow, United Kingdom) (24). Toidentify the gene clusters that were most responsible for the resulting subdi-vision of samples, we used the method of quality-threshold clustering (25). Wefirst selected the gene clusters with minimal size and minimal correlation of 10and 0.6, respectively. Their average expression profile was then computed andsubmitted to supervised analysis (see below), to identify the most discriminat-ing profile between the two predominant sample clusters. Supervised analysiswas applied to identify and rank genes that discriminate between two relevantsubgroups of samples. A discriminating score (DS) was calculated for eachgene (26) as DS � (M1 � M2)/(S1 � S2), where M1 and S1, respectively,represent mean and SD of expression levels of the gene in subgroup 1, and M2and S2 represent those levels in subgroup 2. Because of multiple hypothesestesting, confidence levels were estimated by 200 iterative random permutationsof samples as described previously (27) and by computing the proportion ofpermutations in which the number of genes selected exceeds the observednumber of genes. Once identified, the classification power of the discriminator
9 Internet address: http://www.atcc.org/.10 Internet address: http://tagc.univ-mrs.fr/pub/.11 Internet address: http://www.mged.org/miame.
Table 1 Tumor characteristics
Characteristics *Total
(N � 81)NIBC
(n � 44)IBC
(n � 37) P value †
Age, median (range), years 58 (24–86) 62 (39–86) 55 (24–81) 0.12
Pev status (81) �0.01Pev 0–1 53 (65%) 44 (100%) 9 (24%)Pev 2 14 (17.5%) 0 (0%) 14 (38%)Pev 3 14 (17.5%) 0 (0%) 14 (38%)
Clinical axillary node status (78) 0.07N0 31 (40%) 21 (48%) 10 (29%)N1, N2, N3 47 (60%) 23 (52%) 24 (71%)
Histological type (81) 0.19ductal 67 (83%) 34 (77%) 33 (89%)lobular 11 (14%) 7 (16%) 4 (11%)other 3 (3%) 3 (7%) 0 (0%)
SBR grade (81) 0.071–2 38 (47%) 25 (57%) 13 (35%)3 43 (53%) 19 (43%) 24 (65%)
Dermal lymphatic emboli (81) �0.01Present 26 (32%) 0 (0%) 26 (70%)Absent 55 (68%) 44 (100%) 11 (30%)
Angioinvasion (79) �0.01Present 42 (53%) 16 (36%) 26 (74%)Absent 37 (47%) 28 (64%) 9 (26%)
ER status (81) 0.36Negative 32 (39%) 15 (34%) 17 (46%)Positive 49 (61%) 29 (66%) 20 (54%)
PR status (81) 0.06Negative 30 (37%) 12 (27%) 18 (49%)Positive 51 (63%) 32 (73%) 19 (51%)
ERBB2 status (81) 0.79Negative 0–1� 61 (75%) 34 (77%) 27 (73%)Positive 2–3� 20 (25%) 10 (23%) 10 (27%)
P53 status (81) 0.35Negative 51 (63%) 29 (66%) 22 (59%)Positive 30 (37%) 15 (34%) 15 (41%)
Note. For all characteristics except age, the values are number of patients withpercentage of evaluated cases in parentheses.
Abbreviations: Pev 0–1, no inflammatory sign; Pev 2 and Pev 3, localized andextensive inflammatory signs, respectively; SBR, Scarff-Bloom-Richardson.
* In this column in parentheses, the number of evaluated cases among 81 patients.† Not significant when P � 0.05.
8559
DNA MICROARRAY AND INFLAMMATORY BREAST CANCER
Cancer Research. on September 11, 2018. © 2004 American Association forcancerres.aacrjournals.org Downloaded from

signature was illustrated by classifying samples according to the correlationcoefficient of their expression profile with the median profile of the IBCsamples (“IBC signature”) or of the pathological complete response–positiveIBC samples (“PCR signature”). The “IBC signature” was validated on anindependent sample set. A “leave-one-out” procedure (26) estimated the ac-curacy of prediction of the “PCR signature.” Statistical analyses were done byusing the SPSS software (version 10.0.5, SPSS Inc., Chicago, IL). Correlationsbetween sample groups and histoclinical parameters were calculated with theFisher exact test or �2 test when appropriate. A P value � 0.05 was consideredsignificant.
RESULTS
A total of 103 samples representing 97 different cases (81 cancertissue samples including 37 IBC and 44 NIBC, 2 NB samples, and 14cell lines) were profiled by using DNA microarrays.
Unsupervised Hierarchical Clustering Based on Global GeneExpression Profiles. Before clustering, a filter procedure eliminatedgenes with uniformly low expression or with low expression variationacross the experiments, retaining 2,300 genes/expressed sequencetags. Results of hierarchical clustering are shown in Fig. 1. The cancertissue samples displayed heterogeneous expression profiles (Fig. 1Aand B). Overall, they fell in two groups that significantly differed withrespect to the IBC or NIBC type. In the left group, which included thetwo NB samples, 25 of the 42 cancer samples (60%) were IBC,whereas in the right group, 14 of the 44 samples (31%) were IBC(P � 0.008, Fisher exact test). Correlations existed between the twogroups and the IHC status of tumors for ER (P � 0.001), ERBB2(P � 0.003), P53 (P � 0.001), and angioinvasion (P � 0.051). Asexpected, all of the cell lines represented separate branches of thedendrogram.
Gene clustering revealed groups of coordinately expressed genes.Some of these represented signatures of biological processes or celltypes (see colored bars on the right of Fig. 1A and zooms in Fig. 1C).A cluster with a prominent role in the classification of samplesincluded ESR1, which codes for ER-�, several transcription factorgenes (GATA3, XBP1, ILF1, GLI3, PBX1), and genes associated withER-positive status (KRT19, CCND1, EMS1, MUC1). This cluster,overexpressed in luminal ER-positive NIBC cell lines as comparedwith the basal-like cell line and the IBC cell line, was designated“luminal/ER� cluster.” Variation in expression of ESR1 mRNA cor-related well with IHC ER status. The “ERBB2-related cluster,” over-expressed in cell lines with amplification of ERBB2, included ERBB2,GRB7, and PPARBP, identified as part of an ERBB2 gene expressionsignature (28). As reported elsewhere (8, 10), the “early responsecluster” included immediate-early genes (JUNB, FOS, ATF3, EGR1,NR4A1, DUSP1) and was overexpressed in normal samples overall ascompared with cancer samples. A “proliferation cluster” was globallyoverexpressed in cell lines as compared with tissues. It includedPCNA, which codes for a proliferation marker used in clinical prac-tice, and genes involved in glycolysis (GAPD, LDHA, ENO1), me-tabolism (ALDH3A1, cytochrome c oxidase and ATP synthase sub-units), cell cycle and mitosis (tubulin genes, CDK4, BUB3, CCNB2),and protein synthesis (ribosomal proteins; not shown). The “immunecluster” was rich in genes expressed in B- or T-cells and macrophages(immunoglobulin genes, HLA class I and II, CD69, IL16, CD14,CSF1, CSF1R, and genes regulated by interferon such as STAT1,B2M, IFI27). It was globally negatively correlated with the “luminal/ER� cluster,” reflecting the strong lymphoid infiltrate of ER-negativetumors. The “stromal cluster” was rich in genes related to extracellularmatrix remodeling (collagen genes, MMP2, PRSS3, SPARC, EDN1)and strongly expressed in the fibroblastic cell line. The “vascularcluster,” strongly expressed in the human umbilical vein endothelial-cell cell line, contained genes related to endothelial cells (ENG, VWF,
CD31, CDH5, HSPG2, FN1). Another cluster, designated “basalcluster,” included cytokeratins (KRT5, 6, 7, 13, 14, 15, 16), integrins(ITGA2, ITGA6, ITGB4), and other genes (COL17A1, EGFR, laminin,TRIM29, CRYAB, SLPI) and was overexpressed in the basal-like cellline. This cluster was also overexpressed in the IBC cell line ascompared with the NIBC cell lines.
To identify objectively the gene clusters most responsible for thesubdivision of samples into two main groups (Fig. 1B), we appliedsupervised analysis to the 24 gene clusters identified by quality-threshold clustering analysis. Two subclusters from the “luminalcluster” were significantly overexpressed in the right group (rich inNIBC). Two subclusters from the “basal cluster,” one subcluster fromthe “immune cluster” and another from the “vascular cluster” weresignificantly overexpressed in the left group (rich in IBC). The twomost discriminating subclusters came from the “luminal” and the“basal cluster.”
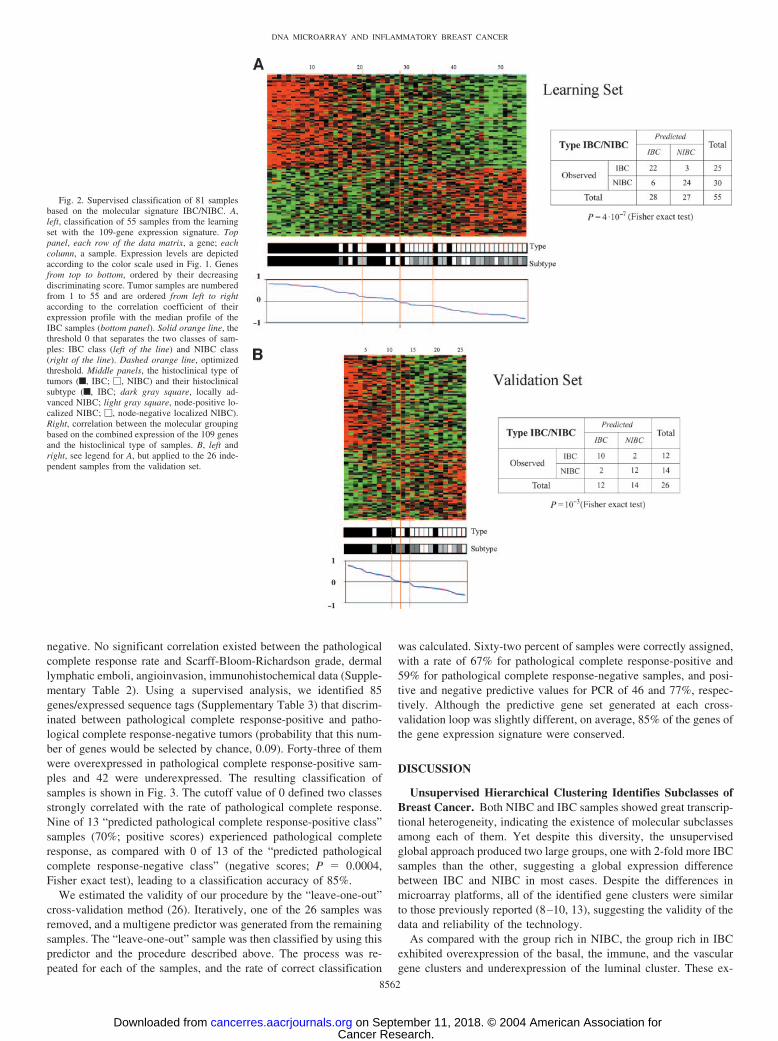
Gene Expression Signature for Inflammatory Breast CancerIdentified by Supervised Analyses. To identify a gene expressionsignature that discriminated IBC from NIBC samples, we appliedsupervised analysis by using two independent (learning and valida-tion) tumor sets. The assignment of samples to each set was random,but preserved the IBC/NIBC ratio. The learning set (55 samples: 25IBCs, 30 NIBCs) was used to define the gene expression signature.Using a discriminating score combined with permutation tests, weidentified 109 cDNA clones differentially expressed between IBCsand NIBCs. The significance threshold used produced fewer than fivefalse positives and ensured that the number of genes selected bychance, given 200 iterative random permutations, never exceeded 109.Sixty-four clones were overexpressed and 45 were underexpressed inIBC samples. They represented 90 characterized genes and 19 othersequences or expressed sequence tags (Supplementary Table 1).12 Theclassification of 55 samples based on these 109 genes is shown in Fig.2A. A threshold of 0 (solid line in Fig. 2A) sorted the samples into twoclasses (“predicted IBC class,” positive scores; “predicted NIBCclass,” negative scores) that strongly correlated with the observedhistoclinical type: 79% of the 28 “predicted IBC class” samples wereIBC, whereas 89% of the 27 “predicted NIBC class” samples wereNIBC [odds ratio (OR) � 26.78; 95% confidence interval (CI),5.59–187.9; P � 4.10�7, Fisher exact test]. A more stringent thresh-old improved the accuracy of discrimination: for example, with acutoff of 0.2 and �0.2 (dashed lines in Fig. 2A), 85% of the “pre-dicted IBC class” samples were IBC and 90% of the “predicted NIBCclass” samples were NIBC, leaving some samples unclassifiable.
To estimate its robustness, we tested this gene expression signatureon a set of 26 independent samples (12 IBC, 14 NIBC). None of thesesamples had been included in the learning set, which allowed for theestimation of the true predictive accuracy. Samples were classified byusing the same procedure (Fig. 2B). The two predicted classesstrongly correlated with the distinction between IBC and NIBC ratio.There were 10 IBCs (83%) of the 12 samples in the “predicted IBCclass” and 12 NIBCs (86%) of the 14 samples in the “predicted NIBCclass” (OR � 24.43; 95% CI , 2.71–414.2; P � 0.001, Fisher exacttest), with a prediction accuracy of 85%. The IBC cell line was withinthe “predicted IBC class.” These results suggest the robustness of ourmodel for discriminating IBCs and NIBCs.
Gene Expression Signature for Pathological Complete Re-sponse in Inflammatory Breast Cancer. Among the 37 IBC sam-ples, 26 mastectomy specimens were available for assessment ofpathological complete response: 9 were defined as pathological com-plete response-positive and 17 as pathological complete response-
12 Supplementary data for this article can be found at Cancer Research Online (http://cancerres.aacrjournals.org).
8560
DNA MICROARRAY AND INFLAMMATORY BREAST CANCER
Cancer Research. on September 11, 2018. © 2004 American Association forcancerres.aacrjournals.org Downloaded from

Fig. 1. Global gene expression profiles in inflammatory and noninflammatory breast cancer. A, hierarchical clustering of 103 samples and 2,300 cDNA clones based on mRNAexpression levels. Each row, a clone; each column, a sample. Color scale across the bottom, the expression level of each gene in a single sample relative to its median abundance acrossall samples; red, expression level above the median; green, expression level below the median; color saturation, the magnitude of deviation from the median; gray, missing data. Abovematrix, dendrogram of samples, overall similarities in gene expression profiles (zoomed in B). Colored bars to the right, the locations of eight gene clusters of interest. [These clusters,except the “proliferation cluster” (brown bar), are zoomed in C.] B, top, dendrogram of samples (from dendrogram in A): red branches, IBC samples (n � 39); blue branches, NIBCsamples (n � 47); brown branches, NB samples (n � 2); black branches, cell lines (n � 15); numbers below the dendrogram, tissue samples; five small gray horizontal bars, fivepairs of duplicate samples clustered together. Black and white chart below the numbers, some relevant features of numbered samples (
��, unavailable): Type (white, NIBC; black, IBC);
ER, ER immunohistochemical (IHC) status (white, negative; black, positive); ERBB2, ERBB2 IHC status (white, negative; black, positive); P53, P53 IHC status (white, negative; black,positive); Angioinvasion (white, negative; black, positive). C, expanded view of selected gene clusters. On right side, names of genes; some genes included in these clusters arereferenced by their Human Genome Organization (HUGO) abbreviation as used in “Entrez Gene” (http://www.ncbi.nih.gov/entrez). On left side, from top to bottom: light blue bar,early response; dark pink bar, basal; dark blue bar, ERBB2-related; green bar, luminal/ER�; light pink bar, immune; orange bar, vascular; gray bar, stromal.
8561
DNA MICROARRAY AND INFLAMMATORY BREAST CANCER
Cancer Research. on September 11, 2018. © 2004 American Association forcancerres.aacrjournals.org Downloaded from
negative. No significant correlation existed between the pathologicalcomplete response rate and Scarff-Bloom-Richardson grade, dermallymphatic emboli, angioinvasion, immunohistochemical data (Supple-mentary Table 2). Using a supervised analysis, we identified 85genes/expressed sequence tags (Supplementary Table 3) that discrim-inated between pathological complete response-positive and patho-logical complete response-negative tumors (probability that this num-ber of genes would be selected by chance, 0.09). Forty-three of themwere overexpressed in pathological complete response-positive sam-ples and 42 were underexpressed. The resulting classification ofsamples is shown in Fig. 3. The cutoff value of 0 defined two classesstrongly correlated with the rate of pathological complete response.Nine of 13 “predicted pathological complete response-positive class”samples (70%; positive scores) experienced pathological completeresponse, as compared with 0 of 13 of the “predicted pathologicalcomplete response-negative class” (negative scores; P � 0.0004,Fisher exact test), leading to a classification accuracy of 85%.
We estimated the validity of our procedure by the “leave-one-out”cross-validation method (26). Iteratively, one of the 26 samples wasremoved, and a multigene predictor was generated from the remainingsamples. The “leave-one-out” sample was then classified by using thispredictor and the procedure described above. The process was re-peated for each of the samples, and the rate of correct classification
was calculated. Sixty-two percent of samples were correctly assigned,with a rate of 67% for pathological complete response-positive and59% for pathological complete response-negative samples, and posi-tive and negative predictive values for PCR of 46 and 77%, respec-tively. Although the predictive gene set generated at each cross-validation loop was slightly different, on average, 85% of the genes ofthe gene expression signature were conserved.
DISCUSSION
Unsupervised Hierarchical Clustering Identifies Subclasses ofBreast Cancer. Both NIBC and IBC samples showed great transcrip-tional heterogeneity, indicating the existence of molecular subclassesamong each of them. Yet despite this diversity, the unsupervisedglobal approach produced two large groups, one with 2-fold more IBCsamples than the other, suggesting a global expression differencebetween IBC and NIBC in most cases. Despite the differences inmicroarray platforms, all of the identified gene clusters were similarto those previously reported (8–10, 13), suggesting the validity of thedata and reliability of the technology.
As compared with the group rich in NIBC, the group rich in IBCexhibited overexpression of the basal, the immune, and the vasculargene clusters and underexpression of the luminal cluster. These ex-
Fig. 2. Supervised classification of 81 samplesbased on the molecular signature IBC/NIBC. A,left, classification of 55 samples from the learningset with the 109-gene expression signature. Toppanel, each row of the data matrix, a gene; eachcolumn, a sample. Expression levels are depictedaccording to the color scale used in Fig. 1. Genesfrom top to bottom, ordered by their decreasingdiscriminating score. Tumor samples are numberedfrom 1 to 55 and are ordered from left to rightaccording to the correlation coefficient of theirexpression profile with the median profile of theIBC samples (bottom panel). Solid orange line, thethreshold 0 that separates the two classes of sam-ples: IBC class (left of the line) and NIBC class(right of the line). Dashed orange line, optimizedthreshold. Middle panels, the histoclinical type oftumors (f, IBC; �, NIBC) and their histoclinicalsubtype (f, IBC; dark gray square, locally ad-vanced NIBC; light gray square, node-positive lo-calized NIBC; �, node-negative localized NIBC).Right, correlation between the molecular groupingbased on the combined expression of the 109 genesand the histoclinical type of samples. B, left andright, see legend for A, but applied to the 26 inde-pendent samples from the validation set.
8562
DNA MICROARRAY AND INFLAMMATORY BREAST CANCER
Cancer Research. on September 11, 2018. © 2004 American Association forcancerres.aacrjournals.org Downloaded from

pression changes were in agreement with the phenotypical character-istics of IBC and NIBC, and suggest that IBC is related to the basallineage more frequently than is NIBC. In fact, none of the differentialexpressions revealed by this approach appeared completely specific toIBC or NIBC but, rather, reflected the luminal or basal-like pheno-types.
Identification of a Gene Expression Signature for Inflamma-tory Phenotype in Breast Cancer. By supervised analysis, we iden-tified a 109-gene signature that discriminated IBC and NIBC. Thisclassifier had comparable prediction accuracy (85%) in an independ-ent set of samples, providing evidence of its robustness. The molec-ular distinction was not strict for all samples, with a large range ofintermediate profiles between the respective “typical profiles” for IBCand NIBC. Among all these profiles, there was no particular organi-zation of samples with respect to clinically or pathologically definedIBC or according to the histoclinical form of NIBC (Fig. 2). Thecorrection for testing multiple hypotheses may have caused the elim-ination of potentially interesting genes. For example, ARHC (29) didnot pass our stringent threshold, although it was up-regulated in ourseries of IBC (P � 0.002 and 0.03 for the two corresponding clones,Mann–Whitney test without correction for multiple comparisons).Similarly, CTGF, which codes for a protein with 57% similarity toWISP3 (29), was also underexpressed (P � 0.004, Mann–Whitney testwithout correction), but not included in our signature.
This gene expression signature represents a bar code signature ofthe IBC phenotype. Whether the discriminator genes are causative oreven predictive of the phenotype in a biological sense or whether theyreflect another associated phenomenon remain to be explored. Severalgenes are related to signal transduction, cell motility, invasion, andangiogenesis. Genes overexpressed in IBC included ARHQ, a memberof the Rho GTPase family involved in cytoskeletal organization andcell motility (30); RAB1A, a small GTPase; tyrosine kinase SYK; andFNTA. FNTA encodes the farnesyltransferase � subunit; van Golen etal. (31) reported that treatment of the SUM149 cell line and HME-RhoC transfectants with a farnesyl transferase inhibitor reversed theRhoC-induced phenotype, with a significant decrease in motility andinvasion. The same authors suggested the involvement of the mitogen-activated protein kinase (MAPK) pathway in RhoC-induced motility,
invasion, and angiogenesis in IBC (32). Here, we identified genesencoding MAPK1 and STK24, a serine/threonine kinase that func-tions upstream of the MAPK cascade, as overexpressed in IBC.Overexpressed genes also included genes from the “basal cluster,”CDC37, involved in cell cycle regulation, and ITGB4, which promotescarcinoma invasion (33). Some of the proteins encoded by otheroverexpressed genes also stimulate cell motility: VASP plays a role inintegrin-mediated cell adhesion (34), and CACNB1 (calcium channel,voltage-dependent, � 1 subunit), AKAP1, and AKAP7 (A kinase(PRKA) anchor protein 1 and 7) are involved in calcium signaling(35). Other genes found overexpressed are involved in local inflam-matory processes (CXCL2, BMP4, SCGB1A1, FPRL1, VCAM1), cellcycle (CCNG2, CDC37, CCT2), apoptosis (DAD1, ALS2CR2), trans-port (CRABP1, SLC18A2, SLC22A4, SLC2A12), and transcription(ARNT, DTR, NPAS2, SIX3). ARNT encodes the � subunit of hypoxia-inducible factor 1 (HIF1), involved in angiogenesis and tumor pro-gression (36). Increased expression of several genes involved incarbohydrate metabolism (PDPK1, FUCA1, GAPD, RPN2) and pro-tein synthesis (RPL13A, RPS2, RPS6KA4, MBNL1) was associatedwith the IBC phenotype, possibly related to increased metabolism andcell proliferation in IBC. Genes found underexpressed in IBC, such asBRE (37), GPC4 (38), THBS4 (39), and PTPRA also encoded proteinsinvolved in negative regulation of cell motility, invasion, or angio-genesis. Finally, the analysis pointed to some interesting chromo-somal regions. Five genes down-regulated in IBC (NDUFS4, THBS4,BTF3, COX7C, RIOK2) were located at 5q11–14. This result, com-bined with the higher frequency of basal-like tumors among IBCs,may be related to a significantly higher rate of loss of heterozygosityat 5q in basal-like breast cancers (40). Two genes down-regulated inIBC (PSMB8, CSNK2B) are found on 6p21, which harbors loss ofheterozygosity more frequently in IBC than in NIBC (41). Con-versely, three genes up-regulated in IBC (CXCL2, CCNG2, MASA/E-1) were located at 4q21.1, in a 10-Mb-long region that containsmany genes encoding pro-inflammatory cytokines and growth factors.A 2-Mb-long region at 22q11.21 contains three genes (RTN4R,PIK4CA, MAPK1) up-regulated in IBC. These regions of co-up-regulated or -down-regulated genes may correspond to genome alter-ations specific to IBC.
Fig. 3. Supervised classification of 26 IBC sam-ples based on the molecular signature for the path-ological complete response (PCR). A, classificationof 26 samples by using the 85-gene expressionsignature. Top panel, expression levels accordingto the color scale used in Fig. 1. Genes are orderedfrom top to bottom by their decreasing discriminat-ing score. Tumor samples are numbered from 1 to26 and are ordered from left to right according tothe correlation coefficient of their expression pro-file with the median profile of the PCR� samples(bottom panel). Solid orange line (threshold � 0),separates the two classes of samples, “PCR� class”(at the left of the line) and “PCR� class” (right ofthe line). The middle panels indicate the patholog-ical response to primary chemotherapy (f, PCR�;�, PCR�). B, correlation between the moleculargrouping based on the combined expression of the85 genes and the pathologic response.
8563
DNA MICROARRAY AND INFLAMMATORY BREAST CANCER
Cancer Research. on September 11, 2018. © 2004 American Association forcancerres.aacrjournals.org Downloaded from
Identification of a Gene Expression Signature for PathologicalComplete Response in Inflammatory Breast Cancer. IBC ismostly treated with anthracycline-based primary chemotherapy. Re-sults are disappointing, with 5-year survival ranging from 30 to 50%(1). No clinical or molecular marker has been found that reliablypredicts pathological complete response to such chemotherapy (42,43). As a consequence, chemotherapy is delivered empirically to allpatients. Current efforts are, therefore, aimed at discovering molecularmarkers that would help clinicians to select an alternative chemother-apy or another systemic treatment that would improve response rate.
In our series, pathological complete response after anthracycline-based chemotherapy was observed in 35% of mastectomy specimens.No correlation was found between response and any tested histoclini-cal condition. Global unsupervised hierarchical clustering showed noseparation between pathological complete response-positive and path-ological complete response-negative samples, which suggests that theresponse to chemotherapy is governed by a smaller set of genes.Supervised analysis identified a set of 85 genes the expression ofwhich divided patients in two groups with, respectively, 70% and 0%of pathological complete response. Because of the small number ofcases, estimation of the classifier performance was not done in anindependent series, but by the use of leave-one-out cross-validation, aclassical alternative method. Because this method may overestimateaccuracy, it will be necessary to validate this signature with a largerindependent sample series. Regardless of the small sample size, therespective positive and negative predictive values for pathologicalcomplete response of �50 and �80% are highly encouraging in thecurrent clinical context, in which the expectation of any unselectedIBC patient to achieve pathological complete response is less than 15to 25% (1). This classifier is a first step in achieving a criterion onwhich to negatively or positively select for the most efficient therapyfor patients.
Additional experiments are required to investigate the role of someof the discriminator genes in response to therapy. It was interesting tofind genes already reported as associated with drug sensitivity. Forexample, a high expression of CDKN1B (p27) was associated withpathological complete response, as previously reported in acute my-eloid leukemia (44). Two recent reports identified gene expressionsignature associated with response to primary chemotherapy in locallyadvanced breast cancer (15, 16). Comparison of the discriminatorgenes with ours revealed several genes (AK3, ATP6V1F, EIF3S9,MRPL4, APOD, PPP5C) that belong to the same families. CCL3encoding the MIP1A chemokine is overexpressed in sensitive B-cellchronic lymphocytic leukemia cell samples (45). The up-regulation inpathological complete response-positive samples of genes encodingother chemokines, cytokines, and cytokine receptors (CSF1R, CCL2,CCL3, MMP9) is consistent with a role of the host immune system intumor eradication after chemotherapy.
Our study is the first example of high-throughput gene profilingapplied to clinical specimens of IBC. Although obtained on a smallseries of samples (IBC is a rare disease), our results are encouraging.They show the potential for a better understanding of this particularand aggressive form of breast cancer and for the identification of newdiagnostic and predictive factors and potential therapeutic targets.Further validation on a larger and multicentric series of samples iswarranted, as well as additional investigations of our discriminatorgenes to determine their relevance in the aggressiveness of IBC andpossible therapeutic utility.
ACKNOWLEDGMENTS
We thank L. Bachelart and S. Jeangirard for assistance at the beginning ofthis work.
REFERENCES
1. Jaiyesimi IA, Buzdar AU, Hortobagyi G. Inflammatory breast cancer: a review. J ClinOncol 1992;10:1014–24.
2. Buzdar AU, Singletary SE, Booser DJ, et al. Combined modality treatment of stageIII and inflammatory breast cancer. M. D. Anderson Cancer Center experience. SurgOncol Clin N Am 1995;4:715–34.
3. Feldman LD, Hortobagyi GN, Buzdar AU, Ames FC, Blumenschein GR. Patholog-ical assessment of response to induction chemotherapy in breast cancer. Cancer Res1986;46:2578–81.
4. Cristofanilli M, Buzdar AU, Hortobagyi GN. Update on the management of inflam-matory breast cancer. Oncologist 2003;8:141–8.
5. Kleer CG, van Golen KL, Merajver SD. Molecular biology of breast cancer metas-tasis. Inflammatory breast cancer: clinical syndrome and molecular determinants.Breast Cancer Res 2000;2:423–9.
6. Bertucci F, Houlgatte R, Nguyen C, et al. Gene expression profiling of cancer by useof DNA arrays: how far from the clinic? Lancet Oncol 2001;2:674–82.
7. Polyak K, Riggins GJ. Gene discovery using the serial analysis of gene expressiontechnique: implications for cancer research. J Clin Oncol 2001;19:2948–58.
8. Perou CM, Sorlie T, Eisen MB, et al. Molecular portraits of human breast tumours.Nature (Lond) 2000;406:747–52.
9. Sorlie T, Tibshirani R, Parker J, et al. Repeated observation of breast tumor subtypesin independent gene expression data sets. Proc Natl Acad Sci USA 2003;100:8418–23.
10. Bertucci F, Nasser V, Granjeaud S, et al. Gene expression profiles of poor-prognosisprimary breast cancer correlate with survival. Hum Mol Genet 2002;11:863–72.
11. van ’t Veer LJ, Dai H, van De Vijver MJ, et al. Gene expression profiling predictsclinical outcome of breast cancer. Nature (Lond) 2002;415:530–6.
12. van de Vijver MJ, He YD, van’t Veer LJ et al. A gene-expression signature as apredictor of survival in breast cancer. N Engl J Med 2002;347:1999–2009.
13. Sotiriou C, Neo SY, McShane LM, et al. Breast cancer classification and prognosisbased on gene expression profiles from a population-based study. Proc Natl Acad SciUSA 2003;100:10393–8.
14. Huang E, Cheng SH, Dressman H, et al. Gene expression predictors of breast canceroutcomes. Lancet 2003;361:1590–6.
15. Chang JC, Wooten EC, Tsimelzon A, et al. Gene expression profiling for theprediction of therapeutic response to docetaxel in patients with breast cancer. Lancet2003;362:362–9.
16. Ayers M, Symmans WF, Stec J, et al. Gene expression profiles predict completepathologic response to neoadjuvant paclitaxel and fluorouracil, doxorubicin, andcyclophosphamide chemotherapy in breast cancer. J Clin Oncol 2004;22:2284–93.
17. Wu M, Wu ZF, Kumar-Sinha C, Chinnaiyan A, Merajver SD. RhoC induces differ-ential expression of genes involved in invasion and metastasis in MCF10A breastcells. Breast Cancer Res Treat 2004;84:3–12.
18. Chevallier B, Chollet P, Merrouche Y, et al. Lenograstim prevents morbidity fromintensive induction chemotherapy in the treatment of inflammatory breast cancer.J Clin Oncol 1995;13:1564–71.
19. Theillet C, Adelaide J, Louason G, et al. FGFRI and PLAT genes and DNAamplification at 8p12 in breast and ovarian cancers. Genes Chromosomes Cancer1993;7:219–26.
20. Bertucci F, Salas S, Eysteries S, et al. Gene expression profiling of colon cancer byDNA microarrays and correlation with histoclinical parameters. Oncogene 2004;23:1377–91.
21. Bertucci F, Van Hulst S, Bernard K, et al. Expression scanning of an array of growthcontrol genes in human tumor cell lines. Oncogene 1999;18:3905–12.
22. Bertucci F, Bernard K, Loriod B, et al. Sensitivity issues in DNA array-basedexpression measurements and performance of nylon microarrays for small samples.Hum Mol Genet 1999;8:1715–22.
23. Yang YH, Dudoit S, Luu P, et al. Normalization for cDNA microarray data: a robustcomposite method addressing single and multiple slide systematic variation. NucleicAcids Res 2002;30:e15.
24. Eisen MB, Spellman PT, Brown PO, Botstein D. Cluster analysis and display ofgenome-wide expression patterns. Proc Natl Acad Sci USA 1998;95:14863–8.
25. Wang Y, Jatkoe T, Zhang Y, et al. Gene expression profiles and molecular markersto predict recurrence of Dukes’ B colon cancer. J Clin Oncol 2004;22:1564–71.
26. Golub TR, Slonim DK, Tamayo P, et al. Molecular classification of cancer: classdiscovery and class prediction by gene expression monitoring. Science (Wash DC)1999;286:531–7.
27. Magrangeas F, Nasser V, Avet-Loiseau H, et al. Gene expression profiling of multiplemyeloma reveals molecular portraits in relation to the pathogenesis of the disease.Blood 2003;101:4988–5006.
28. Bertucci F, Borie N, Ginestier C, et al. Identification and validation of an ERBB2gene expression signature in breast cancers. Oncogene 2004;23:2564–75.
29. van Golen KL, Davies S, Wu ZF, et al. A novel putative low-affinity insulin-likegrowth factor-binding protein, LIBC (lost in inflammatory breast cancer), and RhoCGTPase correlate with the inflammatory breast cancer phenotype. Clin Cancer Res1999;5:2511–9.
30. Hall A. Rho GTPases and the actin cytoskeleton. Science (Wash DC) 1998;279:509–14.
31. van Golen KL, Bao L, DiVito MM, et al. Reversion of RhoC GTPase-inducedinflammatory breast cancer phenotype by treatment with a farnesyl transferase inhib-itor. Mol Cancer Ther 2002;1:575–83.
32. van Golen KL, Bao LW, Pan Q, et al. Mitogen activated protein kinase pathway isinvolved in RhoC GTPase induced motility, invasion and angiogenesis in inflamma-tory breast cancer. Clin Exp Metastasis 2002;19:301–11.
8564
DNA MICROARRAY AND INFLAMMATORY BREAST CANCER
Cancer Research. on September 11, 2018. © 2004 American Association forcancerres.aacrjournals.org Downloaded from

33. Shaw LM, Rabinovitz I, Wang HH, Toker A, Mercurio AM. Activation of phosphoi-nositide 3-OH kinase by the alpha6beta4 integrin promotes carcinoma invasion. Cell1997;91:949–60.
34. Samarin S, Romero S, Kocks C, et al. How VASP enhances actin-based motility.J Cell Biol 2003;163:131–42.
35. Huang JB, Kindzelskii AL, Clark AJ, Petty HR. Identification of channels promotingcalcium spikes and waves in HT1080 tumor cells: their apparent roles in cell motilityand invasion. Cancer Res 2004;64:2482–9.
36. Tacchini L, Matteucci E, De Ponti C, Desiderio MA. Hepatocyte growth factorsignaling regulates transactivation of genes belonging to the plasminogen activationsystem via hypoxia inducible factor-1. Exp Cell Res 2003;290:391–401.
37. Bharti AC, Aggarwal BB. Nuclear factor-kappa B and cancer: its role in preventionand therapy. Biochem Pharmacol 2002;64:883–8.
38. Sanderson RD. Heparan sulfate proteoglycans in invasion and metastasis. Semin CellDev Biol 2001;12:89–98.
39. de Fraipont F, Nicholson AC, Feige JJ, Van Meir EG. Thrombospondins and tumorangiogenesis. Trends Mol Med 2001;7:401–7.
40. Wang ZC, Lin M, Wei LJ, et al. Loss of heterozygosity and its correlation with expressionprofiles in subclasses of invasive breast cancers. Cancer Res 2004;64:64–71.
41. Lerebours F, Bertheau P, Bieche I, et al. Evidence of chromosome regions and geneinvolvement in inflammatory breast cancer. Int J Cancer 2002;102:618–22.
42. Vincent-Salomon A, Carton M, Freneaux P, et al. ERBB2 overexpression inbreast carcinomas: no positive correlation with complete pathological response topreoperative high-dose anthracycline-based chemotherapy. Eur J Cancer 2000;36:586 –91.
43. Viens P, Penault-Llorca F, Jacquemier J, et al. High-dose chemotherapy and haema-topoietic stem cell transplantation for inflammatory breast cancer: pathologic re-sponse and outcome. Bone Marrow Transplant 1998;21:249–54.
44. Radosevic N, Delmer A, Tang R, Marie JP, Ajchenbaum-Cymbalista F. Cell cycleregulatory protein expression in fresh acute myeloid leukemia cells and after drugexposure. Leukemia (Baltimore) 2001;15:559–66.
45. Vallat L, Magdelenat H, Merle-Beral H, et al. The resistance of B-CLL cells toDNA damage-induced apoptosis defined by DNA microarrays. Blood 2003;101:4598 – 606.
8565
DNA MICROARRAY AND INFLAMMATORY BREAST CANCER
Cancer Research. on September 11, 2018. © 2004 American Association forcancerres.aacrjournals.org Downloaded from

2004;64:8558-8565. Cancer Res François Bertucci, Pascal Finetti, Jacques Rougemont, et al. ChemotherapyInflammatory Breast Cancer and Prediction of Response to Gene Expression Profiling for Molecular Characterization of
Updated version
http://cancerres.aacrjournals.org/content/64/23/8558
Access the most recent version of this article at:
Material
Supplementary
http://cancerres.aacrjournals.org/content/suppl/2004/12/01/64.23.8558.DC1
Access the most recent supplemental material at:
Cited articles
http://cancerres.aacrjournals.org/content/64/23/8558.full#ref-list-1
This article cites 44 articles, 18 of which you can access for free at:
Citing articles
http://cancerres.aacrjournals.org/content/64/23/8558.full#related-urls
This article has been cited by 14 HighWire-hosted articles. Access the articles at:
E-mail alerts related to this article or journal.Sign up to receive free email-alerts
SubscriptionsReprints and
To order reprints of this article or to subscribe to the journal, contact the AACR Publications
Permissions
Rightslink site. (CCC)Click on "Request Permissions" which will take you to the Copyright Clearance Center's
.http://cancerres.aacrjournals.org/content/64/23/8558To request permission to re-use all or part of this article, use this link
Cancer Research. on September 11, 2018. © 2004 American Association forcancerres.aacrjournals.org Downloaded from