gene flow between island populations of the malaria
TRANSCRIPT

Evolutionary Applications. 2021;00:1–14. | 1wileyonlinelibrary.com/journal/eva
Received: 26 March 2021 | Revised: 23 June 2021 | Accepted: 13 July 2021
DOI: 10.1111/eva.13288
O R I G I N A L A R T I C L E
Gene flow between island populations of the malaria mosquito, Anopheles hinesorum, may have contributed to the spread of divergent host preference phenotypes
Luke Ambrose1 | Daniel Ortiz- Barrientos1 | Robert D. Cooper2 | Neil F. Lobo3 | Thomas R. Burkot4 | Tanya L. Russell4 | Nigel W. Beebe1,5
This is an open access article under the terms of the Creat ive Commo ns Attri bution License, which permits use, distribution and reproduction in any medium, provided the original work is properly cited.© 2021 The Authors. Evolutionary Applications published by John Wiley & Sons Ltd.
1School of Biological Sciences, University of Queensland, Brisbane, Qld, Australia2Australian Defence Force, Malaria and Infectious Disease Institute, Brisbane, Qld, Australia3University of Notre Dame, Notre Dame, Indiana, USA4James Cook University, Cairns, Qld, Australia5CSIRO, Brisbane, Qld, Australia
CorrespondenceLuke Ambrose, School of Biological Sciences, University of Queensland, St. Lucia, Brisbane, Qld 4072, Australia.Email: [email protected]
Funding informationNational Institutes of Health International Center of Excellence in Malaria Research, Grant/Award Number: U19AI089686- 03; National Health and Medical Research Council, Grant/Award Number: 117102; Hermon Slade Foundation, Grant/Award Number: 2014000818
AbstractAnopheles hinesorum is a mosquito species with variable host preference. Throughout New Guinea and northern Australia, An. hinesorum feeds on humans (it is opportun-istically anthropophagic) while in the south- west Pacific's Solomon Archipelago, the species is abundant but has rarely been found biting humans (it is exclusively zoo-phagic in most populations). There are at least two divergent zoophagic (nonhuman biting) mitochondrial lineages of An. hinesorum in the Solomon Archipelago represent-ing two independent dispersals. Since zoophagy is a derived (nonancestral) trait in this species, this leads to the question: has zoophagy evolved independently in these two populations? Or conversely: has nuclear gene flow or connectivity resulted in the transfer of zoophagy? Although we cannot conclusively answer this, we find close nuclear relationships between Solomon Archipelago populations indicating that re-cent nuclear gene flow has occurred between zoophagic populations from the diver-gent mitochondrial lineages. Recent work on isolated islands of the Western Province (Solomon Archipelago) has also revealed an anomalous, anthropophagic island pop-ulation of An. hinesorum. We find a common shared mitochondrial haplotype be-tween this Solomon Island population and another anthropophagic population from New Guinea. This finding suggests that there has been recent migration from New Guinea into the only known anthropophagic population from the Solomon Islands. Although currently localized to a few islands in the Western Province of the Solomon Archipelago, if anthropophagy presents a selective advantage, we may see An. hine-sorum emerge as a new malaria vector in a region that is now working on malaria elimination.
K E Y W O R D Sgene flow, host preference evolution, island colonization, malaria, population genetics- empirical

2 | AMBROSE Et Al.
1 | INTRODUC TION
Host preference is a behaviour that varies between mosquito spe-cies and populations (Besansky et al., 2004; Takken, 1991; Takken & Verhulst, 2013) and is important in the epidemiology (Ritchie, 2014) of mosquito- borne diseases (Clements, 2011; Hess et al., 1968; Lyimo & Ferguson, 2009; Zwiebel & Takken, 2004). Although many mosquito species are generalists (Takken & Verhulst, 2013; Tempelis, 1975) with a hierarchical preference for hosts (Hess et al., 1968), some mosquito species have a very strong preference for specific host types (Tempelis, 1975). Mosquito species with a strong pref-erence for human hosts are the most efficient at spreading human disease. For example, Anopheles gambiae s.s. (the main vector of sub- Saharan malaria in Africa (Sinka et al., 2010)) and Aedes aegypti (the main vector of dengue (Ritchie, 2014)) are preferentially anthro-pophagic (Costantini et al., 1999; McBride et al., 2014; Zwiebel & Takken, 2004). This means that they are more likely to take consec-utive blood meals from humans than from different host species, increasing the survival and transmission of the pathogens that they transmit (Ritchie, 2014; White, 1974). Both An. gambiae s.s. and Ae. aegypti have evolved from generalists into human- feeding spe-cialists (Costantini et al., 1999; McBride, 2016), making them excel-lent models for studying the evolution of human host preference in mosquitoes (Brown et al., 2011; Carey & Carlson, 2011; Harrington et al., 2001; McBride et al., 2014).
In this study, we develop basic population genetic knowledge in a malaria- transmitting species— Anopheles hinesorum— previously An. farauti 2, belonging to the Anopheles farauti complex. Although phylogeographic, behavioural and ecological studies have been per-formed on many members of this species complex (Ambrose et al., 2012; Beebe et al., 2000, 2015; Cooper et al., 2002; Van Den Hurk et al., 2000), it is as yet unstudied in terms of the basis of anthro-pophagy. The An. farauti complex is a particularly useful study sys-tem for elucidating the molecular basis of human host preference in mosquitoes due to differences in its host preference in geographi-cally isolated populations and species (Beebe et al., 2015). Anopheles hinesorum is possibly the most useful species in the complex for studying the anthropophagy due to intraspecific differences in host preference.
Anopheles hinesorum has a wide distribution through much of the south- west Pacific (Australia, New Guinea and the Solomon Archipelago) being found in coastal and inland habitats up to of over 1000 m above sea level (Beebe & Cooper, 2002; Beebe et al., 2015). Throughout most of its range, An. hinesorum is a host generalist, being opportunistically anthropophagic (Cooper et al., 2009; Keven et al., 2017; Laurent et al., 2017; Sweeney et al., 1990). However, most populations from the Solomon Archipelago do not bite humans (they are exclusively zoophagic; Beebe et al., 2000; Cooper & Frances, 2002; Foley et al., 1994). This is a well- established phenotypic dif-ference, and recent fieldwork (2015 and 2018) in Guadalcanal in Solomon Islands has further verified this finding where no An. hine-sorum were collected in human landing catches (HLCs). These HLCs were performed near (within 50 m of) productive larval sites, no one
has yet been able to collect blood fed adults from these populations, and their hosts remain unknown. A previous study also showed that exclusive zoophagy in An. hinesorum is a derived trait, finding two distinct zoophagic mitochondrial (mtDNA) lineages (Ambrose et al., 2012).
Ambrose et al. (2012) hypothesized that the evolution of exclu-sive zoophagy in these lineages may have occurred independently by convergent evolution. They found that the two lineages likely rep-resent two separate dispersal events colonizing the Archipelago at different times in the past with the northern lineage representing an older dispersal event and the southern lineage representing a more recent dispersal event. In contrast to the hypothesis of convergent evolution of zoophagy, it is also possible that the initial (older) col-onizing lineage had already adapted to feeding on local island hosts and that zoophagy was transferred from this preadapted population to the secondary (younger) colonizers via gene flow. Another possi-ble scenario is that An. hinesorum colonized all islands in the Solomon Archipelago shortly after arriving there and that the secondary dis-persal event to the southern islands resulted in the introduction and spread (via selective sweep) of a new mitochondrial lineage. Finally, it is possible that the initial population on the islands (presumably colonists from New Guinea or Australia) evolved or already exhib-ited zoophagy and contained multiple mitochondrial lineages which subsequently became dominant in the north and the south of the Archipelago.
As mentioned above, most populations of An. hinesorum in the Solomon Archipelago are exclusively zoophagic, including popula-tions from Bougainville and Guadalcanal (Cooper & Frances, 2002; Foley et al., 1994). However, a recent study revealed anthropoph-agy in the Western Province Solomon Islands, where adult female An. hinesorum were collected landing (i.e. attempting to feed) on hu-mans (Burkot et al., 2018). A few samples of the species have been collected on one other occasion in human landing catches on Santa Isabel, another island of the Solomon Archipelago, where it is very common in larval collections (Bugoro et al., 2011). Taken together, these studies show that there are behavioural differences in host preference between populations of this species within the Solomon Archipelago. The recently discovered anthropophagic population may have emerged as the result of the re- evolution of anthropoph-agy from a zoophagic population. Alternatively, it may have been spread via gene flow from anthropophagic population(s) in Australia or New Guinea.
In this study, our first aim is to complement and build on pre-viously published work with new nuclear microsatellite and mito-chondrial data to better understand the population structure of An. hinesorum. This will lay the groundwork for its development as a novel model system for studying human host preference in mos-quitoes. Our second aim is to use nuclear data to assess whether gene flow may have contributed to the spread of zoophagy between northern and southern island populations. Our third aim is to eval-uate whether there is any evidence of gene flow from mainland Australia or New Guinea into the newly discovered anthropophagic An. hinesorum population in the Archipelago. To achieve these aims,

| 3AMBROSE Et Al.
we build on mitochondrial data (n = 233) published in Ambrose et al. (2012) to include additional Solomon Archipelago populations (n = 61). We develop 14 novel microsatellite primers for the species and generate microsatellite data from throughout the species range (n = 456). We include mitochondrial and nuclear microsatellite data from samples collected in human landing catches by Burkot et al. (2018), from the anthropophagic Western Province Solomon Islands population.
2 | METHODS
2.1 | Sampling and species identification
Specimens for this study were collected as both larvae and adults, with some samples collected in human landing catches (Table 1 and Figure 1). Genomic DNA was isolated, and samples were verified as being An. hinesorum using a well- established PCR diagnostic method (Beebe & Saul, 1995).
2.2 | Mitochondrial sequencing and analysis
We sequenced, edited and aligned a 527 base- pair sequence of the mitochondrial cytochrome oxidase 1 gene (mtDNA COI) for 60 in-dividuals in this study. We aligned this with previously published homologous sequence data (n = 206; Ambrose et al., 2012) for further analysis. The new data include 27 individuals from Santa Isabel Island (including eight adult females caught in human landing catches in a previous study; Bugoro et al., 2011), 26 samples from the Western Province of the Solomon Islands (see Table 1), five indi-viduals (larvae) from the Nggela Islands and two additional individu-als (larvae) from Bougainville Island. Of the 26 individuals collected from Solomon Islands Western Province, 16 were adult females (col-lected biting humans) and 10 were collected as larvae. We generated data for this study using the same primers and methods outlined in Ambrose et al. (2012) and then edited and realigned them to the pre- existing COI alignment in the program Geneious v.8 (Kearse et al., 2012). To assess relationships between populations, we generated a median joining mitochondrial haplotype network using the program PopART (Bandelt et al., 1999).
2.3 | Microsatellite development and scoring
We developed 14 novel microsatellite markers using the same methods described in Ambrose et al. (2014). We called fragment sizes manually using the program, GeneMarker v.2.2 (Hulce et al., 2011) and removed individuals missing data from six or more loci from the data set prior to analysis, leaving 456 individuals in the final data set. We initially defined populations based on genetically distinct groups identified by Ambrose et al. (2012), and we treated separate islands in the Solomon Archipelago as populations. We then checked for the presence of null
alleles using MicroChecker v2.2.3 (Van Oosterhout et al., 2004) and for Hardy– Weinberg equilibrium (HWE) in the R package PopGenReport (Adamack & Gruber, 2014). For primer- and locus- specific information, including information on null alleles and HWE, see Table S1.
2.4 | Microsatellite population structure
We performed a variety of analyses to assess population structure of An. hinesorum throughout its range based on nuclear microsatel-lite data. These include Bayesian analyses (STRUCTURE), multivari-ate analyses, estimation of fixation indices, a neighbour- joining tree based on pairwise G′ST and AMOVA. Initially, we assessed popula-tion structure using the Bayesian clustering program STRUCTURE v. 2.3.4 (Pritchard et al., 2000). We ran STRUCTURE through the program STRUCTURE_threader (Pina- Martins et al., 2017) for 20 it-erations of K = 2 to K = 15, using the admixture model and location priors (100,000 generation burn- in, 500,000 generation sampling). Sites where mosquitoes were sampled were used to define loca-tion priors for populations from Australia and New Guinea. In the Solomon Archipelago, we used the islands that individuals were sam-pled from as location priors. We ran STRUCTURE output through the CLUMPAK server (Kopelman et al., 2015), with default CLUMPP (Jakobsson & Rosenberg, 2007) and DISTRUCT (Rosenberg, 2004) settings, including the LargeKGreedy algorithm (in CLUMPP), with a random order of input and 2000 repeats. We determined the most strongly defined population structure in the data using CLUMPAK which implements the Evanno delta K method (Evanno et al., 2005) as well the most probable K based on the ‘Estimated Ln Prob of Data’ (Kopelman et al., 2015). As has been found previously, the Evanno method underestimated the optimal value of K (Janes et al., 2017). We therefore present the major mode for STRUCTURE plots for both K = 2 (predicted by the Evanno method) and K = 10 (predicted by the ‘Estimated Ln Prob of Data’). Additional STRUCTURE plots for all K values run can be found in Data S1.
We also used three multivariate clustering methods— principal components analysis (PCA), discriminant analysis of principal compo-nents (DAPC; Jombart et al., 2010) and t- distributed stochastic neigh-bour embedding (t- SNE; Van Der Maaten & Hinton, 2008)— to assess population structure. T- distributed Stochastic Neighbour Embedding is a multivariate method based on machine learning that is used to visualise multidimensional data in two or three dimensions. It is similar in concept to principal component analysis in that it arranges points (representing individuals) in space such that highly similar points are located close together (clustered) while dissimilar points are dispersed (Van Der Maaten & Hinton, 2008). An advantage of these multivari-ate approaches is that they are free of population genetic assump-tions; for example, there is no assumption that populations are in HWE. We performed both PCA and DAPC analyses in the adegenet package (Jombart, 2008) and the t- SNE analysis in the Rtsne package (Krijthe, 2015) in R version 3.3.0 (R Core Team, 2013), run through RStudio version 1.0.136 (Rstudio Team, 2020). For these analyses, we replaced missing data with mean values for the overall data.
4 | AMBROSE Et Al.
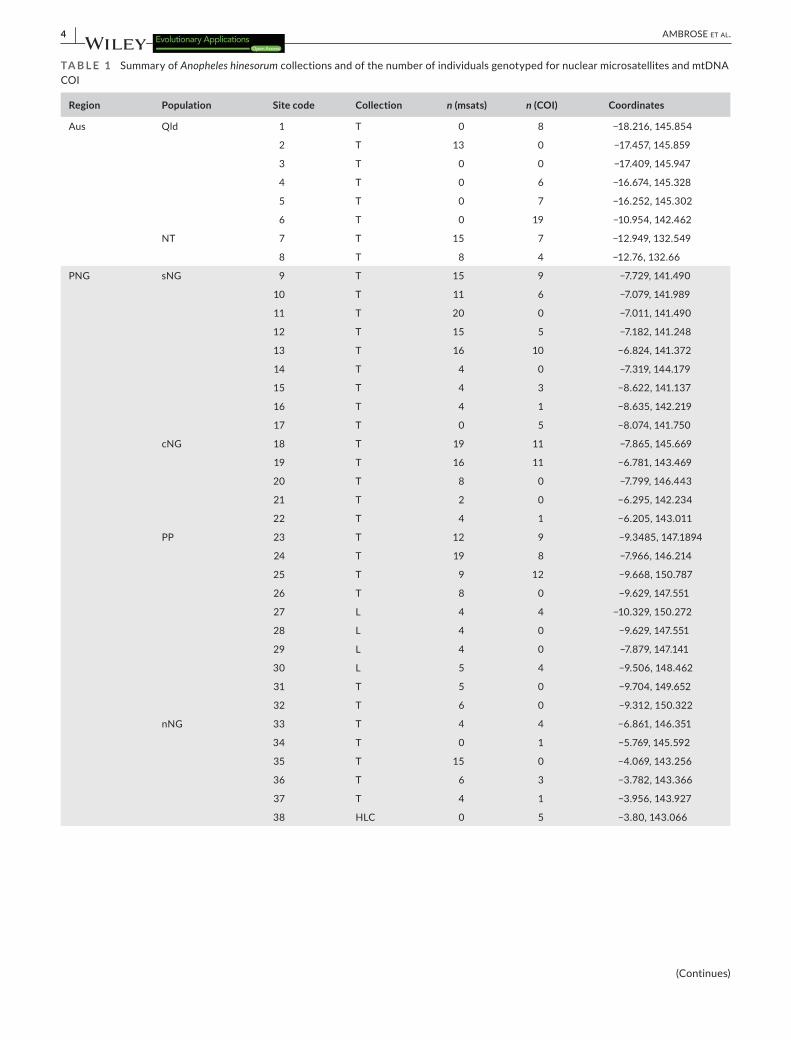
TA B L E 1 Summary of Anopheles hinesorum collections and of the number of individuals genotyped for nuclear microsatellites and mtDNA COI
Region Population Site code Collection n (msats) n (COI) Coordinates
Aus Qld 1 T 0 8 −18.216, 145.854
2 T 13 0 −17.457, 145.859
3 T 0 0 −17.409, 145.947
4 T 0 6 −16.674, 145.328
5 T 0 7 −16.252, 145.302
6 T 0 19 −10.954, 142.462
NT 7 T 15 7 −12.949, 132.549
8 T 8 4 −12.76, 132.66
PNG sNG 9 T 15 9 −7.729, 141.490
10 T 11 6 −7.079, 141.989
11 T 20 0 −7.011, 141.490
12 T 15 5 −7.182, 141.248
13 T 16 10 −6.824, 141.372
14 T 4 0 −7.319, 144.179
15 T 4 3 −8.622, 141.137
16 T 4 1 −8.635, 142.219
17 T 0 5 −8.074, 141.750
cNG 18 T 19 11 −7.865, 145.669
19 T 16 11 −6.781, 143.469
20 T 8 0 −7.799, 146.443
21 T 2 0 −6.295, 142.234
22 T 4 1 −6.205, 143.011
PP 23 T 12 9 −9.3485, 147.1894
24 T 19 8 −7.966, 146.214
25 T 9 12 −9.668, 150.787
26 T 8 0 −9.629, 147.551
27 L 4 4 −10.329, 150.272
28 L 4 0 −9.629, 147.551
29 L 4 0 −7.879, 147.141
30 L 5 4 −9.506, 148.462
31 T 5 0 −9.704, 149.652
32 T 6 0 −9.312, 150.322
nNG 33 T 4 4 −6.861, 146.351
34 T 0 1 −5.769, 145.592
35 T 15 0 −4.069, 143.256
36 T 6 3 −3.782, 143.366
37 T 4 1 −3.956, 143.927
38 HLC 0 5 −3.80, 143.066
(Continues)
| 5AMBROSE Et Al.
We initially defined populations (as requested by DAPC) based on results by Ambrose et al. (2012) as well as results from initial STRUCTURE analyses. For DAPC analyses, we used the cross- validation xvalDAPC command with 1000 replicates to determine the optimal number of principle components (PCs) to retain for each anal-ysis. For the full data set, we retained 80 PCs and ten discriminant axes (DAs), and for the Solomon Archipelago data alone (n = 177), we retained 30 PCs and 4 DAs. We present two types of plots that were generated from the DAPC: a composition plot (a bar plot— similar to a STRUCTURE plot) and pairwise plots of the first two discriminant axes.
We used the program GenAlEx v.6.5 (Peakall & Smouse, 2006) to estimate pairwise fixation indices, GST, G′ST and Jost's D, between the populations identified by STRUCTURE and multivariate meth-ods. We plotted results for one of these indices (G′ST) in tabular form, as well as building a neighbour- joining tree based on pairwise G′ST using the R package ape (Paradis & Schliep, 2019). Finally, we performed an AMOVA (Excoffier et al., 1992) to partition variance explained by different hierarchical strata in the data. To achieve this, we used the poppr.amova function implemented in the R package poppr (Kamvar et al., 2014). Prior to running the AMOVA, we defined strata within our data by region (Australia, New Guinea, Solomon Archipelago) as well as by populations identified by STRUCTURE and multivariate analyses. We then performed a randomized test using the randtest function to assess whether there is significantly more or less variance explained by different partitions (strata) in the data compared with the null (random) expectation.
3 | RESULTS
3.1 | Mitochondrial DNA genetic structure
The mtDNA haplotype network (Figure 2) expands on previously published work (Ambrose et al., 2012), with the addition of sam-ples from the Solomon Islands Western Province, Santa Isabel and the Nggela Islands and new samples from Bougainville. We found
three major patterns: firstly, we observed higher haplotype diver-sity in Solomon Islands Western Province than on the other islands in the Archipelago— six unique haplotypes were sampled from the 26 individuals from the Solomon Islands Western Province. Three of the haplotypes sampled from this population are identical to haplo-types sampled elsewhere in the Solomon Archipelago (two from the more recent southern lineage and one from the older northern line-age). One haplotype belongs to the recent southern lineage but has not been sampled elsewhere. Secondly, for the first time, we found haplotype sharing between the Solomon archipelago and a New Guinean population, with two haplotypes sampled from Western Province falling within a group from the Papuan Peninsula of eastern Papua New Guinea. One of these haplotypes was commonly sam-pled from Western Province (n = 11, six adult females and five larvae from Ghizo Island) and is shared with individuals from the Papuan peninsula. The other haplotype falling in this group was only sam-pled in one larva collected from Ghizo. Thirdly, apart from Western Province, all newly sampled Solomon Archipelago COI haplotypes belong to the northern island lineage.
3.2 | Microsatellite analyses
All microsatellite analyses identified strong genetic structure be-tween populations defined a priori. We find support for all previous genetic groups found by Ambrose et al. (2012) with a high probability of assignment to a single cluster for most individuals in both DAPC and STRUCTURE analyses (Figures 1 and 2). At K = 2, STRUCTURE separated individuals from the Solomon Islands from individuals sampled from Australia and New Guinea, which form a single group. At K = 10, STRUCTURE identified two groups in Australia (Northern Territory and Queensland), four in New Guinea (southern New Guinea, Papuan Peninsula, central New Guinea and northern New Guinea) and four in the Solomon Archipelago (northern Solomon Islands, Santa Isabel, Solomon Islands Western Province and south-ern Solomon Islands). DAPC analysis revealed evidence of eleven
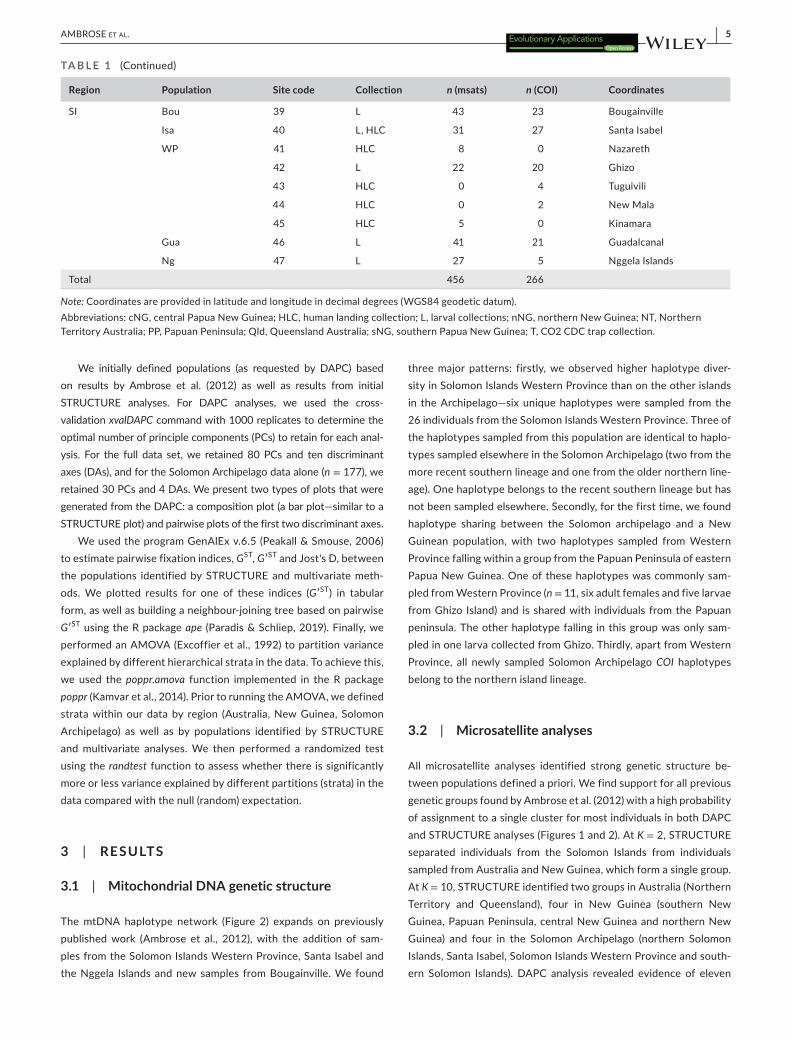
Region Population Site code Collection n (msats) n (COI) Coordinates
SI Bou 39 L 43 23 Bougainville
Isa 40 L, HLC 31 27 Santa Isabel
WP 41 HLC 8 0 Nazareth
42 L 22 20 Ghizo
43 HLC 0 4 Tuguivili
44 HLC 0 2 New Mala
45 HLC 5 0 Kinamara
Gua 46 L 41 21 Guadalcanal
Ng 47 L 27 5 Nggela Islands
Total 456 266
Note: Coordinates are provided in latitude and longitude in decimal degrees (WGS84 geodetic datum).Abbreviations: cNG, central Papua New Guinea; HLC, human landing collection; L, larval collections; nNG, northern New Guinea; NT, Northern Territory Australia; PP, Papuan Peninsula; Qld, Queensland Australia; sNG, southern Papua New Guinea; T, CO2 CDC trap collection.
TA B L E 1 (Continued)

6 | AMBROSE Et Al.
distinct clusters, in agreement with those found by STRUCTURE but with additional genetic differentiation between Guadalcanal and Nggela (which form the southern Solomon Islands indicated above; Figure 2). For results from STRUCTURE analyses from K = 2 to K = 15, see Data S1. AMOVA showed significantly higher than expected levels of variance between samples within populations
(phi = 0.29, p = 0.01), between populations within regions (phi = 0.19, p = 0.01) and between regions (phi = 0.18, p = 0.01) and significantly lower than expected variance within samples (phi = 0.53, p = 0.01) compared with the null model (Figure 3 and Table 2).
The Northern Territory (Australia) population is the most dis-tantly related at the nuclear level based on consistently high pairwise
F I G U R E 1 Map of sampling locations, host preference and Bayesian clustering (STRUCTURE) Anopheles hinesorum individuals based on 14 microsatellite loci. Host preference is shown by coloured bars beneath structure plots and by colour of text on the map. Opportunistic anthropophagic— feeds opportunistically on mammals including humans. Exclusively zoophagic— exclusively feeds on animals other than humans. Top Panel: Sampling locations of An. hinesorum specimens used in this study for microsatellite loci and mitochondrial COI. For some sites, only COI was generated/available (represented by squares); for others, only microsatellites were generated (represented by triangles), circles show sites for which both COI and microsatellite data are available. Locations labelled in red represent populations that do not bite humans, while populations labelled in black represent populations that are anthropophagic opportunists. The location of the city of Lae referred to in the manuscript is shown by the black arrow. Sites are coloured by the genetic population/cluster as follows: NT— Northern Territory; QLD— Queensland; sNG— southern New Guinea; PP— Papuan Peninsula; cNG— central New Guinea; nNG— northern New Guinea; Bou— Bougainville; Isa— Santa Isabel; WP— Western Province Solomon Islands; (Gua— Guadalcanal plus Ng— Nggela Islands) = sSI (southern Solomon Islands). Bottom Panel: The plots above were generated using the program STRUCTURE. They show individual membership probabilities to each population. The STRUCTURE plots represent the major clusters found (K = 2 and K = 10) in STRUCTURE analyses. For further details on these analyses, see the Section 2

| 7AMBROSE Et Al.
fixation indices relative to the other populations (Figure 4). Within New Guinea, the northern and central populations are the most dis-tinct for microsatellite loci, also based on pairwise fixation indices (Figure 4 and Tables S2– S4). Despite strong population structure within New Guinea, one individual from the central New Guinean population falls within the Papuan peninsula group with mtDNA and the microsatellite analyses (Figures 1 and 2). Microsatellite markers also show a close relationship between southern New Guinean and Queensland populations (Tables S2– S4, Figure 4), which form the centre of the multivariate plots (Figure 2 and Figure S1). Despite this close relationship, STRUCTURE, DAPC and t- SNE show that the Queensland population constitutes a separate group (Figures 1 and 2 and Figure S1).
The Solomon Archipelago populations cluster together in the multivariate analyses to form a closely related group that is distinct from populations from Australia and New Guinea. The STRUCTURE analysis run at K2 also clearly separates the Solomon Archipelago from populations from Australia and New Guinea (Figure 1). This taken together with low fixation indices between island populations
relative to the overall average G′ST suggests that there has been re-cent nuclear gene flow through the Archipelago. In assessing the re-lationship between mainland and island populations, the population from the Papuan Peninsula (New Guinea) and Santa Isabel (Solomon Islands) appear as closest relatives in the DAPC (Figure 2) as well as in pairwise G′ST estimates (Figure 4).
Within the Solomon Archipelago, nuclear divergence based on pairwise measures of differentiation is consistently lowest between the southern, western and northern Solomon Archipelago popula-tions, with Santa Isabel being the most distinct population in this region based on pairwise fixation indices (Figure 4 and Tables S2– S4). Populations from Nggela and Guadalcanal are closely related, with evidence of weak genetic structure between these islands in multivariate analyses (Figure 2 and Figure S2). The close relation-ship between these populations is further verified by relatively low fixation indices between these populations (Figure 4 and Tables S2– S4). All analyses also suggest a close nuclear genetic relationship between the Bougainville and Solomon Islands Western Province populations.
F I G U R E 2 Median joining haplotype network of Anopheles hinesorum mitochondrial COI sequences and DAPC analysis. Top Left: Relationships between mitochondrial haplotypes from 527 bp of the cytochrome oxidase 1 gene. Each circle represents a unique sequence with lines between sequences and hatches crossing lines showing mutations. Circles representing haplotypes are coloured by geographical region as shown in the key at bottom right and the size of each circle and proportion coloured shows the number of individuals that were sampled with that haplotype. Red circles show the two distinct lineages that are found on the Solomon Islands. Top Right: DAPC— scatter plot of all An. hinesorum microsatellite data generated. Each point represents a single individual and distance between points is negatively correlated with how closely related they are. Individuals are coloured by population as shown in the key above. The white line connecting groups is an estimated minimum spanning tree. Bottom: DAPC— Individual assignment plot generated using all An. hinesorum microsatellite. It shows the probability of assignment of each individual to a given population. Abbreviations are as follows: cNG, central New Guinea; Gua, Guadalcanal; Isa, Santa Isabel; Ng, Ngella Islands; nNG, northern New Guinea; nSI, northern Solomon Archipelago; NT, Northern Territory; PP, Papuan Peninsula; QLD, Queensland; sNG, southern New Guinea; WP, Western Province Solomon Islands

8 | AMBROSE Et Al.
4 | DISCUSSION
4.1 | Population structure between mainland An. hinesorum populations
By expanding field collections and using nuclear microsatellites, we build on previous knowledge of the population structure of
An. hinesorum in the south- west Pacific. Within New Guinea, we find six genetic clusters corresponding to geographically restricted populations identified in a previous study (Ambrose et al., 2012). Pairwise fixation indices based on microsatellite data corroborate previous findings, showing that the northern New Guinean popula-tion is the most genetically distinct population in New Guinea. DNA sequences of ribosomal protein S9 DNA from individuals sampled
F I G U R E 3 Null (randomised) distribution versus observed variance explained by different strata in AMOVA analyses. The figure above shows observed (black line) variance (Sigma) versus the null expected distribution, which was generated by randomisation of data in R, as outlined in Excoffier et al. (1992). The top left panel shows that the observed Sigma within samples is lower than expected under the null distribution (p < 0.01). The top right panel shows that Sigma observed between samples within populations is higher than expected (p < 0.01). The bottom left panel shows that Sigma observed between populations within regions is higher than expected (p < 0.01). The bottom right panel shows that Sigma observed between regions higher than expected (p < 0.01)
TA B L E 2 Results from AMOVA analyses
dfSums of squares
Mean square Sigma % Phi p
Between regions 2 641.79 320.89 1.0 18.26 0.18 0.01
Between populations within region 8 604.61 75.58 0.86 15.75 0.19 0.01
Between samples within population 445 2069.34 4.65 1.05 19.31 0.29 0.01
Within samples 456 1160.5 2.54 2.54 46.68 0.53 0.01
Note: This table shows results of AMOVA analyses. df = degrees of freedom, Sigma = variation explained by each level, % = the percentage of total variation explained by each level, Phi = the Phi statistic for each level. p- values were obtained by permutation tests as described in Excoffier et al. (1992).

| 9AMBROSE Et Al.
from the northern New Guinean population were previously found to be completely sorted from other populations of the species, form-ing a well- supported monophyletic clade (Ambrose et al., 2012). The northern New Guinean population was also the only An. hinesorum population that could not be detected by species- specific genomic DNA probes (Beebe et al., 1996). Altogether, this evidence suggests putative cryptic species status. However, further evidence of repro-ductive isolation when in sympatry with other An. hinesorum popula-tions, or other genomic evidence of reproductive isolation would be necessary to make this assessment. There may be areas of parapa-try where the ranges of the northern New Guinean and the Papua Peninsula populations meet— inland from the city of Lae— where re-productive isolation could be assessed.
Other populations in New Guinea that are found in proximity to each other are the central New Guinean, southern New Guinean
and Papuan peninsula populations. The southern and central New Guinean populations as well as the central New Guinean and Papuan peninsula populations may have areas of parapatry on the south-ern New Guinean coast (see Figure 1). Despite this, the central New Guinea population is distantly related in microsatellite analyses and is completely sorted for rpS9 (Ambrose et al., 2012), but shares mtDNA haplotypes with the highly diverse southern New Guinean population. One individual sampled from a site in the Papuan Peninsula, bordering the central New Guinean population range, was assigned to the central New Guinean population in microsat-ellite analyses with strong support and no evidence of admixture. These results suggest that populations identified within New Guinea by this, and previous studies may also be reproductively isolated.
For most of the last 250,000 years, southern New Guinea and northern Australia were connected by land bridges due to lower
F I G U R E 4 Summary of Anopheles hinesorum population structure based on pairwise G′ST (14 nuclear microsatellite loci). Top Left: Graphical representation of pairwise G′ST values between An. hinesorum populations based on allele frequencies of 14 microsatellite loci. Values shown in key are pairwise G′ST values calculated in GenAlex. Top Right: Neighbour joining tree showing relationships between populations based on pairwise G′ST. Bottom Left: Box plots showing ranges and interquartile ranges of pairwise G′ST values for each population. Bottom Right: Map of sampling locations with sites coloured by population. Abbreviations are as follows: cNG, central New Guinea; Gua, Guadalcanal; Isa, Santa Isabel; Ng, Ngella Islands; nNG, northern New Guinea; nSI, northern Solomon Archipelago; NT, Northern Territory; PP, Papuan Peninsula; QLD, Queensland; sNG, southern New Guinea; WP, Western Province Solomon Islands

10 | AMBROSE Et Al.
sea levels. In particular, what is now northern Queensland was con-nected to southern New Guinea for more than 90 per cent of the last 250,000 years, while the Northern Territory was only connected to New Guinea for <10 per cent of this period (Voris, 2000). Following the most recent glacial maximum, the Northern Territory separated from New Guinea approximately 12,000 years bp and Queensland separated from southern new Guinea as recently as 7000 years bp (Lambeck & Nakada, 1990; Nix & Kalma, 1975). Close relationships in the mtDNA haplotype network reflect these recent connections, and it is likely that the populations from Queensland and southern New Guinea formed a large metapopulation encompassing this area during the Pleistocene. Nuclear microsatellites support this hypoth-esis, as the Queensland and southern New Guinean populations are closely related for these markers.
The Northern Territory population is the most genetically dis-tant of any population in microsatellite analyses as observed through the pairwise fixation indices. This may be explained by the reduced period of time that the Northern Territory was connected to New Guinea during the Pleistocene. Although there were land bridges connecting the Northern Territory to New Guinea relatively re-cently, the climate during glacial maxima in large parts of Australia was much drier than it is today (Williams et al., 2009). This means that that there would have been little opportunity for connectivity be-tween the Northern Territory and other populations in Queensland and New Guinea, even when New Guinea was connected to the Northern Territory directly. Today An. hinesorum in the Northern Territory could be a remnant population with a restricted distribu-tion (Cooper et al., 2002). Additionally, the monsoonal climate in the Northern Territory drives intense dry periods, likely causing this population to go through regular bottlenecks, allowing greater po-tential for genetic drift to occur. These climatic and biogeographic factors working on a small, isolated population may explain why the Northern Territory population appears so distinct for the microsat-ellite markers used in this study.
4.2 | Evolution of exclusive zoophagy in the Solomon Archipelago
The Anopheles farauti complex shows variation in human host preference. Zoophagy is a derived trait in this complex that has evolved at least twice in the Solomon Archipelago: once in An. irenicus (another exclusively zoophagic species in the An. fa-rauti group) and at least once in An. hinesorum (Ambrose et al., 2012; Beebe et al., 2000; Foley et al., 1994). This group there-fore provides a useful system to study the genetic basis of human host preference in mosquitoes. Specialization in this group has occurred in the opposite direction to that in An. gambiae s.s. and Ae. aegypti, with species in the An. farauti complex having evolved from anthropophagic generalists to exclusively zoophagic species (and populations; Ambrose et al., 2012). The An. farauti complex therefore provides a useful counterpoint for comparison to other well- studied mosquito systems.
Human landing catches performed during studies in Bougainville and Guadalcanal have failed to collect An. hinesorum despite pro-ductive larval habitats near the human landing catches (Cooper & Frances, 2002; Foley et al., 1994). Thus, the zoophagic trait ap-pears to be fixed in An. hinesorum populations from the northern and southern Solomon Archipelago. The hosts that these popula-tions are feeding upon remain unknown but there was probably a limited range of hosts available on the Solomon Archipelago at the time of initial colonization, and sizeable mammals may not have been present (Ambrose et al., 2012). Anopheles hinesorum in Australia and New Guinea are attracted to carbon dioxide baited traps while populations in the Solomon Archipelago are not (Cooper & Frances, 2002; Cooper et al., 2009; Foley et al., 1994; Van Den Hurk et al., 1997), a phenotypic difference indicating that the colonization of these islands may have driven the adaptation of An. hinesorum to ec-tothermic hosts. Other animals, including insects, have experienced host shifts and specialization when colonizing islands (Jorge et al., 2018; Simberloff, 1974; Tseng et al., 2018; Yassin et al., 2016), and the Solomon Archipelago supports an abundant and diverse frog and reptile fauna (Morrison et al., 2007; Pikacha et al., 2016), providing an plentiful potential food source.
Mitochondrial DNA data starkly show that there are two dis-tinct lineages of An. hinesorum occupying the north and south of the Solomon Archipelago. These most likely reflect two distinct migra-tions of the species to the islands from New Guinea or elsewhere: firstly, an old migration whose haplotypes dominate the northern islands, likely dispersing from New Guinea through the New Britain archipelago and then a more recent migration into the southern is-lands, possibly from the Papuan peninsula. The five samples from Nggela as well as most samples from Santa Isabel belong to the northern haplotype group, likely indicative of historical Pleistocene connectivity through the north- eastern islands of the archipelago— Bougainville, Santa Isabel and the Nggela Islands.
Three distinct evolutionary scenarios may have generated the observed pattern of exclusive zoophagy in two divergent mtDNA lineages of An. hinesorum found on the Solomon Archipelago. These include the convergent evolution of the trait, the evolution of the trait in one population and subsequent transmission via gene flow to the other, and the replacement of mitochondria (via selective sweep) in a widespread zoophagic population in the Solomon Archipelago. Despite the southern and northern Solomon Archipelago mtDNA lineages being highly divergent, all populations from the Archipelago form a closely related group at the nuclear DNA level. These close relationships suggest that recent nuclear gene flow has occurred be-tween them or that they share a more recent common ancestor than their mtDNA genomes suggest. The northern mtDNA lineage domi-nates the islands extending from Bougainville in the north to Nggela in the south, although several individuals sampled from Santa Isabel possess a haplotype commonly found on Guadalcanal (southern lin-eage). This pattern suggests either past connectivity between these islands or long- distance migration of females.
Genetic connectivity between islands in the Solomon Archipelago is also indicated by the microsatellite data. STRUCTURE plots and
| 11AMBROSE Et Al.
DAPC compoplots show mixed assignment of individuals from differ-ent islands in the Solomon Archipelago. Comparatively low fixation indices also indicate that recent gene flow has occurred. This result makes sense given that most islands of the Solomon Archipelago were connected by land bridges and formed a larger island known as Greater Bukida, separated from Guadalcanal by only 2 km of ocean at times of lowest sea level (Mayr & Diamond, 2001). The Western Province islands were still isolated during this period. Interestingly, individuals sampled from the Western Province possessed mtDNA haplotypes from both the highly divergent northern and southern lineages and the eastern peninsula of New Guinea.
It is likely that microsatellite differentiation between island pop-ulations reflects postglacial divergence. Previously we hypothesized that zoophagy may have evolved independently in the two divergent island mitochondrial lineages of An. hinesorum due to selection on new migrants. However, it now seems likely that zoophagy evolved in one lineage and moved through the Archipelago by migration and gene flow. As we do not yet know the genetic basis of the trait, we cannot be sure which scenario has resulted in the evolution and spread of zoophagy in these islands.
4.3 | Emergence of anthropophagy in the Solomon Archipelago: Recent gene flow from New Guinea and implications for malaria transmission
Recent fieldwork in Solomon Islands Western Province identified An. hinesorum feeding on humans (Burkot et al., 2018). This is an im-portant finding as the species has rarely been collected feeding on humans in the Solomon Archipelago during many previous attempts to collect An. hinesorum in human landing catches, despite abundant larvae in the immediate landscape. The mtDNA (COI) of samples from this population fell into three genetically distinct and geographically defined groups: one from New Guinea (Papuan Peninsula) and two from the Solomon Archipelago (northern and southern lineages). One Western Province haplotype sampled in eleven individuals is identical to a sequence sampled from an anthropophagic popula-tion in New Guinea— the only case of haplotype sharing observed between Solomon Archipelago and New Guinean populations. This raises the possibility that female An. hinesorum from New Guinea were able to arrive in the Western Province of the Solomon Islands, reproduce with local mosquitoes, and in the process transfer an-thropophagy to this island population.
There are two obvious recent dispersal routes for An. hinesorum from New Guinea to the Western Province. During the World War II Pacific engagement, American airbases connected the Western Province to New Guinea via airstrips in Lae and Milne Bay (the east-ern point of the Papuan peninsula— see Figure S3). At this time, an-thropophagic An. hinesorum were abundant at these New Guinean airbase sites (Beebe & Cooper, 2002) and there would have been ample opportunity for human- seeking female mosquitoes to enter aircraft destined for the Munda airstrip in Western Province. These females could have arrived in Munda— where plentiful larval sites
and human hosts were available— within a day. There are also reg-ular contemporary shipping movements between Lae (northern Papuan Peninsula) and Munda (Western Province Solomon Islands) which may provide additional ongoing human- aided dispersal opportunities.
Even though a commonly sampled mitochondrial haplotype in the Solomon Islands Western Province is identical to a haplotype sampled in a New Guinean population— the only case of haplo-type sharing between New Guinean and Solomon Archipelago populations— the nuclear microsatellites suggest the genomes of the Western Province population appear to be mostly of native Solomon Archipelago origin. This is shown by the close relationships at mi-crosatellite loci between individuals from Western Province and the rest of the Solomon Archipelago. In mosquitoes, olfaction is the primary sense that governs host preference (Takken, 1991), and it is likely that only small regions (e.g. a small number of olfactory genes) of the genome are associated with the ability to detect and feed on humans (Raji & DeGennaro, 2017). Thus, it is possible that small parts of the New Guinean nuclear genome (that are associ-ated with anthropophagy and likely olfactory in function) have been retained in the anthropophagic Solomon Islands Western Province population. For this reason, the Western Province Solomon Island population may be central to identifying genes or genomic regions associated with mosquito anthropophagy in future comparative population genomics investigations.
Today, the only common species known to transmit malaria in the Solomon Archipelago is the coastally restricted An. farauti (Beebe et al., 2015). The emergence of anthropophagy in a popu-lation of An. hinesorum from the Solomon Archipelago has serious implications for the transmission of malaria, especially if this phe-notype spreads through other populations in the Archipelago. Anopheles hinesorum is common and abundant through the Solomon Islands showing larval site plasticity, and existing both inland and at elevation (Beebe et al., 2015). If anthropophagy provides a selective advantage (i.e. blood source availability and improved fecundity), it may spread quickly resulting in the emergence of a second common malaria vector in the Solomon Archipelago. This could have serious implications for the spread of malaria in the Solomon Archipelago due to the high abundance of An. hinesorum through the Solomon Islands.
5 | CONCLUSIONS
In this study, we have achieved a more complete understanding of population genetic relationships of An. hinesorum in the Western Pacific, clarifying population subdivisions. This lays the groundwork necessary to use this species as a novel model system for studying human host preference in mosquitoes. Large mtDNA divergences likely do not indicate species boundaries, as nuclear gene flow is evident between some highly diverged lineages in the Solomon Archipelago. Although we cannot be certain that exclusive zoophagy in the Solomon Island populations was transmitted between these
12 | AMBROSE Et Al.
divergent lineages via gene flow, our results suggest that gene flow between islands of the Archipelago has occurred. Further work is necessary to disentangle the hypotheses regarding the origins of zoophagy in the Solomon Archipelago. We detected New Guinean mitotypes in a recently discovered anthropophagic population from the Solomon Islands indicating that human- mediated transport of the species may have resulted in anthropophagy being introduced to the Archipelago. The emergence of this phenotype may have rami-fications for the epidemiology and transmission of malaria on the Solomon Archipelago; specifically, it may result in increased malaria transmission in inland villages.
ACKNOWLEDG EMENTSThis work was supported by funding from the Hermon Slade Foundation (grant number 2014000818), National Health and Medical Research Council (grant number 117102) and the National Institutes of Health International Center of Excellence in Malaria Research (award number U19AI089686- 03). The authors thank staff from the National Vector Borne Disease Program Solomon Islands for their assistance. Thank you to Andrew Maynard, Andrew Mather and Ashley Hay for providing useful feedback on the manuscript.
CONFLIC T OF INTERE S TThe authors declare no conflicts of interest.
DATA AVAIL ABILIT Y S TATEMENTThe data that support the findings of this study are openly available in Dryad at http://doi.org/10.5061/dryad.bg79c npb8
ORCIDLuke Ambrose https://orcid.org/0000-0003-4048-9616 Daniel Ortiz- Barrientos https://orcid.org/0000-0002-7493-416X
R E FE R E N C E SAdamack, A. T., & Gruber, B. (2014). PopGenReport: Simplifying basic
population genetic analyses in R. Methods in Ecology and Evolution, 5(4), 384– 387. https://doi.org/10.1111/2041- 210X.12158
Ambrose, L., Cooper, R. D., Russell, T. L., Burkot, T. R., Lobo, N. F., Collins, F. H., Hii, J., & Beebe, N. W. (2014). Microsatellite and mitochondrial markers reveal strong gene flow barriers for Anopheles farauti in the Solomon Archipelago: Implications for malaria vector control. International Journal for Parasitology, 44(3– 4), 225– 233. https://doi.org/10.1016/j.ijpara.2013.12.001
Ambrose, L., Riginos, C., Cooper, R. D., Leow, K. S., Ong, W., & Beebe, N. W. (2012). Population structure, mitochondrial polyphyly and the repeated loss of human biting ability in anopheline mosquitoes from the southwest Pacific. Molecular Ecology, 21(17), 4327– 4343. https://doi.org/10.1111/j.1365- 294X.2012.05690.x
Bandelt, H. J., Forster, P., & Röhl, A. (1999). Median- joining networks for inferring intraspecific phylogenies. Molecular Biology and Evolution, 16(1), 37– 48. https://doi.org/10.1093/oxfor djour nals.molbev.a026036
Beebe, N. W., Bakote'e, B., Ellis, J. T., & Cooper, R. D. (2000). Differential ecology of Anopheles punctulatus and three mem-bers of the Anopheles farauti complex of mosquitoes on Guadalcanal, Solomon Islands, identified by PCR- RFLP analysis.
Medical and Veterinary Entomology, 14(3), 308– 312. https://doi.org/10.1046/j.1365- 2915.2000.00248.x
Beebe, N. W., & Cooper, R. D. (2002). Distribution and evolution of the Anopheles punctulatus group (Diptera: Culicidae) in Australia and Papua New Guinea. International Journal for Parasitology, 32(5), 563– 574. https://doi.org/10.1016/S0020 - 7519(01)00359 - 9
Beebe, N. W., Foley, D. H., Cooper, R. D., Bryan, J. H., & Saul, A. (1996). DNA probes for the Anopheles punctulatus complex. American Journal of Tropical Medicine and Hygiene, 54(4), 395– 398. https://doi.org/10.4269/ajtmh.1996.54.395
Beebe, N. W., Russell, T., Burkot, T. R., & Cooper, R. D. (2015). Anopheles punctulatus group: Evolution, distribution, and control. Annual Review of Entomology, 60, 335– 350. https://doi.org/10.1146/annur ev- ento- 01081 4- 021206
Beebe, N. W., & Saul, A. (1995). Discrimination of all members of the Anopheles punctulatus complex by polymerase chain reaction- restriction fragment length polymorphism analysis. American Journal of Tropical Medicine and Hygiene, 53(5), 478– 481. https://doi.org/10.4269/ajtmh.1995.53.478
Besansky, N. J., Hill, C. A., & Costantini, C. (2004). No accounting for taste: Host preference in malaria vectors. Trends in Parasitology, 20(6), 249– 251. https://doi.org/10.1016/j.pt.2004.03.007
Brown, J. E., Mcbride, C. S., Johnson, P., Ritchie, S., Paupy, C., Bossin, H., Lutomiah, J., Fernandez- Salas, I., Ponlawat, A., Cornel, A. J., Black, W. C. IV, Gorrochotegui- Escalante, N., Urdaneta- Marquez, L., Sylla, M., Slotman, M., Murray, K. O., Walker, C., & Powell, J. R. (2011). Worldwide patterns of genetic differentiation imply multiple “do-mestications” of Aedes aegypti, a major vector of human diseases. Proceedings of the Royal Society B: Biological Sciences, 278(1717), 2446– 2454. https://doi.org/10.1098/rspb.2010.2469
Bugoro, H., Iro'ofa, C., Mackenzie, D. O., Apairamo, A., Hevalao, W., Corcoran, S., Bobogare, A., Beebe, N. W., Russell, T. L., Chen, C.- C., & Cooper, R. D. (2011). Changes in vector species composition and current vector biology and behaviour will favour malaria elim-ination in Santa Isabel Province, Solomon Islands. Malaria Journal, 10(1), 287. https://doi.org/10.1186/1475- 2875- 10- 287
Burkot, T. R., Bugoro, H., Apairamo, A., Cooper, R. D., Echeverry, D. F., Odabasi, D., Beebe, N. W., Makuru, V., Xiao, H., Davidson, J. R., Deason, N. A., Reuben, H., Kazura, J. W., Collins, F. H., Lobo, N. F., & Russell, T. L. (2018). Spatial- temporal heterogeneity in malaria receptivity is best estimated by vector biting rates in areas nearing elimination. Parasites and Vectors, 11(1). https://doi.org/10.1186/s1307 1- 018- 3201- 1
Carey, A. F., & Carlson, J. R. (2011). Insect olfaction from model systems to disease control. Proceedings of the National Academy of Sciences, 108(32), 12987– 12995. https://doi.org/10.1073/pnas.11034 72108
Clements, A. N. (2011). The biology of mosquitoes, Volume 3: Transmission of viruses and interactions with bacteria. CABI Publishing.
Cooper, R. D., & Frances, S. P. (2002). Malaria vectors on Buka and Bougainville islands, Papua New Guinea. Journal of the American Mosquito Control Association, 18(2), 100– 106.
Cooper, R. D., Waterson, D. G. E., Frances, S. P., Beebe, N. W., Pluess, B., & Sweeney, A. W. (2009). Malaria vectors of Papua New Guinea. International Journal for Parasitology, 39(13), 1495– 1501. https://doi.org/10.1016/j.ijpara.2009.05.009
Cooper, R. D., Waterson, D. G. E., Frances, S. P., Beebe, N. W., & Sweeney, A. W. (2002). Speciation and distribution of the members of the Anopheles punctulatus (Diptera: Culicidae) group in Papua New Guinea. Journal of Medical Entomology, 39(1), 16– 27. https://doi.org/10.1603/0022- 2585- 39.1.16
Costantini, C., Sagnon, N. F., Della Torre, A., & Coluzzi, M. (1999). Mosquito behavioural aspects of vector- human interactions in the Anopheles gambiae complex. Parassitologia, 41(1– 3), 209– 217.
Evanno, G., Regnaut, S., & Goudet, J. (2005). Detecting the num-ber of clusters of individuals using the software STRUCTURE: A
| 13AMBROSE Et Al.
simulation study. Molecular Ecology, 14(8), 2611– 2620. https://doi.org/10.1111/j.1365- 294X.2005.02553.x
Excoffier, L., Smouse, P. E., & Quattro, J. M. (1992). Analysis of molecular variance inferred from metric distances among DNA haplotypes: Application to human mitochondrial DNA restriction data. Genetics, 131(2), 479– 491. https://doi.org/10.1093/genet ics/131.2.479
Foley, D. H., Meek, S. R., & Bryan, J. H. (1994). The Anopheles punctulatus group of mosquitoes in the Solomon Islands and Vanuatu surveyed by allozyme electrophoresis. Medical and Veterinary Entomology, 8(4), 340– 350. https://doi.org/10.1111/j.1365- 2915.1994.tb000 98.x
Harrington, L. C., Edman, J. D., & Scott, T. W. (2001). Why do female Aedes aegypti (Diptera: Culicidae) feed preferentially and frequently on human blood? Journal of Medical Entomology, 38(3), 411– 422. https://doi.org/10.1603/0022- 2585- 38.3.411
Hess, A. D., Hayes, R. O., & Tempelis, C. H. (1968). The use of the for-age ratio technique in mosquito host preference studies. Mosquito News, 28(3), 386– 389.
Hulce, D., Li, X., & Snyder- Leiby, T. (2011). GeneMarker® genotyping software: Tools to increase the statistical power of DNA fragment analysis. Journal of Biomolecular Techniques, 22(Suppl), S35– S36.
Jakobsson, M., & Rosenberg, N. A. (2007). CLUMPP: A cluster matching and permutation program for dealing with label switching and mul-timodality in analysis of population structure. Bioinformatics, 23(14), 1801– 1806. https://doi.org/10.1093/bioin forma tics/btm233
Janes, J. K., Miller, J. M., Dupuis, J. R., Malenfant, R. M., Gorrell, J. C., Cullingham, C. I., & Andrew, R. L. (2017). The K = 2 conundrum. Molecular Ecology, 26(14), 3594– 3602. https://doi.org/10.1111/mec.14187
Jombart, T. (2008). Adegenet: A R package for the multivariate analysis of genetic markers. Bioinformatics, 24(11), 1403– 1405. https://doi.org/10.1093/bioin forma tics/btn129
Jombart, T., Devillard, S., & Balloux, F. (2010). Discriminant analysis of principal components: A new method for the analysis of geneti-cally structured populations. BMC Genetics, 11(1), 94. https://doi.org/10.1186/1471- 2156- 11- 94
Jorge, F., Perera, A., Poulin, R., Roca, V., & Carretero, M. A. (2018). Getting there and around: Host range oscillations during colonization of the Canary Islands by the parasitic nematode Spauligodon. Molecular Ecology, 27(2), 533– 549. https://doi.org/10.1111/mec.14458
Kamvar, Z. N., Tabima, J. F., & Gr̈ unwald, N. J. (2014). Poppr: An R package for genetic analysis of populations with clonal, partially clonal, and/or sexual reproduction. PeerJ, 2014(1). https://doi.org/10.7717/peerj.281
Kearse, M., Moir, R., Wilson, A., Stones- Havas, S., Cheung, M., Sturrock, S., Buxton, S., Cooper, A., Markowitz, S., Duran, C., Thierer, T., Ashton, B., Meintjes, P., & Drummond, A. (2012). Geneious basic: An integrated and extendable desktop software platform for the organization and analysis of sequence data. Bioinformatics, 28(12), 1647– 1649. https://doi.org/10.1093/bioin forma tics/bts199
Keven, J. B., Reimer, L., Katusele, M., Koimbu, G., Vinit, R., Vincent, N., Thomsen, E., Foran, D. R., Zimmerman, P. A., & Walker, E. D. (2017). Plasticity of host selection by malaria vectors of Papua New Guinea. Parasites and Vectors, 10(1). https://doi.org/10.1186/s1307 1- 017- 2038- 3
Kopelman, N. M., Mayzel, J., Jakobsson, M., Rosenberg, N. A., & Mayrose, I. (2015). Clumpak: A program for identifying cluster-ing modes and packaging population structure inferences across K. Molecular Ecology Resources, 15(5), 1179– 1191. https://doi.org/10.1111/1755- 0998.12387
Krijthe, J. H. (2015). Rtsne: T- Distributed stochastic neighbor embed-ding using Barnes- Hut implementation. https://github.com/jkrij the/Rtsne
Lambeck, K., & Nakada, M. (1990). Late Pleistocene and Holocene sea- level change along the Australian coast. Global and Planetary Change, 3(1– 2), 143– 176. https://doi.org/10.1016/0921- 8181(90)90060 - P
Lyimo, I. N., & Ferguson, H. M. (2009). Ecological and evolution-ary determinants of host species choice in mosquito vectors. Trends in Parasitology, 25(4), 189– 196. https://doi.org/10.1016/j.pt.2009.01.005
Mayr, E., & Diamond, J. (2001). The birds of northern Melanesia – Speciation, ecology and biogeography. Oxford University Press.
McBride, C. S. (2016). Genes and odors underlying the recent evolution of mosquito preference for humans. Current Biology, 26(1), R41– R46. https://doi.org/10.1016/j.cub.2015.11.032
McBride, C. S., Baier, F., Omondi, A. B., Spitzer, S. A., Lutomiah, J., Sang, R., Ignell, R., & Vosshall, L. B. (2014). Evolution of mosquito prefer-ence for humans linked to an odorant receptor. Nature, 515(7526), 222– 227. https://doi.org/10.1038/natur e13964
Morrison, C., Pikacha, P., Pitakia, T., & Boseto, D. (2007). Herpetofauna, community education and logging on Choiseul Island, Solomon Islands: Implications for conservation. Pacific Conservation Biology, 13(4), 250– 258. https://doi.org/10.1071/PC070250
Nix, H. A. & Kalma, J. D. (1975). Climate as a dominant control in the bio-geography of northern Australia and New Guinea. CSIRO report, Canberra.
Paradis, E., & Schliep, K. (2019). Ape 5.0: An environment for modern phylogenetics and evolutionary analyses in R. Bioinformatics, 35(3), 526– 528. https://doi.org/10.1093/bioin forma tics/bty633
Peakall, R., & Smouse, P. E. (2006). GENALEX 6: Genetic analy-sis in Excel. Population genetic software for teaching and re-search. Molecular Ecology Notes, 6(1), 288– 295. https://doi.org/10.1111/j.1471- 8286.2005.01155.x
Pikacha, P., Filardi, C., Morrison, C., & Leung, L. (2016). Factors affecting frog density in the Solomon Islands. Pacific Conservation Biology, 22(3), 223– 235. https://doi.org/10.1071/PC14927
Pina- Martins, F., Silva, D. N., Fino, J., & Paulo, O. S. (2017). Structure_threader: An improved method for automation and parallelization of programs structure, fastStructure and MavericK on multicore CPU systems. Molecular Ecology Resources, 17(6), e268– e274. https://doi.org/10.1111/1755- 0998.12702
Pritchard, J. K., Stephens, M., & Donnelly, P. (2000). Inference of popu-lation structure using multilocus genotype data. Genetics, 155(2), 945– 959. https://doi.org/10.1093/genet ics/155.2.945
R Core Team (2013). R: A language and environment for statistical com-puting. R Foundation for Statistical Computing. http://www.r- proje ct.org/
Raji, J. I., & DeGennaro, M. (2017). Genetic analysis of mosquito detec-tion of humans. Current Opinion in Insect Science, 20, 34– 38. https://doi.org/10.1016/j.cois.2017.03.003
Ritchie, S. A. (2014). Dengue vector bionomics: Why Aedes aegypti is such a good vector. In D. J. Gubler, E. E. Ooi, S. Vasudevan, & J. Farrar (Eds.), Dengue and dengue hemorrhagic fever (2nd ed.). CABI. https://doi.org/10.1079/97818 45939 649.0455
Rosenberg, N. A. (2004). DISTRUCT: A program for the graphical display of population structure. Molecular Ecology Notes, 4(1), 137– 138. https://doi.org/10.1046/j.1471- 8286.2003.00566.x
Rstudio Team (2020). RStudio: Integrated development environment for R. Rstudio, PBC. http://www.rstud io.com/
Simberloff, D. S. (1974). Equilibrium theory of island biogeography and ecology. Annual Review of Ecology and Systematics, 5(1), 161– 182. https://doi.org/10.1146/annur ev.es.05.110174.001113
Sinka, M. E., Bangs, M. J., Manguin, S., Coetzee, M., Mbogo, C. M., Hemingway, J., Patil, A. P., Temperley, W. H., Gething, P. W., Kabaria, C. W., Okara, R. M., Van Boeckel, T., Godfray, H. C. J., Harbach, R. E., & Hay, S. I. (2010). The dominant Anopheles vectors of human malaria in Africa, Europe and the Middle East: occurrence data, distribution maps and bionomic précis. Parasites & Vectors, 3(1). https://doi.org/10.1186/1756- 3305- 3- 117
St. Laurent, B., Burton, T. A., Zubaidah, S., Miller, H. C., Asih, P. B., Baharuddin, A., Kosasih, S., Shinta, Firman, S., Hawley, W. A., Burkot, T. R., Syafruddin, D., Sukowati, S., Collins, F. H., & Lobo, N. F.

14 | AMBROSE Et Al.
(2017). Host attraction and biting behaviour of Anopheles mosqui-toes in South Halmahera, Indonesia. Malaria Journal, 16(1). https://doi.org/10.1186/s1293 6- 017- 1950- 5
Sweeney, A. W., Cooper, R. D., & Frances, S. P. (1990). Distribution of the sibling species of Anopheles farauti in the Cape York Peninsula, northern Queensland, Australia. Journal of the American Mosquito Control Association, 6(3), 425– 429.
Takken, W. (1991). The role of olfaction in host- seeking of mosquitoes: A review. International Journal of Tropical Insect Science, 12(1– 3), 287– 295. https://doi.org/10.1017/S1742 75840 0020816
Takken, W., & Verhulst, N. O. (2013). Host preferences of blood- feeding mosquitoes. Annual Review of Entomology, 58(1), 433– 453. https://doi.org/10.1146/annur ev- ento- 12081 1- 153618
Tempelis, C. H. (1975). Host feeding patterns of mosquitoes, with a re-view of advances in analysis of blood meals by serology. Journal of Medical Entomology, 11(6), 635– 653. https://doi.org/10.1093/jmede nt/11.6.635
Tseng, H. Y., Huang, W. S., Jeng, M. L., Villanueva, R. J. T., Nuñeza, O. M., & Lin, C. P. (2018). Complex inter- island colonization and peri-patric founder speciation promote diversification of flightless Pachyrhynchus weevils in the Taiwan- Luzon volcanic belt. Journal of Biogeography, 45(1), 89– 100. https://doi.org/10.1111/jbi.13110
Van Den Hurk, A. F., Beebe, N. W., & Ritchie, S. A. (1997). Responses of mosquitoes of the Anopheles farauti complex to 1- octen- 3- ol and light in combination with carbon dioxide in northern Queensland, Australia. Medical and Veterinary Entomology, 11(2), 177– 180. https://doi.org/10.1111/j.1365- 2915.1997.tb003 10.x
Van Den Hurk, A. F., Cooper, R. D., Beebe, N. W., Williams, G. M., Bryan, J. H., & Ritchie, S. A. (2000). Seasonal abundance of Anopheles farauti (Diptera: Culicidae) sibling species in far north Queensland, Australia. Journal of Medical Entomology, 37(1), 153– 161. https://doi.org/10.1603/0022- 2585- 37.1.153
Van Der Maaten, L., & Hinton, G. (2008). Visualizing data using t- SNE. Journal of Machine Learning Research, 9, 2579– 2605.
Van Oosterhout, C., Van Heuven, M. K., & Brakefield, P. M. (2004). On the neutrality of molecular genetic markers: Pedigree analysis of genetic variation in fragmented populations. Molecular Ecology, 13(5), 1025– 1034. https://doi.org/10.1111/ j.1365- 294X.2004.02114.x
Voris, H. K. (2000). Maps of Pleistocene sea levels in Southeast Asia: Shorelines, river systems and time durations.
Journal of Biogeography, 27(5), 1153– 1167. https://doi.org/10.1046/j.1365- 2699.2000.00489.x
White, G. B. (1974). Anopheles gambiae complex and disease transmission in Africa. Transactions of the Royal Society of Tropical Medicine and Hygiene, 68(4), 278– 298. https://doi.org/10.1016/0035- 9203(74)90035 - 2
Williams, M., Cook, E., van der Kaars, S., Barrows, T., Shulmeister, J., & Kershaw, P. (2009). Glacial and deglacial climatic patterns in Australia and surrounding regions from 35 000 to 10 000 years ago reconstructed from terrestrial and near- shore proxy data. Quaternary Science Reviews, 28(23– 24), 2398– 2419. https://doi.org/10.1016/j.quasc irev.2009.04.020
Yassin, A., Debat, V., Bastide, H., Gidaszewski, N., David, J. R., & Pool, J. E. (2016). Recurrent specialization on a toxic fruit in an is-land Drosophila population. Proceedings of the National Academy of Sciences of the United States of America, 113(17), 4771– 4776. https://doi.org/10.1073/pnas.15225 59113
Zwiebel, L. J., & Takken, W. (2004). Olfactory regulation of mosquito– host interactions. Insect Biochemistry and Molecular Biology, 34(7), 645– 652. https://doi.org/10.1016/j.ibmb.2004.03.017
SUPPORTING INFORMATIONAdditional supporting information may be found online in the Supporting Information section.
How to cite this article: Ambrose, L., Ortiz- Barrientos, D., Cooper, R. D., Lobo, N. F., Burkot, T. R., Russell, T. L., & Beebe, N. W. (2021). Gene flow between island populations of the malaria mosquito, Anopheles hinesorum, may have contributed to the spread of divergent host preference phenotypes. Evolutionary Applications, 00, 1– 14. https://doi.org/10.1111/eva.13288