general certificate of education · general certificate of education specimen unit advanced...
TRANSCRIPT

abc
General Certificate of Education
Mathematics – Statistics
SPECIMEN UNITS AND MARK SCHEMES
ADVANCED SUBSIDIARY MATHEMATICS (5361) ADVANCED SUBSIDIARY PURE MATHEMATICS (5366)
ADVANCED SUBSIDIARY FURTHER MATHEMATICS (5371)
ADVANCED MATHEMATICS (6361) ADVANCED PURE MATHEMATICS (6366)
ADVANCED FURTHER MATHEMATICS (6371)

[2]
General Certificate of Education Specimen Unit Advanced Subsidiary Examination
MATHEMATICS MS1A Unit Statistics 1A
In addition to this paper you will require: • an 8-page answer book; • the AQA booklet of formulae and statistical tables. You may use a graphics calculator.
Time allowed: 1 hour 15 minutes
Instructions • Use blue or black ink or ball-point pen. Pencil should only be used for drawing. • Write the information required on the front of your answer book. The Examining Body for this
paper is AQA. The Paper Reference is MS1A. • Answer all questions. • All necessary working should be shown; otherwise marks for method may be lost. • The final answer to questions requiring the use of tables or calculators should normally be given
to three significant figures. Information • The maximum mark for this paper is 60. • Mark allocations are shown in brackets. Advice • Unless stated otherwise, formulae may be quoted, without proof, from the booklet.
abc


[4]
3
4 A cricket team meets for fielding practice. One exercise consists of a cricket ball being thrown at different heights, speeds and angles to one side of a fielder who tries to catch it using one hand.
Each member of the team attempts 25 catches with each hand. The number of successful catches are given in the following table.
Fielder A B C D E F G H I J K Left hand 11 13 9 17 21 16 14 8 19 19 20 Right hand 18 17 20 22 14 19 21 15 10 24 23
(a) Calculate the value of the product moment correlation between the number of catches with
the left hand and the number of catches with the right hand. (3 marks) (b) Comment on the performance of fielders E and I. (2 marks) (c) When fielders E and I are omitted from the calculation, the value of the product moment
correlation coefficient between the number of left-handed catches and the number of right-handed catches is 0.812, correct to three decimal places. Comment on this value and the value you calculated in part (a) (2 marks)
5 Pencils produced on a certain machine have lengths, in millimetres, which are distributed with a mean of µ and a standard deviation of 3. A random sample of 90 pencils was taken and the length of each pencil measured. The mean length was found to be 178.5 millimetres.
(a) Construct a 99% confidence interval for µ . (5 marks) (b) State why, in answering part (a), it is not necessary to assume that the length of pencils are
normally distributed. (2 marks)
TURN OVER FOR THE NEXT QUESTION
Turn over ►

[5]
4
6 Last year the employees of a firm either received no pay rise, a small pay rise or a large pay rise. The following table shows the number in each category, classified by whether they were weekly paid or monthly paid.
No pay rise Small pay rise Large pay rise
Weekly Paid 25 85 5 Monthly paid 4 8 23
A tax inspector decides to investigate the tax affairs of an employee selected at random. D is the event that a weekly paid employee is selected. E is the event that an employee who received no pay rise is selected. E′ is the event not E.
(a) Find the value of:
(i) P (D ); (ii) P (D | E ); (iii) P (D ∩ E ′ ). (5 marks)
(b) The tax inspector now decides to select three employees. Find the probability that they are all weekly paid if:
(i) one is selected at random from those who had no pay rise, one from those who had a
small pay rise and one from those who had a large pay rise; (3 marks)
(ii) they are selected at random (without replacement) from all the employees of the firm. (2 marks)

[6]
5
7 [[[[A sheet of graph paper is provided for use in this question.]]]]
Andrew (A), Charles (C) and Edward (E) are employed by the Palace Hotel. Each is responsible for one floor of the building and their duties include cleaning the bedrooms. The number of bedrooms occupied on each floor varies from day to day.
The following table shows 10 observations of the number, x, of bedrooms to be cleaned and the time taken, y minutes, to carry out the cleaning. The employee carrying out the cleaning is also indicated.
Employee A C E E C A A E C C
x 8 22 12 24 19 14 22 16 10 21 y 110 211 132 257 184 165 248 171 97 196
(a) Plot a scatter diagram of the data. Identify the employee by labelling each point. (3 marks) (b) Calculate the equation of the regression line of y on x. Draw the line on your scatter
diagram. (6 marks) (c) Calculate the residuals for the three observations when Andrew did the cleaning. (3 marks) (d) Comment on the times taken by Andrew to carry out his cleaning. (1 mark)
END OF QUESTIONS

[7]
MS1A Specimen
Question Solution Marks Total Comments
1(a) Binomial n = 40 p = 0.1
P( 4 or fewer ) = 0.629
B1B1
B1
3
(b) P(2) = (35 ×34/2) × 0.12 × 0.933
= 0.184
B1M1
A1
3
0.183 − 0.184
(c) Beads selected randomly/independently E1 1 Total 7
2(a) z = (25 – 25.8)/0.5 = –1.6
Probability less than 25kg = 1 – 0.94520
= 0.0548
M1
M1
A1
3
(b) z = 1.2816
Weight exceeded by 10% of bags
25.8 + 1.2816 × 0.5 = 26.44
B1
M1m1
A1
4
Total 7
3(a) Class mid-mark Frequency 40 12 50 54 60 68 75 41 95 23
x = 63.2 s = 15.2
M1
A2 A2
5
Allow m1A1 for mean and s.d. if method shown. 63.2 (63.1 − 63.3)
15.2 (15.0 − 15.3)
(b) Journeys from Surrey have similar duration, on average, but are less variable than those from Essex.
E1 E1
2
(c) People asked may not be representative. Times are estimated not measured.
E1 E1
2
Or any other sensible comments e.g. journey time not defined , weather conditions may be extreme etc
Total 9
abc

[8]
MS1A (cont)
Question Solution Marks Total Comments
4(a) 0.0477 B3 3 0.047 − 0.048 allow M2 A1 if method shown
(b) E and I held more catches with left than with right hand - all others held more with right than left.
E1
E1
2
(c) Correlation coefficient of 0.812 suggests that those who caught a lot of catches with one hand also caught a lot of catches with the other. When E and I (possibly left handers) are included the correlation coefficient of 0.0477 suggests no association between the number of catches with each hand.
E1
E1
2
Total 7
5(a) 99% confidence interval for mean
178.5 ± 2.5758 × 3/√90
178.5 ± 0.8145 177.69 − 179.31
B1M1
m2
A1
5
(b) Sample is large. Sample mean may be assumed to be Normally distributed by Central Limit Theorem.
E1 E1
2
Total 7
6(a)(i) 115/150 = 0.767 B1 1 acf
(ii) 25/29 = 0.862 M1A1 2 acf
(iii) 90/150 = 0.6 M1A1 2 acf
(b)(i) 25/29 × 85/93 × 5/28 = 0.141 M1 M1A1
3
0.14 – 0.141 (ii) 115/150 × 114/149 × 113/148 = 0.448 M1 A1 2
Total 10

[9]
MS1A (cont)
Question Solution Marks Total Comments
7(a)
See graph on next page M1 A1 B1
3
(b) y = 22.8 + 9.19x
x = 8 y = 96.3 x = 23 y = 234.1
B2 B2
M1A1
6
22.7 – 22.8 9.18 – 9.2 Allow M1 A1 for a and b if method shown
+ line on graph
(c) Residuals
110 – 22.77 – 9.186 × 8 =13.7 165 – 22.77 –- 9.186 × 14 = 13.6 248 – 22.77 – 9.186 × 22 = 23.1
M1
A1
A1
3
M1 method - ignore sign, allow read from graph A1 one correct - ignore sign 13.7 (13 – 14) 13.6 (13 – 14) 23.1 ( 22 – 24) A1 all correct, including sign
(d) Andrew appears to be slowest (all residuals positive / all times longer than predicted by regression line)
E1 1
Total 13 TOTAL 60

[10]
MS1A (cont) Graph for Question 7
260
140
160
240
220
200
180
120
y
8 10 1412 16 18 2220 x
100
24
A
C
E
E
C
A
A
E
C
C

[11]
General Certificate of Education Specimen Unit Advanced Subsidiary Examination
MATHEMATICS MS1B Unit Statistics 1B
In addition to this paper you will require: • an 8-page answer book; • the AQA booklet of formulae and statistical tables; • a sheet of graph paper for use in Question 6; • a ruler. You may use a graphics calculator.
Time allowed: 1 hour 30 minutes
Instructions • Use blue or black ink or ball-point pen. Pencil should only be used for drawing. • Write the information required on the front of your answer book. The Examining Body for this paper
is AQA. The Paper Reference is MS1B. • Answer all questions. • All necessary working should be shown; otherwise marks for method may be lost. • The final answer to questions requiring the use of tables or calculators should normally be given to
three significant figures. Information • The maximum mark for this paper is 75. • Mark allocations are shown in brackets. Advice • Unless stated otherwise, formulae may be quoted, without proof, from the booklet.
abc

[12]
2
1 Jeremy sells a magazine which is produced in order to raise money for homeless people. The probability of making a sale is 0.09 for each person he approaches.
(a) Given that he approaches 40 people, find the probability that he will make: (i) 2 or fewer sales; (3 marks) (ii) more than 5 sales. (2 marks) (b) Find the probability that he will make two sales given that he approaches 16 people.(3 marks) (c) State one assumption you have made in answering parts (a) and (b). (1 mark)
2 (a) A sample of people, who commute regularly from a town in Surrey into London, was asked for an estimate of the time taken on their most recent journey. The replies are summarised below.
Time
(minutes) Frequency
35- 12
45- 54
55- 68
65- 41
85-105 23
Calculate estimates of the mean and the standard deviation of these times. (5 marks) (b) A sample of people who commute regularly from a town in Essex into London was also asked
for an estimate of the time taken on their most recent journey. Their answers had a mean of 64 minutes and a standard deviation of 21 minutes. Compare, briefly, the journey times estimated by commuters from the two towns. (2 marks)
(c) Give two reasons why the data presented in parts (a) and (b) may not adequately represent typical commuting times from the two towns. (2 marks)

[13]
3
3 A cricket team meets for fielding practice. One exercise consists of a cricket ball being thrown at different heights, speeds and angles to one side of a fielder who tries to catch it one handed.
Each member of the team attempts 25 catches with each hand. The number of successful catches are given in the following table.
Fielder A B C D E G H I J K L Left hand 11 13 9 17 21 16 14 8 19 19 20 Right hand 18 17 20 22 14 19 21 15 10 24 23
(a) Calculate the value of the product moment correlation between the number of catches with the
left hand and the number of catches with the right hand. (3 marks) (b) Comment on the performance of fielders E and J. (2 marks) (c) When fielders E and J are omitted from the calculation, the value of the product moment
correlation coefficient between the number of left-handed and the number of right-handed catches is 0.812, correct to three decimal places. Comment on this value and the value you calculated in part (a) (2 marks)
4 The weights of the contents of jars of honey may be assumed to be normally distributed with the standard deviation 3.1 grams. The weights of the contents, in grams, of a random sample of eight jars were as follows:
458 450 457 456 460 459 458 456
(a) Calculate a 95% confidence interval for the mean weight of the contents of all jars. (6 marks) (b) On each jar it states “Contents 454 grams”. Comment on this statement using the given
sample and your results in part (a). (3 marks)
TURN OVER FOR THE NEXT QUESTION
Turn over ►

[14]
4
5 Last year the employees of a firm either received no pay rise, a small pay rise or a large pay rise. The following table shows the number in each category, classified by whether they were weekly paid or monthly paid.
No pay rise Small pay rise Large pay rise
Weekly Paid 25 85 5 Monthly paid 4 8 23
A tax inspector decides to investigate the tax affairs of an employee selected at random. D is the event that a weekly paid employee is selected. E is the event that an employee who received no pay rise is selected. E′ is the event “not E”. (a) Find the value of:
(i) P (D);
(ii) P (D | E ) ;
(iii) P (D ∩ E′ ). (5 marks)
(b) The tax inspector now decides to select three employees. Find the probability that they are all
weekly paid if:
(i) one is selected at random from those who had no pay rise, one from those who had a small pay rise and one from those who had a large pay rise; (3 marks)
(ii) they are selected at random (without replacement) from all the employees of the firm.
(2 marks)
6 [[[[A sheet of graph paper is provided for use in this question.]]]]
Andrew (A), Charles (C) and Edward (E) are employed by the Palace Hotel. Each is responsible for one floor of the building and their duties include cleaning the bedrooms. The number of bedrooms occupied on each floor varies from day to day.
The following table shows 10 observations of the number, x, of bedrooms to be cleaned and the time taken, y minutes, to carry out the cleaning. The employee carrying out the cleaning is also indicated.
Employee A C E E C A A E C C
x 8 22 12 24 19 14 22 16 10 21 y 110 211 132 257 184 165 248 171 97 196

[15]
5
(a) Plot a scatter diagram of the data. Identify the employee by labelling each point.(3 marks) (b) Calculate the equation of the regression line of y on x. Draw the line on your scatter diagram.
(6 marks)
(c) Use your regression equation to estimate the time which would be taken to clean 18 bedrooms. (1 mark)
(d) Calculate the residuals for the three observations when Andrew did the cleaning. (3 marks) (e) Modify your estimate in part (c), given that the 18 bedrooms are to be cleaned by Andrew.
(2 marks)
7 A gas supplier maintains a team of engineers who are available to deal with leaks reported by customers. Most reported leaks can be dealt with fairly quickly but some require a long time. The time (excluding travelling time), X, taken to deal with reported leaks is found to have a mean of 65 minutes and a standard deviation of 60 minutes.
(a) Assuming that the times may be modelled by a normal distribution, find the probability that it
will take:
(i) more than 185 minutes to deal with a reported leak; (3 marks)
(ii) between 50 minutes and 125 minutes to deal with a reported leak. (4 marks) (b) The mean of the times taken to deal with each of a random sample of 90 leaks is denoted
by X .
(i) State the distribution of X . (3 marks)
(ii) Find the probability that X is less than 70 minutes. (2 marks) (c) A statistician consulted by the gas supplier stated that, as the times had a mean of 65 minutes
and a standard deviation of 60 minutes, the normal distribution would not provide an adequate model.
(i) Explain the reason for the statistician’s statement. (2 marks)
(ii) Give a reason why, despite the statistician’s statement, your answer to part (b)(ii)
is still valid. (2 marks)
END OF QUESTIONS

[16]
MS1B Specimen
Question Solution Marks Total Comments
1(a)(i) Binomial n = 40 p = 0.09
P( 2 or fewer ) = 0.2894
B1B1
B1
3
0.289 - 0.29
(ii) P(>5) = 1– P(5 or fewer) = 1– 0.8535 = 0.1465
M1
A1
2
0.146 - 0.147
(b) P(2) = (16×15/2) × 0.092× 0.9114
= 0.260
B1M1
A1
3
0.259 − 0.26
(c) probabilities independent/people selected at random/equivalent
E1 1
Total 9
2(a) Class mid-mark Frequency 40 12 50 54 60 68 75 41 95 23
x = 63.2 s = 15.2
M1
A2A2
5
Allow m1A1 for mean and s.d. if method shown. 63.2 (63.1 − 63.3)
15.2 (15.0 - 15.3)
(b) Journeys from Surrey have similar duration, on average, but are less variable than those from Essex.
E1 E1
2
(c) People asked may not be representative. Times are estimated not measured.
E1 E1
2
Or any other sensible comments e.g. journey time not defined , weather conditions may be extreme etc
Total 9
3(a) 0.0477 B3 3 0.047 − 0.048 allow M2A1 if method shown
(b) E and J held more catches with left than with right hand - all others held more with right than left.
E1
E1
2
(c) Correlation coefficient of 0.812 suggests that those who caught a lot of catches with one hand also caught a lot of catches with the other. When E and J (possibly left handers) are included the correlation coefficient of 0.0477 suggests no association between the number of catches with each hand.
E1
E1
2
Total 7
abc

[17]
MS1B (cont)
Question Solution Marks Total Comments
4(a) x = 456.75 95% confidence interval for mean
456.75 ± 1.96 ×3.1/√8
456.75 ± 2.15 454.60 − 458.90
B1
B1M1 M2
A1
6
(b) The confidence interval provides evidence that the mean contents are greater than 454 grams. However the sample shows that some jars will contain less than 454 grams.
E1 E1 E1
3
E1 confidence interval refers to mean contents E1 evidence mean >454 E1 some individual contents <454
Total 9
5(a)(i) 115/150 = 0.767 B1 1 acf
(ii) 25/29 = 0.862 M1A1 2 acf
(iii) 90/150 = 0.6 M1A1 2 acf
(b)(i) 25/29 × 85/93 × 5/28 = 0.141 M1 M1A1
3 0.14 - 0.141
(ii) 115/150 × 114/149 × 113/148 = 0.448 M1 A1 2 Total 10
6(a)
See graph on next page M1 A1 B1
3
(b) y = 22.8 + 9.19x
x = 8 y = 96.3 x = 23 y = 234.1
B2B2
M1A1
6
22.7 – 22.8 9.18 – 9.2 Allow M1A1 for a and b if method shown
+ line on graph
(c) 188 B1 1 188 – 188.3, allow 190
(d) Residuals
110 – 22.77 – 9.186 × 8 =13.7 165 – 22.77 –-9.186 × 14 = 13.6 248 – 22.77 – 9.186 × 22 = 23.1
M1
A1
A1
3
M1 method - ignore sign, allow read from graph A1 one correct - ignore sign 13.7 (13 – 14) 13.6 (13 – 14) 23.1 ( 22 – 24) A1 all correct, including sign
(e) 188 + 17 = 205 M1 A1
2
Any sensible method 201 – 211
Total 15

[18]
MS1B (cont)
Graph for Question 6
260
140
160
240
220
200
180
120
y
8 10 1412 16 18 2220 x
100
24
A
C
E
E
C
A
A
E
C
C

[19]
MS1B (cont)
Question Solution Marks Total Comments
7(a)(i) ( ) 0260
65185 .z =−=
P(X > 185) = 1 − 0.97725
= 0.02275
M1
M1
A1
3
0.0227 − 0.023
(ii) ( ) 25.060
65501 −=−=z
( ) 0160
651252 .z =−=
P( 50 < X < 125)=
0.84134 − (1 − 0.59871) = 0.440
M1
m1
M1 A1
4
(b)(i) Normal, mean 65, s.d. 60/√90 = 6.32 B1 B1 B1
3 normal may be implied in (b)(ii)
(ii) ( ) 79060
9060
6570 .z =−=
Probability mean of 90 less than 70 is 0.785
M1
A1
2
0.785 − 0.786
(c)(i) Mean is only a little more than one standard deviation above zero. For normal this implies substantial proportion of times would be negative. This is impossible so model must be inadequate.
E1
E1
2
(ii) Mean of large sample will be approximately normally distributed even if parent distribution is not.
E1
E1
2
Total 16 TOTAL 75

[20]
General Certificate of Education Specimen Unit Advanced Level Examination
MATHEMATICS MS2A Unit Statistics 2A
In addition to this paper you will require: • an 8-page answer book; • the AQA booklet of formulae and statistical tables. You may use a graphics calculator.
Time allowed: 1 hour 15 minutes
Instructions • Use blue or black ink or ball-point pen. Pencil should only be used for drawing. • Write the information required on the front of your answer book. The Examining Body for this
paper is AQA. The Paper Reference is MS2A. • Answer all questions. • All necessary working should be shown; otherwise marks for method may be lost. • The final answer to questions requiring the use of tables or calculators should normally be given
to three significant figures. Information • The maximum mark for this paper is 60. • Mark allocations are shown in brackets. Advice • Unless stated otherwise, formulae may be quoted, without proof, from the booklet.
abc

[21]
2
Answer all questions.
1 For her 21st birthday present, Joanne wishes to have a course of driving lessons. In order to select the better driving school available in her area, she decides to compare the recent performances of participants taking lessons at two driving schools P and Q.
These performances are tabulated below.
School P School Q Pass 100 120 Fail 36 24
Use a 2χ test, at the 10% level of significance, to determine whether there is an association between the performance of participants and driving school. (9 marks)
2 The number of vehicles arriving at a toll bridge during a 5-minute period can be modelled by a Poisson distribution with mean 3.6.
(a) State the value for the standard deviation of the number of vehicles arriving at a toll bridge
during a 5-minute period. (1 mark) (b) Find: (i) the probability that at least 3 vehicles arrive in a 5-minute period; (3 marks) (ii) the probability that at least 3 vehicles arrive in each of three successive 5-minute
periods. (2 marks) (c) Show that the probability that no vehicles arrive in a 10-minute period is 0.0007, correct
to four decimal places. (2 marks)

[22]
3
3 At a cinema, the time, T minutes, that customers have to wait in order to collect their tickets has the following probability density function.
−=
0
54118
f
2
)t(
t
)t(
(a) Write down the value of P(T = 4). (1 mark) (b) Show that the median waiting time is 3 minutes. (2 marks) (c) Find the probability that customers have to wait for less than 4 minutes in order to collect
their tickets. (4 marks)
(d) Calculate the mean time that customers have to wait in order to collect their tickets. (4 marks)
4 The random variable X has the following distribution.
x 2 4 8 P(X = x) 8
3 167 16
3 (a) Calculate values for E(X) and Var(X). (3 marks)
(b) A rectangle has sides of length X and
+
X
642 .
(i) Find values for the mean and variance of the area of the rectangle. (4 marks)
(ii) By tabulating the distribution for X
XY 64+= , or otherwise, show that ( ) 5.24E =Y .
(2 marks)
(iii) Hence find the mean value for the perimeter of the rectangle. (3 marks)
Turn over ►
0 t < 3 3 t 5 otherwise

[23]
4
5 Charles is an athlete specialising in throwing the javelin. During practice, he throws a javelin the following distances, in metres.
40.3 39.8 41.6 42.8 39.0 38.6 40.8 41.1
(a) Calculate unbiased estimates of the mean and the variance of the distance thrown. (2 marks) (b) (i) Hence calculate a 95% confidence interval for the mean distance thrown. (5 marks) (ii) State two assumptions that you make in order to do this calculation. (2 marks)
6 A random variable X is normally distributed with mean µ and variance 0.64 . The null hypothesis 50:H0 =µ is to be tested against the alternative hypothesis 50:H1 ≠µ ,
using the 5% level of significance. The mean, X , of a random sample of 40 observations of X is to be used as the test statistic. (a) Write down the distribution of X assuming 0H is true. (3 marks) (b) Explain what is meant by: (i) a Type I error; (ii) a Type II error. (2 marks) (c) Write down the probability of a Type I error. (1 mark) (d) Calculate the acceptance region for X , giving the limits to two decimal places. (5 marks)
END OF QUESTIONS

[24]
MS2A Specimen
Question Solution Marks Total Comments 1
0 : no associationH
B1
100 120 220 36 24 60
136 144 280
B1
Calculate iE : 220 136 106.9280220 144 113.128060 136 29.128060 144 30.9280
× =
× =
× =
× =
5.0−−= ii EOα 2α iE
2α
6.357 40.4 0.3782 0.3572 1.3867 1.3097 total = 3.432
( )2
11 2.706
νχ
==
Reject 0H at the 10% level Evidence at the 10% level to suggest an association between performance and the driving school selected.
M1
M1
M1
A1
B1 B1
E1
Any correct method
Use of ( )2O EE−∑
Attempted use of Yates’ correction awfw 3.4 to 3.5 Any correct interpretation
Total 9
abc

[25]
MS2A (cont)
Question Solution Marks Total Comments 2(a)
(b)(i)
(ii)
(c)
Standard deviation = 90163 .. =
3.6λ = for a 5-minute period Let Y = no. of vehicles arriving in a 5-minute period then ).(~Y 63P0 and P(Y 2)=0.3027 P(Y 3)=1– P (Y 2)
1 0.30270.69730.697
= −==
p = 0.6973 P(at least 3 arrive in 3 succ. 5 min) = ( )30.6973
0.3390460.339
==
let X = no. vehicles arriving in a 10-minute period then ).(~X 27P0 and ( ) 7.2P 0X e−= = 0.0007=
B1
B1 M1
A1
M1
A1
B1
B1
1
3
2
2
1.897 for 3( )p i
ag
Total 7

[26]
MS2A (cont)
Question Solution Marks Total Comments 3(a) ( )P 4 0T = = B1 1
(b)
(c)
(d)
Median = 3 ⇒ ( ) ( )P 3 P 3 0.5T T≤ = > =
)()(f)T( 3533P 21 −××=>
25021 ×× .
0.5=
)4(P– 1)4(P ≥=< TT 4
121 11 ××−=
811 −=
87=
( ) ( ) d 5 d 18
E5
341
3
0
3
∫∫ −+= tttttT
= 5
3
323
0
4
1285
72
−+
ttt
( ) ( )[ ]4
9845
12125
8125
811 −−−+=
= 23242
M1
A1
M1
M1A1
A1
M1
m1
M1
A1
2
4
4
or
∫ =
=
3
0
3
0
32
21
54d
18ttt
Integration attempted (2.9583)
Total 11

[27]
MS2A (cont)
Question Solution Marks Total Comments 4 (a) ( ) 3 7 3
8 16 16E 2 4 8X = × + × + × = 4
B1
(b)(i)
(ii)
( ) 163
167
832 64164 E ×+×+×=X
= 20.5 ( ) ( ) ( )2 2Var E EX X X= −
220.5 4= − 4.5=
Area = 642 2 64A X XX
= + = +
( ) ( ) ( )E E 2 64 2E 64A X X= + = +
2 4 6472
= × +=
( ) ( )Var Var 2 64A X= +
( )4Var4 4.518
X== ×=
XXY 64+=
M1 A1
B1
B1
M1
A1
3
4
Y 34 20 16
P(Y=y) 83
167
163
B1
(iii)
( )16316
16720
8334E ×+×+×=Y
= 24.5
42 += YP
4)(2E)(E += YP =2 × 24.5 + 4 53=
B1
B1
M1
A1
2
3
Total 12

[28]
MS2A (cont)
Question Solution Marks Total Comments 5(a)
∑ ∑ == 3413135 and 324 2 .x
5408
324 .n
xxˆ ==== ∑µ
−×=8
32434.1313571 2
2s
= 1.91
B1
B1
2
awfw 1.90 to 1.91 (s = 1.38)
(b)(i)
(ii)
Confidence Interval for µ
= x ±nst ×
Degrees of freedom = v = 8 – 1 = 7
( ) 365297507 ..t =
is for CI µ∴
89057113652540 ... ±×
1541540 .. ±=
= (39.3, 41.7) distances are normally distributed distances are independent
M1
B1
B1
A1
A1
B1B1
5
2
accept (39.3/4, 41.6/7)
accept random sample
Total 10

[29]
MS2A (cont)
Question Solution Marks Total Comments
6(a)
( )0.016 50,N40
0.6450,N ~~X
B1 M1 A1
3
for Normal and 50 idea of
2
nσ ; correct
(b)(i)
(ii)
Type I error: Reject 0H when 0H true
Type II error: Accepting 0H when 0H incorrect
B1
B1
2
or equivalent or equivalent
(c) ( )P Type I error 0.05= B1 1
(d)
Acceptance region: 1.96z = ±
0.1265n
σ =
50 1.96 0.016± × = ( )49.75,50.25
B1
B1
M1 A1
A1
5
Total 11 TOTAL 60

[30]
General Certificate of Education Specimen Unit Advanced Level Examination
MATHEMATICS MS2B Unit Statistics 2B
In addition to this paper you will require: • an 8-page answer book; • the AQA booklet of formulae and statistical tables. You may use a graphics calculator.
Time allowed: 1 hour 30 minutes
Instructions • Use blue or black ink or ball-point pen. Pencil should only be used for drawing. • Write the information required on the front of your answer book. The Examining Body for this
paper is AQA. The Paper Reference is MS2B. • Answer all questions. • All necessary working should be shown; otherwise marks for method may be lost. • The final answer to questions requiring the use of tables or calculators should normally be given to
three significant figures. Information • The maximum mark for this paper is 75. • Mark allocations are shown in brackets. Advice • Unless stated otherwise, formulae may be quoted, without proof, from the booklet.
abc

[31]
2
Answer all questions.
1 The number of strikes per game, obtained by a tenpin bowler, can be modelled by a Poisson distribution with mean .λ For the first game played, 2.0=λ and, for each subsequent game played, .1.1=λ
A match consists of three consecutive games. (a) Write down the distribution of T, the total number of strikes obtained by a tenpin bowler in
a match. (2 marks) (b) Write down the value of Var(T ). (1 mark) (c) Find the probability that, in a match, the tenpin bowler will obtain a total of between
3 and 5 strikes, inclusive. (3 marks)
2 Charles is an athlete specialising in throwing the javelin. During practice, he throws a javelin the following distances, in metres.
40.3 39.8 41.6 42.8 39.0 38.6 40.8 41.1
(a) Calculate unbiased estimates of the mean and the variance of the distance thrown.
(2 marks)
(b) (i) Hence calculate a 95% confidence interval for the mean distance thrown. (5 marks) (ii) State two assumptions that you need to make in order to do this calculation.
(2 marks)
3 The results of a recent police survey of traffic travelling on motorways produced information about the genders of drivers and the speeds, S miles per hour, of their vehicles, as tabulated below.
S 70 70 < S 90 S > 90
Male 17 40 70 Female 30 25 18
Investigate, at the 1% level of significance, the claim that there is no association between the gender of the driver and the speed of the car. (11 marks)

[32]
3
4 The continuous random variable X has a rectangular distribution with the following probability density function, where k is a constant.
( )
=0
f 61
x
(a) State the value of k. (1 mark) (b) Hence find values for the mean, ,µ and the variance, ,2σ of X. (2 marks) (c) Determine ( )σµ +>XP . (2 marks)
5 At a cinema, the time, T minutes, that customers have to wait in order to collect their tickets has the following probability density function.
−
<
=
otherwise0
53)5(41
3018
)(f
2
tt
tt
t
(a) Write down the value of ( )4P =T . (1 mark) (b) Show that the median waiting time is 3 minutes. (2 marks) (c) Find the probability that customers have to wait for less than 4 minutes in order to collect
their tickets. (4 marks) (d) Calculate the mean time that customers have to wait in order to collect their tickets.
(4 marks)
TURN OVER FOR THE NEXT QUESTION
Turn over
6 x k
otherwise

[33]
4
6 The random variable X has the following probability distribution.
x 2 4 8 ( )xX =P 8
3 167 16
3 (a) Calculate values for ( )XE and ( )XVar . (3 marks)
(b) A rectangle has sides of length X and
+
X642 .
(i) Find values for the mean and variance of the area of the rectangle. (4 marks)
(ii) By tabulating the distribution for ,64X
XY += or otherwise, show that ( ) 5.24=YE .
(2 marks) (iii) Hence find the mean value for the perimeter of the rectangle. (3 marks)
7 An instrument for measuring the speed of passing motorists is tested by a police force.
A car is driven at known speeds along a straight road.
The error (speed recorded by the instrument – actual speed of the car) is observed on eight occasions with the following results in metres per second.
4.2 –2.8 3.7 –5.9 0.2 6.4 4.1 –1.9
Assuming these data to be a random sample from a normal distribution, investigate, at the
5% level of significance, whether the instrument is biased (i.e. whether the mean error differs from zero). (10 marks)
[34]
5
8 A random variable X is normally distributed with mean µ and variance 0.64. The null hypothesis, 50:H0 =µ , is to be tested against the alternative hypothesis, 50:H1 ≠µ ,
using the 5% level of significance. The mean, ,X of a random sample of 40 observations of X is to be used as the test statistic. (a) Write down the distribution of X assuming 0H is true. (3 marks) (b) Explain what is meant by: (i) a Type I error; (ii) a Type II error. (2 marks) (c) Write down the probability of a Type I error. (1 mark) (d) Calculate the acceptance region for X , giving the limits to two decimal places. (5 marks)
END OF QUESTIONS

[35]
MS2B Specimen
Question Solution Marks Total Comments
1(a)
X = number of strikes per game then: X1 ~ Po(0.2) X2 ~ Po(1.1) X3 ~ Po(1.1) ∴ T = X1 + X2 + X3 ~ Po(2.4)
M1 A1
2
(b)
(c)
Var (T ) = 2.4 P(3 ≤ T ≤ 5) = P( T = 3 or 4 or 5) = P( T ≤ 5) – P(T ≤ 2) = 0.9643 – 0.5697 = 0.3946
B1
M1 M1
A1
1
3
awfw 0.394 to 0.395
Total 6 2(a) ∑= 324 and∑ = 34.131352x
5.408
324ˆ ==== ∑n
xxµ
−×=8
32434.1313571 2
2s
= 1.91
B1
B1
2
awfw 1.90 to 1.91 (s = 1.38)
(b)(i)
(ii)
Confidence Interval for µ
nstx ×±=
Degres of freedom = ν = 8 – 1 = 7 t7(0.975) = 2.3 6 5
is for CI µ∴
= 890571.1154.15.40 ±
= 40.5 ± 1.154 = (39.3, 41.7)
distances are normally distributed distances are independent
M1
B1
B1
A1
A1 B1
B1
5
2
Use of Accept (39.3/4 , 41.6/7) Accept random sample
Total 9
abc

[36]
MS2B (cont) Question Solution Marks Total Comments
3 H0: Gender of driver and speed of car are independent H1: Gender of driver and speed of car are associated ν = (3 – 1) (2 – 1) = 2
iO iE ( )2
i i
i
O EE−
17 29.8 5.5284 (5.4980) 40 41.3 0.0394 (0.0409) 70 55.9 3.5679 (3.5565) 30 17.2 9.6178 (9.5256) 25 23.7 0.0685 (0.0713) 18 32.1 6.2072 (6.1935) 2
calcχ = 25.03 (24.89)
210.9)2(2%1 =χ
∴ reject H0 There is (very strong) evidence at the 1% level to suggest an association between the gender of the driver and the speed of the car.
B1
B1
B1
M1 A2
M1
A1
B1
B1
E1
11
awfw 24.5 to 25.5
Total 11

[37]
MS2B (cont) Question Solution Marks Total Comments 4 (a) k = 12 B1 1 (b) µ = 9
σ 2 = 3
B1 B1
2
(c) P(X > µ + σ )
( )39P +>= X
= 6
732.1012 −
= 0.211
M1
A1
2
633 −
Total 5
5(a) P(T = 4) = 0
B1
1
(b)
(c)
(d)
Median = 3 5.0)3(P)3(P =>=≤⇒ TT
)35()3(f)3(P 21 −××=>T
25.021 ××=
= 0.5 P(T < 4) = 1– P(T ≥ 4)
411
211 ××−=
811 −=
87=
∫∫ −+=5
341
3
0
3d)5(d
18)(E tttttT
5
3
323
0
4
1285
72
−+
= ttt
( ) ( )[ ]49
845
12125
8125
811 −−−+=
= 2 2423
M1
A1
M1
M1 A1
A1
M1
m1
M1
A1
2
4
4
or
21
54d
18
3
0
33
0
2=
=∫ ttt
Integration attempted (2.9583)
Total 11

[38]
MS2B (cont) Question Solution Marks Total Comments
6 (a) 163
167
83 842)(E ×+×+×=X
= 4
B1
(b)(i)
(ii)
(iii)
163
167
832 64164)(E ×+×+×=X
= 20.5 Var (X ) = E(X 2) – E2(X ) = 20.5 – 42 = 4.5
642642Area +=
+== X
XXA
64)(E2)642(E)(E +=+= XXA
72
6442=
+×=
)642(Var)(Var += XA
18
5.44)(Var4
=×=
= X
X
XY 64+=
y 34 20 16 P(Y = y) 8
3 167 16
3
163
167
83 162034)( ×+×+×=YE
= 24.5
42 += YP
4)(E2)(E += YP
53
45.242=
+×=
M1
A1
B1
B1
M1
A1
B1
B1
B1
M1
A1
3
4
2
3
Total 12

[39]
MS2B (cont)
Question Solution Marks Total Comments
7
188 === ∑n
xx
925.157
82 ×=s 266.4=s
0:0:
1
0
≠=
µµ
HH
663.0
8266.4
01 =−=t
365.27 ±=t Accept 0H No significant evidence of bias
B1
M1
A1
B1
B1
M1 A1
M1 A1
A1
10
Total 10 8(a)
)016.0,50(N~4064.0,50N~
X
B1
M1 A1
3
For Normal & 50 Idea of
2
nσ ; correct
(b)(i)
(ii)
Type I error: Reject 0H when 0H true Type II error: Accepting 0H when 0H incorrect
B1
B1
2
oe
oe
(c) P( Type I error ) = 0.05
B1
1
(d)
Acceptance region: 96.1±=z
1265.0=n
σ
016.096.150 ×± = (49.75, 50.25)
B1
B1
M1 A1 A1
5
Total 11 TOTAL 75

[40]
General Certificate of Education Specimen Unit Advanced Level Examination
MATHEMATICS MS03 Unit Statistics 3
In addition to this paper you will require: • an 8-page answer book; • the AQA booklet of formulae and statistical tables. You may use a graphics calculator.
Time allowed: 1 hour 30 minutes
Instructions • Use blue or black ink or ball-point pen. Pencil should only be used for drawing. • Write the information required on the front of your answer book. The Examining Body for this
paper is AQA. The Paper Reference is MS03. • Answer all questions. • All necessary working should be shown; otherwise marks for method may be lost. • The final answer to questions requiring the use of tables or calculators should normally be given
to three significant figures. Information • The maximum mark for this paper is 75. • Mark allocations are shown in brackets. Advice • Unless stated otherwise, formulae may be quoted, without proof, from the booklet.
abc

[41]
2
Answer all questions.
1 In a local government election, 40% of adults voted. The random variable V denotes the number who voted out of a random sample of 200 adults.
(a) (i) Write down the probability distribution for V. (1 mark) (ii) Write down an appropriate distributional approximation for V. (1 mark) (iii) Find an approximate value for ( ).90P >V . (3 marks)
(b) Only 5% of those who voted in the election voted for candidate A.
(i) Find the probability that an adult, chosen at random, voted for candidate A. (1 mark)
(ii) Using a suitable distributional approximation, find the probability that, out of a random sample of 200 adults, more than 5 voted for candidate A. (3 marks)
2 Over a period of one year, a greengrocer sells tomatoes at six different prices (x pence per kilogram). He calculates the average number of kilograms, y, sold per day at each of the six different prices.
His results are as follows.
x 99 105 110 120 125 130
y 97 88 80 62 68 59
(a) Calculate the value of the product moment correlation coefficient. (3 marks)
(b) (i) Assuming that these data are a random sample from a bivariate distribution with correlation coefficient ρ, investigate, at the 1% level of significance, the hypothesis that ρ < 0 . (4 marks)
(ii) Interpret your result in the context of this question. (1 mark)

[42]
3
3 To travel to school in the morning, Sam either catches the bus, cycles or gets a lift with her father. The probabilities for these three modes of travel are 0.3, 0.3 and 0.4, respectively.
The probability that Sam is late for school is:
0.4 when she catches the bus;
0.5 when she cycles;
0.1 when she gets a lift with her father.
(a) Find the probability that, on a particular morning, Sam cycles to school and arrives late. (2 marks)
(b) Sam is late for school one morning. Find the probability that she cycled to school that morning. (4 marks)
4 (a) The random variable X has a Poisson distribution with parameter λ . Prove that the mean of X is λ . (3 marks)
(b) The daily number of missed appointments at a dental surgery can be modelled by a
Poisson distribution with mean 1.8. In an attempt to reduce this figure, the surgery publicised the introduction of fines for
missed appointments.
(i) During the first 5 days after the fines were introduced, there was a total of 6 missed appointments. Use a test with the 10% level of significance to show that there is insufficient evidence to conclude that the introduction of fines has succeeded in its aim. (5 marks)
(ii) A dentist at the surgery suggested that the number of missed appointments should be
monitored over a much longer period of time. Subsequently, there was a total of 297 missed appointments during 180 days. Test, again at the 10% level of significance, the claim that the mean daily number of missed appointments is now less than 1.8.
(8 marks)
TURN OVER FOR NEXT QUESTION
Turn over

[43]
4
5 The random variable L has mean 65 and variance 16. The random variable S has mean 50 and variance 9. Variables L and S are independent and the random variable D is given by
SLD 54 −=
(a) (i) Show that D has mean 10. (2 marks)
(ii) Find the value of the variance of D. (2 marks)
(b) The weights of large eggs are normally distributed with mean 65 grams and standard deviation 4 grams. The weights of standard eggs are normally distributed with mean 50 grams and standard deviation 3 grams.
One large egg and one standard egg are chosen at random. Find the probability that the weight of the standard egg is more than
54 of the weight of the large egg. (5 marks)
6 It is claimed that women are faster than men at solving anagrams. To investigate the claim, the same list of anagrams was given to random samples of 110 men and 125 women under identical experimental conditions. The time, in minutes, taken by each person to solve the anagrams was recorded.
The results are summarised in the table below, together with known values for the population standard deviations.
Sample Size Sample Mean Population Standard Deviation
Men (M) 110 15.4 minutes 2.1 minutes Women (F) 125 14.9 minutes 1.8 minutes
(a) A hypothesis test is to be applied to these data to determine whether, on average, men take longer than women to solve anagrams.
Stating null and alternative hypotheses concerning the population means Mµ and Fµ , and using the 5% level of significance, find the critical region of this test.
Hence determine whether the evidence supports the claim that women are faster than men at solving anagrams. (8 marks)
(b) If the alternative hypothesis states that 3.0=− FM µµ , find the power of the test. (5 marks)

[44]
5
7 A company is introducing a new brand of toothpaste. The company’s marketing department is investigating people’s opinions of the new brand by giving out free samples and asking people to compare the new brand with their usual brand.
(a) From a random sample of 300 people, 129 preferred the new brand of toothpaste to their usual brand.
(i) Calculate an approximate 98% confidence interval for the proportion of people who prefer the new brand to their usual brand. (6 marks)
(ii) Comment on the evidence for claiming that the majority of people prefer the new brand. (1 mark)
(b) In a further survey, 200 people aged under 25 and 250 people aged 25 or over were asked their opinion. The results are summarised below.
Age (years) Sample size Proportion who preferred new brand
Under 25 200 0.47 25 or over 250 0.38
(i) Calculate an approximate 98% confidence interval for the difference between the proportions of people aged under 25 and those aged 25 or over who prefer the new brand of toothpaste. (6 marks)
(ii) Hence determine whether people aged under 25 are more likely than those aged 25 or over to prefer the new brand of toothpaste. (1 mark)
END OF QUESTIONS

[45]
MS03 Specimen
Question Solution Marks Total Comments
1(a)(i) V ~ B(200, 0.4) B1 1
(ii) ( )48,80N~V B1 1
(iii) P(V > 90) =P
−>48
805.90z
= P ( )52.1>z = 1 – 0.93574 = 0.0643 (3 s f)
M1
A1
A1
3
Condone no continuity correction (1.44) 0.064 to 0.066 ; cao
(b)(i) P(voted for A)
= 02.005.04.0 =×
B1
1 cao
(ii) X ~ B(200, 0.02) ≈ Poisson(4)
P(X > 5) = 1 – P(X ≤ 5) = 0.215
B1 M1 A1
3
Use of Poisson
Total 9 2(a) r = –0.962 B3
3 awfw –0.962 to –0.961 Allow M2 A1 if method shown
(b)(i) H0: ρ = 0
H1: ρ < 0 n = 6, α = 1% Critical value of coefficient = –0.8822 –0.962 < –0.8822 Reject H0 at 1% level. Evidence suggests that ρ < 0
B1
B1 M1
A1
4
Both Accept positive value
(ii) Fewer tomatoes are sold when price is higher.
E1
1
Total 8
abc
[46]
MS03 (cont) Question Solution Marks Total Comments
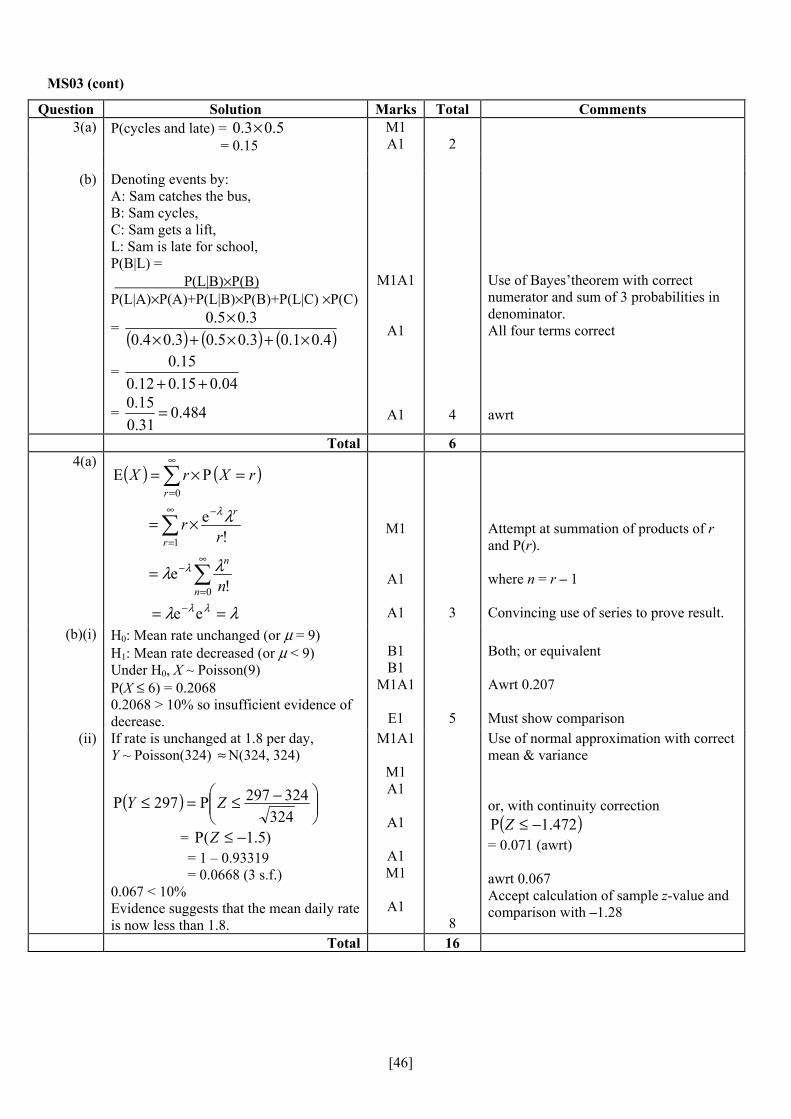
3(a) P(cycles and late) = 5.03.0 × = 0.15
M1 A1
2
(b) Denoting events by:
A: Sam catches the bus, B: Sam cycles, C: Sam gets a lift, L: Sam is late for school, P(B|L) = P(L|B)×P(B) P(L|A)×P(A)+P(L|B)×P(B)+P(L|C) ×P(C)
= ( ) ( ) ( )4.01.03.05.03.04.03.05.0
×+×+××
= 04.015.012.0
15.0++
= 484.031.015.0 =
M1A1
A1
A1
4
Use of Bayes’theorem with correct numerator and sum of 3 probabilities in denominator. All four terms correct awrt
Total 6 4(a)
( ) ( )
λλ
λλ
λ
λλ
λ
λ
==
=
×=
=×=
−
∞
=
−
∞
=
−
∞
=
∑
∑
∑
ee
!e
!e
PE
0
1
0
n
n
r
r
r
n
rr
rXrX
M1
A1
A1
3
Attempt at summation of products of r and P(r). where n = r – 1 Convincing use of series to prove result.
(b)(i) H0: Mean rate unchanged (or µ = 9) H1: Mean rate decreased (or µ < 9) Under H0, X ~ Poisson(9) P(X ≤ 6) = 0.2068 0.2068 > 10% so insufficient evidence of decrease.
B1 B1
M1A1
E1
5
Both; or equivalent Awrt 0.207 Must show comparison
(ii) If rate is unchanged at 1.8 per day, Y ~ Poisson(324) ≈ N(324, 324)
( )
−≤=≤324
324297P297P ZY
= )5.1(P −≤Z = 1 – 0.93319 = 0.0668 (3 s.f.) 0.067 < 10% Evidence suggests that the mean daily rate is now less than 1.8.
M1A1
M1 A1
A1
A1 M1
A1
8
Use of normal approximation with correct mean & variance or, with continuity correction
( )472.1P −≤Z = 0.071 (awrt) awrt 0.067 Accept calculation of sample z-value and comparison with –1.28
Total 16

[47]
MS03 (cont) Question Solution Marks Total Comments
5(a)(i) E(D) = 4E(L) – 5E(S) = 260 – 250 = 10
M1 A1
2
(ii) Var(D) = 42Var(L) + 52Var(S) = 256 + 225 = 481
M1
A1
2
(b) L ~ N(65, 42); S ~ N(50, 32)
> LS
54P =
>− 0
54P LS
= ( ) ( )0P045P <=>− DLS D ~ N(10, 481)
( )
−<=<481
100P0P ZD
= ( )456.0P −<Z = 0.322 to 0.327
M1
A1
M1 A1√
A1
5
√ on part (a) (ii)
Total 9 6(a) H0: FM µµ =
H1: FM µµ > Under H0, using central limit theorem,
~FM XX − N
+
1258.1
1101.2,0
22
= N(0, 0.0660) One-tailed test at 5% level so z = 1.6449 Critical region is
0660.06449.1 ×>− FM XX ie. 423.0>− FM XX From the sample data, 5.0=− FM xx Reject H0. The evidence supports the claim.
B1
M1
A1
B1
M1 A1
B1 A1√
8
both may be implied awfw 0.42 to 0.43 √ on critical region
(b) H1: 3.0=− FM µµ
Under H1, ~FM XX − N(0.3, 0.0660) Power of test = P ( )1H|423.0>− FM XX
= P
−>0660.0
3.0423.0Z
= 1 – Φ(0.479) = 0.316
B1
M1 M1 A1√
A1
5
may be implied √ on critical value awfw 0.31 to 0.32
Total 13

[48]
MS03 (cont) Question Solution Marks Total Comments
7(a)(i)
43.0300129ˆ ==p
B1
cao
98% confidence interval so z = 2.3263
Standard error =300
57.043.0 ×
B1 M1 A1
98% confidence limits are
30057.043.03263.243.0 ×±
M1
giving (0.363 to 0.364, 0.496 to 0.497)
A1√
6
√ on p̂ and se
(ii) Confidence interval lies below 50% so the claim is not supported.
B1
1
(b)(i) Denoting proportions of younger and older people by Xp and Yp respectively,
09.0ˆˆ =− YX pp
B1
cao
Estimated standard error for YX pp − is
25062.038.0
20053.047.0 ×+×
= 0021879.0 98% confidence limits for YX pp − :
0021879.03263.209.0 ×± giving (-0.0188, 0.199)
M1 A1
A1
M1 A1
6
(ii) Zero lies within confidence interval so not enough evidence for larger proportion.
E1
1
Total 14 TOTAL 75

[49]
General Certificate of Education Specimen Unit Advanced Level Examination
MATHEMATICS MS04 Unit Statistics 4
In addition to this paper you will require: • an 8-page answer book; • the AQA booklet of formulae and statistical tables. You may use a graphics calculator.
Time allowed: 1 hour 30 minutes
Instructions • Use blue or black ink or ball-point pen. Pencil should only be used for drawing. • Write the information required on the front of your answer book. The Examining Body for this
paper is AQA. The Paper Reference is MS04. • Answer all questions. • All necessary working should be shown; otherwise marks for method may be lost. • The final answer to questions requiring the use of tables or calculators should normally be given
to three significant figures. Information • The maximum mark for this paper is 75. • Mark allocations are shown in brackets. Advice • Unless stated otherwise, formulae may be quoted, without proof, from the booklet.
abc

[50]
2
Answer all questions.
1 When an automatic bottling machine is working properly, the volume of liquid delivered into each bottle can be assumed to be normally distributed with standard deviation 0.5 ml. On a certain day, the Quality Control Manager believes that the standard deviation is larger than this. He therefore measures the contents of six randomly selected bottles with the following results.
Contents (ml) 204.1 202.8 205.0 203.6 203.9 202.0
Investigate the Quality Control Manager’s belief at the 10% level of significance. (9 marks)
2 The times, T minutes, between successive telephone calls to a small business can be assumed to be exponentially distributed with mean 10.
(a) (i) Write down, in full, the probability density function of T. (2 marks) (ii) Using integration, obtain an expression, valid for t ≥ 0, for the distribution function of T. (3 marks) (b) A call is received at 11.00 am. Find the probability that the next call is received:
(i) before 11.15 am; (2 marks) (ii) between 11.10 am and 11.20 am. (2 marks)
3 Independent observations 1X , 2X and 3X are made on the random variable X which has mean µ and variance 2σ .
(a) Determine which of the following random variables are unbiased estimators for µ .
R = 31
1X + 21
2X + 61
3X
S = 53
1X + 103
2X + 51
3X
T = 43
1X + 21
2X – 41
3X
(5 marks) (b) Calculate the variance of those estimators which are unbiased. (3 marks)
(b) Hence state, giving a reason, which of these estimators is the best unbiased estimator for .µ (1 mark)

[51]
3
4 Eight patients have their pulse rates, in beats per minute, measured before and after receiving a certain treatment. The results, including the decrease in pulse rate for each patient, are given in the table.
Patient A B C D E F G H Before 73.2 69.1 76.9 75.6 68.8 79.5 69.9 74.3 After 70.8 65.7 77.5 69.2 71.1 77.6 67.9 70.4 Decrease 2.4 3.4 –0.6 6.4 –2.3 1.9 2.0 3.9
Using a t-test, investigate, at the 5% significance level, whether this treatment decreases, on average, patients’ pulse rates. (9 marks)
5 A six-sided die has the numbers 1, 2, 3, 4, 5 and 6 on its faces. The random variable R denotes the number of independent throws of the die needed to first obtain a score of either 5 or 6.
Assuming that the die is unbiased, the probability model for R is:
P(R = r) =
( )( )
32
31
0
1−r
otherwise.
...,3,2,1=r
The frequency table below shows the results of 243 observations of R.
Number of throws, r 1 2 3 4 5 6 Frequency, f 97 58 29 19 12 28
Using a χ 2 goodness of fit test and the 5% level of significance, test the hypothesis that the die is unbiased. (11 marks)
Turn over ►

[52]
4
6 The random variable X follows the probability distribution
P(X = r) = 1−rq p for r = 1,2…….
where p + q = 1. (a) Prove that: (i) ( ) pΧ 1=Ε ; (3 marks)
(ii) Var ( ) 2p
qX = . (5 marks)
(b) In the case when p = 0.4, find the value of n such that
P (X > n) < 0.001 (4 marks)
7 Radha, a gardener, buys 12 tomato plants: 6 of variety X and 6 of variety Y. She plants these in her greenhouse and she keeps a record of the total yield, in kilograms, from each plant. She obtains the following results.
Variety X 3.7 4.9 2.8 5.3 4.6 3.3 Variety Y 5.8 4.1 2.9 6.3 3.8 5.0
You may assume that these are random samples from populations distributed N( Xµ , 2
Xσ ) and N( Yµ , 2
Yσ ) respectively.
(a) Test, at the 5% significance level, the hypotheses
0H : 2Xσ = 2
Yσ against 1H : 2Xσ ≠ 2
Yσ . (7 marks)
(b) (i) Obtain a 95% confidence interval for Xµ – Yµ . (7 marks) (ii) State, giving a reason, whether your result in part (b)(i) indicates a difference
between the mean yields of the two varieties. (2 marks)
END OF QUESTIONS
[53]
abc MS04 Specimen
Question Solution Marks Total Comments
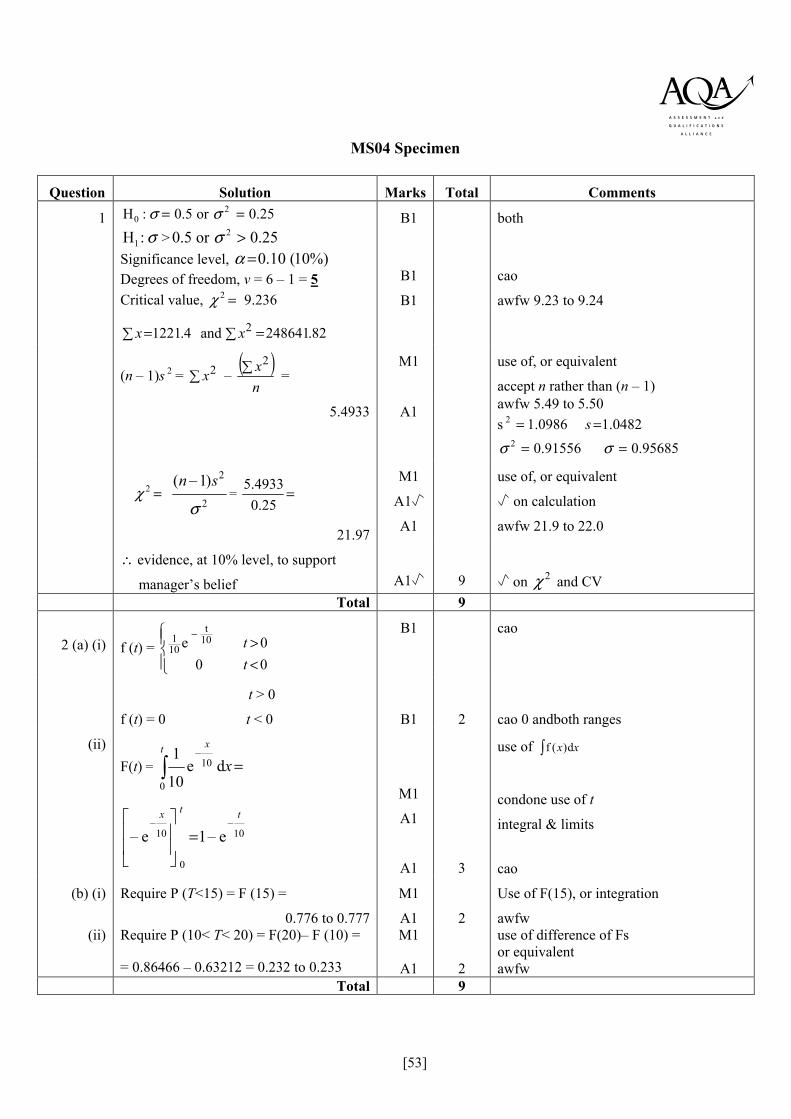
1 25.0or5.0:H 20 == σσ
σ:H1 > 25.0or5.0 2 >σ Significance level, %)10(10.0=α Degrees of freedom, v = 6 – 1 = 5 Critical value, =2χ 9.236
B1
B1
B1
both
cao
awfw 9.23 to 9.24
82.248641and4.1221 2 =∑ ∑= xx
(n – 1)s 2 = ∑ 2x – ( )
nx∑ 2
= M1 use of, or equivalent
accept n rather than (n – 1) 5.4933 A1 awfw 5.49 to 5.50
s 0482.10986.12 == s95685.091556.02 == σσ
=2χ2
2)1–(
σ
sn= =
25.04933.5
21.97
M1
A1
A1
use of, or equivalent
on calculation
awfw 21.9 to 22.0
∴ evidence, at 10% level, to support
manager’s belief
A1
9
on 2χ and CV Total 9
2 (a) (i) f (t) =
<>
−
000e 10
t
101
tt
B1 cao
t > 0
f (t) = 0 t < 0
B1
2
cao 0 andboth ranges
(ii) F(t) = =∫ x
xt
de10
110
–
0
10–
0
10–
e–1e–ttx
=
M1
A1
A1
3
use of ∫ xx d)(f
condone use of t
integral & limits
cao
(b) (i) Require P (T<15) = F (15) =
0.776 to 0.777
M1
A1
2
Use of F(15), or integration
awfw (ii) Require P (10< T< 20) = F(20)– F (10) =
= 0.86466 – 0.63212 = 0.232 to 0.233
M1
A1
2
use of difference of Fs or equivalent awfw
Total 9

[54]
MS04 (cont)
Question Solution Marks Total Comments
3 (a) ( )
++= 321 6
121
31EE XXXR
( ) ( ) ( )321 E61E
21E
31 XXX ++= M1 Used on any one of R, S, T
µµµ61
21
31 ++= A1
( ) µµµ51
103
53E ++=S A1
µ1011=
( ) µµµ41
21
43E −+=T A1
∴R and T are unbiased A1 5
(b) ( ) ( ) ( ) ( )321 Var361Var
41Var
91Var XXXR ++=
M1 Use of any answer from (a)
222
361
41
91 σσσ ++=
2
187 σ= A1
222
161
41
169)(Var σσσ ++=T
2
87 σ= A1 3
(c) R best (smaller variance) E1 1 Total 9
4 0:0: 100 >= DHH µµ B1 Both 718 =−=ν B1 cao 895.1=critt B1 awfe 1.89 to 1.90
∑ ∑ == 75.861.17 2dd
1375.2
81.17 ==d B1 awfw 2.13 to 2.14
17125.7
81.1775.86
71 2
2 =
−=dS B1 awrt 7.17 ( )8/67.2=dS
817125.7
01375.2 −=calct M1
A1
use of
on Sx and
26.2to25.2= A1 awfw, accept 2.25 or 2.26 ∴ evidence, at 5% level, that mean pulse
rate decreases A1 9 on critcalc tt and
Total 9

[55]
MS04 (cont)
Question Solution Marks Total Comments
5 0H : biased 1H : unbiased B1 At least 0H
516 =−=ν B1 cao
070.112 =critχ B1 awrt 11.1
r o ( )rR =P
e ( )eeo 2−
1 97 31 81 3.16 M1 Probs 1 to 5
2 58 92 54 0.30 M1 Prob ( )∑ =≥ 16 pr
6 29 274 36 1.36 M1 pe 243=
4 19 818 24 1.04
5 12 24316
16 1.00 A2,1 2 for all 6 e awrt integer
6≥ 28 24332 32 0.50 1 for 4 or 5 e awrt integer
∑ 243 1 243 7.36
( )∑ =−= 50.7to25.7
22
eeo
calcχ M1 A1
use of awfw
∴ no evidence, at 5% level, that die is biased
A1 11 on 22 and critcalc χχ
Total 11

[56]
MS04 (cont)
Question Solution Marks Total Comments
6(a) ( )....pq 2 p.1) 2 ++=Ε x
= p 2pp= ( ).......q3q21 2 +++
= p ( )q1− 2−
= p1
M1
M1
A1
3
Accept Methods
Using M.G.F.or P.G. F., which may be quoted, without proof, if known.
(ii) ( ).......
3.2.1 22222 +++= pgpgpxE
= p ( )......941 2 +++ qg
= p ( ){ .....631 2 +++ qq
( )......631 2 ++++ qqq
= p ( ){ ( ) 33 q1qq1 −− −+− }
Var ( ) 21p=× + 2
1p
= 2pq
M1
A1
M1
A1
5
(b) ( )( ) 999.0
6.016.014.0 >
−− n
001.06.0 <n
( )5.136.0log
001.0log =>n
14 trials required
M1
M1
M1
A1
4
use of
M2 if written down immediately
Total 12

[57]
MS04 (cont)
Question Solution Marks Total Comments
7 ∑∑ == 68.1056.24 2xx
∑∑ == 99.1379.27 2yy
(a) 221
220 :H:H yxyx σσσσ ≠=
521 == νν B1 cao both
15.7=critF B1 cao (accept 140.015.7 1 =− )
964.066.2468.105
51 22 =
−=xS B1 awfw 0.960 to 0.970
651.1
69.2799.137
51 22 =
−=yS B1 awfw 1.650 to 1.652
accept 1.65
72.1to71.1964.0651.1 ==calcF
M1
A1
use of
awfw ∴No evidence, at 5% level, to reject
equal variances
A1
7
on calcF and critF (b)(i)
266651.15964.05ˆ 2
−+×+×=σ M1 use of
=1.305 to 1.315 A1 awfw
55.0−=− yx B1 cao 102–66 =+=ν B1 cao ( ) 228.2975.010 =t B1 awfw 2.22 to 2.23 CI is
61
613075.1228.255.0 +±−
M1
(-2.03 to –2.01, 0.91 to 0.93) A1 7 awfw (ii) No, since the CI contains zero B1 on CI
E1 2 Total 16 TOTAL 75