general elections 2016-17 analysis - home - state election
TRANSCRIPT
General Elections 2016-17
ANALYSISMunicipal Corporations & Municipal Councils
STATE ELECTION COMMISSIONMAHARASHTRA
i
2017 General Elections 2016-2017
GENERAL ELECTIONS 2016-17
ANALYSIS
Municipal Corporations & Municipal Councils
ii
2017 General Elections 2016-2017
Compiled by:
State Election Commission Maharashtra
State Election Commission Team:
Shri. Avinash Sanas – Deputy Commissioner
Mrs. Pranali Ghonge Jaybhaye - Assistant Commissioner
Shri. Heramb Sathye, Mumbai University
Shri. Abin Johnson, Mumbai University
Gokhale Institute of Politics and Economics Team:
Mrs. Manasi Phadke
Mrs. Anjali Phadke
DATA SOURCE:
MahaOnline software and Google Sheet (data as entered by Local Bodies)
Disclaimer:
The information and analysis contained in this book is based on information provided by the Local
bodies and/or Candidates whilst filing their nomination forms for elections.
The report is only an academic exercise for getting an insight into the dynamics of elections. It is
not intended in anyway to endorse, promote or condemn etc. any Political Party, person or institution
etc.
Although the efforts have been made to make this information accurate and useful, it is advisable
that the reader refers to the source data available with the Local bodies as & when required.
iii
2017 General Elections 2016-2017
Foreword
Indian Constitution was amended in 1992 through 73rd and 74th Amendments in order to
provide the local bodies their rightful place in the political governance of the country. As a
sequel to above, State Election Commissions have been established in each state for conducting
elections to the various local bodies in a free, fair and transparent manner.
2. State Election Commission of Maharashtra which was established in 1994 elects more than
2.5 lakh representatives every 5 years in nearly 28,000 local bodies (27 Municipal
Corporations, 360 Municipal Councils & Nagar Panchayats, 34 Zilla Parishads, 351
Panchayat Samitis and Gram Panchayats approximately 27,781).
3. Data generated during the process of local body elections can be broadly classified in the
following 3 categories:-
(i) Information provided by the candidates while submitting nomination papers and
affidavits,
(ii) Information about the arrangements made by the Election Officers (e.g. Details of
wards, reservation of seats, number of polling stations / counting hall, number of
persons deployed for polling / counting / policing, number of vehicles used etc.)
and
(iii) Information generated during the process of actual elections (e.g. cases of violation
of Model Code of Conduct, progress of polling, repoll, counting, recounting etc.).
4. Collection of the data generated during the election (of more than 12 lakhs contesting
candidates) is extremely important to understand the dynamics of these fiercely contested
elections and for devising future strategies.
5. SEC Maharashtra has conducted 4 rounds of elections, since its inception in 1994, for the
periods 1994-98, 1999-2003, 2004-2008, 2009-2013. Elections for the 5th round (period
2014-2018) are currently being held.
6. Since data of earlier 4 rounds has been collected primarily through traditional methods
pertaining to very few broad parameters (like number of reserved seats, voter turnout, seats
won by different political parties etc.), very little analysis is possible. It may however be
mentioned that sporadic efforts have been made by SEC and enthusiastic field officers from
time to time towards collection of data using modern technology like Excel Sheet, CDs,
emails etc.
iv
2017 General Elections 2016-2017
7. State Election Commission, Maharashtra initiated the process to collect all the possible data
digitally at the time of generation itself from the elections held in 2015.
8. First area in which help of computers and modern technology was taken was to ensure that
all the candidates submit computer software generated nomination papers and affidavits
only. It is heartening to note that nearly 60 to 70 percent candidates filed their nomination
papers and affidavits using software developed by SEC for the elections to 15,000 Gram
Panchayat in 2015 and 210 Municipal Councils held between October 2016 and January
2017 in four phases. All the candidates in the above elections could not submit computer
generated nomination papers and affidavits due to issue of internet connectivity, untrained
man power, lacuna in software etc. However, 100% candidates submitted computer
generated nomination papers / affidavits of all the elections held after January 2017 i.e. 25
Zilla Parishads, 283 Panchayat Samitis and 10 Municipal Corporations and nearly 8000
Grampanchayats till today. This data is now digitally available with the SEC for analysis.
9. The second area in which the help of computers and modern technology was taken is the
collection of data regarding the arrangements etc.. I am happy to mention that this data is
available for all the elections held since October 2016.
10. The third area in which the data is being collected with the help of computers and modern
technology relates to the process of actual elections (e.g. cases of violation of Model Code
of Conduct, progress of polling, repoll, counting, recounting etc.)
11. I am happy that an analysis has been attempted by SEC with the help of Gokhale Institute
of Politics and Economics, Pune of the following data collected between October 2016 and
February 2017.
(i) Analysis of polling and counting data of 210 Municipal Councils; and
(ii) Analysis of nomination / affidavit, polling and counting data of 10 Municipal
Corporations.
12. I congratulate all the officers of SEC Maharashtra and Gokhale Institute of Politics and
Economics who have taken efforts to analyse this data and publish the same in a booklet
form. More important is the fact that all the data of elections is now being collected
digitally at the time of generation itself which would be available to anybody and
everybody for analysis.
Shri. J. S. Saharia
State Election commission
Maharashtra November 3, 2017
v
2017 General Elections 2016-2017
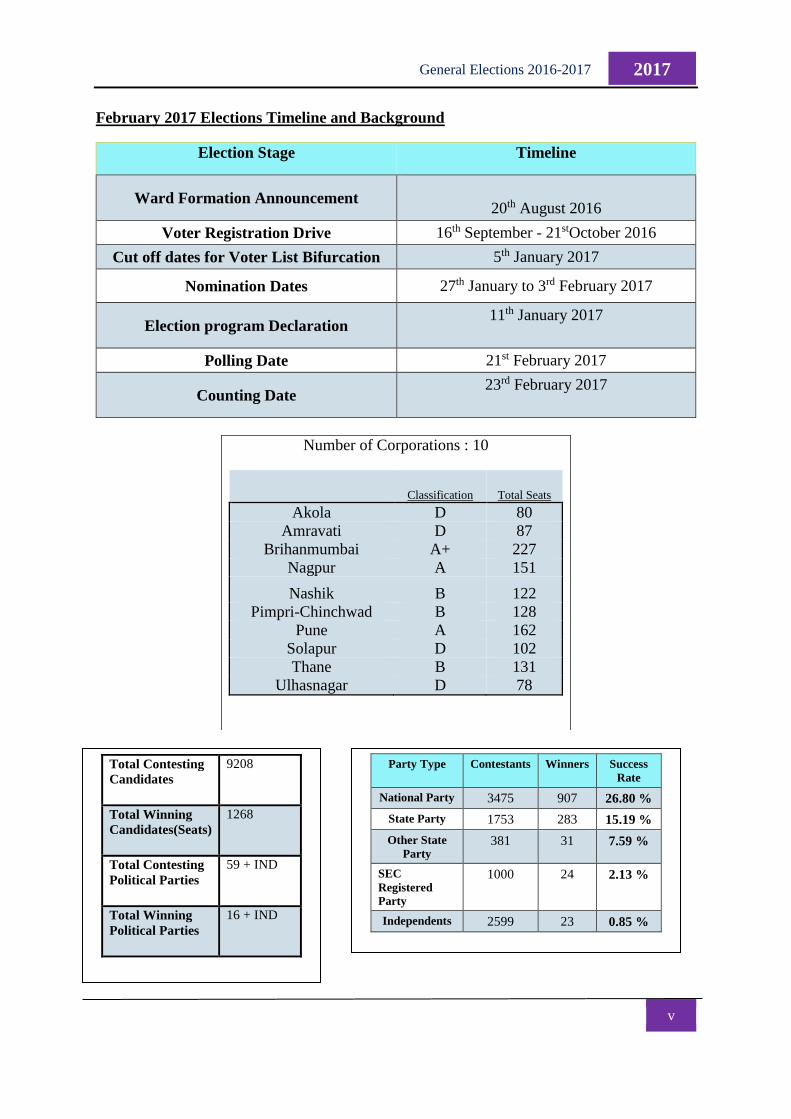
February 2017 Elections Timeline and Background
Election Stage Timeline
Ward Formation Announcement
20th August 2016
Voter Registration Drive 16th September - 21stOctober 2016
Cut off dates for Voter List Bifurcation 5th January 2017
Nomination Dates 27th January to 3rd February 2017
Election program Declaration 11th January 2017
Polling Date 21st February 2017
Counting Date 23rd February 2017
Number of Corporations : 10
Classification Total Seats
Akola D 80
Amravati D 87
Brihanmumbai A+ 227
Nagpur A 151
Nashik B 122
Pimpri-Chinchwad B 128
Pune A 162
Solapur D 102
Thane B 131
Ulhasnagar D 78
Total Contesting
Candidates
9208
Total Winning
Candidates(Seats)
1268
Total Contesting
Political Parties
59 + IND
Total Winning
Political Parties
16 + IND
Party Type Contestants Winners Success
Rate
National Party 3475 907 26.80 %
State Party 1753 283 15.19 %
Other State
Party 381 31 7.59 %
SEC
Registered
Party
1000 24 2.13 %
Independents 2599 23 0.85 %
vi
2017 General Elections 2016-2017
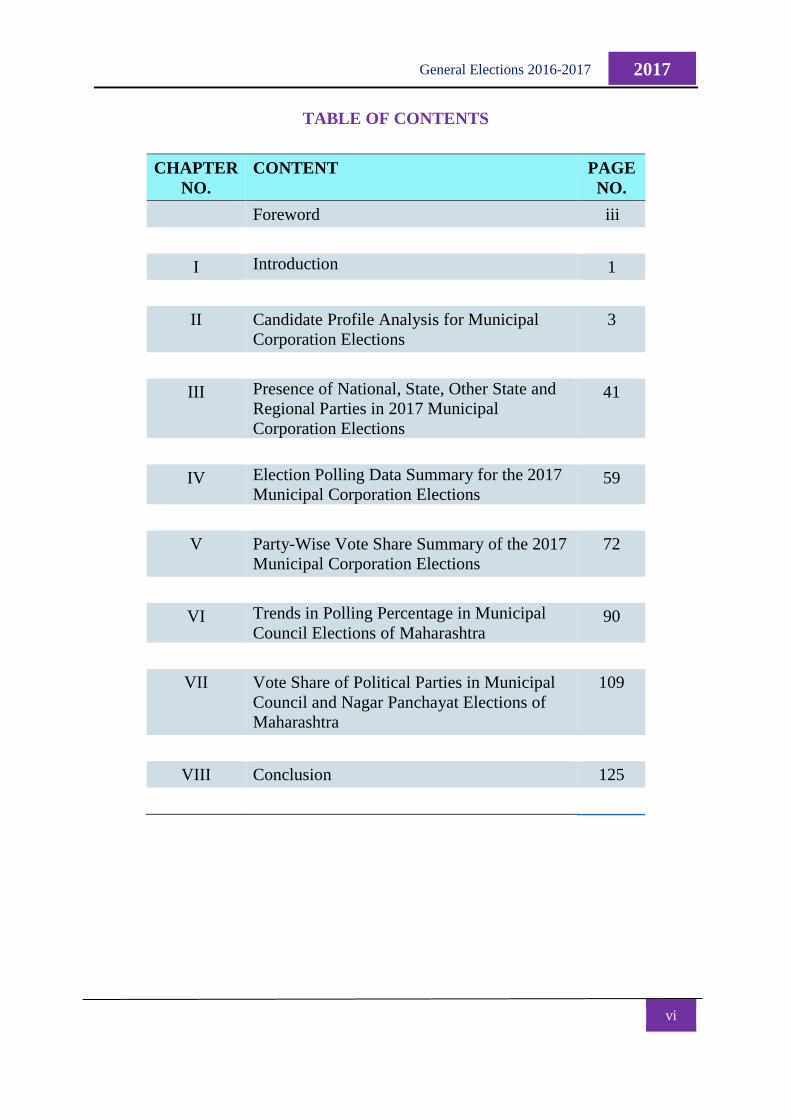
TABLE OF CONTENTS
CHAPTER
NO.
CONTENT PAGE
NO.
Foreword iii
I Introduction 1
II Candidate Profile Analysis for Municipal
Corporation Elections
3
III Presence of National, State, Other State and
Regional Parties in 2017 Municipal
Corporation Elections
41
IV Election Polling Data Summary for the 2017
Municipal Corporation Elections 59
V Party-Wise Vote Share Summary of the 2017
Municipal Corporation Elections
72
VI Trends in Polling Percentage in Municipal
Council Elections of Maharashtra 90
VII Vote Share of Political Parties in Municipal
Council and Nagar Panchayat Elections of
Maharashtra
109
VIII Conclusion 125
vii
2017 General Elections 2016-2017
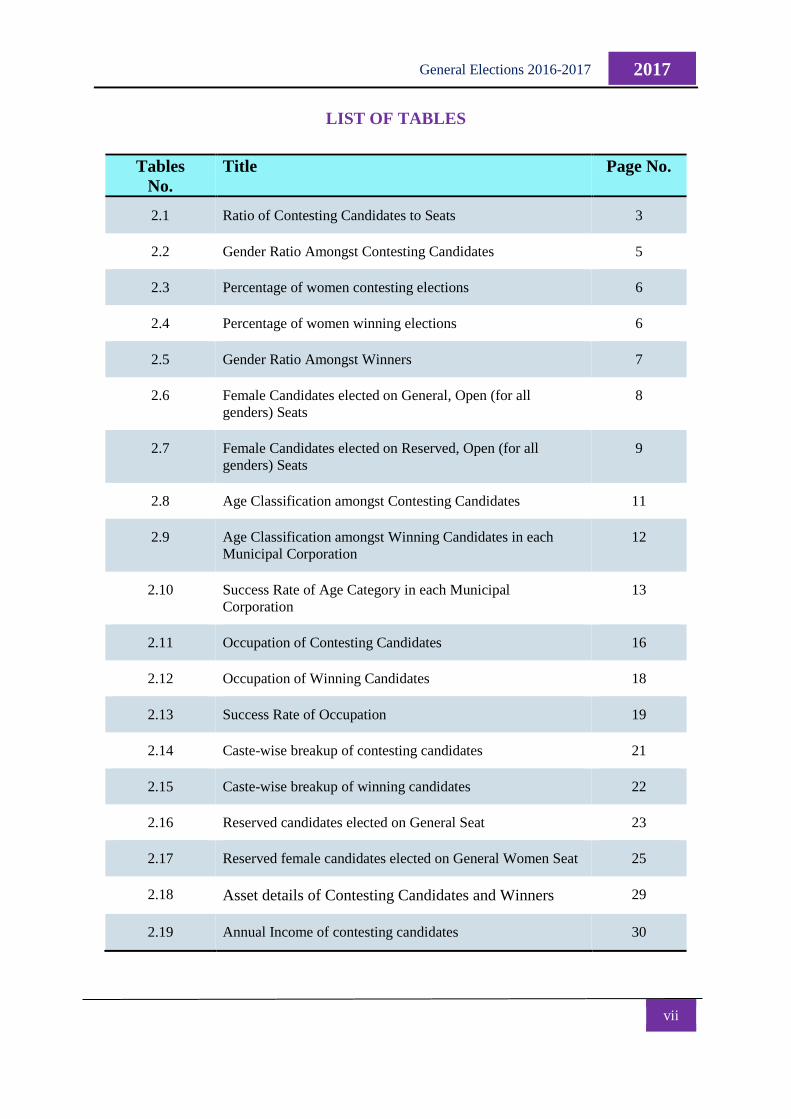
LIST OF TABLES
Tables
No.
Title Page No.
2.1 Ratio of Contesting Candidates to Seats 3
2.2 Gender Ratio Amongst Contesting Candidates 5
2.3 Percentage of women contesting elections 6
2.4 Percentage of women winning elections 6
2.5 Gender Ratio Amongst Winners 7
2.6 Female Candidates elected on General, Open (for all
genders) Seats
8
2.7 Female Candidates elected on Reserved, Open (for all
genders) Seats
9
2.8 Age Classification amongst Contesting Candidates 11
2.9 Age Classification amongst Winning Candidates in each
Municipal Corporation
12
2.10 Success Rate of Age Category in each Municipal
Corporation
13
2.11 Occupation of Contesting Candidates 16
2.12 Occupation of Winning Candidates 18
2.13 Success Rate of Occupation 19
2.14 Caste-wise breakup of contesting candidates 21
2.15 Caste-wise breakup of winning candidates 22
2.16 Reserved candidates elected on General Seat 23
2.17 Reserved female candidates elected on General Women Seat 25
2.18 Asset details of Contesting Candidates and Winners 29
2.19 Annual Income of contesting candidates 30
viii
2017 General Elections 2016-2017
2.20 Annual Income of winning candidates 31
2.21 Success Rate of Annual Income Category 32
2.22 No. of elections previously contested (Contesting candidates) 35
2.23 No. of elections previously contested (Winning candidates) 36
2.24 Success Rate of Past Political Experience 37
2.25 Percentage of contestants with no cases registered against
them in different Municipal Corporations
40
3.1 Contesting Candidates and Winners in each of the Municipal
Corporations
41
3.2 Party-Type wise Contesting Candidates in Municipal
Corporation Election February 2017 (Participation Share)
43
3.3 Party Type wise Winning Candidates in Municipal
Corporation Election February 2017(Winning Share)
44
3.4 Success Rate of Party Types in Municipal Corporation
Elections
45
3.5 Type of Party: Participation Share, Winning Share & Success
Rate
46
3.6 Party-wise Contesting Candidates in each Municipal
Corporation Election February 2017 (Contesting Parties: 59
+ IND)
50
3.7 Party-wise Winning Candidates in each Municipal
Corporation Election February 2017
56
4.1 Total Voter Turnout and Voter Turnout by Gender 59
4.2 Comparison of Polling Percentage in 2012 and 2017
elections
61
4.3 Poll Percentage Difference over the Polling Percentage in the
2012 elections
62
4.4 Polling Percentage, Total voters by Gender, Total votes
polled by gender, wards with highest and lowest polling in
Municipal Corporation of Greater Mumbai
64
ix
2017 General Elections 2016-2017
4.5 Polling Percentage, Total voters by Gender, Total votes
polled by gender, wards with highest and lowest polling in
Municipal Corporation of Akola
64
4.6 Polling Percentage, Total voters by Gender, Total votes
polled by gender, wards with highest and lowest polling in
Municipal Corporation of Amravati
65
4.7 Polling Percentage, Total voters by Gender, Total votes
polled by gender, wards with highest and lowest polling in
Municipal Corporation of Nagpur
65
4.8 Polling Percentage, Total voters by Gender, Total votes
polled by gender, wards with highest and lowest polling in
Municipal Corporation of Pimpri-Chinchwad
66
4.9 Polling Percentage, Total voters by Gender, Total votes
polled by gender, wards with highest and lowest polling in
Municipal Corporation of Pune
66
4.10 Polling Percentage, Total voters by Gender, Total votes
polled by gender, wards with highest and lowest polling in
Municipal Corporation of Solapur
67
4.11 Polling Percentage, Total voters by Gender, Total votes
polled by gender, wards with highest and lowest polling in
Municipal Corporation of Thane
67
4.12 Polling Percentage, Total voters by Gender, Total votes
polled by gender, wards with highest and lowest polling in
Municipal Corporation of Ulhasnagar
68
4.13 Polling Percentage, Total voters by Gender, Total votes
polled by gender, wards with highest and lowest polling in
Municipal Corporation of Nashik
68
4.14 Rule for Assigning Number of Voters to Polling Stations 69
4.15 Number of Polling Stations in each Municipal Corporation 69
4.16 Percentage of NOTA votes in each Corporation 70
4.17 Wards that received highest NOTA within each Corporation
except Municipal Corporation Of Greater Mumbai
71
4.18 Wards that received highest NOTA within Municipal
Corporation Of Greater Mumbai
71
x
2017 General Elections 2016-2017
5.1 Party-wise participation share, winning share and success
rate
72
5.2 Party type-wise Votes and Vote Share 72
5.3 Party-wise Votes and Vote Share 73
5.4 Corporation Party Type-wise Vote Share in each Corporation 76
5.5 Votes secured by National Parties 77
5.6 Votes secured by State Parties 77
5.7 Votes secured by Independent Candidates and NOTA votes 77
5.8 Votes secured by Other State Parties 78
5.9 Votes secured by SEC Registered Parties 78
5.10 Performance of Political Parties in Municipal Corporation Of
Greater Mumbai
80
5.11 Performance of Political Parties in Akola Municipal
Corporation
81
5.12 Performance of Political Parties in Amravati Municipal
Corporation
81
5.13 Performance of Political Parties in Nagpur Municipal
Corporation
82
5.14 Performance of Political Parties in Nashik Municipal
Corporation
82
5.15 Performance of Political Parties in Pimpri Chinchwad
Municipal Corporation
83
5.16 Performance of Political Parties in Pune Municipal
Corporation
83
5.17 Performance of Political Parties in Solapur Municipal
Corporation
84
5.18 Performance of Political Parties in Thane Municipal
Corporation
84
5.19 Performance of Political Parties in Ulhasnagar Municipal
Corporation
85
5.20 Comparison of Seats Won by Political Parties in 10
Municipal Corporations
86
xi
2017 General Elections 2016-2017
LIST OF GRAPHS
Graph No. Title Page No.
2.1 Contesting Candidates per Seat in Municipal Corporations 4
2.2 Percentage of male and female candidates contesting
elections
5
2.3 Overall Success Rate of Age Category 13
2.4 Participation, winning share and success rate of candidates in
different age groups
14
2.5 Occupation Profiles of Contesting Candidates 17
2.6 Participation, winning share and success rate of candidates as
per occupation of the candidate
20
2.7 Success Rate by Occupation of Candidate 20
2.8 Asset holding of Contesting Candidates 27
2.9 Average Assets (Rs. lakhs) declared to be owned by
Candidates of different Political Parties
28
2.10 Participation, Winning Share and Success Rate as per Income
of the Candidates
33
2.11 Success Rate of Candidates having Different Annual Income
Levels
34
2.12 Participation, Winning Share and Success Rate of Candidates
as per Years of Experience in Politics
38
2.13 Success Rate as per Previous Political Experience 39
3.1 Contesting Candidates and Winners in Each of the Municipal
Corporations
42
3.2 Participation Share, Winning Share and Success Rate by
Party Type
46
3.3 Contesting and Winning Candidates in National Parties 47
3.4 Contesting and Winning Candidates in State Parties 47
xii
2017 General Elections 2016-2017
3.5 Contesting and Winning Candidates in Other State Parties 48
3.6 Contesting and Winning Candidates in SEC Registered Party 48
3.7 Contesting and Winning Candidates amongst Independents 49
4.1 Total Voter Turnout 60
4.2 Polling Percentage Comparison: 2012 and 2017 elections 61
4.3 Poll Percentage Difference over the Polling Percentage in the
2012 elections
62
5.1 Vote Share by Party Type 73
5.3 Seat Position of Parties in 2012 and 2017 in MCGM 87
5.4 Seat Position of Parties in 2012 and 2017 in Thane 87
5.5 Seat Position of Parties in 2012 and 2017 in Ulhasnagar 87
5.6 Seat Position of Parties in 2012 and 2017 in Nashik 87
5.7 Seat Position of Parties in 2012 and 2017 in Pune 87
5.8 Seat Position of Parties in 2012 and 2017 in PCMC 87
5.9 Seat Position of Parties in 2012 and 2017 in Solapur 88
5.10 Seat Position of Parties in 2012 and 2017 in Amravati 88
5.11 Seat Position of Parties in 2012 and 2017 in Akola 88
5.12 Seat Position of Parties in 2012 and 2017 in Nagpur 88
5.13 Party-wise Seat Position 2012-17 89
5.14 Change in Seats 2012-17 89
6.1 Division-wise polling percentages in Municipal Councils and
Nagar Panchayat elections in 2016
91
6.2 Voter Turnout in the districts in the different administrative
divisions of Maharashtra
92
6.3 District-wise Polling Percentage in Municipal Councils and
Nagar Panchayats in 2016 elections
94
xiii
2017 General Elections 2016-2017
6.4 Polling Percentage in Municipal Councils and Nagar
Panchayats in 6 Divisions of Maharashtra in 2011 and 2016
95
6.5 Division-wise Increase/ Decrease in Polling Percentage over
2011 elections
96
6.6 District-wise comparison of polling percentage in 2011 and
2016
96
6.7 District-wise Increase/ Decrease in Polling Percentage over
2011 elections
97
6.8 Comparison of Voter Turnouts in 2011 and 2016 in all
Municipal Councils and Nagar Panchayats within Different
Districts of Maharashtra
98
6.9 Polling Percentage in 2016 in the newly formed Municipal
Councils and Nagar Panchayats
105
6.10 Gender-wise polling percentage 106
6.11 Gender-wise Poll Percentage in the Six Administrative
Divisions
107
6.12 Gender-wise Polling Percentage in Districts- Graph A 107
6.13 Gender-wise Polling Percentage in Districts- Graph B 108
7.1 Seats won by different political parties in Municipal Council
and Nagar Panchayat elections in Maharashtra
109
7.2 Seat Won by Different Political in Konkan Division 110
7.3 Seat Won by Different Political in Pune Division 110
7.4 Seat Won by Different Political in Nashik Division 110
7.5 Seat Won by Different Political in Aurangabad Division 110
7.6 Seat Won by Different Political in Amravati Division 111
7.7 Seat Won by Different Political in Nagpur Division 111
7.8 Seat Won by Political Parties in Palghar 112
7.9 Seat Won by Political Parties in Ratnagiri 112
xiv
2017 General Elections 2016-2017
7.10 Seat Won by Political Parties in Sindhudurg 112
7.11 Seat Won by Political Parties in Raigad 112
7.12 Seat Won by Political Parties in Pune 112
7.13 Seat Won by Political Parties in Satara 112
7.15 Seat Won by Political Parties in Sangli 113
7.16 Seat Won by Political Parties in Solapur 113
7.17 Seat Won by Political Parties in Kolhapur 113
7.18 Seat Won by Political Parties in Nashik 113
7.19 Seat Won by Political Parties in Dhule 113
7.20 Seat Won by Political Parties in Nandurbar 113
7.21 Seat Won by Political Parties in Jalgaon 114
7.22 Seat Won by Political Parties in Ahmednagar 114
7.23 Seat Won by Political Parties in Aurangabad 114
7.24 Seat Won by Political Parties in Jalna 114
7.25 Seat Won by Political Parties in Parbhani 114
7.26 Seat Won by Political Parties in Hingoli 114
7.27 Seat Won by Political Parties in Beed 115
7.28 Seat Won by Political Parties in Latur 115
7.29 Seat Won by Political Parties in Osmanabad 115
7.30 Seat Won by Political Parties in Nanded 115
7.31 Seat Won by Political Parties in Amravati 115
7.32 Seat Won by Political Parties in Akola 115
7.33 Seat Won by Political Parties in Buldhana 116
7.34 Seat Won by Political Parties in Washim 116
xv
2017 General Elections 2016-2017
7.35 Seat Won by Political Parties in Yavatmal 116
7.36 Seat Won by Political Parties in Nagpur 116
7.37 Seat Won by Political Parties in Wardha 116
7.38 Seat Won by Political Parties in Chandrapur 116
7.39 Seat Won by Political Parties in Bhandara 117
7.40 Seat Won by Political Parties in Gondia 117
7.41 Seat Won by Political Parties in Gadchiroli 117
7.42 Comparison of Seats Won by Political Parties in 2011 and
2016 Election in Raigad
118
7.43 Comparison of Seats Won by Political Parties in 2011 and
2016 Election in Ratnagiri
118
7.44 Comparison of Seats Won by Political Parties in 2011 and
2016 Election in Sindhudurg
118
7.45 Comparison of Seats Won by Political Parties in 2011 and
2016 Election in Pune
118
7.46 Comparison of Seats Won by Political Parties in 2011 and
2016 Election in Satara
118
7.47 Comparison of Seats Won by Political Parties in 2011 and
2016 Election in Sangli
118
7.48 Comparison of Seats Won by Political Parties in 2011 and
2016 Election in Solapur
119
7.49 Comparison of Seats Won by Political Parties in 2011 and
2016 Election in Kolhapur
119
7.50 Comparison of Seats Won by Political Parties in 2011 and
2016 Election in Nashik
119
7.51 Comparison of Seats Won by Political Parties in 2011 and
2016 Election in Dhule
119
7.52 Comparison of Seats Won by Political Parties in 2011 and
2016 Election in Nandurbar
119
xvi
2017 General Elections 2016-2017
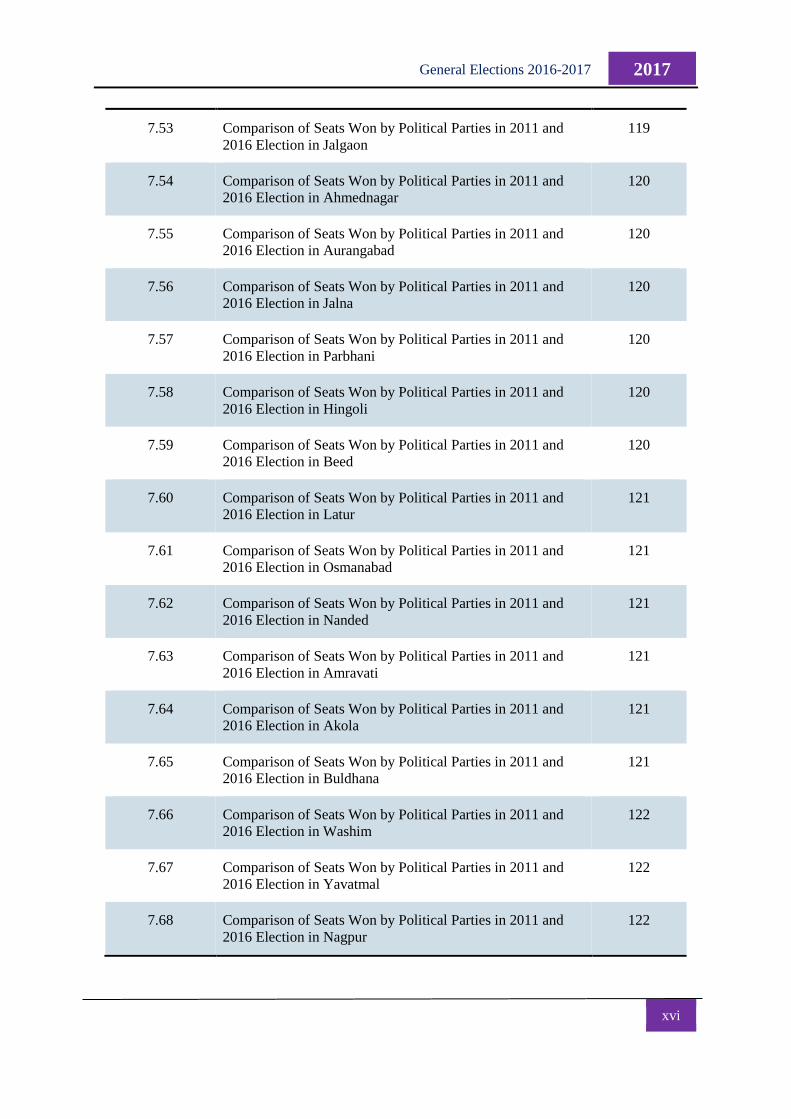
7.53 Comparison of Seats Won by Political Parties in 2011 and
2016 Election in Jalgaon
119
7.54 Comparison of Seats Won by Political Parties in 2011 and
2016 Election in Ahmednagar
120
7.55 Comparison of Seats Won by Political Parties in 2011 and
2016 Election in Aurangabad
120
7.56 Comparison of Seats Won by Political Parties in 2011 and
2016 Election in Jalna
120
7.57 Comparison of Seats Won by Political Parties in 2011 and
2016 Election in Parbhani
120
7.58 Comparison of Seats Won by Political Parties in 2011 and
2016 Election in Hingoli
120
7.59 Comparison of Seats Won by Political Parties in 2011 and
2016 Election in Beed
120
7.60 Comparison of Seats Won by Political Parties in 2011 and
2016 Election in Latur
121
7.61 Comparison of Seats Won by Political Parties in 2011 and
2016 Election in Osmanabad
121
7.62 Comparison of Seats Won by Political Parties in 2011 and
2016 Election in Nanded
121
7.63 Comparison of Seats Won by Political Parties in 2011 and
2016 Election in Amravati
121
7.64 Comparison of Seats Won by Political Parties in 2011 and
2016 Election in Akola
121
7.65 Comparison of Seats Won by Political Parties in 2011 and
2016 Election in Buldhana
121
7.66 Comparison of Seats Won by Political Parties in 2011 and
2016 Election in Washim
122
7.67 Comparison of Seats Won by Political Parties in 2011 and
2016 Election in Yavatmal
122
7.68 Comparison of Seats Won by Political Parties in 2011 and
2016 Election in Nagpur
122
xvii
2017 General Elections 2016-2017
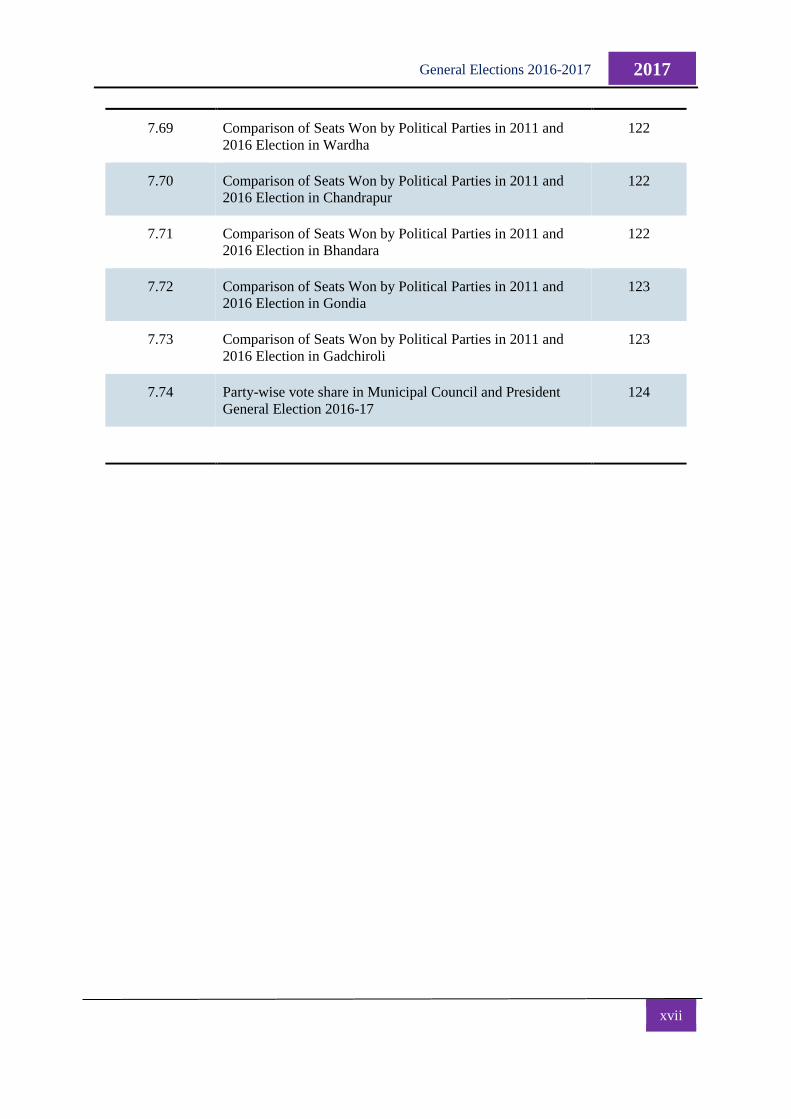
7.69 Comparison of Seats Won by Political Parties in 2011 and
2016 Election in Wardha
122
7.70 Comparison of Seats Won by Political Parties in 2011 and
2016 Election in Chandrapur
122
7.71 Comparison of Seats Won by Political Parties in 2011 and
2016 Election in Bhandara
122
7.72 Comparison of Seats Won by Political Parties in 2011 and
2016 Election in Gondia
123
7.73 Comparison of Seats Won by Political Parties in 2011 and
2016 Election in Gadchiroli
123
7.74 Party-wise vote share in Municipal Council and President
General Election 2016-17
124
xviii
2017 General Elections 2016-2017
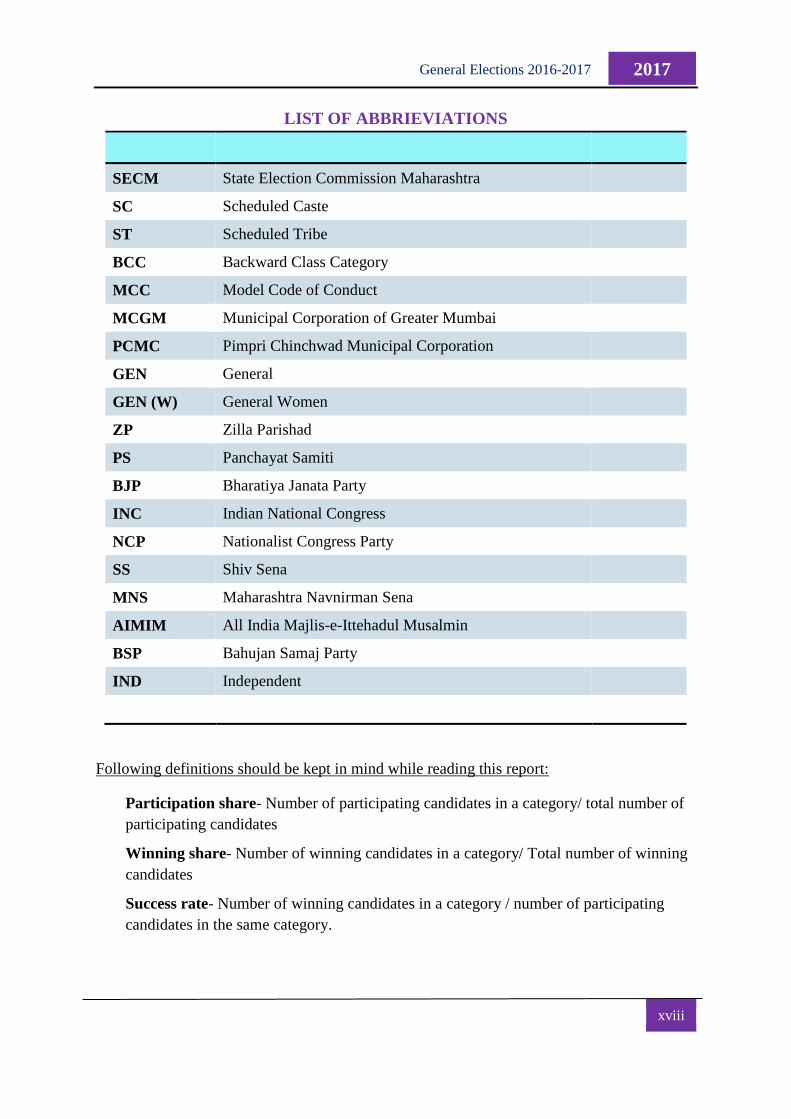
LIST OF ABBRIEVIATIONS
SECM State Election Commission Maharashtra
SC Scheduled Caste
ST Scheduled Tribe
BCC Backward Class Category
MCC Model Code of Conduct
MCGM Municipal Corporation of Greater Mumbai
PCMC Pimpri Chinchwad Municipal Corporation
GEN General
GEN (W) General Women
ZP Zilla Parishad
PS Panchayat Samiti
BJP Bharatiya Janata Party
INC Indian National Congress
NCP Nationalist Congress Party
SS Shiv Sena
MNS Maharashtra Navnirman Sena
AIMIM All India Majlis-e-Ittehadul Musalmin
BSP Bahujan Samaj Party
IND Independent
Following definitions should be kept in mind while reading this report:
Participation share- Number of participating candidates in a category/ total number of
participating candidates
Winning share- Number of winning candidates in a category/ Total number of winning
candidates
Success rate- Number of winning candidates in a category / number of participating
candidates in the same category.
1
2017 General Elections 2016-2017
CHAPTER - I
INTRODUCTION
The 73rd and 74th Amendment to the Constitution, which gave constitutional status to the Panchyat Raj
Institutions (PRI), was passed in 1992. The same amendment provided for the creation of the State
Election Commission of Maharashtra for conduct of elections in urban and rural local self governance
bodies. All urban and rural local body elections in Maharashtra since 1994 have been conducted by the
SECM. While urban bodies include Municipal Corporations, Municipal Councils and Nagar
Panchayats, rural bodies encompass Zilla Parishads, Panchayat Samitis and Gram Panchayats.
In Maharashtra State, at the time of establishment of the SECM, some of the local bodies rural as well
as urban, were already in existence and were functioning with elected members. It was decided to allow
the local bodies to continue with their existence and hold elections in these local bodies as and when a
5-year period of their working came to a close. Thus, in Maharashtra, all local bodies do not go into a
state of election at the same time. Different local bodies, urban and rural, go into a state of elections as
and when the 5-year period of their existence comes to a close.
Since its establishment, the SECM has conducted 4 rounds of elections in all the local bodies. The first
round was from 1994-98, the second round was from 1999-2003, the third round was from 2004-08 and
the fourth one was from 2009-13. From 2014 onwards, the fifth round of elections was conducted by
the SECM across all rural and urban local bodies in Maharashtra. In this publication, it is endeavored
to present data analysis of the urban body elections conducted in the fifth round of elections held by
SECM.
As has been mentioned earlier, Municipal Corporations, Municipal Councils and Nagar Panchayats are
covered under urban bodies. Whilst the schedule for Municipal Corporation elections is created
separately, the Municipal Councils and Nagar Panchayats go concurrently into election mode.
SECM has been collecting election data since 1992; however, the initial four phases of elections saw
data being collected on very few variables. These variables are:
a. Population which will be governed by the local body
b. Proportion of SC population within the total population
c. Proportion of ST population within the total population
d. Total number of wards created within the area governed by the local body
e. Number of seats contested for the area
f. Number of seats reserved for SC, ST, BCC classes
g. Number of seats that fall under General Category
h. Number of seats reserved for women under General, SC, ST, BCC categories
i. Number of voters within the population
j. Number of male and female voters
k. Number of votes cast
l. Number of valid votes cast
m. Voter Turnout Ratio (defined as number of valid votes/ number of eligible voters in the
population)
n. Proportion of votes received by different political parties, coalitions and independent candidates
o. Distribution of seats won by different political parties, coalitions and independent candidates
2
2017 General Elections 2016-2017
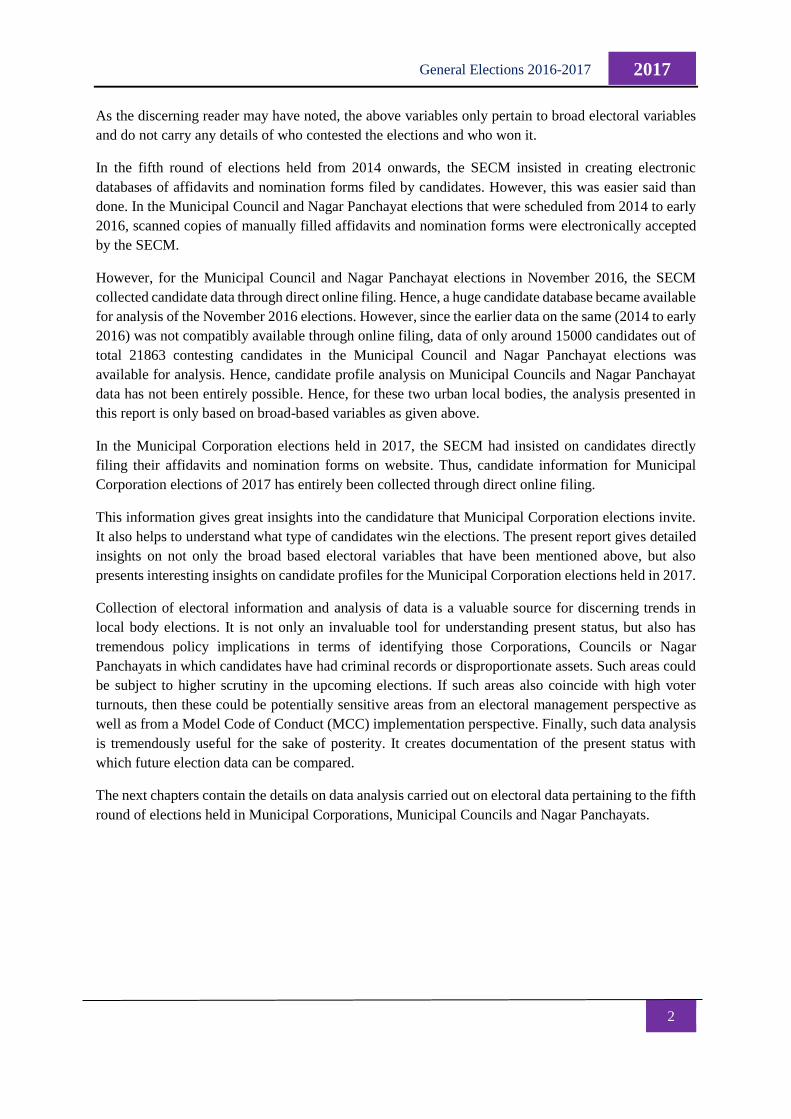
As the discerning reader may have noted, the above variables only pertain to broad electoral variables
and do not carry any details of who contested the elections and who won it.
In the fifth round of elections held from 2014 onwards, the SECM insisted in creating electronic
databases of affidavits and nomination forms filed by candidates. However, this was easier said than
done. In the Municipal Council and Nagar Panchayat elections that were scheduled from 2014 to early
2016, scanned copies of manually filled affidavits and nomination forms were electronically accepted
by the SECM.
However, for the Municipal Council and Nagar Panchayat elections in November 2016, the SECM
collected candidate data through direct online filing. Hence, a huge candidate database became available
for analysis of the November 2016 elections. However, since the earlier data on the same (2014 to early
2016) was not compatibly available through online filing, data of only around 15000 candidates out of
total 21863 contesting candidates in the Municipal Council and Nagar Panchayat elections was
available for analysis. Hence, candidate profile analysis on Municipal Councils and Nagar Panchayat
data has not been entirely possible. Hence, for these two urban local bodies, the analysis presented in
this report is only based on broad-based variables as given above.
In the Municipal Corporation elections held in 2017, the SECM had insisted on candidates directly
filing their affidavits and nomination forms on website. Thus, candidate information for Municipal
Corporation elections of 2017 has entirely been collected through direct online filing.
This information gives great insights into the candidature that Municipal Corporation elections invite.
It also helps to understand what type of candidates win the elections. The present report gives detailed
insights on not only the broad based electoral variables that have been mentioned above, but also
presents interesting insights on candidate profiles for the Municipal Corporation elections held in 2017.
Collection of electoral information and analysis of data is a valuable source for discerning trends in
local body elections. It is not only an invaluable tool for understanding present status, but also has
tremendous policy implications in terms of identifying those Corporations, Councils or Nagar
Panchayats in which candidates have had criminal records or disproportionate assets. Such areas could
be subject to higher scrutiny in the upcoming elections. If such areas also coincide with high voter
turnouts, then these could be potentially sensitive areas from an electoral management perspective as
well as from a Model Code of Conduct (MCC) implementation perspective. Finally, such data analysis
is tremendously useful for the sake of posterity. It creates documentation of the present status with
which future election data can be compared.
The next chapters contain the details on data analysis carried out on electoral data pertaining to the fifth
round of elections held in Municipal Corporations, Municipal Councils and Nagar Panchayats.
3
2017 General Elections 2016-2017
CHAPTER - II
CANDIDATE PROFILE ANALYSIS FOR MUNICIPAL
CORPORATION ELECTIONS
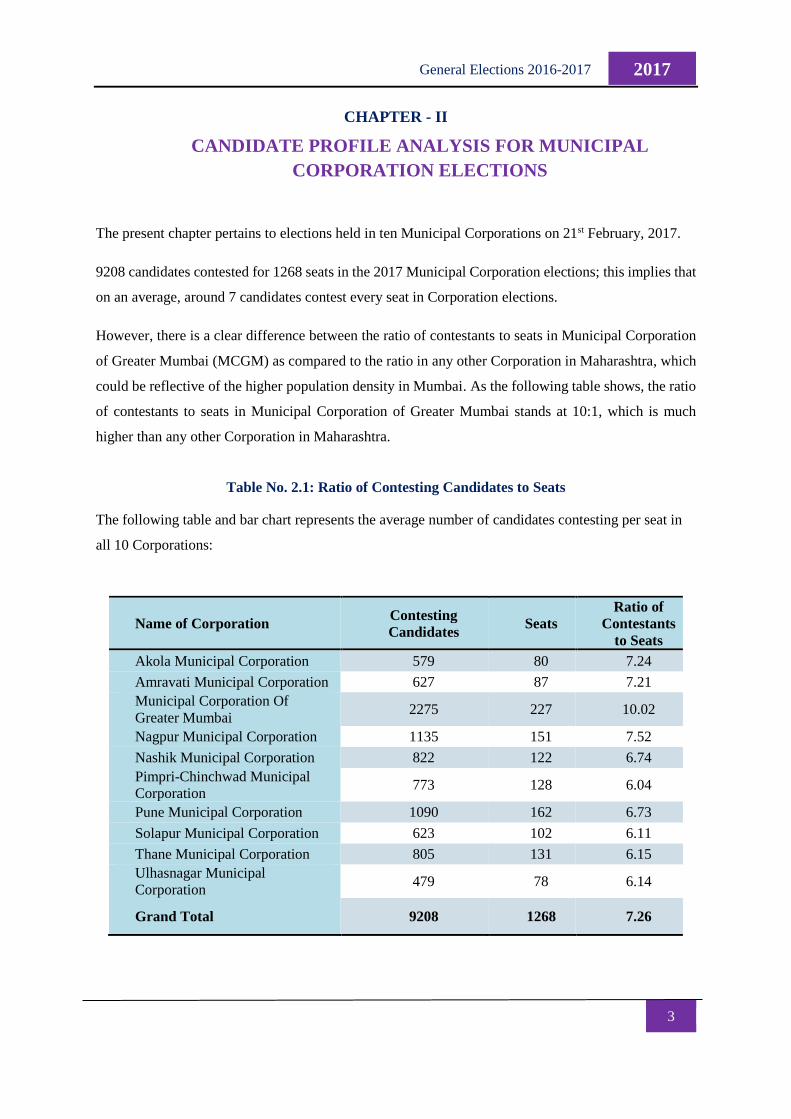
The present chapter pertains to elections held in ten Municipal Corporations on 21st February, 2017.
9208 candidates contested for 1268 seats in the 2017 Municipal Corporation elections; this implies that
on an average, around 7 candidates contest every seat in Corporation elections.
However, there is a clear difference between the ratio of contestants to seats in Municipal Corporation
of Greater Mumbai (MCGM) as compared to the ratio in any other Corporation in Maharashtra, which
could be reflective of the higher population density in Mumbai. As the following table shows, the ratio
of contestants to seats in Municipal Corporation of Greater Mumbai stands at 10:1, which is much
higher than any other Corporation in Maharashtra.
Table No. 2.1: Ratio of Contesting Candidates to Seats
The following table and bar chart represents the average number of candidates contesting per seat in
all 10 Corporations:
Name of Corporation Contesting
Candidates Seats
Ratio of
Contestants
to Seats
Akola Municipal Corporation 579 80 7.24
Amravati Municipal Corporation 627 87 7.21
Municipal Corporation Of
Greater Mumbai 2275 227 10.02
Nagpur Municipal Corporation 1135 151 7.52
Nashik Municipal Corporation 822 122 6.74
Pimpri-Chinchwad Municipal
Corporation 773 128 6.04
Pune Municipal Corporation 1090 162 6.73
Solapur Municipal Corporation 623 102 6.11
Thane Municipal Corporation 805 131 6.15
Ulhasnagar Municipal
Corporation 479 78 6.14
Grand Total 9208 1268 7.26
4
2017 General Elections 2016-2017
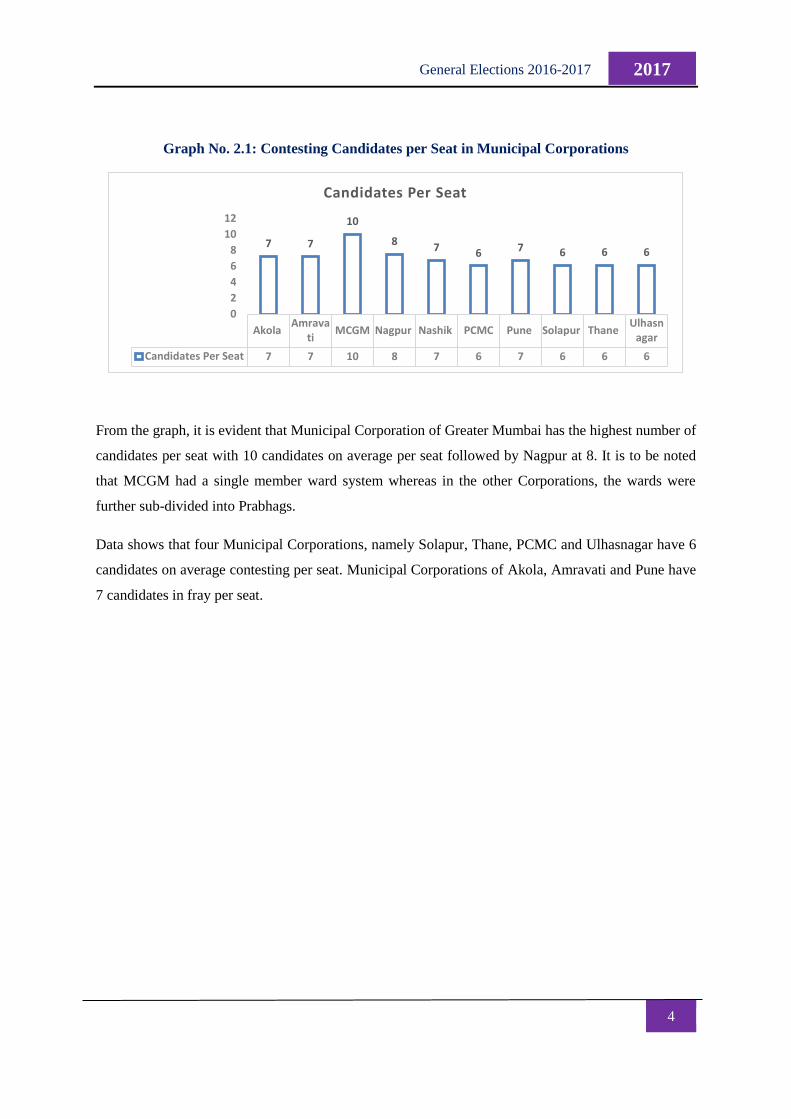
Graph No. 2.1: Contesting Candidates per Seat in Municipal Corporations
From the graph, it is evident that Municipal Corporation of Greater Mumbai has the highest number of
candidates per seat with 10 candidates on average per seat followed by Nagpur at 8. It is to be noted
that MCGM had a single member ward system whereas in the other Corporations, the wards were
further sub-divided into Prabhags.
Data shows that four Municipal Corporations, namely Solapur, Thane, PCMC and Ulhasnagar have 6
candidates on average contesting per seat. Municipal Corporations of Akola, Amravati and Pune have
7 candidates in fray per seat.
AkolaAmrava
tiMCGM Nagpur Nashik PCMC Pune Solapur Thane
Ulhasnagar
Candidates Per Seat 7 7 10 8 7 6 7 6 6 6
7 7
10
87 6 7 6 6 6
0
2
4
6
8
10
12
Candidates Per Seat
5
2017 General Elections 2016-2017
(I) ANALYSIS BASED ON GENDER
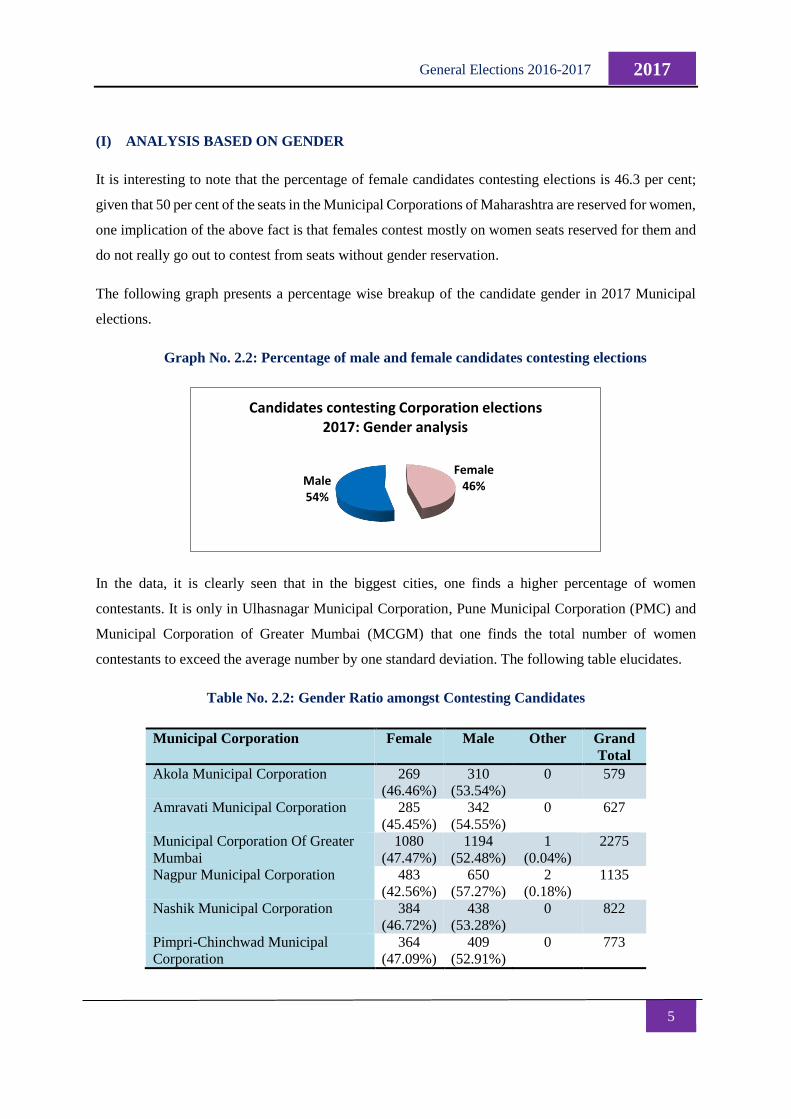
It is interesting to note that the percentage of female candidates contesting elections is 46.3 per cent;
given that 50 per cent of the seats in the Municipal Corporations of Maharashtra are reserved for women,
one implication of the above fact is that females contest mostly on women seats reserved for them and
do not really go out to contest from seats without gender reservation.
The following graph presents a percentage wise breakup of the candidate gender in 2017 Municipal
elections.
Graph No. 2.2: Percentage of male and female candidates contesting elections
In the data, it is clearly seen that in the biggest cities, one finds a higher percentage of women
contestants. It is only in Ulhasnagar Municipal Corporation, Pune Municipal Corporation (PMC) and
Municipal Corporation of Greater Mumbai (MCGM) that one finds the total number of women
contestants to exceed the average number by one standard deviation. The following table elucidates.
Table No. 2.2: Gender Ratio amongst Contesting Candidates
Municipal Corporation Female Male Other Grand
Total
Akola Municipal Corporation 269
(46.46%)
310
(53.54%)
0 579
Amravati Municipal Corporation 285
(45.45%)
342
(54.55%)
0 627
Municipal Corporation Of Greater
Mumbai
1080
(47.47%)
1194
(52.48%)
1
(0.04%)
2275
Nagpur Municipal Corporation 483
(42.56%)
650
(57.27%)
2
(0.18%)
1135
Nashik Municipal Corporation 384
(46.72%)
438
(53.28%)
0 822
Pimpri-Chinchwad Municipal
Corporation
364
(47.09%)
409
(52.91%)
0 773
Female46%Male
54%
Candidates contesting Corporation elections 2017: Gender analysis
6
2017 General Elections 2016-2017
Pune Municipal Corporation 520
(47.71%)
569
(52.20%)
1(0.09%) 1090
Solapur Municipal Corporation 274
(43.98%)
349
(56.02%)
0 623
Thane Municipal Corporation 361
(44.84%)
444
(55.16%)
0 805
Ulhasnagar Municipal Corporation 242
(50.52%)
237
(49.48%)
0 479
Grand Total 4262 4942 4 9208
46.29% 53.67% 0.04%
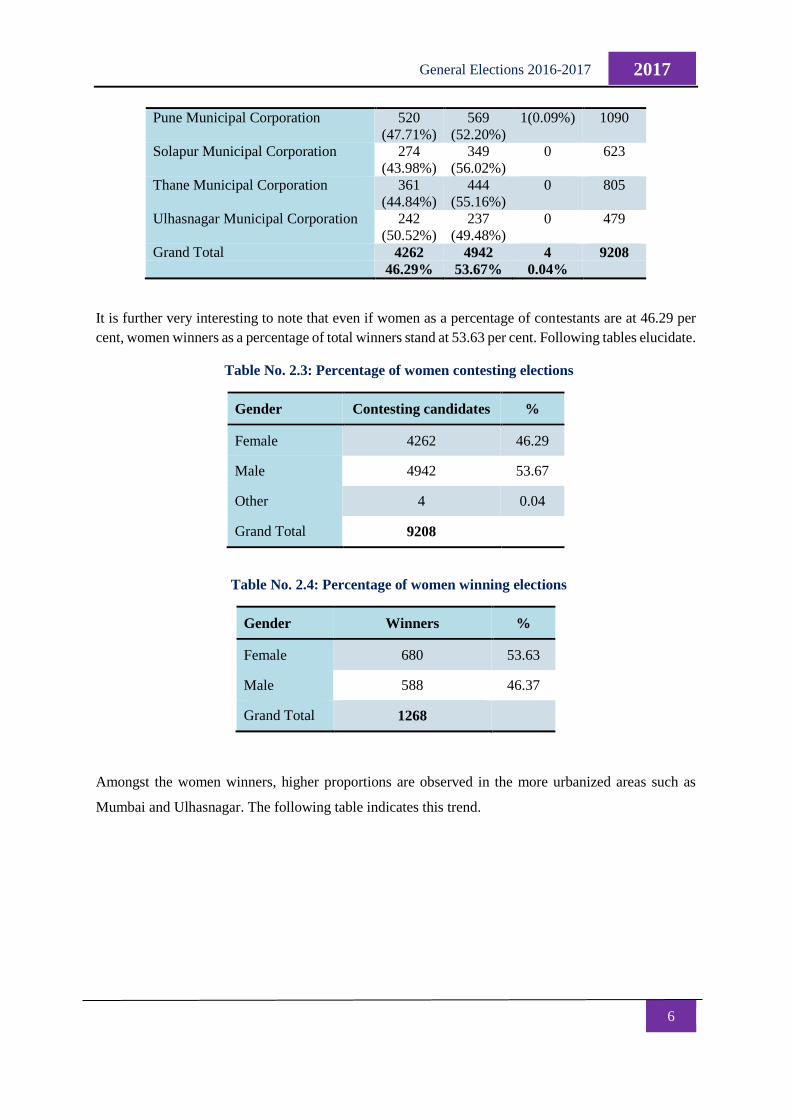
It is further very interesting to note that even if women as a percentage of contestants are at 46.29 per
cent, women winners as a percentage of total winners stand at 53.63 per cent. Following tables elucidate.
Table No. 2.3: Percentage of women contesting elections
Gender Contesting candidates %
Female 4262 46.29
Male 4942 53.67
Other 4 0.04
Grand Total 9208
Table No. 2.4: Percentage of women winning elections
Gender Winners %
Female 680 53.63
Male 588 46.37
Grand Total 1268
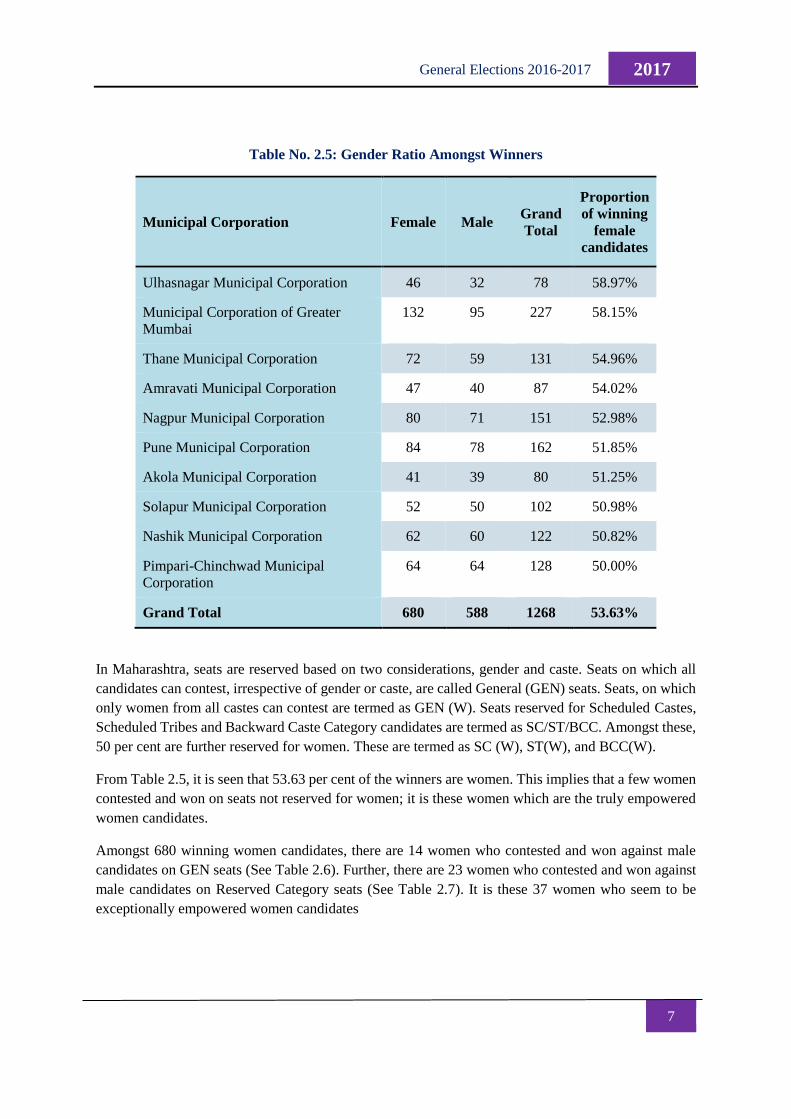
Amongst the women winners, higher proportions are observed in the more urbanized areas such as
Mumbai and Ulhasnagar. The following table indicates this trend.
7
2017 General Elections 2016-2017
Table No. 2.5: Gender Ratio Amongst Winners
Municipal Corporation Female Male Grand
Total
Proportion
of winning
female
candidates
Ulhasnagar Municipal Corporation 46 32 78 58.97%
Municipal Corporation of Greater
Mumbai
132 95 227 58.15%
Thane Municipal Corporation 72 59 131 54.96%
Amravati Municipal Corporation 47 40 87 54.02%
Nagpur Municipal Corporation 80 71 151 52.98%
Pune Municipal Corporation 84 78 162 51.85%
Akola Municipal Corporation 41 39 80 51.25%
Solapur Municipal Corporation 52 50 102 50.98%
Nashik Municipal Corporation 62 60 122 50.82%
Pimpari-Chinchwad Municipal
Corporation
64 64 128 50.00%
Grand Total 680 588 1268 53.63%
In Maharashtra, seats are reserved based on two considerations, gender and caste. Seats on which all
candidates can contest, irrespective of gender or caste, are called General (GEN) seats. Seats, on which
only women from all castes can contest are termed as GEN (W). Seats reserved for Scheduled Castes,
Scheduled Tribes and Backward Caste Category candidates are termed as SC/ST/BCC. Amongst these,
50 per cent are further reserved for women. These are termed as SC (W), ST(W), and BCC(W).
From Table 2.5, it is seen that 53.63 per cent of the winners are women. This implies that a few women
contested and won on seats not reserved for women; it is these women which are the truly empowered
women candidates.
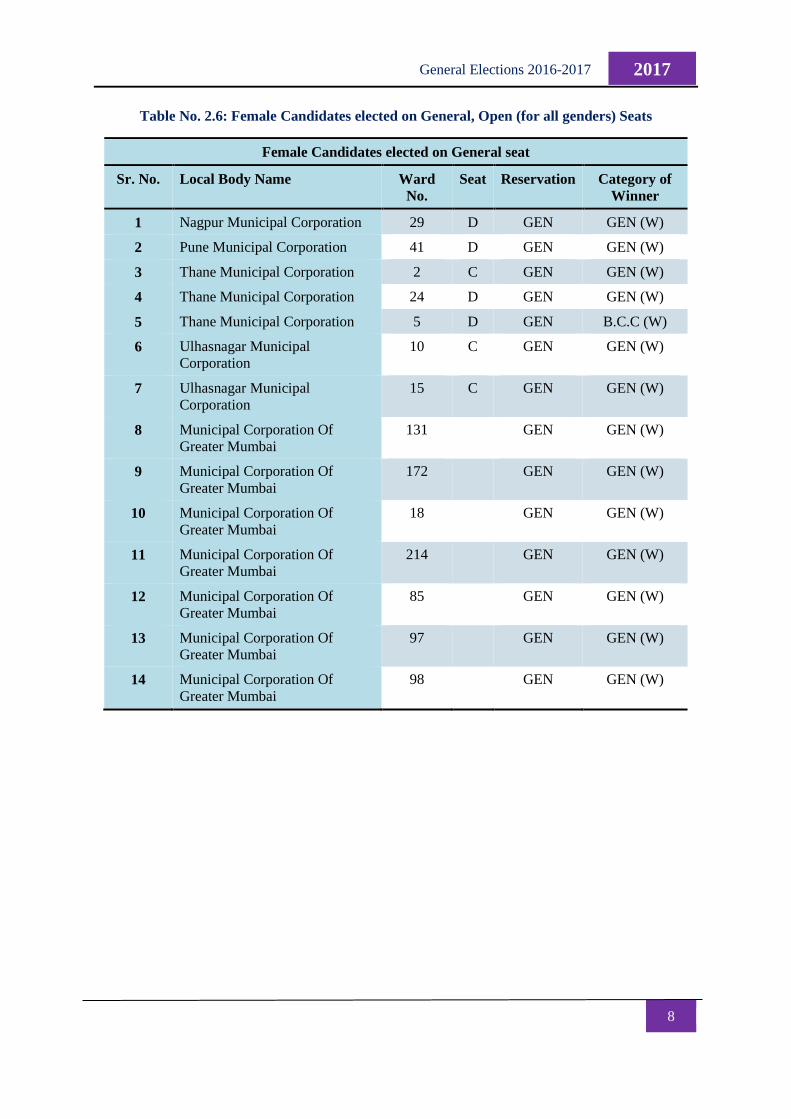
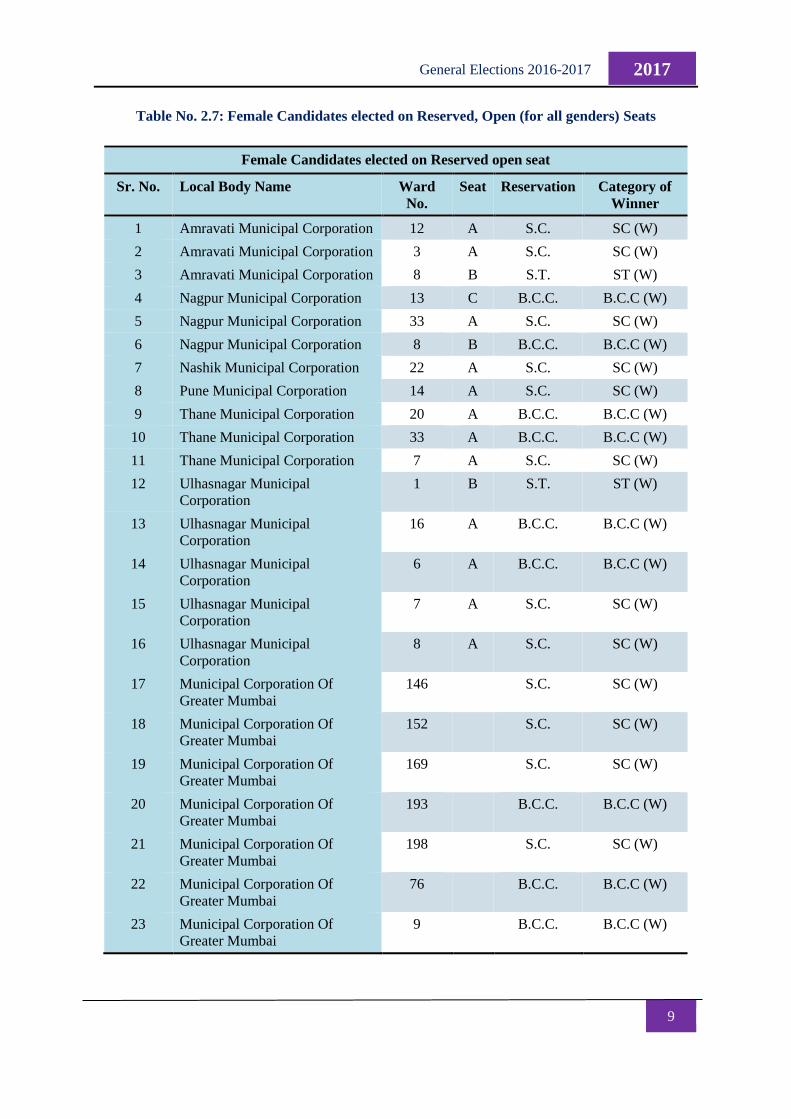
Amongst 680 winning women candidates, there are 14 women who contested and won against male
candidates on GEN seats (See Table 2.6). Further, there are 23 women who contested and won against
male candidates on Reserved Category seats (See Table 2.7). It is these 37 women who seem to be
exceptionally empowered women candidates
8
2017 General Elections 2016-2017
Table No. 2.6: Female Candidates elected on General, Open (for all genders) Seats
Female Candidates elected on General seat
Sr. No. Local Body Name Ward
No.
Seat Reservation Category of
Winner
1 Nagpur Municipal Corporation 29 D GEN GEN (W)
2 Pune Municipal Corporation 41 D GEN GEN (W)
3 Thane Municipal Corporation 2 C GEN GEN (W)
4 Thane Municipal Corporation 24 D GEN GEN (W)
5 Thane Municipal Corporation 5 D GEN B.C.C (W)
6 Ulhasnagar Municipal
Corporation
10 C GEN GEN (W)
7 Ulhasnagar Municipal
Corporation
15 C GEN GEN (W)
8 Municipal Corporation Of
Greater Mumbai
131
GEN GEN (W)
9 Municipal Corporation Of
Greater Mumbai
172
GEN GEN (W)
10 Municipal Corporation Of
Greater Mumbai
18
GEN GEN (W)
11 Municipal Corporation Of
Greater Mumbai
214
GEN GEN (W)
12 Municipal Corporation Of
Greater Mumbai
85
GEN GEN (W)
13 Municipal Corporation Of
Greater Mumbai
97
GEN GEN (W)
14 Municipal Corporation Of
Greater Mumbai
98
GEN GEN (W)
9
2017 General Elections 2016-2017
Table No. 2.7: Female Candidates elected on Reserved, Open (for all genders) Seats
Female Candidates elected on Reserved open seat
Sr. No. Local Body Name Ward
No.
Seat Reservation Category of
Winner
1 Amravati Municipal Corporation 12 A S.C. SC (W)
2 Amravati Municipal Corporation 3 A S.C. SC (W)
3 Amravati Municipal Corporation 8 B S.T. ST (W)
4 Nagpur Municipal Corporation 13 C B.C.C. B.C.C (W)
5 Nagpur Municipal Corporation 33 A S.C. SC (W)
6 Nagpur Municipal Corporation 8 B B.C.C. B.C.C (W)
7 Nashik Municipal Corporation 22 A S.C. SC (W)
8 Pune Municipal Corporation 14 A S.C. SC (W)
9 Thane Municipal Corporation 20 A B.C.C. B.C.C (W)
10 Thane Municipal Corporation 33 A B.C.C. B.C.C (W)
11 Thane Municipal Corporation 7 A S.C. SC (W)
12 Ulhasnagar Municipal
Corporation
1 B S.T. ST (W)
13 Ulhasnagar Municipal
Corporation
16 A B.C.C. B.C.C (W)
14 Ulhasnagar Municipal
Corporation
6 A B.C.C. B.C.C (W)
15 Ulhasnagar Municipal
Corporation
7 A S.C. SC (W)
16 Ulhasnagar Municipal
Corporation
8 A S.C. SC (W)
17 Municipal Corporation Of
Greater Mumbai
146
S.C. SC (W)
18 Municipal Corporation Of
Greater Mumbai
152
S.C. SC (W)
19 Municipal Corporation Of
Greater Mumbai
169
S.C. SC (W)
20 Municipal Corporation Of
Greater Mumbai
193
B.C.C. B.C.C (W)
21 Municipal Corporation Of
Greater Mumbai
198
S.C. SC (W)
22 Municipal Corporation Of
Greater Mumbai
76
B.C.C. B.C.C (W)
23 Municipal Corporation Of
Greater Mumbai
9
B.C.C. B.C.C (W)
10
2017 General Elections 2016-2017
(II) ANALYSIS BASED ON AGE
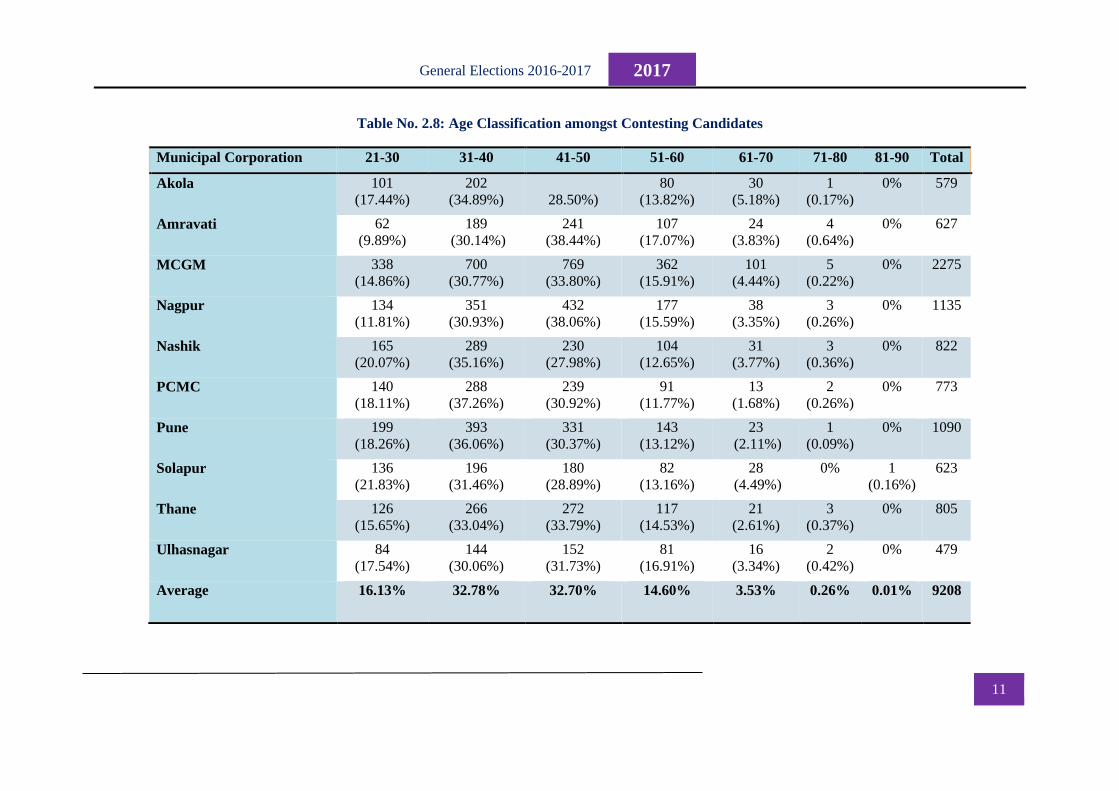
The following table depicts age-wise breakup of contesting candidates across various Municipal
Corporations. It can be seen that around 65 per cent of the candidates are in the 31-50 age bracket.
Hence the participation share of 31-40 and 41-50 is higher. It is interesting to note that Solapur and
Nashik show a dominance of youth candidature, with 21.83 per cent and 20.07 per cent candidates
respectively in the 21-30 age bracket
11
2017 General Elections 2016-2017
Table No. 2.8: Age Classification amongst Contesting Candidates
Municipal Corporation 21-30 31-40 41-50 51-60 61-70 71-80 81-90 Total
Akola 101
(17.44%)
202
(34.89%)
28.50%)
80
(13.82%)
30
(5.18%)
1
(0.17%)
0% 579
Amravati 62
(9.89%)
189
(30.14%)
241
(38.44%)
107
(17.07%)
24
(3.83%)
4
(0.64%)
0% 627
MCGM 338
(14.86%)
700
(30.77%)
769
(33.80%)
362
(15.91%)
101
(4.44%)
5
(0.22%)
0% 2275
Nagpur 134
(11.81%)
351
(30.93%)
432
(38.06%)
177
(15.59%)
38
(3.35%)
3
(0.26%)
0% 1135
Nashik 165
(20.07%)
289
(35.16%)
230
(27.98%)
104
(12.65%)
31
(3.77%)
3
(0.36%)
0% 822
PCMC 140
(18.11%)
288
(37.26%)
239
(30.92%)
91
(11.77%)
13
(1.68%)
2
(0.26%)
0% 773
Pune 199
(18.26%)
393
(36.06%)
331
(30.37%)
143
(13.12%)
23
(2.11%)
1
(0.09%)
0% 1090
Solapur 136
(21.83%)
196
(31.46%)
180
(28.89%)
82
(13.16%)
28
(4.49%)
0% 1
(0.16%)
623
Thane 126
(15.65%)
266
(33.04%)
272
(33.79%)
117
(14.53%)
21
(2.61%)
3
(0.37%)
0% 805
Ulhasnagar 84
(17.54%)
144
(30.06%)
152
(31.73%)
81
(16.91%)
16
(3.34%)
2
(0.42%)
0% 479
Average 16.13% 32.78% 32.70% 14.60% 3.53% 0.26% 0.01% 9208
12
2017 General Elections 2016-2017
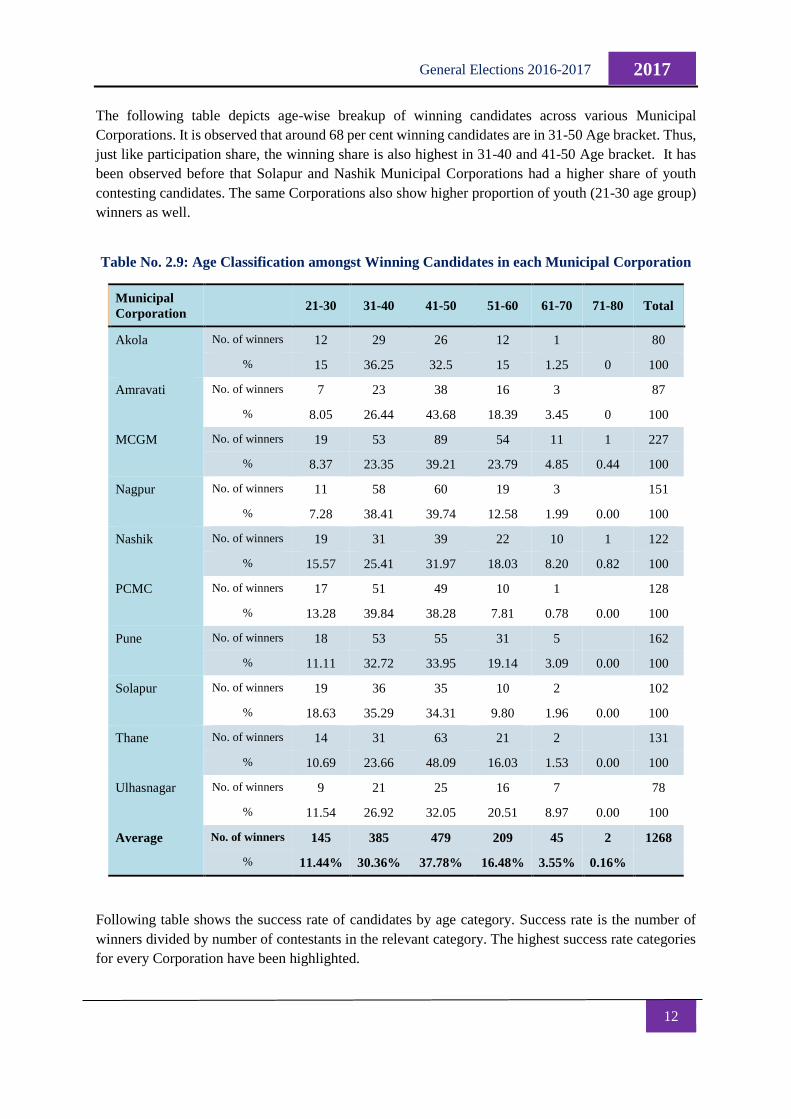
The following table depicts age-wise breakup of winning candidates across various Municipal
Corporations. It is observed that around 68 per cent winning candidates are in 31-50 Age bracket. Thus,
just like participation share, the winning share is also highest in 31-40 and 41-50 Age bracket. It has
been observed before that Solapur and Nashik Municipal Corporations had a higher share of youth
contesting candidates. The same Corporations also show higher proportion of youth (21-30 age group)
winners as well.
Table No. 2.9: Age Classification amongst Winning Candidates in each Municipal Corporation
Municipal
Corporation 21-30 31-40 41-50 51-60 61-70 71-80 Total
Akola No. of winners 12 29 26 12 1
80
% 15 36.25 32.5 15 1.25 0 100
Amravati No. of winners 7 23 38 16 3
87
% 8.05 26.44 43.68 18.39 3.45 0 100
MCGM No. of winners 19 53 89 54 11 1 227
% 8.37 23.35 39.21 23.79 4.85 0.44 100
Nagpur No. of winners 11 58 60 19 3
151
% 7.28 38.41 39.74 12.58 1.99 0.00 100
Nashik No. of winners 19 31 39 22 10 1 122
% 15.57 25.41 31.97 18.03 8.20 0.82 100
PCMC No. of winners 17 51 49 10 1
128
% 13.28 39.84 38.28 7.81 0.78 0.00 100
Pune No. of winners 18 53 55 31 5
162
% 11.11 32.72 33.95 19.14 3.09 0.00 100
Solapur No. of winners 19 36 35 10 2
102
% 18.63 35.29 34.31 9.80 1.96 0.00 100
Thane No. of winners 14 31 63 21 2
131
% 10.69 23.66 48.09 16.03 1.53 0.00 100
Ulhasnagar No. of winners 9 21 25 16 7
78
% 11.54 26.92 32.05 20.51 8.97 0.00 100
Average No. of winners 145 385 479 209 45 2 1268
% 11.44% 30.36% 37.78% 16.48% 3.55% 0.16%
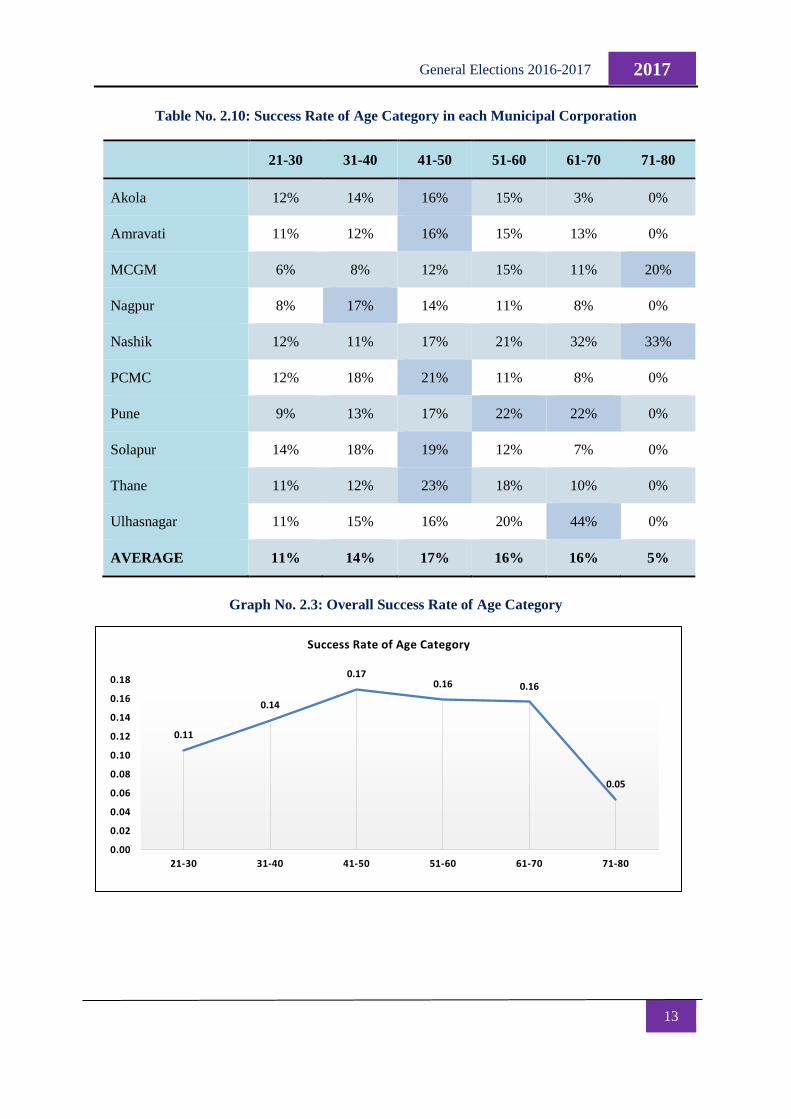
Following table shows the success rate of candidates by age category. Success rate is the number of
winners divided by number of contestants in the relevant category. The highest success rate categories
for every Corporation have been highlighted.
13
2017 General Elections 2016-2017
Table No. 2.10: Success Rate of Age Category in each Municipal Corporation
21-30 31-40 41-50 51-60 61-70 71-80
Akola 12% 14% 16% 15% 3% 0%
Amravati 11% 12% 16% 15% 13% 0%
MCGM 6% 8% 12% 15% 11% 20%
Nagpur 8% 17% 14% 11% 8% 0%
Nashik 12% 11% 17% 21% 32% 33%
PCMC 12% 18% 21% 11% 8% 0%
Pune 9% 13% 17% 22% 22% 0%
Solapur 14% 18% 19% 12% 7% 0%
Thane 11% 12% 23% 18% 10% 0%
Ulhasnagar 11% 15% 16% 20% 44% 0%
AVERAGE 11% 14% 17% 16% 16% 5%
Graph No. 2.3: Overall Success Rate of Age Category
0.11
0.14
0.170.16 0.16
0.05
0.00
0.02
0.04
0.06
0.08
0.10
0.12
0.14
0.16
0.18
21-30 31-40 41-50 51-60 61-70 71-80
Success Rate of Age Category
14
2017 General Elections 2016-2017
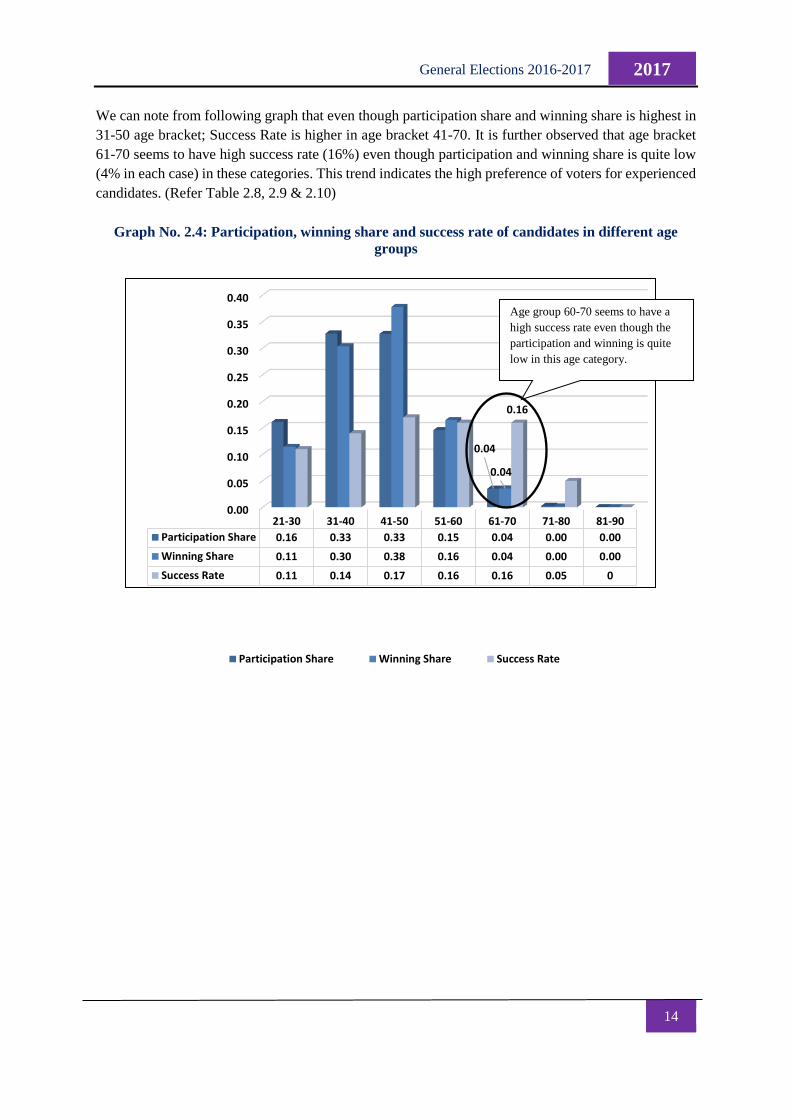
We can note from following graph that even though participation share and winning share is highest in
31-50 age bracket; Success Rate is higher in age bracket 41-70. It is further observed that age bracket
61-70 seems to have high success rate (16%) even though participation and winning share is quite low
(4% in each case) in these categories. This trend indicates the high preference of voters for experienced
candidates. (Refer Table 2.8, 2.9 & 2.10)
Graph No. 2.4: Participation, winning share and success rate of candidates in different age
groups
0.00
0.05
0.10
0.15
0.20
0.25
0.30
0.35
0.40
21-30 31-40 41-50 51-60 61-70 71-80 81-90
Participation Share 0.16 0.33 0.33 0.15 0.04 0.00 0.00
Winning Share 0.11 0.30 0.38 0.16 0.04 0.00 0.00
Success Rate 0.11 0.14 0.17 0.16 0.16 0.05 0
0.04
0.04
0.16
Participation Share Winning Share Success Rate
Age group 60-70 seems to have a
high success rate even though the
participation and winning is quite
low in this age category.
15
2017 General Elections 2016-2017
(III) ANALYSIS BASED ON OCCUPATION
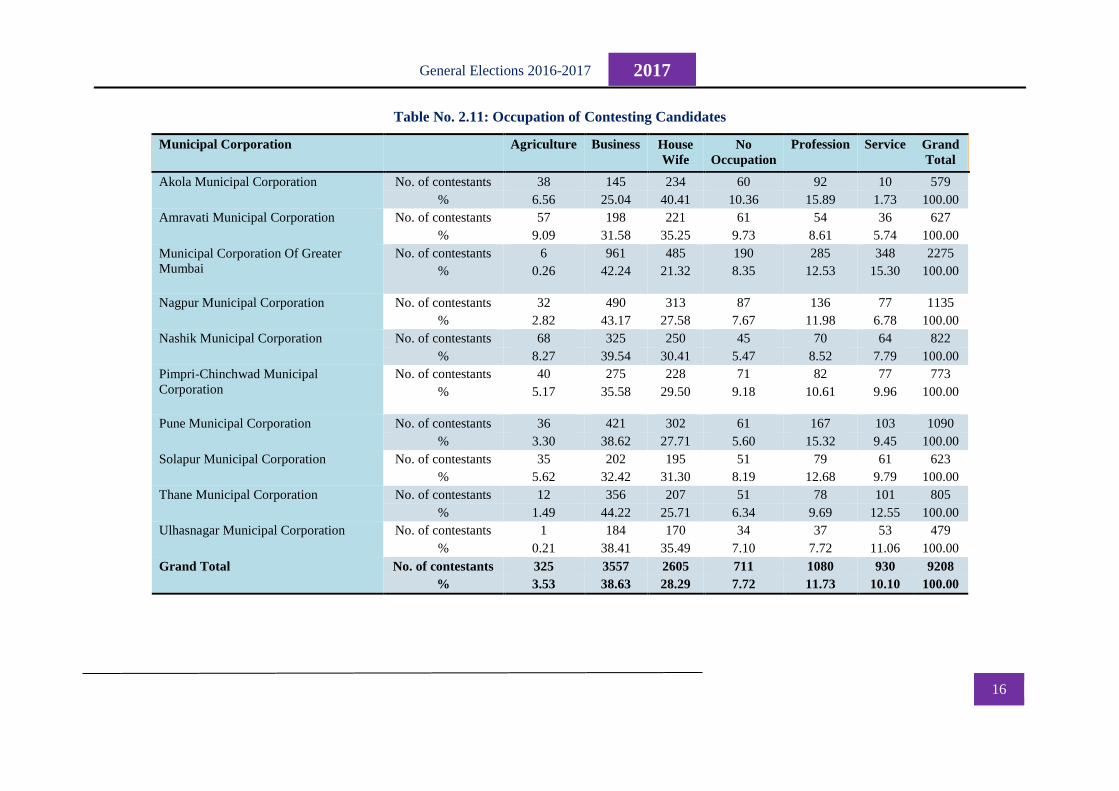
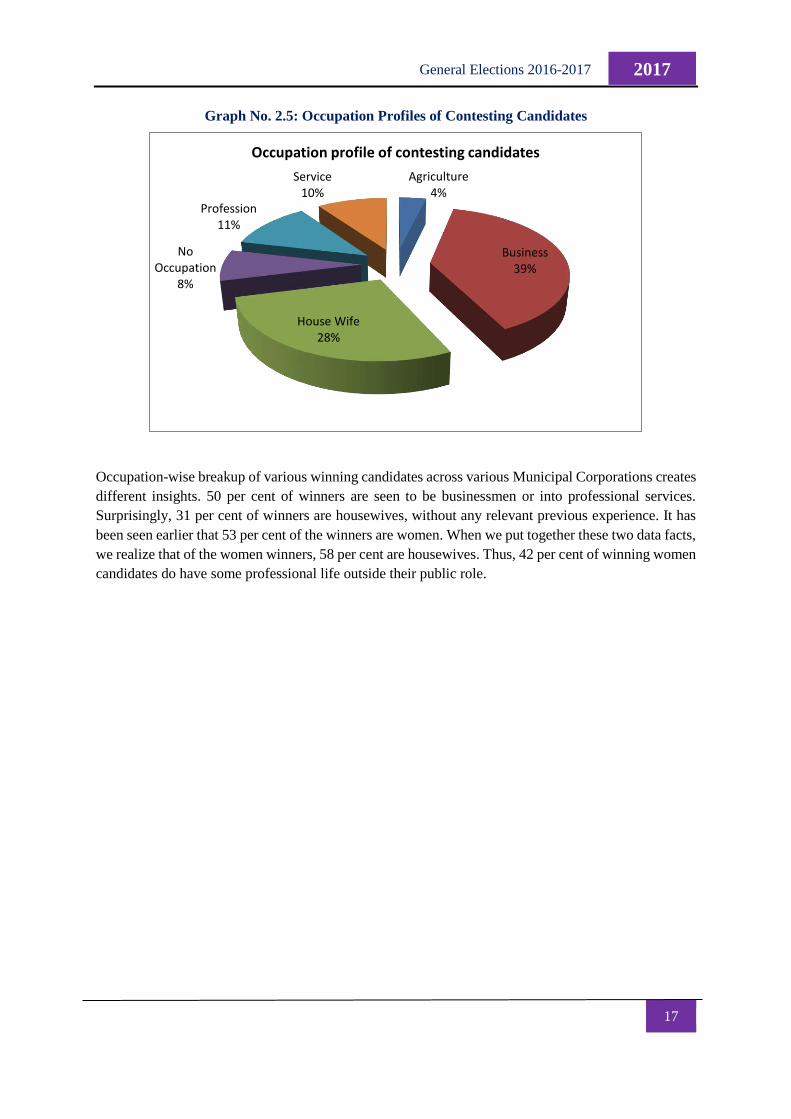
39 per cent of the candidates show “Business” to be their main occupation. 28 per cent of the candidates
are housewives; it is important to note here that women candidates are 46 per cent of the total number
of candidates. This implies that of the women candidates contesting elections, 61 per cent of the female
candidates are housewives and have not been actively engaged in any profession before contesting
elections.
In the 4 metro cities of Mumbai, Pune, Nashik and Nagpur, the percentage of candidates with a business
profile is higher than average. In the Municipal Corporations of Thane and Ulhasnagar too, data shows
that the percentage of candidates with a business profile is higher than average. Following table
elucidates.
16
2017 General Elections 2016-2017
Table No. 2.11: Occupation of Contesting Candidates
Municipal Corporation
Agriculture Business House
Wife
No
Occupation
Profession Service Grand
Total
Akola Municipal Corporation
No. of contestants 38 145 234 60 92 10 579
% 6.56 25.04 40.41 10.36 15.89 1.73 100.00
Amravati Municipal Corporation
No. of contestants 57 198 221 61 54 36 627
% 9.09 31.58 35.25 9.73 8.61 5.74 100.00
Municipal Corporation Of Greater
Mumbai
No. of contestants 6 961 485 190 285 348 2275
% 0.26 42.24 21.32 8.35 12.53 15.30 100.00
Nagpur Municipal Corporation
No. of contestants 32 490 313 87 136 77 1135
% 2.82 43.17 27.58 7.67 11.98 6.78 100.00
Nashik Municipal Corporation
No. of contestants 68 325 250 45 70 64 822
% 8.27 39.54 30.41 5.47 8.52 7.79 100.00
Pimpri-Chinchwad Municipal
Corporation
No. of contestants 40 275 228 71 82 77 773
% 5.17 35.58 29.50 9.18 10.61 9.96 100.00
Pune Municipal Corporation
No. of contestants 36 421 302 61 167 103 1090
% 3.30 38.62 27.71 5.60 15.32 9.45 100.00
Solapur Municipal Corporation
No. of contestants 35 202 195 51 79 61 623
% 5.62 32.42 31.30 8.19 12.68 9.79 100.00
Thane Municipal Corporation
No. of contestants 12 356 207 51 78 101 805
% 1.49 44.22 25.71 6.34 9.69 12.55 100.00
Ulhasnagar Municipal Corporation
No. of contestants 1 184 170 34 37 53 479
% 0.21 38.41 35.49 7.10 7.72 11.06 100.00
Grand Total
No. of contestants 325 3557 2605 711 1080 930 9208
% 3.53 38.63 28.29 7.72 11.73 10.10 100.00
17
2017 General Elections 2016-2017
Graph No. 2.5: Occupation Profiles of Contesting Candidates
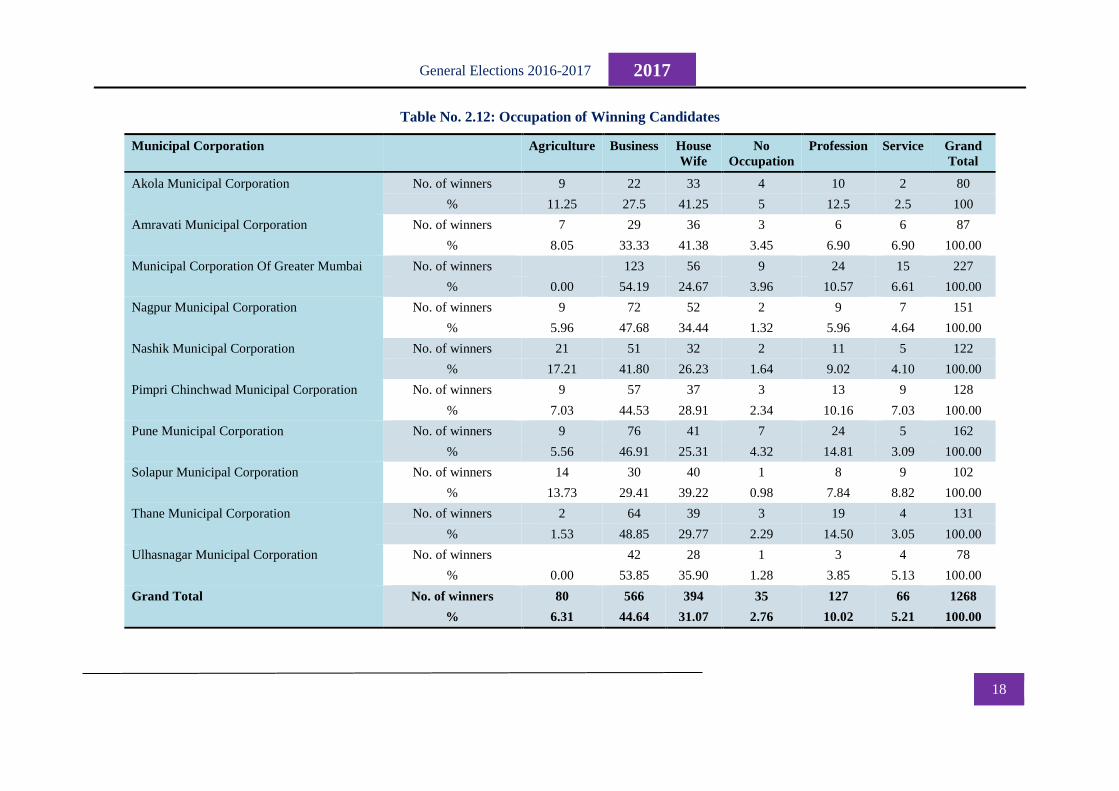
Occupation-wise breakup of various winning candidates across various Municipal Corporations creates
different insights. 50 per cent of winners are seen to be businessmen or into professional services.
Surprisingly, 31 per cent of winners are housewives, without any relevant previous experience. It has
been seen earlier that 53 per cent of the winners are women. When we put together these two data facts,
we realize that of the women winners, 58 per cent are housewives. Thus, 42 per cent of winning women
candidates do have some professional life outside their public role.
Agriculture4%
Business39%
House Wife28%
No Occupation
8%
Profession11%
Service10%
Occupation profile of contesting candidates
18
2017 General Elections 2016-2017
Table No. 2.12: Occupation of Winning Candidates
Municipal Corporation Agriculture Business House
Wife
No
Occupation
Profession Service Grand
Total
Akola Municipal Corporation
No. of winners 9 22 33 4 10 2 80
% 11.25 27.5 41.25 5 12.5 2.5 100
Amravati Municipal Corporation
No. of winners 7 29 36 3 6 6 87
% 8.05 33.33 41.38 3.45 6.90 6.90 100.00
Municipal Corporation Of Greater Mumbai No. of winners
123 56 9 24 15 227
% 0.00 54.19 24.67 3.96 10.57 6.61 100.00
Nagpur Municipal Corporation
No. of winners 9 72 52 2 9 7 151
% 5.96 47.68 34.44 1.32 5.96 4.64 100.00
Nashik Municipal Corporation
No. of winners 21 51 32 2 11 5 122
% 17.21 41.80 26.23 1.64 9.02 4.10 100.00
Pimpri Chinchwad Municipal Corporation
No. of winners 9 57 37 3 13 9 128
% 7.03 44.53 28.91 2.34 10.16 7.03 100.00
Pune Municipal Corporation
No. of winners 9 76 41 7 24 5 162
% 5.56 46.91 25.31 4.32 14.81 3.09 100.00
Solapur Municipal Corporation
No. of winners 14 30 40 1 8 9 102
% 13.73 29.41 39.22 0.98 7.84 8.82 100.00
Thane Municipal Corporation
No. of winners 2 64 39 3 19 4 131
% 1.53 48.85 29.77 2.29 14.50 3.05 100.00
Ulhasnagar Municipal Corporation
No. of winners
42 28 1 3 4 78
% 0.00 53.85 35.90 1.28 3.85 5.13 100.00
Grand Total
No. of winners 80 566 394 35 127 66 1268
% 6.31 44.64 31.07 2.76 10.02 5.21 100.00
19
2017 General Elections 2016-2017
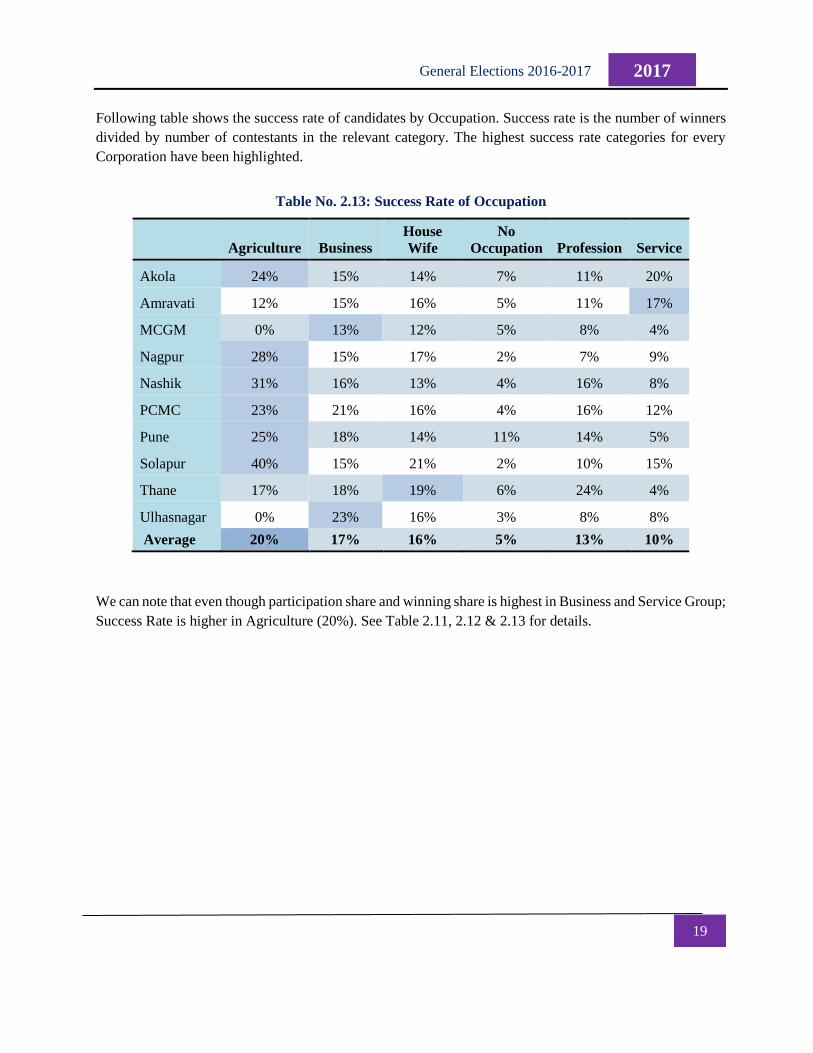
Following table shows the success rate of candidates by Occupation. Success rate is the number of winners
divided by number of contestants in the relevant category. The highest success rate categories for every
Corporation have been highlighted.
Table No. 2.13: Success Rate of Occupation
Agriculture Business
House
Wife
No
Occupation Profession Service
Akola 24% 15% 14% 7% 11% 20%
Amravati 12% 15% 16% 5% 11% 17%
MCGM 0% 13% 12% 5% 8% 4%
Nagpur 28% 15% 17% 2% 7% 9%
Nashik 31% 16% 13% 4% 16% 8%
PCMC 23% 21% 16% 4% 16% 12%
Pune 25% 18% 14% 11% 14% 5%
Solapur 40% 15% 21% 2% 10% 15%
Thane 17% 18% 19% 6% 24% 4%
Ulhasnagar 0% 23% 16% 3% 8% 8%
Average 20% 17% 16% 5% 13% 10%
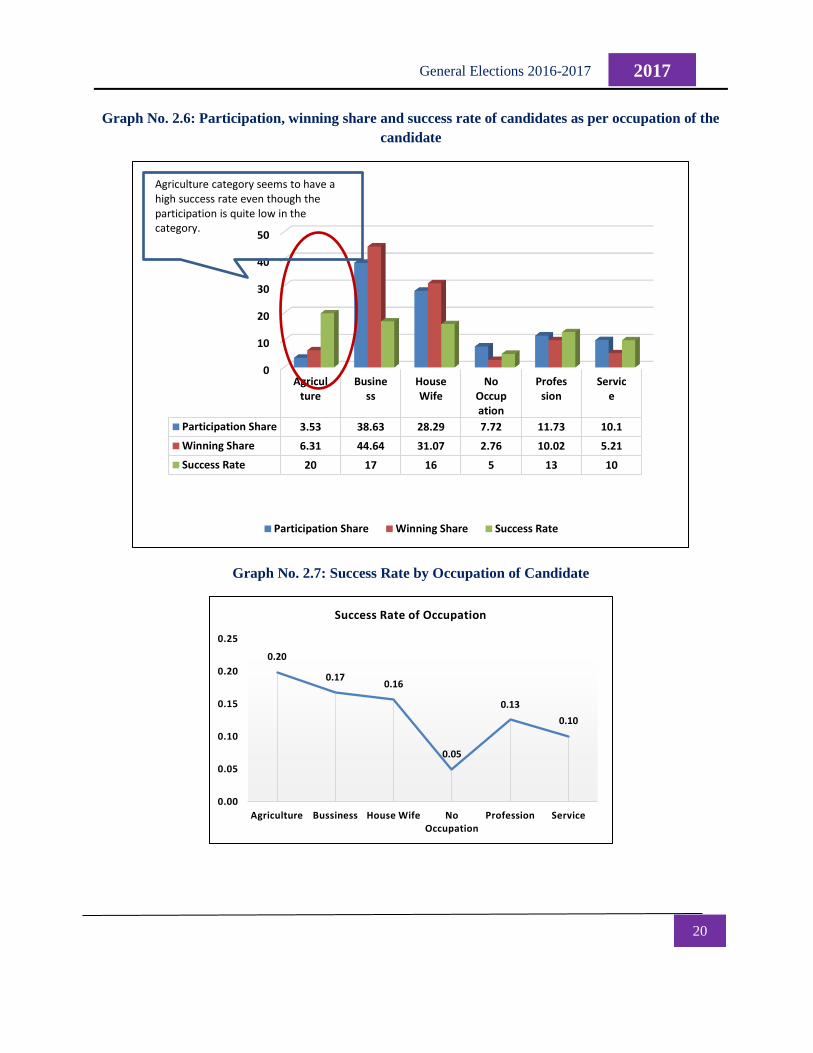
We can note that even though participation share and winning share is highest in Business and Service Group;
Success Rate is higher in Agriculture (20%). See Table 2.11, 2.12 & 2.13 for details.
20
2017 General Elections 2016-2017
Graph No. 2.6: Participation, winning share and success rate of candidates as per occupation of the
candidate
Graph No. 2.7: Success Rate by Occupation of Candidate
0
10
20
30
40
50
Agriculture
Business
HouseWife
NoOccupation
Profession
Service
Participation Share 3.53 38.63 28.29 7.72 11.73 10.1
Winning Share 6.31 44.64 31.07 2.76 10.02 5.21
Success Rate 20 17 16 5 13 10
Participation Share Winning Share Success Rate
Agriculture category seems to have a high success rate even though the participation is quite low in the category.
0.20
0.170.16
0.05
0.13
0.10
0.00
0.05
0.10
0.15
0.20
0.25
Agriculture Bussiness House Wife No Occupation
Profession Service
Success Rate of Occupation
21
2017 General Elections 2016-2017
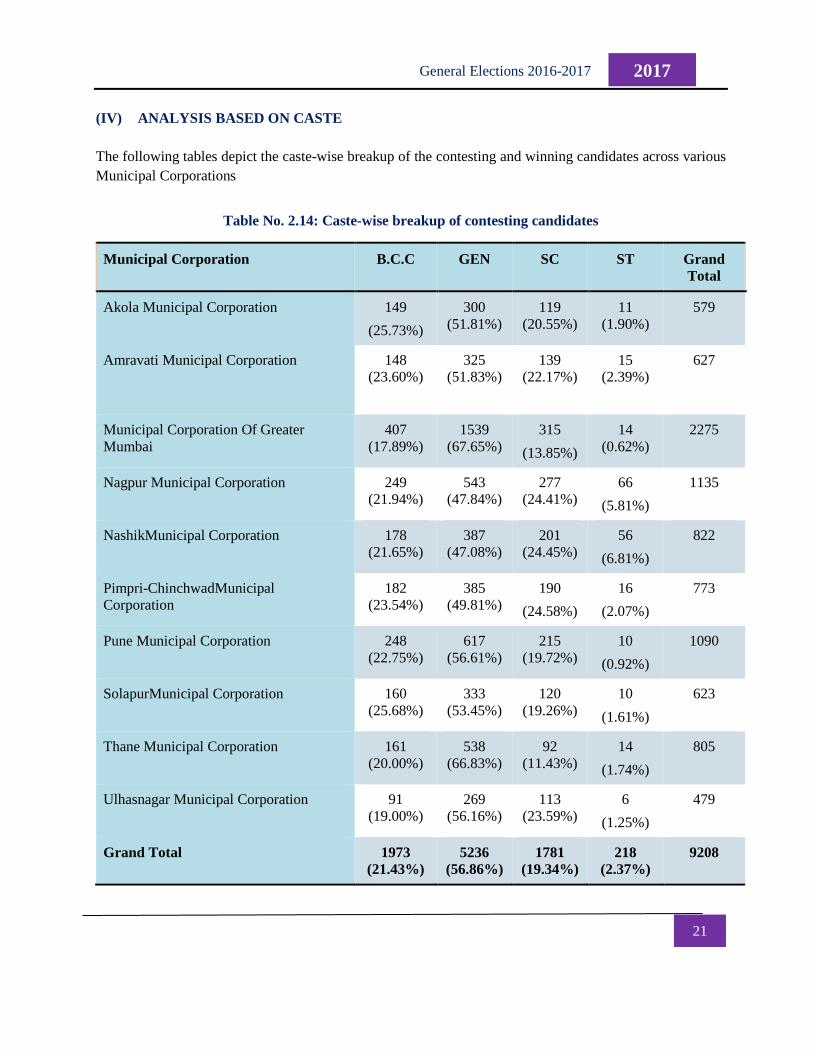
(IV) ANALYSIS BASED ON CASTE
The following tables depict the caste-wise breakup of the contesting and winning candidates across various
Municipal Corporations
Table No. 2.14: Caste-wise breakup of contesting candidates
Municipal Corporation B.C.C GEN SC ST Grand
Total
Akola Municipal Corporation 149
(25.73%)
300
(51.81%)
119
(20.55%)
11
(1.90%)
579
Amravati Municipal Corporation 148
(23.60%)
325
(51.83%)
139
(22.17%)
15
(2.39%)
627
Municipal Corporation Of Greater
Mumbai
407
(17.89%)
1539
(67.65%)
315
(13.85%)
14
(0.62%)
2275
Nagpur Municipal Corporation 249
(21.94%)
543
(47.84%)
277
(24.41%)
66
(5.81%)
1135
NashikMunicipal Corporation 178
(21.65%)
387
(47.08%)
201
(24.45%)
56
(6.81%)
822
Pimpri-ChinchwadMunicipal
Corporation
182
(23.54%)
385
(49.81%)
190
(24.58%)
16
(2.07%)
773
Pune Municipal Corporation 248
(22.75%)
617
(56.61%)
215
(19.72%)
10
(0.92%)
1090
SolapurMunicipal Corporation 160
(25.68%)
333
(53.45%)
120
(19.26%)
10
(1.61%)
623
Thane Municipal Corporation 161
(20.00%)
538
(66.83%)
92
(11.43%)
14
(1.74%)
805
Ulhasnagar Municipal Corporation 91
(19.00%)
269
(56.16%)
113
(23.59%)
6
(1.25%)
479
Grand Total 1973
(21.43%)
5236
(56.86%)
1781
(19.34%)
218
(2.37%)
9208
22
2017 General Elections 2016-2017
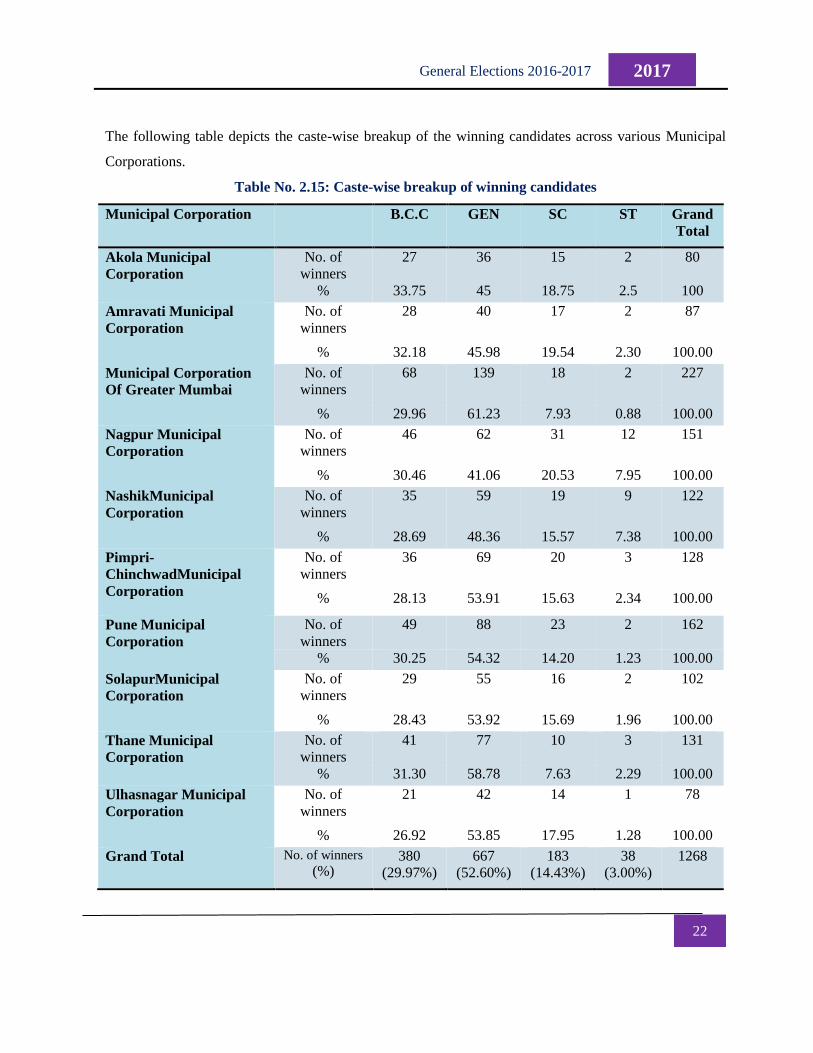
The following table depicts the caste-wise breakup of the winning candidates across various Municipal
Corporations.
Table No. 2.15: Caste-wise breakup of winning candidates
Municipal Corporation B.C.C GEN SC ST Grand
Total
Akola Municipal
Corporation
No. of
winners
27 36 15 2 80
% 33.75 45 18.75 2.5 100
Amravati Municipal
Corporation
No. of
winners
28 40 17 2 87
% 32.18 45.98 19.54 2.30 100.00
Municipal Corporation
Of Greater Mumbai
No. of
winners
68 139 18 2 227
% 29.96 61.23 7.93 0.88 100.00
Nagpur Municipal
Corporation
No. of
winners
46 62 31 12 151
% 30.46 41.06 20.53 7.95 100.00
NashikMunicipal
Corporation
No. of
winners
35 59 19 9 122
% 28.69 48.36 15.57 7.38 100.00
Pimpri-
ChinchwadMunicipal
Corporation
No. of
winners
36 69 20 3 128
% 28.13 53.91 15.63 2.34 100.00
Pune Municipal
Corporation
No. of
winners
49 88 23 2 162
% 30.25 54.32 14.20 1.23 100.00
SolapurMunicipal
Corporation
No. of
winners
29 55 16 2 102
% 28.43 53.92 15.69 1.96 100.00
Thane Municipal
Corporation
No. of
winners
41 77 10 3 131
% 31.30 58.78 7.63 2.29 100.00
Ulhasnagar Municipal
Corporation
No. of
winners
21 42 14 1 78
% 26.92 53.85 17.95 1.28 100.00
Grand Total No. of winners (%)
380
(29.97%)
667
(52.60%)
183
(14.43%)
38
(3.00%)
1268
23
2017 General Elections 2016-2017
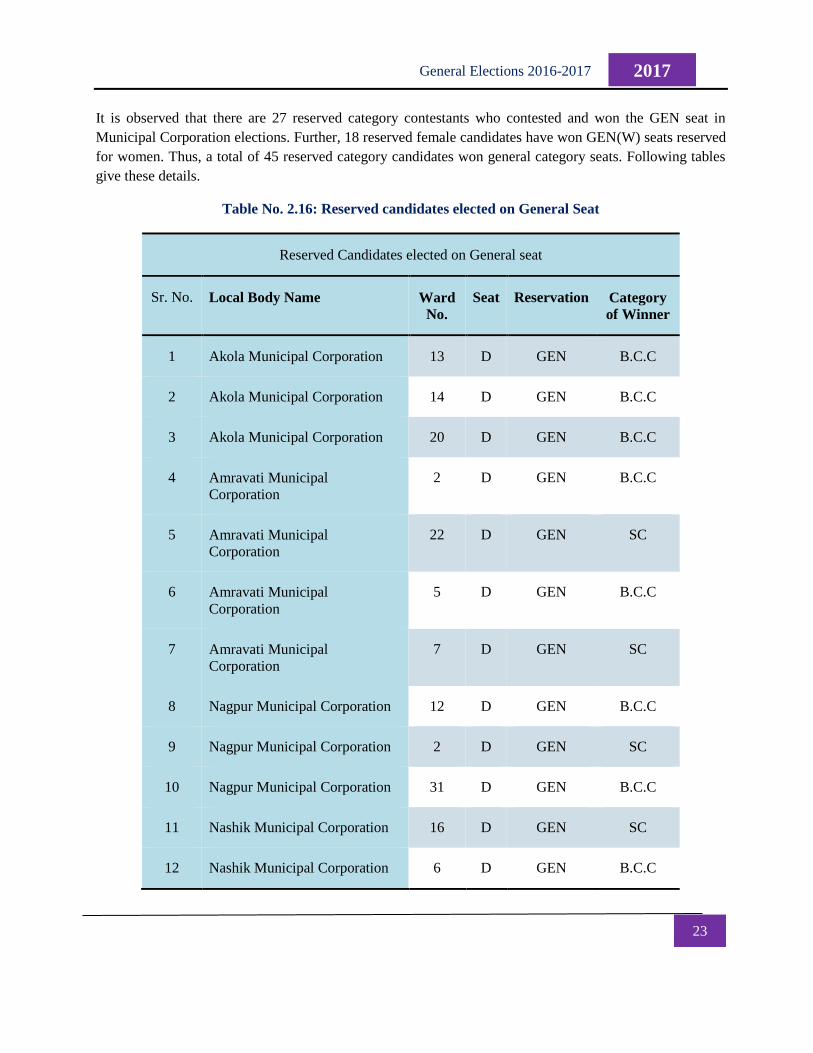
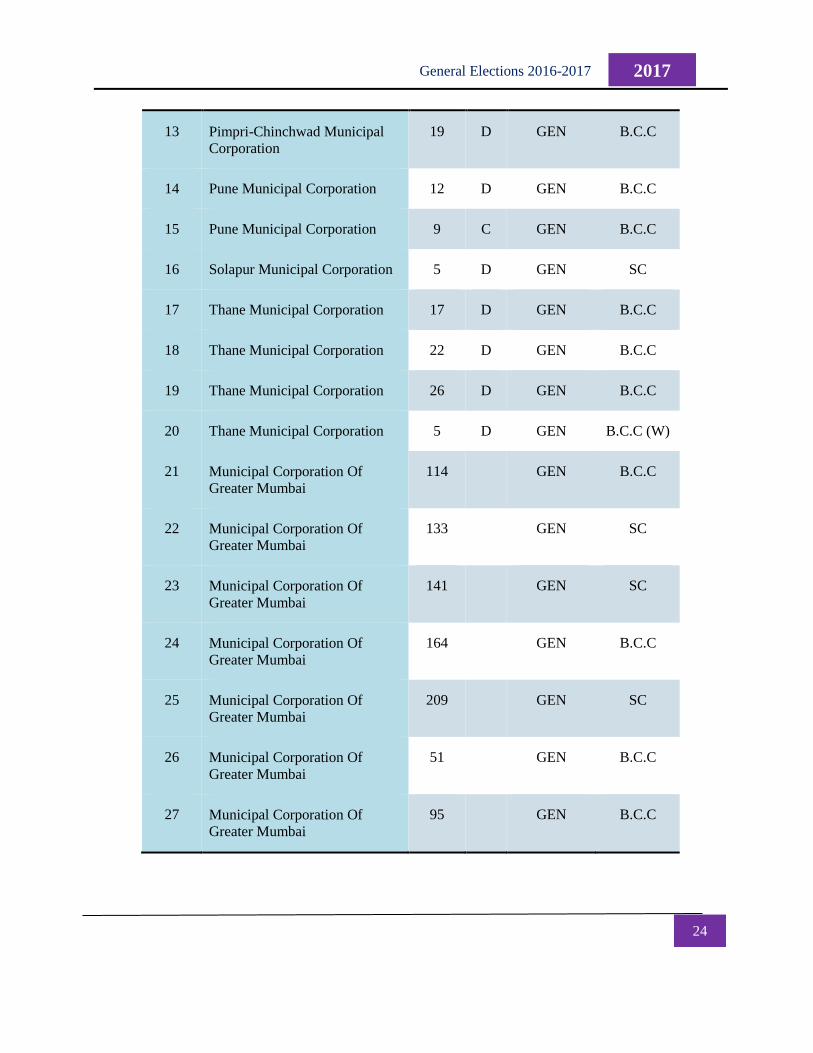
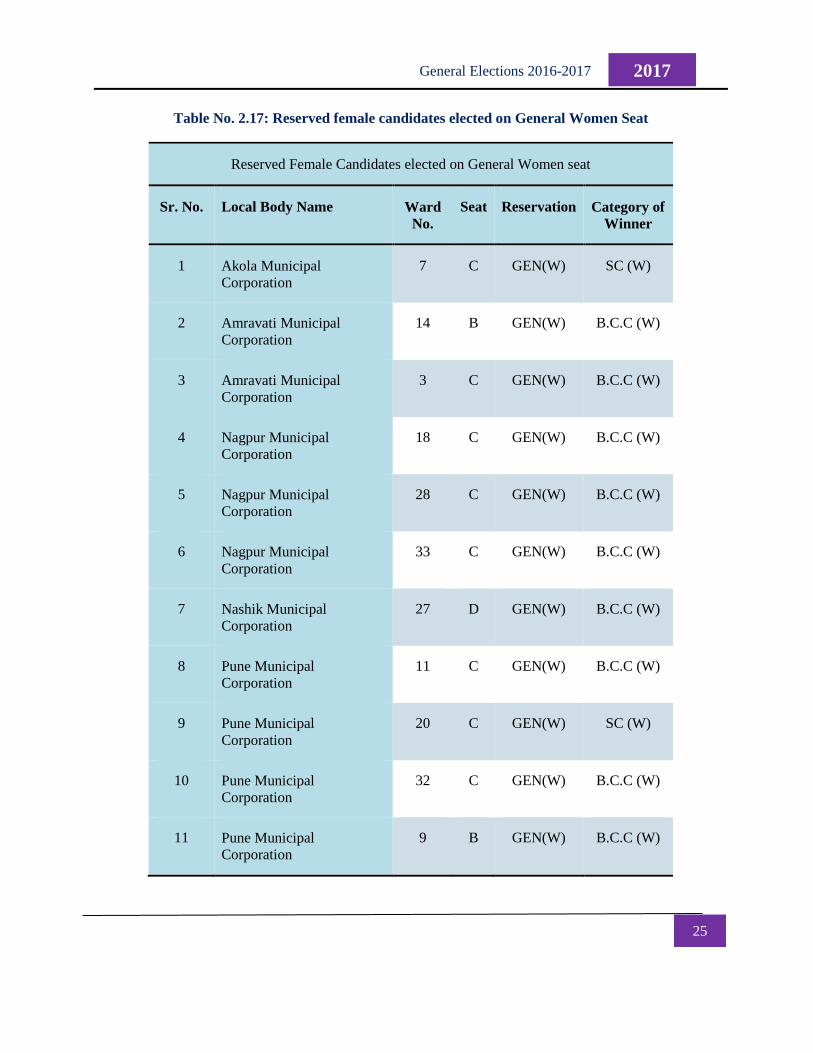
It is observed that there are 27 reserved category contestants who contested and won the GEN seat in
Municipal Corporation elections. Further, 18 reserved female candidates have won GEN(W) seats reserved
for women. Thus, a total of 45 reserved category candidates won general category seats. Following tables
give these details.
Table No. 2.16: Reserved candidates elected on General Seat
Reserved Candidates elected on General seat
Sr. No. Local Body Name Ward
No.
Seat Reservation Category
of Winner
1 Akola Municipal Corporation 13 D GEN B.C.C
2 Akola Municipal Corporation 14 D GEN B.C.C
3 Akola Municipal Corporation 20 D GEN B.C.C
4 Amravati Municipal
Corporation
2 D GEN B.C.C
5 Amravati Municipal
Corporation
22 D GEN SC
6 Amravati Municipal
Corporation
5 D GEN B.C.C
7 Amravati Municipal
Corporation
7 D GEN SC
8 Nagpur Municipal Corporation 12 D GEN B.C.C
9 Nagpur Municipal Corporation 2 D GEN SC
10 Nagpur Municipal Corporation 31 D GEN B.C.C
11 Nashik Municipal Corporation 16 D GEN SC
12 Nashik Municipal Corporation 6 D GEN B.C.C
24
2017 General Elections 2016-2017
13 Pimpri-Chinchwad Municipal
Corporation
19 D GEN B.C.C
14 Pune Municipal Corporation 12 D GEN B.C.C
15 Pune Municipal Corporation 9 C GEN B.C.C
16 Solapur Municipal Corporation 5 D GEN SC
17 Thane Municipal Corporation 17 D GEN B.C.C
18 Thane Municipal Corporation 22 D GEN B.C.C
19 Thane Municipal Corporation 26 D GEN B.C.C
20 Thane Municipal Corporation 5 D GEN B.C.C (W)
21 Municipal Corporation Of
Greater Mumbai
114
GEN B.C.C
22 Municipal Corporation Of
Greater Mumbai
133
GEN SC
23 Municipal Corporation Of
Greater Mumbai
141
GEN SC
24 Municipal Corporation Of
Greater Mumbai
164
GEN B.C.C
25 Municipal Corporation Of
Greater Mumbai
209
GEN SC
26 Municipal Corporation Of
Greater Mumbai
51
GEN B.C.C
27 Municipal Corporation Of
Greater Mumbai
95
GEN B.C.C
25
2017 General Elections 2016-2017
Table No. 2.17: Reserved female candidates elected on General Women Seat
Reserved Female Candidates elected on General Women seat
Sr. No. Local Body Name Ward
No.
Seat Reservation Category of
Winner
1 Akola Municipal
Corporation
7 C GEN(W) SC (W)
2 Amravati Municipal
Corporation
14 B GEN(W) B.C.C (W)
3 Amravati Municipal
Corporation
3 C GEN(W) B.C.C (W)
4 Nagpur Municipal
Corporation
18 C GEN(W) B.C.C (W)
5 Nagpur Municipal
Corporation
28 C GEN(W) B.C.C (W)
6 Nagpur Municipal
Corporation
33 C GEN(W) B.C.C (W)
7 Nashik Municipal
Corporation
27 D GEN(W) B.C.C (W)
8 Pune Municipal
Corporation
11 C GEN(W) B.C.C (W)
9 Pune Municipal
Corporation
20 C GEN(W) SC (W)
10 Pune Municipal
Corporation
32 C GEN(W) B.C.C (W)
11 Pune Municipal
Corporation
9 B GEN(W) B.C.C (W)
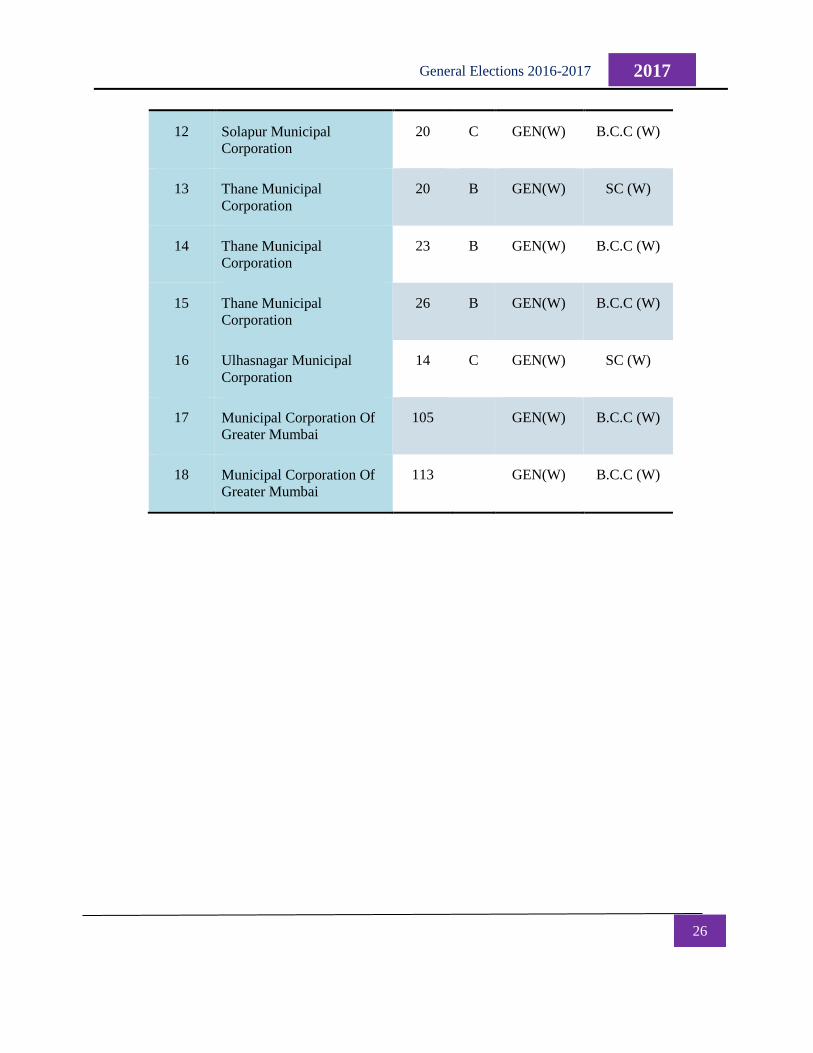
26
2017 General Elections 2016-2017
12 Solapur Municipal
Corporation
20 C GEN(W) B.C.C (W)
13 Thane Municipal
Corporation
20 B GEN(W) SC (W)
14 Thane Municipal
Corporation
23 B GEN(W) B.C.C (W)
15 Thane Municipal
Corporation
26 B GEN(W) B.C.C (W)
16 Ulhasnagar Municipal
Corporation
14 C GEN(W) SC (W)
17 Municipal Corporation Of
Greater Mumbai
105
GEN(W) B.C.C (W)
18 Municipal Corporation Of
Greater Mumbai
113
GEN(W) B.C.C (W)
27
2017 General Elections 2016-2017
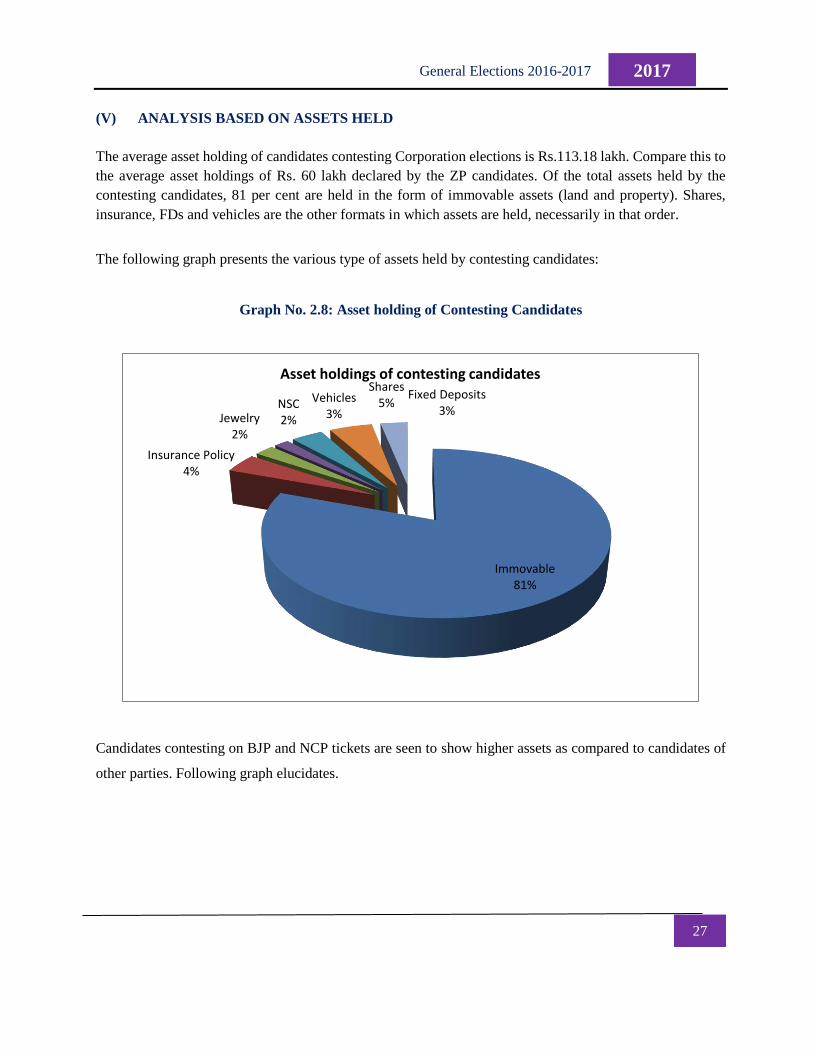
(V) ANALYSIS BASED ON ASSETS HELD
The average asset holding of candidates contesting Corporation elections is Rs.113.18 lakh. Compare this to
the average asset holdings of Rs. 60 lakh declared by the ZP candidates. Of the total assets held by the
contesting candidates, 81 per cent are held in the form of immovable assets (land and property). Shares,
insurance, FDs and vehicles are the other formats in which assets are held, necessarily in that order.
The following graph presents the various type of assets held by contesting candidates:
Graph No. 2.8: Asset holding of Contesting Candidates
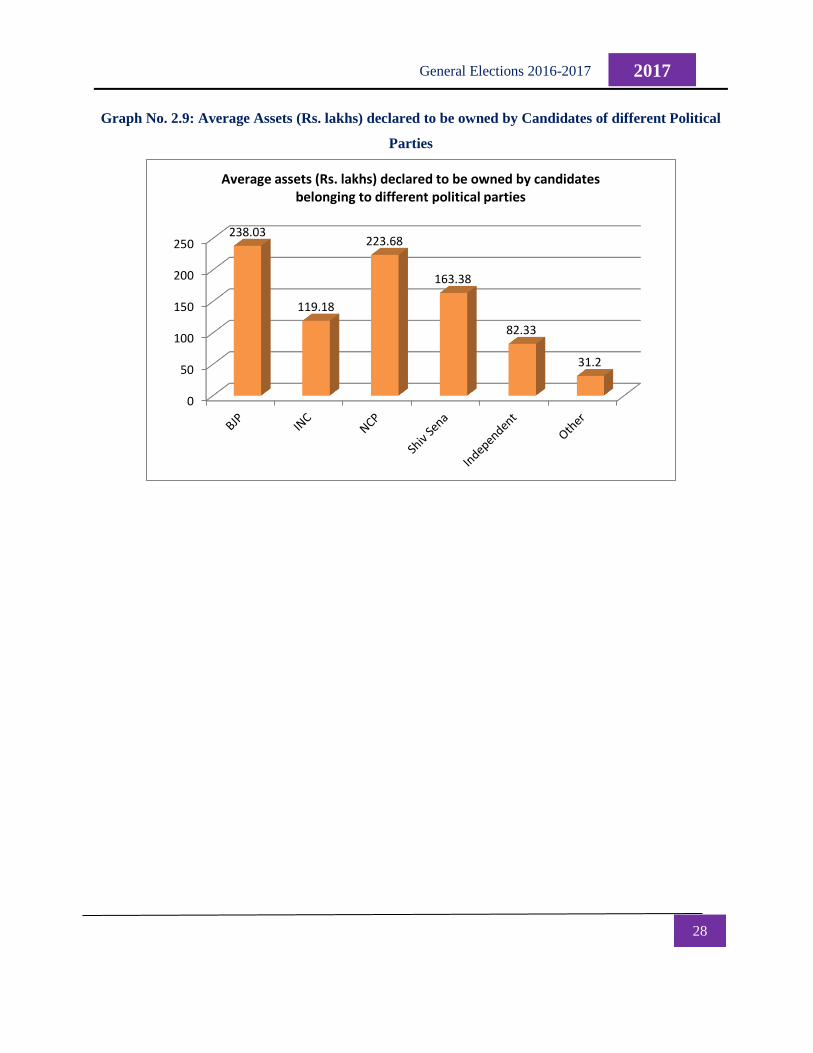
Candidates contesting on BJP and NCP tickets are seen to show higher assets as compared to candidates of
other parties. Following graph elucidates.
Immovable81%
Insurance Policy4%
Jewelry2%
NSC2%
Vehicles3%
Shares5%
Fixed Deposits3%
Asset holdings of contesting candidates
28
2017 General Elections 2016-2017
Graph No. 2.9: Average Assets (Rs. lakhs) declared to be owned by Candidates of different Political
Parties
0
50
100
150
200
250238.03
119.18
223.68
163.38
82.33
31.2
Average assets (Rs. lakhs) declared to be owned by candidates belonging to different political parties
29
2017 General Elections 2016-2017
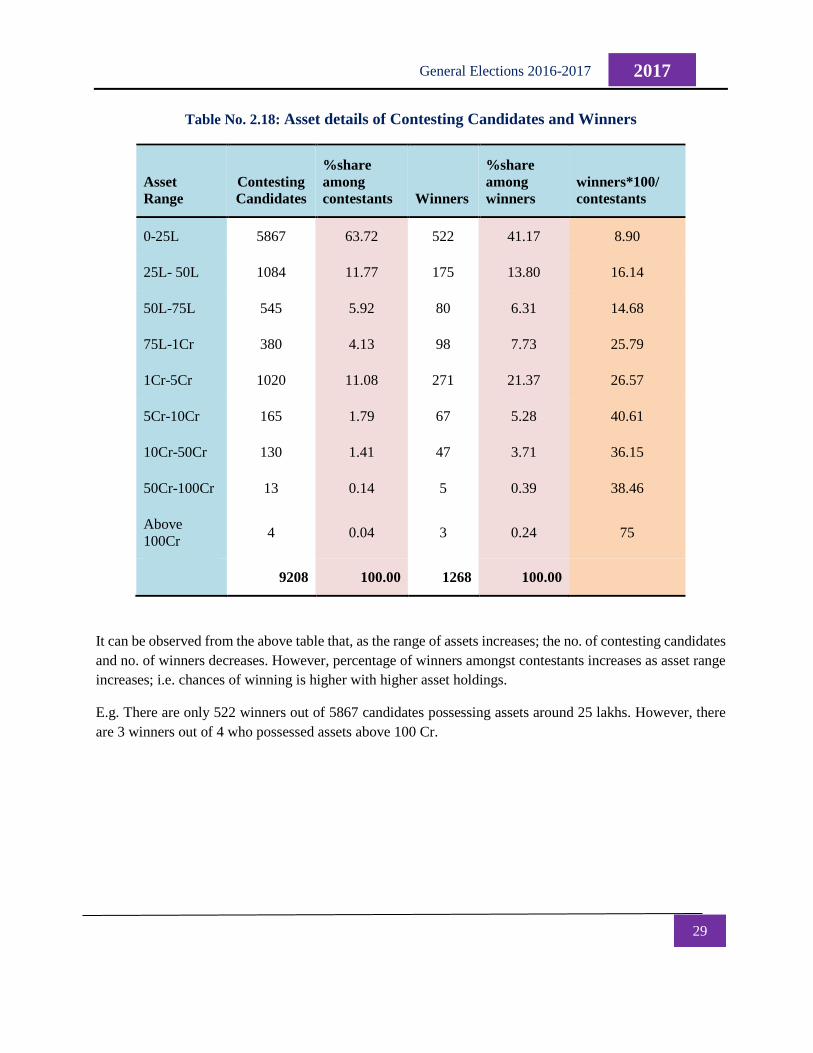
Table No. 2.18: Asset details of Contesting Candidates and Winners
Asset
Range
Contesting
Candidates
%share
among
contestants Winners
%share
among
winners
winners*100/
contestants
0-25L 5867 63.72 522 41.17 8.90
25L- 50L 1084 11.77 175 13.80 16.14
50L-75L 545 5.92 80 6.31 14.68
75L-1Cr 380 4.13 98 7.73 25.79
1Cr-5Cr 1020 11.08 271 21.37 26.57
5Cr-10Cr 165 1.79 67 5.28 40.61
10Cr-50Cr 130 1.41 47 3.71 36.15
50Cr-100Cr 13 0.14 5 0.39 38.46
Above
100Cr 4 0.04 3 0.24 75
9208 100.00 1268 100.00
It can be observed from the above table that, as the range of assets increases; the no. of contesting candidates
and no. of winners decreases. However, percentage of winners amongst contestants increases as asset range
increases; i.e. chances of winning is higher with higher asset holdings.
E.g. There are only 522 winners out of 5867 candidates possessing assets around 25 lakhs. However, there
are 3 winners out of 4 who possessed assets above 100 Cr.
30
2017 General Elections 2016-2017
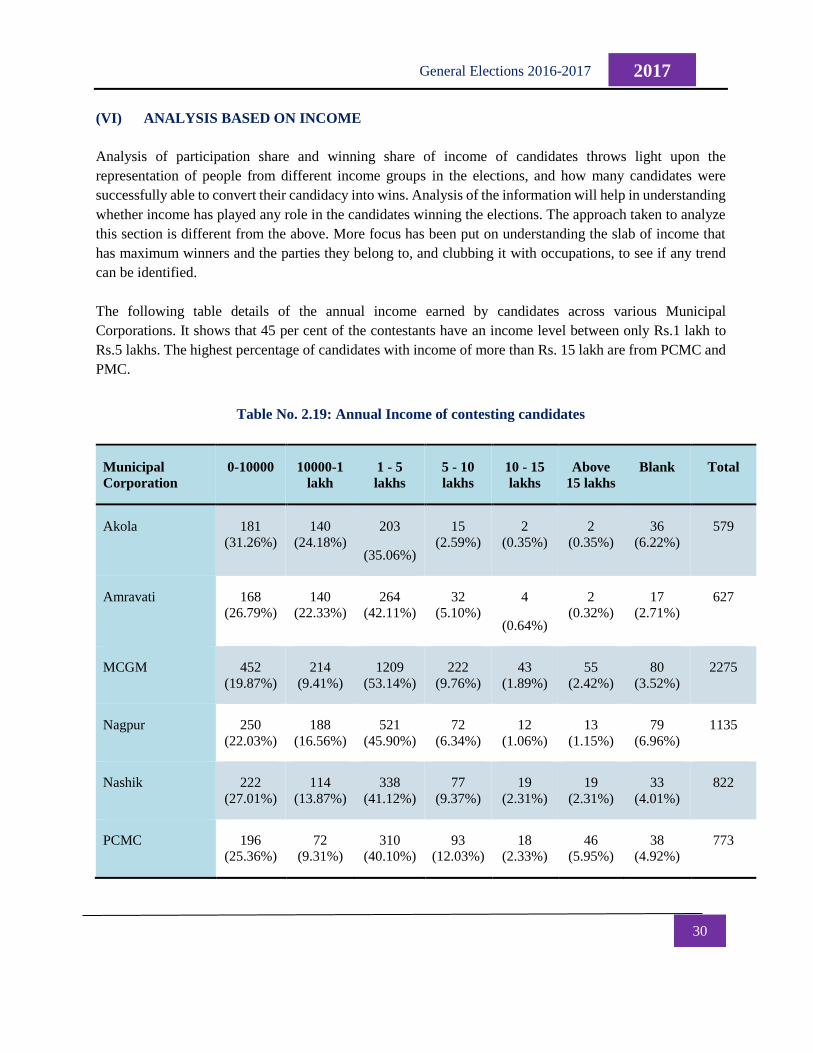
(VI) ANALYSIS BASED ON INCOME
Analysis of participation share and winning share of income of candidates throws light upon the
representation of people from different income groups in the elections, and how many candidates were
successfully able to convert their candidacy into wins. Analysis of the information will help in understanding
whether income has played any role in the candidates winning the elections. The approach taken to analyze
this section is different from the above. More focus has been put on understanding the slab of income that
has maximum winners and the parties they belong to, and clubbing it with occupations, to see if any trend
can be identified.
The following table details of the annual income earned by candidates across various Municipal
Corporations. It shows that 45 per cent of the contestants have an income level between only Rs.1 lakh to
Rs.5 lakhs. The highest percentage of candidates with income of more than Rs. 15 lakh are from PCMC and
PMC.
Table No. 2.19: Annual Income of contesting candidates
Municipal
Corporation
0-10000 10000-1
lakh
1 - 5
lakhs
5 - 10
lakhs
10 - 15
lakhs
Above
15 lakhs
Blank Total
Akola 181
(31.26%)
140
(24.18%)
203
(35.06%)
15
(2.59%)
2
(0.35%)
2
(0.35%)
36
(6.22%)
579
Amravati 168
(26.79%)
140
(22.33%)
264
(42.11%)
32
(5.10%)
4
(0.64%)
2
(0.32%)
17
(2.71%)
627
MCGM 452
(19.87%)
214
(9.41%)
1209
(53.14%)
222
(9.76%)
43
(1.89%)
55
(2.42%)
80
(3.52%)
2275
Nagpur 250
(22.03%)
188
(16.56%)
521
(45.90%)
72
(6.34%)
12
(1.06%)
13
(1.15%)
79
(6.96%)
1135
Nashik 222
(27.01%)
114
(13.87%)
338
(41.12%)
77
(9.37%)
19
(2.31%)
19
(2.31%)
33
(4.01%)
822
PCMC 196
(25.36%)
72
(9.31%)
310
(40.10%)
93
(12.03%)
18
(2.33%)
46
(5.95%)
38
(4.92%)
773
31
2017 General Elections 2016-2017
Pune 250
(22.94%)
111
(10.18%)
493
(45.23%)
113
(10.37%)
36
(3.30%)
51
(4.68%)
36
(3.30%)
1090
Solapur 115
(18.46%)
202
(32.42%)
244
(39.17%)
26
(4.17%)
5
(0.80%)
8
(1.28%)
23
(3.69%)
623
Thane 175
(21.74%)
72
(8.94%)
394
(48.94%)
81
(10.06%)
19
(2.36%)
33
(4.10%)
31
(3.85%)
805
Ulhasnagar 139
(29.02%)
66
(13.78%)
197
(41.13%)
38
(7.93%)
17
(3.55%
7
(1.46%)
15
(3.13%)
479
Grand Total 2148 1319 4173 769 175 236 388 9208
% distribution of
annual income
23.33% 14.32% 45.32% 8.35% 1.90% 2.56% 4.21%
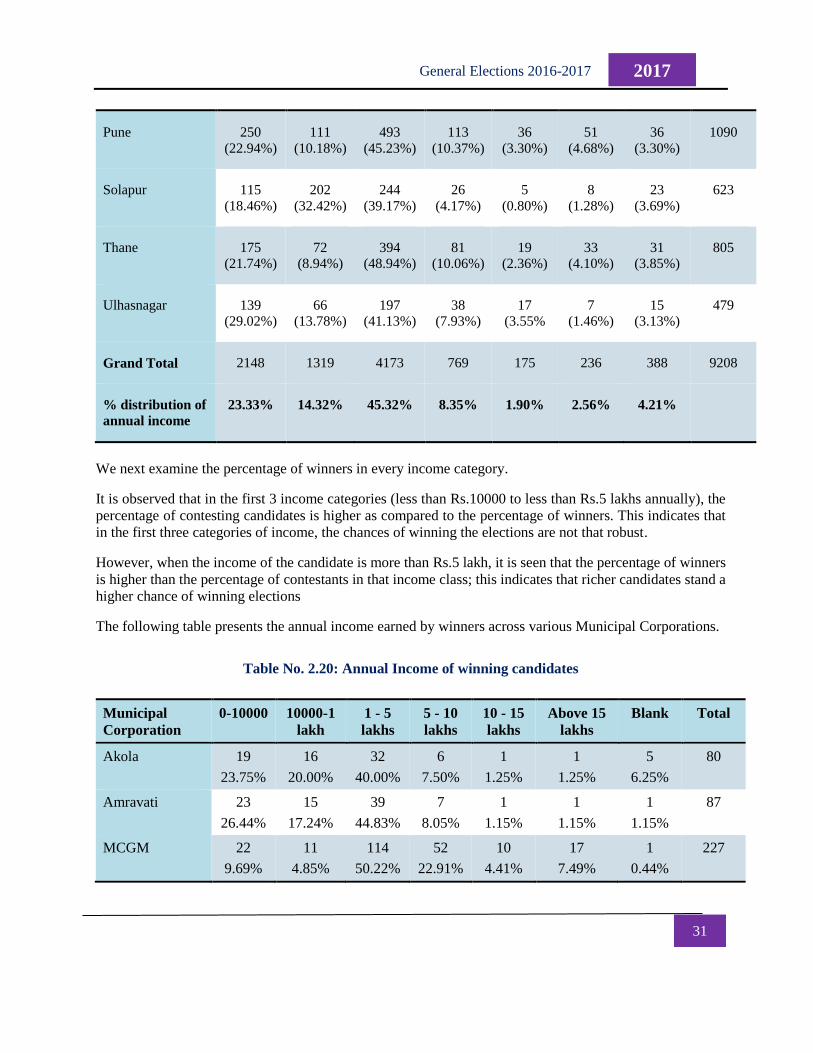
We next examine the percentage of winners in every income category.
It is observed that in the first 3 income categories (less than Rs.10000 to less than Rs.5 lakhs annually), the
percentage of contesting candidates is higher as compared to the percentage of winners. This indicates that
in the first three categories of income, the chances of winning the elections are not that robust.
However, when the income of the candidate is more than Rs.5 lakh, it is seen that the percentage of winners
is higher than the percentage of contestants in that income class; this indicates that richer candidates stand a
higher chance of winning elections
The following table presents the annual income earned by winners across various Municipal Corporations.
Table No. 2.20: Annual Income of winning candidates
Municipal
Corporation
0-10000 10000-1
lakh
1 - 5
lakhs
5 - 10
lakhs
10 - 15
lakhs
Above 15
lakhs
Blank Total
Akola 19
23.75%
16
20.00%
32
40.00%
6
7.50%
1
1.25%
1
1.25%
5
6.25%
80
Amravati 23
26.44%
15
17.24%
39
44.83%
7
8.05%
1
1.15%
1
1.15%
1
1.15%
87
MCGM 22
9.69%
11
4.85%
114
50.22%
52
22.91%
10
4.41%
17
7.49%
1
0.44%
227
32
2017 General Elections 2016-2017
Nagpur 29
19.21%
12
7.95%
79
52.32%
16
10.60%
6
3.97%
3
1.99%
6
3.97%
151
Nashik 20
16.39%
3
2.46%
53
43.44%
24
19.67%
8
6.56%
7
5.74%
7
5.74%
122
PCMC 22
17.19%
11
8.59%
49
38.28%
26
20.31%
6
4.69%
9
7.03%
5
3.91%
128
Pune 29
17.90%
1
0.62%
62
38.27%
27
16.67%
15
9.26%
20
12.35%
8
4.94%
162
Solapur 20
19.61%
20
19.61%
50
49.02%
5
4.90%
1
0.98%
2
1.96%
4
3.92%
102
Thane 21
16.03%
4
3.05%
57
43.51%
27
20.61%
5
3.82%
15
11.45%
2
1.53%
131
Ulhasnagar 13
16.67%
5
6.41%
34
43.59%
12
15.38%
7
8.97%
5
6.41%
2
2.56%
78
Grand Total
%
218 98 569 202 60 80 41 1268
17.19% 7.73% 44.87% 15.93% 4.73% 6.31% 3.23%
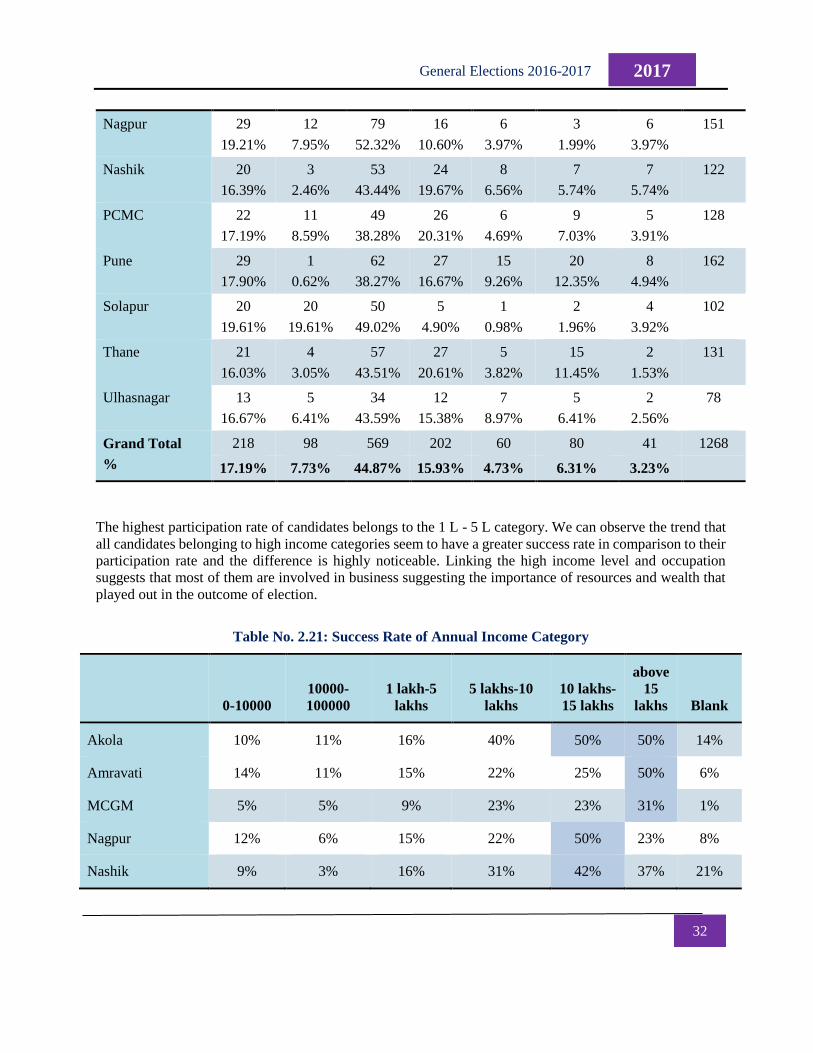
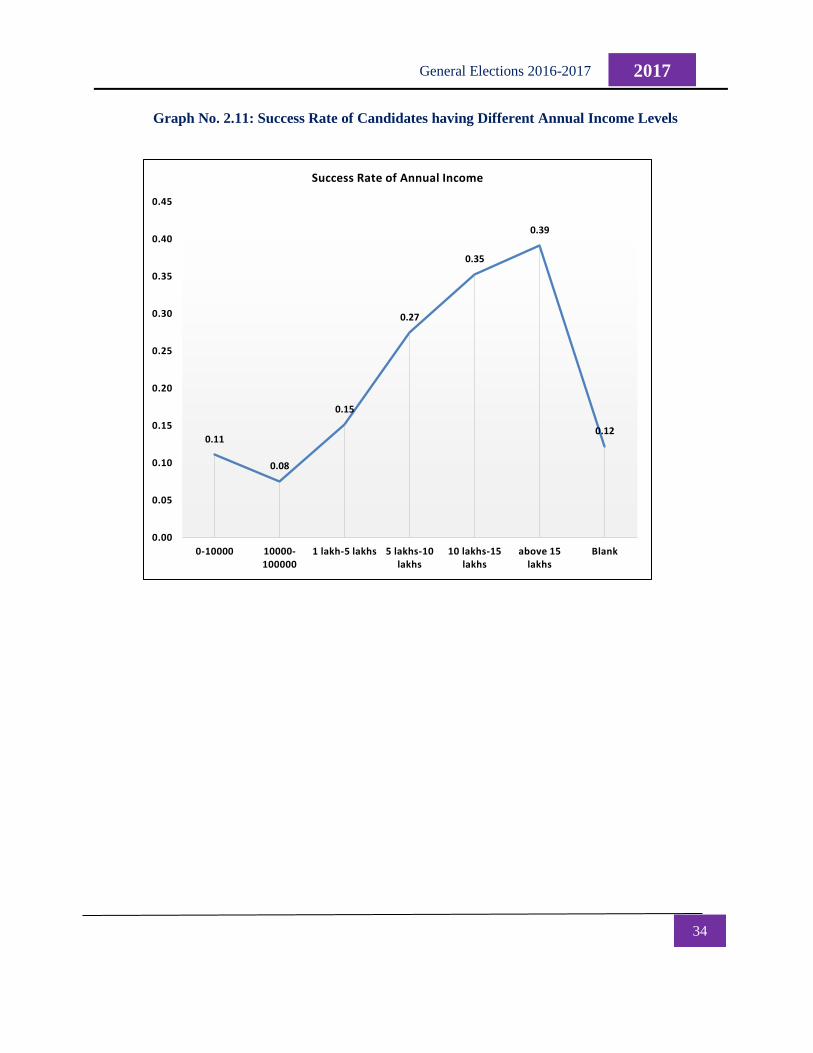
The highest participation rate of candidates belongs to the 1 L - 5 L category. We can observe the trend that
all candidates belonging to high income categories seem to have a greater success rate in comparison to their
participation rate and the difference is highly noticeable. Linking the high income level and occupation
suggests that most of them are involved in business suggesting the importance of resources and wealth that
played out in the outcome of election.
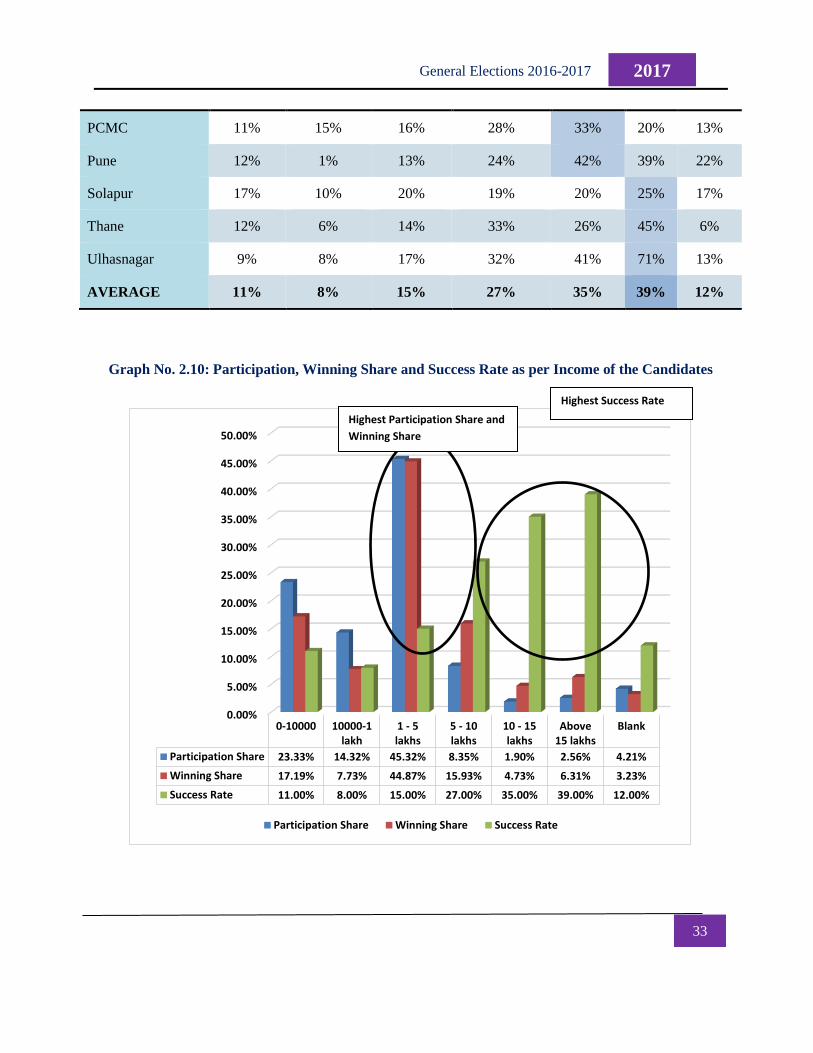
Table No. 2.21: Success Rate of Annual Income Category
0-10000
10000-
100000
1 lakh-5
lakhs
5 lakhs-10
lakhs
10 lakhs-
15 lakhs
above
15
lakhs Blank
Akola 10% 11% 16% 40% 50% 50% 14%
Amravati 14% 11% 15% 22% 25% 50% 6%
MCGM 5% 5% 9% 23% 23% 31% 1%
Nagpur 12% 6% 15% 22% 50% 23% 8%
Nashik 9% 3% 16% 31% 42% 37% 21%
33
2017 General Elections 2016-2017
PCMC 11% 15% 16% 28% 33% 20% 13%
Pune 12% 1% 13% 24% 42% 39% 22%
Solapur 17% 10% 20% 19% 20% 25% 17%
Thane 12% 6% 14% 33% 26% 45% 6%
Ulhasnagar 9% 8% 17% 32% 41% 71% 13%
AVERAGE 11% 8% 15% 27% 35% 39% 12%
Graph No. 2.10: Participation, Winning Share and Success Rate as per Income of the Candidates
0.00%
5.00%
10.00%
15.00%
20.00%
25.00%
30.00%
35.00%
40.00%
45.00%
50.00%
0-10000 10000-1lakh
1 - 5lakhs
5 - 10lakhs
10 - 15lakhs
Above15 lakhs
Blank
Participation Share 23.33% 14.32% 45.32% 8.35% 1.90% 2.56% 4.21%
Winning Share 17.19% 7.73% 44.87% 15.93% 4.73% 6.31% 3.23%
Success Rate 11.00% 8.00% 15.00% 27.00% 35.00% 39.00% 12.00%
Participation Share Winning Share Success Rate
Highest Participation Share and
Winning Share
Highest Success Rate
34
2017 General Elections 2016-2017
Graph No. 2.11: Success Rate of Candidates having Different Annual Income Levels
0.11
0.08
0.15
0.27
0.35
0.39
0.12
0.00
0.05
0.10
0.15
0.20
0.25
0.30
0.35
0.40
0.45
0-10000 10000-100000
1 lakh-5 lakhs 5 lakhs-10 lakhs
10 lakhs-15 lakhs
above 15 lakhs
Blank
Success Rate of Annual Income
35
2017 General Elections 2016-2017
(VII) ANALYSIS BASED ON ELECTIONS CONTESTED IN THE PAST
In this section, we analyze whether veteran politicians enjoy a higher probability of winning elections as
compared to novice candidates without experience
Number of elections contested previously will help us understand whether past experience has helped the
candidate in winning current elections. The more experienced contestants could have a higher probability of
winning given their familiarity to the voters and their ability to target their audience effectively through their
campaigns and networks.
It will also help us observe voting trends and patterns, if any. The approach to analyze this section is to
understand the participation share, winning share and success rates of the candidates who contested elections
previously and drill down to the party level to see the number of candidates who won with respect to the
number of elections contested.
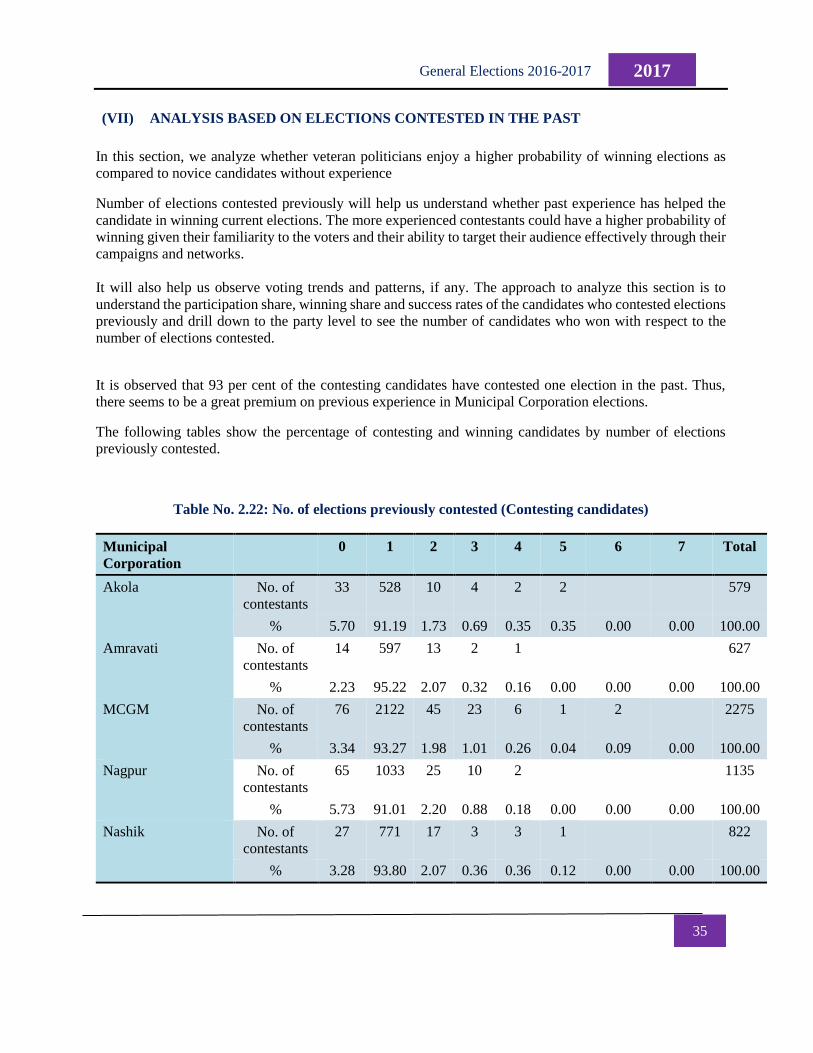
It is observed that 93 per cent of the contesting candidates have contested one election in the past. Thus,
there seems to be a great premium on previous experience in Municipal Corporation elections.
The following tables show the percentage of contesting and winning candidates by number of elections
previously contested.
Table No. 2.22: No. of elections previously contested (Contesting candidates)
Municipal
Corporation
0 1 2 3 4 5 6 7 Total
Akola
No. of
contestants
33 528 10 4 2 2
579
% 5.70 91.19 1.73 0.69 0.35 0.35 0.00 0.00 100.00
Amravati
No. of
contestants
14 597 13 2 1
627
% 2.23 95.22 2.07 0.32 0.16 0.00 0.00 0.00 100.00
MCGM
No. of
contestants
76 2122 45 23 6 1 2
2275
% 3.34 93.27 1.98 1.01 0.26 0.04 0.09 0.00 100.00
Nagpur
No. of
contestants
65 1033 25 10 2
1135
% 5.73 91.01 2.20 0.88 0.18 0.00 0.00 0.00 100.00
Nashik
No. of
contestants
27 771 17 3 3 1
822
% 3.28 93.80 2.07 0.36 0.36 0.12 0.00 0.00 100.00
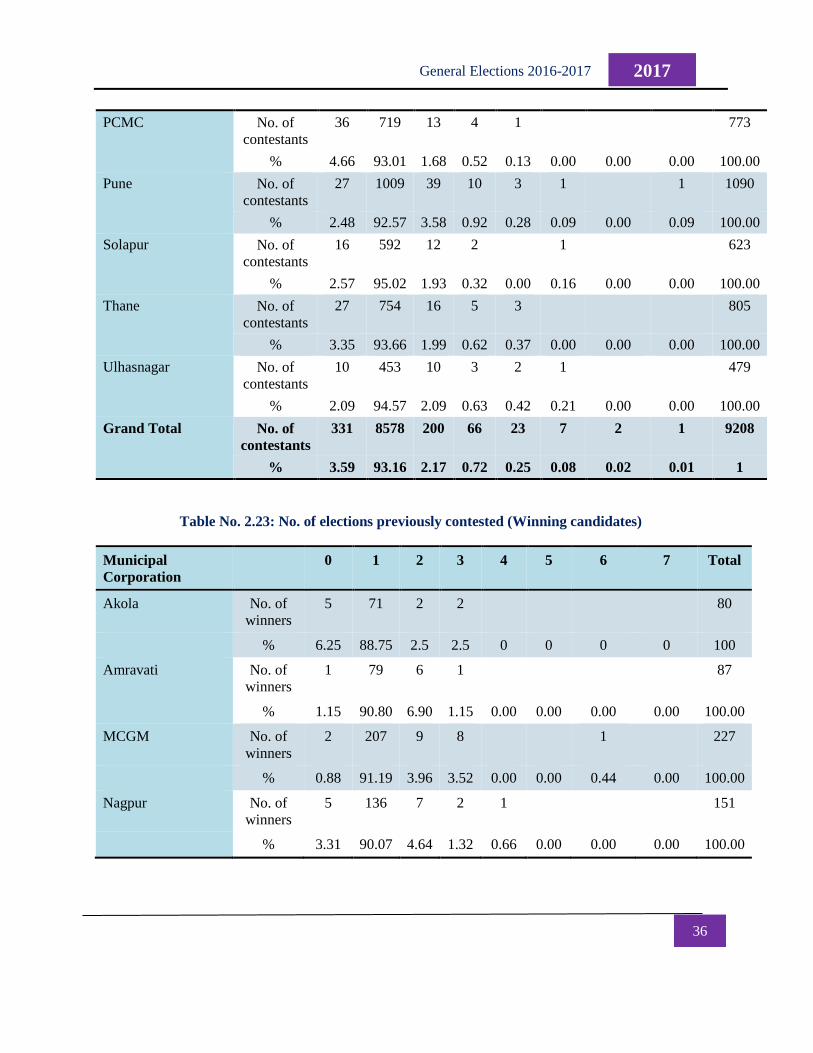
36
2017 General Elections 2016-2017
PCMC
No. of
contestants
36 719 13 4 1
773
% 4.66 93.01 1.68 0.52 0.13 0.00 0.00 0.00 100.00
Pune
No. of
contestants
27 1009 39 10 3 1
1 1090
% 2.48 92.57 3.58 0.92 0.28 0.09 0.00 0.09 100.00
Solapur
No. of
contestants
16 592 12 2
1
623
% 2.57 95.02 1.93 0.32 0.00 0.16 0.00 0.00 100.00
Thane
No. of
contestants
27 754 16 5 3
805
% 3.35 93.66 1.99 0.62 0.37 0.00 0.00 0.00 100.00
Ulhasnagar
No. of
contestants
10 453 10 3 2 1
479
% 2.09 94.57 2.09 0.63 0.42 0.21 0.00 0.00 100.00
Grand Total
No. of
contestants
331 8578 200 66 23 7 2 1 9208
% 3.59 93.16 2.17 0.72 0.25 0.08 0.02 0.01 1
Table No. 2.23: No. of elections previously contested (Winning candidates)
Municipal
Corporation
0 1 2 3 4 5 6 7 Total
Akola No. of
winners
5 71 2 2
80
% 6.25 88.75 2.5 2.5 0 0 0 0 100
Amravati No. of
winners
1 79 6 1
87
% 1.15 90.80 6.90 1.15 0.00 0.00 0.00 0.00 100.00
MCGM No. of
winners
2 207 9 8
1
227
% 0.88 91.19 3.96 3.52 0.00 0.00 0.44 0.00 100.00
Nagpur No. of
winners
5 136 7 2 1
151
% 3.31 90.07 4.64 1.32 0.66 0.00 0.00 0.00 100.00
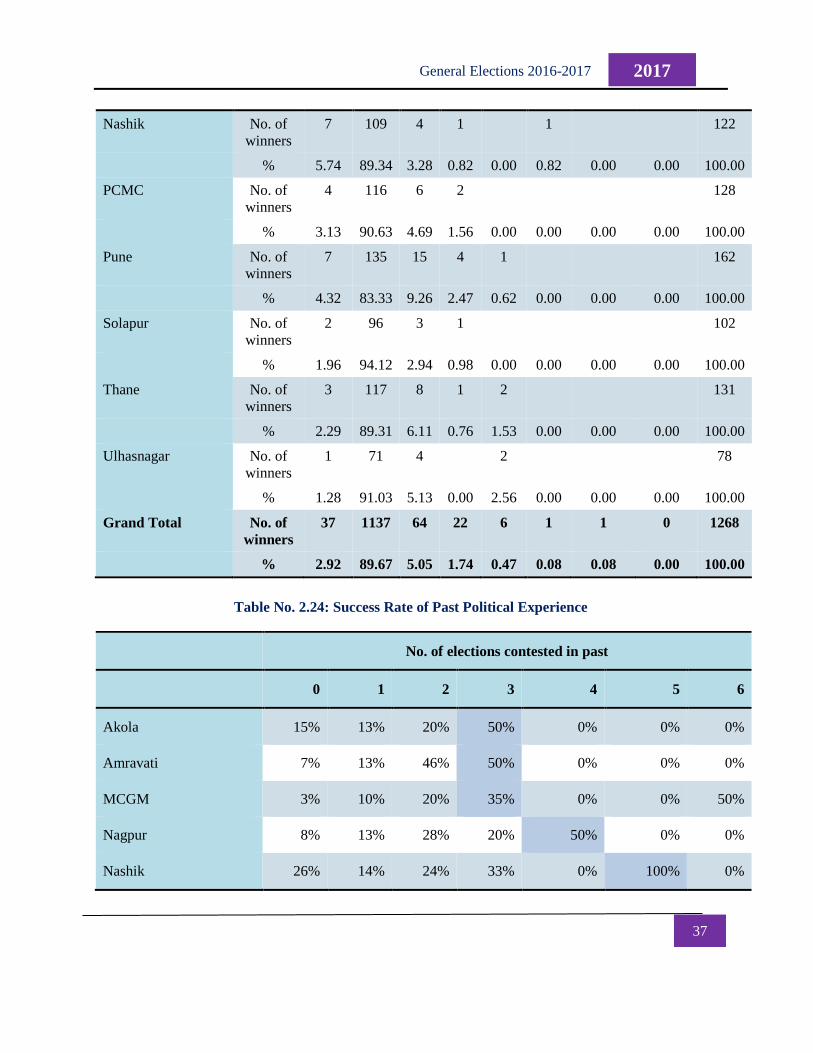
37
2017 General Elections 2016-2017
Nashik No. of
winners
7 109 4 1
1
122
% 5.74 89.34 3.28 0.82 0.00 0.82 0.00 0.00 100.00
PCMC No. of
winners
4 116 6 2
128
% 3.13 90.63 4.69 1.56 0.00 0.00 0.00 0.00 100.00
Pune No. of
winners
7 135 15 4 1
162
% 4.32 83.33 9.26 2.47 0.62 0.00 0.00 0.00 100.00
Solapur No. of
winners
2 96 3 1
102
% 1.96 94.12 2.94 0.98 0.00 0.00 0.00 0.00 100.00
Thane No. of
winners
3 117 8 1 2
131
% 2.29 89.31 6.11 0.76 1.53 0.00 0.00 0.00 100.00
Ulhasnagar No. of
winners
1 71 4
2
78
% 1.28 91.03 5.13 0.00 2.56 0.00 0.00 0.00 100.00
Grand Total No. of
winners
37 1137 64 22 6 1 1 0 1268
% 2.92 89.67 5.05 1.74 0.47 0.08 0.08 0.00 100.00
Table No. 2.24: Success Rate of Past Political Experience
No. of elections contested in past
0 1 2 3 4 5 6
Akola 15% 13% 20% 50% 0% 0% 0%
Amravati 7% 13% 46% 50% 0% 0% 0%
MCGM 3% 10% 20% 35% 0% 0% 50%
Nagpur 8% 13% 28% 20% 50% 0% 0%
Nashik 26% 14% 24% 33% 0% 100% 0%
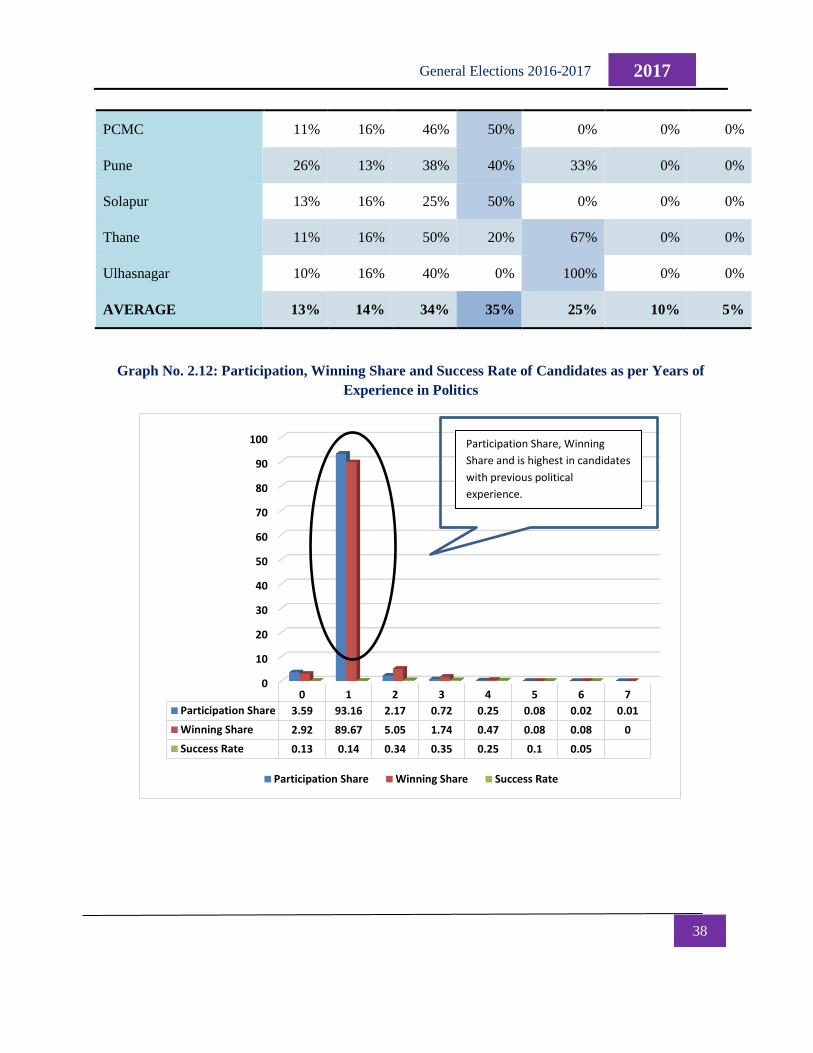
38
2017 General Elections 2016-2017
PCMC 11% 16% 46% 50% 0% 0% 0%
Pune 26% 13% 38% 40% 33% 0% 0%
Solapur 13% 16% 25% 50% 0% 0% 0%
Thane 11% 16% 50% 20% 67% 0% 0%
Ulhasnagar 10% 16% 40% 0% 100% 0% 0%
AVERAGE 13% 14% 34% 35% 25% 10% 5%
Graph No. 2.12: Participation, Winning Share and Success Rate of Candidates as per Years of
Experience in Politics
0
10
20
30
40
50
60
70
80
90
100
0 1 2 3 4 5 6 7
Participation Share 3.59 93.16 2.17 0.72 0.25 0.08 0.02 0.01
Winning Share 2.92 89.67 5.05 1.74 0.47 0.08 0.08 0
Success Rate 0.13 0.14 0.34 0.35 0.25 0.1 0.05
Participation Share Winning Share Success Rate
Participation Share, Winning
Share and is highest in candidates
with previous political
experience.
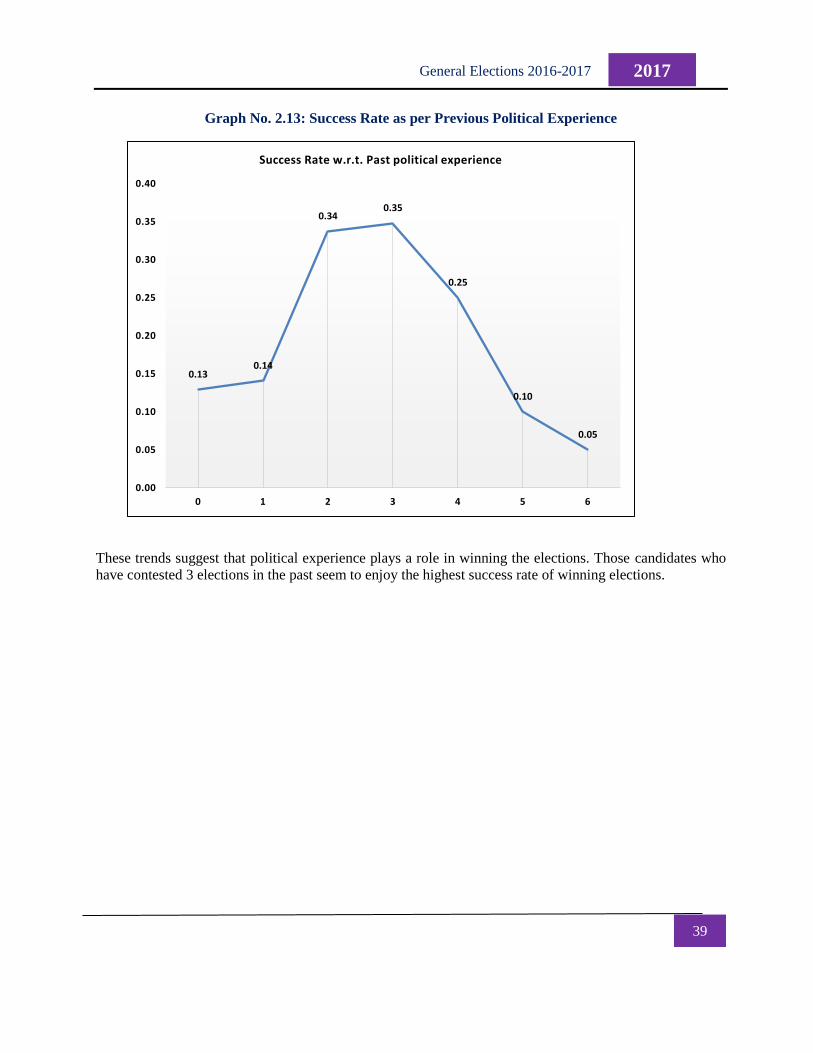
39
2017 General Elections 2016-2017
Graph No. 2.13: Success Rate as per Previous Political Experience
These trends suggest that political experience plays a role in winning the elections. Those candidates who
have contested 3 elections in the past seem to enjoy the highest success rate of winning elections.
0.130.14
0.340.35
0.25
0.10
0.05
0.00
0.05
0.10
0.15
0.20
0.25
0.30
0.35
0.40
0 1 2 3 4 5 6
Success Rate w.r.t. Past political experience
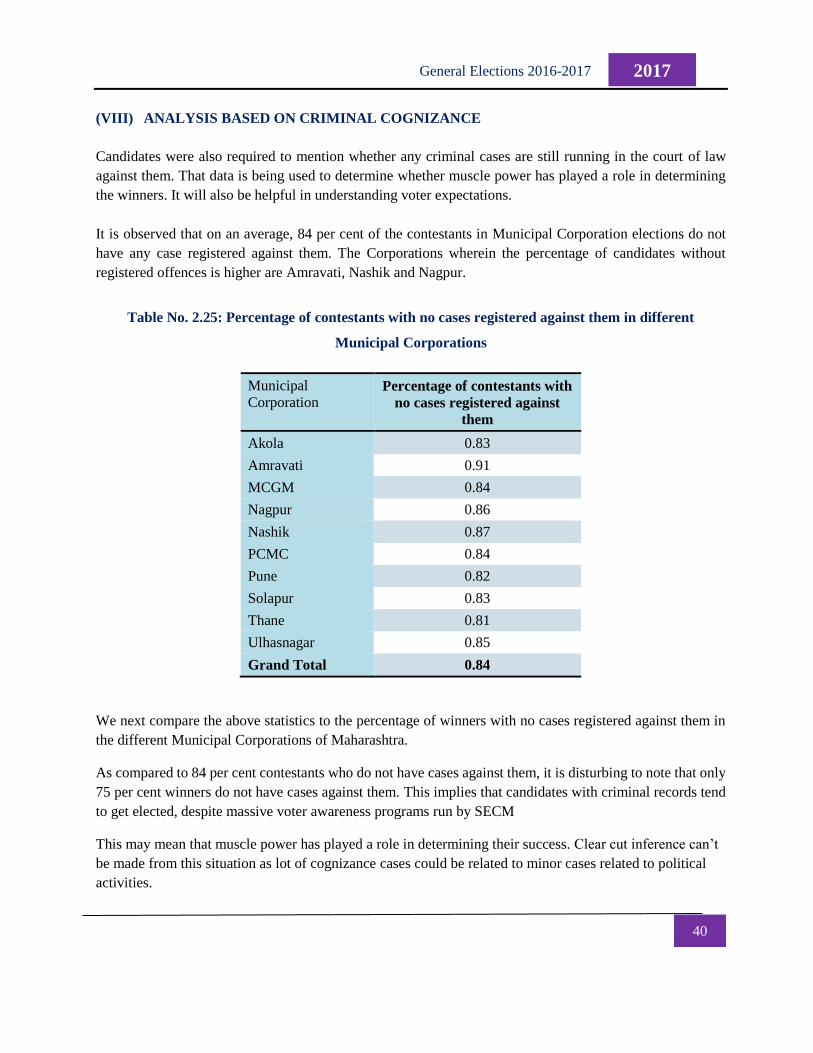
40
2017 General Elections 2016-2017
(VIII) ANALYSIS BASED ON CRIMINAL COGNIZANCE
Candidates were also required to mention whether any criminal cases are still running in the court of law
against them. That data is being used to determine whether muscle power has played a role in determining
the winners. It will also be helpful in understanding voter expectations.
It is observed that on an average, 84 per cent of the contestants in Municipal Corporation elections do not
have any case registered against them. The Corporations wherein the percentage of candidates without
registered offences is higher are Amravati, Nashik and Nagpur.
Table No. 2.25: Percentage of contestants with no cases registered against them in different
Municipal Corporations
Municipal
Corporation Percentage of contestants with
no cases registered against
them
Akola 0.83
Amravati 0.91
MCGM 0.84
Nagpur 0.86
Nashik 0.87
PCMC 0.84
Pune 0.82
Solapur 0.83
Thane 0.81
Ulhasnagar 0.85
Grand Total 0.84
We next compare the above statistics to the percentage of winners with no cases registered against them in
the different Municipal Corporations of Maharashtra.
As compared to 84 per cent contestants who do not have cases against them, it is disturbing to note that only
75 per cent winners do not have cases against them. This implies that candidates with criminal records tend
to get elected, despite massive voter awareness programs run by SECM
This may mean that muscle power has played a role in determining their success. Clear cut inference can’t
be made from this situation as lot of cognizance cases could be related to minor cases related to political
activities.
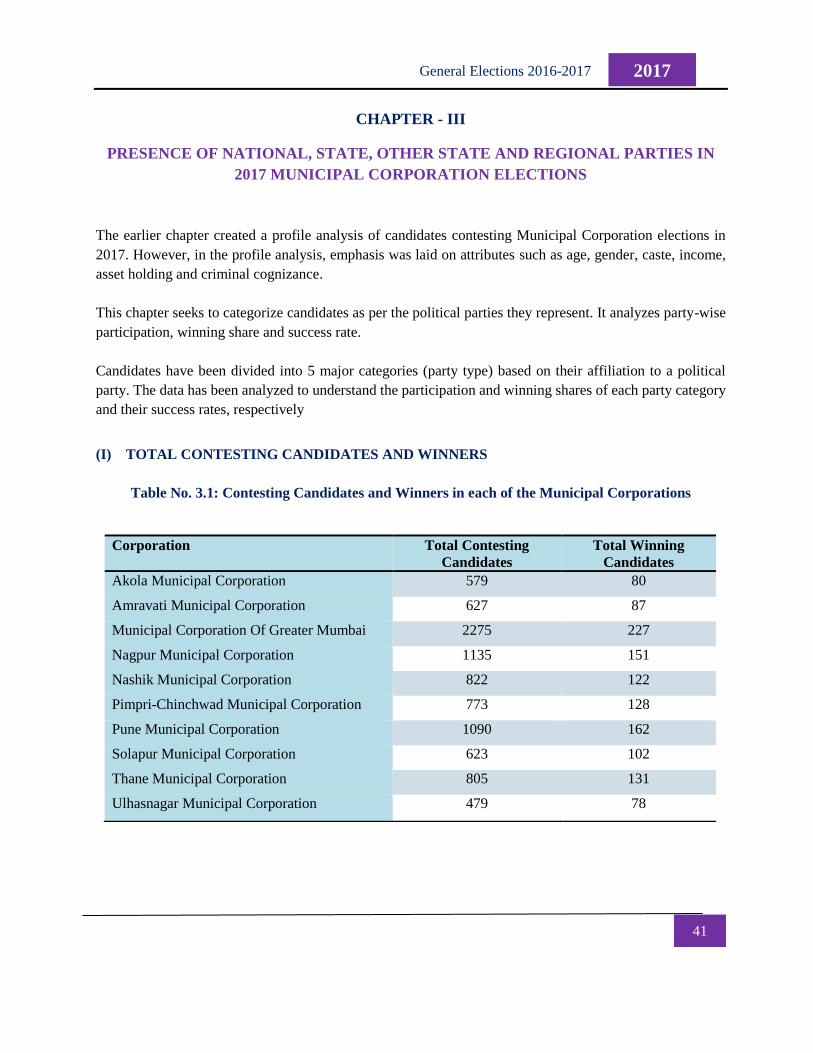
41
2017 General Elections 2016-2017
CHAPTER - III
PRESENCE OF NATIONAL, STATE, OTHER STATE AND REGIONAL PARTIES IN
2017 MUNICIPAL CORPORATION ELECTIONS
The earlier chapter created a profile analysis of candidates contesting Municipal Corporation elections in
2017. However, in the profile analysis, emphasis was laid on attributes such as age, gender, caste, income,
asset holding and criminal cognizance.
This chapter seeks to categorize candidates as per the political parties they represent. It analyzes party-wise
participation, winning share and success rate.
Candidates have been divided into 5 major categories (party type) based on their affiliation to a political
party. The data has been analyzed to understand the participation and winning shares of each party category
and their success rates, respectively
(I) TOTAL CONTESTING CANDIDATES AND WINNERS
Table No. 3.1: Contesting Candidates and Winners in each of the Municipal Corporations
Corporation Total Contesting
Candidates
Total Winning
Candidates
Akola Municipal Corporation 579 80
Amravati Municipal Corporation 627 87
Municipal Corporation Of Greater Mumbai 2275 227
Nagpur Municipal Corporation 1135 151
Nashik Municipal Corporation 822 122
Pimpri-Chinchwad Municipal Corporation 773 128
Pune Municipal Corporation 1090 162
Solapur Municipal Corporation 623 102
Thane Municipal Corporation 805 131
Ulhasnagar Municipal Corporation 479 78
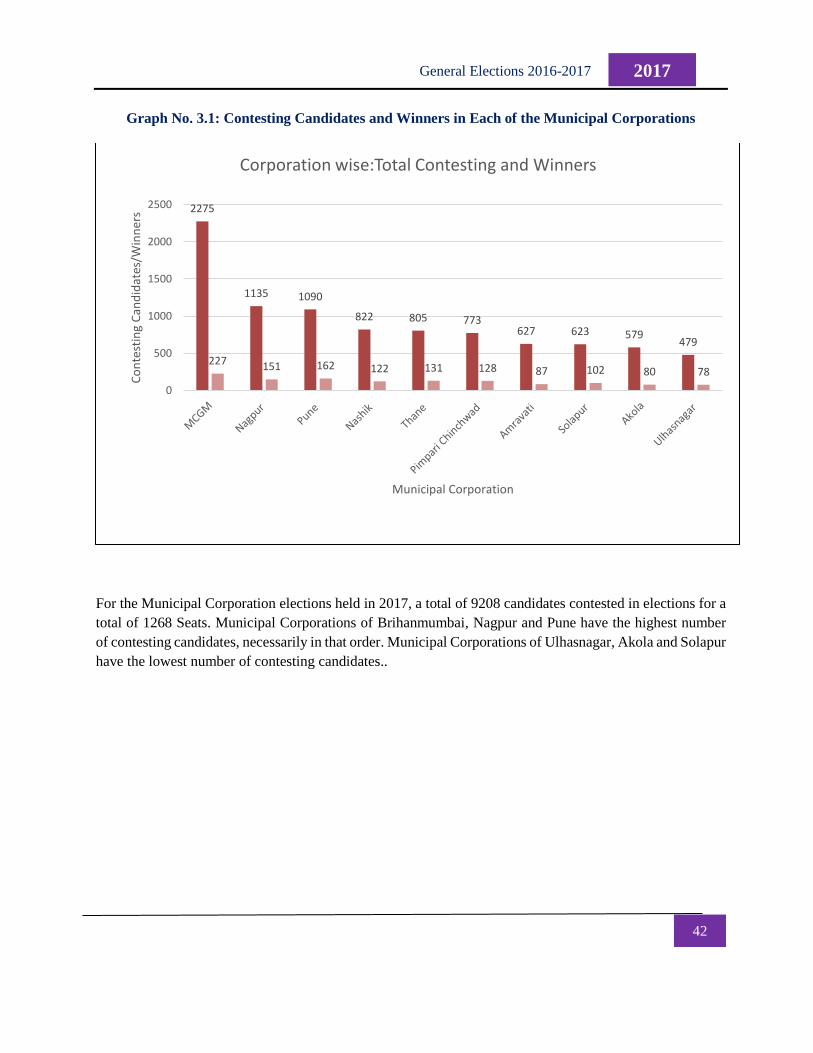
42
2017 General Elections 2016-2017
Graph No. 3.1: Contesting Candidates and Winners in Each of the Municipal Corporations
For the Municipal Corporation elections held in 2017, a total of 9208 candidates contested in elections for a
total of 1268 Seats. Municipal Corporations of Brihanmumbai, Nagpur and Pune have the highest number
of contesting candidates, necessarily in that order. Municipal Corporations of Ulhasnagar, Akola and Solapur
have the lowest number of contesting candidates..
2275
1135 1090
822 805 773627 623 579
479
227 151 162 122 131 128 87 102 80 78
0
500
1000
1500
2000
2500
Co
nte
stin
g C
and
idat
es/W
inn
ers
Municipal Corporation
Corporation wise:Total Contesting and Winners
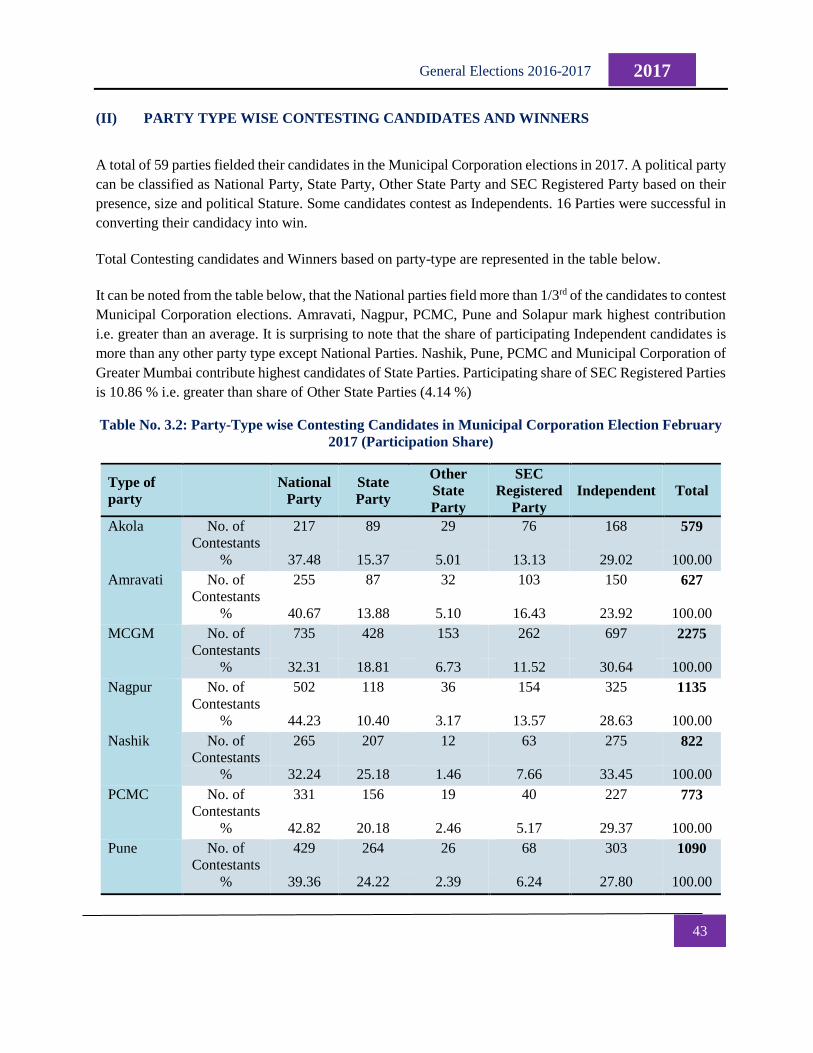
43
2017 General Elections 2016-2017
(II) PARTY TYPE WISE CONTESTING CANDIDATES AND WINNERS
A total of 59 parties fielded their candidates in the Municipal Corporation elections in 2017. A political party
can be classified as National Party, State Party, Other State Party and SEC Registered Party based on their
presence, size and political Stature. Some candidates contest as Independents. 16 Parties were successful in
converting their candidacy into win.
Total Contesting candidates and Winners based on party-type are represented in the table below.
It can be noted from the table below, that the National parties field more than 1/3rd of the candidates to contest
Municipal Corporation elections. Amravati, Nagpur, PCMC, Pune and Solapur mark highest contribution
i.e. greater than an average. It is surprising to note that the share of participating Independent candidates is
more than any other party type except National Parties. Nashik, Pune, PCMC and Municipal Corporation of
Greater Mumbai contribute highest candidates of State Parties. Participating share of SEC Registered Parties
is 10.86 % i.e. greater than share of Other State Parties (4.14 %)
Table No. 3.2: Party-Type wise Contesting Candidates in Municipal Corporation Election February
2017 (Participation Share)
Type of
party
National
Party
State
Party
Other
State
Party
SEC
Registered
Party
Independent Total
Akola No. of
Contestants
217 89 29 76 168 579
% 37.48 15.37 5.01 13.13 29.02 100.00
Amravati No. of
Contestants
255 87 32 103 150 627
% 40.67 13.88 5.10 16.43 23.92 100.00
MCGM No. of
Contestants
735 428 153 262 697 2275
% 32.31 18.81 6.73 11.52 30.64 100.00
Nagpur No. of
Contestants
502 118 36 154 325 1135
% 44.23 10.40 3.17 13.57 28.63 100.00
Nashik No. of
Contestants
265 207 12 63 275 822
% 32.24 25.18 1.46 7.66 33.45 100.00
PCMC No. of
Contestants
331 156 19 40 227 773
% 42.82 20.18 2.46 5.17 29.37 100.00
Pune No. of
Contestants
429 264 26 68 303 1090
% 39.36 24.22 2.39 6.24 27.80 100.00
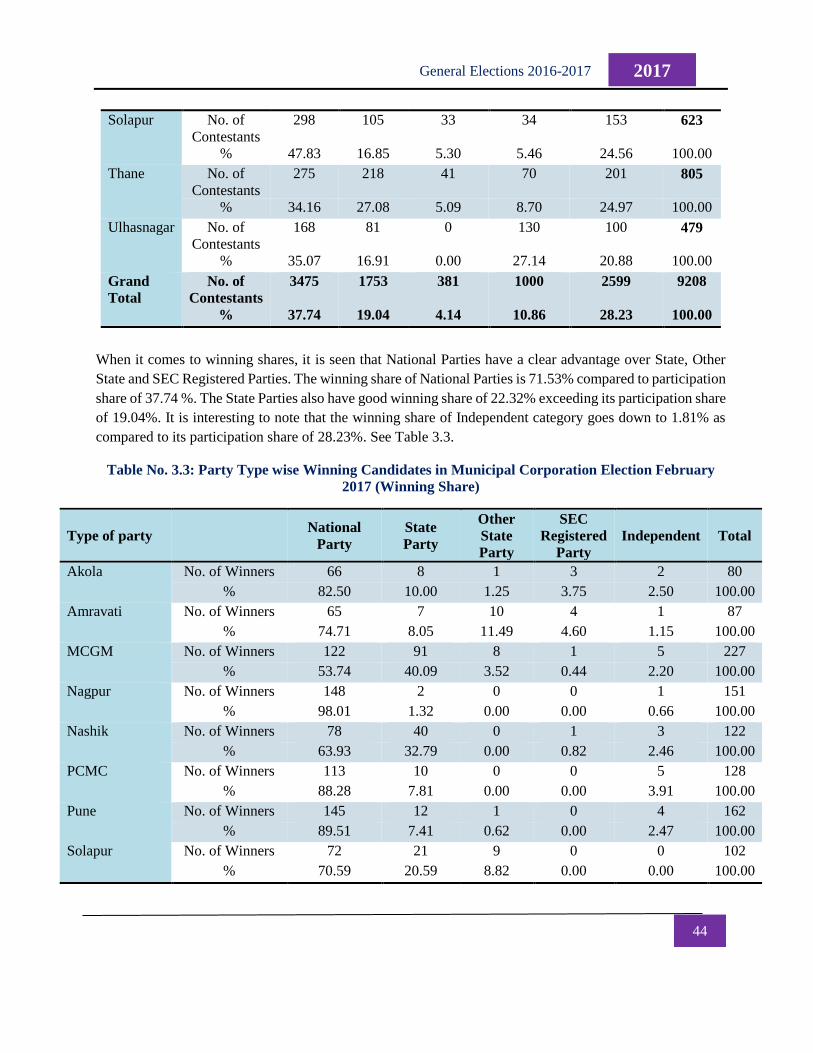
44
2017 General Elections 2016-2017
Solapur No. of
Contestants
298 105 33 34 153 623
% 47.83 16.85 5.30 5.46 24.56 100.00
Thane No. of
Contestants
275 218 41 70 201 805
% 34.16 27.08 5.09 8.70 24.97 100.00
Ulhasnagar No. of
Contestants
168 81 0 130 100 479
% 35.07 16.91 0.00 27.14 20.88 100.00
Grand
Total
No. of
Contestants
3475 1753 381 1000 2599 9208
% 37.74 19.04 4.14 10.86 28.23 100.00
When it comes to winning shares, it is seen that National Parties have a clear advantage over State, Other
State and SEC Registered Parties. The winning share of National Parties is 71.53% compared to participation
share of 37.74 %. The State Parties also have good winning share of 22.32% exceeding its participation share
of 19.04%. It is interesting to note that the winning share of Independent category goes down to 1.81% as
compared to its participation share of 28.23%. See Table 3.3.
Table No. 3.3: Party Type wise Winning Candidates in Municipal Corporation Election February
2017 (Winning Share)
Type of party National
Party
State
Party
Other
State
Party
SEC
Registered
Party
Independent Total
Akola No. of Winners 66 8 1 3 2 80
% 82.50 10.00 1.25 3.75 2.50 100.00
Amravati No. of Winners 65 7 10 4 1 87
% 74.71 8.05 11.49 4.60 1.15 100.00
MCGM No. of Winners 122 91 8 1 5 227
% 53.74 40.09 3.52 0.44 2.20 100.00
Nagpur No. of Winners 148 2 0 0 1 151
% 98.01 1.32 0.00 0.00 0.66 100.00
Nashik No. of Winners 78 40 0 1 3 122
% 63.93 32.79 0.00 0.82 2.46 100.00
PCMC No. of Winners 113 10 0 0 5 128
% 88.28 7.81 0.00 0.00 3.91 100.00
Pune No. of Winners 145 12 1 0 4 162
% 89.51 7.41 0.62 0.00 2.47 100.00
Solapur No. of Winners 72 21 9 0 0 102
% 70.59 20.59 8.82 0.00 0.00 100.00
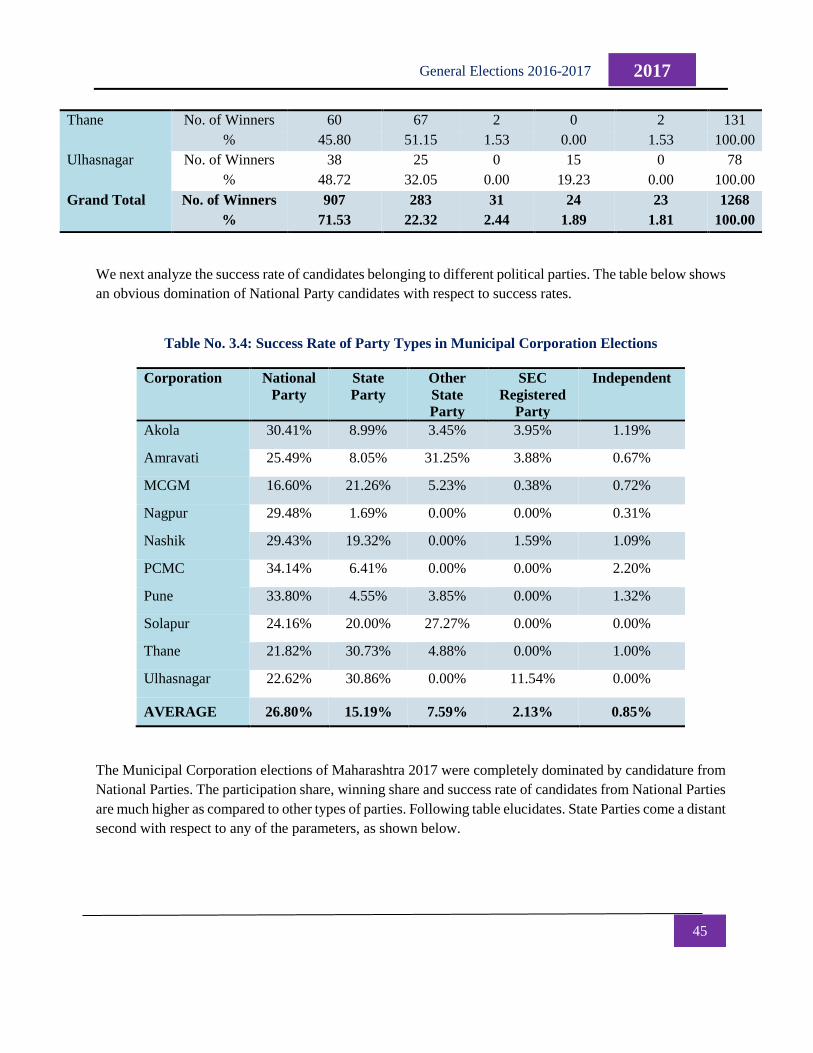
45
2017 General Elections 2016-2017
Thane No. of Winners 60 67 2 0 2 131
% 45.80 51.15 1.53 0.00 1.53 100.00
Ulhasnagar No. of Winners 38 25 0 15 0 78
% 48.72 32.05 0.00 19.23 0.00 100.00
Grand Total No. of Winners 907 283 31 24 23 1268
% 71.53 22.32 2.44 1.89 1.81 100.00
We next analyze the success rate of candidates belonging to different political parties. The table below shows
an obvious domination of National Party candidates with respect to success rates.
Table No. 3.4: Success Rate of Party Types in Municipal Corporation Elections
Corporation National
Party
State
Party
Other
State
Party
SEC
Registered
Party
Independent
Akola 30.41% 8.99% 3.45% 3.95% 1.19%
Amravati 25.49% 8.05% 31.25% 3.88% 0.67%
MCGM 16.60% 21.26% 5.23% 0.38% 0.72%
Nagpur 29.48% 1.69% 0.00% 0.00% 0.31%
Nashik 29.43% 19.32% 0.00% 1.59% 1.09%
PCMC 34.14% 6.41% 0.00% 0.00% 2.20%
Pune 33.80% 4.55% 3.85% 0.00% 1.32%
Solapur 24.16% 20.00% 27.27% 0.00% 0.00%
Thane 21.82% 30.73% 4.88% 0.00% 1.00%
Ulhasnagar 22.62% 30.86% 0.00% 11.54% 0.00%
AVERAGE 26.80% 15.19% 7.59% 2.13% 0.85%
The Municipal Corporation elections of Maharashtra 2017 were completely dominated by candidature from
National Parties. The participation share, winning share and success rate of candidates from National Parties
are much higher as compared to other types of parties. Following table elucidates. State Parties come a distant
second with respect to any of the parameters, as shown below.
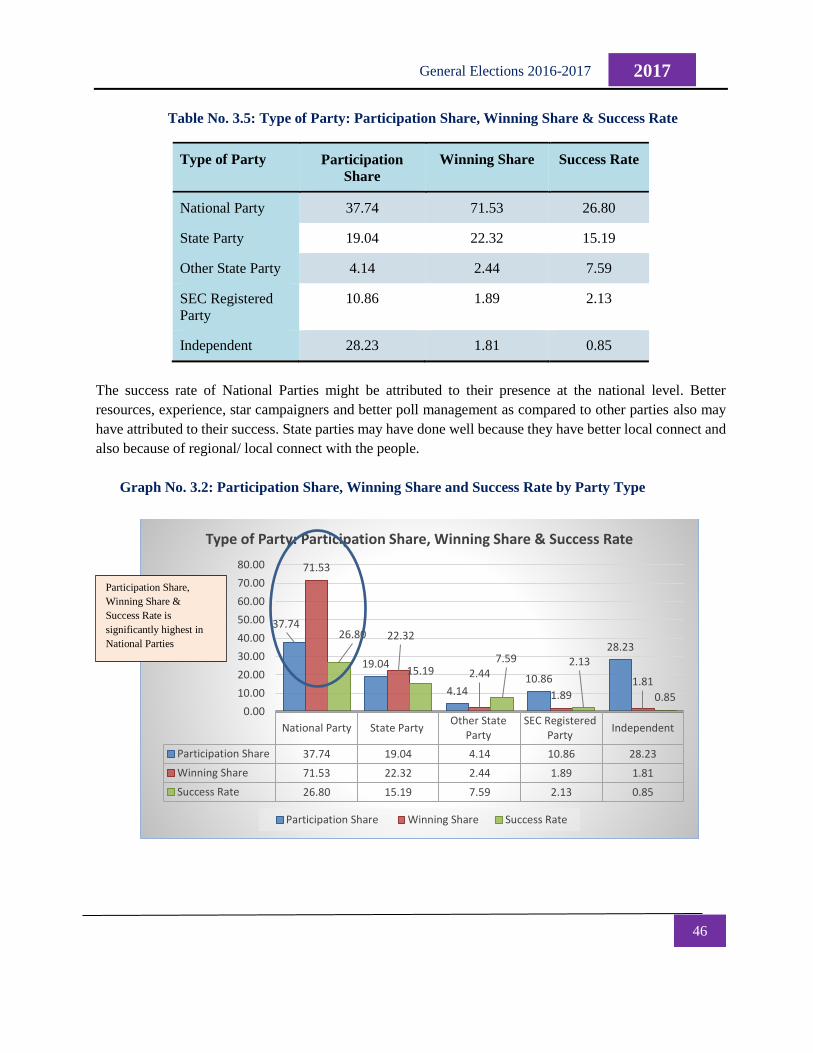
46
2017 General Elections 2016-2017
Table No. 3.5: Type of Party: Participation Share, Winning Share & Success Rate
Type of Party Participation
Share
Winning Share Success Rate
National Party 37.74 71.53 26.80
State Party 19.04 22.32 15.19
Other State Party 4.14 2.44 7.59
SEC Registered
Party
10.86 1.89 2.13
Independent 28.23 1.81 0.85
The success rate of National Parties might be attributed to their presence at the national level. Better
resources, experience, star campaigners and better poll management as compared to other parties also may
have attributed to their success. State parties may have done well because they have better local connect and
also because of regional/ local connect with the people.
Graph No. 3.2: Participation Share, Winning Share and Success Rate by Party Type
National Party State PartyOther State
PartySEC Registered
PartyIndependent
Participation Share 37.74 19.04 4.14 10.86 28.23
Winning Share 71.53 22.32 2.44 1.89 1.81
Success Rate 26.80 15.19 7.59 2.13 0.85
37.74
19.04
4.1410.86
28.23
71.53
22.32
2.44
1.891.81
26.80
15.197.59 2.13
0.850.00
10.00
20.00
30.00
40.00
50.00
60.00
70.00
80.00
Type of Party: Participation Share, Winning Share & Success Rate
Participation Share Winning Share Success Rate
Participation Share,
Winning Share &
Success Rate is
significantly highest in
National Parties
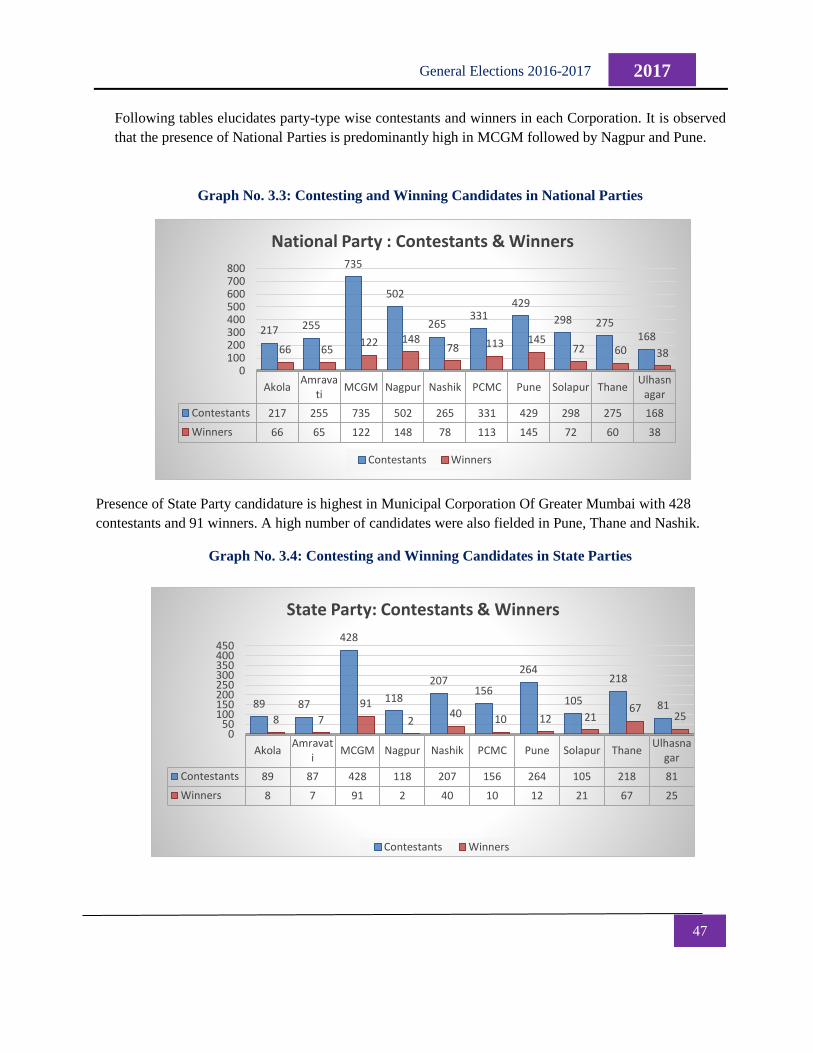
47
2017 General Elections 2016-2017
Following tables elucidates party-type wise contestants and winners in each Corporation. It is observed
that the presence of National Parties is predominantly high in MCGM followed by Nagpur and Pune.
Graph No. 3.3: Contesting and Winning Candidates in National Parties
Presence of State Party candidature is highest in Municipal Corporation Of Greater Mumbai with 428
contestants and 91 winners. A high number of candidates were also fielded in Pune, Thane and Nashik.
Graph No. 3.4: Contesting and Winning Candidates in State Parties
AkolaAmrava
tiMCGM Nagpur Nashik PCMC Pune Solapur Thane
Ulhasnagar
Contestants 217 255 735 502 265 331 429 298 275 168
Winners 66 65 122 148 78 113 145 72 60 38
217 255
735
502
265331
429
298 275168
66 65122 148
78 113 14572 60 38
0100200300400500600700800
National Party : Contestants & Winners
Contestants Winners
AkolaAmravat
iMCGM Nagpur Nashik PCMC Pune Solapur Thane
Ulhasnagar
Contestants 89 87 428 118 207 156 264 105 218 81
Winners 8 7 91 2 40 10 12 21 67 25
89 87
428
118
207156
264
105
218
818 7
91
240 10 12 21
6725
050
100150200250300350400450
State Party: Contestants & Winners
Contestants Winners
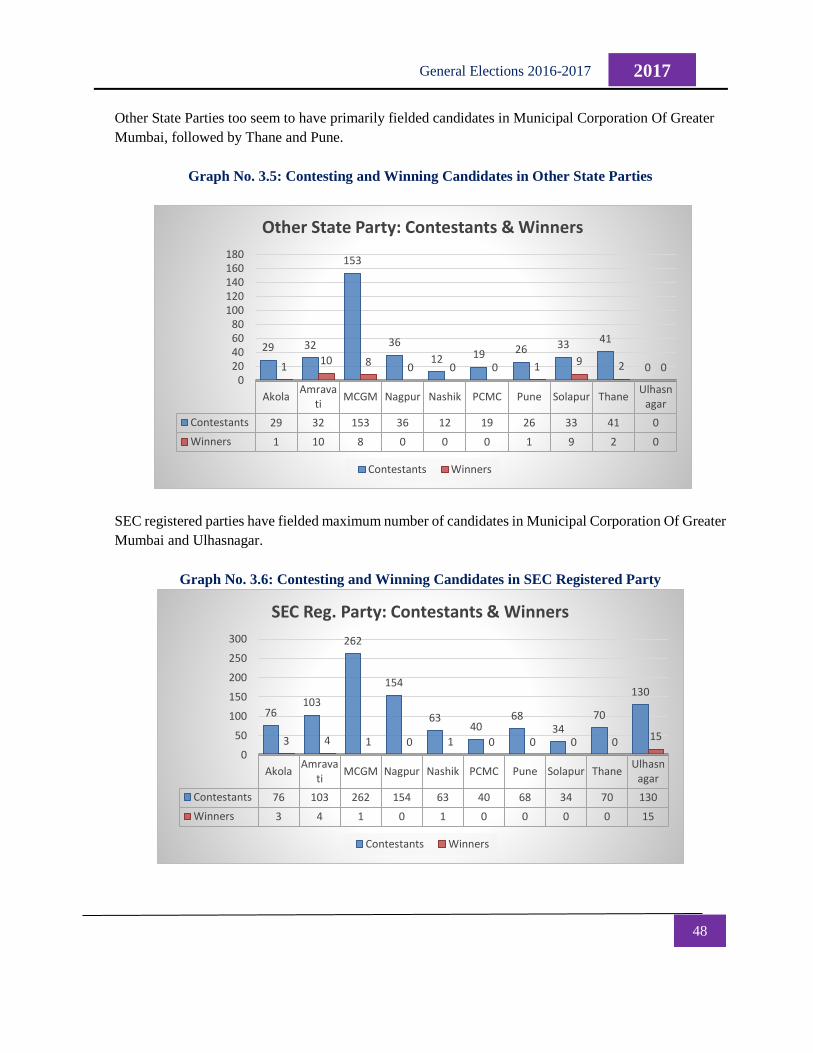
48
2017 General Elections 2016-2017
Other State Parties too seem to have primarily fielded candidates in Municipal Corporation Of Greater
Mumbai, followed by Thane and Pune.
Graph No. 3.5: Contesting and Winning Candidates in Other State Parties
SEC registered parties have fielded maximum number of candidates in Municipal Corporation Of Greater
Mumbai and Ulhasnagar.
Graph No. 3.6: Contesting and Winning Candidates in SEC Registered Party
AkolaAmrava
tiMCGM Nagpur Nashik PCMC Pune Solapur Thane
Ulhasnagar
Contestants 29 32 153 36 12 19 26 33 41 0
Winners 1 10 8 0 0 0 1 9 2 0
29 32
153
36
12 19 26 33 41
0110 8 0 0 0 1 9 2 0
020406080
100120140160180
Other State Party: Contestants & Winners
Contestants Winners
AkolaAmrava
tiMCGM Nagpur Nashik PCMC Pune Solapur Thane
Ulhasnagar
Contestants 76 103 262 154 63 40 68 34 70 130
Winners 3 4 1 0 1 0 0 0 0 15
76103
262
154
6340
6834
70
130
3 4 1 0 1 0 0 0 0 15
0
50
100
150
200
250
300
SEC Reg. Party: Contestants & Winners
Contestants Winners
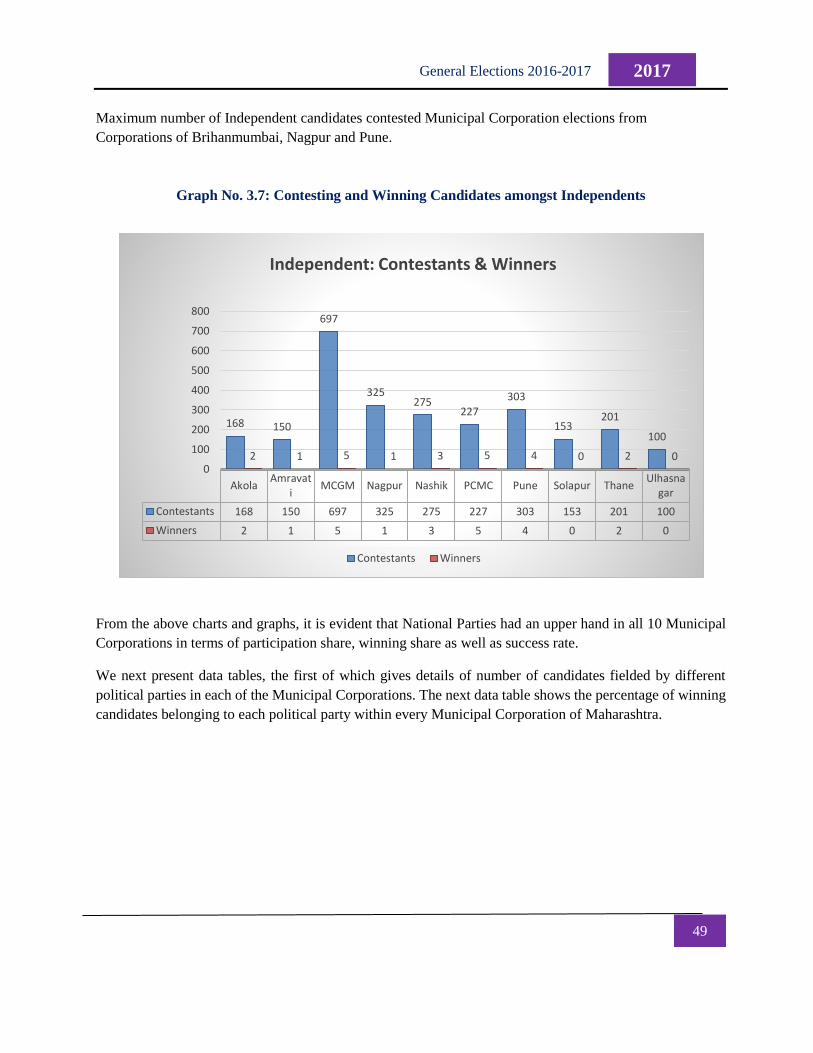
49
2017 General Elections 2016-2017
Maximum number of Independent candidates contested Municipal Corporation elections from
Corporations of Brihanmumbai, Nagpur and Pune.
Graph No. 3.7: Contesting and Winning Candidates amongst Independents
From the above charts and graphs, it is evident that National Parties had an upper hand in all 10 Municipal
Corporations in terms of participation share, winning share as well as success rate.
We next present data tables, the first of which gives details of number of candidates fielded by different
political parties in each of the Municipal Corporations. The next data table shows the percentage of winning
candidates belonging to each political party within every Municipal Corporation of Maharashtra.
AkolaAmravat
iMCGM Nagpur Nashik PCMC Pune Solapur Thane
Ulhasnagar
Contestants 168 150 697 325 275 227 303 153 201 100
Winners 2 1 5 1 3 5 4 0 2 0
168 150
697
325275
227
303
153201
100
2 1 5 1 3 5 4 0 2 00
100
200
300
400
500
600
700
800
Independent: Contestants & Winners
Contestants Winners
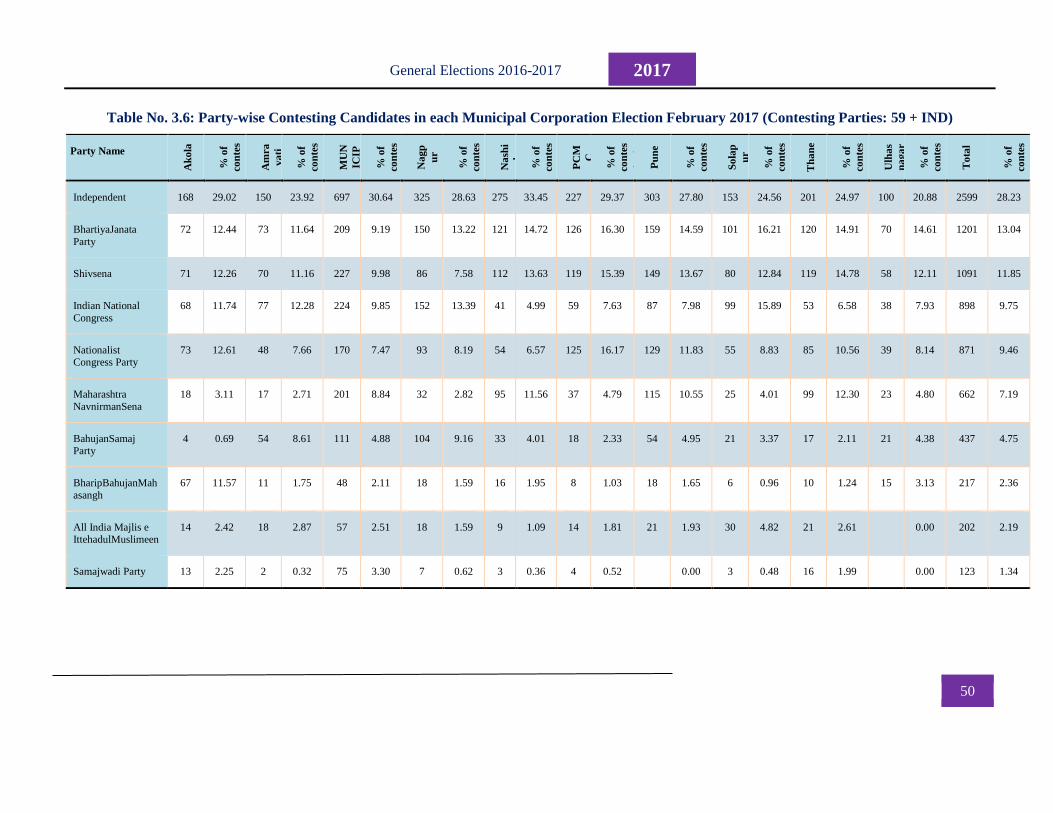
50
2017 General Elections 2016-2017
Table No. 3.6: Party-wise Contesting Candidates in each Municipal Corporation Election February 2017 (Contesting Parties: 59 + IND)
Party Name
Ak
ola
% o
f
co
nte
s
tan
ts
Am
ra
va
ti
% o
f
co
nte
s
tan
ts
MU
N
ICIP
AL
CO
R
PO
R
AT
IO
N O
F
GR
E
AT
E
R
MU
M
BA
I
% o
f
co
nte
s
tan
ts
Na
gp
ur
% o
f
co
nte
s
tan
ts
Na
shi
k
% o
f
co
nte
s
tan
ts
PC
M
C
% o
f
co
nte
s
tan
ts
Pu
ne
% o
f
co
nte
s
tan
ts
So
lap
ur
% o
f
co
nte
s
tan
ts
Th
an
e
% o
f
co
nte
s
tan
ts
Ulh
as
na
ga
r
% o
f
co
nte
s
tan
ts
To
tal
% o
f
co
nte
s
tan
ts
Independent 168 29.02 150 23.92 697 30.64 325 28.63 275 33.45 227 29.37 303 27.80 153 24.56 201 24.97 100 20.88 2599 28.23
BhartiyaJanata
Party
72 12.44 73 11.64 209 9.19 150 13.22 121 14.72 126 16.30 159 14.59 101 16.21 120 14.91 70 14.61 1201 13.04
Shivsena 71 12.26 70 11.16 227 9.98 86 7.58 112 13.63 119 15.39 149 13.67 80 12.84 119 14.78 58 12.11 1091 11.85
Indian National
Congress
68 11.74 77 12.28 224 9.85 152 13.39 41 4.99 59 7.63 87 7.98 99 15.89 53 6.58 38 7.93 898 9.75
Nationalist Congress Party
73 12.61 48 7.66 170 7.47 93 8.19 54 6.57 125 16.17 129 11.83 55 8.83 85 10.56 39 8.14 871 9.46
Maharashtra
NavnirmanSena
18 3.11 17 2.71 201 8.84 32 2.82 95 11.56 37 4.79 115 10.55 25 4.01 99 12.30 23 4.80 662 7.19
BahujanSamaj Party
4 0.69 54 8.61 111 4.88 104 9.16 33 4.01 18 2.33 54 4.95 21 3.37 17 2.11 21 4.38 437 4.75
BharipBahujanMah
asangh
67 11.57 11 1.75 48 2.11 18 1.59 16 1.95 8 1.03 18 1.65 6 0.96 10 1.24 15 3.13 217 2.36
All India Majlis e IttehadulMuslimeen
14 2.42 18 2.87 57 2.51 18 1.59 9 1.09 14 1.81 21 1.93 30 4.82 21 2.61
0.00 202 2.19
Samajwadi Party 13 2.25 2 0.32 75 3.30 7 0.62 3 0.36 4 0.52
0.00 3 0.48 16 1.99
0.00 123 1.34
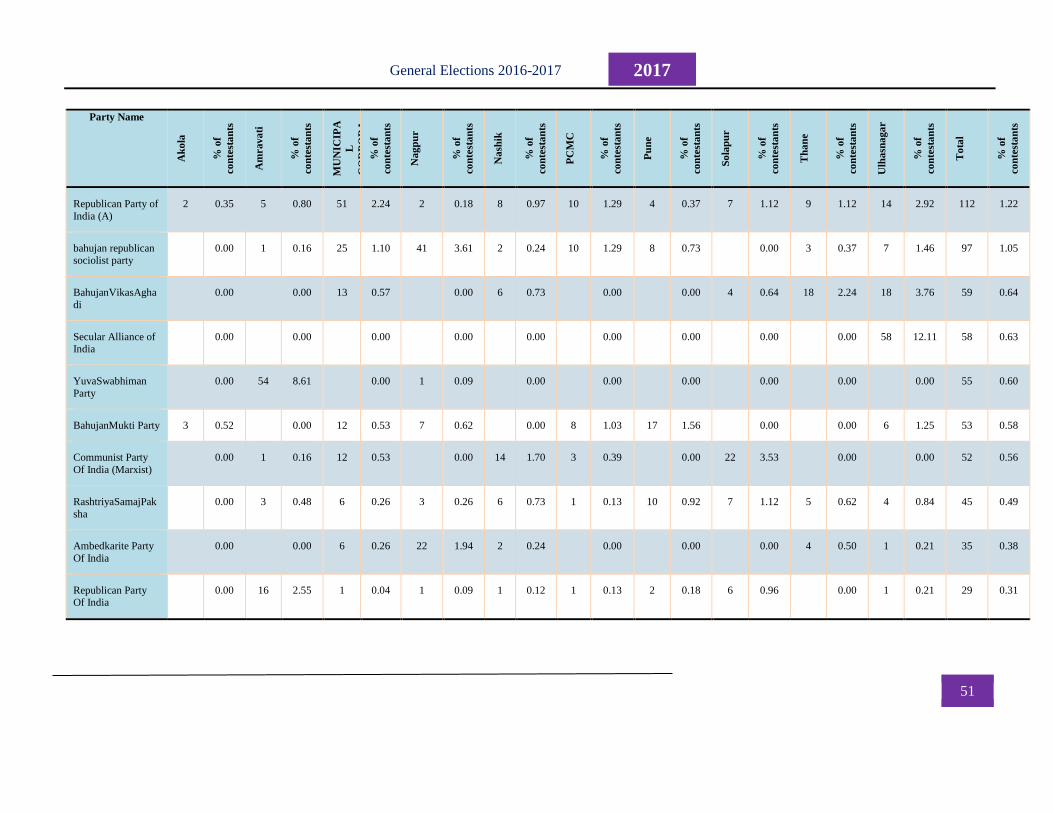
51
2017 General Elections 2016-2017
Party Name
Ak
ola
% o
f
co
nte
sta
nts
Am
rava
ti
% o
f
co
nte
sta
nts
MU
NIC
IPA
L
CO
RP
OR
A
TIO
N O
F
GR
EA
TE
R
MU
MB
AI
% o
f
co
nte
sta
nts
Na
gp
ur
% o
f
co
nte
sta
nts
Na
shik
% o
f
co
nte
sta
nts
PC
MC
% o
f
co
nte
sta
nts
Pu
ne
% o
f
co
nte
sta
nts
So
lap
ur
% o
f
co
nte
sta
nts
Th
an
e
% o
f
co
nte
sta
nts
Ulh
asn
aga
r
% o
f
co
nte
sta
nts
To
tal
% o
f
co
nte
sta
nts
Republican Party of
India (A)
2 0.35 5 0.80 51 2.24 2 0.18 8 0.97 10 1.29 4 0.37 7 1.12 9 1.12 14 2.92 112 1.22
bahujan republican
sociolist party
0.00 1 0.16 25 1.10 41 3.61 2 0.24 10 1.29 8 0.73
0.00 3 0.37 7 1.46 97 1.05
BahujanVikasAgha
di
0.00
0.00 13 0.57
0.00 6 0.73
0.00
0.00 4 0.64 18 2.24 18 3.76 59 0.64
Secular Alliance of India
0.00
0.00
0.00
0.00
0.00
0.00
0.00
0.00
0.00 58 12.11 58 0.63
YuvaSwabhiman
Party
0.00 54 8.61
0.00 1 0.09
0.00
0.00
0.00
0.00
0.00
0.00 55 0.60
BahujanMukti Party 3 0.52
0.00 12 0.53 7 0.62
0.00 8 1.03 17 1.56
0.00
0.00 6 1.25 53 0.58
Communist Party
Of India (Marxist)
0.00 1 0.16 12 0.53
0.00 14 1.70 3 0.39
0.00 22 3.53
0.00
0.00 52 0.56
RashtriyaSamajPak
sha
0.00 3 0.48 6 0.26 3 0.26 6 0.73 1 0.13 10 0.92 7 1.12 5 0.62 4 0.84 45 0.49
Ambedkarite Party
Of India
0.00
0.00 6 0.26 22 1.94 2 0.24
0.00
0.00
0.00 4 0.50 1 0.21 35 0.38
Republican Party Of India
0.00 16 2.55 1 0.04 1 0.09 1 0.12 1 0.13 2 0.18 6 0.96
0.00 1 0.21 29 0.31
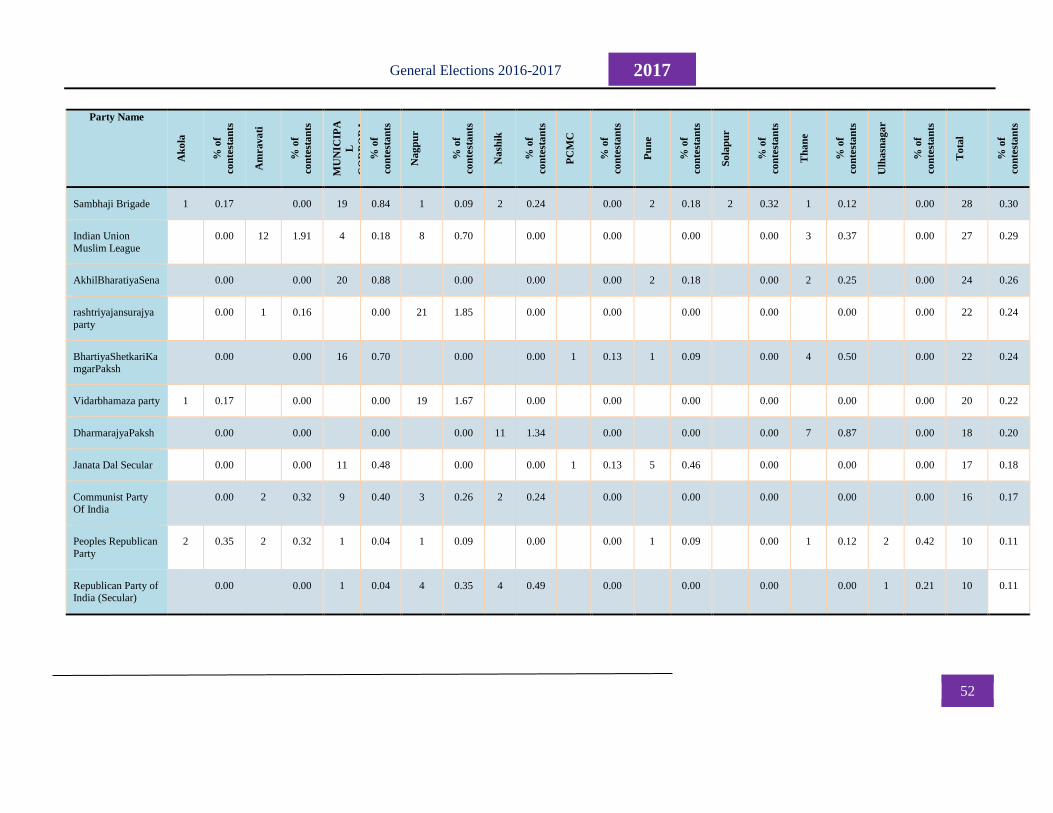
52
2017 General Elections 2016-2017
Party Name
Ak
ola
% o
f
co
nte
sta
nts
Am
rava
ti
% o
f
co
nte
sta
nts
MU
NIC
IPA
L
CO
RP
OR
A
TIO
N O
F
GR
EA
TE
R
MU
MB
AI
% o
f
co
nte
sta
nts
Na
gp
ur
% o
f
co
nte
sta
nts
Na
shik
% o
f
co
nte
sta
nts
PC
MC
% o
f
co
nte
sta
nts
Pu
ne
% o
f
co
nte
sta
nts
So
lap
ur
% o
f
co
nte
sta
nts
Th
an
e
% o
f
co
nte
sta
nts
Ulh
asn
aga
r
% o
f
co
nte
sta
nts
To
tal
% o
f
co
nte
sta
nts
Sambhaji Brigade 1 0.17
0.00 19 0.84 1 0.09 2 0.24
0.00 2 0.18 2 0.32 1 0.12
0.00 28 0.30
Indian Union
Muslim League
0.00 12 1.91 4 0.18 8 0.70
0.00
0.00
0.00
0.00 3 0.37
0.00 27 0.29
AkhilBharatiyaSena
0.00
0.00 20 0.88
0.00
0.00
0.00 2 0.18
0.00 2 0.25
0.00 24 0.26
rashtriyajansurajya
party
0.00 1 0.16
0.00 21 1.85
0.00
0.00
0.00
0.00
0.00
0.00 22 0.24
BhartiyaShetkariKamgarPaksh
0.00
0.00 16 0.70
0.00
0.00 1 0.13 1 0.09
0.00 4 0.50
0.00 22 0.24
Vidarbhamaza party 1 0.17
0.00
0.00 19 1.67
0.00
0.00
0.00
0.00
0.00
0.00 20 0.22
DharmarajyaPaksh
0.00
0.00
0.00
0.00 11 1.34
0.00
0.00
0.00 7 0.87
0.00 18 0.20
Janata Dal Secular
0.00
0.00 11 0.48
0.00
0.00 1 0.13 5 0.46
0.00
0.00
0.00 17 0.18
Communist Party Of India
0.00 2 0.32 9 0.40 3 0.26 2 0.24
0.00
0.00
0.00
0.00
0.00 16 0.17
Peoples Republican
Party
2 0.35 2 0.32 1 0.04 1 0.09
0.00
0.00 1 0.09
0.00 1 0.12 2 0.42 10 0.11
Republican Party of India (Secular)
0.00
0.00 1 0.04 4 0.35 4 0.49
0.00
0.00
0.00
0.00 1 0.21 10 0.11
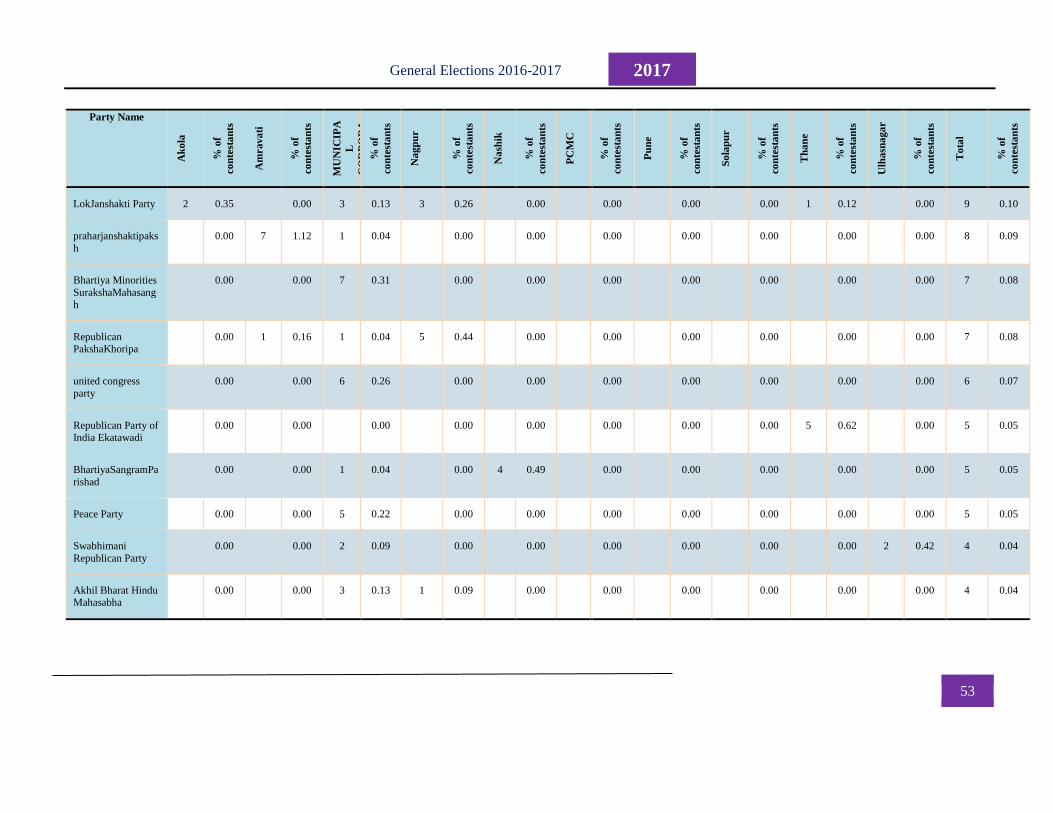
53
2017 General Elections 2016-2017
Party Name
Ak
ola
% o
f
co
nte
sta
nts
Am
rava
ti
% o
f
co
nte
sta
nts
MU
NIC
IPA
L
CO
RP
OR
A
TIO
N O
F
GR
EA
TE
R
MU
MB
AI
% o
f
co
nte
sta
nts
Na
gp
ur
% o
f
co
nte
sta
nts
Na
shik
% o
f
co
nte
sta
nts
PC
MC
% o
f
co
nte
sta
nts
Pu
ne
% o
f
co
nte
sta
nts
So
lap
ur
% o
f
co
nte
sta
nts
Th
an
e
% o
f
co
nte
sta
nts
Ulh
asn
aga
r
% o
f
co
nte
sta
nts
To
tal
% o
f
co
nte
sta
nts
LokJanshakti Party 2 0.35
0.00 3 0.13 3 0.26
0.00
0.00
0.00
0.00 1 0.12
0.00 9 0.10
praharjanshaktipaks
h
0.00 7 1.12 1 0.04
0.00
0.00
0.00
0.00
0.00
0.00
0.00 8 0.09
Bhartiya Minorities
SurakshaMahasang
h
0.00
0.00 7 0.31
0.00
0.00
0.00
0.00
0.00
0.00
0.00 7 0.08
Republican PakshaKhoripa
0.00 1 0.16 1 0.04 5 0.44
0.00
0.00
0.00
0.00
0.00
0.00 7 0.08
united congress
party
0.00
0.00 6 0.26
0.00
0.00
0.00
0.00
0.00
0.00
0.00 6 0.07
Republican Party of
India Ekatawadi
0.00
0.00
0.00
0.00
0.00
0.00
0.00
0.00 5 0.62
0.00 5 0.05
BhartiyaSangramPa
rishad
0.00
0.00 1 0.04
0.00 4 0.49
0.00
0.00
0.00
0.00
0.00 5 0.05
Peace Party
0.00
0.00 5 0.22
0.00
0.00
0.00
0.00
0.00
0.00
0.00 5 0.05
Swabhimani
Republican Party
0.00
0.00 2 0.09
0.00
0.00
0.00
0.00
0.00
0.00 2 0.42 4 0.04
Akhil Bharat Hindu Mahasabha
0.00
0.00 3 0.13 1 0.09
0.00
0.00
0.00
0.00
0.00
0.00 4 0.04
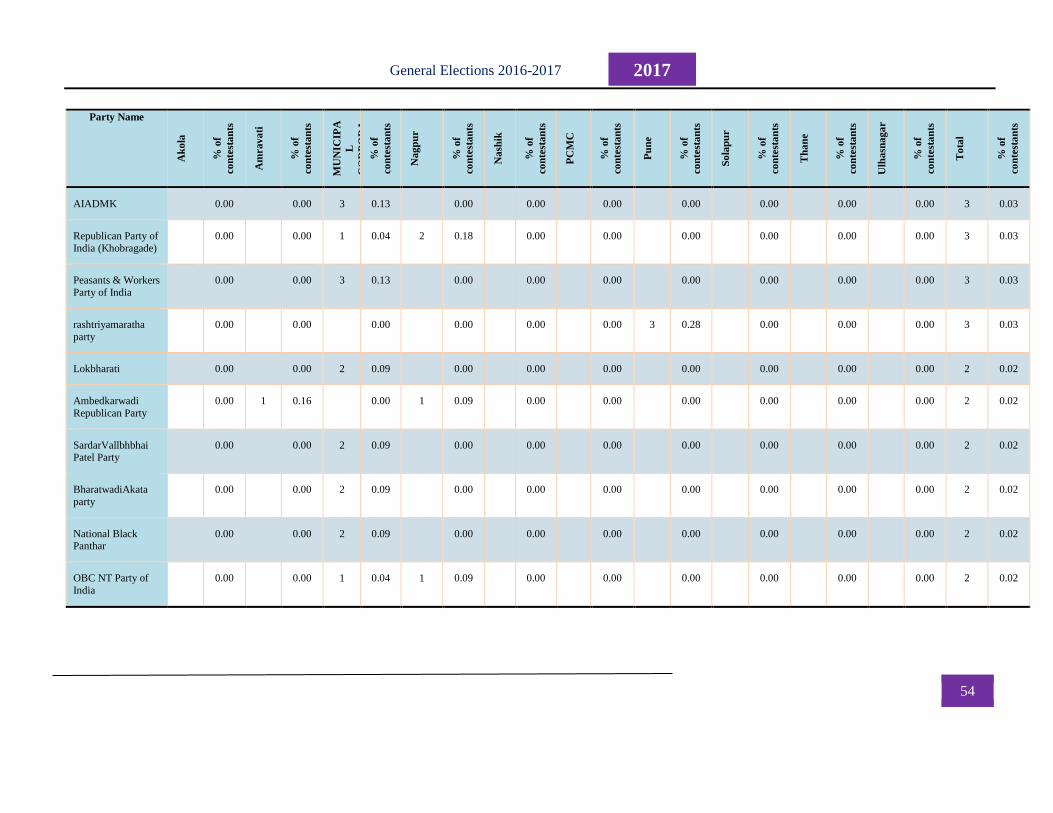
54
2017 General Elections 2016-2017
Party Name
Ak
ola
% o
f
co
nte
sta
nts
Am
rava
ti
% o
f
co
nte
sta
nts
MU
NIC
IPA
L
CO
RP
OR
A
TIO
N O
F
GR
EA
TE
R
MU
MB
AI
% o
f
co
nte
sta
nts
Na
gp
ur
% o
f
co
nte
sta
nts
Na
shik
% o
f
co
nte
sta
nts
PC
MC
% o
f
co
nte
sta
nts
Pu
ne
% o
f
co
nte
sta
nts
So
lap
ur
% o
f
co
nte
sta
nts
Th
an
e
% o
f
co
nte
sta
nts
Ulh
asn
aga
r
% o
f
co
nte
sta
nts
To
tal
% o
f
co
nte
sta
nts
AIADMK 0.00
0.00 3 0.13
0.00
0.00
0.00
0.00
0.00
0.00
0.00 3 0.03
Republican Party of
India (Khobragade)
0.00
0.00 1 0.04 2 0.18
0.00
0.00
0.00
0.00
0.00
0.00 3 0.03
Peasants & Workers
Party of India
0.00
0.00 3 0.13
0.00
0.00
0.00
0.00
0.00
0.00
0.00 3 0.03
rashtriyamaratha
party
0.00
0.00
0.00
0.00
0.00
0.00 3 0.28
0.00
0.00
0.00 3 0.03
Lokbharati 0.00
0.00 2 0.09
0.00
0.00
0.00
0.00
0.00
0.00
0.00 2 0.02
Ambedkarwadi
Republican Party
0.00 1 0.16
0.00 1 0.09
0.00
0.00
0.00
0.00
0.00
0.00 2 0.02
SardarVallbhbhai Patel Party
0.00
0.00 2 0.09
0.00
0.00
0.00
0.00
0.00
0.00
0.00 2 0.02
BharatwadiAkata
party
0.00
0.00 2 0.09
0.00
0.00
0.00
0.00
0.00
0.00
0.00 2 0.02
National Black Panthar
0.00
0.00 2 0.09
0.00
0.00
0.00
0.00
0.00
0.00
0.00 2 0.02
OBC NT Party of
India
0.00
0.00 1 0.04 1 0.09
0.00
0.00
0.00
0.00
0.00
0.00 2 0.02
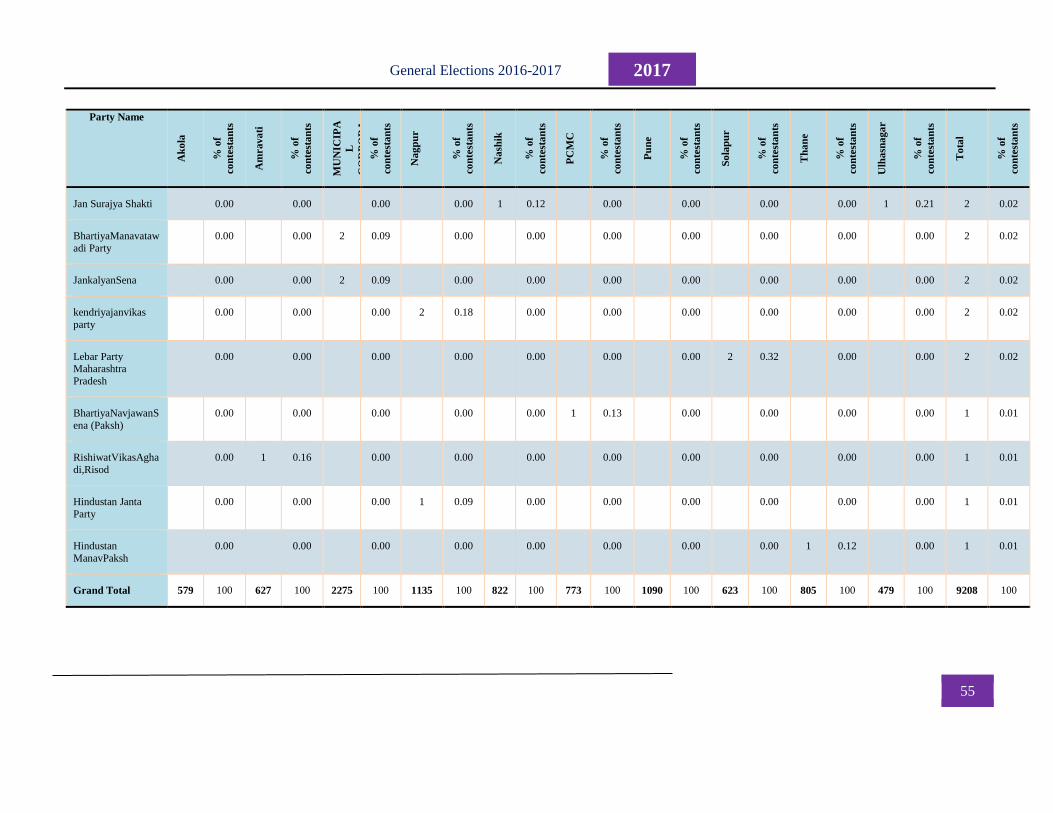
55
2017 General Elections 2016-2017
Party Name
Ak
ola
% o
f
co
nte
sta
nts
Am
rava
ti
% o
f
co
nte
sta
nts
MU
NIC
IPA
L
CO
RP
OR
A
TIO
N O
F
GR
EA
TE
R
MU
MB
AI
% o
f
co
nte
sta
nts
Na
gp
ur
% o
f
co
nte
sta
nts
Na
shik
% o
f
co
nte
sta
nts
PC
MC
% o
f
co
nte
sta
nts
Pu
ne
% o
f
co
nte
sta
nts
So
lap
ur
% o
f
co
nte
sta
nts
Th
an
e
% o
f
co
nte
sta
nts
Ulh
asn
aga
r
% o
f
co
nte
sta
nts
To
tal
% o
f
co
nte
sta
nts
Jan Surajya Shakti 0.00
0.00
0.00
0.00 1 0.12
0.00
0.00
0.00
0.00 1 0.21 2 0.02
BhartiyaManavataw
adi Party
0.00
0.00 2 0.09
0.00
0.00
0.00
0.00
0.00
0.00
0.00 2 0.02
JankalyanSena 0.00
0.00 2 0.09
0.00
0.00
0.00
0.00
0.00
0.00
0.00 2 0.02
kendriyajanvikas
party
0.00
0.00
0.00 2 0.18
0.00
0.00
0.00
0.00
0.00
0.00 2 0.02
Lebar Party Maharashtra
Pradesh
0.00
0.00
0.00
0.00
0.00
0.00
0.00 2 0.32
0.00
0.00 2 0.02
BhartiyaNavjawanS
ena (Paksh)
0.00
0.00
0.00
0.00
0.00 1 0.13
0.00
0.00
0.00
0.00 1 0.01
RishiwatVikasAgha
di,Risod
0.00 1 0.16
0.00
0.00
0.00
0.00
0.00
0.00
0.00
0.00 1 0.01
Hindustan Janta
Party
0.00
0.00
0.00 1 0.09
0.00
0.00
0.00
0.00
0.00
0.00 1 0.01
Hindustan
ManavPaksh
0.00
0.00
0.00
0.00
0.00
0.00
0.00
0.00 1 0.12
0.00 1 0.01
Grand Total 579 100 627 100 2275 100 1135 100 822 100 773 100 1090 100 623 100 805 100 479 100 9208 100
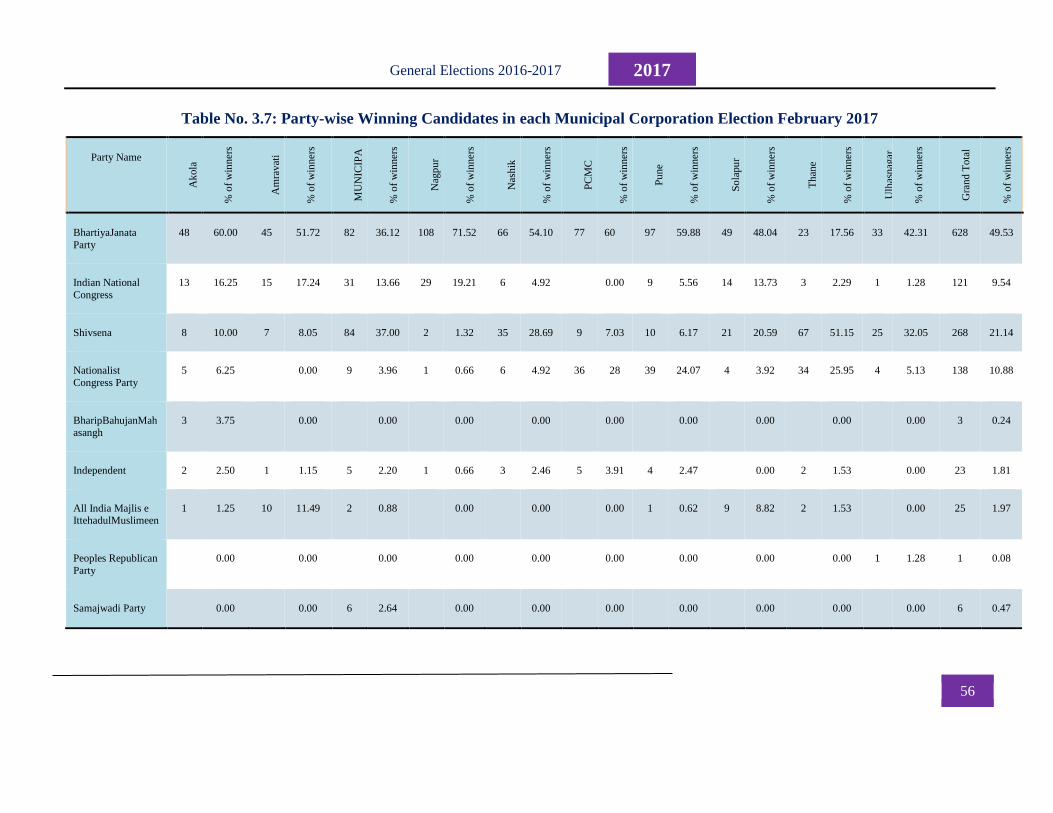
56
2017 General Elections 2016-2017
Table No. 3.7: Party-wise Winning Candidates in each Municipal Corporation Election February 2017
Party Name
Ak
ola
% o
f w
inner
s
Am
rav
ati
% o
f w
inner
s
MU
NIC
IPA
L
CO
RP
OR
AT
ION
OF
GR
EA
TE
R
MU
MB
AI
% o
f w
inner
s
Nag
pu
r
% o
f w
inner
s
Nas
hik
% o
f w
inner
s
PC
MC
% o
f w
inner
s
Pu
ne
% o
f w
inner
s
So
lapu
r
% o
f w
inner
s
Th
ane
% o
f w
inner
s
Ulh
asnag
ar
% o
f w
inner
s
Gra
nd T
ota
l
% o
f w
inner
s
BhartiyaJanata
Party
48 60.00 45 51.72 82 36.12 108 71.52 66 54.10 77 60 97 59.88 49 48.04 23 17.56 33 42.31 628 49.53
Indian National
Congress
13 16.25 15 17.24 31 13.66 29 19.21 6 4.92 0.00 9 5.56 14 13.73 3 2.29 1 1.28 121 9.54
Shivsena 8 10.00 7 8.05 84 37.00 2 1.32 35 28.69 9 7.03 10 6.17 21 20.59 67 51.15 25 32.05 268 21.14
Nationalist
Congress Party
5 6.25 0.00 9 3.96 1 0.66 6 4.92 36 28 39 24.07 4 3.92 34 25.95 4 5.13 138 10.88
BharipBahujanMah
asangh
3 3.75 0.00 0.00 0.00 0.00 0.00 0.00 0.00 0.00 0.00 3 0.24
Independent 2 2.50 1 1.15 5 2.20 1 0.66 3 2.46 5 3.91 4 2.47 0.00 2 1.53 0.00 23 1.81
All India Majlis e IttehadulMuslimeen
1 1.25 10 11.49 2 0.88 0.00 0.00 0.00 1 0.62 9 8.82 2 1.53 0.00 25 1.97
Peoples Republican
Party
0.00 0.00 0.00 0.00 0.00 0.00 0.00 0.00 0.00 1 1.28 1 0.08
Samajwadi Party 0.00 0.00 6 2.64 0.00 0.00 0.00 0.00 0.00 0.00 0.00 6 0.47
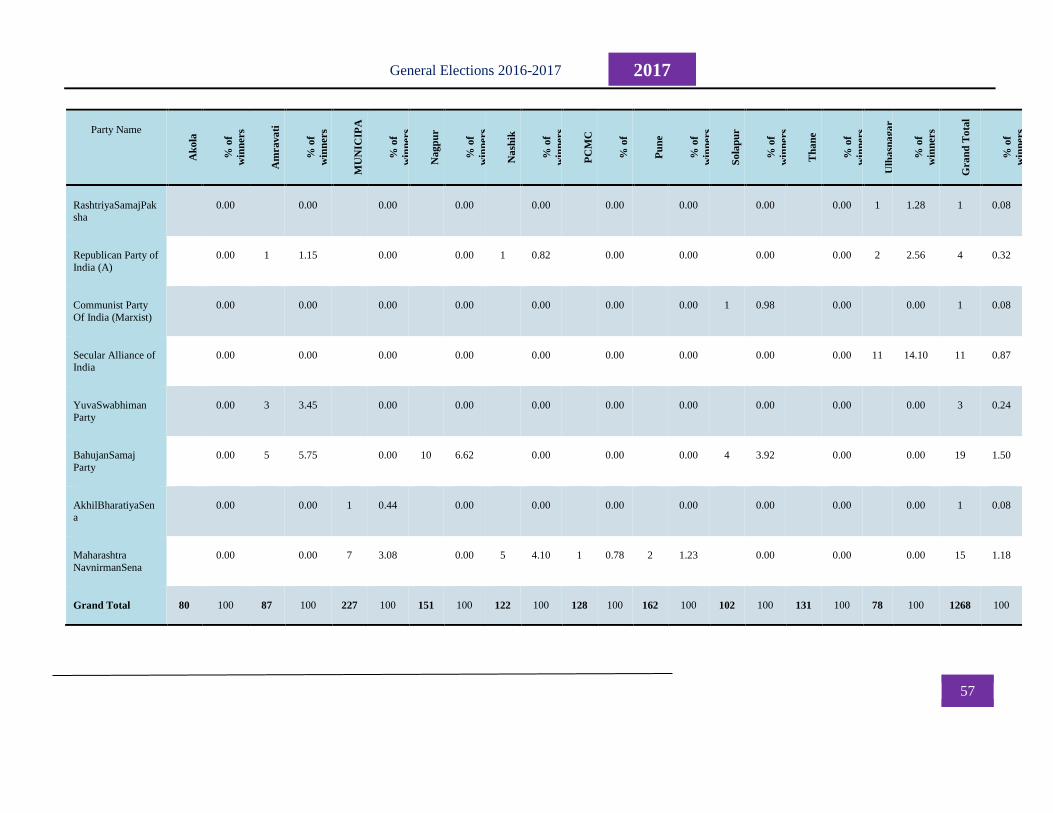
57
2017 General Elections 2016-2017
Party Name
Ak
ola
% o
f
win
ners
Am
rava
ti
% o
f
win
ners
MU
NIC
IPA
L
CO
RP
OR
A
TIO
N O
F
GR
EA
TE
R
MU
MB
AI
% o
f
win
ners
Na
gp
ur
% o
f
win
ners
Na
shik
% o
f
win
ners
PC
MC
% o
f
win
ners
Pu
ne
% o
f
win
ners
So
lap
ur
% o
f
win
ners
Th
an
e
% o
f
win
ners
Ulh
asn
aga
r
% o
f
win
ners
Gra
nd
To
tal
% o
f
win
ners
RashtriyaSamajPaksha
0.00 0.00 0.00 0.00 0.00 0.00 0.00 0.00 0.00 1 1.28 1 0.08
Republican Party of
India (A)
0.00 1 1.15 0.00 0.00 1 0.82 0.00 0.00 0.00 0.00 2 2.56 4 0.32
Communist Party
Of India (Marxist)
0.00 0.00 0.00 0.00 0.00 0.00 0.00 1 0.98 0.00 0.00 1 0.08
Secular Alliance of India
0.00 0.00 0.00 0.00 0.00 0.00 0.00 0.00 0.00 11 14.10 11 0.87
YuvaSwabhiman
Party
0.00 3 3.45 0.00 0.00 0.00 0.00 0.00 0.00 0.00 0.00 3 0.24
BahujanSamaj
Party
0.00 5 5.75 0.00 10 6.62 0.00 0.00 0.00 4 3.92 0.00 0.00 19 1.50
AkhilBharatiyaSena
0.00 0.00 1 0.44 0.00 0.00 0.00 0.00 0.00 0.00 0.00 1 0.08
Maharashtra
NavnirmanSena
0.00 0.00 7 3.08 0.00 5 4.10 1 0.78 2 1.23 0.00 0.00 0.00 15 1.18
Grand Total 80 100 87 100 227 100 151 100 122 100 128 100 162 100 102 100 131 100 78 100 1268 100
58
2017 General Elections 2016-2017
This chapter thus presents data on candidature fielded by National Parties, State Parties, other State
Parties and SEC registered parties. It also presents data on number of Independent candidates contesting
Municipal Corporation elections. The data indicates a complete dominance of National Parties when it
comes to participation share, winning share as well as success rate of candidates. The next chapter
throws light on polling data in the various Municipal Corporations of Maharashtra.
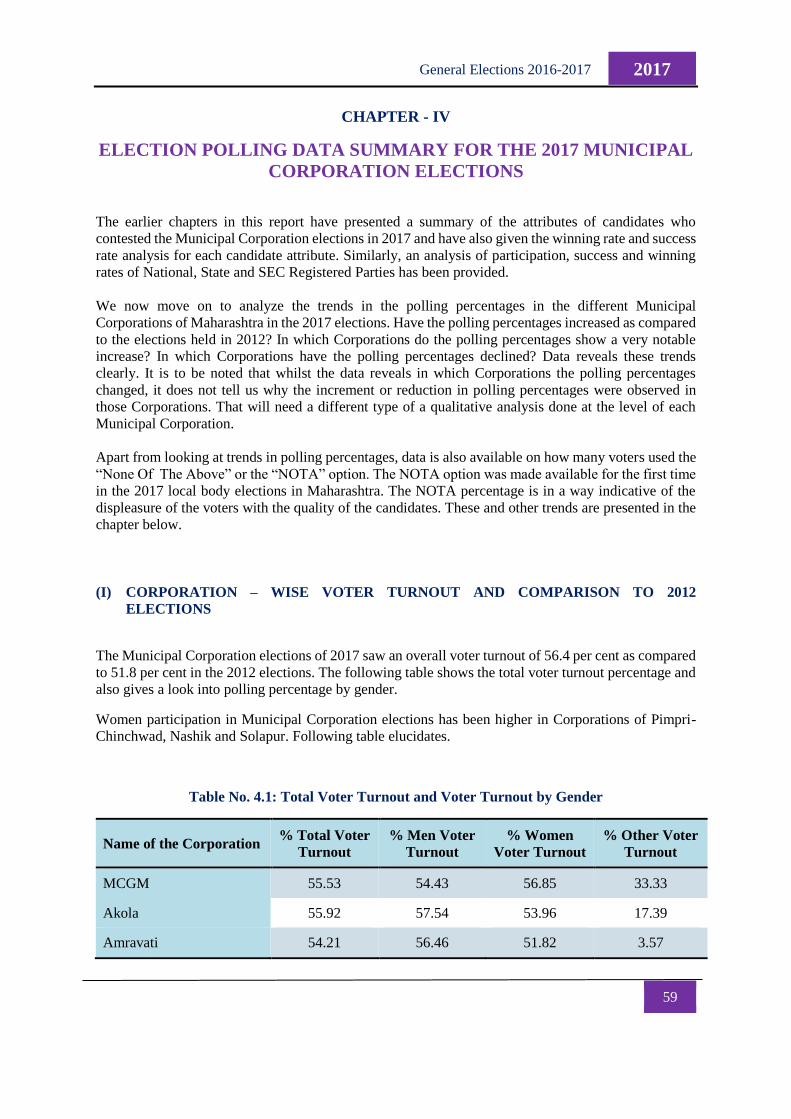
59
2017 General Elections 2016-2017
CHAPTER - IV
ELECTION POLLING DATA SUMMARY FOR THE 2017 MUNICIPAL
CORPORATION ELECTIONS
The earlier chapters in this report have presented a summary of the attributes of candidates who
contested the Municipal Corporation elections in 2017 and have also given the winning rate and success
rate analysis for each candidate attribute. Similarly, an analysis of participation, success and winning
rates of National, State and SEC Registered Parties has been provided.
We now move on to analyze the trends in the polling percentages in the different Municipal
Corporations of Maharashtra in the 2017 elections. Have the polling percentages increased as compared
to the elections held in 2012? In which Corporations do the polling percentages show a very notable
increase? In which Corporations have the polling percentages declined? Data reveals these trends
clearly. It is to be noted that whilst the data reveals in which Corporations the polling percentages
changed, it does not tell us why the increment or reduction in polling percentages were observed in
those Corporations. That will need a different type of a qualitative analysis done at the level of each
Municipal Corporation.
Apart from looking at trends in polling percentages, data is also available on how many voters used the
“None Of The Above” or the “NOTA” option. The NOTA option was made available for the first time
in the 2017 local body elections in Maharashtra. The NOTA percentage is in a way indicative of the
displeasure of the voters with the quality of the candidates. These and other trends are presented in the
chapter below.
(I) CORPORATION – WISE VOTER TURNOUT AND COMPARISON TO 2012
ELECTIONS
The Municipal Corporation elections of 2017 saw an overall voter turnout of 56.4 per cent as compared
to 51.8 per cent in the 2012 elections. The following table shows the total voter turnout percentage and
also gives a look into polling percentage by gender.
Women participation in Municipal Corporation elections has been higher in Corporations of Pimpri-
Chinchwad, Nashik and Solapur. Following table elucidates.
Table No. 4.1: Total Voter Turnout and Voter Turnout by Gender
Name of the Corporation % Total Voter
Turnout
% Men Voter
Turnout
% Women
Voter Turnout
% Other Voter
Turnout
MCGM 55.53 54.43 56.85 33.33
Akola 55.92 57.54 53.96 17.39
Amravati 54.21 56.46 51.82 3.57
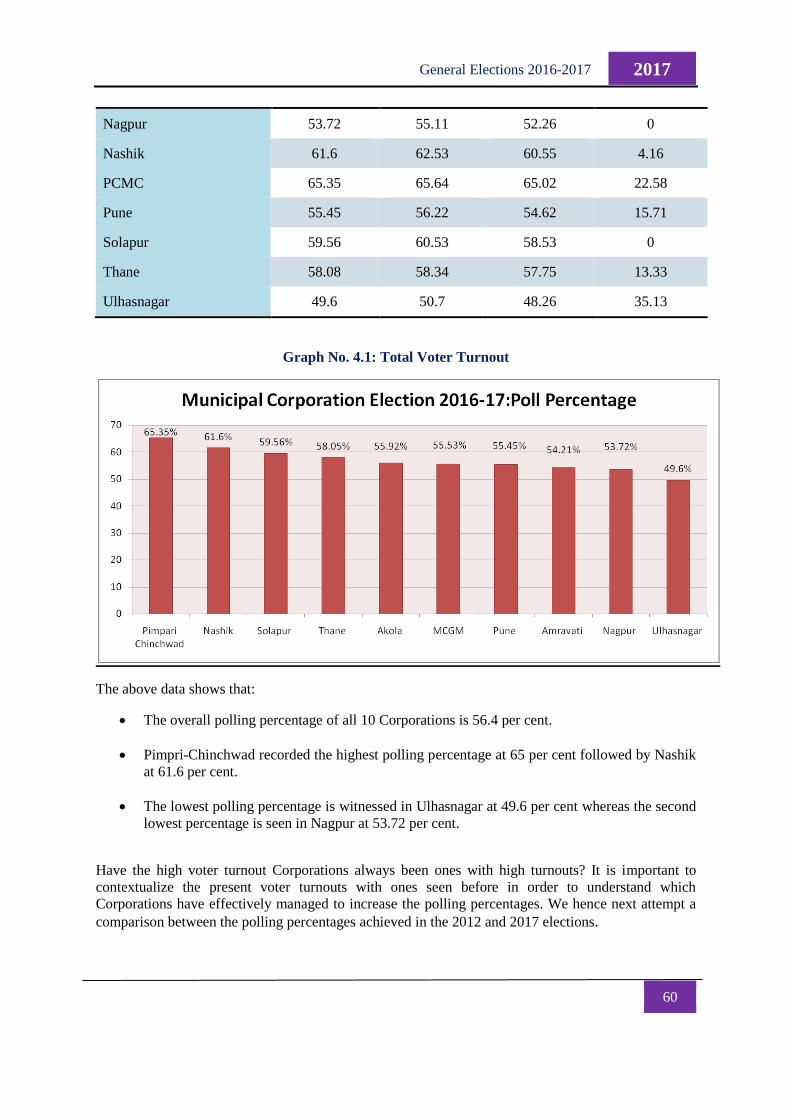
60
2017 General Elections 2016-2017
Nagpur 53.72 55.11 52.26 0
Nashik 61.6 62.53 60.55 4.16
PCMC 65.35 65.64 65.02 22.58
Pune 55.45 56.22 54.62 15.71
Solapur 59.56 60.53 58.53 0
Thane 58.08 58.34 57.75 13.33
Ulhasnagar 49.6 50.7 48.26 35.13
Graph No. 4.1: Total Voter Turnout
The above data shows that:
The overall polling percentage of all 10 Corporations is 56.4 per cent.
Pimpri-Chinchwad recorded the highest polling percentage at 65 per cent followed by Nashik
at 61.6 per cent.
The lowest polling percentage is witnessed in Ulhasnagar at 49.6 per cent whereas the second
lowest percentage is seen in Nagpur at 53.72 per cent.
Have the high voter turnout Corporations always been ones with high turnouts? It is important to
contextualize the present voter turnouts with ones seen before in order to understand which
Corporations have effectively managed to increase the polling percentages. We hence next attempt a
comparison between the polling percentages achieved in the 2012 and 2017 elections.
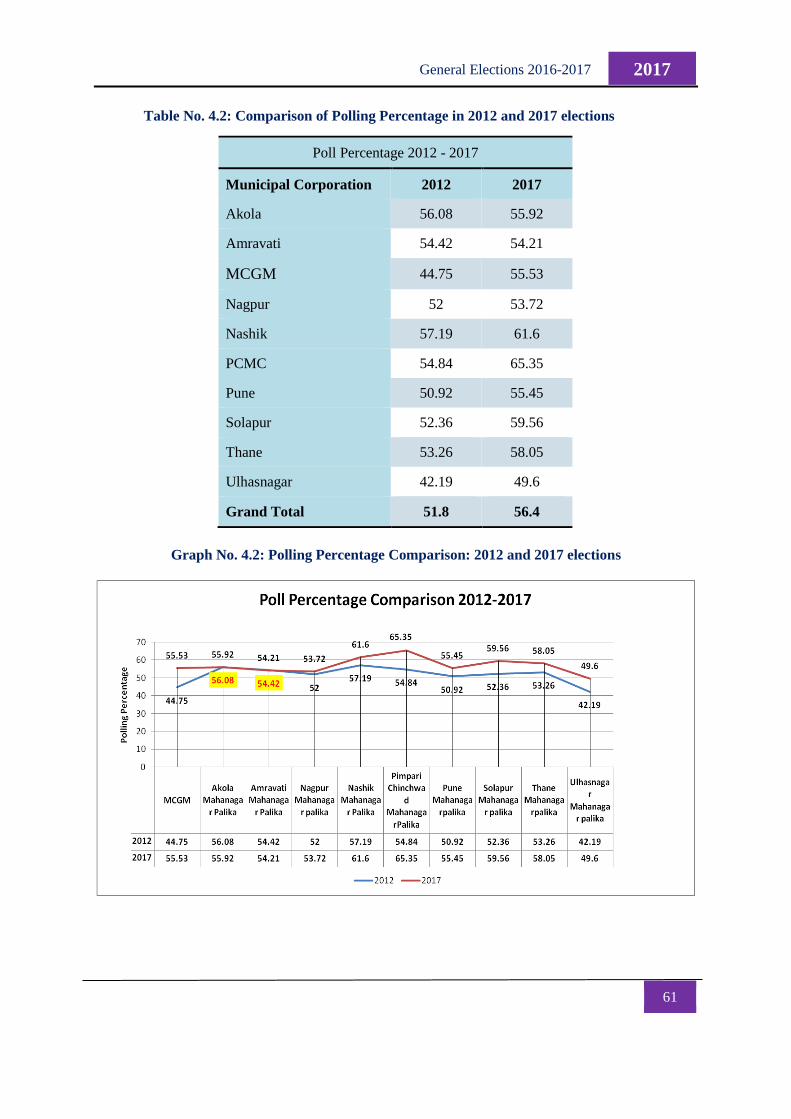
61
2017 General Elections 2016-2017
Table No. 4.2: Comparison of Polling Percentage in 2012 and 2017 elections
Graph No. 4.2: Polling Percentage Comparison: 2012 and 2017 elections
Poll Percentage 2012 - 2017
Municipal Corporation 2012 2017
Akola 56.08 55.92
Amravati 54.42 54.21
MCGM 44.75 55.53
Nagpur 52 53.72
Nashik 57.19 61.6
PCMC 54.84 65.35
Pune 50.92 55.45
Solapur 52.36 59.56
Thane 53.26 58.05
Ulhasnagar 42.19 49.6
Grand Total 51.8 56.4
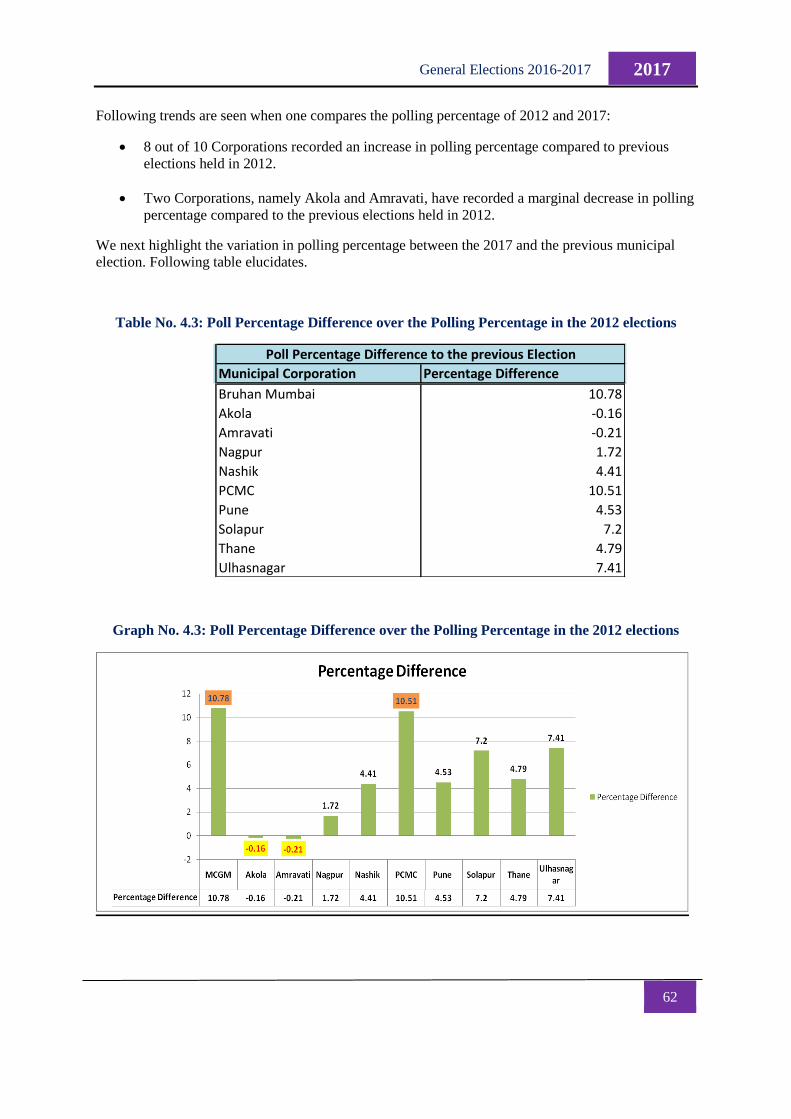
62
2017 General Elections 2016-2017
Following trends are seen when one compares the polling percentage of 2012 and 2017:
8 out of 10 Corporations recorded an increase in polling percentage compared to previous
elections held in 2012.
Two Corporations, namely Akola and Amravati, have recorded a marginal decrease in polling
percentage compared to the previous elections held in 2012.
We next highlight the variation in polling percentage between the 2017 and the previous municipal
election. Following table elucidates.
Table No. 4.3: Poll Percentage Difference over the Polling Percentage in the 2012 elections
Graph No. 4.3: Poll Percentage Difference over the Polling Percentage in the 2012 elections
Municipal Corporation Percentage Difference
Poll Percentage Difference to the previous Election
Bruhan Mumbai 10.78
Akola -0.16
Amravati -0.21
Nagpur 1.72
Nashik 4.41
PCMC 10.51
Pune 4.53
Solapur 7.2
Thane 4.79
Ulhasnagar 7.41
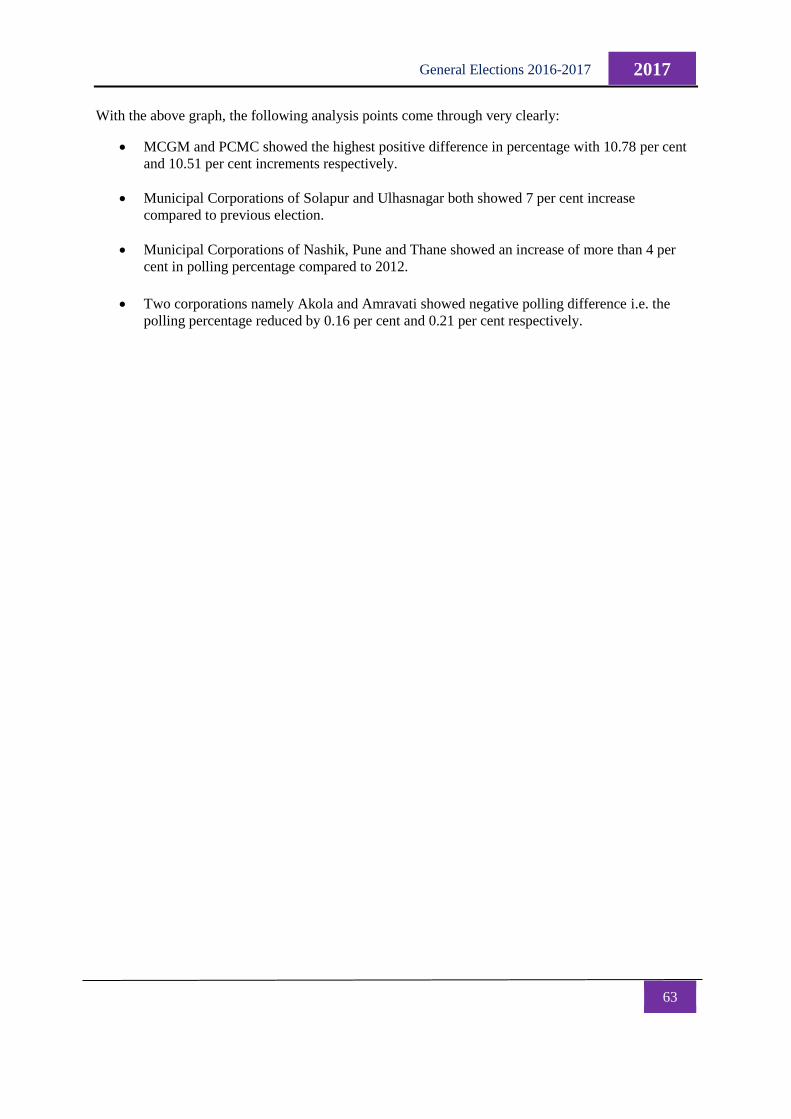
63
2017 General Elections 2016-2017
With the above graph, the following analysis points come through very clearly:
MCGM and PCMC showed the highest positive difference in percentage with 10.78 per cent
and 10.51 per cent increments respectively.
Municipal Corporations of Solapur and Ulhasnagar both showed 7 per cent increase
compared to previous election.
Municipal Corporations of Nashik, Pune and Thane showed an increase of more than 4 per
cent in polling percentage compared to 2012.
Two corporations namely Akola and Amravati showed negative polling difference i.e. the
polling percentage reduced by 0.16 per cent and 0.21 per cent respectively.
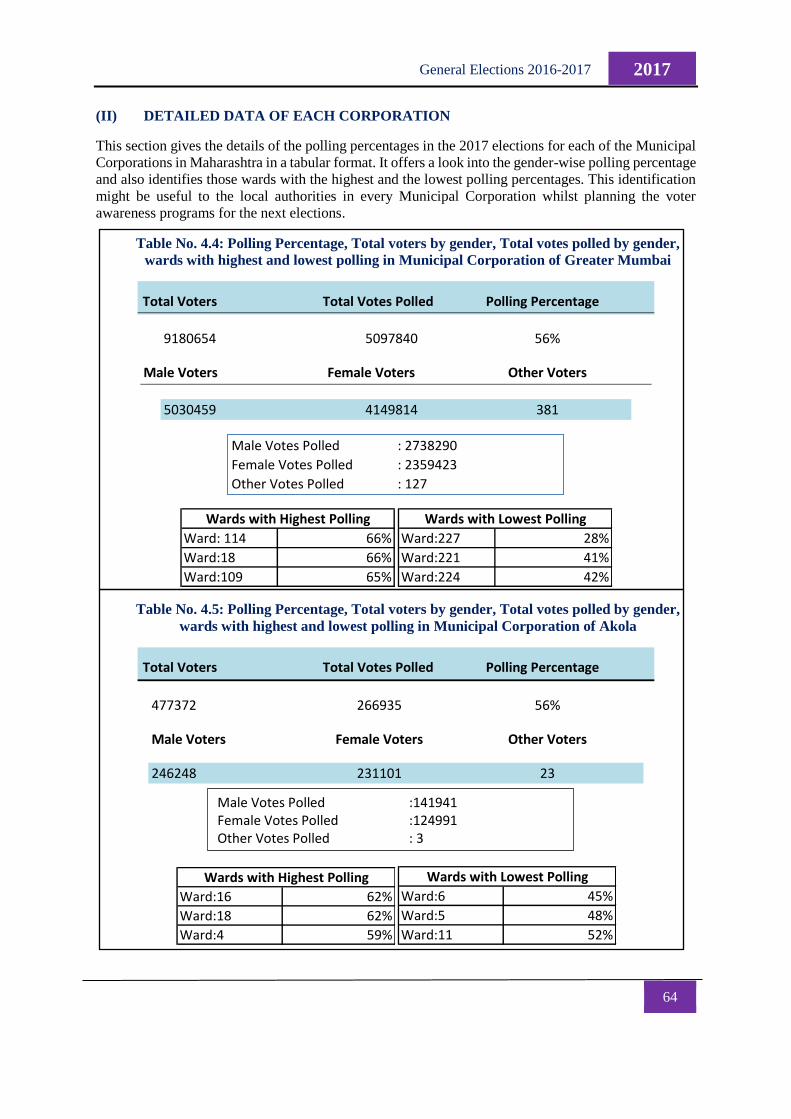
64
2017 General Elections 2016-2017
(II) DETAILED DATA OF EACH CORPORATION
This section gives the details of the polling percentages in the 2017 elections for each of the Municipal
Corporations in Maharashtra in a tabular format. It offers a look into the gender-wise polling percentage
and also identifies those wards with the highest and the lowest polling percentages. This identification
might be useful to the local authorities in every Municipal Corporation whilst planning the voter
awareness programs for the next elections.
Table No. 4.4: Polling Percentage, Total voters by gender, Total votes polled by gender,
wards with highest and lowest polling in Municipal Corporation of Greater Mumbai
Table No. 4.5: Polling Percentage, Total voters by gender, Total votes polled by gender,
wards with highest and lowest polling in Municipal Corporation of Akola
Total Voters Total Votes Polled Polling Percentage
9180654 5097840 56%
Male Voters Female Voters Other Voters
5030459 4149814 381
Male Votes Polled : 2738290
Female Votes Polled : 2359423
Other Votes Polled : 127
Ward: 114 66%
Ward:18 66%
Ward:109 65%
Wards with Highest Polling
Ward:227 28%
Ward:221 41%
Ward:224 42%
Wards with Lowest Polling
Total Voters Total Votes Polled Polling Percentage
477372 266935 56%
Male Voters Female Voters Other Voters
246248 231101 23
Ward:16 62%
Ward:18 62%
Ward:4 59%
Wards with Highest Polling
Ward:6 45%
Ward:5 48%
Ward:11 52%
Wards with Lowest Polling
Male Votes Polled :141941 Female Votes Polled :124991 Other Votes Polled : 3
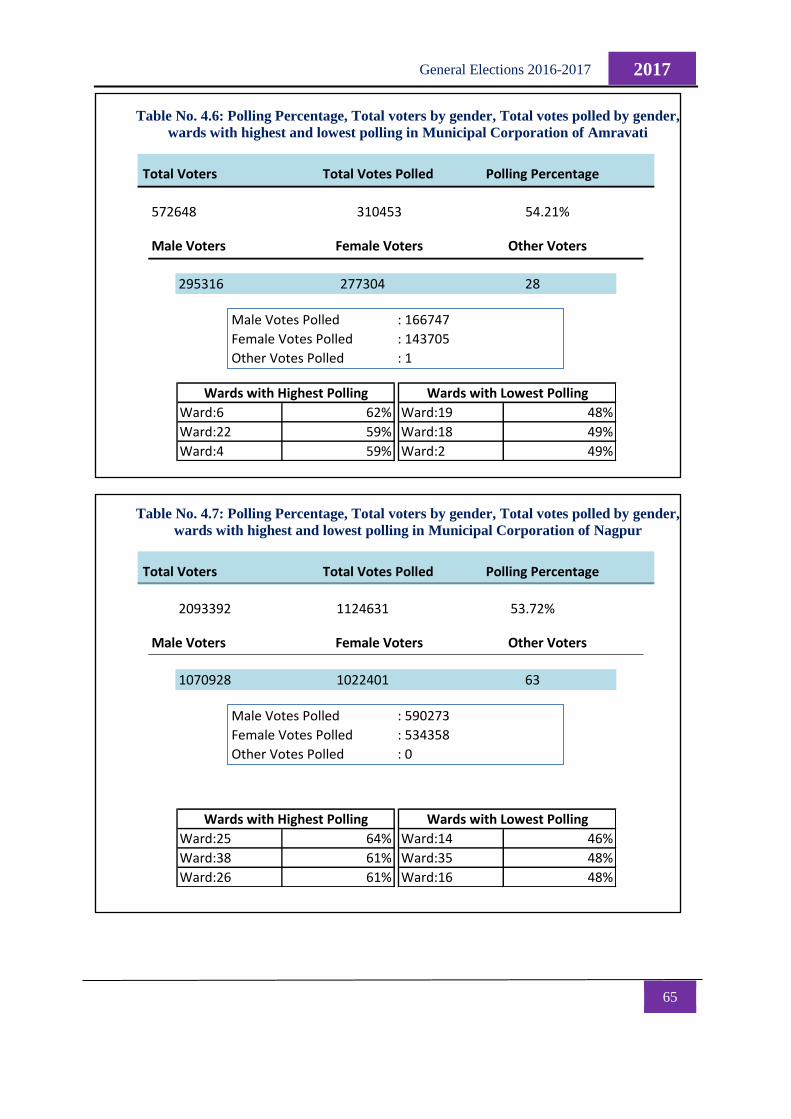
65
2017 General Elections 2016-2017
Table No. 4.6: Polling Percentage, Total voters by gender, Total votes polled by gender,
wards with highest and lowest polling in Municipal Corporation of Amravati
Table No. 4.7: Polling Percentage, Total voters by gender, Total votes polled by gender,
wards with highest and lowest polling in Municipal Corporation of Nagpur
Total Voters Total Votes Polled Polling Percentage
572648 310453 54.21%
Male Voters Female Voters Other Voters
295316 277304 28
Male Votes Polled : 166747
Female Votes Polled : 143705
Other Votes Polled : 1
Ward:6 62%
Ward:22 59%
Ward:4 59%
Wards with Highest Polling
Ward:19 48%
Ward:18 49%
Ward:2 49%
Wards with Lowest Polling
Total Voters Total Votes Polled Polling Percentage
2093392 1124631 53.72%
Male Voters Female Voters Other Voters
1070928 1022401 63
Male Votes Polled : 590273
Female Votes Polled : 534358
Other Votes Polled : 0
Ward:25 64%
Ward:38 61%
Ward:26 61%
Wards with Highest Polling
Ward:14 46%
Ward:35 48%
Ward:16 48%
Wards with Lowest Polling
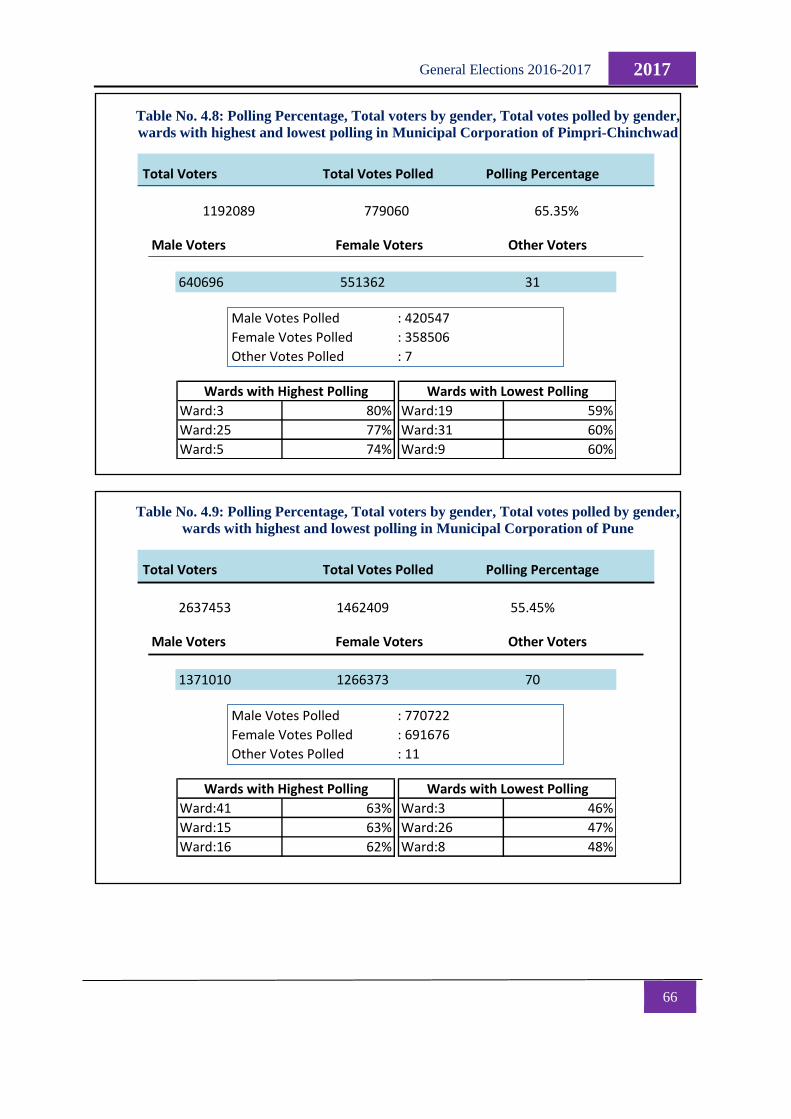
66
2017 General Elections 2016-2017
Table No. 4.8: Polling Percentage, Total voters by gender, Total votes polled by gender,
wards with highest and lowest polling in Municipal Corporation of Pimpri-Chinchwad
Table No. 4.9: Polling Percentage, Total voters by gender, Total votes polled by gender,
wards with highest and lowest polling in Municipal Corporation of Pune
Total Voters Total Votes Polled Polling Percentage
1192089 779060 65.35%
Male Voters Female Voters Other Voters
640696 551362 31
Male Votes Polled : 420547
Female Votes Polled : 358506
Other Votes Polled : 7
Ward:3 80%
Ward:25 77%
Ward:5 74%
Wards with Highest Polling
Ward:19 59%
Ward:31 60%
Ward:9 60%
Wards with Lowest Polling
Total Voters Total Votes Polled Polling Percentage
2637453 1462409 55.45%
Male Voters Female Voters Other Voters
1371010 1266373 70
Male Votes Polled : 770722
Female Votes Polled : 691676
Other Votes Polled : 11
Ward:41 63%
Ward:15 63%
Ward:16 62%
Wards with Highest Polling
Ward:3 46%
Ward:26 47%
Ward:8 48%
Wards with Lowest Polling
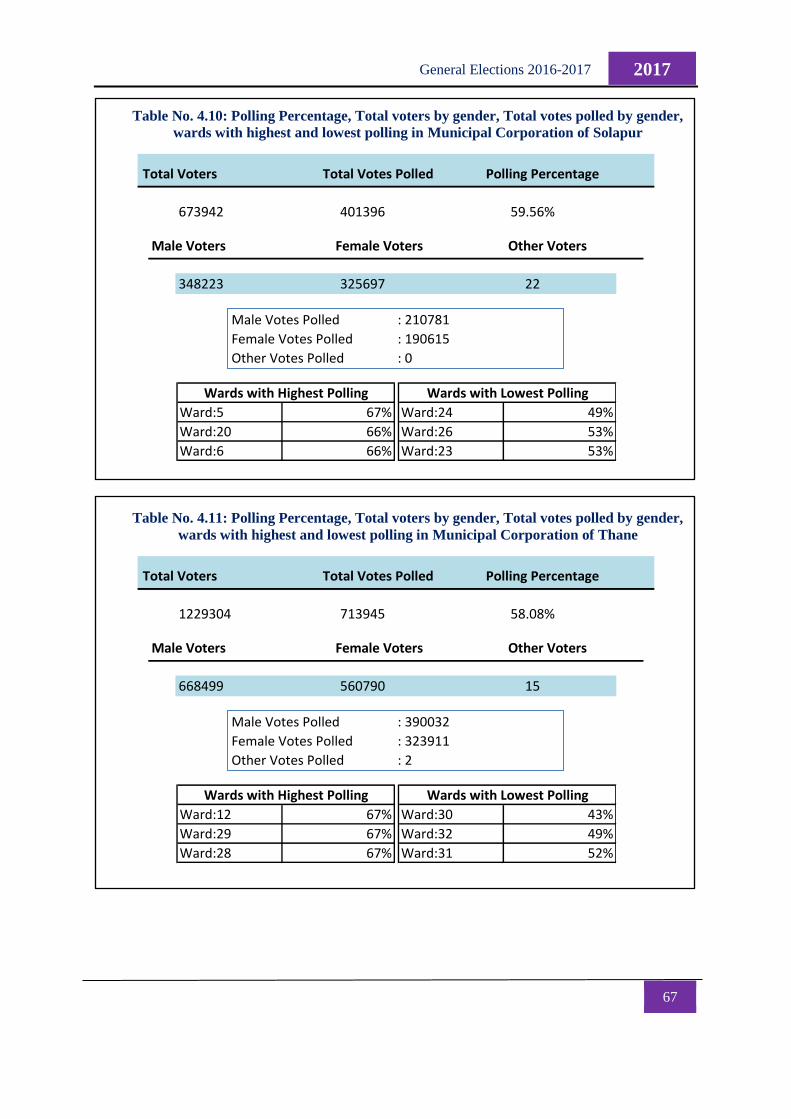
67
2017 General Elections 2016-2017
Table No. 4.10: Polling Percentage, Total voters by gender, Total votes polled by gender,
wards with highest and lowest polling in Municipal Corporation of Solapur
Table No. 4.11: Polling Percentage, Total voters by gender, Total votes polled by gender,
wards with highest and lowest polling in Municipal Corporation of Thane
Total Voters Total Votes Polled Polling Percentage
673942 401396 59.56%
Male Voters Female Voters Other Voters
348223 325697 22
Male Votes Polled : 210781
Female Votes Polled : 190615
Other Votes Polled : 0
Ward:5 67%
Ward:20 66%
Ward:6 66%
Wards with Highest Polling
Ward:24 49%
Ward:26 53%
Ward:23 53%
Wards with Lowest Polling
Total Voters Total Votes Polled Polling Percentage
1229304 713945 58.08%
Male Voters Female Voters Other Voters
668499 560790 15
Male Votes Polled : 390032
Female Votes Polled : 323911
Other Votes Polled : 2
Ward:12 67%
Ward:29 67%
Ward:28 67%
Wards with Highest Polling
Ward:30 43%
Ward:32 49%
Ward:31 52%
Wards with Lowest Polling
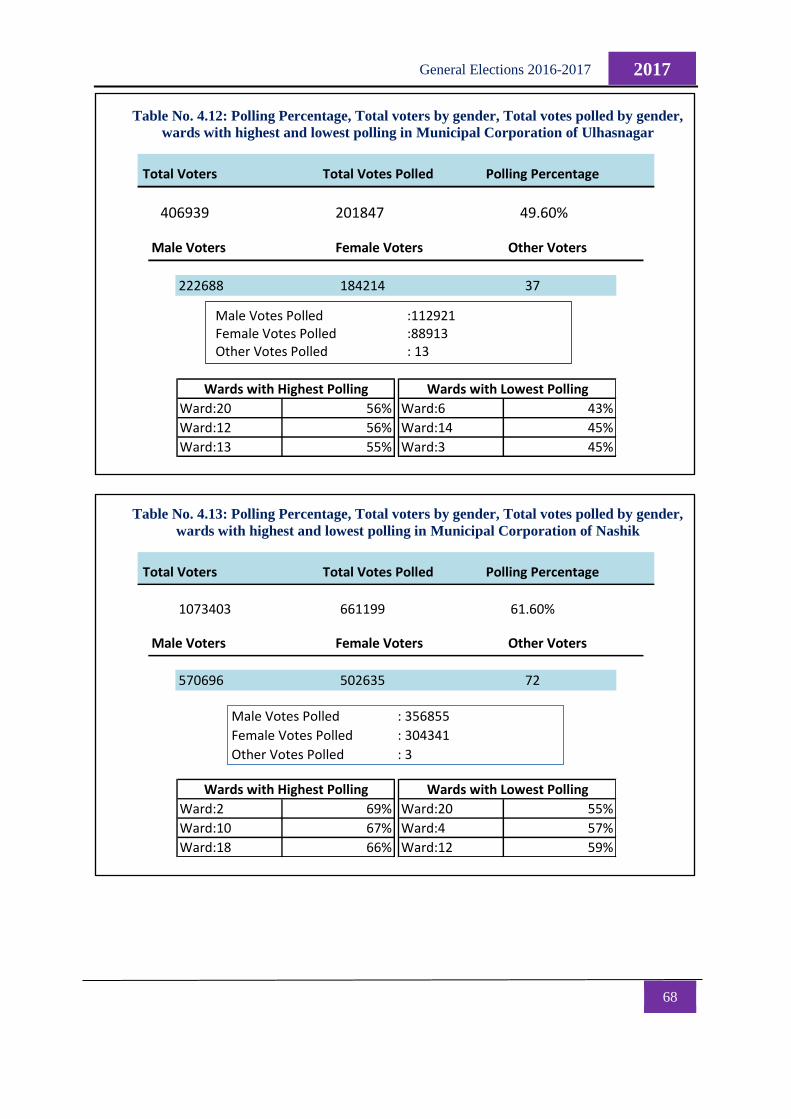
68
2017 General Elections 2016-2017
Table No. 4.12: Polling Percentage, Total voters by gender, Total votes polled by gender,
wards with highest and lowest polling in Municipal Corporation of Ulhasnagar
Table No. 4.13: Polling Percentage, Total voters by gender, Total votes polled by gender,
wards with highest and lowest polling in Municipal Corporation of Nashik
Total Voters Total Votes Polled Polling Percentage
406939 201847 49.60%
Male Voters Female Voters Other Voters
222688 184214 37
Ward:20 56%
Ward:12 56%
Ward:13 55%
Wards with Highest Polling
Ward:6 43%
Ward:14 45%
Ward:3 45%
Wards with Lowest Polling
Total Voters Total Votes Polled Polling Percentage
1073403 661199 61.60%
Male Voters Female Voters Other Voters
570696 502635 72
Male Votes Polled : 356855
Female Votes Polled : 304341
Other Votes Polled : 3
Ward:2 69%
Ward:10 67%
Ward:18 66%
Wards with Highest Polling
Ward:20 55%
Ward:4 57%
Ward:12 59%
Wards with Lowest Polling
Male Votes Polled :112921 Female Votes Polled :88913 Other Votes Polled : 13
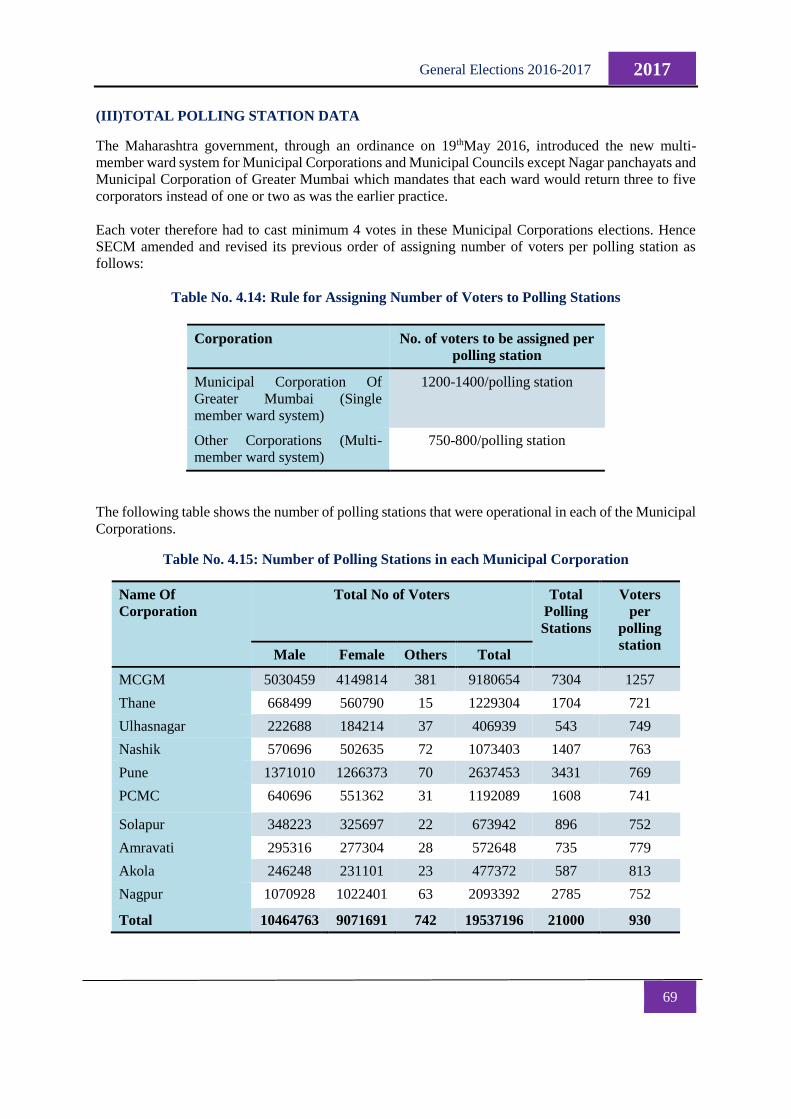
69
2017 General Elections 2016-2017
(III)TOTAL POLLING STATION DATA
The Maharashtra government, through an ordinance on 19thMay 2016, introduced the new multi-
member ward system for Municipal Corporations and Municipal Councils except Nagar panchayats and
Municipal Corporation of Greater Mumbai which mandates that each ward would return three to five
corporators instead of one or two as was the earlier practice.
Each voter therefore had to cast minimum 4 votes in these Municipal Corporations elections. Hence
SECM amended and revised its previous order of assigning number of voters per polling station as
follows:
Table No. 4.14: Rule for Assigning Number of Voters to Polling Stations
Corporation No. of voters to be assigned per
polling station
Municipal Corporation Of
Greater Mumbai (Single
member ward system)
1200-1400/polling station
Other Corporations (Multi-
member ward system)
750-800/polling station
The following table shows the number of polling stations that were operational in each of the Municipal
Corporations.
Table No. 4.15: Number of Polling Stations in each Municipal Corporation
Name Of
Corporation
Total No of Voters Total
Polling
Stations
Voters
per
polling
station Male Female Others Total
MCGM 5030459 4149814 381 9180654 7304 1257
Thane 668499 560790 15 1229304 1704 721
Ulhasnagar 222688 184214 37 406939 543 749
Nashik 570696 502635 72 1073403 1407 763
Pune 1371010 1266373 70 2637453 3431 769
PCMC 640696 551362 31 1192089 1608 741
Solapur 348223 325697 22 673942 896 752
Amravati 295316 277304 28 572648 735 779
Akola 246248 231101 23 477372 587 813
Nagpur 1070928 1022401 63 2093392 2785 752
Total 10464763 9071691 742 19537196 21000 930
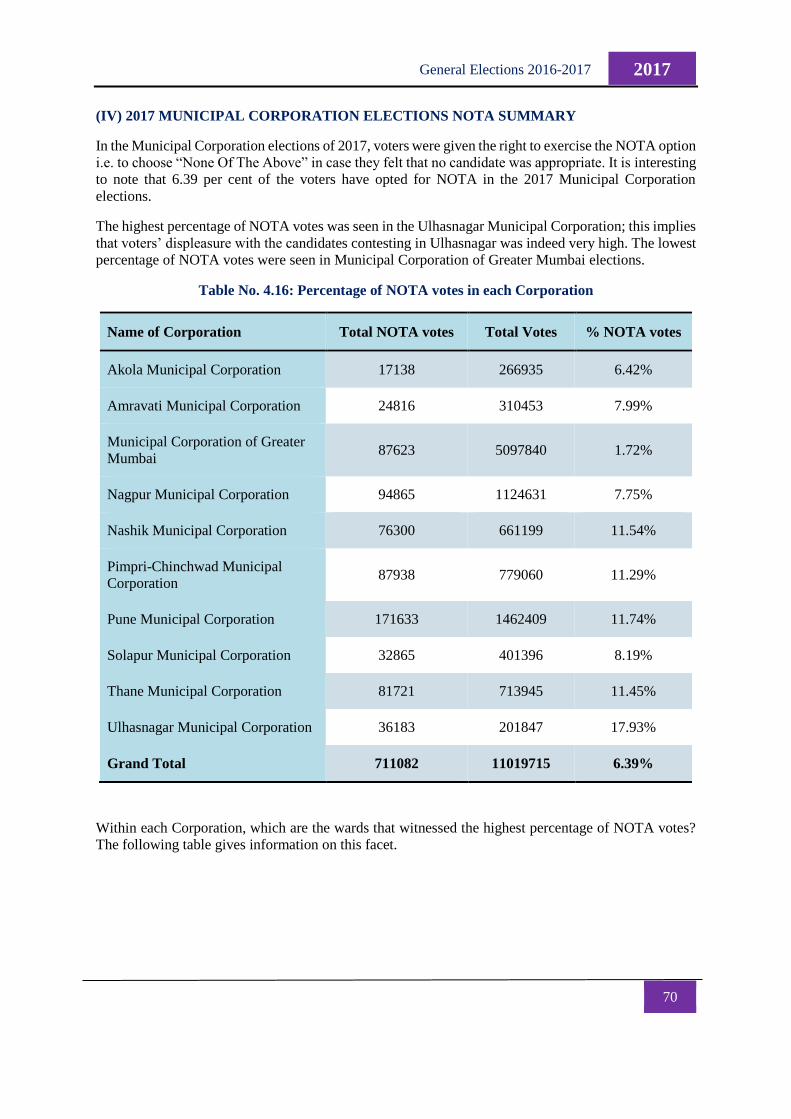
70
2017 General Elections 2016-2017
(IV) 2017 MUNICIPAL CORPORATION ELECTIONS NOTA SUMMARY
In the Municipal Corporation elections of 2017, voters were given the right to exercise the NOTA option
i.e. to choose “None Of The Above” in case they felt that no candidate was appropriate. It is interesting
to note that 6.39 per cent of the voters have opted for NOTA in the 2017 Municipal Corporation
elections.
The highest percentage of NOTA votes was seen in the Ulhasnagar Municipal Corporation; this implies
that voters’ displeasure with the candidates contesting in Ulhasnagar was indeed very high. The lowest
percentage of NOTA votes were seen in Municipal Corporation of Greater Mumbai elections.
Table No. 4.16: Percentage of NOTA votes in each Corporation
Name of Corporation Total NOTA votes Total Votes % NOTA votes
Akola Municipal Corporation 17138 266935 6.42%
Amravati Municipal Corporation 24816 310453 7.99%
Municipal Corporation of Greater
Mumbai 87623 5097840 1.72%
Nagpur Municipal Corporation 94865 1124631 7.75%
Nashik Municipal Corporation 76300 661199 11.54%
Pimpri-Chinchwad Municipal
Corporation 87938 779060 11.29%
Pune Municipal Corporation 171633 1462409 11.74%
Solapur Municipal Corporation 32865 401396 8.19%
Thane Municipal Corporation 81721 713945 11.45%
Ulhasnagar Municipal Corporation 36183 201847 17.93%
Grand Total 711082 11019715 6.39%
Within each Corporation, which are the wards that witnessed the highest percentage of NOTA votes?
The following table gives information on this facet.
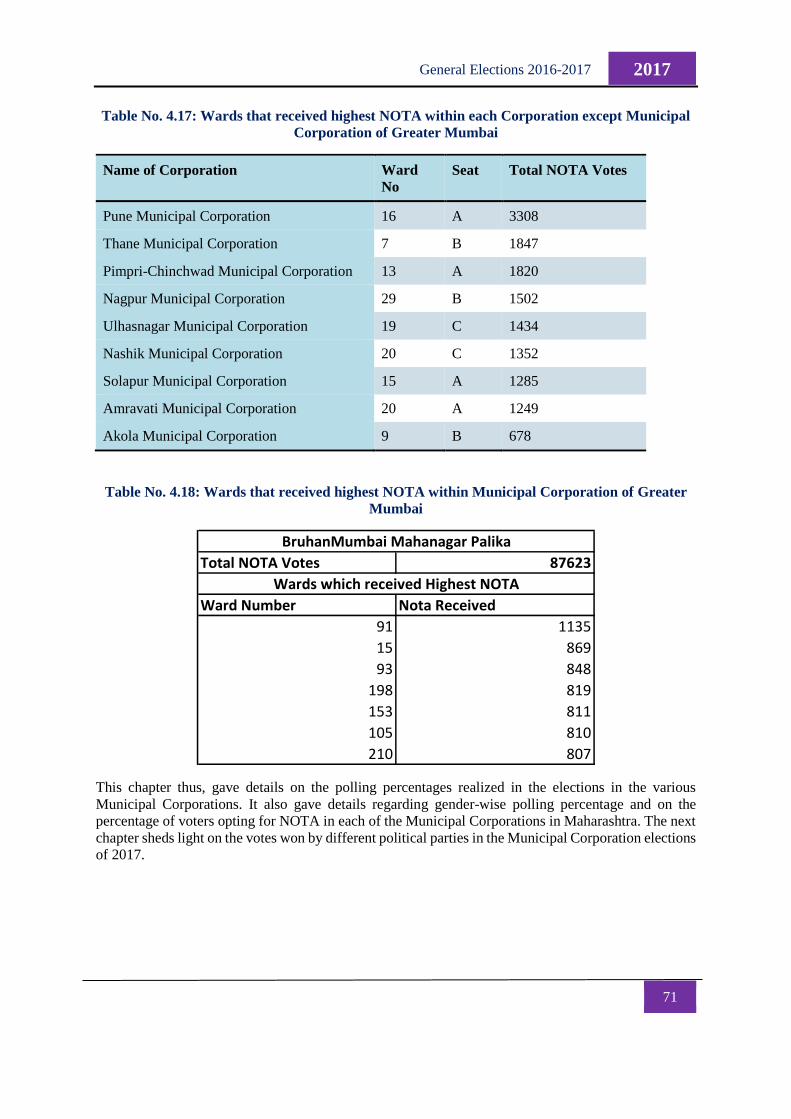
71
2017 General Elections 2016-2017
Table No. 4.17: Wards that received highest NOTA within each Corporation except Municipal
Corporation of Greater Mumbai
Name of Corporation Ward
No
Seat Total NOTA Votes
Pune Municipal Corporation 16 A 3308
Thane Municipal Corporation 7 B 1847
Pimpri-Chinchwad Municipal Corporation 13 A 1820
Nagpur Municipal Corporation 29 B 1502
Ulhasnagar Municipal Corporation 19 C 1434
Nashik Municipal Corporation 20 C 1352
Solapur Municipal Corporation 15 A 1285
Amravati Municipal Corporation 20 A 1249
Akola Municipal Corporation 9 B 678
Table No. 4.18: Wards that received highest NOTA within Municipal Corporation of Greater
Mumbai
This chapter thus, gave details on the polling percentages realized in the elections in the various
Municipal Corporations. It also gave details regarding gender-wise polling percentage and on the
percentage of voters opting for NOTA in each of the Municipal Corporations in Maharashtra. The next
chapter sheds light on the votes won by different political parties in the Municipal Corporation elections
of 2017.
Total NOTA Votes 87623
Ward Number Nota Received
91 1135
15 869
93 848
198 819
153 811
105 810
210 807
Wards which received Highest NOTA
BruhanMumbai Mahanagar Palika
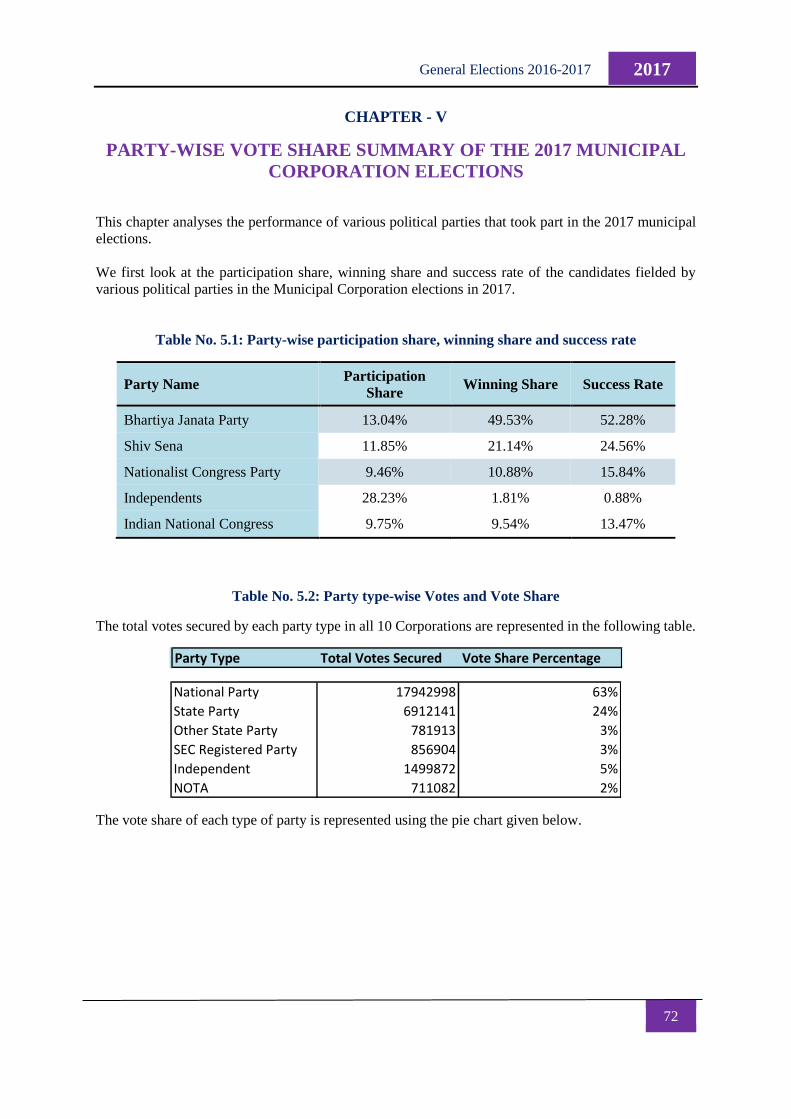
72
2017 General Elections 2016-2017
CHAPTER - V
PARTY-WISE VOTE SHARE SUMMARY OF THE 2017 MUNICIPAL
CORPORATION ELECTIONS
This chapter analyses the performance of various political parties that took part in the 2017 municipal
elections.
We first look at the participation share, winning share and success rate of the candidates fielded by
various political parties in the Municipal Corporation elections in 2017.
Table No. 5.1: Party-wise participation share, winning share and success rate
Party Name Participation
Share Winning Share Success Rate
Bhartiya Janata Party 13.04% 49.53% 52.28%
Shiv Sena 11.85% 21.14% 24.56%
Nationalist Congress Party 9.46% 10.88% 15.84%
Independents 28.23% 1.81% 0.88%
Indian National Congress 9.75% 9.54% 13.47%
Table No. 5.2: Party type-wise Votes and Vote Share
The total votes secured by each party type in all 10 Corporations are represented in the following table.
The vote share of each type of party is represented using the pie chart given below.
Party Type Total Votes Secured Vote Share Percentage
National Party 17942998 63%
State Party 6912141 24%
Other State Party 781913 3%
SEC Registered Party 856904 3%
Independent 1499872 5%
NOTA 711082 2%
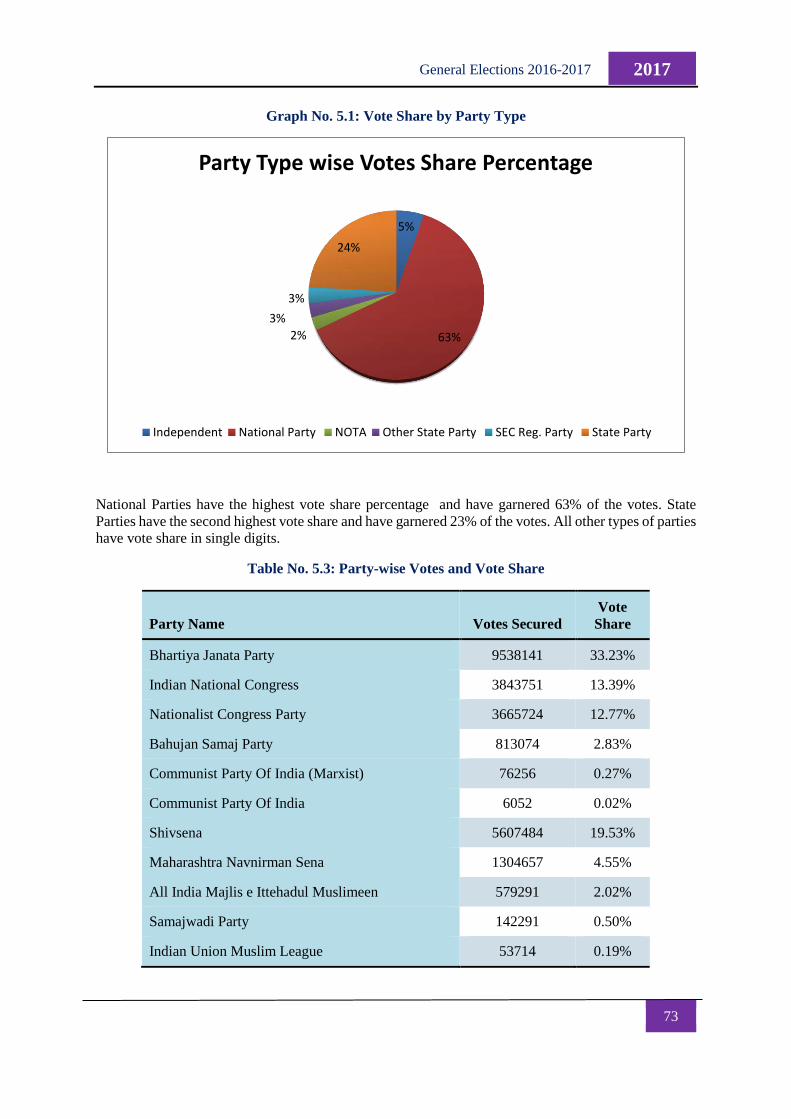
73
2017 General Elections 2016-2017
Graph No. 5.1: Vote Share by Party Type
National Parties have the highest vote share percentage and have garnered 63% of the votes. State
Parties have the second highest vote share and have garnered 23% of the votes. All other types of parties
have vote share in single digits.
Table No. 5.3: Party-wise Votes and Vote Share
Party Name Votes Secured
Vote
Share
Bhartiya Janata Party 9538141 33.23%
Indian National Congress 3843751 13.39%
Nationalist Congress Party 3665724 12.77%
Bahujan Samaj Party 813074 2.83%
Communist Party Of India (Marxist) 76256 0.27%
Communist Party Of India 6052 0.02%
Shivsena 5607484 19.53%
Maharashtra Navnirman Sena 1304657 4.55%
All India Majlis e Ittehadul Muslimeen 579291 2.02%
Samajwadi Party 142291 0.50%
Indian Union Muslim League 53714 0.19%
5%
63%2%
3%
3%
24%
Party Type wise Votes Share Percentage
Independent National Party NOTA Other State Party SEC Reg. Party State Party
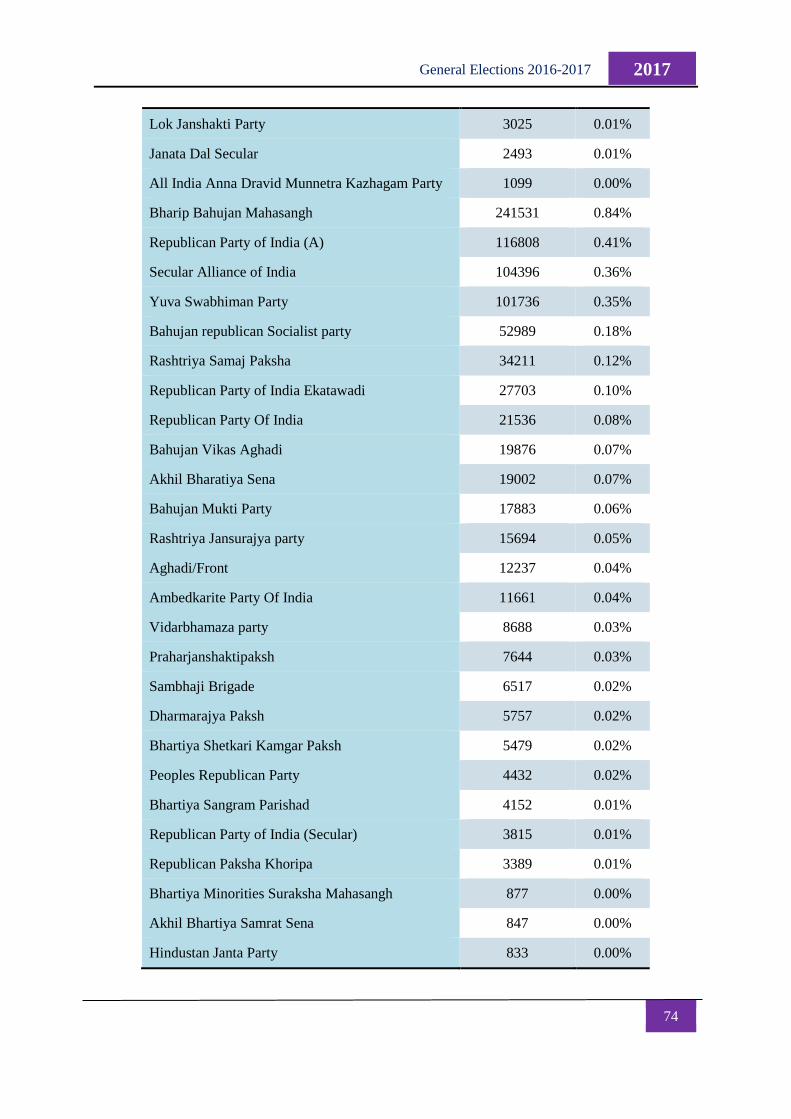
74
2017 General Elections 2016-2017
Lok Janshakti Party 3025 0.01%
Janata Dal Secular 2493 0.01%
All India Anna Dravid Munnetra Kazhagam Party 1099 0.00%
Bharip Bahujan Mahasangh 241531 0.84%
Republican Party of India (A) 116808 0.41%
Secular Alliance of India 104396 0.36%
Yuva Swabhiman Party 101736 0.35%
Bahujan republican Socialist party 52989 0.18%
Rashtriya Samaj Paksha 34211 0.12%
Republican Party of India Ekatawadi 27703 0.10%
Republican Party Of India 21536 0.08%
Bahujan Vikas Aghadi 19876 0.07%
Akhil Bharatiya Sena 19002 0.07%
Bahujan Mukti Party 17883 0.06%
Rashtriya Jansurajya party 15694 0.05%
Aghadi/Front 12237 0.04%
Ambedkarite Party Of India 11661 0.04%
Vidarbhamaza party 8688 0.03%
Praharjanshaktipaksh 7644 0.03%
Sambhaji Brigade 6517 0.02%
Dharmarajya Paksh 5757 0.02%
Bhartiya Shetkari Kamgar Paksh 5479 0.02%
Peoples Republican Party 4432 0.02%
Bhartiya Sangram Parishad 4152 0.01%
Republican Party of India (Secular) 3815 0.01%
Republican Paksha Khoripa 3389 0.01%
Bhartiya Minorities Suraksha Mahasangh 877 0.00%
Akhil Bhartiya Samrat Sena 847 0.00%
Hindustan Janta Party 833 0.00%
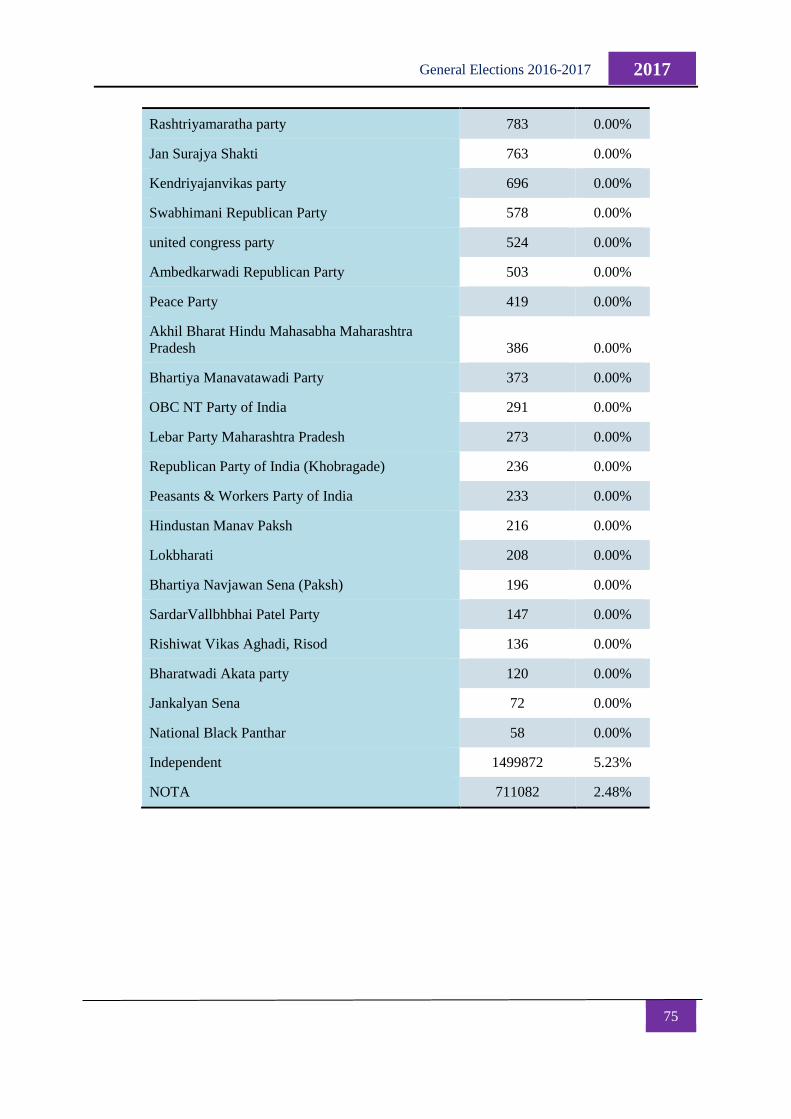
75
2017 General Elections 2016-2017
Rashtriyamaratha party 783 0.00%
Jan Surajya Shakti 763 0.00%
Kendriyajanvikas party 696 0.00%
Swabhimani Republican Party 578 0.00%
united congress party 524 0.00%
Ambedkarwadi Republican Party 503 0.00%
Peace Party 419 0.00%
Akhil Bharat Hindu Mahasabha Maharashtra
Pradesh 386 0.00%
Bhartiya Manavatawadi Party 373 0.00%
OBC NT Party of India 291 0.00%
Lebar Party Maharashtra Pradesh 273 0.00%
Republican Party of India (Khobragade) 236 0.00%
Peasants & Workers Party of India 233 0.00%
Hindustan Manav Paksh 216 0.00%
Lokbharati 208 0.00%
Bhartiya Navjawan Sena (Paksh) 196 0.00%
SardarVallbhbhai Patel Party 147 0.00%
Rishiwat Vikas Aghadi, Risod 136 0.00%
Bharatwadi Akata party 120 0.00%
Jankalyan Sena 72 0.00%
National Black Panthar 58 0.00%
Independent 1499872 5.23%
NOTA 711082 2.48%
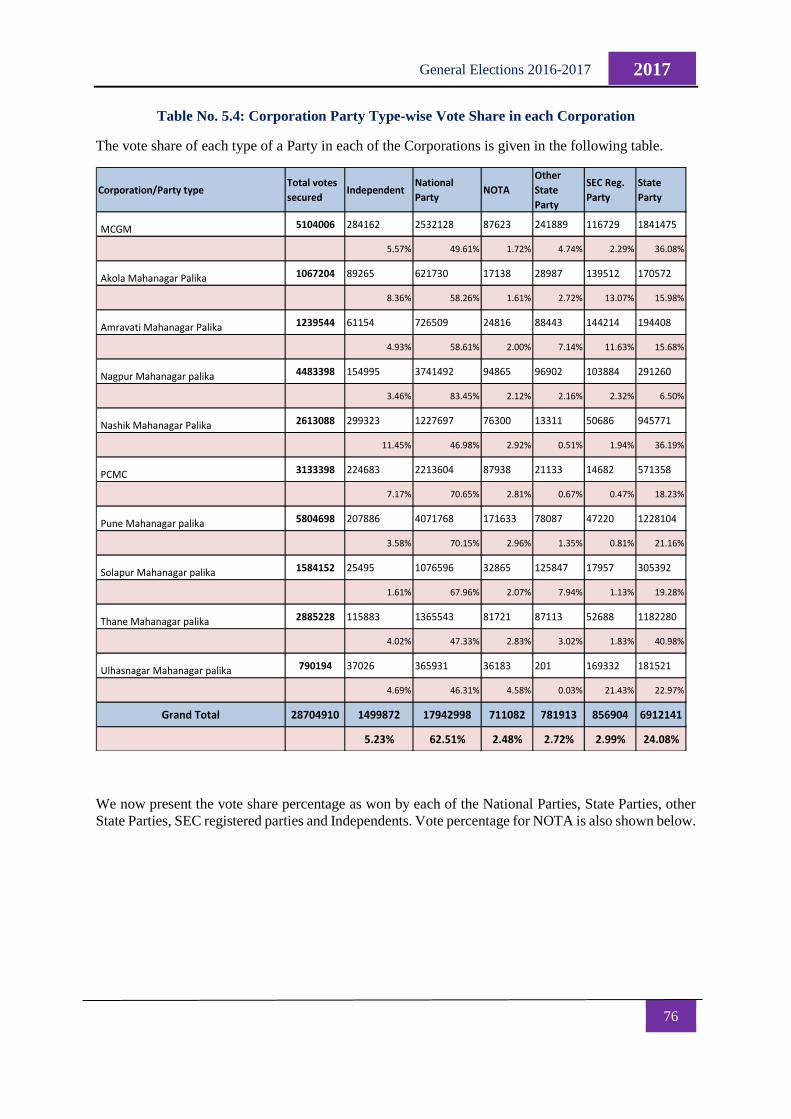
76
2017 General Elections 2016-2017
Table No. 5.4: Corporation Party Type-wise Vote Share in each Corporation
The vote share of each type of a Party in each of the Corporations is given in the following table.
We now present the vote share percentage as won by each of the National Parties, State Parties, other
State Parties, SEC registered parties and Independents. Vote percentage for NOTA is also shown below.
Corporation/Party typeTotal votes
securedIndependent
National
Party NOTA
Other
State
Party
SEC Reg.
Party
State
Party
MCGM 5104006 284162 2532128 87623 241889 116729 1841475
5.57% 49.61% 1.72% 4.74% 2.29% 36.08%
Akola Mahanagar Palika 1067204 89265 621730 17138 28987 139512 170572
8.36% 58.26% 1.61% 2.72% 13.07% 15.98%
Amravati Mahanagar Palika 1239544 61154 726509 24816 88443 144214 194408
4.93% 58.61% 2.00% 7.14% 11.63% 15.68%
Nagpur Mahanagar palika 4483398 154995 3741492 94865 96902 103884 291260
3.46% 83.45% 2.12% 2.16% 2.32% 6.50%
Nashik Mahanagar Palika 2613088 299323 1227697 76300 13311 50686 945771
11.45% 46.98% 2.92% 0.51% 1.94% 36.19%
PCMC 3133398 224683 2213604 87938 21133 14682 571358
7.17% 70.65% 2.81% 0.67% 0.47% 18.23%
Pune Mahanagar palika 5804698 207886 4071768 171633 78087 47220 1228104
3.58% 70.15% 2.96% 1.35% 0.81% 21.16%
Solapur Mahanagar palika 1584152 25495 1076596 32865 125847 17957 305392
1.61% 67.96% 2.07% 7.94% 1.13% 19.28%
Thane Mahanagar palika 2885228 115883 1365543 81721 87113 52688 1182280
4.02% 47.33% 2.83% 3.02% 1.83% 40.98%
Ulhasnagar Mahanagar palika 790194 37026 365931 36183 201 169332 181521
4.69% 46.31% 4.58% 0.03% 21.43% 22.97%
Grand Total 28704910 1499872 17942998 711082 781913 856904 6912141
5.23% 62.51% 2.48% 2.72% 2.99% 24.08%
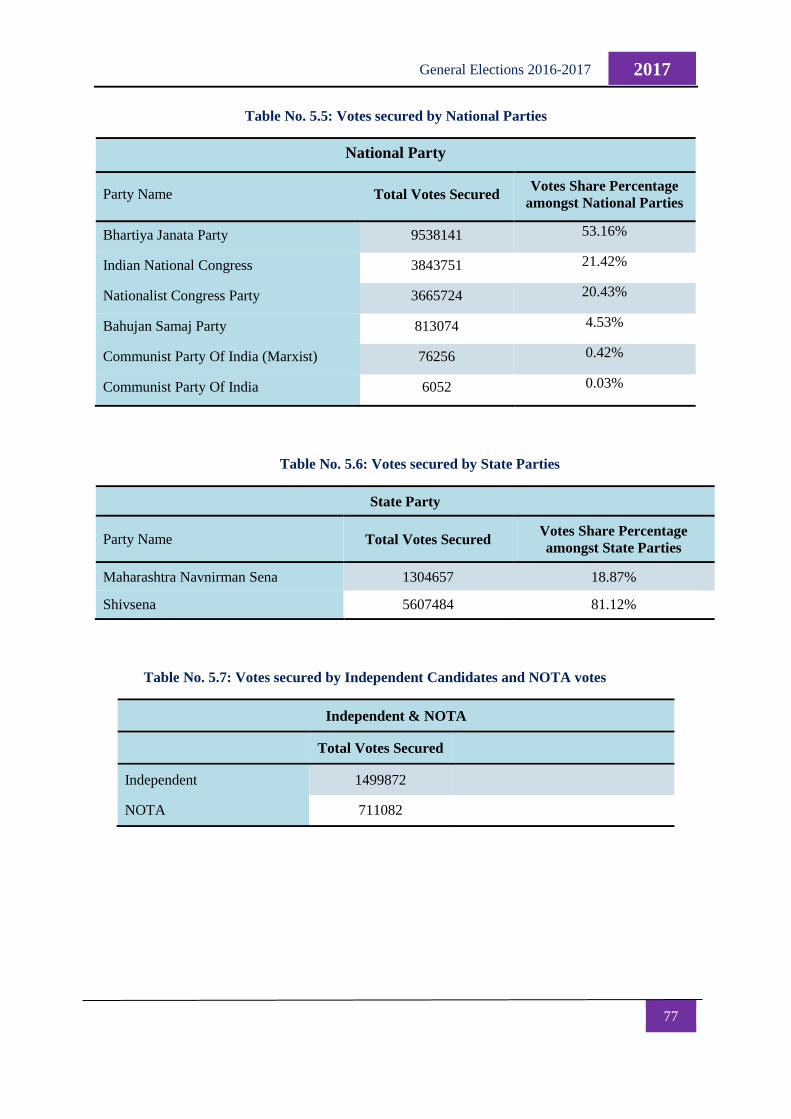
77
2017 General Elections 2016-2017
Table No. 5.5: Votes secured by National Parties
National Party
Party Name Total Votes Secured Votes Share Percentage
amongst National Parties
Bhartiya Janata Party 9538141 53.16%
Indian National Congress 3843751 21.42%
Nationalist Congress Party 3665724 20.43%
Bahujan Samaj Party 813074 4.53%
Communist Party Of India (Marxist) 76256 0.42%
Communist Party Of India 6052 0.03%
Table No. 5.6: Votes secured by State Parties
State Party
Party Name Total Votes Secured Votes Share Percentage
amongst State Parties
Maharashtra Navnirman Sena 1304657 18.87%
Shivsena 5607484 81.12%
Table No. 5.7: Votes secured by Independent Candidates and NOTA votes
Independent & NOTA
Total Votes Secured
Independent 1499872
NOTA 711082
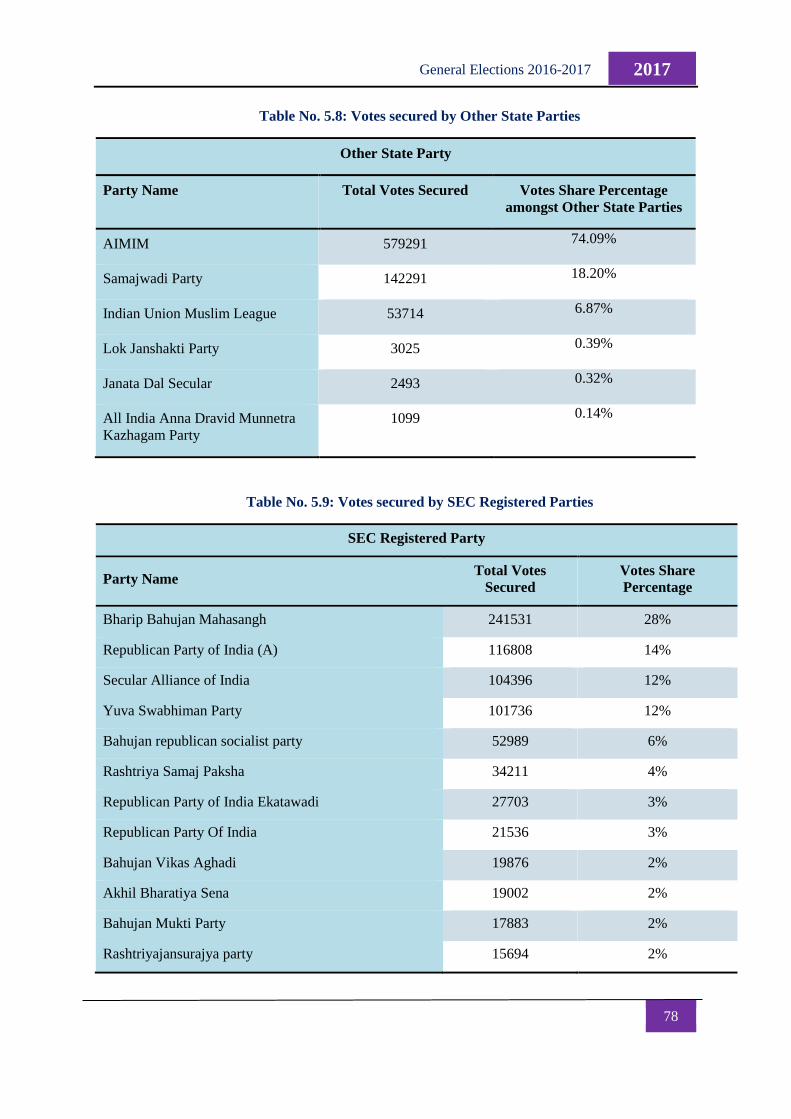
78
2017 General Elections 2016-2017
Table No. 5.8: Votes secured by Other State Parties
Other State Party
Party Name Total Votes Secured Votes Share Percentage
amongst Other State Parties
AIMIM 579291 74.09%
Samajwadi Party 142291 18.20%
Indian Union Muslim League 53714 6.87%
Lok Janshakti Party 3025 0.39%
Janata Dal Secular 2493 0.32%
All India Anna Dravid Munnetra
Kazhagam Party
1099 0.14%
Table No. 5.9: Votes secured by SEC Registered Parties
SEC Registered Party
Party Name Total Votes
Secured
Votes Share
Percentage
Bharip Bahujan Mahasangh 241531 28%
Republican Party of India (A) 116808 14%
Secular Alliance of India 104396 12%
Yuva Swabhiman Party 101736 12%
Bahujan republican socialist party 52989 6%
Rashtriya Samaj Paksha 34211 4%
Republican Party of India Ekatawadi 27703 3%
Republican Party Of India 21536 3%
Bahujan Vikas Aghadi 19876 2%
Akhil Bharatiya Sena 19002 2%
Bahujan Mukti Party 17883 2%
Rashtriyajansurajya party 15694 2%
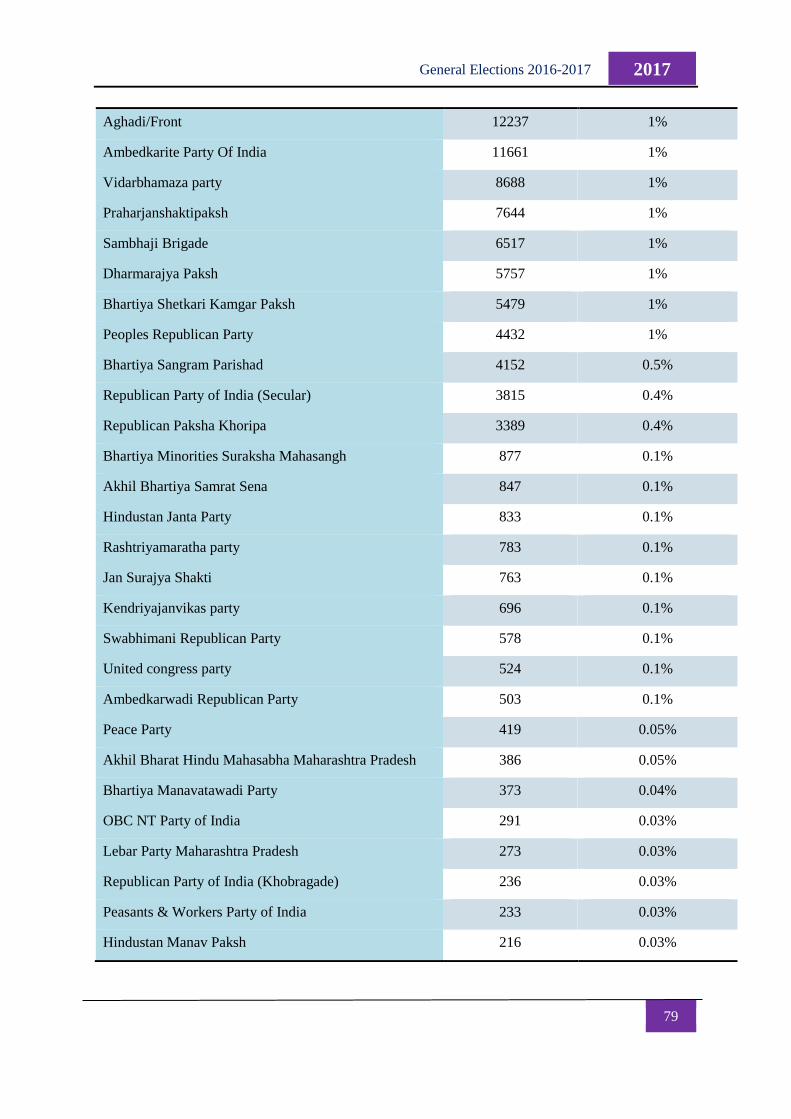
79
2017 General Elections 2016-2017
Aghadi/Front 12237 1%
Ambedkarite Party Of India 11661 1%
Vidarbhamaza party 8688 1%
Praharjanshaktipaksh 7644 1%
Sambhaji Brigade 6517 1%
Dharmarajya Paksh 5757 1%
Bhartiya Shetkari Kamgar Paksh 5479 1%
Peoples Republican Party 4432 1%
Bhartiya Sangram Parishad 4152 0.5%
Republican Party of India (Secular) 3815 0.4%
Republican Paksha Khoripa 3389 0.4%
Bhartiya Minorities Suraksha Mahasangh 877 0.1%
Akhil Bhartiya Samrat Sena 847 0.1%
Hindustan Janta Party 833 0.1%
Rashtriyamaratha party 783 0.1%
Jan Surajya Shakti 763 0.1%
Kendriyajanvikas party 696 0.1%
Swabhimani Republican Party 578 0.1%
United congress party 524 0.1%
Ambedkarwadi Republican Party 503 0.1%
Peace Party 419 0.05%
Akhil Bharat Hindu Mahasabha Maharashtra Pradesh 386 0.05%
Bhartiya Manavatawadi Party 373 0.04%
OBC NT Party of India 291 0.03%
Lebar Party Maharashtra Pradesh 273 0.03%
Republican Party of India (Khobragade) 236 0.03%
Peasants & Workers Party of India 233 0.03%
Hindustan Manav Paksh 216 0.03%
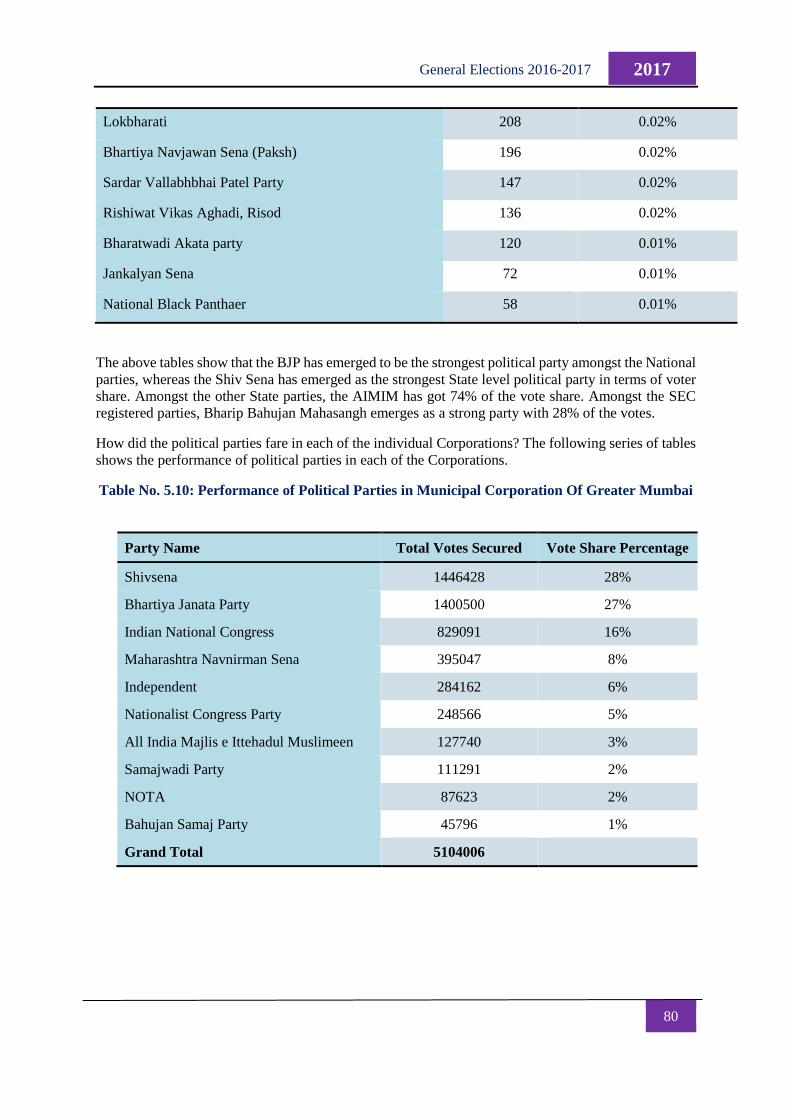
80
2017 General Elections 2016-2017
Lokbharati 208 0.02%
Bhartiya Navjawan Sena (Paksh) 196 0.02%
Sardar Vallabhbhai Patel Party 147 0.02%
Rishiwat Vikas Aghadi, Risod 136 0.02%
Bharatwadi Akata party 120 0.01%
Jankalyan Sena 72 0.01%
National Black Panthaer 58 0.01%
The above tables show that the BJP has emerged to be the strongest political party amongst the National
parties, whereas the Shiv Sena has emerged as the strongest State level political party in terms of voter
share. Amongst the other State parties, the AIMIM has got 74% of the vote share. Amongst the SEC
registered parties, Bharip Bahujan Mahasangh emerges as a strong party with 28% of the votes.
How did the political parties fare in each of the individual Corporations? The following series of tables
shows the performance of political parties in each of the Corporations.
Table No. 5.10: Performance of Political Parties in Municipal Corporation Of Greater Mumbai
Party Name Total Votes Secured Vote Share Percentage
Shivsena 1446428 28%
Bhartiya Janata Party 1400500 27%
Indian National Congress 829091 16%
Maharashtra Navnirman Sena 395047 8%
Independent 284162 6%
Nationalist Congress Party 248566 5%
All India Majlis e Ittehadul Muslimeen 127740 3%
Samajwadi Party 111291 2%
NOTA 87623 2%
Bahujan Samaj Party 45796 1%
Grand Total 5104006
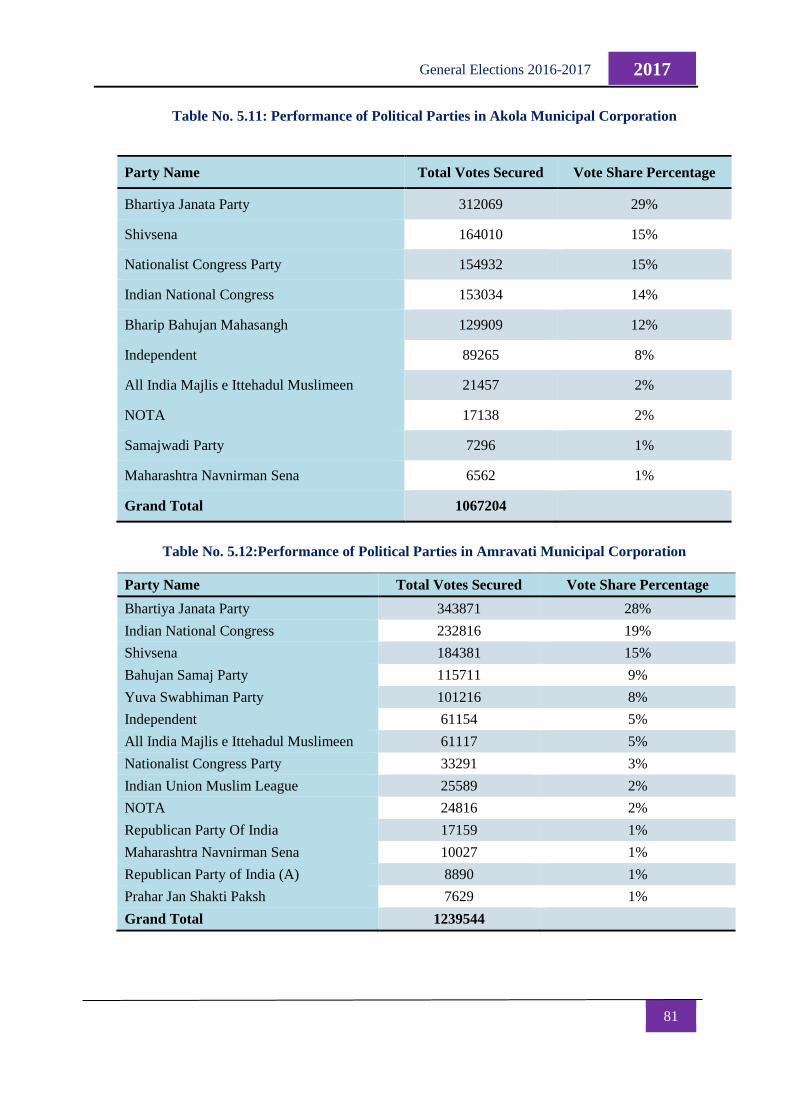
81
2017 General Elections 2016-2017
Table No. 5.11: Performance of Political Parties in Akola Municipal Corporation
Party Name Total Votes Secured Vote Share Percentage
Bhartiya Janata Party 312069 29%
Shivsena 164010 15%
Nationalist Congress Party 154932 15%
Indian National Congress 153034 14%
Bharip Bahujan Mahasangh 129909 12%
Independent 89265 8%
All India Majlis e Ittehadul Muslimeen 21457 2%
NOTA 17138 2%
Samajwadi Party 7296 1%
Maharashtra Navnirman Sena 6562 1%
Grand Total 1067204
Table No. 5.12:Performance of Political Parties in Amravati Municipal Corporation
Party Name Total Votes Secured Vote Share Percentage
Bhartiya Janata Party 343871 28%
Indian National Congress 232816 19%
Shivsena 184381 15%
Bahujan Samaj Party 115711 9%
Yuva Swabhiman Party 101216 8%
Independent 61154 5%
All India Majlis e Ittehadul Muslimeen 61117 5%
Nationalist Congress Party 33291 3%
Indian Union Muslim League 25589 2%
NOTA 24816 2%
Republican Party Of India 17159 1%
Maharashtra Navnirman Sena 10027 1%
Republican Party of India (A) 8890 1%
Prahar Jan Shakti Paksh 7629 1%
Grand Total 1239544
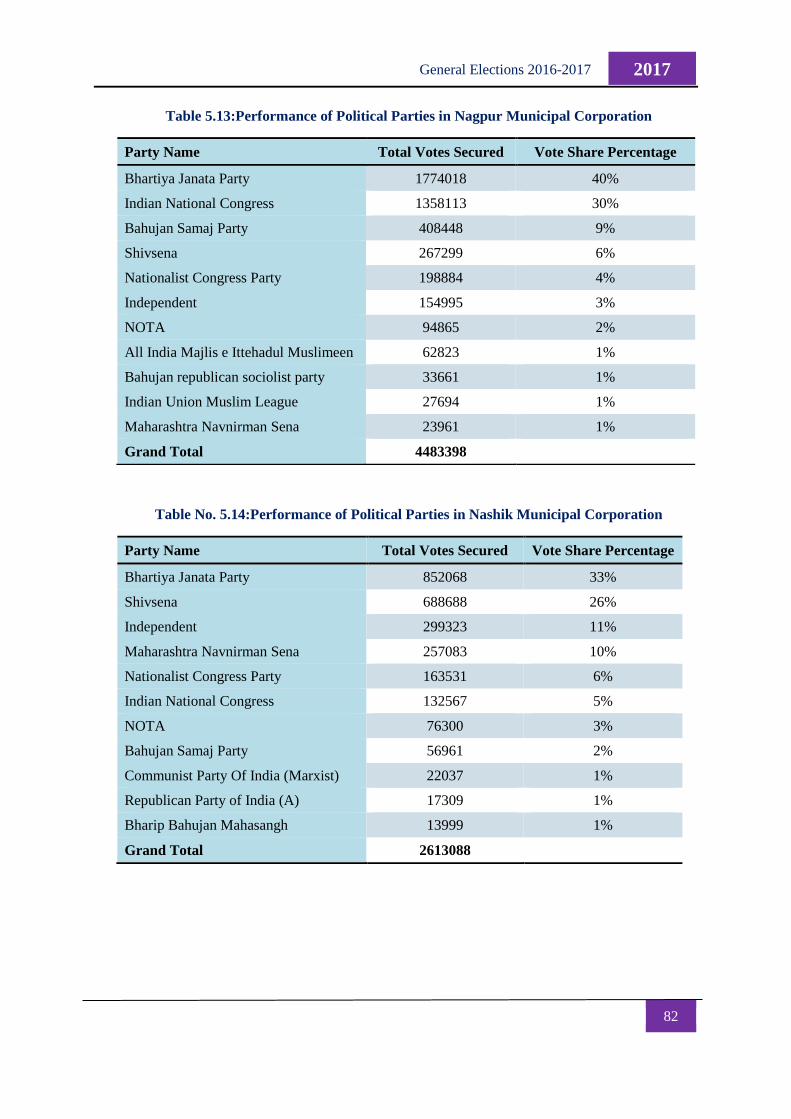
82
2017 General Elections 2016-2017
Table 5.13:Performance of Political Parties in Nagpur Municipal Corporation
Party Name Total Votes Secured Vote Share Percentage
Bhartiya Janata Party 1774018 40%
Indian National Congress 1358113 30%
Bahujan Samaj Party 408448 9%
Shivsena 267299 6%
Nationalist Congress Party 198884 4%
Independent 154995 3%
NOTA 94865 2%
All India Majlis e Ittehadul Muslimeen 62823 1%
Bahujan republican sociolist party 33661 1%
Indian Union Muslim League 27694 1%
Maharashtra Navnirman Sena 23961 1%
Grand Total 4483398
Table No. 5.14:Performance of Political Parties in Nashik Municipal Corporation
Party Name Total Votes Secured Vote Share Percentage
Bhartiya Janata Party 852068 33%
Shivsena 688688 26%
Independent 299323 11%
Maharashtra Navnirman Sena 257083 10%
Nationalist Congress Party 163531 6%
Indian National Congress 132567 5%
NOTA 76300 3%
Bahujan Samaj Party 56961 2%
Communist Party Of India (Marxist) 22037 1%
Republican Party of India (A) 17309 1%
Bharip Bahujan Mahasangh 13999 1%
Grand Total 2613088
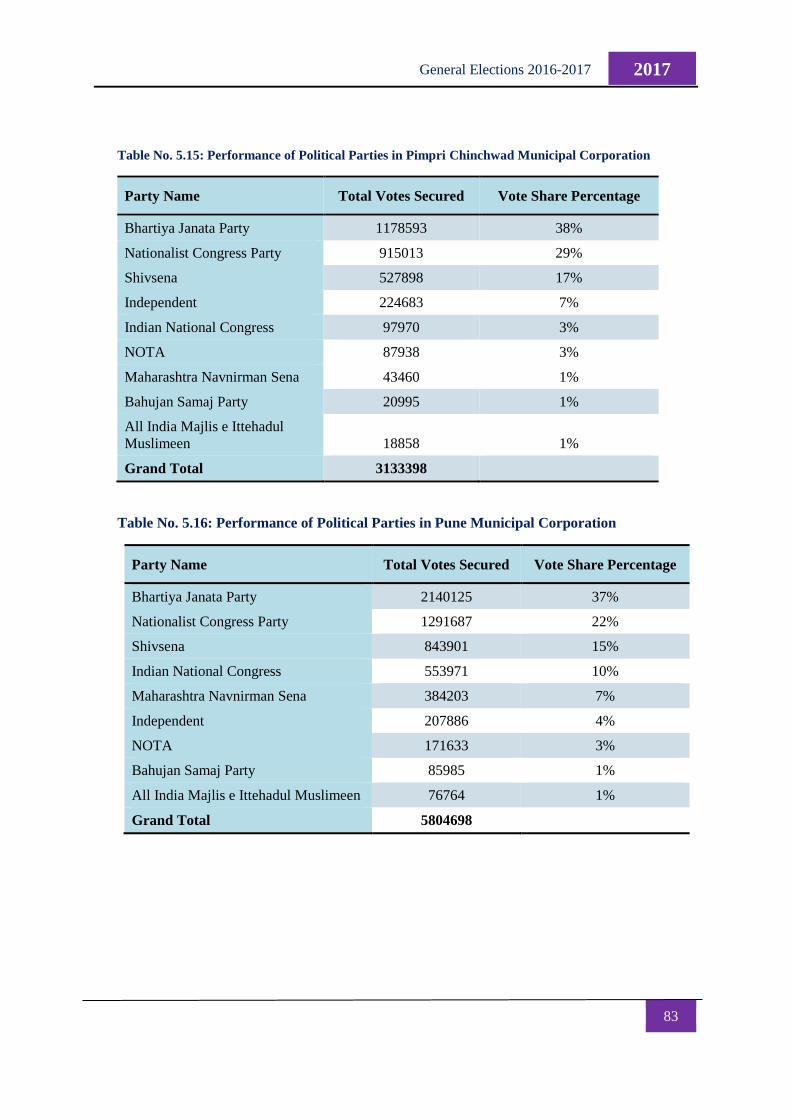
83
2017 General Elections 2016-2017
Table No. 5.15: Performance of Political Parties in Pimpri Chinchwad Municipal Corporation
Party Name Total Votes Secured Vote Share Percentage
Bhartiya Janata Party 1178593 38%
Nationalist Congress Party 915013 29%
Shivsena 527898 17%
Independent 224683 7%
Indian National Congress 97970 3%
NOTA 87938 3%
Maharashtra Navnirman Sena 43460 1%
Bahujan Samaj Party 20995 1%
All India Majlis e Ittehadul
Muslimeen 18858 1%
Grand Total 3133398
Table No. 5.16: Performance of Political Parties in Pune Municipal Corporation
Party Name Total Votes Secured Vote Share Percentage
Bhartiya Janata Party 2140125 37%
Nationalist Congress Party 1291687 22%
Shivsena 843901 15%
Indian National Congress 553971 10%
Maharashtra Navnirman Sena 384203 7%
Independent 207886 4%
NOTA 171633 3%
Bahujan Samaj Party 85985 1%
All India Majlis e Ittehadul Muslimeen 76764 1%
Grand Total 5804698
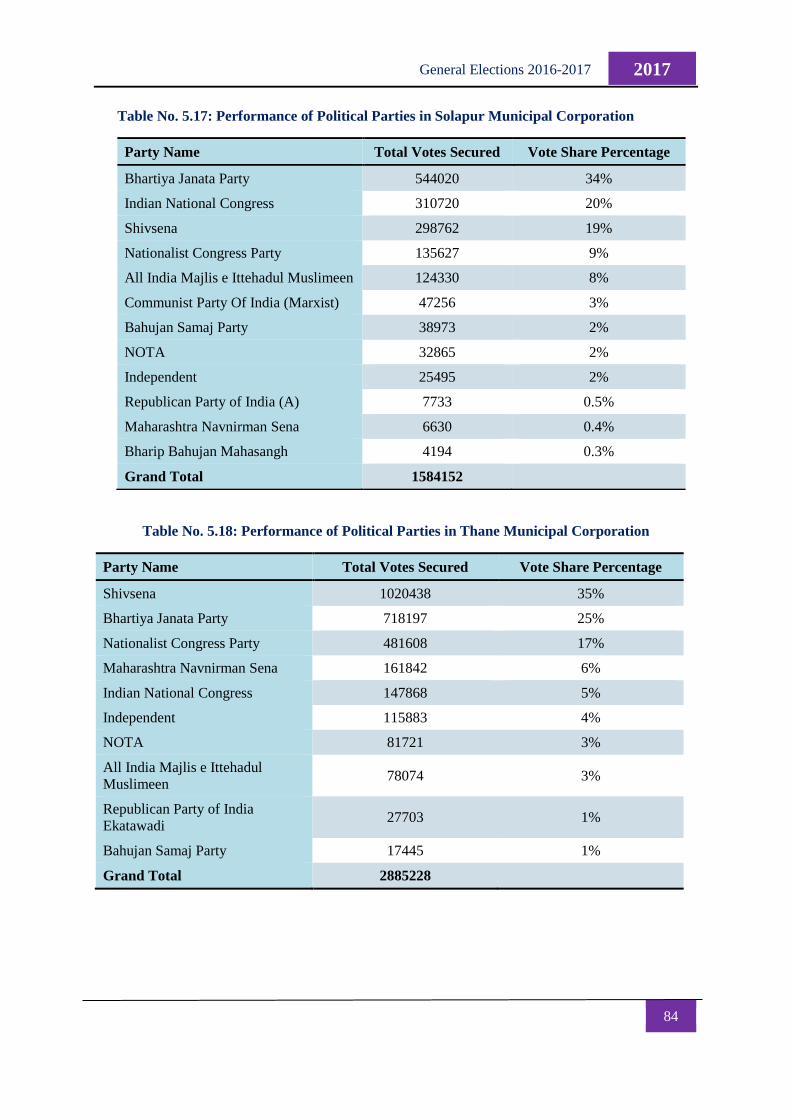
84
2017 General Elections 2016-2017
Table No. 5.17: Performance of Political Parties in Solapur Municipal Corporation
Party Name Total Votes Secured Vote Share Percentage
Bhartiya Janata Party 544020 34%
Indian National Congress 310720 20%
Shivsena 298762 19%
Nationalist Congress Party 135627 9%
All India Majlis e Ittehadul Muslimeen 124330 8%
Communist Party Of India (Marxist) 47256 3%
Bahujan Samaj Party 38973 2%
NOTA 32865 2%
Independent 25495 2%
Republican Party of India (A) 7733 0.5%
Maharashtra Navnirman Sena 6630 0.4%
Bharip Bahujan Mahasangh 4194 0.3%
Grand Total 1584152
Table No. 5.18: Performance of Political Parties in Thane Municipal Corporation
Party Name Total Votes Secured Vote Share Percentage
Shivsena 1020438 35%
Bhartiya Janata Party 718197 25%
Nationalist Congress Party 481608 17%
Maharashtra Navnirman Sena 161842 6%
Indian National Congress 147868 5%
Independent 115883 4%
NOTA 81721 3%
All India Majlis e Ittehadul
Muslimeen 78074 3%
Republican Party of India
Ekatawadi 27703 1%
Bahujan Samaj Party 17445 1%
Grand Total 2885228
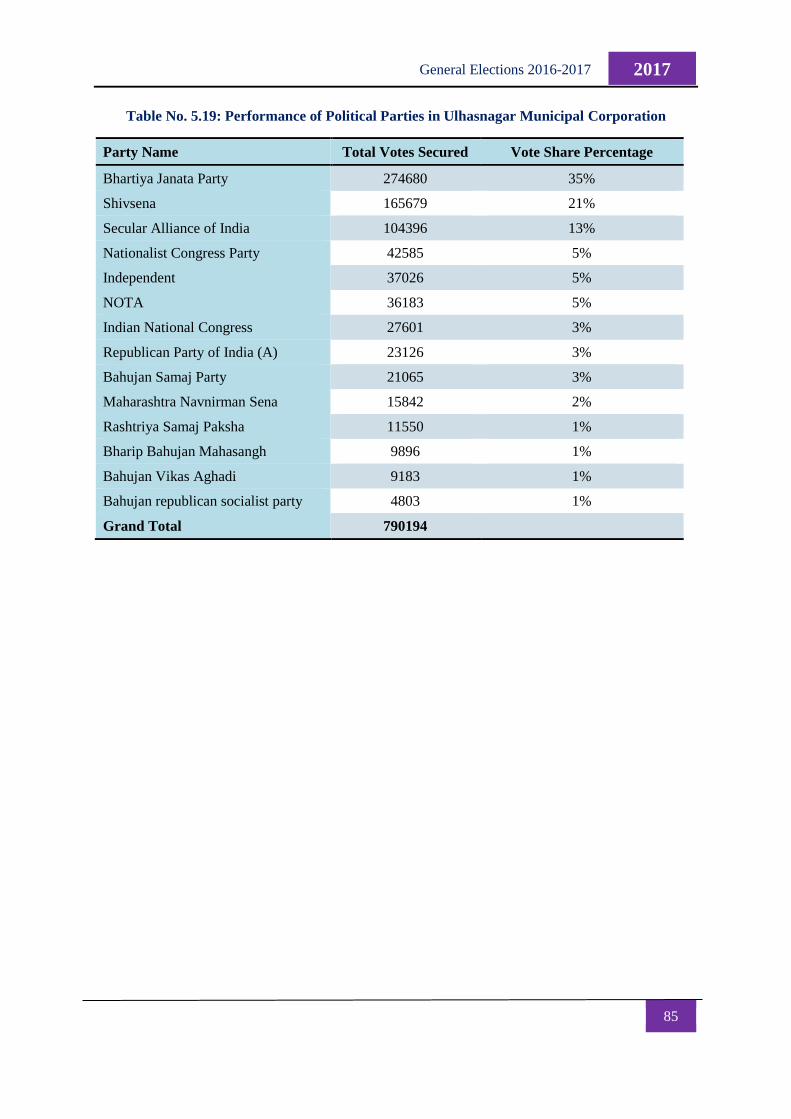
85
2017 General Elections 2016-2017
Table No. 5.19: Performance of Political Parties in Ulhasnagar Municipal Corporation
Party Name Total Votes Secured Vote Share Percentage
Bhartiya Janata Party 274680 35%
Shivsena 165679 21%
Secular Alliance of India 104396 13%
Nationalist Congress Party 42585 5%
Independent 37026 5%
NOTA 36183 5%
Indian National Congress 27601 3%
Republican Party of India (A) 23126 3%
Bahujan Samaj Party 21065 3%
Maharashtra Navnirman Sena 15842 2%
Rashtriya Samaj Paksha 11550 1%
Bharip Bahujan Mahasangh 9896 1%
Bahujan Vikas Aghadi 9183 1%
Bahujan republican socialist party 4803 1%
Grand Total 790194
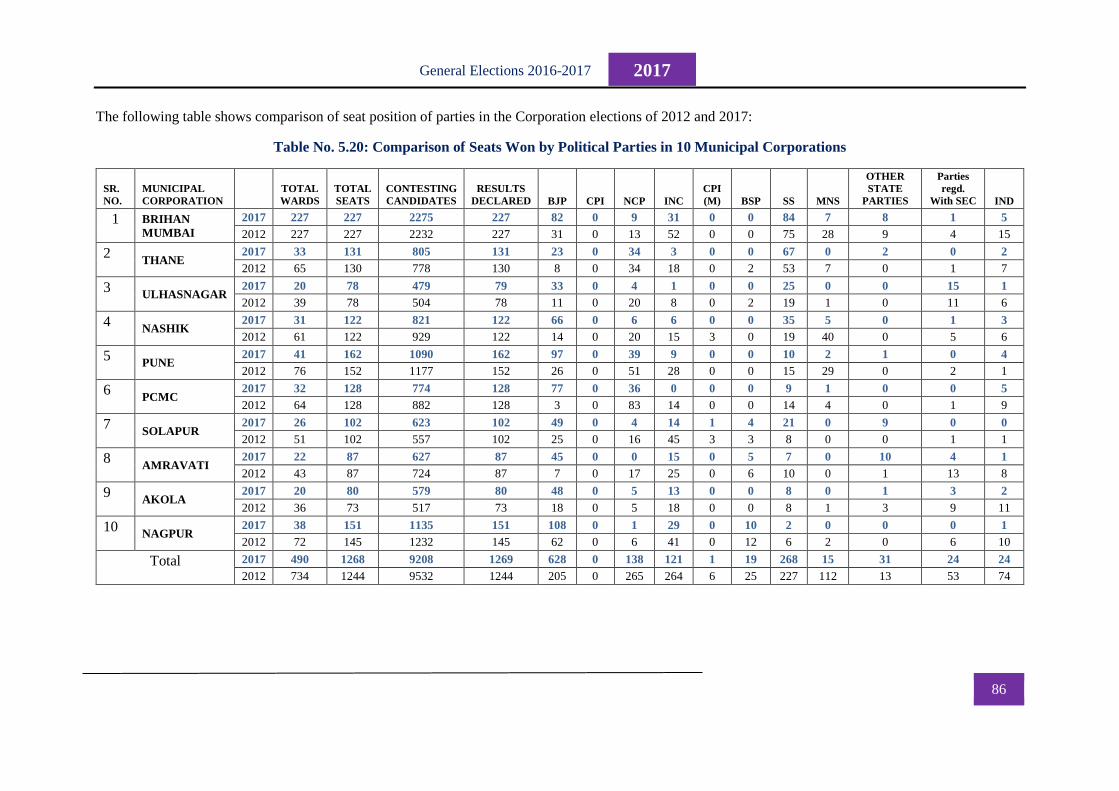
86
2017 General Elections 2016-2017
The following table shows comparison of seat position of parties in the Corporation elections of 2012 and 2017:
Table No. 5.20: Comparison of Seats Won by Political Parties in 10 Municipal Corporations
SR.
NO.
MUNICIPAL
CORPORATION
TOTAL
WARDS
TOTAL
SEATS
CONTESTING
CANDIDATES
RESULTS
DECLARED BJP CPI NCP INC
CPI
(M) BSP SS MNS
OTHER
STATE
PARTIES
Parties
regd.
With SEC IND
1 BRIHAN
MUMBAI
2017 227 227 2275 227 82 0 9 31 0 0 84 7 8 1 5
2012 227 227 2232 227 31 0 13 52 0 0 75 28 9 4 15
2 THANE
2017 33 131 805 131 23 0 34 3 0 0 67 0 2 0 2
2012 65 130 778 130 8 0 34 18 0 2 53 7 0 1 7
3 ULHASNAGAR
2017 20 78 479 79 33 0 4 1 0 0 25 0 0 15 1
2012 39 78 504 78 11 0 20 8 0 2 19 1 0 11 6
4 NASHIK
2017 31 122 821 122 66 0 6 6 0 0 35 5 0 1 3
2012 61 122 929 122 14 0 20 15 3 0 19 40 0 5 6
5 PUNE
2017 41 162 1090 162 97 0 39 9 0 0 10 2 1 0 4
2012 76 152 1177 152 26 0 51 28 0 0 15 29 0 2 1
6 PCMC
2017 32 128 774 128 77 0 36 0 0 0 9 1 0 0 5
2012 64 128 882 128 3 0 83 14 0 0 14 4 0 1 9
7 SOLAPUR
2017 26 102 623 102 49 0 4 14 1 4 21 0 9 0 0
2012 51 102 557 102 25 0 16 45 3 3 8 0 0 1 1
8 AMRAVATI
2017 22 87 627 87 45 0 0 15 0 5 7 0 10 4 1
2012 43 87 724 87 7 0 17 25 0 6 10 0 1 13 8
9 AKOLA
2017 20 80 579 80 48 0 5 13 0 0 8 0 1 3 2
2012 36 73 517 73 18 0 5 18 0 0 8 1 3 9 11
10 NAGPUR
2017 38 151 1135 151 108 0 1 29 0 10 2 0 0 0 1
2012 72 145 1232 145 62 0 6 41 0 12 6 2 0 6 10
Total 2017 490 1268 9208 1269 628 0 138 121 1 19 268 15 31 24 24
2012 734 1244 9532 1244 205 0 265 264 6 25 227 112 13 53 74
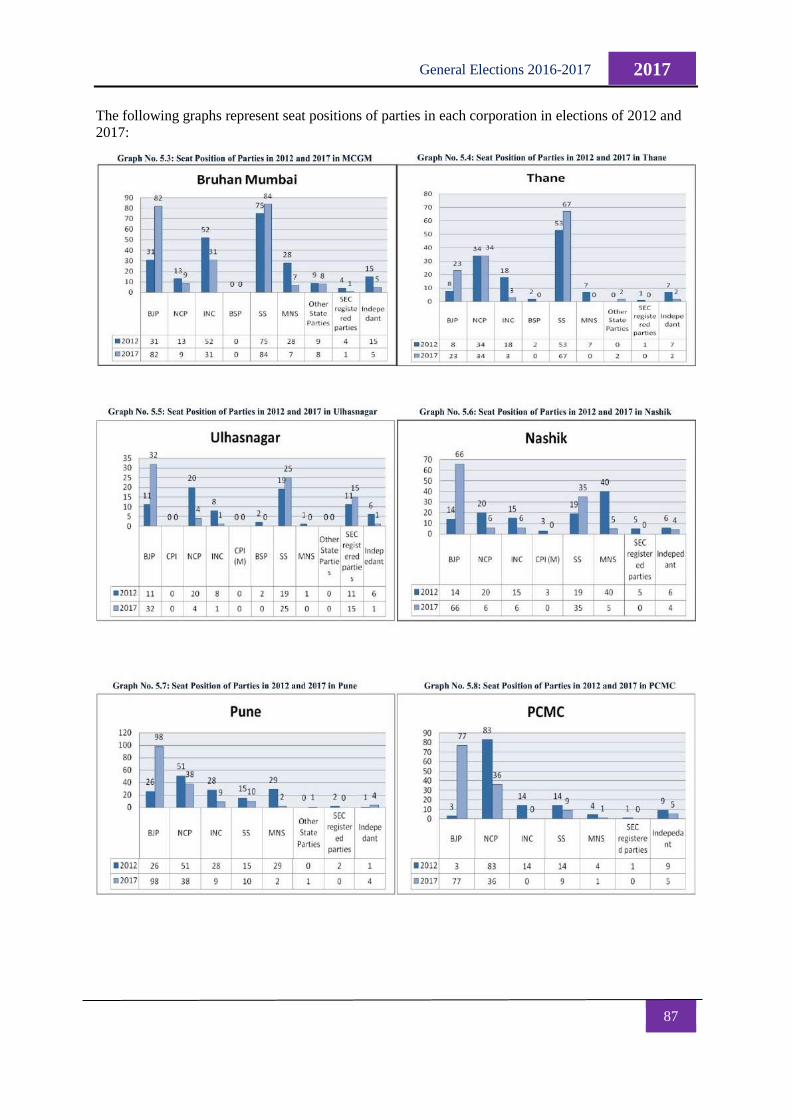
87
2017 General Elections 2016-2017
The following graphs represent seat positions of parties in each corporation in elections of 2012 and
2017:
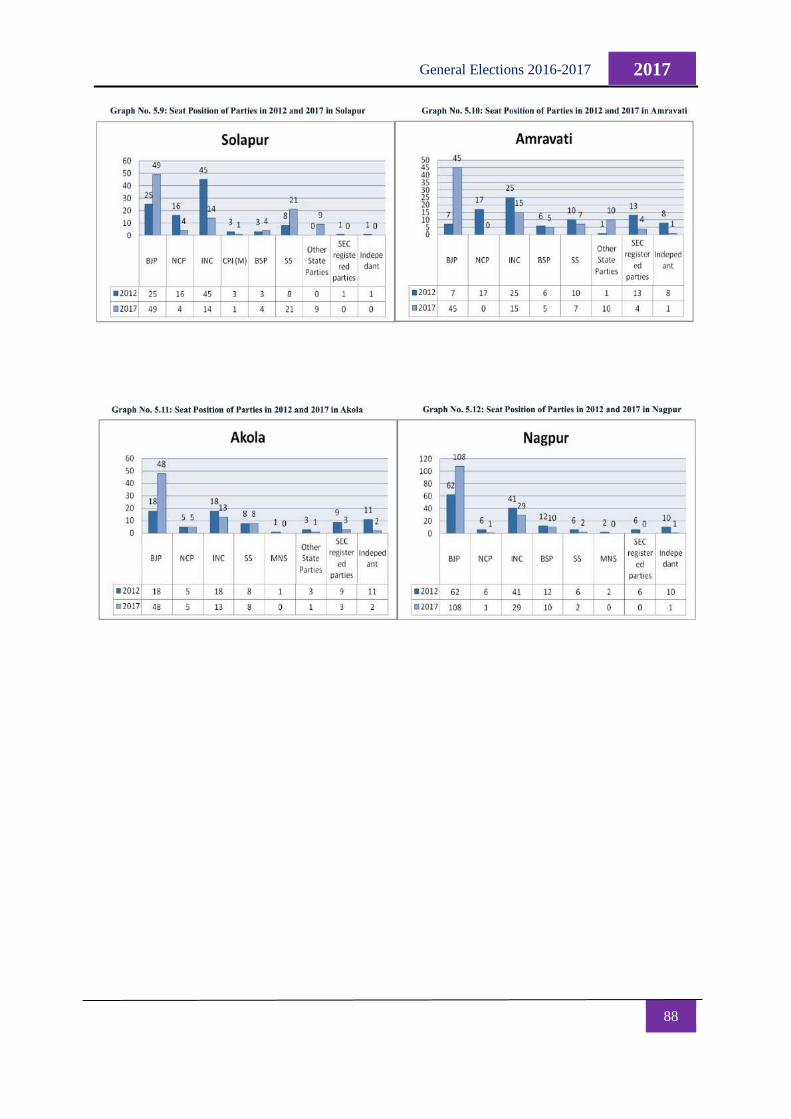
88
2017 General Elections 2016-2017
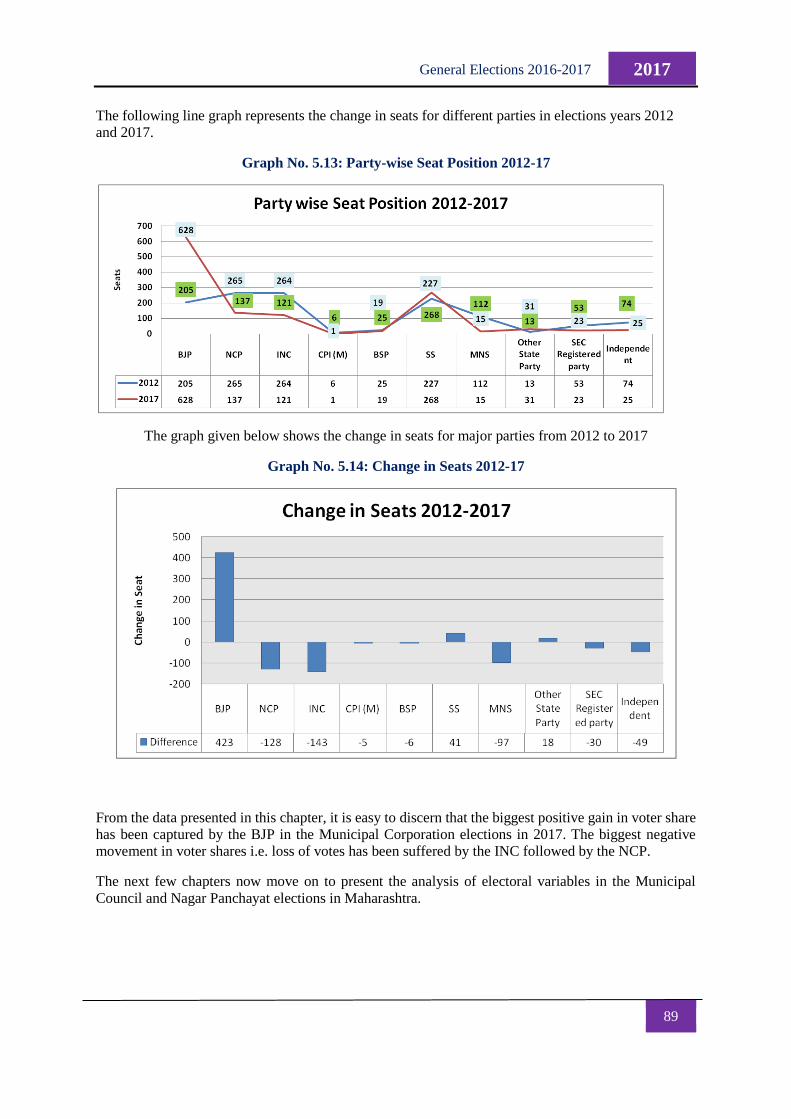
89
2017 General Elections 2016-2017
The following line graph represents the change in seats for different parties in elections years 2012
and 2017.
Graph No. 5.13: Party-wise Seat Position 2012-17
The graph given below shows the change in seats for major parties from 2012 to 2017
Graph No. 5.14: Change in Seats 2012-17
From the data presented in this chapter, it is easy to discern that the biggest positive gain in voter share
has been captured by the BJP in the Municipal Corporation elections in 2017. The biggest negative
movement in voter shares i.e. loss of votes has been suffered by the INC followed by the NCP.
The next few chapters now move on to present the analysis of electoral variables in the Municipal
Council and Nagar Panchayat elections in Maharashtra.
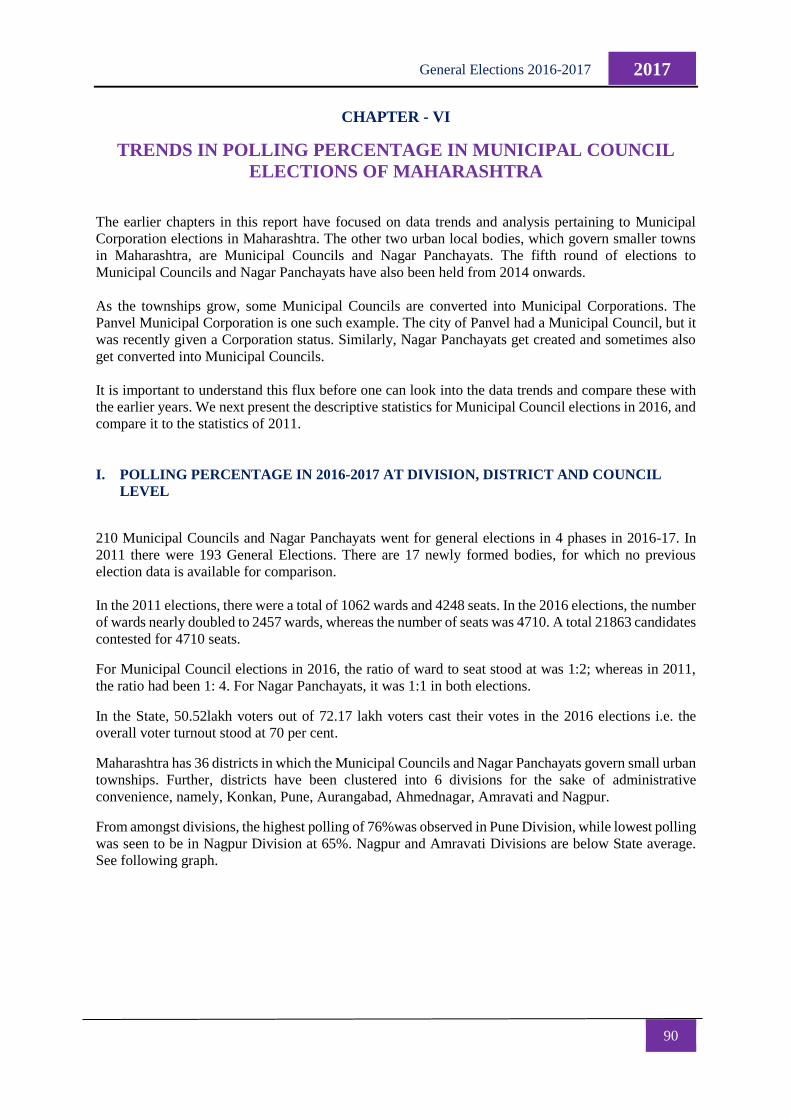
90
2017 General Elections 2016-2017
CHAPTER - VI
TRENDS IN POLLING PERCENTAGE IN MUNICIPAL COUNCIL
ELECTIONS OF MAHARASHTRA
The earlier chapters in this report have focused on data trends and analysis pertaining to Municipal
Corporation elections in Maharashtra. The other two urban local bodies, which govern smaller towns
in Maharashtra, are Municipal Councils and Nagar Panchayats. The fifth round of elections to
Municipal Councils and Nagar Panchayats have also been held from 2014 onwards.
As the townships grow, some Municipal Councils are converted into Municipal Corporations. The
Panvel Municipal Corporation is one such example. The city of Panvel had a Municipal Council, but it
was recently given a Corporation status. Similarly, Nagar Panchayats get created and sometimes also
get converted into Municipal Councils.
It is important to understand this flux before one can look into the data trends and compare these with
the earlier years. We next present the descriptive statistics for Municipal Council elections in 2016, and
compare it to the statistics of 2011.
I. POLLING PERCENTAGE IN 2016-2017 AT DIVISION, DISTRICT AND COUNCIL
LEVEL
210 Municipal Councils and Nagar Panchayats went for general elections in 4 phases in 2016-17. In
2011 there were 193 General Elections. There are 17 newly formed bodies, for which no previous
election data is available for comparison.
In the 2011 elections, there were a total of 1062 wards and 4248 seats. In the 2016 elections, the number
of wards nearly doubled to 2457 wards, whereas the number of seats was 4710. A total 21863 candidates
contested for 4710 seats.
For Municipal Council elections in 2016, the ratio of ward to seat stood at was 1:2; whereas in 2011,
the ratio had been 1: 4. For Nagar Panchayats, it was 1:1 in both elections.
In the State, 50.52lakh voters out of 72.17 lakh voters cast their votes in the 2016 elections i.e. the
overall voter turnout stood at 70 per cent.
Maharashtra has 36 districts in which the Municipal Councils and Nagar Panchayats govern small urban
townships. Further, districts have been clustered into 6 divisions for the sake of administrative
convenience, namely, Konkan, Pune, Aurangabad, Ahmednagar, Amravati and Nagpur.
From amongst divisions, the highest polling of 76%was observed in Pune Division, while lowest polling
was seen to be in Nagpur Division at 65%. Nagpur and Amravati Divisions are below State average.
See following graph.
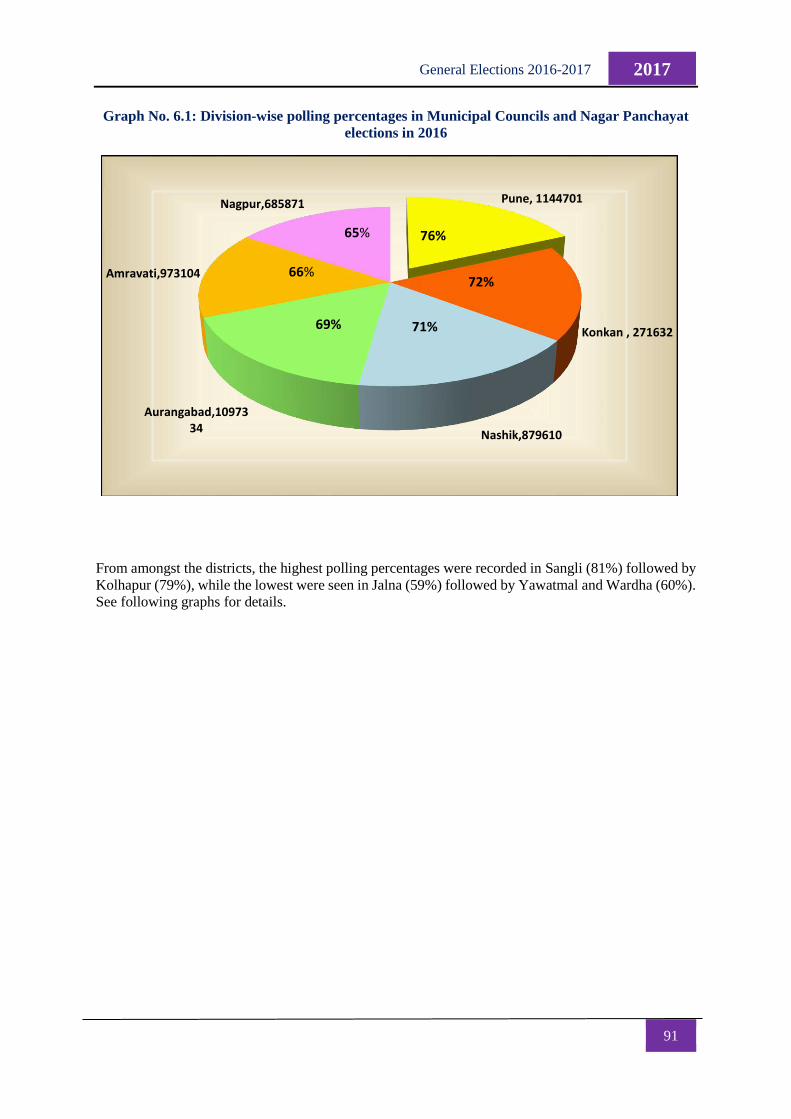
91
2017 General Elections 2016-2017
Graph No. 6.1: Division-wise polling percentages in Municipal Councils and Nagar Panchayat
elections in 2016
From amongst the districts, the highest polling percentages were recorded in Sangli (81%) followed by
Kolhapur (79%), while the lowest were seen in Jalna (59%) followed by Yawatmal and Wardha (60%).
See following graphs for details.
o
Pune, 1144701
Konkan , 271632
Nashik,879610
Aurangabad,1097334
Amravati,973104
Nagpur,685871
66%
65%
69% 71%
76%
72%
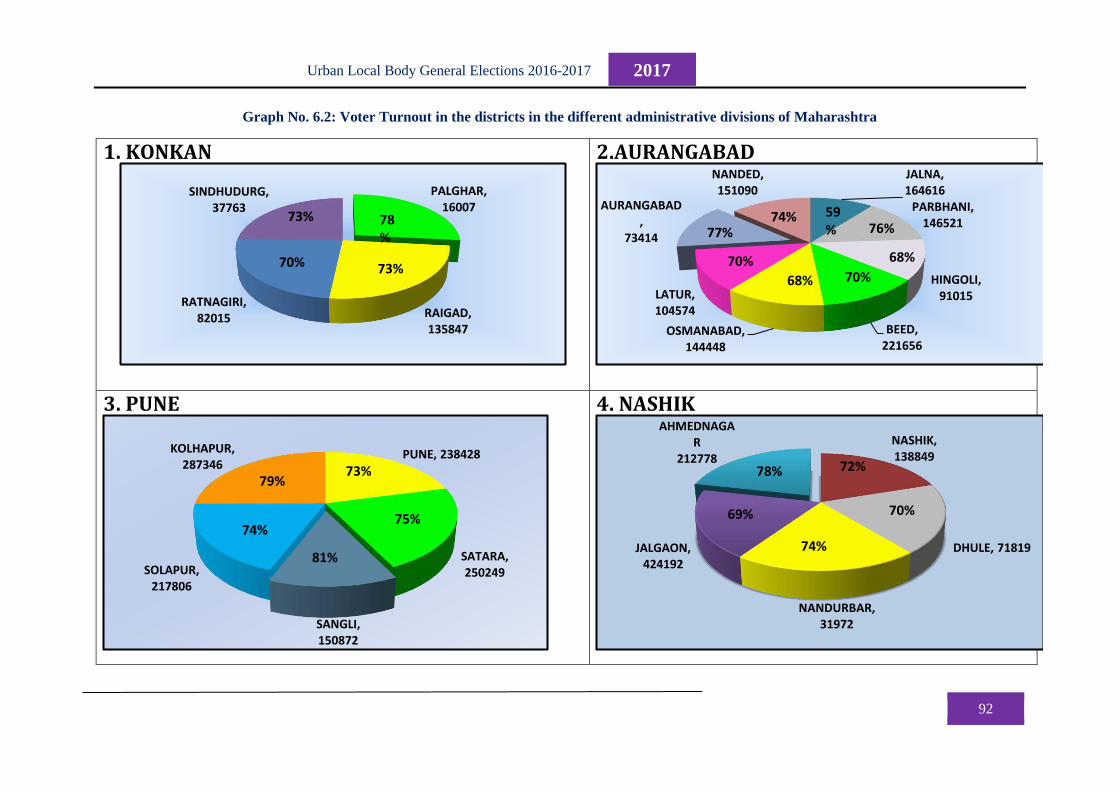
92
2017 Urban Local Body General Elections 2016-2017
Graph No. 6.2: Voter Turnout in the districts in the different administrative divisions of Maharashtra
1. KONKAN
2.AURANGABAD
3. PUNE
4. NASHIK
PALGHAR,16007
RAIGAD,135847
RATNAGIRI,82015
SINDHUDURG, 37763
73% 78%
73%70%
JALNA,164616
PARBHANI,146521
HINGOLI,91015
BEED,221656
OSMANABAD,144448
LATUR,104574
AURANGABAD,
73414
NANDED,151090
74% 59% 76%
68%
70%68%
70%
77%
PUNE, 238428
SATARA, 250249
SANGLI, 150872
SOLAPUR, 217806
KOLHAPUR, 287346
81%
75%
73%79%
74%
NASHIK, 138849
DHULE, 71819
NANDURBAR, 31972
JALGAON, 424192
AHMEDNAGAR
212778
69% 70%
74%
78% 72%
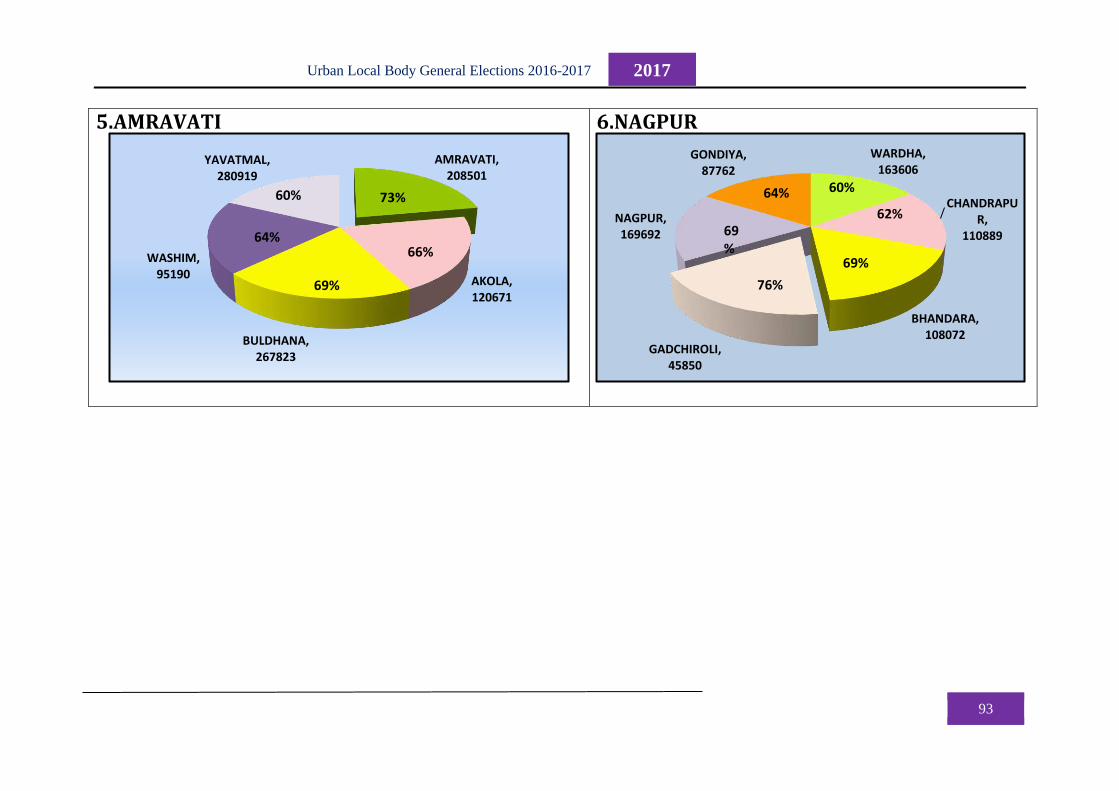
93
2017 Urban Local Body General Elections 2016-2017
5.AMRAVATI
6.NAGPUR
AMRAVATI,208501
AKOLA,120671
BULDHANA,267823
WASHIM,95190
YAVATMAL,280919
64%
69%
66%
60% 73%
WARDHA, 163606
CHANDRAPUR,
110889
BHANDARA, 108072
GADCHIROLI, 45850
NAGPUR, 169692
GONDIYA, 87762
69%
76%
69%
62%
60%64%
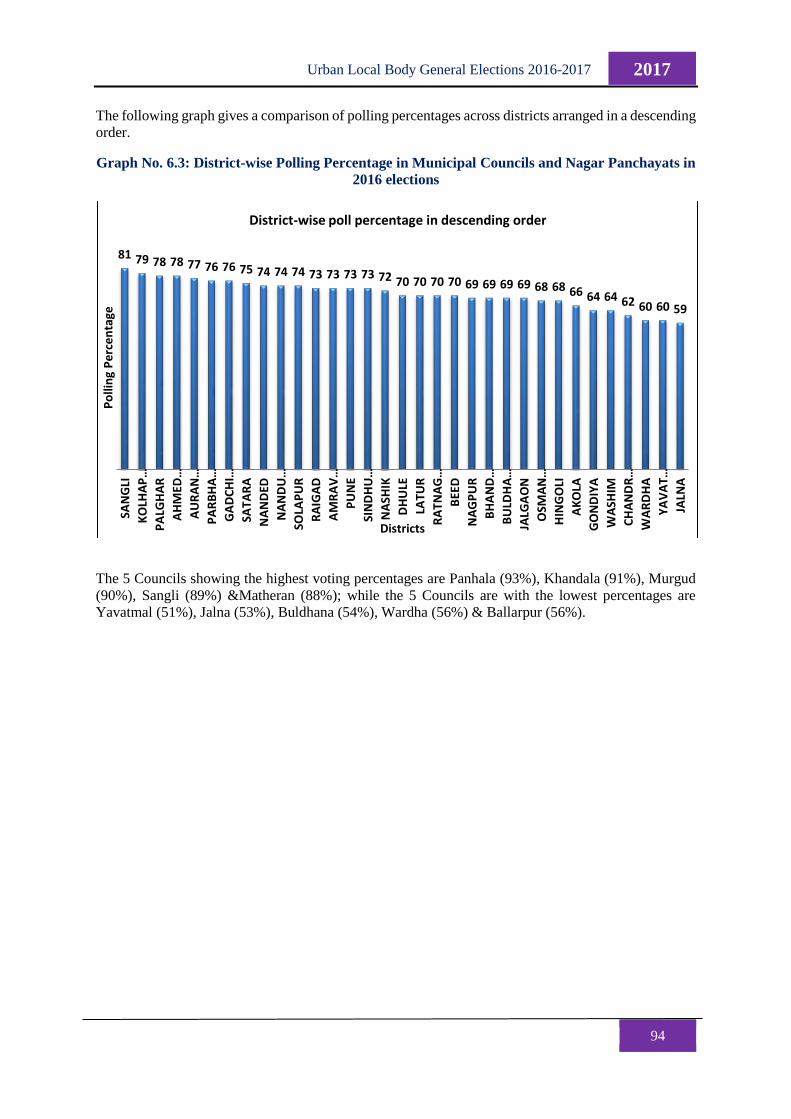
94
2017 Urban Local Body General Elections 2016-2017
The following graph gives a comparison of polling percentages across districts arranged in a descending
order.
Graph No. 6.3: District-wise Polling Percentage in Municipal Councils and Nagar Panchayats in
2016 elections
The 5 Councils showing the highest voting percentages are Panhala (93%), Khandala (91%), Murgud
(90%), Sangli (89%) &Matheran (88%); while the 5 Councils are with the lowest percentages are
Yavatmal (51%), Jalna (53%), Buldhana (54%), Wardha (56%) & Ballarpur (56%).
81 79 78 78 77 76 76 75 74 74 74 73 73 73 73 72 70 70 70 70 69 69 69 69 68 68 66 64 64 62 60 60 59
SAN
GLI
KOLH
AP…
PA
LGH
AR
AHMED
…
AURAN…
PARBHA…
GADCHI…
SATA
RA
NA
ND
ED
NANDU…
SOLA
PU
R
RA
IGA
D
AMRAV…
PU
NE
SINDHU…
NA
SHIK
DH
ULE
LATU
R
RATNAG…
BEE
D
NA
GP
UR
BHAND…
BULD
HA…
JALG
AO
N
OSM
AN…
HIN
GO
LI
AK
OLA
GO
ND
IYA
WA
SHIM
CHANDR…
WA
RD
HA
YAVAT…
JALN
A
Po
llin
g P
erc
en
tage
Districts
District-wise poll percentage in descending order
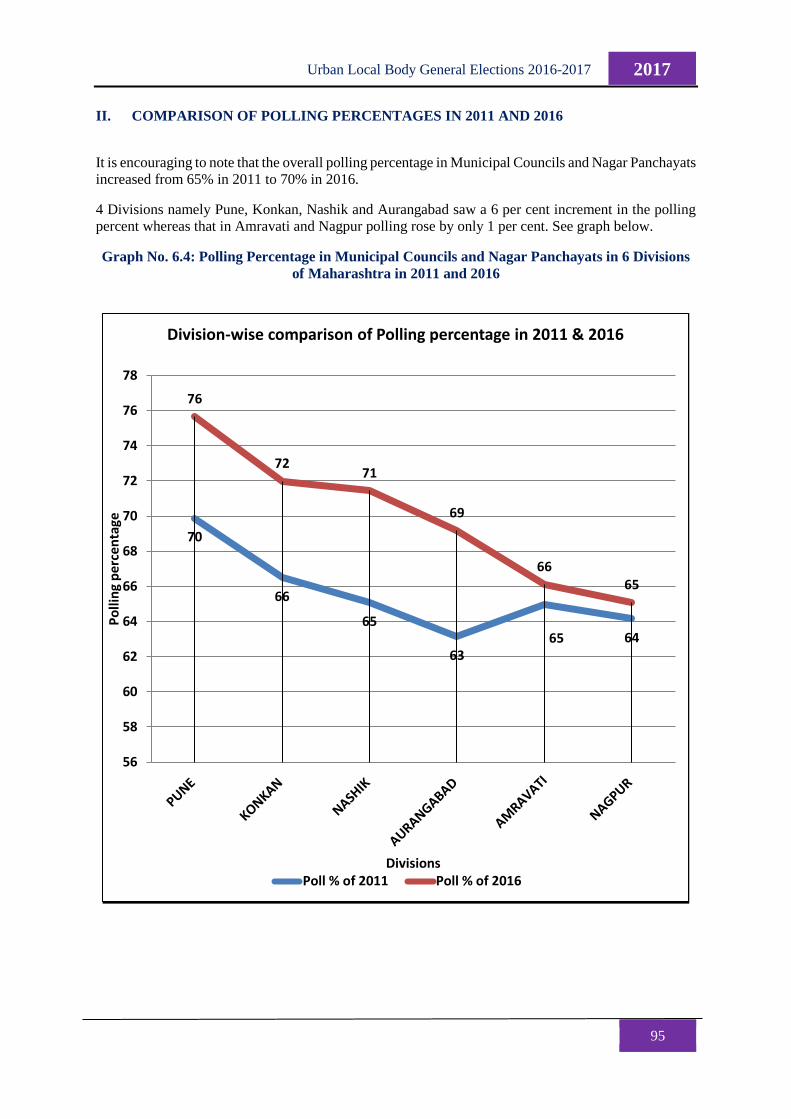
95
2017 Urban Local Body General Elections 2016-2017
II. COMPARISON OF POLLING PERCENTAGES IN 2011 AND 2016
It is encouraging to note that the overall polling percentage in Municipal Councils and Nagar Panchayats
increased from 65% in 2011 to 70% in 2016.
4 Divisions namely Pune, Konkan, Nashik and Aurangabad saw a 6 per cent increment in the polling
percent whereas that in Amravati and Nagpur polling rose by only 1 per cent. See graph below.
Graph No. 6.4: Polling Percentage in Municipal Councils and Nagar Panchayats in 6 Divisions
of Maharashtra in 2011 and 2016
70
66
65
6365 64
76
7271
69
6665
56
58
60
62
64
66
68
70
72
74
76
78
Po
llin
g p
erc
en
tage
Divisions
Division-wise comparison of Polling percentage in 2011 & 2016
Poll % of 2011 Poll % of 2016
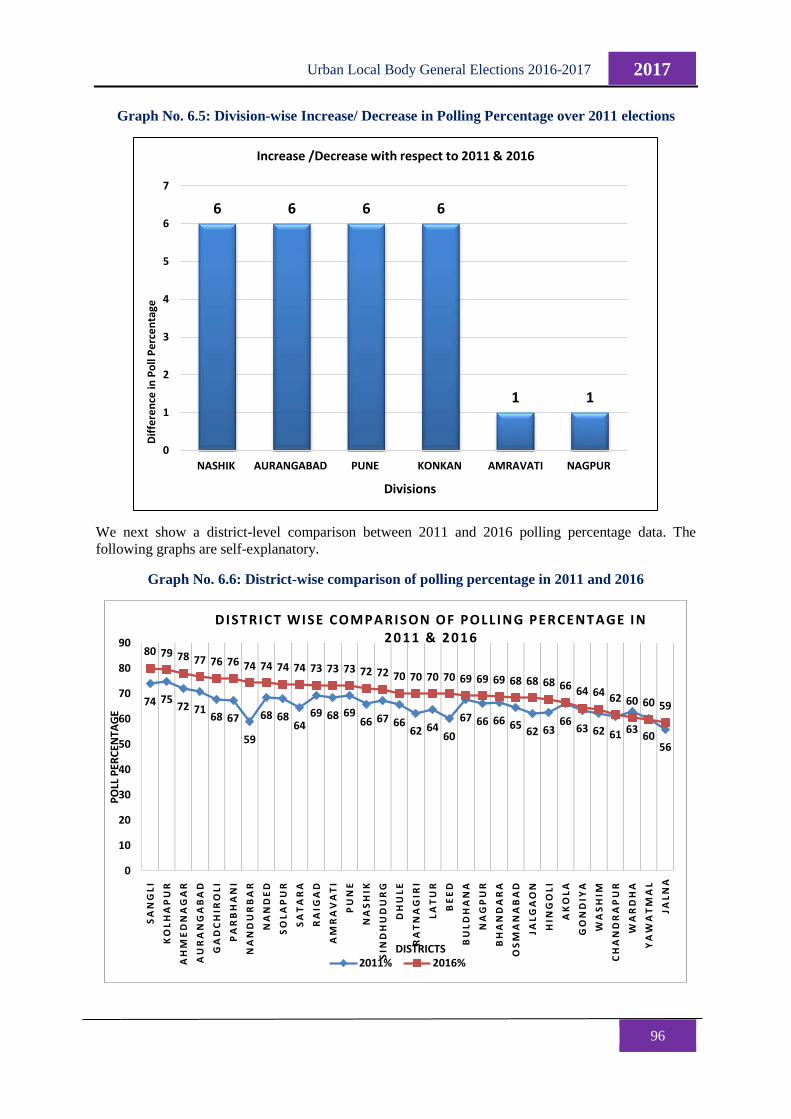
96
2017 Urban Local Body General Elections 2016-2017
Graph No. 6.5: Division-wise Increase/ Decrease in Polling Percentage over 2011 elections
We next show a district-level comparison between 2011 and 2016 polling percentage data. The
following graphs are self-explanatory.
Graph No. 6.6: District-wise comparison of polling percentage in 2011 and 2016
6 6 6 6
1 1
0
1
2
3
4
5
6
7
NASHIK AURANGABAD PUNE KONKAN AMRAVATI NAGPUR
Dif
fere
nce
in P
oll
Pe
rce
nta
ge
Divisions
Increase /Decrease with respect to 2011 & 2016
74 7572 71
68 67
59
68 6864
69 68 6966 67 66
62 6460
67 66 66 6562 63
6663 62 61 63
6056
80 79 78 77 76 76 74 74 74 74 73 73 73 72 72 70 70 70 70 69 69 69 68 68 68 66 64 64 62 60 60 59
0
10
20
30
40
50
60
70
80
90
SA
NG
LI
KO
LH
AP
UR
AH
ME
DN
AG
AR
AU
RA
NG
AB
AD
GA
DC
HIR
OL
I
PA
RB
HA
NI
NA
ND
UR
BA
R
NA
ND
ED
SO
LA
PU
R
SA
TA
RA
RA
IGA
D
AM
RA
VA
TI
PU
NE
NA
SH
IK
SIN
DH
UD
UR
G
DH
UL
E
RA
TN
AG
IRI
LA
TU
R
BE
ED
BU
LD
HA
NA
NA
GP
UR
BH
AN
DA
RA
OS
MA
NA
BA
D
JAL
GA
ON
HIN
GO
LI
AK
OL
A
GO
ND
IYA
WA
SH
IM
CH
AN
DR
AP
UR
WA
RD
HA
YA
WA
TM
AL
JAL
NA
PO
LL P
ERC
ENTA
GE
DISTRICTS
DISTRICT WISE COMPARISON OF POLL ING PERCENTAGE IN 2011 & 2016
2011% 2016%
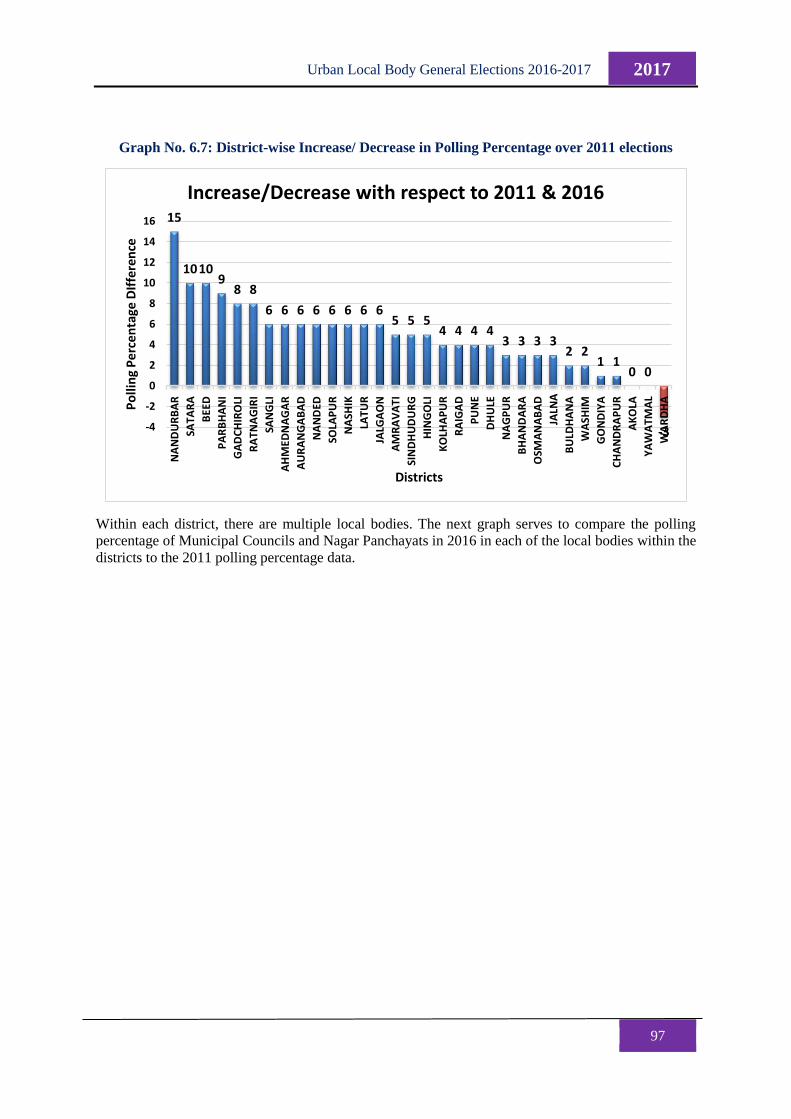
97
2017 Urban Local Body General Elections 2016-2017
Graph No. 6.7: District-wise Increase/ Decrease in Polling Percentage over 2011 elections
Within each district, there are multiple local bodies. The next graph serves to compare the polling
percentage of Municipal Councils and Nagar Panchayats in 2016 in each of the local bodies within the
districts to the 2011 polling percentage data.
15
10109
8 8
6 6 6 6 6 6 6 65 5 5
4 4 4 43 3 3 3
2 21 1
0 0
-3-4
-2
0
2
4
6
8
10
12
14
16
NA
ND
UR
BA
R
SATA
RA
BEE
D
PA
RB
HA
NI
GA
DC
HIR
OLI
RA
TNA
GIR
I
SAN
GLI
AH
MED
NA
GA
R
AU
RA
NG
AB
AD
NA
ND
ED
SOLA
PU
R
NA
SHIK
LATU
R
JALG
AO
N
AM
RA
VA
TI
SIN
DH
UD
UR
G
HIN
GO
LI
KO
LHA
PU
R
RA
IGA
D
PU
NE
DH
ULE
NA
GP
UR
BH
AN
DA
RA
OSM
AN
AB
AD
JALN
A
BU
LDH
AN
A
WA
SHIM
GO
ND
IYA
CH
AN
DR
AP
UR
AK
OLA
YA
WA
TMA
L
WA
RD
HAPo
llin
g P
erc
en
tage
DIf
fere
nce
Districts
Increase/Decrease with respect to 2011 & 2016
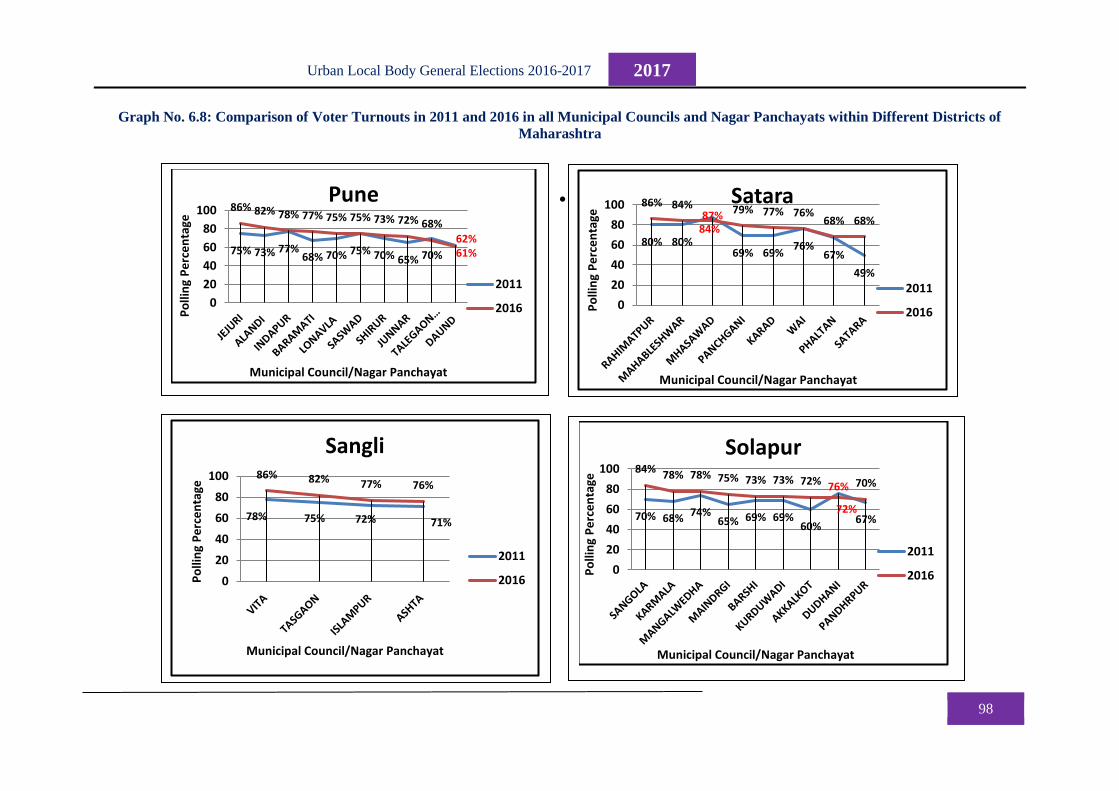
98
2017 Urban Local Body General Elections 2016-2017
Graph No. 6.8: Comparison of Voter Turnouts in 2011 and 2016 in all Municipal Councils and Nagar Panchayats within Different Districts of
Maharashtra
75% 73% 77%68% 70% 75% 70% 65% 70%
62%
86% 82% 78% 77% 75% 75% 73% 72% 68%
61%
0
20
40
60
80
100
Po
llin
g P
erc
en
tage
Municipal Council/Nagar Panchayat
Pune
2011
2016
80% 80%
87%
69% 69%76%
67%
49%
86% 84%
84%
79% 77% 76%68% 68%
0
20
40
60
80
100
Po
llin
g P
erc
en
tage
Municipal Council/Nagar Panchayat
Satara
2011
2016
78% 75% 72% 71%
86% 82% 77% 76%
0
20
40
60
80
100
Po
llin
g P
erc
en
tage
Municipal Council/Nagar Panchayat
Sangli
2011
2016
70% 68%74%
65% 69% 69%60%
76%
67%
84%78% 78% 75% 73% 73% 72%
72%
70%
0
20
40
60
80
100
Po
llin
g P
erc
en
tage
Municipal Council/Nagar Panchayat
Solapur
2011
2016
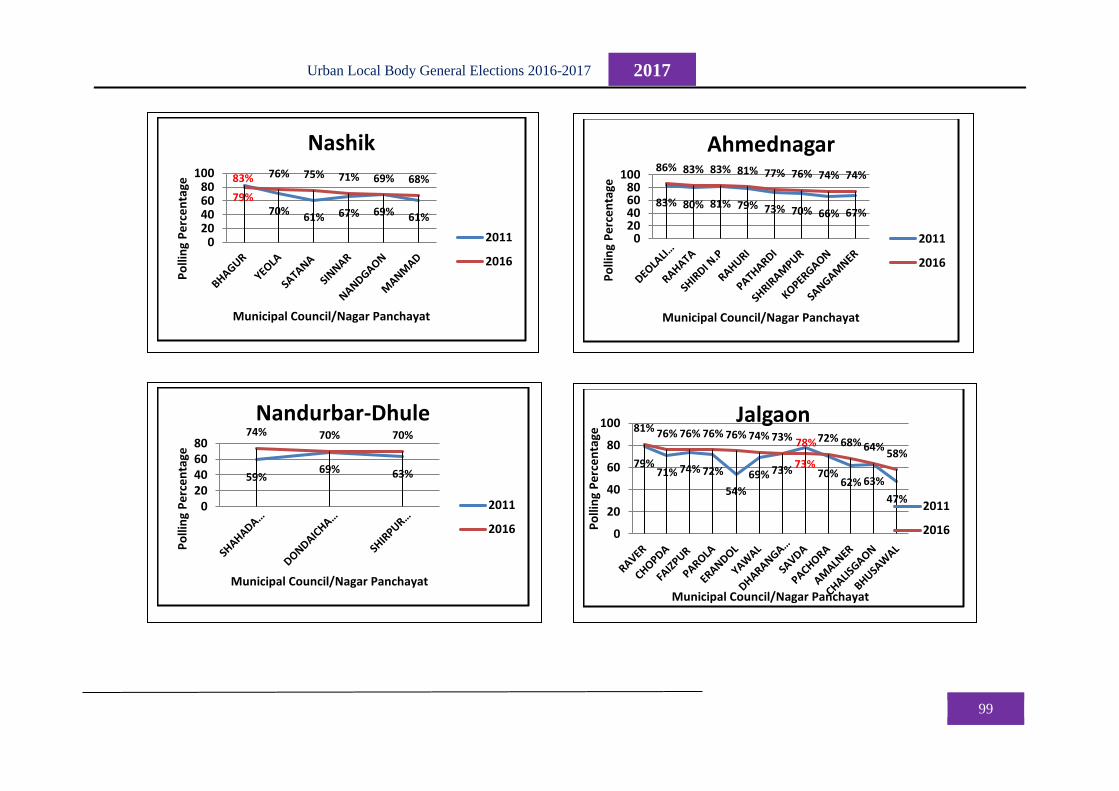
99
2017 Urban Local Body General Elections 2016-2017
83%
70%61% 67% 69% 61%
79%
76% 75% 71% 69% 68%
020406080
100P
olli
ng
Pe
rce
nta
ge
Municipal Council/Nagar Panchayat
Nashik
2011
2016
83% 80% 81% 79% 73% 70% 66% 67%
86% 83% 83% 81% 77% 76% 74% 74%
020406080
100
Po
llin
g P
erc
en
tage
Municipal Council/Nagar Panchayat
Ahmednagar
2011
2016
59%69% 63%
74% 70% 70%
020406080
Po
llin
g P
erc
en
tage
Municipal Council/Nagar Panchayat
Nandurbar-Dhule
2011
2016
79%71% 74% 72%
54%
69% 73%
78%
70%62% 63%
47%
81% 76% 76% 76% 76% 74% 73%
73%
72% 68% 64%58%
0
20
40
60
80
100
Po
llin
g P
erc
en
tage
Municipal Council/Nagar Panchayat
Jalgaon
2011
2016
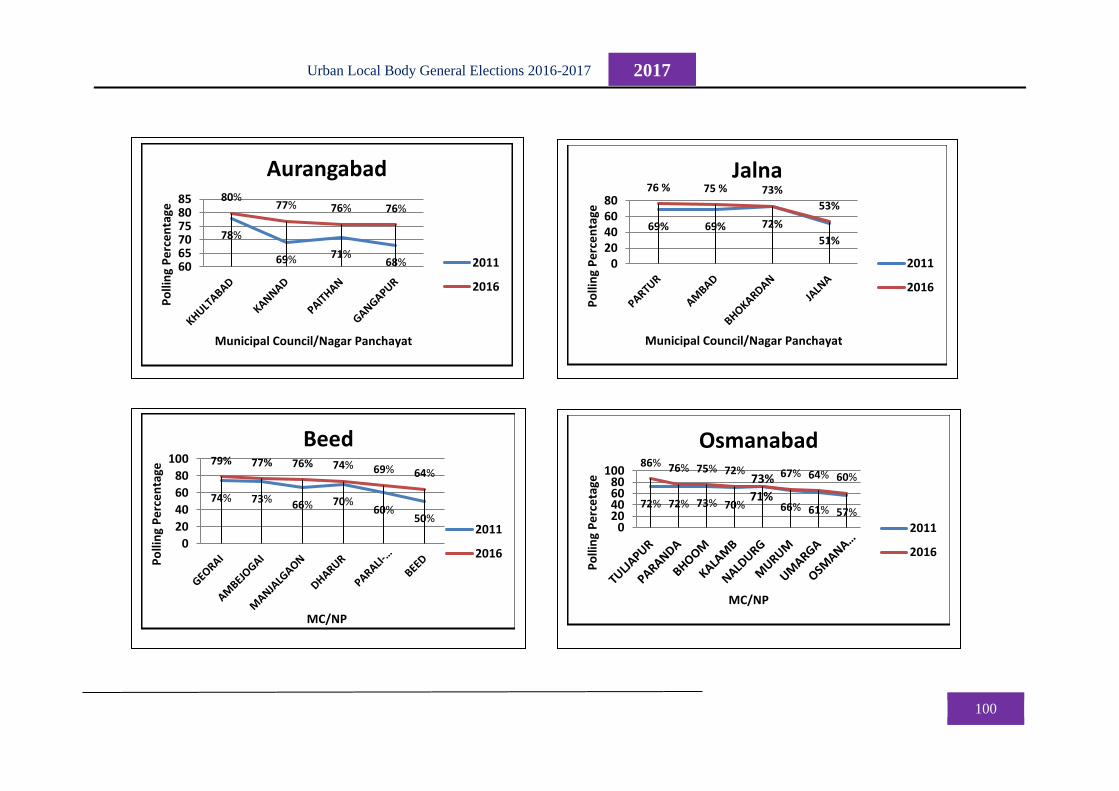
100
2017 Urban Local Body General Elections 2016-2017
78%
69% 71%68%
80%77% 76% 76%
606570758085
Po
llin
g P
erc
en
tage
Municipal Council/Nagar Panchayat
Aurangabad
2011
2016
69% 69% 72%
51%
76 % 75 % 73%
53%
020406080
Po
llin
g P
erc
en
tage
Municipal Council/Nagar Panchayat
Jalna
2011
2016
74% 73% 66% 70%60%
50%
79% 77% 76% 74% 69% 64%
0
20
40
60
80
100
Po
llin
g P
erc
en
tage
MC/NP
Beed
2011
2016
72% 72% 73% 70%
73%
66% 61% 57%
86% 76% 75% 72%
71%
67% 64% 60%
020406080
100
Po
llin
g P
erc
eta
geMC/NP
Osmanabad
2011
2016
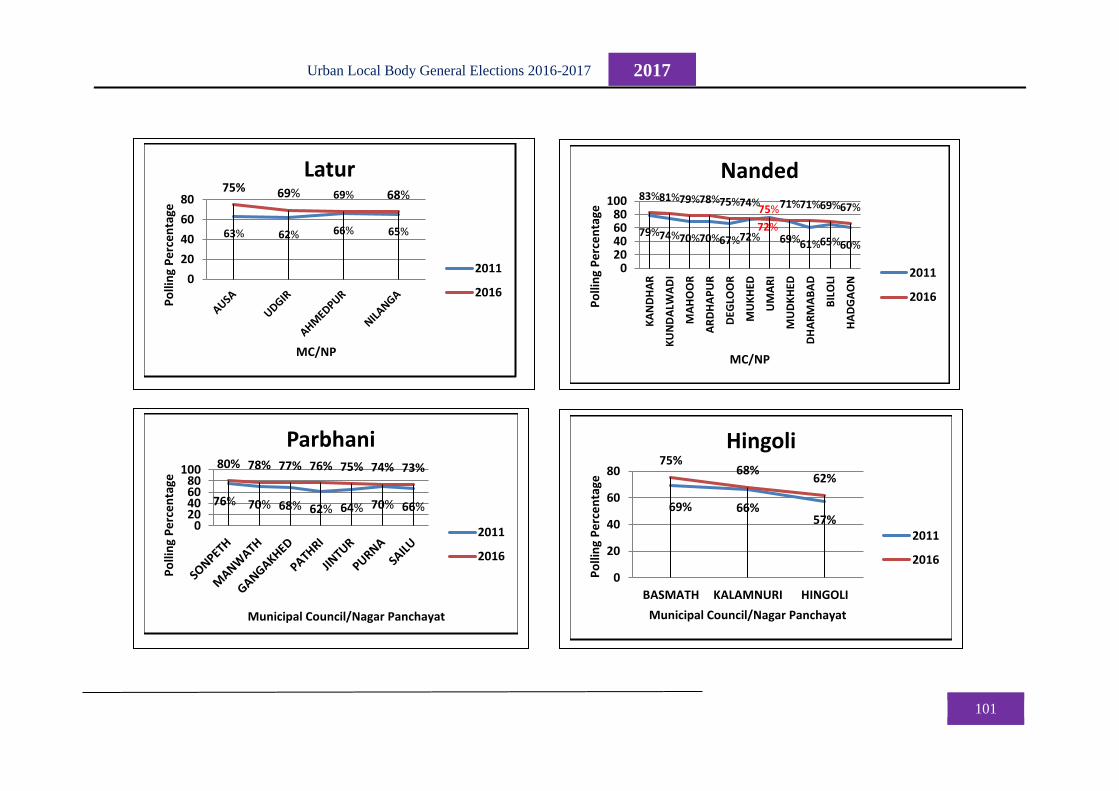
101
2017 Urban Local Body General Elections 2016-2017
63% 62% 66% 65%
75% 69% 69% 68%
0
20
40
60
80
Po
llin
g P
erc
en
tage
MC/NP
Latur
2011
2016
79%74%70%70%67%72%
75%
69%61%65%60%
83%81%79%78%75%74%
72%
71%71%69%67%
020406080
100
KA
ND
HA
R
KU
ND
ALW
AD
I
MA
HO
OR
AR
DH
AP
UR
DEG
LOO
R
MU
KH
ED
UM
AR
I
MU
DK
HED
DH
AR
MA
BA
D
BIL
OLI
HA
DG
AO
N
Po
llin
g P
erc
en
tage
MC/NP
Nanded
2011
2016
76% 70% 68% 62% 64% 70% 66%
80% 78% 77% 76% 75% 74% 73%
020406080
100
Po
llin
g P
erc
en
tage
Municipal Council/Nagar Panchayat
Parbhani
2011
2016
69% 66%57%
75%68%
62%
0
20
40
60
80
BASMATH KALAMNURI HINGOLIP
olli
ng
Pe
rce
nta
ge
Municipal Council/Nagar Panchayat
Hingoli
2011
2016
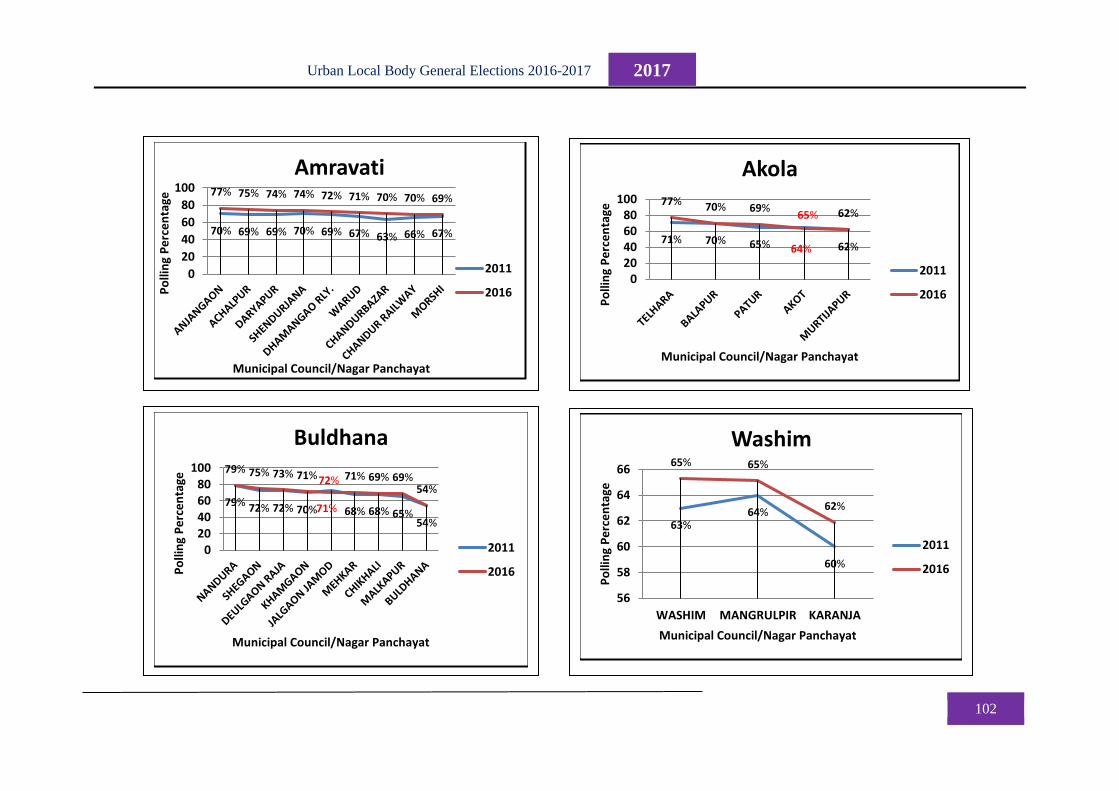
102
2017 Urban Local Body General Elections 2016-2017
70% 69% 69% 70% 69% 67% 63% 66% 67%
77% 75% 74% 74% 72% 71% 70% 70% 69%
0
20
40
60
80
100
Po
llin
g P
erc
en
tage
Municipal Council/Nagar Panchayat
Amravati
2011
2016
71% 70% 65%
65%
62%
77% 70% 69%
64%
62%
020406080
100
Po
llin
g P
erc
en
tage
Municipal Council/Nagar Panchayat
Akola
2011
2016
79% 72% 72% 70%
72%
68% 68% 65%54%
79% 75% 73% 71%
71%
71% 69% 69%54%
020406080
100
Po
llin
g P
erc
en
tage
Municipal Council/Nagar Panchayat
Buldhana
2011
2016
63%64%
60%
65% 65%
62%
56
58
60
62
64
66
WASHIM MANGRULPIR KARANJAP
olli
ng
Pe
rce
nta
ge
Municipal Council/Nagar Panchayat
Washim
2011
2016
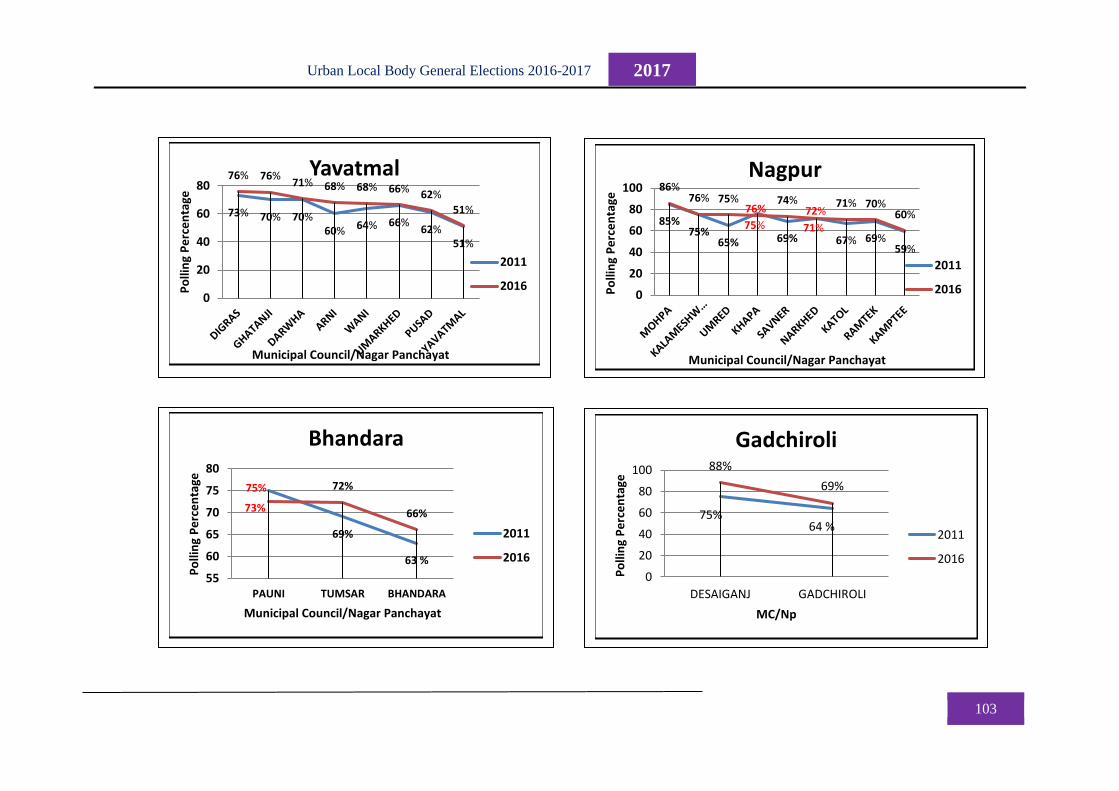
103
2017 Urban Local Body General Elections 2016-2017
73% 70% 70%60% 64% 66%
62%51%
76% 76%71% 68% 68% 66% 62%
51%
0
20
40
60
80P
olli
ng
Pe
rce
nta
ge
Municipal Council/Nagar Panchayat
Yavatmal
2011
2016
85%75%
65%
76%
69%
72%
67% 69%59%
86%76% 75%
75%
74%
71%
71% 70%60%
0
20
40
60
80
100
Po
llin
g P
erc
en
tage
Municipal Council/Nagar Panchayat
Nagpur
2011
2016
75%
69%
63 %
73%
72%
66%
55
60
65
70
75
80
PAUNI TUMSAR BHANDARA
Po
llin
g P
erc
en
tage
Municipal Council/Nagar Panchayat
Bhandara
2011
2016
75%64 %
88%
69%
0
20
40
60
80
100
DESAIGANJ GADCHIROLI
Po
llin
g P
erc
en
tage
MC/Np
Gadchiroli
2011
2016
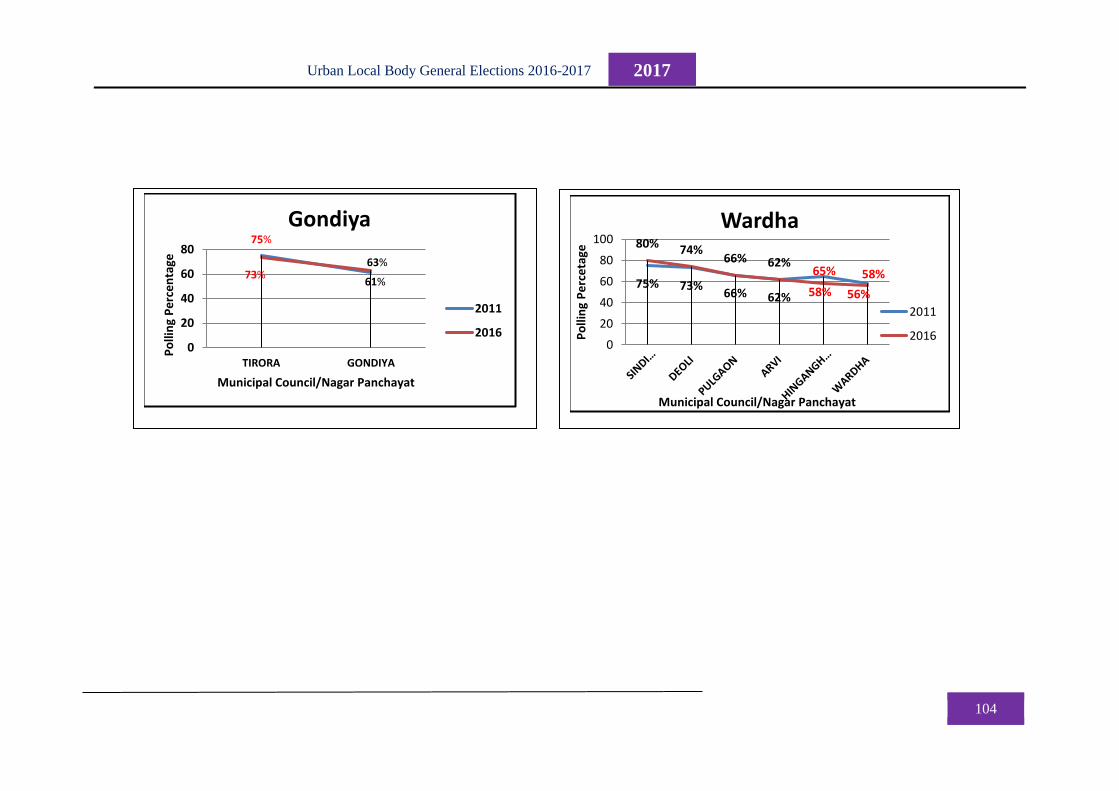
104
2017 Urban Local Body General Elections 2016-2017
75%
61%73%
63%
0
20
40
60
80
TIRORA GONDIYA
Po
llin
g P
erc
en
tage
Municipal Council/Nagar Panchayat
Gondiya
2011
2016
75% 73%66% 62%
65% 58%
80% 74%66% 62%
58% 56%
0
20
40
60
80
100
Po
llin
g P
erc
eta
ge
Municipal Council/Nagar Panchayat
Wardha
2011
2016
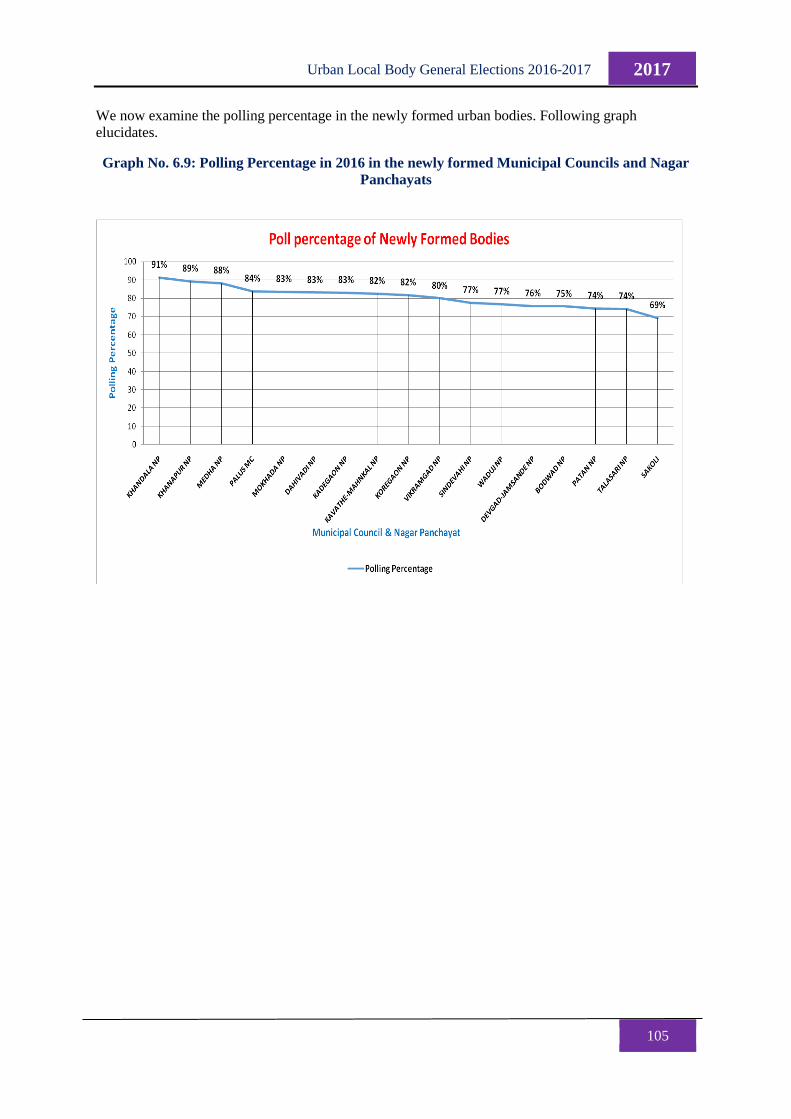
105
2017 Urban Local Body General Elections 2016-2017
We now examine the polling percentage in the newly formed urban bodies. Following graph
elucidates.
Graph No. 6.9: Polling Percentage in 2016 in the newly formed Municipal Councils and Nagar
Panchayats
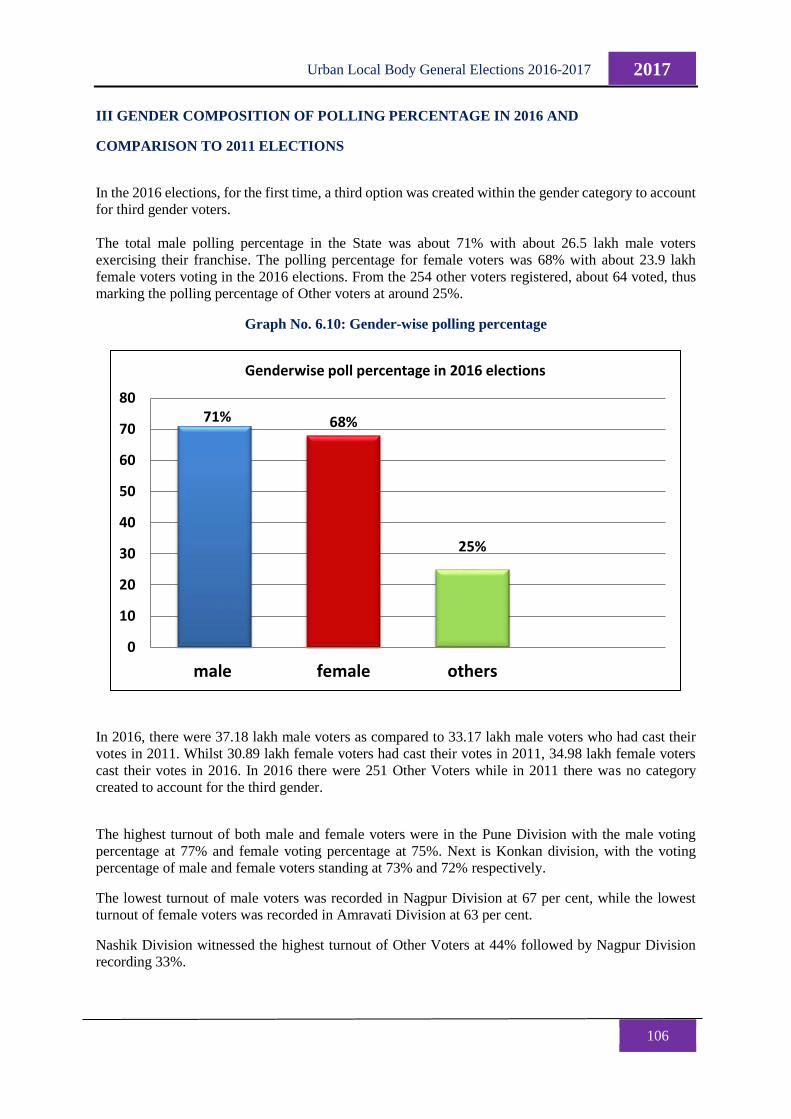
106
2017 Urban Local Body General Elections 2016-2017
III GENDER COMPOSITION OF POLLING PERCENTAGE IN 2016 AND
COMPARISON TO 2011 ELECTIONS
In the 2016 elections, for the first time, a third option was created within the gender category to account
for third gender voters.
The total male polling percentage in the State was about 71% with about 26.5 lakh male voters
exercising their franchise. The polling percentage for female voters was 68% with about 23.9 lakh
female voters voting in the 2016 elections. From the 254 other voters registered, about 64 voted, thus
marking the polling percentage of Other voters at around 25%.
Graph No. 6.10: Gender-wise polling percentage
In 2016, there were 37.18 lakh male voters as compared to 33.17 lakh male voters who had cast their
votes in 2011. Whilst 30.89 lakh female voters had cast their votes in 2011, 34.98 lakh female voters
cast their votes in 2016. In 2016 there were 251 Other Voters while in 2011 there was no category
created to account for the third gender.
The highest turnout of both male and female voters were in the Pune Division with the male voting
percentage at 77% and female voting percentage at 75%. Next is Konkan division, with the voting
percentage of male and female voters standing at 73% and 72% respectively.
The lowest turnout of male voters was recorded in Nagpur Division at 67 per cent, while the lowest
turnout of female voters was recorded in Amravati Division at 63 per cent.
Nashik Division witnessed the highest turnout of Other Voters at 44% followed by Nagpur Division
recording 33%.
71% 68%
25%
0
10
20
30
40
50
60
70
80
male female others
Genderwise poll percentage in 2016 elections
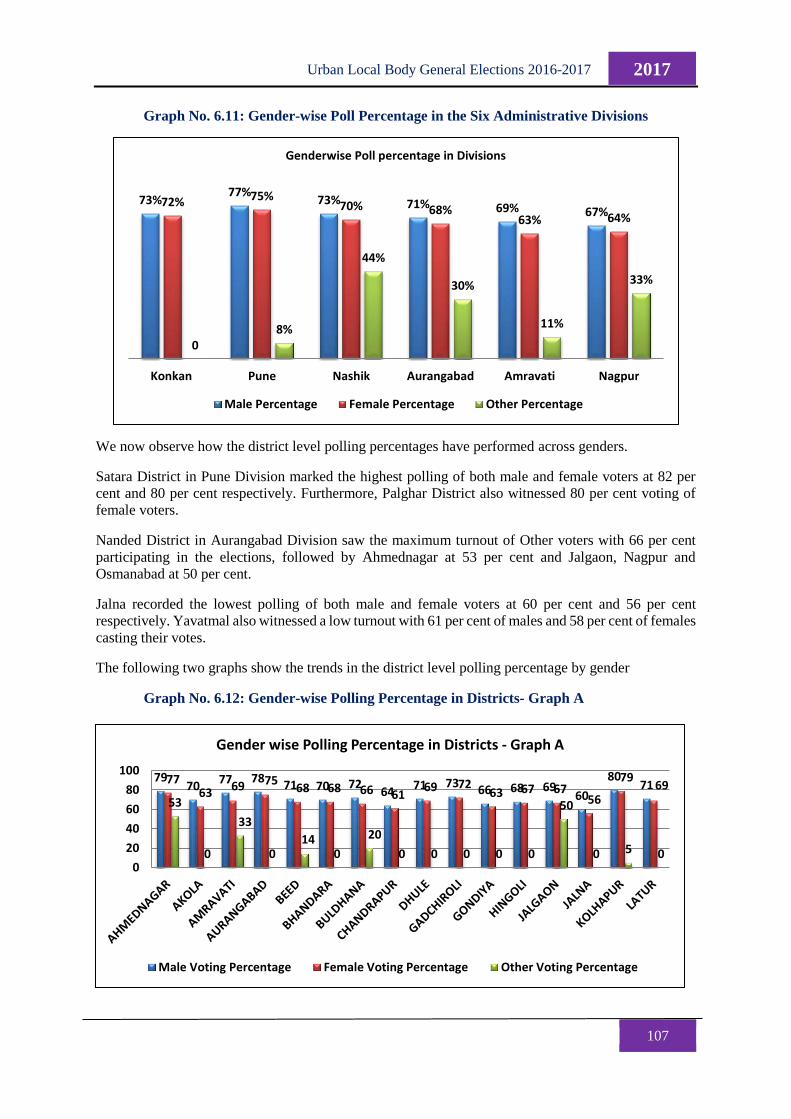
107
2017 Urban Local Body General Elections 2016-2017
Graph No. 6.11: Gender-wise Poll Percentage in the Six Administrative Divisions
We now observe how the district level polling percentages have performed across genders.
Satara District in Pune Division marked the highest polling of both male and female voters at 82 per
cent and 80 per cent respectively. Furthermore, Palghar District also witnessed 80 per cent voting of
female voters.
Nanded District in Aurangabad Division saw the maximum turnout of Other voters with 66 per cent
participating in the elections, followed by Ahmednagar at 53 per cent and Jalgaon, Nagpur and
Osmanabad at 50 per cent.
Jalna recorded the lowest polling of both male and female voters at 60 per cent and 56 per cent
respectively. Yavatmal also witnessed a low turnout with 61 per cent of males and 58 per cent of females
casting their votes.
The following two graphs show the trends in the district level polling percentage by gender
Graph No. 6.12: Gender-wise Polling Percentage in Districts- Graph A
73%77%
73% 71% 69% 67%72% 75%
70% 68%63% 64%
08%
44%
30%
11%
33%
Konkan Pune Nashik Aurangabad Amravati Nagpur
Genderwise Poll percentage in Divisions
Male Percentage Female Percentage Other Percentage
7970
77 7871 70 72
6471 73
66 68 6960
807177
6369 75
68 68 66 6169 72
63 67 6756
7969
53
0
33
014
0
20
0 0 0 0 0
50
0 5 00
20
40
60
80
100
Gender wise Polling Percentage in Districts - Graph A
Male Voting Percentage Female Voting Percentage Other Voting Percentage
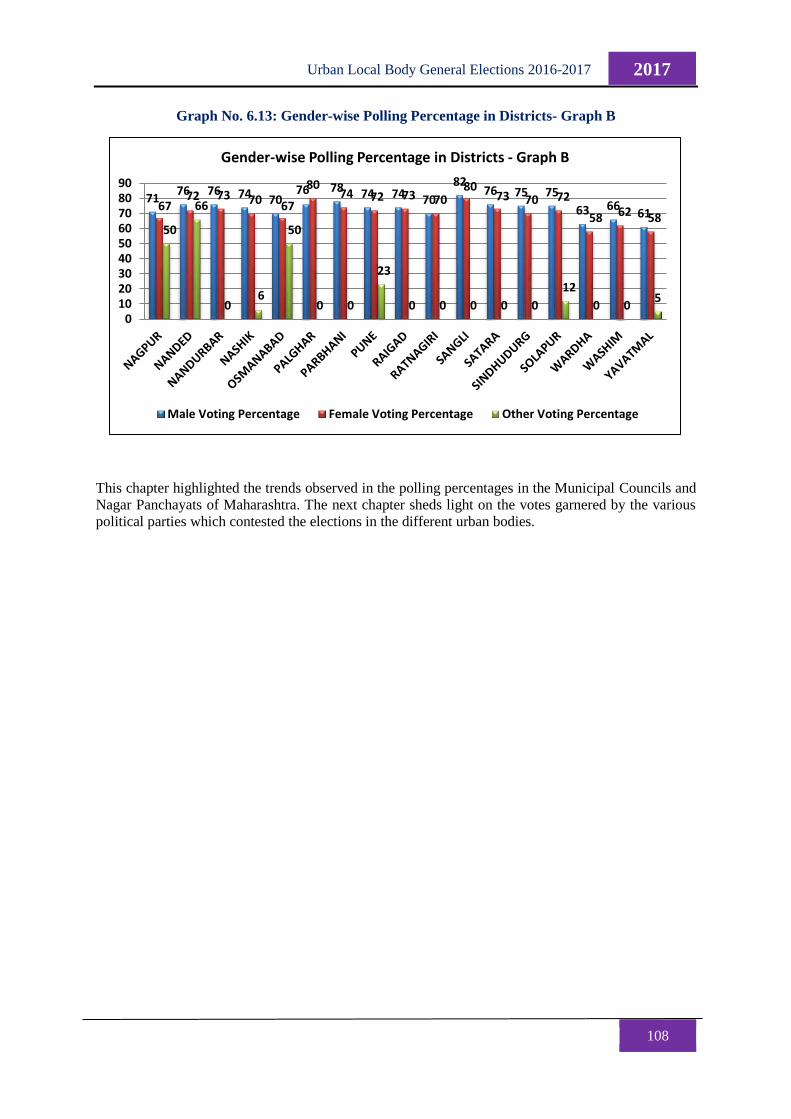
108
2017 Urban Local Body General Elections 2016-2017
Graph No. 6.13: Gender-wise Polling Percentage in Districts- Graph B
This chapter highlighted the trends observed in the polling percentages in the Municipal Councils and
Nagar Panchayats of Maharashtra. The next chapter sheds light on the votes garnered by the various
political parties which contested the elections in the different urban bodies.
7176 76 74 70
76 78 74 74 70
8276 75 75
63 6661
6772 73 70 67
8074 72 73 70
8073 70 72
58 62 5850
66
06
50
0 0
23
0 0 0 0 0
12
0 05
0102030405060708090
Gender-wise Polling Percentage in Districts - Graph B
Male Voting Percentage Female Voting Percentage Other Voting Percentage
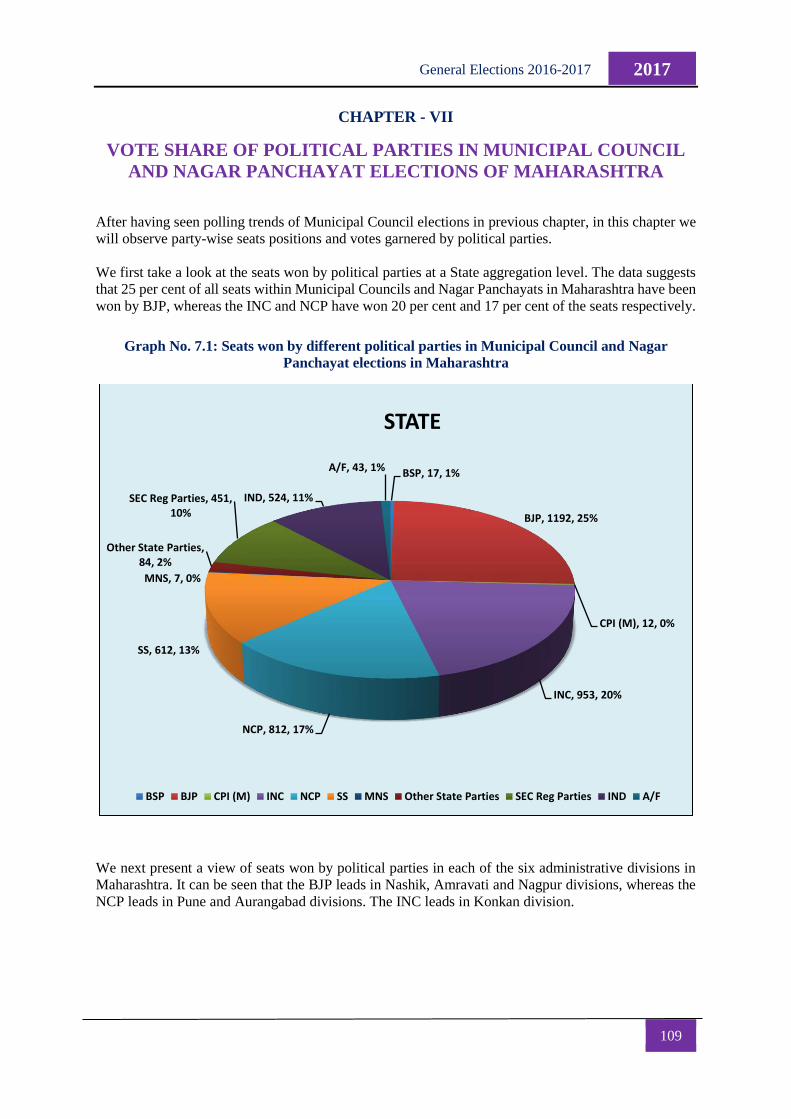
109
2017 General Elections 2016-2017
CHAPTER - VII
VOTE SHARE OF POLITICAL PARTIES IN MUNICIPAL COUNCIL
AND NAGAR PANCHAYAT ELECTIONS OF MAHARASHTRA
After having seen polling trends of Municipal Council elections in previous chapter, in this chapter we
will observe party-wise seats positions and votes garnered by political parties.
We first take a look at the seats won by political parties at a State aggregation level. The data suggests
that 25 per cent of all seats within Municipal Councils and Nagar Panchayats in Maharashtra have been
won by BJP, whereas the INC and NCP have won 20 per cent and 17 per cent of the seats respectively.
Graph No. 7.1: Seats won by different political parties in Municipal Council and Nagar
Panchayat elections in Maharashtra
We next present a view of seats won by political parties in each of the six administrative divisions in
Maharashtra. It can be seen that the BJP leads in Nashik, Amravati and Nagpur divisions, whereas the
NCP leads in Pune and Aurangabad divisions. The INC leads in Konkan division.
BSP, 17, 1%
BJP, 1192, 25%
CPI (M), 12, 0%
INC, 953, 20%
NCP, 812, 17%
SS, 612, 13%
MNS, 7, 0%
Other State Parties, 84, 2%
SEC Reg Parties, 451, 10%
IND, 524, 11%
A/F, 43, 1%
STATE
BSP BJP CPI (M) INC NCP SS MNS Other State Parties SEC Reg Parties IND A/F
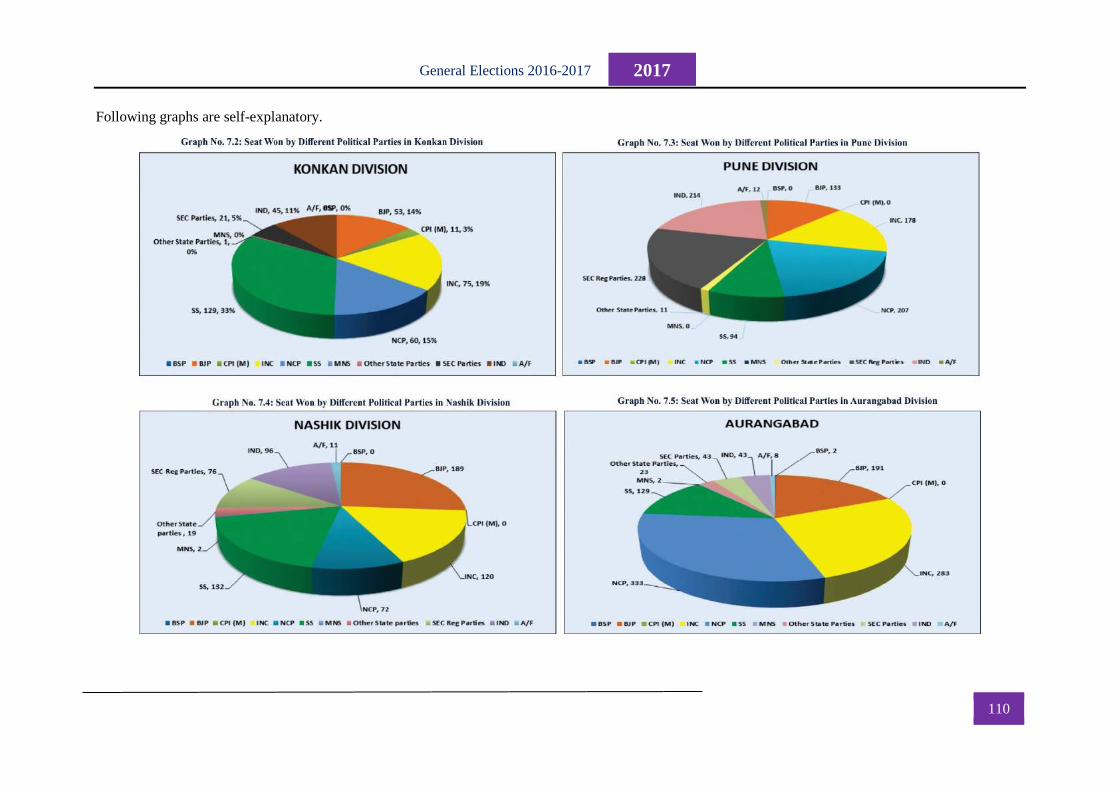
110
2017 General Elections 2016-2017
Following graphs are self-explanatory.
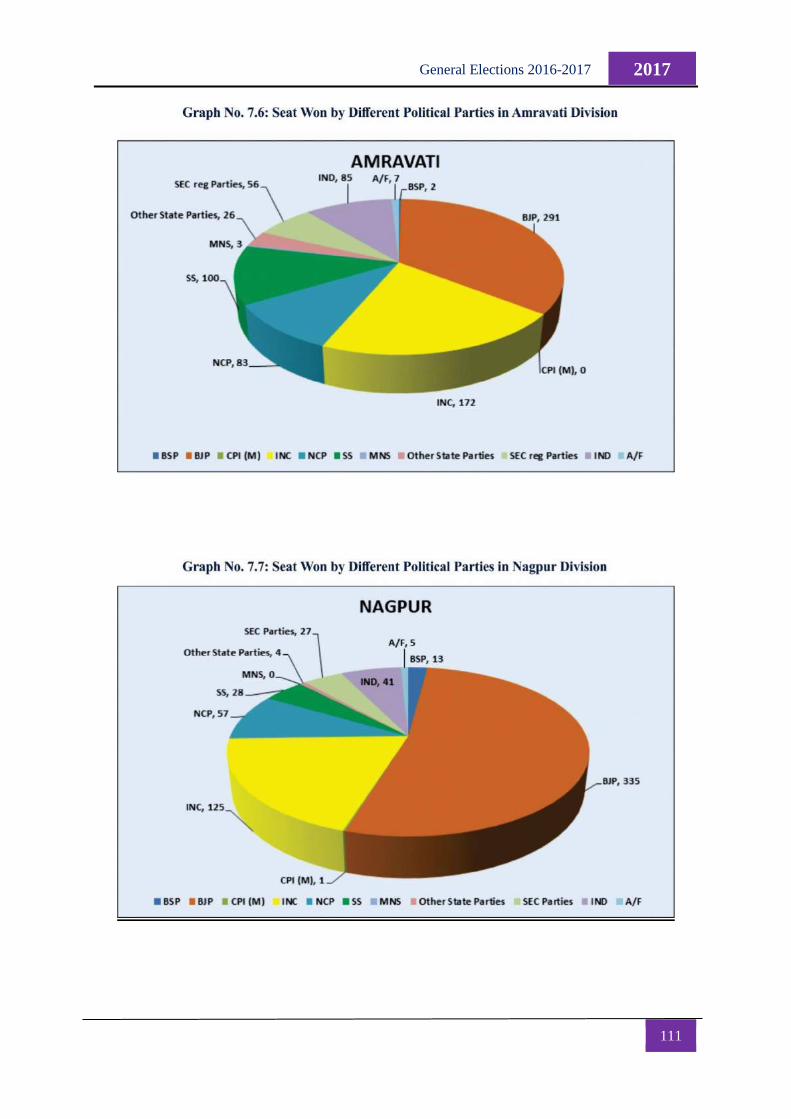
111
2017 General Elections 2016-2017
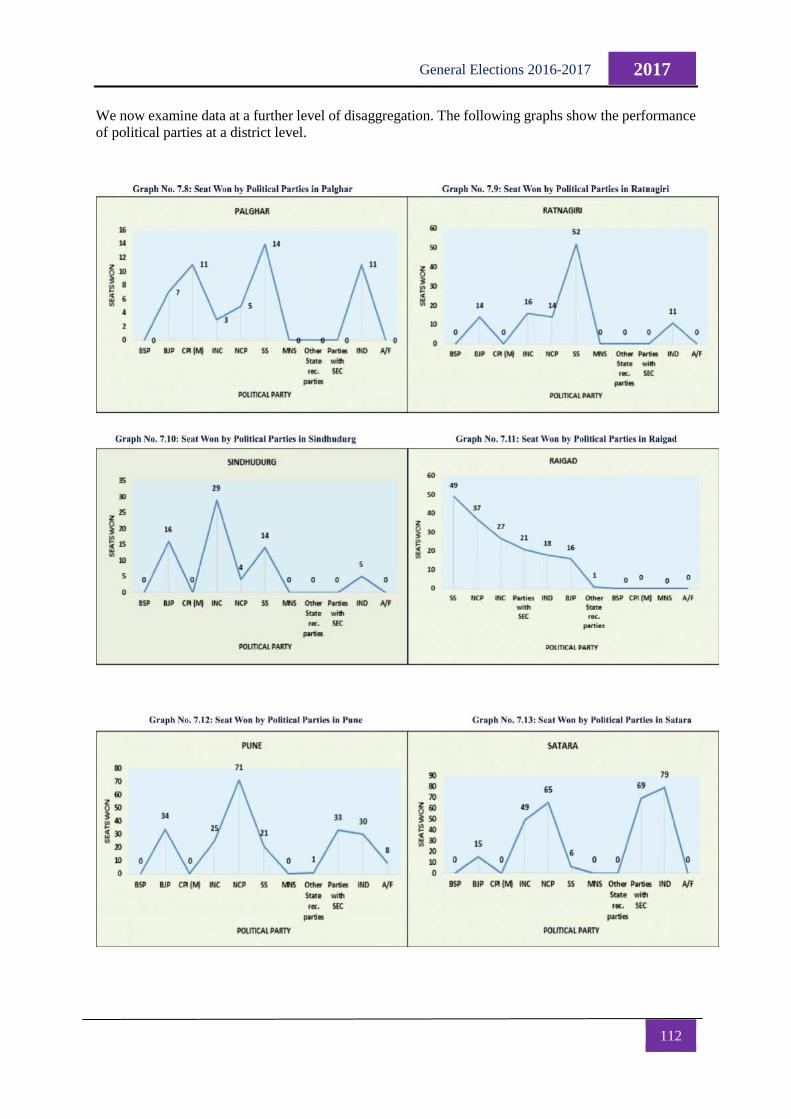
112
2017 General Elections 2016-2017
We now examine data at a further level of disaggregation. The following graphs show the performance
of political parties at a district level.
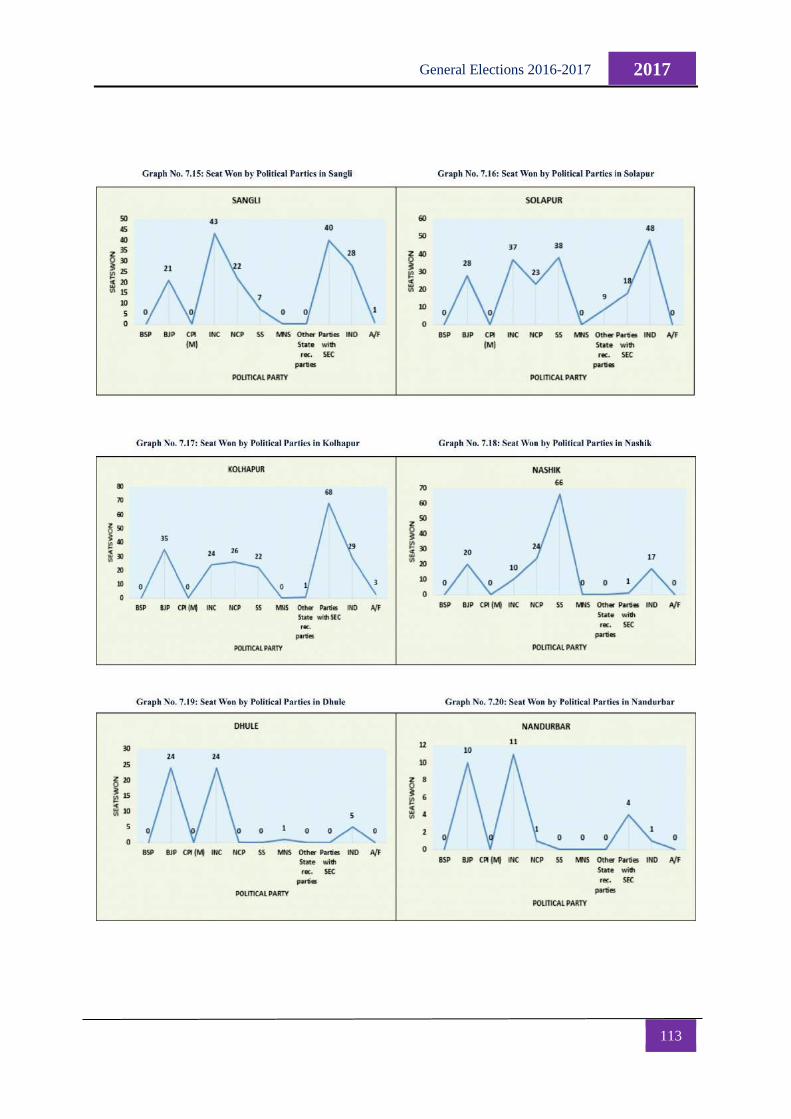
113
2017 General Elections 2016-2017
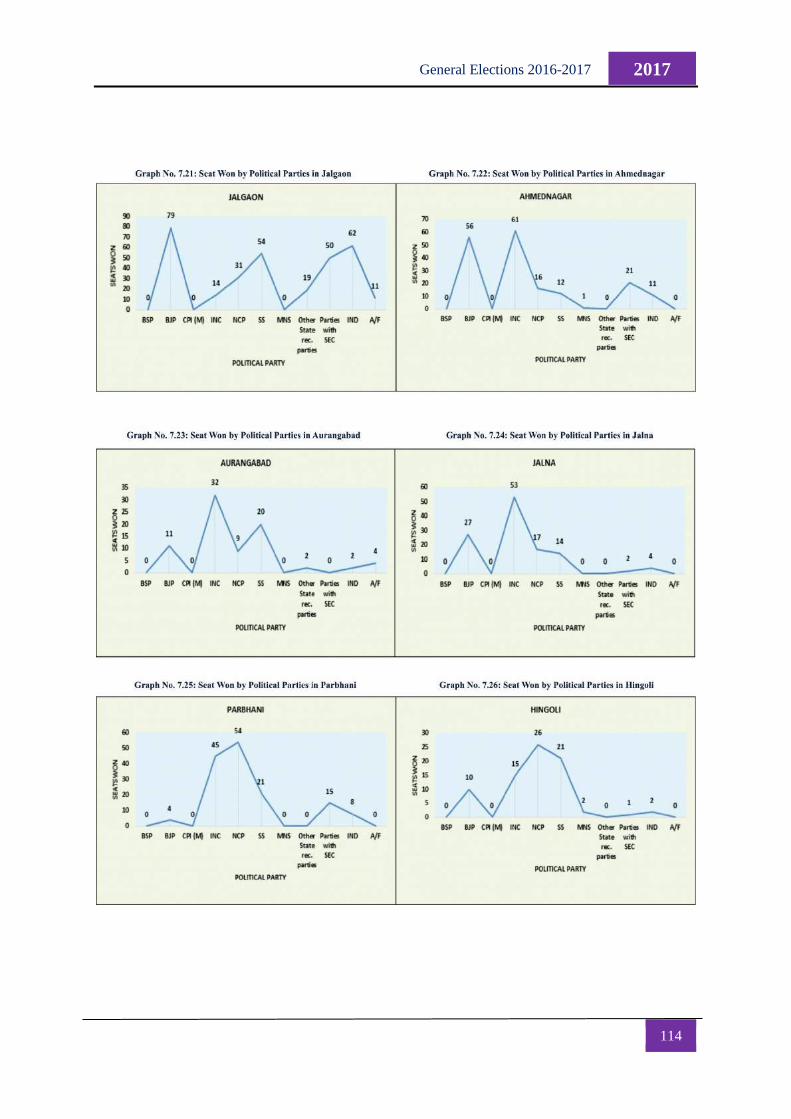
114
2017 General Elections 2016-2017
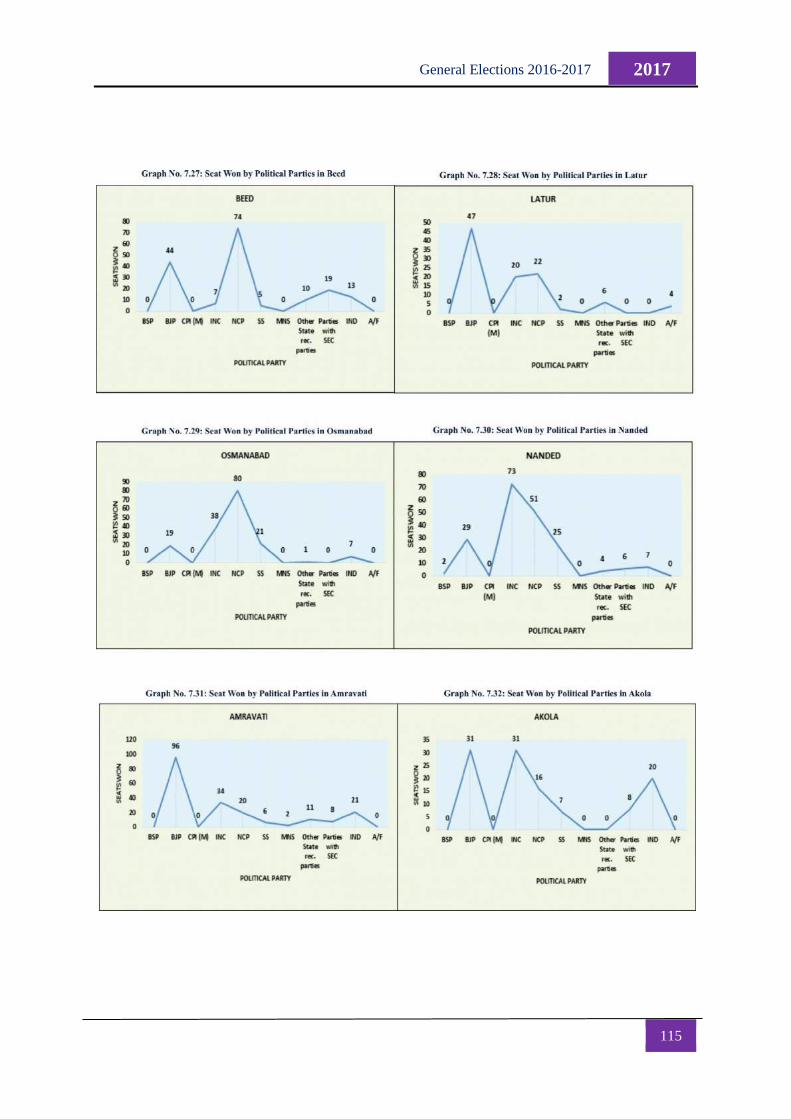
115
2017 General Elections 2016-2017
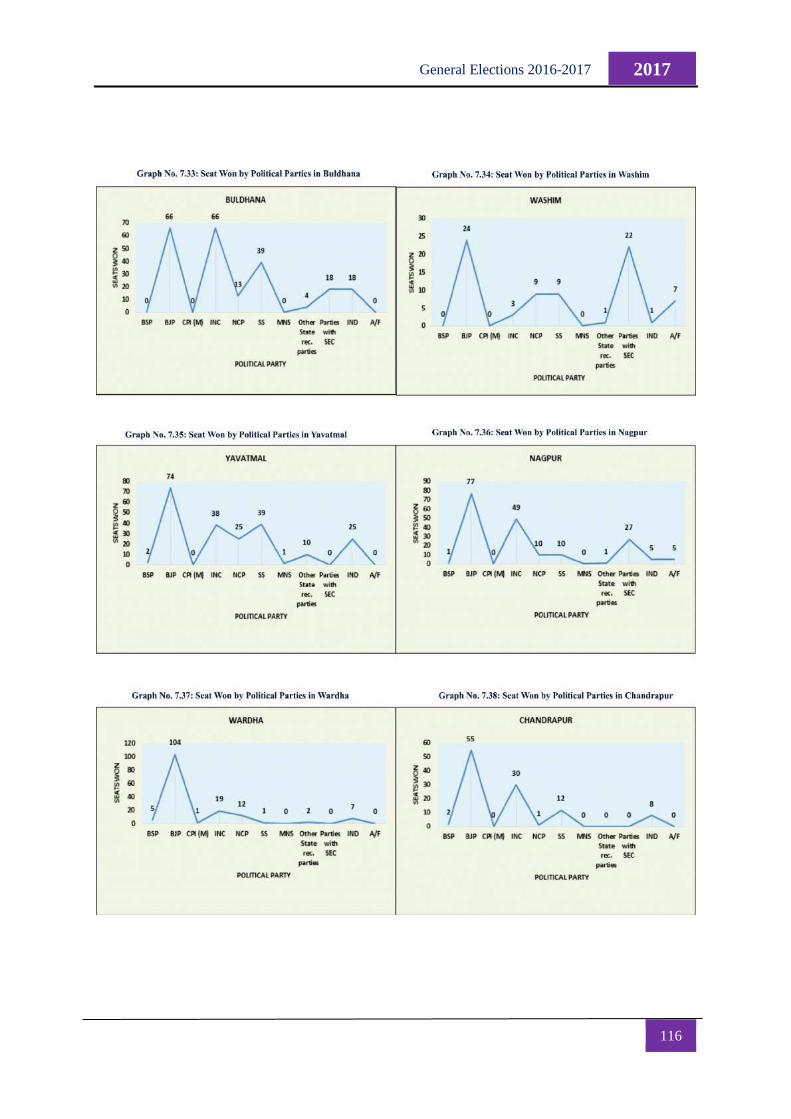
116
2017 General Elections 2016-2017
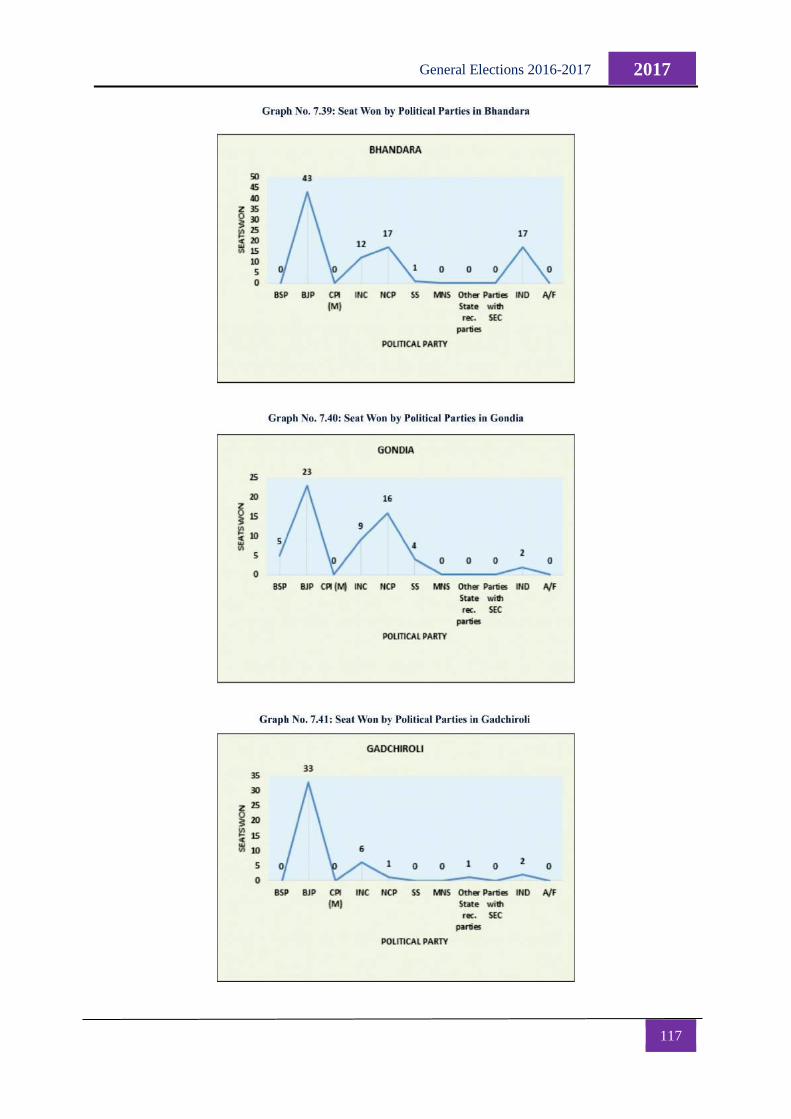
117
2017 General Elections 2016-2017
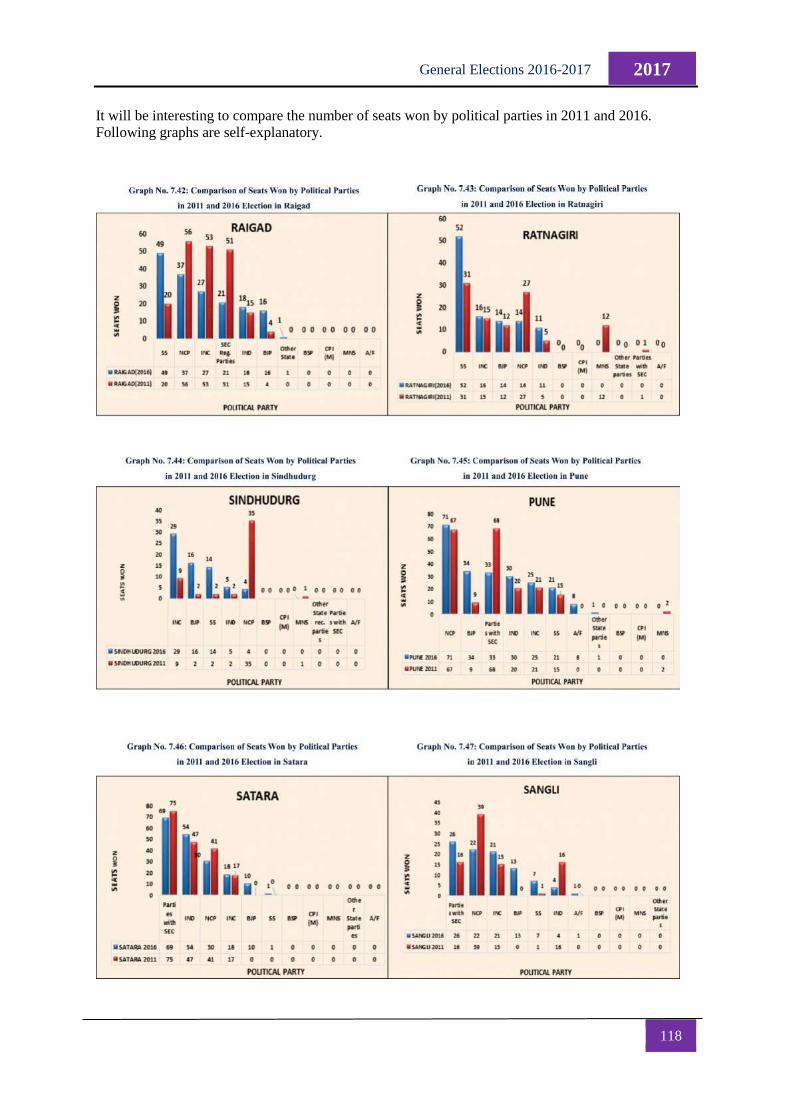
118
2017 General Elections 2016-2017
It will be interesting to compare the number of seats won by political parties in 2011 and 2016.
Following graphs are self-explanatory.
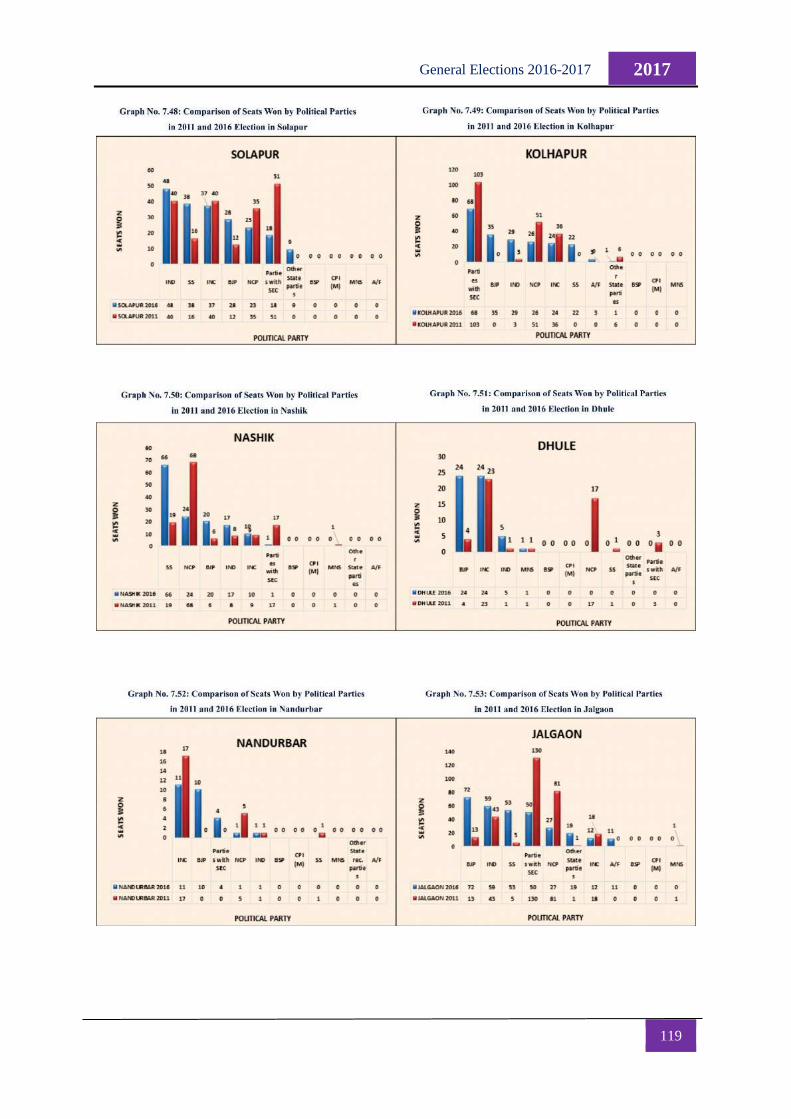
119
2017 General Elections 2016-2017
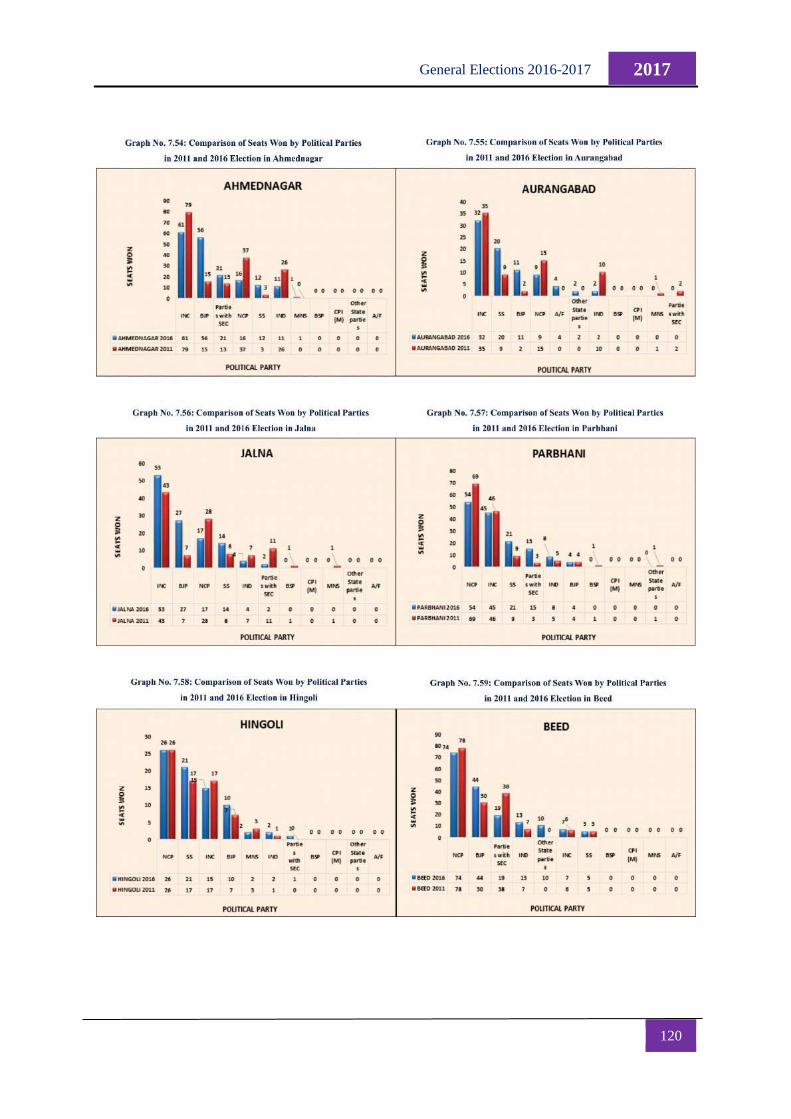
120
2017 General Elections 2016-2017
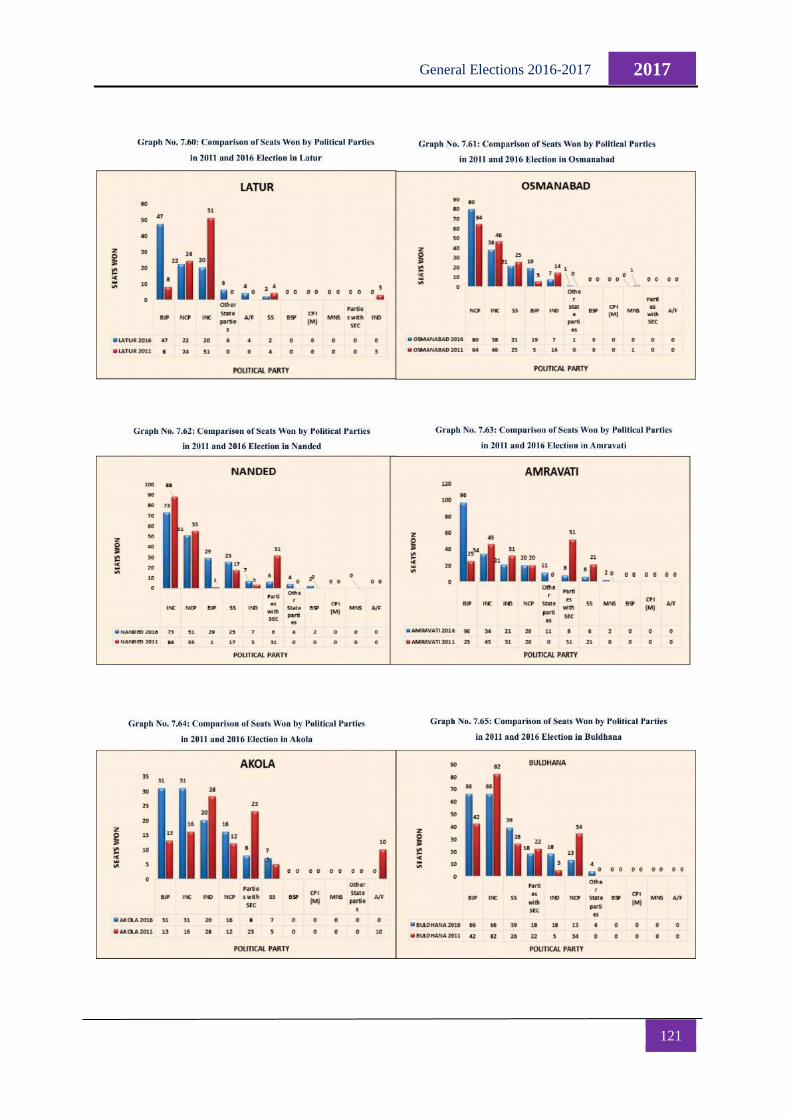
121
2017 General Elections 2016-2017
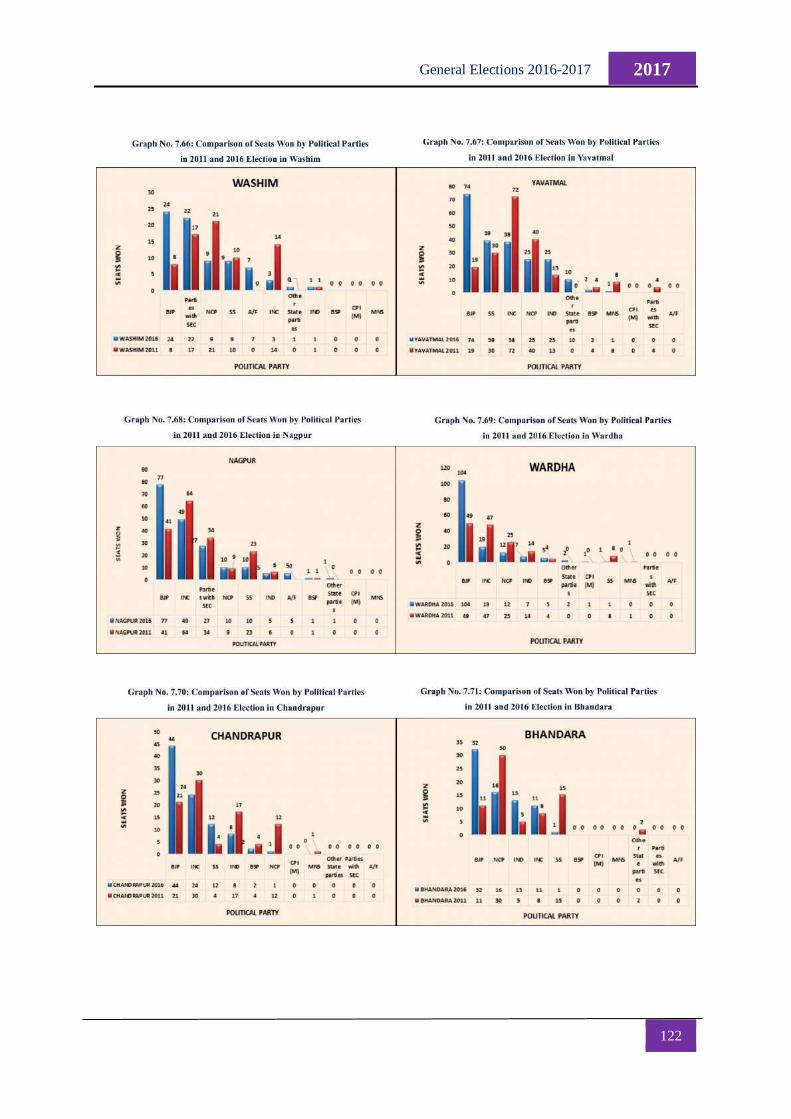
122
2017 General Elections 2016-2017
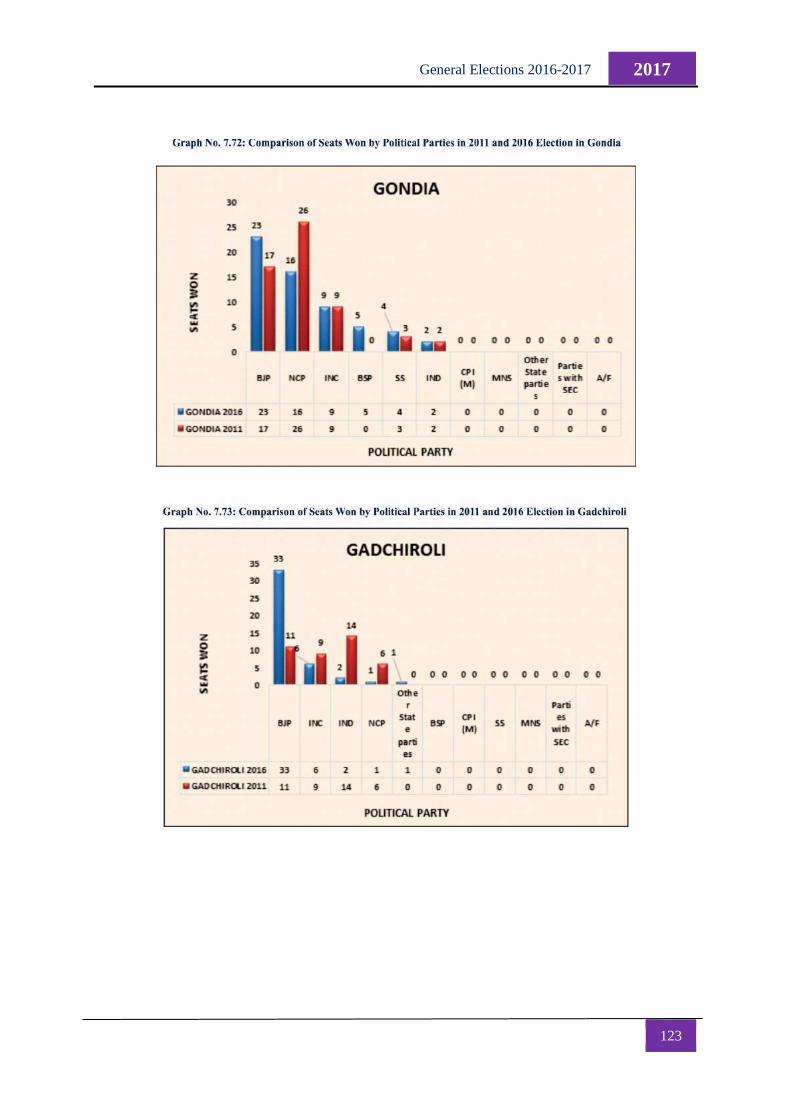
123
2017 General Elections 2016-2017
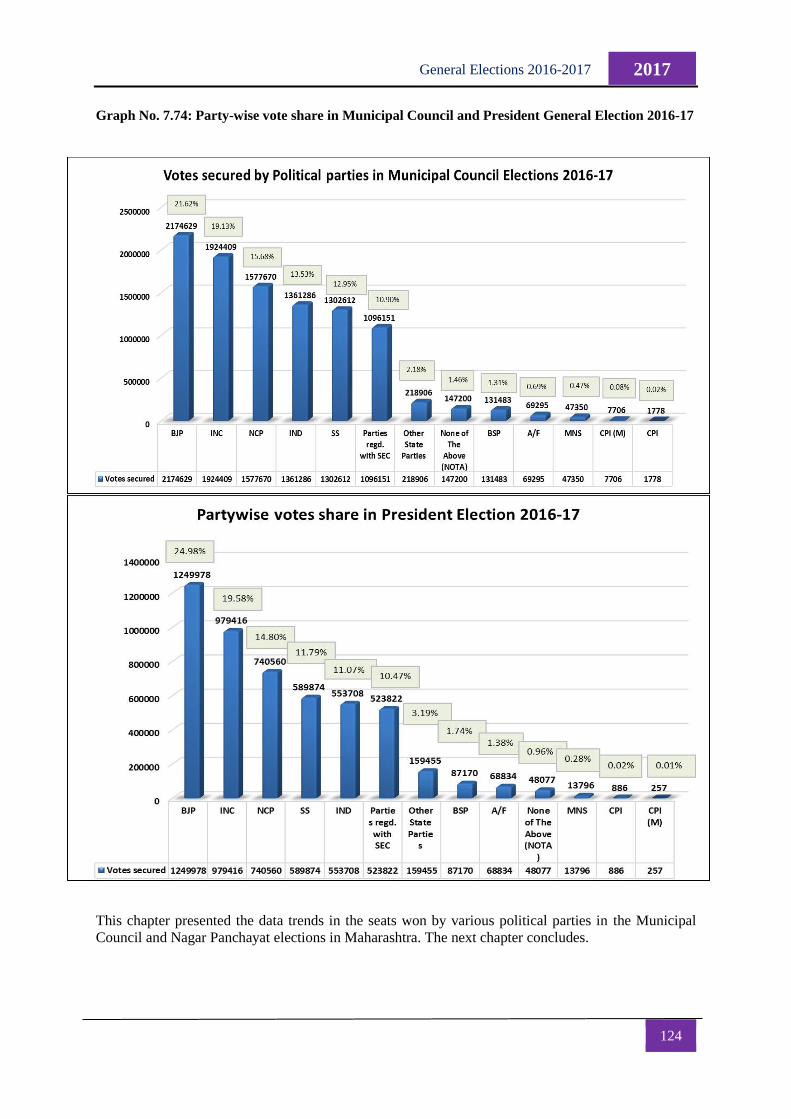
124
2017 General Elections 2016-2017
Graph No. 7.74: Party-wise vote share in Municipal Council and President General Election 2016-17
This chapter presented the data trends in the seats won by various political parties in the Municipal
Council and Nagar Panchayat elections in Maharashtra. The next chapter concludes.
125
2017 General Elections 2016-2017
CHAPTER - VIII
CONCLUSION
This report gives a detailed view into the fifth round of Municipal Corporation, Municipal Council and
Nagar Panchayat elections conducted in Maharashtra by SECM.
There were a number of reforms undertaken by the SECM in the Municipal Corporation elections of
2017, the chief amongst which was that all the information in the affidavits and nomination forms was
submitted online by candidates. This created a huge mine of information on candidates in the 2017
Municipal Corporation elections, allowing creation of candidate profile analysis which has been
presented in the second chapter. This chapter gives interesting insights into candidate attributes such as
age, gender, occupation, education, criminal records etc. More interestingly, it helps to understand
which of these attributes might be crucial in winning elections.
Another dynamic area of elections is data on contesting parties. The third chapter in the report carries
information on National, State and SEC registered parties which contested elections. It also gives details
on how many candidates contested on political party tickets in each of the Corporations.
The fourth chapter focuses on voter turnout, that variable which the SECM has endeavoured to increase
through multiple initiatives. It gives details of polling percentage within every Corporation, as well as
compares the 2017 voter turnout to 2012 turnouts.
Which parties were in the forefront in terms of putting up candidates? And which parties recorded
maximum wins? The participation share, winning share and success rate of various political parties in
Maharashtra can be seen in Chapter 5.
Chapters 6 and 7 present the polling and seats won data pertaining to Municipal Council and Nagar
Panchayat elections.
This report thus endeavors to document and analyze the data pertaining to the various dynamics of local
body elections in urban Maharashtra. Such documentation becomes relevant from a future perspective
and helps in creating futuristic and practical electoral policies and reforms.
STATE ELECTION COMMISSIONMAHARASHTRA
https://www.instagram.com/maharashtrasec
https://www.facebook.com/MaharashtraSEC
https://www.twitter.com/maharashtrasec
https://www.youtube.com/channel/UCBecPYpVQš1P8-ZqMUlG-1w
022 22886950
https://mahasec.maharashtra.gov.in
https://mahasecnews.blogspot.in
First Floor, New Administrative BuildingHutatma Rajguru Chowk, Madam Cama Road,
Mumbai - 400032