general purpose technology and wage inequality
TRANSCRIPT

General Purpose Technology and Wage Inequality
CitationAghion, Philippe, Peter Howitt, and Giovanni L. Violante†. 2002. Journal of Economic Growth 7 (4): 315–345.
Published Versiondoi:10.1023/A:1020875717066
Permanent linkhttp://nrs.harvard.edu/urn-3:HUL.InstRepos:12490369
Terms of UseThis article was downloaded from Harvard University’s DASH repository, and is made available under the terms and conditions applicable to Other Posted Material, as set forth at http://nrs.harvard.edu/urn-3:HUL.InstRepos:dash.current.terms-of-use#LAA
Share Your StoryThe Harvard community has made this article openly available.Please share how this access benefits you. Submit a story .
Accessibility

General Purpose Technology and Wage
Inequality
Philippe Aghion
University College London, Harvard University, and CEPR
Peter Howitt
Brown University
Giovanni L. Violante�
University College London, Institute of Fiscal Studies, and CEPR
Corresponding Author: Giovanni L. Violante, Department of Economics, Univer-
sity College London, London, WC1E 6BT, UK, e-mail: [email protected], tel. +44-20-
7679-5834. From August 1: Department of Economics, New York University, 269 Mercer
Street, New York, New York 10003, USA, tel. 212-998-8900.
�We thank Daron Acemoglu, John Hassler, Elhanan Helpman, Zvi Hercowitz, and Steve Machin for
comments, and seminar participants at Brown, Carlos III, CEMFI, Cornell, ECARE, Essex, Harvard,
Hebrew University, MIT, Stockholm University, Toulouse, and UCL. Aghion acknowledges �nancial sup-
port from the Mc Arthur Foundation and from Harvard University. Aghion and Violante acknowledge
�nancial support from the ESRC Centre for Economic Learning and Social Evolution (ELSE).
1

Abstract
The recent changes in the U.S. wage structure are often linked to the new wave of
capital-embodied information technologies. The existing literature has emphasized
either the accelerated pace or the skill-bias of embodied technical progress as the
driving force behind the rise in wage inequality. A key, neglected, aspect is the
\general purpose" nature of the new information technologies. This paper formalizes
the idea of generality of technology in two ways, one related to human capital
(skill transferability) and one to physical capital (vintage compatibility) and studies
the impact of an increase in these two dimensions of technological generality on
equilibrium wage inequality.
JEL Classi�cation: E24, J31, O30.
Keywords: General Purpose Technology, Wage Inequality, Experience Premium,
Skill Transferability, Vintage Compatibility.
2

1 Introduction
The U.S. wage distribution has undergone remarkable changes during the past three
decades. Wage inequality has grown fast over that period, reaching arguably the highest
peak in the Post-War era: the ratio between the ninth and �rst deciles of the weekly
wage distribution for males rose by 40% between 1963 and 1995 (Katz and Autor, 1999).
Part of this increase in inequality is attributable to wage di�erentials between educational
groups, but a substantial fraction of the increase (from one half to two thirds, according
to Juhn, Murphy and Pierce, 1993) took place within groups.
The rise in the educational premium is well understood as the combination of an ac-
celeration in relative labour demand for more educated workers and a contemporaneous
slowdown in their relative supply (Katz and Murphy, 1992, Krusell et al., 2000).1Per-
haps more challenging is to understand the sources of the rise in within-group (or residual)
inequality. The common denominator among most of the theoretical papers in the litera-
ture is that they identify the recent wave of capital-embodied technological change as the
primary source of the increase in the various dimensions of wage inequality.2
A �rst strand of the literature (Katz and Murphy, 1992, Acemoglu 1998, 1999) empha-
sizes the secular trend in the skill-bias of new technologies: the new equipment goods are
designed to increase the productivity of workers with certain skills (i.e. more educated,
or more \able"), hence the market return for this type of measured and unmeasured skills
increases and so does inequality of wages in the workforce. A second strand points to the
acceleration in the speed of embodied technical change: the rapid rise in capital-embodied
productivity induces a surge in the demand for equipment and, when equipment is com-
plementary in production with skilled labour, inequality rises (Krusell et al. 2000). More
directly, it can induce an increase in the demand for skilled labour if the latter has a
comparative advantage in coping with the uncertainty and the novelties associated with
times of rapid technical change (Galor and Tsiddon, 1997, Greenwood and Yorukoglu,
1997, Caselli, 1999, Rubinstein and Tsiddon, 1999, Aghion et al., 2000, Galor and Moav,
2000, Aghion et al., 2000, Gould et al., 2001, and Violante, 2002).
In this paper we focus on yet another important feature of technological change that
1See Aghion (2002) for a survey of the competing theories attempting to explain the evolution of the
educational premium.2There are notable exceptions. Di Nardo, Fortin and Lemieux (1996) and Lee (1999) emphasize the
role of institutional changes, such as deunionization and the decline in the real minimum wage. Wood
(1995) argues that trade liberalization is responsible for the rise in inequality. Acemoglu (2002) provides
an interesting discussion of how these non-technological factors become much more important when
interacted with technical change.
3

has been neglected by the existing literature on inequality: its general purpose nature.
Bresnahan and Trajtenberg (1995) coined the term \general purpose technologies" (GPT)
to describe certain drastic innovations that have the potential for pervasive use and ap-
plication in a wide range of sectors of the economy. Lipsey et al. (1998) cite as examples
of such innovations, in ancient times, writing and printing, and in more recent times,
the steam-engine, the electric dynamo and last, the microchip. A recent report of the
Computer Science and Telecommunications Board of the National Academy of Sciences
con�rms the view of information technologies as GPT's as it states that \...increased pro-
cessing power can also often be used to [...] increase exibility and generality, attributes
that are key to much of the ongoing transformation of communication technology" (page
116). There is a small literature on the relation between GPT and aggregate productivity:
the GPT is modelled as a technological paradigm that induces a sequence of secondary
incremental innovations and the emphasis is on the role of GPT di�usion for productivity
and growth: in particular, the GPT approach provides theoretical foundations for the co-
existence of a technological acceleration and a productivity slowdown.3Here, we develop
the link between GPT and the dynamics of wage inequality.
In this paper we formalize two aspects of \generality" of a technology and we build
a theoretical framework to understand how each a�ects wage inequality. The �rst aspect
relates to human capital: a more general technology allows a larger degree of transfer-
ability of skills across the di�erent sectors of the economy. For example, the ability to
use computers for word-processing, database, or programming can be useful in a wide
range of sectors and jobs in the economy. A recent survey by the Bureau of Labour
Statistics concludes that the impact of computers has been \...extensive because the tech-
nology, network systems, and software is similar across �rms and industries. This is in
contrast to technological innovations in the past, which often a�ected speci�c occupations
and industries (for example, machine tool automation only involved production jobs in
manufacturing). Computer technology is versatile and a�ects many unrelated industries
and almost every job category" (McConnell, 1996, page 5).
The second aspect relates to physical capital: a more general technological blueprint
increases the degree of compatibility between old and new vintages of capital. The afore-
mentioned report of the Computer Science and Telecommunications Board contains two
striking examples. First, the increasing transfer of tasks from hardware to software, al-
3We refer the reader to the essays included in Helpman (1998) for an extensive discussion of the
relationship between GPT's and growth dynamics. See also Helpman and Rangel (1999).
4

lowed by faster computing power, has the advantage of permitting a large set of functions
of the new machines to be modi�ed after manufacture to correct problems or meet evolv-
ing user needs, whereas the old machines, once manufactured, were \frozen" (page 116).
A second key consequence of increasing processing power is the improved ability to process
and transform data in communication systems. As a result, the scope for inter-operation
among previously incompatible systems is larger: in the past the di�erent broadcast video
formats used in various part of the world were a barrier to interchange of video content,
but today general converters exist. Similarly, digital and analogue telephone system which
were originally incompatible, now interwork perfectly (page 117).
The framework we develop in the paper is a simple overlapping generation model with
two-period lived agents and two production sectors. Technological progress results in
capital-embodied innovations occurring in each of the two sectors in alternance. Capital
fully depreciates after two periods so that at any time there are only two vintages of capital
(old and new). Workers cumulate experience through learning-by-doing. The generality
of the technology determines the degree of skill transferability and vintage compatibility.
Transferability of skills refers to the fraction of accumulated knowledge a worker can carry
over when moving to the leading-edge sector. Compatibility of physical capital, refers to
the extent to which capital equipment embodying the old technology, can be retooled so as
to embody the new leading-edge technology. Not all workers can be productive with the
new technology, only those who are adaptable. Adaptability in our model is determined
by the schooling investment of young workers. This link between education and ability to
adopt new technologies goes back to the seminal work of Nelson and Phelps (1966). We
then use this framework to study the e�ect of a rise in the generality of the technological
platform on wage inequality.4
The main results of the paper are three. First, when adaptability is exogenous, an
increase in both measures of generality of technology increases the long-run level of wage
inequality. Intuitively, larger skill transferability increases the premium of adaptable
workers through \skill deepening", and larger vintage compatibility has the same e�ect
through \capital deepening". Interestingly, during the transition towards a more general
technology, inequality might temporarily overshoot its new steady-state level. Second,
when adaptability is endogenous, a rise in generality of the technology increases the de-
4Our structure is similar to that of Galor and Tsiddon (1997), who also examine the theoretical
relationship between growth and wage-inequality using a two-period overlapping-generationsmodel. They
assume that each person works only in one period of life and that technological progress is not embodied
in capital. As a consequence, neither dimension of \generality" that we study below can be represented
in their model.
5

mand for education and thus the supply of adaptable workers, thereby counteracting the
initial mechanism. We characterize the conditions under which the initial forces dominate
and show, with a simple calibration, that this appears indeed to be the case for the U.S.
economy. Third, our model can shed some light on one dimension of rising inequality
which is less well understood than others, the increase in the experience premium: in the
U.S. the ratio between the average wage of workers with 25 years of experience and 5
years of experience rose by 20% since the early 70's (Katz and Autor, 1999). Explana-
tions based purely on the \acceleration hypothesis" would predict a fall in the experience
premium, whereas this empirical fact is easily explained as resulting from an increase
in the generality of technologies: a technological platform that allows skills to be more
transferable on the new vintages can raise the relative wage of older workers, as it raises
the premium to accumulated knowledge and experience to use on the new, and more
productive machines.
The remainder of the paper is organized as follows. In the next section we describe
the general model. In Section 3 we analyze the impact on steady-state wage inequality
of the generality of technology in an economy with exogenous adaptability. In Section 4
we endogenize the acquisition of adaptability through schooling and check the robustness
of the previous results. In Section 5 we calibrate our model to the U.S. economy to,
tentatively, gauge the extent of the rise in technological generality. Section 6 analyzes the
transitional dynamics between steady-states. Section 7 concludes.
2 The Environment
Demographics and Preferences
Time is discrete, and indexed by t. The economy is populated by a continuum of
overlapping generations of ex-ante identical individuals, who live for two periods. Each
generation has measure one. The preferences of an individual born at time t are given by
Ut = cyt + �cot+1;
where � is the discount factor. Individuals are non-altruistic, thus from intertemporal
consumption optimization one can obtain that in equilibrium � = 1=(1 + r); where r is
the economy's rate of interest.5We assume that r exceeds the growth rate of the economy,
to ensure dynamic eÆciency.
5This presumes an interior equilibrium; i.e., that the equilibrium capital stock corresponding to a
rate of interest r is small enough that young people can a�ord to buy it out of their current income
with something left over for current consumption (recall that in a two-period overlapping generations
6

Technological Progress and Production
Technological progress in this economy is embodied in capital: at each date t an
innovation takes place creating a new improved vintage of machines, each with a (labour-
augmenting) productivity factor At = (1 + )t, where > 0: There is one �nal good in
the economy, produced in two separate sectors, whose price is normalized to unity.6In
odd periods the exogenous process of technological change produces an innovation speci�c
to the �rst sector, while in even periods the innovation is speci�c to the second sector.
Let the \new" sector at date t be the one that has just innovated and denote it by \0"
to refer to the age of capital in that sector. Similarly, the \old" sector is the one that has
innovated in the previous period and will be denoted by \1".
Output in each sector is produced by a Cobb-Douglas production function using phys-
ical capital and labour. Physical capital lasts for two periods, with no depreciation after
the �rst period. At the beginning of the second period �rms in the old sector can keep any
amount of the old capital in production; what is not kept in the old sector can be relocated
to the new sector where it will be retooled, at a cost, to embody the new technological
innovation. When the amount Dt of old capital is retooled to embody the new technology,
only a fraction � 2 [0; 1] is retained in the process. The parameter � represents the degree
of technological compatibility between old and new vintages of capital. Thus, � captures
the notion of generality of the technology based on physical capital that we mentioned in
the Introduction.
The production technologies in the two sectors i = 0; 1 at date t are:
Y0t = K�t (Atx0t)
1��+ (�Dt)
�(Atex0t)1��;
Y1t = (Kt�1 �Dt)�(At�1x1t)
1��;
(1)
where Kt is the capital stock installed at date t, x0t is the amount of labour used in
production with new capital in sector 0, ex0t is the amount of labour used with retooled
capital in sector 0; and x1t is the amount of labour used in sector 1: The production of
�nal goods in sector i is Yit and � is capital's share of output.
setup there is no one from whom the representative young person can borrow to �nance the purchase of
capital). Otherwise the conditions of equilibrium involve a corner solution, with young people consuming
nothing, and with a rate of interest that may exceed their rate of time preference. It is straightforward
to demonstrate that the equilibria analyzed below (both steady-state and transitional) all satisfy this
interiority condition if r is large enough or if capital's share of income � is small enough.6The assumption of a unique �nal good is made in order to abstract from demand e�ects driven by
relative prices which are outside the scope of the paper.
7

Adaptability and Education
All workers are capable of working with the old technology. However, not all workers
are productive with the new technology; to do so they must be adaptable. We assume
that adaptability depends on age and education, together with a stochastic component
(i.e. luck in the labour market). Speci�cally, all young workers are adaptable, whereas
only with probability � 2 [0; 1] can an old worker relocate to the newly innovating sector.
Our analysis will �rst proceed under the assumption that the adaptability parameter �
is exogenous, and in Section 4 we shall extend it to the case where � depends upon the
amount of time h 2 [0; 1] a worker devotes to education when young. This notion of
education as a vehicle for workers to acquire skills that empower them to use the newest
technologies goes back to the seminal work of Nelson and Phelps (1966) and since then it
has been widely used in growth theory and macroeconomics.7
Vintage Human Capital
Each individual worker is endowed with one unit of time per period, any amount of
which can be supplied |conditional on adaptability| to one sector or the other, but not
to both at the same time. Young workers are all the same; each unit of time supplied to a
sector by a young worker contributes one unit of labour towards production in that sector.
When young, workers learn vintage speci�c skills that determine their productivity next
period. Hence, each unit of time supplied by old workers provides an amount of labour
that depends on the vintage of technology they used when young (human capital thus has
a vintage-speci�c component).
In particular, one unit of time supplied by an old worker using the same vintage of
technology she used last period, contributes (1 + �) units of labour, where � > 0 is a
parameter indicating the rate of learning by doing. For an old individual working on a
technology that is one period newer than the vintage used last period, her unit of time
contributes (1 + ��) units of labour, where � 2 (0; 1). Finally, for an old individual
working on a technology that is two or more periods newer, her unit of time contributes
only one unit of labour. Thus we are implicitly assuming that experience with a previous
technology makes a worker more productive only if the previous technology is at most
one period older. The transferability parameter � captures the notion of generality of the
technology based on human capital that we mentioned in the Introduction.
7In Greenwood and Yorukoglu (1997) educated labor is necessary in the adoption phase of the new
technology. Bartel and Lichtenberg (1987) show micro-evidence for the U.S. that more educated workers
have a comparative advantage in implementing new technologies. Flug and Hercowitz (2000) using a
cross-country dataset �nd that new equipment investments raises the demand of more educated workers.
8

3 Exogenous Adaptability
3.1 The Relative Labour Demand Schedule
Consider the economy of the previous section with � exogenously given, � = 0, and
� 2 (0; 1). Hence, skills are only partially transferable on new technologies, but capital is
not transferable at any cost in its second period. Each �rm chooses its demands for capital
and labour so as to maximize the present value of pro�ts over the lifetime of capital, given
a constant rate of interest r and a wage in each sector i equal to wit � !itAt, for all t: Let
kt � Kt=At denote the normalized amount of new capital installed at date t. Then the
representative �rm in sector 0 at date t chooses kt; x0t; and x1;t+1 so as to maximize:
�kt + k�t x1��0t � !0tx0t +
1
1 + r
�k�t x
1��1;t+1 � (1 + )!1;t+1x1;t+1
�; (2)
where we have normalized the price of the �nal good (consumption or investment) to
one.8The �rst-order condition for maximization with respect to capital input yields:
kt = �1
1��
�x1��0t +
1
1 + rx1��1;t+1
� 1
1��
; (3)
and the �rst-order conditions for x0t and x1t de�ne the relative labour-demand schedule
at each date t:!0t
!1t
= (1 + )
�kt
kt�1
���x0t
x1t
���
: (4)
Next, suppose that � 2 (0; 1). The owners of old capital can retool it to embody the
new technology and employ it in the other sector, at a cost of losing a fraction (1� �) of
the capital. Thus � is an index of generality of the technological blueprint. Let dt � Dt=At
be the normalized amount of old capital that is retooled at each date t. The representative
�rm chooses kt; x0t; x1;t+1; dt+1 and ex0;t+1 so as to maximize:9
�kt + k�t x1��0t � !0tx0t +
1
1 + r[(kt � (1 + ) dt+1)
�x1��1;t+1
� (1 + )!1;t+1x1;t+1] +1 +
1 + r
�(�dt+1)
� ex1��0;t+1 � !0;t+1ex0;t+1
�:
(5)
8According to the production relations (1), the present value of pro�ts resulting from the use of capital
newly aquired at t, when there is no compatibility (� = 0), is:
�Kt +K�t (Atx0t)
1��� w0tx0t +
1
1 + r
hK
�t (Atx1;t+1)
1��� w1;t+1x1;t+1
i
Dividing this expression by At and using the normalizations de�ned above produces (2).9Expression (5) can be derived by an argument analogous to the one used in footnote 8 above to derive
expression (2).
9

The �rst-order condition with respect to each dt can be expressed as:
�
� ex0t�dt
�1��
�
�x1t
kt�1 � (1 + ) dt
�1��; with equality if dt > 0:
Thus the optimal amount of retooling dt is such that the marginal productivity of using a
unit of capital with the old technology equals the marginal productivity of embodying the
new technology into � < 1 units of old capital. Together with the �rst-order conditions
for x1t and ex0t, the inequality above can be expressed as:
!0t
!1t
� (1 + )��
1�� , with equality if dt > 0: (6)
In other words, for any given degree of compatibility � there is a maximum wage premium
to be paid to workers on the new technology that makes the retooling choice pro�table
to the �rm. It also follows that equation (4) holds whenever dt = 0. Hence, the general
expression for the relative demand of skilled labor is:
!0t
!1t
= (1 + )max
(�kt
kt�1
���x0t
x1t
���
; ��
1��
): (7)
This relative demand curve is illustrated in Figure 1: when the relative wage of adapt-
able labour is above the limit de�ned by the second argument of the max operator in
(7), �rms are discouraged from embodying the new technology in the old capital and the
relative demand curve is negatively sloped.
3.2 The Relative Labour Supply Schedule
We now determine the relative labour-supply schedule at each date t. To characterize the
optimal behaviour of workers, note that the normalized wage of a worker will depend on
which sector the worker is in, whether the worker is young or old, and (if old) where she
worked last period, according to Table 1 below.
Table 1 here
Thus, an old adaptable worker going from sector 0 to sector 1 supplies (1 + �) units of
labour as a result of learning by doing on the same technology, whereas the same worker
could supply only (1 + ��) units of labour to sector 0, as a result of having to switch
technology. An old worker going from sector 1 to 0 supplies only one unit of labour
because experience with a technology is not transferable to one that is two periods newer,
whereas the same worker could supply (1 + ��) units of labour to sector 1 because only
10

the fraction (1 � � ) of learning is lost when the worker switches sectors to work with a
technology that is one period newer.
An old worker who is not adaptable must work on the old technology in sector 1. One
who is adaptable will work where the wage is highest. A young worker will work where
the expected present value is highest, given the probability � of being adaptable when
old.
The following argument shows that unless the normalized capital stock is falling (that
is, unless kt < kt�1), all young workers at date t will start their careers working with the
new technology (in sector 0). Suppose, on the contrary, that some young workers choose
to work in sector 1. Because of partial skill transferability, Table 1 applied to t+1 implies
that the worker's continuation value would have been higher if he had chosen sector 0 in
date t; therefore !1t > !0t. But then according to Table 1 all old workers will choose to
work on the old technology, no matter where they worked when young, since old workers
do not value future skill transferability. Thus the supply of labour in sector 1 will be
x1t > 1 (the amount supplied by the full measure 1 of old workers, plus some young
workers) and the supply in sector 0 will be x0t � 1 (no more than the full measure 1 of
young workers). Unless kt < kt�1 it then follows from equation (4) that !1t < !0t; which
contradicts our earlier demonstration that !1t > !0t. This establishes:
Lemma 1 If kt � kt�1; all young workers enter sector 0 at date t.
In all of the conceptual experiments analysed below, the normalized capital stock is either
constant (in the steady-state analysis) or rising (in the analysis of transitions), so Lemma
1 ensures that we can safely ignore the possibility of young workers entering sector 1.10
Let st 2 [0; �] denote the fraction of old workers who choose to work in sector 0 at
date t: The supply of labour to each technology will then depend on st according to:
x0t = 1 + st (1 + ��) ;
x1t = (1� st) (1 + �) :
(8)
There are three cases to analyze: (A) if (1 + �)!1t < (1 + ��)!0t, then every old worker
who is adaptable prefers the new vintage, and st = �; (B) if (1 + �)!1t = (1 + ��)!0t,
then any fraction st 2 [0; �] of old workers may choose the new vintage; (C) if (1 + �)!1t >
(1 + ��)!0t, then all old workers choose the old vintage of technology, and st = 0. In
cases (B) and (C) every old worker earns the same wage in equilibrium so that there is no
10See, however, footnote 12 below.
11

within-group inequality in those cases. Case (A) is the only case where there is a positive
adaptability premium and where, when adaptability is endogenous, young workers choose
to invest in education. For this reason, in the remaining part of the paper we shall
concentrate our attention on the more relevant case where the equilibrium is of type
(A).11
3.3 Steady-State Equilibrium Inequality
We focus on a balanced growth path in which the capital stock and all wage rates grow
at the rate of labour-augmenting technological progress ; and the equilibrium quantities
of labour are constant: that is, (kt; !0t; !1t;x0t; x1t) = (k; !0; !1;x0; x1) for all t. Equations
(8) and the taxonomy that follows them de�ne the steady-state labour-supply schedule
which is depicted in Figure 1.12
The steady-state labour-demand schedule is given by (7)
with kt=kt�1 = 1. The equilibrium relative wage (!0=!1) determined by the intersection
between these two schedules in the vertical region of the supply curve can be expressed
as:
!0
!1
= (1 + )max
��(1� �) (1 + �)
1 + � (1 + ��)
��; �
�
1��
�: (9)
Our measure of aggregate wage inequality will be the ratio between the highest and
the lowest wage in the economy, denoted as R. The model does not generate any in-
equality among young workers, given they are ex-ante equal and all work in the same
sector. However, we can characterize wage inequality among old workers by the ratio Ro
between the highest and lowest wage earned by an old worker in equilibrium. We can also
characterize the experience premium Rx, de�ned as the ratio of the average wage of old
workers to the wage of young workers.13
11Where interesting, we report in a footnote the comparative statics when the equilibrium is of type
(B) or (C).12When !0=!1 < � 1� (1� �) � (1 + ) = (1 + r), then young workers will choose to enter sector 1,
despite the higher continuation value to be had from entering sector 0, in which case the relative supply
falls to zero as indicated in Figure 1. Lemma 1 implies, however, that this segment of the relative supply
curve always lies below the relative demand curve in a steady-state equilibrium.13Inequality among old workers (Ro) depends only on two wage rates, thus there is no loss of generality
in choosing the wage ratio as its measure. The experience premium (Rx) is a function of three wage rates
instead. In Aghion, Howitt and Violante (2000) we argue that the behaviour of inequality measures such
as the Gini coeÆcient or the variance of log wages is qualitatively similar to that of wage ratios.
12

Within-group inequality
It is easy to see that the measure of within-group inequality among old workers is
Ro=
(1 + ��)!0
(1 + �)!1
: (10)
To focus �rst on the e�ects of human capital generality, consider the case of full speci�city
of physical capital, i.e. � = 0. An increase in the generality of technology as measured
by the transferability parameter � raises the degree of within-group inequality. It does so
by allowing adaptable workers to bene�t even more from their experience on last period's
leading-edge technology, and therefore to earn an even larger wage premium relative to
the less fortunate workers in their cohort who are not adaptable. Notice that the higher
skill transferability raises the aggregate labour input of the adaptable workers, inducing
downward pressure on their wage, but this force is always dominated by the former \skill
deepening" e�ect.
Suppose now to be in a case where � > 0 and �rms exploit this partial compatibility
across vintages to embody the new technologies in old capital. As before, an increase in
the generality of technology as measured by the transferability parameter � will have a
positive e�ect on within-group inequality, by increasing the premium earned by adaptable
workers. Note that the e�ect of � on within-group inequality is ampli�ed by the possibility
of retooling. That is, the elasticity of Rowith respect to 1 + �� is unity, whereas in the
previous case with no retooling it was less than unity. This is because when � increases,
�rms respond to the increase in the available supply of labour in sector 0 by raising the
amount of capital in which they embody the new technology. This induced increase in the
supply of capital to sector 0 serves to amplify the increase in wages of adaptable workers
in that sector, by raising their marginal product.
In an equilibrium with retooling (i.e. dt > 0), the e�ect of an increase in generality of
technology as measured by the compatibility of capital � is also to increase the degree of
within-group inequality. It does so by increasing the amount of capital that is transferred
to sector 0 to embody the new technological blueprint, thereby increasing the premium
earned by adaptable workers in that sector (\capital deepening" e�ect). The elasticity of
inequality to the technological compatibility parameter � is�
1��. A large capital share
requires a big fraction of the capital stock to be moved from the old to the new sector in
order to equate marginal productivities of capital, with sharp e�ects on the capital-labour
ratios and the wage di�erentials between technologies.14
14Finally, note that in cases (B) and (C) the aggregate adaptability constraint is not binding and all
old workers earn the same, so Ro = 1.
13

Experience premium
When � = 0 and capital is fully speci�c, all adaptable old workers earn an expe-
rience premium of 1 + ��; whereas the non-adaptable earn an experience premium of
(1 + �) (!1=!0). Since both of these individual premiums are increasing in � , the average
experience premium Rxis also increasing in � : That is, an increase in the generality of
technological knowledge raises skill transferability and ampli�es the experience premium
of adaptable workers, who are able to transfer more of their cumulated skills. It also indi-
rectly raises the experience premium of non-adaptable old workers by making adaptable
labour relatively less scarce.
This result is particularly interesting in light of the fact that models based on the
\acceleration hypothesis" would predict a decline in the experience premium. This is
evident from the expressions above showing that Rxis (weakly) decreasing in the growth
rate of embodied productivity : larger productivity di�erentials between the young and
the old vintages represent a relative advantage to young workers who are more adaptable.
Next, consider an equilibrium with retooling of old capital. The experience premium
earned by the non-adaptable fraction (1� �) is
1 + �
(1 + )��
1��
; (11)
whereas the adaptable fraction � will earn an experience premium equal to 1+ ��: There-
fore the average experience premium Rxis increased by a larger � ; as before, but it is now
reduced by an increase in the generality of technology as measured by the compatibility
of capital. That is, a rise in � allows to transfer more capital to sector 0 where it bene�ts
the inexperienced workers.15
Overall inequality
Overall inequality is always given by R = max f1 + ��; Rog ; depending on whether
the lowest wage in the economy is the wage of the inexperienced young workers or that
15In an equilibrium with � = 0, in case (B), the condition of indi�erence that de�nes this case implies
that Rx = 1 + �� , thus, an increase in the generality of technology as measured by � increases the
experience premium because in equilibrium arbitrage ensures that all old workers|irrespectively of where
they work| earn the same premium as those who are bene�ting from the transferability of experience.
In case (C) an increase in the generality of technology as measured by the transferability parameter � has
no e�ect on the experience premium because in equilibrium no worker is actually transferring any skills
to the new technology. In an equilibrium with retooling, only case (C) remains relevant, since case (B)
(where old workers are indi�erent between working in sectors 0 and 1) would now require a razor's edge
condition to put us on the horizontal segments of both the supply and the demand curves (see Figure 1).
In case (C), the experience premium is given by (11). As in the benchmark case (A), Rx is una�ected by
an increase in the transferability parameter � but it is reduced by a rise in �.
14

of the experienced but non-adaptable old workers. It follows from our previous results
that R is (weakly) increasing in the generality of technology, along both dimensions.
That is, an increase in the transferability parameter � will raise the relative wage of the
already privileged old adaptable workers, whereas a rise in the degree of technological
compatibility � will induce �rms to give these privileged workers more capital to work
with thereby further increasing their relative wage. As with our measure of within-group
inequality, the possibility of retooling will amplify the e�ects of � on overall inequality by
inducing a secondary transfer of more capital to sector 0:
To summarize, we state:
Proposition 1 Suppose the adaptability rate � is exogenous. In a stationary equilibrium
with no retooling of physical capital, all three measures of steady-state inequality
are (weakly) increasing in the degree of generality of technology as measured by
the transferability of experience across vintages. In a stationary equilibrium where
�rms retool a positive fraction of old capital to embody the new technology: (i)
all three measures of inequality are (weakly) increasing in the degree of generality
of technology as measured by the transferability of experience � , (ii) within-group
inequality is (weakly) increasing in the generality of physical capital as measured by
�, and (iii) the e�ects of transferability on within-group inequality and on overall
inequality are (weakly) ampli�ed by the possibility of retooling; however (iv) the
experience premium is (weakly) decreasing in the generality of physical capital.
4 Endogenous Adaptability
We now extend the model by allowing young workers to optimally choose their degree
of adaptability � when old. Acquiring adaptability is a time consuming activity and we
denote by h = '(�) the amount of time a young individual must divert from production
in order to achieve adaptability level �, with '0 > 0, '00 > 0, '(0) = 0, and '(1) < 1: We
think of h as being the fraction of individuals' youth spent acquiring education, and of
education as an investment into future adaptability (see Nelson and Phelps, 1966).
Lemma 1 will continue to hold in this case, so that young workers will still �nd it
optimal to work initially on the new vintages. The same reasoning as used in section 3
above can be used, because once again the young worker will strictly prefer to work in
sector 0 if !0t � !1t: That is, let Vit (�) be the continuation value of a young worker that
15

enters sector i at t and acquires an adaptability probability �: According to Table 1:
V0t (�) �1 +
1 + r[�max f(1 + ��)!0;t+1; (1 + �)!1;t+1g+ (1� �) (1 + �)!1;t+1] ;
V1t (�) �1 +
1 + r[�max f!0;t+1; (1 + ��)!1;t+1g+ (1� �) (1 + ��)!1;t+1] :
Since �� > 0 and 0 < � < 1, therefore V0t (�) > V1t (�) for all values of �: It follows that
if !0t � !1t, then:
max�
f!0t (1� ' (�)) + V0t (�)g >max�
f!1t (1� ' (�)) + V1t (�)g ;
i.e. all young workers will start on the new capital. The optimal adaptability choice by a
young worker, ��, will then solve:
max�
�!0 [1� '(�)] +
1 +
1 + r[�max f(1 + ��)!0; (1 + �)!1g+ (1� �) (1 + �)!1]
�:
The �rst order condition for this problem leads to:
!0'0
(��) =1 +
1 + r[(1 + ��)!0 � (1 + �)!1]: (12)
At the optimum, the foregone earnings from a marginal investment in adaptability
when young (LHS of (12)) must equal the discounted marginal wage gain associated
with the correspondingly higher probability of working with the new technology when old
(RHS of (12)). Not surprisingly, therefore, young workers will forego earnings to invest
in adaptability only if they receive a positive return from doing so, that is if wages for
experienced workers on new vintages are strictly higher than wages on the old technology.
This in turn implies that in any equilibrium with �� > 0 there must be inequality among
the old workers.16
Two questions are of relevance when workers can choose optimally their level of adapt-
ability. First, how does the equilibrium level �� respond to an increase in the degree of
technological generality? Intuitively, if human or physical capital is more easily transfer-
able to the new sector because technologies are more general, the incentives to invest in
adaptability |i.e. the option of using this additional knowledge or capital on the more
productive technology| rise. Second, how does equilibrium inequality respond to a rise
in generality? The answer depends on whether the direct e�ect of � or � dominates the
labour supply e�ect induced by the larger fraction of adaptable workers in the population.
16In contrast, when Ro = 1 it is not individually rational to invest, which implies that case (B) can
no longer be an equilibrium, as it would feature both ��> 0 and R
o = 1. Case (C) would be a trivial
equilibrium with no investment in education and no within-group inequality, thus we continue focusing
our analysis on the benchmark case (A) where �� > 0:
16

Dividing both sides of (12) by !0 and rearranging, we get:
'0
(��) =(1 + )(1 + ��)
1 + r
�1�
1
Ro
�; (13)
which de�nes implicitly a function �� (Ro; �) representing the aggregate supply of adapt-
able labour which is increasing in both arguments. The aggregate relative labour sup-
ply schedule in the economy is now determined by: x0 = 1 � '(��) + �� (1 + ��), and
x1 = (1� ��) (1 + �), where �� = �� (!0=!1; �); hence the relative labour supply to the
new technology
x0
x1=
1� '(��) + �� (1 + ��)
(1� ��) (1 + �)(14)
will also be increasing in both Roand � :17
We can now de�ne the adaptability demand curve of the economy: plugging the
demand schedule (7), together with (14) and the steady-state condition kt=kt�1 = 1 into
the de�nition of within-group inequality (10), we obtain a function Ro(��; � ; �) which
is decreasing in the economy's adaptability rate and increasing in the two parameters
measuring technological generality. The supply and demand curves determine a unique
equilibrium pair (��; Ro) depicted in Figure 2.
Within-group inequality
Let us start by assuming full speci�city of physical capital, i.e. � = 0. The e�ect of a
rise in the generality of technological knowledge � on steady-state within-group inequality
Rois now ambiguous: a higher � increases the premium to adaptability for given �� (direct
e�ect), but it also increases the incentives to invest in adaptability, and the resulting
increase in the supply of adaptable labour �� will tend to reduce the wage ratio!0
!1
(indirect e�ect). Which of these two counteracting e�ects dominates, will depend on the
particular cost function '(�): Consider the following general speci�cation:
'(�) = a���1+�
1 + �;
where the parameter � > 0 measures the convexity of the cost function ' (�), a 2 (0; �)
and � 2 [0; �].
We examine �rst the two polar cases where � ! 1 and � = 0. In the case where �
is very large, the supply curve is close to vertical at �� = a, in other words, the economy
17In deriving these last comparative-statics results, note that, according to (13):
'0(��) <
1 +
1 + r(1 + ��) < (1 + ��) ;
where the last inequality follows from the dynamic eÆciency of the economy.
17

is essentially the same as in the case of exogenous � analyzed in section 3 above; thus, as
we saw in that section, an increase in transferability � will have only the direct e�ect of
raising inequality (see the upper panel of Figure 2) .
On the other hand, for � = 0, the supply curve is in�nitely elastic whenever �� 2 (0; �);
and equilibrium within-group inequality Rois obtained from (13) with '0
(��) = 1. This
implies immediately that Rois strictly decreasing in � . In other words, the indirect e�ect
dominates the direct e�ect in this case (see the lower panel of Figure 2).
In the more general case where � > 0 but �nite, the supply curve is positively sloped
and the comparative statics are ambiguous (see the upper panel of Figure 3). By taking
a logarithmic approximation (of the type ln(1+x) ' x) of the supply and demand curves
around the initial equilibrium, we can establish the following suÆcient condition for a rise
in within-group inequality:
Lemma 2 With no retooling, a rise in � in an economy initially at the equilibrium
(��; Ro) increases within-group inequality Ro
if
�� <�
� [(1 + �) + (1 + ��)]: (15)
We prove this Lemma in the Appendix. The conclusion is that inequality will rise
for initial values of equilibrium adaptability which are low enough. Intuitively, it is the
labour supply e�ect that limits the rise in inequality and this e�ect is stronger the higher
is ��. We already showed that a more pronounced convexity in ', corresponding to high
values of � (and to a low elasticity of supply of adaptability to its relative price, i.e. wage
inequality) makes it more likely that in equilibrium inequality will rise, as it dampens
the shift of the supply curve. A smaller fraction of transferable skills � leads to a weaker
labour supply e�ect as it limits the rise in the supply of adaptable labour input. Finally,
a larger capital share � increases the (negative) marginal e�ect of an additional unit of
adaptable labour input on !0 and makes the rise in inequality less likely.
Let us now consider an economy with a suÆciently high degree � of compatibility
between vintages of capital, so that retooling takes place. The supply curve of adaptability
is unchanged since it does not depend explicitly on �. The relevant portion of the demand
curve of adaptability is now given by the at region, which displays in�nite elasticity to
��
, as explained earlier. It is immediate to see that an increase in the generality of the
technologies, captured by a rise in �, shifts upward the demand curve along the supply
curve, therefore it unambiguously raises both equilibrium adaptability �� and within-
group inequality Ro. A rise in generality of skills � inducing a similar shift in the demand
18

curve has the same e�ect on inequality, but will induce a larger supply response (the
adaptability supply curve shifts to the right). The comparative statics in an economy
with retooling are depicted in lower panel of Figure 3. We now turn to the experience
premium.
Experience Premium
Assume �rst full speci�city of capital, � = 0: When adaptability is endogenous, the
fraction �� of adaptable workers earn an experience premium of (1 + ��), whereas the
fraction (1 � ��) of non-adaptable workers earns a lower experience premium equal to:
1+�
1+
h1� (��)+��(1+��)
(1���)(1+�)
i�: Thus an increase in the generality parameter � has an even more
positive e�ect on the average experience premium Rxthan when � is exogenously �xed;
by increasing �� it raises both the fraction of adaptable workers among the old, and the
experience premium of the non-adaptable, as their supply on old technologies becomes
relatively more scarce than in the case with exogenous adaptability.18
We showed in section 3 that, in an equilibrium with capital upgrading and � ex-
ogenous, the experience premium falls when the technological blueprint becomes more
general. When workers control their adaptability, there is an additional force contribut-
ing to push up the experience premium following a rise in � or � : the increase in ��
induces a composition e�ect among the old that increases their relative average wage.
Thus, under some parametric restrictions (e.g. � small enough), the experience premium
could rise.
Finally, aggregate inequality is given by R = max f1 + ��; Rog, thus this is also un-
ambiguously rising with �; while the e�ect of � is now ambiguous in sign, as it depends
on the elasticity of the adaptability-supply response. Under the conditions of Lemma 2,
also aggregate inequality will rise.
To summarize, we state
Proposition 2 Consider an economy with endogenous adaptability: (i) with full speci-
�city of capital, a rise in skill transferability � increases the equilibrium adaptability
rate ��, but has ambiguous e�ects on within-group inequality. Inequality will in-
crease if condition (15) holds, in particular for suÆciently high values of � and low
values of �; � and aggregate adaptability in the initial steady-state; (ii) with retool-
ing, a rise in the generality of technology increases the equilibrium adaptability rate
and within-group inequality; (iii) in the absence of retooling, the supply response due
18Note that we have used the result in Footnote 18 to draw this conclusion.
19

to endogenous adaptability ampli�es the surge in the experience premium following
a rise in technological generality and (iv) when retooling takes place, the endogenous
supply response counteracts the direct e�ect of a rise in �, introducing the possibility
of a rise in the experience premium.
5 A Simple Calibration
The theoretical model guided us to understand the qualitative impact of an increase in
the generality of the technology on wage inequality. Direct measures of generality of
skills and compatibility of capital that would allow us to assess the magnitude of the
rise in generality are not available.19
In this section, we use our model (the version with
endogenous adaptability) in conjunction with the aggregate data in order to learn about
the quantitative changes in the key parameters of the model � and �.
The exercise consists of calibrating the 7 parameters of the model f�; �; ; �; �; � ; �g
to match some key aggregate features of the data (among which within-group inequality
and the experience premium) before the start in the rise of inequality, i.e. say the early
70's , and then simulating the model to measure how large the rise in � and � should
have been to explain, by themselves, the rise in inequality in the next three decades. It is
an exercise in reverse-engineering, where we ask the data to shed some light on the two
key parameter values of the model. By de�nition, it will provide an upper bound on the
increase in generality, since no other type of shock is considered.
For the calibration, we choose a period of 25 years, thus in the �rst period of active
life individuals are aged 15 to 40 and in the second period 40 to 65, their retirement
age. We start the life of our agents at 15 to allow them to spend some extra years of
the �rst period in school. The calibration for some parameter values is standard. For
example, we choose � to match an annual rate of return to capital of 5% and � to match
the aggregate capital share in the economy, roughly 30%, as commonly done in the Real
Business Cycle literature (Cooley, 1995). To parametrize , we follow a large literature in
macroeconomics suggesting that capital-embodied technological progress can be measured
o� the decline in the relative price of capital goods. Since the type of technologies we
refer to in this paper are mainly embodied in equipment, we choose to match the average
rate of decline in (quality-adjusted) relative price of equipment, around 4:5% per year in
19The empirical micro studies on costs of adjustment in labor and capital when implementing new
technologies are very rare (see for example Doms, Dunne and Troske, 1997) and they are far from being
representative of the whole economy.
20

the post-war period (Krusell et al. 2000).20
The parameter � measures the productivity
increase of a worker who spends all her working life on the same type of technology. This
can probably be approximated by the wage growth accruing to workers with very long
tenures. From Topel (1991, Table 2) we estimate that cumulative wage growth over 40
years of tenure would be around 45 � 50%. However, even workers with long tenures in
the data are likely to be subject to upgrading of technology with some frequency, hence
to loss of knowledge. Therefore this number is a lower bound for �, and to account for
this fact we choose to set � to :7.
We are left with the three parameters �; � ; and �. These three parameters are cali-
brated jointly by matching the fraction of the �rst period spent in school h, the experience
premium Rxand within-group inequality Ro
. From the U.S. Current Population Survey
data, we obtained that the average years of schooling of the male population in the period
just prior to the rise in inequality (early 70's) were approximately 11:75. Since individ-
uals in the model start their life at 15, it means that they spend 2:75 extra years in
school on average, corresponding to h = :11. For the experience premium, we match a
value Rx= 1:35 and for within-group inequality a value of Ro
= 1:65. 21Table 2 below
summarizes our calibration.
TABLE 2
Summary of Calibration
Parameters Moment to match Source
� = :29 rate of return on capital Cooley (1995)
� = :30 capital share Cooley (1995)
= 2:0 growth of rel. price of equipment Krusell et al. (2000)
� = :7 returns to life-time tenure Topel (1991)
� = 2:65 average years of schooling CPS data
� = :68 within-group inequality CPS data
� = :34 experience premium Katz-Autor (1999)
20Taken at face value, this number implies that output in our model grows at a rate of 4:5%. Two
considerations are in order. First, although this may seem a large number, when quality-adjusted ap-
propriately, US output grows at nearly 4% per year in the postwar period. Second, all the results of the
model would be unchanged if we introduced neutral technical change (or total factor productivity), as it
would a�ect equally all vintages of capital. Negative total factor productivity growth (as implied by the
last thirty years of data) would bring output growth in the model in line with the data.21We de�ne the experience premium as the ratio between the average weekly wage for male workers
with 25 years of experience and 5 years of experience, which we take from Katz and Autor (1999, Figure
5). Our measures of within-group inequality and educational attainment are constructed from the CPS
March Files data used in Violante (2002). The sample is constructed with white males, aged 18-60, who
worked full time at least 14 weeks. The \residual" wages are computed through a log-wage regression
that includes a quartic in age, educational dummies and interaction terms. We refer the reader to that
paper for more details. We de�ne within-group inequality as the 75th� 25th residual weekly wage ratio
for males. We use this measure rather than the more common 90th� 10th wage ratio because our model
has only a two-point residual wage distribution.
21

Next, we simulate the model in order to \estimate" the values � 0 and �0 that match the
higher levels of the experience premium and within-group inequality in the late 1990's,
respectively, Rx= 1:57 and Ro
= 1:9. The model predicts new values � 0 = :94 and
�0 = :37, thus both measures of generality increase. The index of generality of technology-
speci�c skills increases sharply, while the index of vintage compatibility shows only a
moderate rise. How plausible are these numbers? A simple way to check is to explore
the implications of our exercise for the rise in educational attainment. Our data suggest
that in the late 1990's average educational attainment of the working male population
rose to 13:5 years corresponding to a fraction of :18 of the �rst period in the model. Our
simulation predicts a rise of h from :11 to :17, hence fairly in line with the data.
Given the simplicity of the model {which was designed to be solvable analytically{ one
should take these quantitative results with some caution. However, at the very least, the
exercise was useful to understand that, quantitatively, it is likely that � increased faster
than �. The reason is that, as explained earlier, a sharp rise in � would have reduced the
experience premium, which instead increased in the U.S. economy.
6 Transitional Dynamics
One important advantage of our two-period overlapping generations structure is that
it allows us to characterize the transitional dynamics of the economy in the wake of a
technological shock that increases generality. In what follows we concentrate on the case
where the aggregate adaptability constraint is binding (case A), so that in equilibrium
young workers choose a positive amount of education and there is within-group inequality
among old workers.
6.1 Exogenous Adaptability
Suppose the economy is in the old steady state at date t, with transferability rate equal
to � and that, between t and t+1, a new technology is introduced with generality � 0 > �:
When capital can be partly upgraded and a positive fraction of capital is being retooled
before and after the transition, then the economy displays no transitional dynamics and
the various measures of inequality will immediately jump from their old steady-state to
their new steady-state values at date t+ 1. The reason is that the wage ratio !0u=!1u at
time u is independent of the capital stocks in the new and old sectors, namely:
!0u=!1u = (1 + )��
1�� :
22

In particular, a shock between dates t and t+1 that increases either the compatibility
between old and new vintages of technologies from � to �0 > �; or the degree of skill
transferability across technologies from � to � 0 > � will induce an immediate jump to the
new long-run steady state for both Roand Rx
, with no transitional dynamics in-between;
this simply follows from the wage ratio !0u=!1u being independent of capital stocks as
long as retooling takes place (i.e. dt > 0).
In the absence of compatibility across technologies (� = 0), the economy will display
interesting dynamics. The innovating sector at date t + 1 is free to increase the optimal
amount of capital input from k to k0 > k in order to exploit the higher labour supply
on the new technology due to the larger degree of skill transferability. However, �rms
with capital embodying the old technology are stuck with the capital chosen at time t.
Eventually, at time t + 2, it will be the turn of the other sector to innovate, so also the
other sector will choose the new amount of capital k0 and the economy will converge to
the new steady-state. Hence, there is only one transitional period for inequality, t + 1 ,
between the steady-state levels characterized by Proposition 1.
Within-group inequality for old workers is determined by the wage ratio between
adaptable and non-adaptable workers. Adaptable workers at time t + 1 have the ad-
ditional advantage over non-adaptable workers that they can work with more capital
(k0 > k) embodying the new technology, which further increases their productivity com-
pared to that of non-adaptable workers in the old sector. But from period t + 2 onward,
this additional wedge disappears as both sectors invest the same steady-state normalized
amount of capital k0: Thus, within group-inequality overshoots its �nal steady-state level
along the transition, i.e. Rot+1 > Ro
t+2 > Rot .
Next, consider the dynamics of the experience premium. In contrast to the evolution
of within-group inequality, there is no overshooting in the experience premium, that is:
Rxt+2 > Rx
t+1: This is, in fact, a direct consequence of the overshooting of within-group
inequality: the experience premium for non-adaptable workers increases between period
t + 1 and period t + 2 as young workers no longer bene�t from working with a higher
normalized capital stock than old non-adaptable workers. The comparison between Rxt+1
and Rxt is less straightforward: on the one hand for given capital investment, a rise in skill-
transferability increases the experience premium of both adaptable and non-adaptable
workers (while allowing adaptable workers to transfer more experience, this also raises
the experience premium of non-adaptable workers by making adaptable labour relatively
less scarce); on the other hand, the increase in normalized capital stock in the new sector
23

reduces the experience premium of non-adaptable workers who su�er from a relative
shortage of capital compared to the young workers in the new sector. As it turns out,
this latter e�ect is always dominated.
Finally, the dynamics followed by our measure of overall inequality R, is quite similar
to the dynamics of Roexcept when the lowest wage in the economy is the entry wage of
young workers on young technologies; in this case there is simply no transitional period
and the economy reaches the new steady-state immediately. Figure 4 depicts the dynamics
of Roand Rx
along the transition.
6.2 Endogenous Adaptability
Introducing endogenous adaptability does not change qualitatively the transitional dy-
namics of within-group inequality Rowhen � > 0: if we allow for capital upgrading and
a positive fraction of capital is being retooled before and after the transition, then the
transitional dynamics disappear and within-group inequality immediately jumps from its
old steady-state to the new steady-state value at date t+1: However, even when retooling
takes place, endogenous adaptability introduces some dynamics in the experience pre-
mium. Even though Rou jumps immediately to its new steady-state, in the intermediate
period t+ 1 the old workers inherit the degree of adaptability chosen before the shock at
time t, i.e. ��(�), which is lower than ��(� 0). Thus, Rxt < Rx
t+1 < Rxt+2, where the �rst
inequality follows from the immediate adjustment of within-group inequality to its new
steady-state level, while the second inequality follows from the rise in �� between t + 1
and t + 2.
Consider now an economy with no compatibility between old and new vintages of
technologies. When � is endogenous, at date t + 1; i.e. immediately after the positive
shock on transferability has occurred, within-group inequality will increase by more than
when � is exogenous. With exogenous adaptability, a rise in technological generality from
� to � 0 induces a change in x0 at date t+1 equal to �� (� 0 � � ), whereas with endogenous
adaptability the change in x0 equals
��(� )� (� 0 � � )� [' (�� (� 0))� ' (�� (� ))] < �� (� 0 � �) :
Thus the labour supply e�ect in the transitional period is weaker with endogenous adapt-
ability, which in turn will amplify the increase in the wage rate !u0 between dates t and
t + 1: The explanation is that when � is exogenous in the transitional period the adapt-
ability of old workers is predetermined, while when � is endogenous the optimal choice of
24

adaptability �� for young workers increases, hence their labour supply to the new sector
is reduced by the corresponding extra time they spend in school. There will still be over-
shooting in within-group inequality as the transferability shock will again induce �rms in
the new sector to increase their capital investment from k to some k0 > k; which in turn
implies that adaptable workers will work with more capital than non-adaptable workers
in period t+ 1, but not in period t+ 2:
With endogenous adaptability, the experience premium in periods t + 1 and t + 2
becomes
Rxt+1 = (1 + � 0�)
��� (�) + (1� �� (� ))
1
Rot+1
�;
Rxt+2 = (1 + � 0�)
��� (� 0) + (1� �� (� 0))
1
Rot+2
�:
(16)
Given that Rot+1 > Ro
t+2 and ��
(� 0) > �� (� ), we have: Rxt+1 < Rx
t+2. The fact that Rxt+1 >
Rxt follows from the same reasoning we made for the case where � is exogenous. Thus,
as in the previous section, there is no overshooting in the experience premium. Finally,
the dynamics of overall inequality R with � endogenous do not change qualitatively in
comparison with the case where � is �xed.
The main results on the transitional dynamics of the economy can be summarized in:
Proposition 3 Consider an economy with exogenous adaptability: (i) with full speci�city
of capital, within-group inequality overshoots its �nal steady state along the transi-
tion, while the experience premium is monotonically increasing; (ii) with retooling,
there are no transitional dynamics and all measures of inequality jump immediately
to the new steady-state. Endogenous adaptability (iii) ampli�es the overshooting be-
haviour of within-group inequality when capital is fully speci�c, and (iv) introduces
monotonic dynamics in the experience premium in the presence of retooling of old
capital.
We provide a formal proof of part (i) of this Proposition in the Appendix. The proof
of the other parts follows naturally.
7 Concluding Remarks
We have developed a simple two-sector OLG model with two-period lived agents and
two-period technological vintages to analyze the e�ects of an increase in the generality of
technologies on wage inequality. We have modelled generality, both in relation to human
25

capital and the transferability of skills across sectors, and in relation to physical capital
and its ability to be upgraded towards other sectors using more advanced technologies.
We have focused our attention on two measures of wage inequality, namely the ratio
between high and the low wages within a generation of ex-ante equal workers, which we
took as a measure of within-group inequality, and the ratio between the average wages of
old and young workers, the experience premium. Our main �ndings can be summarized
as follows:
First, whether it relates to human or to physical capital, an increase in the generality
of technology increases long-run within-group inequality, and during the transition to-
wards a more general technology, within-group inequality overshoots its new steady-state
level. Second, the steady-state experience premium reacts positively to an increase in the
generality of technologies with regard to human capital, whereas it reacts negatively to
an increase in the generality of technologies with regard to physical capital; moreover,
during the transition period following an increase in the former, the experience premium
increases monotonically over time towards its long-run steady state. Third, the above
�ndings appear to be robust to endogenizing old workers' adaptability to new technolo-
gies provided the marginal cost of adaptability increases suÆciently fast. Fourth, a simple
calibration exercise on US data suggests that the dimension of generality that increased
most is that related to human capital.
To obtain analytical results we had to keep our model stylized, and as such it should
be seen as a benchmark model that can be extended in several interesting directions. A
�rst extension would explore the dynamics of wage inequality when agents live for more
than two-periods. Our analysis on a related model with in�nitely-lived agents (Aghion,
Howitt, and Violante, 2000) shows that our approach based upon random adaptability to
new technologies and its e�ects on the distribution of labour market histories can account
for an important observation about wage inequality, which the two-period OLG model
in this paper could not capture, namely that a sizeable part of the observed increase in
within-group inequality relates to the temporary component of earnings (Gottschalk and
MoÆtt, 1994, Gittleman and Joyce, 1996, Blundell and Preston, 1999).
A second extension, which we begin investigating in the Appendix, is to model another
dimension of between-group inequality, namely the educational premium. Based on the
assumption that more educated workers are also more adaptable to new technologies when
old, one can show that the comparative statics across steady-states of the educational
premium mirror those of within-group inequality, and in particular also the educational
26

premium increases with the generality of technologies.
Finally, the past thirty years have witnessed economy-wide evolutions in the organi-
zation of �rms, in particular a generalized move towards atter and more decentralized
hierarchical forms. Recent empirical work (e.g. Caroli and Van Reenen, 2001) has pointed
to the skill-biased nature of organizational change. But equally important is the generality
of this change, which has a�ected a broad range of sectors in manufacturing and services,
and involved considerable wage premia for the most adaptable managers and labourers.
This suggests that the model in this paper could also be used to analyze the e�ects of
this type of organizational change on the wage structure.
27

Appendix
Proof of Lemma 2.
It is useful to re-express equation (13) as
(��)�= a�
(1 + ) (1 + ��)
1 + r
�1�
1
Ro
�; (17)
and the demand schedule as
Ro=
(1 + ��) (1 + )
1 + �
�x0
x1
���
: (18)
By taking a log-approximation of (17) and (18), where we substitute forx0
x1as a
function of �� using (14), we obtain respectively
e� = ea + 1
�
h + �� � r � exp(� eRo
)
i;
eRo= + �� � (1� �) � � �
�(2 + ��) exp(e�)� a��
1 + �exp((1 + �) e�)� ;
where, the \e " symbol denotes the logarithm of the corresponding variable. For the
supply curve, the amplitude of the shift after an increase in � (measured at the initial
level of equilibrium inequality eRo) is:
@e��
@�jeRo=
�
�;
and for the demand curve, the magnitude of the shift is
@e��
@�jeRo=
1� ���
�
h(2 + ��)�� � a�� (��)
1+�i�:
We can conclude that a suÆcient condition for the shift in the demand curve to be larger,
and within-group inequality to rise, is the inequality stated in Lemma 2. k
Proof of Proposition 3, part (i)
Suppose that the economy is in the old steady state at date t, with transferability rate
equal to � and that, between t and t+ 1, a new technology is introduced with generality
� 0 > �: From (3) it follows that the innovating sector at date t (resp. at date t + 1) will
optimally choose a normalized amount of new capital k (resp. k0) equal to:
k = �1
1��
�x1��0 +
1
1 + rx1��1
� 1
1��
k0 = �1
1��
�x01��0 +
1
1 + rx01��1
� 1
1��
;
28

where (x0; x1) (resp. (x00; x0
1)) are the equilibrium labour inputs to the new and the old
sectors respectively in the old (resp. the new) steady-state, namely:
x0 = 1 + �(1 + ��);
x00 = 1 + �(1 + � 0�) > x0;
x1 = x01 = (1 + �) (1� �) :
(19)
These follow from Lemma 1 and the fact that k0 > k. At dates u � t; before the shock to �
occurs, both sectors use the same normalized amount of capital k; so that the normalized
wage rates in the new and old sectors are still given by:
!0u = (1� �)
�k
x0
��
;
!1u =1
1 + (1� �)
�k
x1
��
:
Next period, at date t + 1, the �rms in the old sector (say, sector b) are stuck with the
same amount of capital k embodying the low-transferability technology, but �rms in the
new sector (sector a) realize that the (permanent) increase in skill transferability will
make capital investments more pro�table; this, in turn leads them to choose an amount
of capital k0 > k corresponding to the new level of transferability � 0: The normalized
wages at date t + 1 are thus:
!0;t+1 = (1� �)
�k0
x00
��;
!1;t+1 =1
1 + (1� �)
�k
x1
��:
Finally, at date t+2; sector b becomes the innovating sector; facing the same maximization
problem as for sector a in period t+1, it will choose the same normalized amount of capital
k0 corresponding to the new steady-state with transferability � 0: If transferability remains
constant from date t+1 onwards, then for all dates u � t+2 the normalized equilibrium
wage rates in the new and old sectors are given by:
!0u = (1� �)
�k0
x00
��;
!1u =1
1 + (1� �)
�k0
x1
��:
Within group inequality in period u 2 ft; t + 1; t+ 2g; is given by:
Rou =
(1 + �u�)
(1 + �)
!0u
!1u
;
29

where: �u = � if u � t; and �u = � 0 if u > t: Substituting for the normalized wage rates
(!0u; !1u) ; we immediately obtain:
Rou =
(1 + �u�) (1 + )
1 + �
�(1� �)(1 + �)
1 + �(1 + �u�)
���ku
ku�1
��
Thus,
Rot+1 = Ro
t+2
�k0
k
��
> Rot+2 > Ro
t :
In particular, we have just shown within-group inequality overshoots its new long-run
level during the transition period t+ 1. Let us now turn to the experience premium.
In any period u; the average experience premium (across adaptable and non-adaptable
workers) is given by:
Rxu = � (1 + �u�) + (1� �)(1 + �)
!1u
!0u
:
Substituting for the appropriate value of �u and the appropriate expressions for the nor-
malized wage rates !1u and !0u for all u; we immediately get:
Rxu = (1 + ��)
�� + (1� �)
1
Rot
�for u � t;
Rxt+1 = (1 + � 0�)
�� + (1� �)
1
Rot+1
�;
Rxu = (1 + � 0�)
�� + (1� �)
1
Rot+2
�for u � t+ 2:
Given the dynamics of Rou, this proves that R
xt+2 > Rx
t+1: Now, to prove that Rxt+1 > Rx
t ,
it suÆces to show that:
1 + � 0�
Rot+1
>1 + ��
Rot
;
or equivalently that:
k
k0>
1 + �(1 + ��)
1 + �(1 + � 0�): (20)
But from equation (3) we know that:�k
k0
�1��
=x1��0 +
11+r
x1��1
x01��0 +1
1+rx1��1
=[1 + �(1 + ��)]
1��+
11+r
x1��1
[1 + �(1 + � 0�)]1��
+1
1+rx1��1
;
which immediately implies (20). This establishes part (i) of the Proposition. k
The above proof can be explained in more intuitive terms. Namely, between periods t
and t+1 the capital stock in the new sector increases in order to adjust to the rise in the
supply of adaptable labour from x0 to x00. However, it adjusts by less than the increase
in adaptable labour as the optimal choice of capital stock must also take into account the
supply of non-adaptable labour x1 to work with old capital in the following period. The
30

key insight is that this supply does not change throughout the whole transition (see the
equations in (19)).
An Extension: The Educational Premium
Consider an extension of the framework in Section 4 where the economy is populated
by individuals who di�er in their education cost '(�) = a���
1 + �
1+�
. In particular,
assume that the scaling parameter a is distributed in the population according to the
distribution function F , with support (0; �). The �rst-order condition for the individual
choice of education (13) is unchanged, hence the aggregate adaptability rate �� in the
economy is determined by
�� =
�(1 + ) (1 + ��)
1 + r
�1�
1
Ro
�� 1
�
a;
where a is the population mean of the random variable a. Within-group inequality Ro
is given exactly as in Section 4. It follows immediately that without retooling a larger �
raises Rounder the conditions of Lemma 2, while in an equilibrium with retooling Ro
is
increasing in both � and �.
To characterize the educational premium Re, we need to split the population in two
groups: consistently with the rule normally adopted in empirical work, we de�ne "edu-
cated" those workers who spent at least a period of length he in school and "uneducated"
all the rest. It is simple to prove that the marginal educated worker will have an individual
cost parameter equal to
ae =(1 + �)hen
(1+ )(1+��)
1+r
�1� 1
Ro
�o 1+�
�
; (21)
and all workers with a � ae are also educated. It follows from (21) that an increase
in the generality of technology that raises the adaptability premium will induce workers
to spend a longer part of their youth in school, thus the marginally educated worker will
be of lower quality and will have a lower adaptability rate ("extensive-margin" e�ect).
The equilibrium adaptability rate among educated workers ��
e will be
��e =
�(1 + ) (1 + ��)
1 + r
�1�
1
Ro
�� 1
�
"R �aeadF (a)
1� F (ae)
#:
Thus, beyond the extensive margin e�ect that reduces the average level of adaptability
in both pools, we recognize an intensive margin e�ect due to the fact that, following a rise
in generality, all workers invest more in schooling and increase their level of adaptability.
31

Thus, in general the overall impact on ��e is ambiguous and depends, among other things,
on the shape of the distribution function F .
Similarly, for uneducated workers
��
u =
�(1 + ) (1 + ��)
1 + r
�1�
1
Ro
�� 1
�
�R ae0adF (a)
F (ae)
�:
The educational premium, de�ned as the ratio between the average wage of educated
workers and the average wage of uneducated workers, can be conveniently expressed as
Re=
��eRo+ (1� ��e)
��uRo + (1� ��u)
For given ��e and ��u, the comparative statics of the educational premium across steady-
states are qualitatively similar to those for within-group inequality. Intuitively, given
that among the educated labour force a larger fraction is adaptable to new vintages, on
average educated workers can bene�t more from the appearance of a new technology that
increases the degree of skill generality � or capital compatibility �. Di�erences in the way
the endogenous adaptability rates for the two groups respond to a rise in generality can
either amplify or dampen the response of Ro:
32

References
[1] Acemoglu, D. (1998). \Why Do Technologies Complement Skills? Directed Technical
Change and Wage Inequality," Quarterly Journal of Economics 113, 1055-1090.
[2] Acemoglu, D. (1999). \Changes in Unemployment and Wage Inequality: An Alter-
native Theory and Some Evidence," American Economic Review 89, 1259-1278.
[3] Acemoglu, D. (2002). \Technical Change, Inequality and the Labor Market," Journal
of Economic Literature XL(1), 7-72.
[4] Aghion, P. (2002). \Schumpeterian Growth Theory and the Dynamics of Income
Inequality," Econometrica 70(3).
[5] Aghion, P., P. Howitt, and G.L. Violante (2000). \Technological Change and Earnings
Volatility," mimeo UCL.
[6] Bartel, A., and F. Lichtenberg (1987). \The Comparative Advantage of Educated
Workers in Implementing New Technology," Review of Economics and Statistics 69,
1-11.
[7] Blundell, R., and I. Preston (1999). \Inequality and Uncertainty: Short-Run Uncer-
tainty and Permanent Inequality in the US and Britain," mimeo UCL.
[8] Bresnahan, T., and M. Trajtenberg (1995), \General Purpose Technologies: `Engines
of Growth'?," Journal of Econometrics 65(1), 83-108.
[9] Caroli, E., and J. Van Reenen (2001). \Skilled-Bias Organisational Change? Ev-
idence From a Panel of British and French Establishments," Quarterly Journal of
Economics 116(4), 1449-1492.
[10] Caselli, F. (1999). \Technological Revolutions," American Economic Review 89(1),
78-102.
[11] Computer Science and Telecommunications Board (1996). The Unpredictable Cer-
tainty: Information Infrastructure through 2000. Washington: National Academy
Press.
[12] Cooley, T. (ed.) (1995). Frontier of Business Cycle Research. Princeton: Princeton
University Press.
33

[13] DiNardo J., N. Fortin, and T. Lemieux (1996). \Labor Market Institutions and the
Distribution of Wages, 1973-1992: A Semiparametric Approach," Econometrica 64,
1001-44.
[14] Doms, M., T. Dunne, and K. Troske (1997). \Workers, Wages, and Technology,"
Quarterly Journal of Economics 112(1), 253-90.
[15] Flug, K., and Z. Hercowitz (2000). \Equipment Investment and the Relative Demand
for Skilled Labor: International Evidence, Review of Economic Dynamics 3(3), 461-
85.
[16] Galor, O., and O. Moav (2000). \Ability Biased Technological Transition, Wage
Inequality Within and Across Groups, and Economic Growth," Quarterly Journal of
Economics 115, 469-497.
[17] Galor, O., and D. Tsiddon (1997). \Technological Progress, Mobility, and Economic
Growth," American Economic Review 87(3), 363-82.
[18] Gittleman, M. and M. Joyce (1996). \Earnings Mobility and Long-Run Inequality:
An Analysis Using Matched CPS Data," Industrial Relations 35(2), 180-197.
[19] Gordon, R.J. (1990). The Measurement of Durable Good Prices. NBER Monograph
Series, Chicago: University of Chicago Press.
[20] Gottschalk, P., and R. MoÆtt (1994). \The Growth of Earnings Instability in the
U.S. Labour Market," Brookings Papers of Economic Activity 2, 217-272.
[21] Gould, E., O. Moav, and B. Weinberg (2001). \Precautionary Demand for Education,
Inequality and Technological Progress," Journal of Economic Growth 6, 285-315.
[22] Greenwood, J., and M. Yorukoglu (1997). \1974", Carnagie-Rochester Series on Pub-
lic Policy 46, 49-95.
[23] Helpman, E. (ed.) (1998). General Purpose Technologies and Economic Growth.
Cambridge and London: MIT Press.
[24] Helpman, E., and A. Rangel (1999). \Adjusting to a New Technology: Experience
and Training," Journal of Economic Growth 4, 359-83.
[25] Juhn, C., K. Murphy, and B. Pierce (1993). \Wage Inequality and the Rise in Returns
to Skill," Journal of Political Economy 101, 410-442.
34

[26] Katz, L., and D. Autor (1999). \Changes in the Wage Structure and Earnings In-
equality". In Orley Ashenfelter, and David Card (eds.), Handbook of Labor Eco-
nomics, vol. 3. Amsterdam: North Holland.
[27] Katz, L., and K. Murphy (1992). \Changes in Relative Wages, 1963-1987: Supply
and Demand Factors," Quarterly Journal of Economics 107(1), 35-78.
[28] Krusell, P, L. Ohanian, J.V. Rios-Rull, and G.L. Violante (2000). \Capital Skill
Complementarity and Inequality: A Macroeconomic Analysis," Econometrica 68,
1029-1054.
[29] Lee, D. (1999). \Wage Inequality in the U.S. During the 1980s: Rising Dispersion or
Falling Minimum Wage?," Quarterly Journal of Economics 114, 977-1023.
[30] Lipsey, R.G., C. Bekar, and K. Carlaw (1998). \The Consequences of Changes in
GPTs". In Elhanan Helpman (ed.), General purpose technologies and economic
growth. Cambridge and London: MIT Press.
[31] Mc Connell, S. (1996). \The Role of Computers in Reshaping the Workforce,"
Monthly Labour Review, August, 3-5.
[32] Nelson, R.R., and E.S. Phelps (1966). \Investment in Humans, Technological Di�u-
sion, and Economic Growth," American Economic Review 56, 69-75.
[33] Rubinstein, Y., and D. Tsiddon (1999). \Coping with Technological Progress: The
Role of Ability in Making Inequality so Persistent", mimeo Tel Aviv University.
[34] Topel, R. (1991). \Speci�c Capital, Mobility, and Wages: Wages Rise with Job
Seniority," Journal of Political Economy 99, 145-177.
[35] Violante, G.L. (2002). \Technological Acceleration, Skill Transferability and the Rise
in Residual Inequality," Quarterly Journal of Economics 117(1), 297-338.
[36] Wood, A. (1995). \How Trade Hurt Unskilled Workers," Journal of Economic Per-
spectives 9, 57-80.
35

TABLE 1
Wages by workers' age and vintage of technology
Sector
0 1
Wage of young worker !0t !1t
Wage of old worker coming from 0 (1 + ��)!0t (1 + �)!1t
Wage of old worker coming from 1 !0t (1 + ��)!1t
36

Caption for Figure 1: Relative supply and demand schedules in the economy of
Section 3 with exogenous adaptability �, partial skill transferability, i.e. � 2 (0; 1), and
partial vintage compatibility, i.e. � 2 (0; 1). The Figure depicts a case where the economy
is in an equilibrium of type (A). As clear from this picture, with retooling, case (B) is
knife-edge.
Caption for Figure 2: This �gure refers to the economy of Section 4 with endogenous
adaptability and � = 0. The upper panel of the �gure depicts the case where � = 1.
A rise in � shifts the demand curve upward and inequality rises unambiguously (from E
to E'). In the lower panel, the case � = 0 is represented. The equilibrium is on the at
region of the supply curve, so the supply response is very large and inequality falls (from
E to E').
Caption for Figure 3: This �gure refers to the economy of Section 4 with endogenous
adaptability. The upper panel of the �gure depicts the case where and � = 0 and � 2
(0;1). A rise in � shifts both the demand curve and the supply curve upward and
the e�ect on inequality, in general, is ambiguous. In the lower panel, the economy with
retooling is represented. The equilibrium is on the at region of the demand curve, so
inequality increases unambiguously following a rise in both skill transferability (from E
to E� ) and in capital compatibility (from E to E�).
Caption for Figure 4: Transitional dynamics for the economy of Section 3, following
an increase in � . The panel on top depicts the dynamics of within-group inequality Ro
and the panel below the dynamics of the experience premium Rx.
37

6
-
!0!1
x0+ex0x1
Demand
!0!1
= (1 + )
�x0x1
���
1+�(1+��)
(1��)(1+�)
+
(1 + �)�1
1+�
1+��
0
(C)
(B)
Supply
(A)
(1 + ) ��
1��
Figure 1:
38

6
-
��
Ro
Demand
Supply
6
a
E
E'
6
-
��
Ro
h1� 1+r
(1+��)(1+ )
i�1
Demand
Supply
6
?
�
E'
E
Figure 2:
39

6
-
��
Ro
Demand
Supply
6?
�
1
EE�
6
-
��
Ro
Demand
Supply
?
6
�
1
E
E�E�
(1+ )(1+��)
1+��
�
1��
Figure 3:
40
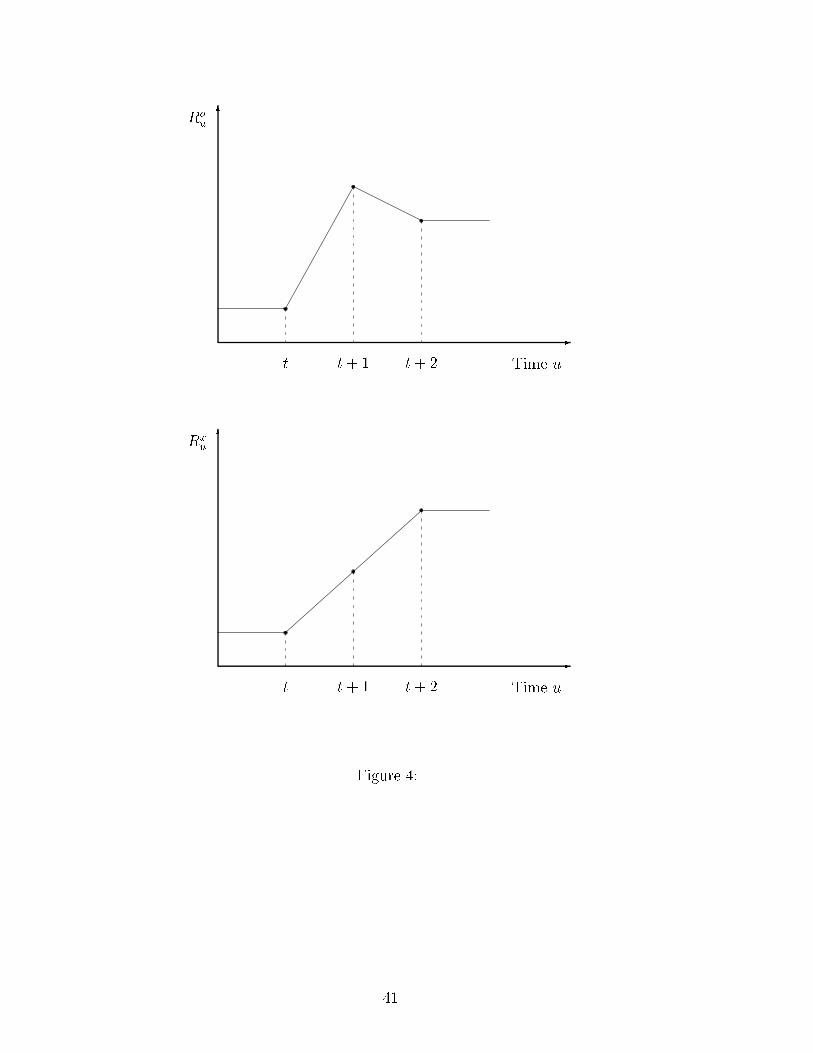
6
-
Time u
Rou
t t + 1 t+ 2
6
-
Time u
Rxu
t t + 1 t+ 2
Figure 4:
41