generating crop calendars with web search data
TRANSCRIPT
LETTER
Generating crop calendars with Web search dataTo cite this article: Marijn van der Velde et al 2012 Environ. Res. Lett. 7 024022
View the article online for updates and enhancements.
Recent citationsInvestigation of the optimum plantingdates for maize varieties using a hybridapproach: A case of Hwedza, ZimbabweHillary Mugiyo et al
-
Remote sensing for agriculturalapplications: A meta-reviewM. Weiss et al
-
Modeling the Global Sowing andHarvesting Windows of Major CropsAround the Year 2000Toshichika Iizumi et al
-
This content was downloaded from IP address 115.21.138.119 on 10/10/2021 at 01:29

IOP PUBLISHING ENVIRONMENTAL RESEARCH LETTERS
Environ. Res. Lett. 7 (2012) 024022 (8pp) doi:10.1088/1748-9326/7/2/024022
Generating crop calendars with Websearch dataMarijn van der Velde1, Linda See1, Steffen Fritz1, Frank G A Verheijen2,Nikolay Khabarov1 and Michael Obersteiner1
1 International Institute of Applied Systems Analysis (IIASA), Ecosystem Services and ManagementProgram, Schlossplatz 1, Laxenburg, A-2361, Austria2 Department of Environment and Planning, Center for Environmental and Marine Studies (CESAM),University of Aveiro, 3810-193 Aveiro, Portugal
E-mail: [email protected]
Received 13 March 2012Accepted for publication 24 May 2012Published 22 June 2012Online at stacks.iop.org/ERL/7/024022
AbstractThis paper demonstrates the potential of using Web search volumes for generating cropspecific planting and harvesting dates in the USA integrating climatic, social andtechnological factors affecting crop calendars. Using Google Insights for Search, clear peaksin volume occur at times of planting and harvest at the national level, which were used toderive corn specific planting and harvesting dates at a weekly resolution. Disaggregated tostate level, search volumes for corn planting generally are in agreement with planting datesfrom a global crop calendar dataset. However, harvest dates were less discriminatory at thestate level, indicating that peaks in search volume may be blurred by broader searches onharvest as a time of cultural events. The timing of other agricultural activities such as purchaseof seed and response to weed and pest infestation was also investigated. These resultshighlight the future potential of using Web search data to derive planting dates in countrieswhere the data are sparse or unreliable, once sufficient search volumes are realized, as well asthe potential for monitoring in real time the response of farmers to climate change over thecoming decades. Other potential applications of search volume data of relevance to agronomyare also discussed.
Keywords: corn, maize, crop planting, internet, web search data, crowd-sourcing, crop model,harvest, web tools, Google Insights for Search
S Online supplementary data available from stacks.iop.org/ERL/7/024022/mmedia
1. Introduction
Access to the Internet has fundamentally impacted the livesof many people and become increasingly interwoven intosociety. Global Web penetration has reached 30% and almost80% in North America alone (Miniwatts Marketing Group2011). One measure of Web activity is the volume of Websearches through the major search engines such as Google andYahoo. The search volume in October 2005 was estimatedat more than 5 billion based on the top 5 search engines(Nielsen//NetRatings 2005), and by the end of 2009, hadincreased to more than 130 billion searches in the month of
December (comScore 2010). To analyze this increasing searchactivity both spatially and temporally, Google has producedthree tools: Google Trends, Google Insights for Search andGoogle Correlate (Mohebbi et al 2011). The potential for toolslike these in the area of medical research and public healthhas been highlighted by Noll-Hussong and Lahmann (2011),and several examples have recently appeared relating searchvolume to incidence data, e.g. influenza (Ginsberg et al 2009,Mohebbi et al 2011), dengue fever (Althouse et al 2011),kidney stones (Breyer et al 2011), stroke prevalence (Walcottet al 2011), deaths by suicide (Yang et al 2011) and depression(Yang et al 2010). Other areas of application include the
11748-9326/12/024022+08$33.00 c© 2012 IOP Publishing Ltd Printed in the UK

Environ. Res. Lett. 7 (2012) 024022 M van der Velde et al
forecasting of private consumption (Vosen and Schmidt2011), unemployment (Tefft 2011) and interest in the publicunderstanding of science (Baram-Tsabari and Segev 2011) .The advantages of using Web search data for understandingtrends and for forecasting include: contemporaneity andtimeliness of the data, which are available from 2004 ona real-time basis; spatial coverage, which is sub-national(e.g. state and county in the USA) when sufficient searchvolumes are available; and open access to a rich databasethat could potentially replace costly field data (Mohebbi et al2011).
Thus far, purely environmental applications of Websearch query data are rare. A recent paper (Sherman-Morriset al 2011) examined the potential of searches for hurricaneinformation to inform the communication of weathermessages. However, opportunities clearly exist in relationto cyclical phenomena (see e.g. Mathias et al 2009). Forexample, analysis of the search term ‘soil erosion’ revealsan increased interest in spring and autumn, and a lowinterest during the summer when crops and vegetation coverare well established. These types of analysis hold potentialfor improved timing or targeting of specific educational orextension campaigns (cf Baram-Tsabari and Segev 2011).Another seasonal activity is cropland management, whichfollows a regular pattern of events. In addition to activitiessuch as purchasing seeds and fertilizer, farmers must makedecisions about when to plant and harvest their crops,which are based on factors such as rainfall forecasts,temperature, soil moisture, and increasingly technologicaland socio-economic factors (Sacks et al 2010). For example,Kucharik (2006) found that changes in technology, such ascorn hybrids that are tolerant to colder temperatures, improvedplanting equipment and conservation tillage, may be the maincontributing factors to the earlier corn planting dates in theUSA relative to the early 1980s. Planting dates might also bechosen in relation to the harvesting date of a previous crop orto ensure favorable conditions during a critical stage of growth(Sacks et al 2010).
Planting dates are necessary inputs for crop models,whether at the plot level or globally. Most global cropmodels use climate to predict planting dates, in additiontwo global products are now available (Sacks et al 2010,Portmann et al 2010). However, the information, which hasbeen collected from sources such as FAO and the USDA,generally refers to the 1990s and early 2000s. Therefore, Websearch data provides a potential source of more up-to-dateinformation that effectively integrates different climatic,social and technological factors that affect these dates, wheretimeliness of the data and ease in data collection and analysismay be one of the main advantages of search data for thisand many other applications, as highlighted by Goel et al(2010). Improved spatially explicit knowledge about timingof cropland management practices could be used to calibrateand/or evaluate crop model response, improve assessments offood security and inform climate change adaptation potential.The present study aims to provide a proof of concept,using Google Insights for Search and Google Correlate, toinvestigate whether search activity can be used to determine
the crop calendar of corn in the USA. Wheat and soybeanwere also attempted but with less success, and are included tohighlight the current limitations of the methodology. The USAprovides a good case study since Web usage is widespreadamong farmers (USDA 2011a) and the search language isEnglish. The results were then compared with crop calendardata from Sacks et al (2010).
2. Data and methods
Google Correlate was first used to establish whether the searchaudience is likely to be farmers. This tool provides searchterms that exhibit the highest correlation with the normalizedsearch activity (σ ; standard deviations away from the mean)of a search term of interest (i.e. whose search frequencyfollows a similar pattern), which was used at the state levelto examine the types of terms correlated with ‘corn planting’,‘corn harvest’, etc (see Google Correlate Tutorial online). Asimilar analysis was undertaken for wheat and soybean.
Google Insights for Search was then given the terms‘corn planting’, ‘corn harvest’, etc (see supplementary table1a available at stacks.iop.org/ERL/7/024022/mmedia) for theperiod 2004 onwards for the USA in all search categories.Similar searches were undertaken for wheat and soybean,all of which are widely cultivated in the USA. The originalidea was to illustrate the method on all three crops. However,search volumes were too low for wheat and soybean beyonda national level result. This is a function of the way searchvolumes are processed. Google Insights for Search normalizesand scales search volume data between 0 and 100 bydividing the search volumes by the highest search volume andmultiplying by 100 (see Google Insights for Search (2011)online help). When the search volumes are too low relative toother search terms, which reflects popularity of the term ratherthan absolute search volumes, the results cannot be displayedbelow a national level and the data are only available at amonthly resolution. Thus, for wheat and corn, the peaks ofWeb search activity corresponding to planting and harvestingcould only be determined as the month in which they occurredwhile a more precise planting and harvesting date and lengthof the growing season was possible for corn. The spatialdistribution of corn by US state based on search volumeswas then compared to the spatial extent of the cultivation ofcorn. For the reasons stated above, this was not possible forwheat and soybean. Finally, state level planting and harvestdates for corn were derived where they were available at aweekly temporal resolution. The dates were compared withthose reported in Sacks et al (2010) in terms of statisticalsimilarity (see supplementary text available at stacks.iop.org/ERL/7/024022/mmedia) as well as the NASS Quick StatsProgress Reports for 2011 (USDA-NASS 2011e).
3. Results
3.1. The search population
Results from Google Correlate showed that the search termwith the highest correlation to ‘corn planting’ is ‘corn growth’with a Pearson correlation coefficient of 0.975, and that the
2

Environ. Res. Lett. 7 (2012) 024022 M van der Velde et al
Figure 1. Comparison of normalized Google Insights Web search volume for ‘planting corn’ (left panel) with the production of corn bystate (right panel; one metric ton = 39.37 bushels of corn; source: USDA-NASS 2010).
search activity for these terms is highest in the state ofIowa, which is the top corn producer (see supplementaryfigure 1 available at stacks.iop.org/ERL/7/024022/mmedia).Other terms found to be highly correlated with ‘corn planting’include ‘bushel of corn’, ‘corn yield’, ‘corn diseases’ and‘pedal tractor’. A list of the top 25 correlated search terms isprovided in supplementary table 2 (available at stacks.iop.org/ERL/7/024022/mmedia), which shows that most are relatedto agriculture. However, there are also other terms on the listthat are unrelated to agriculture such as food related terms(snack mix recipes, snack mixes) and toys (ertl toys, johndeere farm toys). Moreover, similar searches with wheat andsoybean yielded very little relation to agriculture, e.g. manygraduation related words for soybean planting and a rangeof unrelated words for wheat. Although 67% of farmers areconnected to the Web (USDA 2011b), we cannot definitivelyestablish the composition of the search population using thistool. However, we can observe that for corn, the communitysearching appears to have a larger agricultural nature thanfor wheat or soybean. This may also be reflected in thehigher search volumes available at state level and at a weeklytemporal resolution.
3.2. National level
The results of searches for corn, wheat and soybean incombination with terms such as seed, planting, and harvestat national level reveal a clear seasonal periodicity in searchvolume from 2004 to 2011 (supplementary figure 2 availableat stacks.iop.org/ERL/7/024022/mmedia). Corn shows a peakfor planting in the end of May, and a peak for harvest in themiddle of October. In the case of wheat, a peak is observed inJune for harvest, while planting is characterized by two peaksdifferentiating spring and winter wheat planting. Soybeanrevealed peaks in planting around April/May and harvest inSeptember/October.
Figure 1 shows the spatial pattern of Web search volumefor ‘corn planting’ at the state level compared to cornproduction by county (USDA-NASS 2010), which showsimilar patterns. A scatter plot between peak search volume
by state and corn production is provided in supplementaryfigure 3 (available at stacks.iop.org/ERL/7/024022/mmedia)(r = 0.68, p < 0.0001). Iowa and Nebraska are two of thestates with the highest Web search volume, and also areamong the highest corn producing states with annual cornproduction in 2010 of 2.2 and 1.5 billion bushels (55.9 and38.1 million tons) respectively (USDA 2011b) or 17.3% and11.8% of total US production. Illinois is the second cornproducing state with 1.9 billion bushels (48.3 million tons)in 2010 with 15.6% of total US production but shows a lowersearch volume. This could be a function of the normalizationalgorithm of Google Insights for Search, which reflectspopularity rather than trends in absolute search volumes. Thisstate has a broader demographic, which will have a widersearch interest and will be influenced by the presence ofChicago, so this result may simply reflect the lower popularityof farm-related search terms in this state. On the other hand,states such as Arizona, Oregon and Utah have search volumesyet do not appear to produce any corn based on the USDAmap. However, the USDA (2011b) reports that these states doproduce a very small amount of corn.
The spatial pattern of ‘wheat planting’ resulted in thehighest search activity in Kansas, which is also the topwheat producing state (USDA-NASS 2011c). Searches for‘winter wheat planting’ and ‘spring wheat planting’ did notproduce sufficient search volumes for spatial disaggregation.A search on the term ‘soybean planting’ showed searchvolumes in the state of Iowa, which is the top soybeanproducing state (USDA-NASS 2011d) and Missouri, anotherprominent soybean planting state. However, search volume inother states was low, which indicates that applicability to bothwheat and soybean is limited at present.
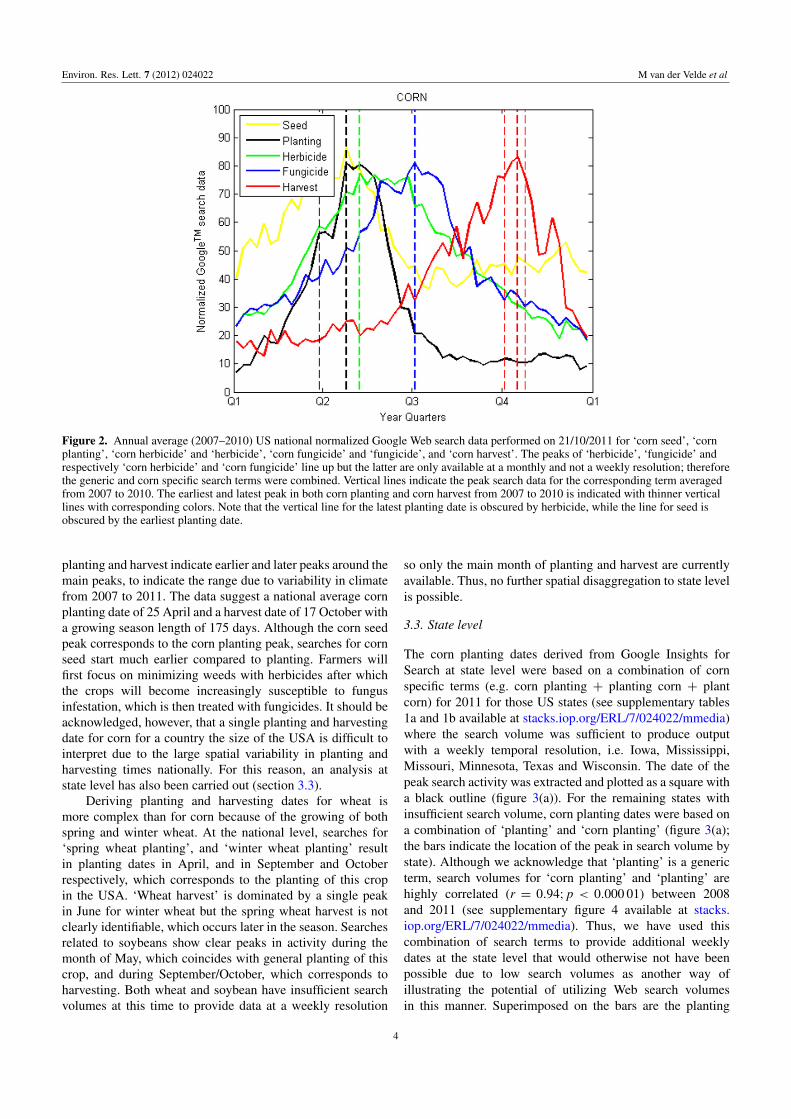
Google Insights for Search was then used to examinethe search volumes for ‘corn’ in combination with ‘seed’,‘planting’, ‘herbicide’, ‘fungicide’ and ‘harvest’ at thenational level. The annual normalized data were averaged for2007–11 and are shown in figure 2. Data prior to 2007 werenot included to produce a more recent set of dates. Verticallines were drawn at the peaks to indicate the average cornplanting and harvesting dates. The thinner vertical lines for
3
Environ. Res. Lett. 7 (2012) 024022 M van der Velde et al
Figure 2. Annual average (2007–2010) US national normalized Google Web search data performed on 21/10/2011 for ‘corn seed’, ‘cornplanting’, ‘corn herbicide’ and ‘herbicide’, ‘corn fungicide’ and ‘fungicide’, and ‘corn harvest’. The peaks of ‘herbicide’, ‘fungicide’ andrespectively ‘corn herbicide’ and ‘corn fungicide’ line up but the latter are only available at a monthly and not a weekly resolution; thereforethe generic and corn specific search terms were combined. Vertical lines indicate the peak search data for the corresponding term averagedfrom 2007 to 2010. The earliest and latest peak in both corn planting and corn harvest from 2007 to 2010 is indicated with thinner verticallines with corresponding colors. Note that the vertical line for the latest planting date is obscured by herbicide, while the line for seed isobscured by the earliest planting date.
planting and harvest indicate earlier and later peaks around themain peaks, to indicate the range due to variability in climatefrom 2007 to 2011. The data suggest a national average cornplanting date of 25 April and a harvest date of 17 October witha growing season length of 175 days. Although the corn seedpeak corresponds to the corn planting peak, searches for cornseed start much earlier compared to planting. Farmers willfirst focus on minimizing weeds with herbicides after whichthe crops will become increasingly susceptible to fungusinfestation, which is then treated with fungicides. It should beacknowledged, however, that a single planting and harvestingdate for corn for a country the size of the USA is difficult tointerpret due to the large spatial variability in planting andharvesting times nationally. For this reason, an analysis atstate level has also been carried out (section 3.3).
Deriving planting and harvesting dates for wheat ismore complex than for corn because of the growing of bothspring and winter wheat. At the national level, searches for‘spring wheat planting’, and ‘winter wheat planting’ resultin planting dates in April, and in September and Octoberrespectively, which corresponds to the planting of this cropin the USA. ‘Wheat harvest’ is dominated by a single peakin June for winter wheat but the spring wheat harvest is notclearly identifiable, which occurs later in the season. Searchesrelated to soybeans show clear peaks in activity during themonth of May, which coincides with general planting of thiscrop, and during September/October, which corresponds toharvesting. Both wheat and soybean have insufficient searchvolumes at this time to provide data at a weekly resolution
so only the main month of planting and harvest are currentlyavailable. Thus, no further spatial disaggregation to state levelis possible.
3.3. State level
The corn planting dates derived from Google Insights forSearch at state level were based on a combination of cornspecific terms (e.g. corn planting + planting corn + plantcorn) for 2011 for those US states (see supplementary tables1a and 1b available at stacks.iop.org/ERL/7/024022/mmedia)where the search volume was sufficient to produce outputwith a weekly temporal resolution, i.e. Iowa, Mississippi,Missouri, Minnesota, Texas and Wisconsin. The date of thepeak search activity was extracted and plotted as a square witha black outline (figure 3(a)). For the remaining states withinsufficient search volume, corn planting dates were based ona combination of ‘planting’ and ‘corn planting’ (figure 3(a);the bars indicate the location of the peak in search volume bystate). Although we acknowledge that ‘planting’ is a genericterm, search volumes for ‘corn planting’ and ‘planting’ arehighly correlated (r = 0.94; p < 0.000 01) between 2008and 2011 (see supplementary figure 4 available at stacks.iop.org/ERL/7/024022/mmedia). Thus, we have used thiscombination of search terms to provide additional weeklydates at the state level that would otherwise not have beenpossible due to low search volumes as another way ofillustrating the potential of utilizing Web search volumesin this manner. Superimposed on the bars are the planting
4

Environ. Res. Lett. 7 (2012) 024022 M van der Velde et al
(a)
(b)
Figure 3. (a) State level corn planting dates and (b) state level harvesting dates derived from Google Web search data (bars) using both cornspecific and generic planting/harvesting to boost search volumes compared to planting dates (error bars indicate average, begin and end) asreported by Sacks et al (2010). The white squares indicate corn specific planting dates derived from Google Web search data for 2011 (onlyindicated where ‘corn planting’ or ‘corn harvest’ yielded data that were reported at weekly temporal resolution). The dates of the searchesare provided in supplementary table 1 (available at stacks.iop.org/ERL/7/024022/mmedia). Supplementary figure 4 (available at stacks.iop.org/ERL/7/024022/mmedia) presents planting windows at state level derived from search volume data.
dates reported by Sacks et al (2010), providing the typicalaverage, start and end dates for each state in red. Overallthe results show reasonable correspondence between the twodatasets and statistical comparison reveals similarities (seesupplementary text available at stacks.iop.org/ERL/7/024022/mmedia).
For Iowa, Missouri, Minnesota and Texas the peakscoincide well with the dates of Sacks et al (2010). However,the Web search data suggests an earlier corn planting date forMississippi when compared to the global data set, which wasoriginally taken from USDA-NASS (1997) for the USA. Highweekly ‘corn planting’ Web search volumes for Mississippifor 2011 started on 27 February (DOY 58) and ended on 26March (DOY 85). Reports on planting of corn in Mississippi
in 2011 confirmed an early planting with the majority of cornplanted during the last 10 days of March (Coblentz 2011).Unfortunately no data were available from the NASS QuickStats Progress Reports for 2011 for the state of Mississippi,which could have provided additional evidence for thisfinding. However, data were available from USDA-NASS(2011e) for Iowa, Missouri, Minnesota, Wisconsin and Texas,i.e. the other five states where corn specific terms were usedto generate the planting dates. NASS provides weekly dataon the cumulative percentage of fields planted. From thiscumulative curve it is possible to determine the plantingpeaks, which could then be compared to the Web search peaks.They suggest similar planting peaks for Iowa, Missouri,Wisconsin or with user generated information (of geowiki.
5
Environ. Res. Lett. 7 (2012) 024022 M van der Velde et al
org, Fritz et al 2012) and Minnesota (i.e. within 10 days) but adisagreement of ∼40 days for Texas (see supplementary table3 available at stacks.iop.org/ERL/7/024022/mmedia) wherethe search peak occurred much earlier than the actual plantingpeak.
Planting windows by state can also be established fromsearch volume data using a threshold in search volume (seean example for 2011 in supplementary figure 5 (available atstacks.iop.org/ERL/7/024022/mmedia) using a peak thresholdof 50 to establish the window and indicating the date atwhich the maximum peak occurred). The peak of plantingfrom USDA-NASS (2011e) was then superimposed onsupplementary figure 5 (available at stacks.iop.org/ERL/7/024022/mmedia) for all states for which data were available,including those states where dates were derived from searchphrases that included the more generic search term ‘planting’.The pattern generally shows that peaks in search volume occurbefore the peak in planting, suggesting that they are indicativeof precursors to planting or coincide with the start of theplanting process.
Figure 3(b) provides corn harvest dates, derived by thesame method used for planting dates. It was possible todetermine harvesting dates with corn specific search terms(corn harvesting + corn harvest) for Iowa and Minnesotaonly. In both cases, USDA-NASS (2011e) indicated DOY296 while the Web search dates were earlier at 282, whichagain suggests that searching coincides with the start of theactual event or could be a precursor. The data of Sackset al (2010) show much more variation by state for thesedates than the Web search data would indicate where thestatistical comparison shows only similarities between theaverage harvest dates of Sacks et al (2010) and the searchvolume derived dates (see supplementary text available atstacks.iop.org/ERL/7/024022/mmedia). This may be due toharvest being an activity which—compared to planting—ismuch more closely related to the festivals and culturalactivities of a society (e.g. Thanksgiving). Thus, the ‘crowd’being sampled for ‘harvest’ may be much broader than thefarming community compared to searches for ‘planting’. Thisis also reflected in the search volumes for ‘corn harvest’ bystate which were only large enough to report for Iowa andMinnesota.
4. Discussion
The searches undertaken considered only the word plantingin the search phrase. Planting dates could be further refinedusing search data on meteorological conditions and pest riskused by farmers. For example, before planting spring wheat,farmers wait until the greatest frost risk has passed (Sacks et al2010). A Web search for ‘frost risk’ indicates peak volumesbetween March and May. Similarly, farmers generally wait toplant winter wheat until the risk of Hessian fly infestation hassubsided (Sacks et al 2010). The search term ‘Hessian fly’resulted in peaks in September. Furthermore, online purchasesof farm equipment may provide additional useful information.The question remains open as to how far search terms reflectpreparatory behavior and will be a precursor to the actual
implementation of a practice, or will reflect a response inreal-time. This will also be differentiated by agriculturalpractice. For instance, searching for crop planting dates mightinform the decision when to plant, while searches for fungustreatment might reflect observations of fungus infestation inthe field. How many days there might be between searchingfor planting dates and the actual planting will depend onbehavioral characteristics of the individual farmer that willneed to be elucidated. This will also aid in an improveddefinition of planting and harvesting windows from Websearch data.
Moreover, the crop calendar of Sacks et al (2010) is basedon older data, where crop calendars may have shifted as aresult of changes in climate. Adjusting planting dates maybe one of the adaptation interventions that farmers take tomaintain or increase yields (Lauer et al 1999). For instance,farmers can adapt planting dates in response to expected shiftsin seasonal water deficits. Monitoring changes in real-timeWeb search activity over the coming decades for key termssuch as those presented here might be used to aid in predictinghow farmers are responding to climate change.
Other agronomical uses could include combining real-time weed and pest infestation searches with remotelysensed satellite observations of phenological development(Wardlow et al 2007) or with user generated information (cfgeowiki.org, Fritz et al 2012). For instance, in 2009, thesearches for ‘weeds’ and ‘blight’ (including ‘potato blight’)both peaked in comparison to other years, which correspondsto online reports of blight impacting both potatoes andtomatoes (Martin 2010). Monitoring Web search query dataduring extreme events such as droughts or heat waves mayyield in improved estimates of irrigation water use, or monitorcrop loss due to heavy precipitation (see e.g. van der Veldeet al 2010, 2012), and similar to detecting influenza epidemics(Ginsberg et al 2009), Web search query data may be used todetect and track contagious diseases and pests in livestock andarable farming.
However, we also recognize that there a number oflimitations with this method. Adequate search volume is themain limiting factors at present. Firstly, we acknowledge thatthe potential for expanding the method to other countries,particularly at lower latitudes where Sacks et al (2010) foundthat planting dates were more difficult to predict using climatevariables, relies on the continued expansion of the Internet tothe developing world and improvements in literacy, where atpresent search volumes are low and access to the Internet isnot ubiquitous. It may take another decade before this typeof analysis will become valuable for data-poor countries inAfrica where 11.4% of the population is currently connectedcompared to a global average of 30% or approximately 2billion Web users (Miniwatts Marketing Group 2011). By2020, this number is projected to increase to 5 billion users(Fox 2011) and will substantially increase penetration figuresin developing countries. The equivalent Portuguese searchterms for planting in combination with different crops such ascorn, soybean, wheat and sugar cane reveal similar seasonalpatterns in Brazil. Supplementary figure 6 (available at stacks.iop.org/ERL/7/024022/mmedia) shows the result of the search
6

Environ. Res. Lett. 7 (2012) 024022 M van der Velde et al
phrase ‘planting wheat’ translated into Portuguese (‘plantiotrigo’) which shows distinctive peaks in the month of June,which corresponds with the planting of winter wheat. Thehighest search volumes are found in the states of Parana andRio Grande do Sul, which have the highest production ofwheat in Brazil (George et al 2009). Not all wheat growingstates show appreciable search volumes, similar to whatoccurred with maize in the USA. Thus similar weaknesses inthe methodology exist with this example. However, Brazil’sInternet access is also set to increase rapidly over the nextdecade. In 2011, Brazil had almost 76 million people onlineor 37.4% of the population (Miniwatts Marketing Group2012). This is predicted to increase to almost 100 millionby 2015 and 1 billion mobile broadband connections by2022, which is predicted to substantially overtake fixedbroadband connections (Beach 2011). Although this examplewas undertaken in Portuguese, we recognize that languagewill be an issue, particularly in those countries which arehighly agricultural and have multiple languages so the taskof extracting search volumes becomes more complex.
Another limitation concerns the search population.Google Correlate did not provide sufficient evidence of thecomposition of the search population. Thus, searches mayhave been carried out by individuals other than farmers andtherefore for different reasons or in different contexts. Finally,it is clear that corn provided the best result to date but thatsearch volumes on other US crops resulted in insufficientsearch volumes. Moreover, there are further limitations withsufficient search volumes spatially and temporally such thatat present, disaggregation would be necessary involving otherdatasets such as climate. Therefore, until search volumesincrease further, the method is currently limited in developingcrop calendars at present. However, as growth in the Internethas been exponential over the last decade and is foreseen tocontinue, this potential may yet be realized in the future.
5. Conclusions
This paper examined the potential of using Web searchvolumes from the Google Insights for Search tool to createcrop calendars. The results showed that the potential doesexist, as planting dates for maize in the USA were shownto have statistical similarity to those of Sacks et al (2010).The peak in search volume also occurred before the plantingpeak based on data from USDA-NASS (2011a, 2011b, 2011c,2011d, 2011e) suggesting that they occur near the start of theplanting period or are precursors to these events. They alsohave the added advantage of being recent and easily updated.However, inadequate search volumes were the main limitingfactor behind the ability to create state level crop calendarsfor other crops or for maize in some states. In order to beable to use this tool for this purpose, there would need tobe two main changes. The first is an absolute increase in theamount of Internet searches globally, especially if this methodis to be utilized in countries where data are currently sparseor in lower latitudes where crop calendars are not as directlyrelated to climatic variables as those in higher latitudes.This will most certainly be realized in the short to medium
term as Internet and mobile connections are set to increaseexponentially over the next 10 years (Beach 2011, Fox 2011).The second concerns improvements to the data provided byGoogle Insights for Search. At present the data are normalizedrelative to other search terms so indicate popularity rather thantrue trends in a specific search term. There is a real need toaccess absolute search volumes that can be normalized byusers for a given purpose. The real trends over time will thenbecome much more apparent. This problem has already beenrecognized as a limitation by Taylor (2011). We therefore callupon Google to reconsider the way in which they present theirdata to allow for better analysis of cyclical events.
Acknowledgments
The research leading to these results has received fundingfrom the European Community’s Seventh FrameworkProgramme (FP7/2007–2013) under grant agreement no.262937 (ISAC: Information Service on Agricultural Change).We also appreciate the input of two anonymous reviewerswhose suggestions have improved the quality of the articlesignificantly.
References
Althouse B M, Ng Y Y and Cummings D A T 2011 Prediction ofdengue incidence using search query surveillance PLoS Negl.Trop. Dis. 5 e1258
Baram-Tsabari A and Segev E 2011 Exploring new web-based toolsto identify public interest in science Public Understand. Sci.20 130–43
Beach J 2011 Billion mobile broadband connections in Brazil by2022 says regulator (www.telecoms.com/33856/billion-mobile-broadband-connections-in-brazil-by-2022-says-regulator/?utm source=rss&utm medium=rss&utmcampaign=billion-mobile-broadband-connections-in-brazil-by-2022-says-regulator)
Breyer B N, Sen S, Aaronson D S, Stoller M L, Erickson B A andEisenberg M L 2011 Use of Google Insights for Search to trackseasonal and geographic kidney stone incidence in the UnitedStates Urology 78 267–71
Coblentz B 2011 Mississippi corn planted early, looking good(http://deltafarmpress.com/corn/mississippi-corn-planted-early-looking-good)
comScore 2010 comScore reports global search market growth of46 percent in 2009 (www.comscore.com/Press Events/PressReleases/2010/1/Global Search Market Grows 46 Percent in2009)
Fox W 2011 Computers and the web (www.futuretimeline.net/subject/computers-web.htm)
Fritz S, McCallum I, Schill C, Perger C, See L, Schepaschenko D,van der Velde M, Kraxner F and Obersteiner M 2012Geo-Wiki: an online platform for improving global land coverEnviron. Model. Soft. 31 110–23
George H, Verbeke I and Corsi S 2009 Agro-MAPS. Mapping subnational land use statistics on a global scale (Rome: FAO)(www.fao.org/fileadmin/templates/ess/pages/rural/wye citygroup/2009/presentations/slides 2 1 VerbekeEtAlAgro-MAPS WYE2009 Rome04 nonotes.ppt)
Ginsberg J, Mohebbi M H, Patel R S, Brammer L,Smolinski M S and Brilliant L 2009 Detecting influenzaepidemics using search engine query data Nature 257 1012–4
Goel S, Hofman J M, Lahaie S, Pennock D M and Watts D J 2010Predicting consumer behavior with web search Proc. NatlAcad. Sci. 107 17486–90
7

Environ. Res. Lett. 7 (2012) 024022 M van der Velde et al
Google Insights for Search 2011 Google Insights for Search, helpsection (www.google.com/support/insights//bin/answer.py?hl=en-US&answer=87285, accessed: 14 November 2011)
Kucharik C J 2006 A multidecadal trend of earlier corn planting inthe central USA Agron. J. 98 1544–50
Lauer J G, Carter P R, Wood T M, Diezel G, Wiersma D W,Rand R E and Mlynarek M J 1999 Corn hybrid response toplanting date in the northern corn belt Agron. J. 91 834–9
Martin J 2010 Spuds Unearthed! Exhibit digs up history of thepotato. USDA Blog (http://blogs.usda.gov/2010/10/04/%e2%80%9cspuds-unearthed%e2%80%9d-exhibit-digs-up-history-of-the-potato/#more-28987)
Mathias Y, Efron N and Shimshoni Y 2009 On the predictability ofsearch trends (http://googleresearch.blogspot.com/2009/08/on-predictability-of-search-trends.html#!/2009/08/on-predictability-of-search-trends.html)
Miniwatts Marketing Group 2011 Web world stats: usage andpopulation statistics (www.webworldstats.com/stats.htm)
Miniwatts Marketing Group 2012 Latin American Internet usagestatistics (www.Internetworldstats.com/stats10.htm)
Mohebbi M, Vanderkarn D, Kodysh J, Schonberger R, Choi H andKumar S 2011 Google Correlate Whitepaper (www.google.com/trends/correlate/whitepaper.pdf)
Nielsen//NetRatings 2010 Online searches grow 55 percentyear-over-year to nearly 5.1 billion searches in December 2005(www.nielsen-online.com/pr/pr 060209.pdf)
Noll-Hussong M and Lahmann C 2011 Whiplash and werthereffect—the potential of Google Insights for Search for MedicalResearch and Public Health Fortschr. Neurol. Psychiatr.79 340–4
Portmann F T, Siebert S and Doll P 2010 MIRCA2000—globalmonthly irrigated and rainfed crop areas around the year 2000:a new high-resolution data set for agricultural and hydrologicalmodeling Glob. Biogeochem. Cycles 24 GB1011
Sacks W J, Deryng D, Foley J A and Ramankutty N 2010 Cropplanting dates: an analysis of global patterns Glob. Ecol.Biogeogr. 19 607–20
Sherman-Morris K, Senkbeil J and Carver R 2011 Who’s Googlingwhat? what Internet searches reveal about hurricaneinformation seeking Bull. Am. Meteorol. Soc. 92 975–85
Taylor S J 2011 Using Google Insights search volumeDecomposition (http://seanjtaylor.com/2011/04/04/using-google-insights-search-volume/)
Tefft N 2011 Insights on unemployment, unemployment insuranceand mental health J. Health Econom. 20 258–64
USDA-NASS 1997 Usual planting and harvesting dates for US fieldcrops Agricultural Handbook No. 628 (Washington, DC:USDA-NASS) (http://usda01.library.cornell.edu/usda/nass/planting/1990s/1997/planting-12-05-1997.pdf)
USDA-NASS 2010 Corn: production acreage by county (www.nass.usda.gov/Charts and Maps/Crops County/cr-pr.asp)
USDA-NASS 2011a Farm computer usage and ownership(http://usda01.library.cornell.edu/usda/current/FarmComp/FarmComp-08-12-2011.pdf)
USDA-NASS 2011b Crop production (www.usda.gov/nass/PUBS/TODAYRPT/crop1111.pdf)
USDA-NASS 2011c Kansas wheat history (www.nass.usda.gov/Statistics by State/Kansas/Publications/Crops/whthist.pdf)
USDA-NASS 2011d Iowa’s rank in United States agriculture(www.nass.usda.gov/Statistics by State/Iowa/Publications/Rankings/2011Rankings.pdf)
USDA-NASS 2011e Quick Stats (www.nass.usda.gov/Quick Stats/)van der Velde M, Tubiello F N, Vrieling A and Bouraoui F 2012
Impacts of extreme weather on wheat and maize in France:evaluating regional crop simulations against observed dataClim. Change at press ( doi:10.1007/s10584-011-0368-2)
van der Velde M, Wriedt G and Bouraoui F 2010 Estimatingirrigation use and effects on maize yield during the 2003 heatwave in France Agric. Ecosyst. Environ. 135 90–7
Vosen S and Schmidt T 2011 Forecasting private consumption:survey-based indicators versus Google trends J. Forecast.30 565–78
Walcott B P, Nahed B V, Kahle K T, Redjal N andCoumans J-V 2011 Determination of geographic variance instroke prevalence using web search engine analyticsNeurosurg. Focus 30 1–4
Wardlow B D, Egbert S L and Kastens J H 2007 Analysis oftime-series MODIS 250 m vegetation index data for cropclassification in the US Central Great Plains Remote Sens.Environ. 108 290–310
Yang A C, Huang N E, Peng C-K and Tsai S-J 2010 Do seasonshave an influence on the incidence of depression? The use ofan web search engine query data as a proxy of human affectPLoS One 5 e13728
Yang A C, Tsai S-J, Huang N E and Peng C-K 2011 Association ofweb search trends with suicide death in Taipai City, Taiwan,2004–2009 J. Affect. Disord. 132 179–84
8